board characteristics that influences effectiveness of the
TRANSCRIPT
Board characteristics that influences effectiveness
of the State-Owned Companies
A research project submitted to the Gordon Institute of Business Science, University of
Pretoria, in partial fulfilment of the requirements for the degree of Masters of Business
Administration
Name: Tshepo Ramantsi
Student Number: 16391382
Year: 2017
Supervisor: Morris Mthombeni
©© UUnniivveerrssiittyy ooff PPrreettoorriiaa

2 | P a g e
ABSTRACT
State Owned Companies (SOC) have proven to be a vital component for economic growth
and have also played a significant role globally to drive economic progression or resurrect
collapsing economies. South Africa currently has an excess of 700 SOCs that contributes
approximately 9.2% to the Gross Domestic Products, and these entities have been exposed
to numerous challenges that range from recurring poor financial performances, high staff
turnover at board level, incompetency, corruption and leadership conflicts mainly driven by
poor governance structures. This research study focuses on board characteristics within the
SOC that can optimise organisational effectiveness and performance.
The study was quantitative in nature and was conducted on SOCs across various sectors
and government departments. In determining the board characteristics, which represent an
independent variable, the following attributes were chosen, gender, race, qualifications, age,
experience, board committees, while the relevant outcome being organisational
effective/performance was assessed used the EBITDA level, return on assets and audit
opinion.
The research paper raised two questions, whether board compositions are essential for
SOCs success and what characteristics of a SOC board structure may influence the
effectiveness of these organisations and ultimately, their performance? Three hypotheses
were raised relating to availability of board structures and impact on performance, the impact
of political appointees on board independence and whether diversity at board impacts
company performance.
The research confirmed the theory in that politically appointed directors have little impact on
company performance, and that adequate board structure have weak relationship to
company performance and that diversity at board level, depending on attribute, does have a
positive impact on company performance.
Key words: ROA, EBITDA, Audit opinion, board composition and diversity
©© UUnniivveerrssiittyy ooff PPrreettoorriiaa
3 | P a g e
DECLARATION
I, Tshepo Ramantsi, declare that the work reflected in this
research is my own, except where other author’s work has
been quoted and referenced. The publication by the
University of Pretoria of this research paper will not in other
way infringe on any third party’s rights.
Name: Tshepo Ramantsi
Signature: …………………………….
Date: 7 November 2017
Student Number: 16391382
©© UUnniivveerrssiittyy ooff PPrreettoorriiaa

4 | P a g e
Acknowledgements
I would like to express many thanks to various people who have extended their support
during my studies, and a special acknowledgment to the following individuals:
• To my family members for all the constant support throughout my studies
• To friends and colleagues for the encouragement provided when I decided to embark
on this journey
• To Chris Manyamba (WHRI) for the assistance with the statistical data analysis, for
your patience and willingness to impart some of your knowledge with me
• Finally, to my Research Supervisor, Morris Mthombeni for the guidance provided
since inception of the project
©© UUnniivveerrssiittyy ooff PPrreettoorriiaa

5 | P a g e
TABLE OF CONTENTS
LIST OF ACRONYMS AND ABBREVIATIONS .................................................................... 8
CHAPTER 1: INTRODUCTION .......................................................................................... 10
1.1 INTRODUCTION .................................................................................................. 10
1.2 PROBLEM STATEMENT ..................................................................................... 12
1.2.1 Problem 1 ...................................................................................................... 13
1.2.2 Problem 2 ...................................................................................................... 13
1.2.3 Problem 3 ...................................................................................................... 14
1.3 PURPOSE OF THE RESEARCH .......................................................................... 15
1.4 DOCUMENT STRUCTURE .................................................................................. 16
2 CHAPTER 2: LITERATURE REVIEW ......................................................................... 17
2.1 INTRODUCTION .................................................................................................. 17
2.2 LESGILATIVE REGULATIONS IN THE CONTEXT OF SOCS .............................. 17
2.3 GOOD CORPORATE GOVERNANCE ................................................................. 18
2.4 IMPORTANCE OF BOARDS ................................................................................ 21
2.5 BOARD COMPOSITION ...................................................................................... 22
2.6 BOARD DIVERSITY ............................................................................................. 23
2.6.1 Gender diversity ............................................................................................. 25
2.6.2 Educational diversity ...................................................................................... 27
2.6.3 Cultural and ethnic diversity ........................................................................... 27
2.7 THE ROLE OF PRINCIPAL-AGENCY RELATIONSHIP ....................................... 28
2.8 ORGANISATIONAL EFFECTIVENESS ............................................................... 30
3 CHAPTER THREE: HYPOTHESIS.............................................................................. 33
3.1 INTRODUCTION .................................................................................................. 33
3.2 HYPOTHESES ..................................................................................................... 33
3.2.1 First Hypothesis ............................................................................................. 33
3.2.2 Second Hypothesis ........................................................................................ 34
3.2.3 Third Hypothesis ............................................................................................ 35
4 CHAPTER 4: RESEARCH METHODOLOGY ............................................................. 36
4.1 INTRODUCTION .................................................................................................. 36
4.2 RESEARCH DESIGN ................................................................................................ 36
4.3 UNIT OF ANALYSIS .................................................................................................. 37
4.4 POPULATION AND SAMPLE .............................................................................. 38
4.4.1 Population ...................................................................................................... 38
©© UUnniivveerrssiittyy ooff PPrreettoorriiaa

6 | P a g e
4.4.2 Sample size and selection ............................................................................. 39
4.5 DATA COLLECTION ............................................................................................ 41
4.6 DATA ANALYSIS ................................................................................................. 43
4.6.1 Data interpretation ......................................................................................... 44
4.6.2 Validity and reliability of the results ................................................................ 44
5 CHAPTER 5: RESULTS .............................................................................................. 45
5.1 INTRODUCTION ....................................................................................................... 45
5.2 RACE OF BOARD MEMBERS ..................................................................................... 46
5.3 POSITION ............................................................................................................... 47
5.4 TRENDS ANALYSIS ................................................................................................. 49
5.5 AUTOCORRELATION ............................................................................................... 51
5.6 PORTMANTEAU TEST FOR WHITE NOISE ................................................................... 53
5.7 NORMAL DISTRIBUTION TEST .................................................................................. 55
5.8 THE DICKEY-FULLER TEST ...................................................................................... 56
5.9 JOHANSEN CO-INTEGRATION TEST........................................................................... 57
5.10 VECTOR ERROR CORRECTION MODEL (VECM) ....................................................... 58
5.11 VECTOR AUTOREGRESSION .................................................................................... 58
5.12 REGRESSION ANALYSIS .......................................................................................... 60
6 CHAPTER 6: DISCUSSION OF RESULTS ................................................................. 62
6.1 INTRODUCTION ....................................................................................................... 62
6.2 ANALYSIS .............................................................................................................. 62
6.2.1 Board structures and performance ................................................................. 62
6.2.2 Political appointees negatively impact the performance of SOCs ................... 64
6.3 THE ESTABLISHMENT OF A DIVERSE BOARD STRUCTURE AND COMPANY PERFORMANCE
ARE POSITIVELY RELATED.................................................................................................. 64
6.3.1 Ethnic diversity ............................................................................................... 64
6.3.2 Gender Diversity ............................................................................................ 65
6.3.3 Age Diversity.................................................................................................. 66
6.3.4 Board experience and educational background ............................................. 67
7 CHAPTER 7: SUMMARY, CONCLUSION AND RECOMMENDATIONS .................... 68
7.1 INTRODUCTION ....................................................................................................... 68
7.2 SUMMARY OF MAIN FINDINGS .................................................................................. 68
7.3 LIMITATIONS ....................................................................................................... 69
7.4 RECOMMENDATIONS ........................................................................................ 70
©© UUnniivveerrssiittyy ooff PPrreettoorriiaa

7 | P a g e
REFERENCES ................................................................................................................... 71
©© UUnniivveerrssiittyy ooff PPrreettoorriiaa

8 | P a g e
List of acronyms and abbreviations
ACSA Airports Company of South Africa
AGSA Auditor General South Africa
ARC Agricultural Research Council
ATNS Air Traffic and Navigation Services Company
Armscor Armaments Corporation of South Africa Corporation
ASSAF Academy of Science of South Africa
CBE Council for the Built Environment
CCMA Council for Conciliation, Mediation and Arbitration
CEO Chief Executive Officer
CEF Central Energy Fund
CMS Council for Medical Schemes
CGE Commission for Gender Equality
CIDB Construction Industry Development Board
CIPC Companies and Intellectual Property Commission
CSIR Council for Science and Industrial Research
DBSA Development Bank of Southern Africa
EBITDA Earnings Before Interest, Tax, Depreciation and Amortization
ECIC Export Credit Insurance Corporation of South Africa
ECSA Engineering Council of South Africa
FFC Financial and Fiscal Commission
FIC Financial Intelligence Centre
FSB Financial Service Board
©© UUnniivveerrssiittyy ooff PPrreettoorriiaa
9 | P a g e
GEMS Government Employees Medical Scheme
GEPF Government Employees Pension Fund
GDP Gross Domestic Products
HPCSA Health Professions Council of South Africa
HSRC Human Science Research Council
ICASA Independent Communications Authority of South Africa
IDC Industrial Development Corporation
IRBA Independent Regulatory Board for Auditors
ITAC International Trade Administration Commission of South Africa
MHSC Mine Health and Safety Council
MTSF Medium Term Strategic Framework
NEF National Empowerment Fund
PFMA Public Finance and Management Act, Act 29 of 1999
PRASA Passenger Rail Agency of South Africa
OECD Organization for Economic Co-operation and Development
PIC Public Investment Corporation
PWC Price Waterhouse Coopers
ROA Return on Assets
SABC South African Broadcasting Corporation
SANRAL South African National Road Agency SOC Ltd
SAA South African Airways
SASSA South African Social Security Agency
SOC State Owned Companies
©© UUnniivveerrssiittyy ooff PPrreettoorriiaa

10 | P a g e
CHAPTER 1: INTRODUCTION
1.1 INTRODUCTION
State Owned Companies (SOCs) are defined as entities in which the government has
control through a wholly, majority, or significant minority ownership (OECD, 2015), and in the
context of South Africa, the state through the office of the ministry under which the SOC falls
is usually the main shareholder.
State Owned Companies are generally not created to maximise profits or incur losses, rather
their existence is primarily for the purposes of driving development agenda on behalf of the
government. They are commonly segmented into two categories, commercial, in relation to
those companies that are mandated to drive profitability and non-commercial, for those that
are established to enhance service delivery and create employment on behalf of the
government (Jurkonis & Petrusauskaitė, 2014) (ANC, 2012). SOCs are often associated with
mismanagement and poor financial performance and this is generally attributed to various
aspects such as operational inefficiencies, resource inadequacies (Ambe & Badenhorst-
Weiss, 2012), misappropriation of funds and the lack of shareholder accountability
(McGregor, 2014). These aspects fuel the perception that SOCs are black holes which
destroy shareholder value and waste taxpayer’s monies due to their inability to deliver
appropriate levels of returns and the inadequate application of the best corporate
governance guidelines within their ownership and management structures (PWC, 2015).
This study embarks on the determination of the appropriate board structures within South
African SOCs that can optimise performance and generate value for all stakeholders, and to
achieve this, the research paper raises two questions;
i. Whether board compositions are essential for SOCs?
ii. What characteristics of a SOC board structure may influence the effectiveness of
these organisations and ultimately, their performance?
SOCs have proven to be a vital component for economic growth and have also played a
significant role globally to drive economic progression or resurrect collapsing economies, a
view confirmed by PWC (2015) report which highlighted that the proportion of SOCs among
©© UUnniivveerrssiittyy ooff PPrreettoorriiaa

11 | P a g e
the Fortune Global 500 had grown from 9% to 23% between the year 2005 and 2014, mainly
fuelled by growth of the Chinese SOCs (PWC, 2015). South Africa currently has an excess
of 700 SOCs that contributes approximately 9.2% to the Gross Domestic Products (GDP)
(Moneyweb, 2013), with its key strategic entities being the likes of ESKOM, South African
Airways (SAA), the South African Broadcasting Authorities (SABC), DENEL, Public
Investment Corporation (PIC) and Transnet to mention but a few. SOCs across the globe are
normally exposed to challenges, and the ones in South Africa are not immune to such
obstacles and have often found themselves faced with obstacles that range from recurring
poor financial performances, high staff turnover at board level, incompetency, corruption,
leadership conflicts which are often characterised by appointments of interim board
members to key positions (Hans Seidel Foundation, 2014).
The magnitude of these challenges is immense such that the South African Airways has had
to continually source financial bailouts from State treasury to remain afloat and meet
operational obligations (Mail & Guardian, 2017) to the detriment of resources which could
have been applied towards service delivery to constituencies. SOCs such as Transnet,
Passenger Rail Agency of South Africa (PRASA), Eskom and the South African
Broadcasting Authorities (SABC) have also had their fair share of problems which
subsequently have impacted their going concern status and operational efficiencies, and the
main reasons for this have been cited as;
• Inadequacy in the procurement policies and poor financial performance (Auditor
General, 2013)
• Failure to appoint a permanent Chief Executive Officer (CEO) over an extended
period (Kanyane & Sausi, 2015)
• Conflicts amongst board members (Hans Seidel Foundation, 2014)
• Inability to convene board meetings as required by statute (National Assembly,
2017)
• Suspension of key board members
• Board member’s misrepresentation of qualifications (Public Protector, 2014)
• The dissolution of existing board structures, only to be replaced with interim boards
at entities such as PRASA, SABC and the Umgeni Water
All these issues render SOCs ineffective and delays strategic decision making which may
subsequently lead to poor operational performance and lost opportunities. Furthermore,
these aspects depict a gloom and negative outlook on South African SOCs, and raises
©© UUnniivveerrssiittyy ooff PPrreettoorriiaa

12 | P a g e
concern pertaining to governance and the capability of those appointed to board structures
of such institutions to adequately manage these entities for the best interests of all
stakeholders. The unintended consequence is that the country’s resources gets strained and
an unnecessary financial burden placed on the shoulders of the state, an aspect which is
negatively viewed by rating agencies (Moneyweb, 2017). Studies undertaken by (Adam,
2013; Heath & Norman,2004) established that SOCs that are efficient and effective are
critical to the delivery of affordable quality of goods and services to citizens, therefore, it is
important to have SOCs governed ethically, independent of political interference and that
they protected from elements of corrupt activities (Adam, 2013) (Heath & Norman, 2004).
This research used the principal-agent theory as the main literary background to build and
generate an insight into SOC board structures and their performances, and is augmented
with the literature on organisational effectiveness and corporate governance, with the
primary focus on governance and board composition.
1.2 PROBLEM STATEMENT
The subject on SOCs is not widely researched, and has received little attention with the
focus predominantly been on private firms as corporate governance has traditionally been
fixated on companies which operate within the private sector (Menozzi & Vannoni, 2014),
and consequently, this has often impeded SOCs from the implementation of adequate
governance structures and processes to avert poor performances and financial
mismanagements. (Kanyane & Sausi,2015; Adam,2013) confirmed that SOCs meagre
performance and failures are largely due to poor governance rather than ownership
structure, and that political interference plays a role in governance matters and at times
inhibits directors’ independence (Kanyane & Sausi, 2015) (Adam, 2013).
The Auditor General (2013) report on SOCs further highlighted the most common risk areas
that have an impact on the future sustainability of these entities, and they include;
• The quality of submitted financial statements and company reports (Denel at one
point reported a government bail-out as a profit during one financial period)
• Financial health status
• Poor financial controls particularly within the supply chain including contracts and
tenders (Auditor General, 2013)
©© UUnniivveerrssiittyy ooff PPrreettoorriiaa

13 | P a g e
This research paper has identified three key challenges faced by these entities, and are
outlined as follows:
1.2.1 Problem 1
The King code on corporate governance advocates for a board structure that is independent
and able to exert authority in execution of its mandates. Menozzi & Vannoni (2014) raises an
argument on the subject of corporate governance, that the traditional separation between
shareholders and controlling managers does not apply to SOCs as executives are
nominated by a public entity which usually holds a great enough stake to ensure real control
rights and establish absolute priorities (Menozzi & Vannoni, 2014), therefore, the existence
of such a shareholding structure empowers the state as a shareholder with a fiduciary
responsibility to appoint board members to represent their interests, and at times, an
element of biasness pertaining to such appointments may arise with preference given to
candidates who are able to drive the government’s agenda to the detriment of
independence.
State intervention is not necessarily wrong, it is the purpose for which it is geared towards
that is important hence, the requirement to ensure that those appointed retain their
independence regardless of their affiliation, because at times, the unintended consequence
of having state ownership is that it creates an agency conflict, where the agent may find
themselves caught up between the pursuance of the principal’s directives and serving the
interests of the SOC resulting in a dual accountable system (Hans Seidel Foundation, 2014)
(Centre for Corporate Governance in Africa, 2012). This also cultivate a culture of “cronyism”
that is wriggled with issues of corruption, bribery and inefficiencies that hampers
organisational performance and prevent SOCs to attract and retain the required skill set and
capabilities (McGregor, 2014) (Menozzi & Vannoni, 2014).
Based on this, the establishment of board structures that are independent from state
intervention may be a challenge for SOCs, and this study strives to examines whether the
establishment of boards is aligned to corporate governance guidelines.
1.2.2 Problem 2
The second predicament faced by SOCs is utter incompetency driven largely by the
shortages of the appropriate skills set and expertise to manage, lead and execute
©© UUnniivveerrssiittyy ooff PPrreettoorriiaa
14 | P a g e
organisational mandates (Ambe & Badenhorst-Weiss, 2012), (McGregor, 2014). This can be
attributed to numerous aspects, one of which is the preference towards private sector
employment opportunities which generally appeal to a large fraction of the highly skilled
individuals as they are often enticed by attractive financial packages that the private sector
offers, coupled with a clearer career path, less bureaucratic practices and the transparency
with which the private sector handles its business affairs (Urtiaga & Menozzi, 2013), an
aspect which has been found to lack with the SOCs. This challenge prevents SOCs from the
benefit of a diverse pool of individuals with a variety of expertise, education levels and
cultural backgrounds, and thus afford shareholders (principals) with self-serving interests a
platform to elevate individuals (agents) who lack in independence and likely to;
• drive a predefined agenda to the detriment of the SOC progress
• drift apart from being accountable
• fail to address operational non-performance issues
• take decisions that are contrary to the interests of the organisation in favour of the
principal’s agenda, and
• destroy value of the business (Menozzi & Vannoni, 2014) (Adam, 2013)
This highlights the importance of having appropriately qualified personnel within board
structures, and this research interrogates the extent to which the SOCs boards are equipped
with the right skill sets to achieve efficiencies, profitability and attain set mandates.
1.2.3 Problem 3
Lastly, SOCs operate as companies and some rely on international capital markets for
funding, and to access these funds at reasonably competitive rate requires a demonstration
of a consistent good financial performance and the presence of appropriate governance
structures. The rating agencies have outlined that they continue to assess the level of
bailouts granted to SOCs as they pose a challenge to government’s fiscal balances and
policy priorities, and create a highly-indebted climate as the State at times must source
external funding to assist these entities. The main reasons cited in respect of this trend is the
inadequacy in operational efficiencies and poor governance (Moneyweb, 2017). Therefore,
the lack of governance structures at SOCs is highlighted as one of the key obstacles, and
this study probes the extent to which these entities have established good governance
structures to attain levels of stability.
©© UUnniivveerrssiittyy ooff PPrreettoorriiaa

15 | P a g e
In addressing three problems identified above, the study was extended to SOCs across
various states departments and comparison derived from such. The focus has been on the
assessment of the appropriateness of board structures in accordance with good corporate
governance guidelines particularly in respect of board diversity, level of board independence,
board committees and skills availability (Adam, 2013) (Menozzi & Vannoni, 2014) and their
impact towards the attainment of profitability and effective performance.
In summary, the study has identified the following three problems:
i. The impact of the principal agency relationship on directors’ independence
ii. The unavailability of required skill sets and impact on operational
efficiencies/performance
iii. The impact of inadequate governance structures on ability to attain board stability
and create a conducive climate to access capital markets
1.3 PURPOSE OF THE RESEARCH
The value in doing this research stems from the background that government intervention
across the world, and for generations, has been at the forefront of economic transformation.
The case in point is that post the great depression era, Western countries revived their
economies based on the strength of state participation in economic activities through SOCs,
even though this contribution has diminished over the years due to changes in their
economic structures. Since the collapse of the Soviet Union, some of the Eastern European
countries have also embraced the management of state assets as a strategic vehicle to
spearhead economic reforms and growth (PRC, 2013) (Aharoni & Vernon, 2014)). China on
the other hand provides a perfect example of an economy that has successfully been built
on the strength of SOCs, and has in the process implemented excellent reforms to shed off
some of these entities that proved to be a fiscal burden, unprofitable and inefficient (Gang &
Hope, 2013)
Notwithstanding some of the good stories associated with SOCs, these entities have been
found to be inefficient within the developing countries (PRC, 2013), a view confirmed by
Adams (2013), who advances an argument that there is a public perception which
associates effectiveness and efficiency only with the private sector (Adam, 2013).
Considering that South Africa has a mixture of a dominant private and public sector
©© UUnniivveerrssiittyy ooff PPrreettoorriiaa

16 | P a g e
economic system, SOCs remain an essential vehicle for government to drive service
delivery, create employment and generate economic value, therefore, there are high
expectations to have these entities remain influential into the future, and this can only be
attained through efficiency in management and adherence to good corporate governance
guidelines.
Based on these aspects, this research aims to contribute to existing body of knowledge on:
• corporate governance and board compositions within public governance and
administration
• state’s approach towards the management of its economic affairs through the SOCs
• effective application of the principal-agent relationship in driving performance, and
• identification of challenges and strengths of the SOCs
1.4 DOCUMENT STRUCTURE
Chapter one of this research study refers to the introductory part of the topic and the
applicable business context. In chapter two, the focus is on the relevant literature review and
covers theoretical knowledge on good corporate governance, with a specific focus on
governance principles around board composition and diversity, the agency theory as well as
the concept of organisational effectiveness. The agency theory has been chosen as the key
theoretical background for board composition and organisational effectiveness of the SOCs,
and reliance will also be placed on practical theory from the corporate arena. Chapter three
discusses the formulation of the research hypothesis, while chapter four outlines the
methodology, coupled with the research question, and provides a detailed explanation and
justification of all the theory variables as outlined in chapter two.
In Chapter five, the statistical results and analysis are outlined, while chapter six discusses
the findings, coupled with similar previous findings on the same topic. Chapter seven
summarises the findings set out in chapter six, and a conclusion with limitations of the study
addressed as well as the recommendations that may be applied in practice and future
related researches are provided.
©© UUnniivveerrssiittyy ooff PPrreettoorriiaa

17 | P a g e
2 CHAPTER 2: LITERATURE REVIEW
2.1 INTRODUCTION
This chapter discusses the theoretical aspects on corporate governance, agency theory and
the concept of organizational effectiveness. The aspect on corporate governance addresses
what constitutes governance, the role of the good governance principles, and board
composition structures as well as practical reference to existing literature on SOCs in South
Africa. The agency theory is outlined in the context of board composition and independence,
while the concept of organizational effectiveness is addressed from the perspective of
measuring performance.
2.2 LESGILATIVE REGULATIONS IN THE CONTEXT OF SOCs
The Presidency of Jacob Zuma in May 2010, instituted reforms to transform the role of
SOCs to drive economic growth by establishing the Presidential State-Owned Entities
Review Committee (Kanyane & Sausi, 2015). At the center of the committee’s mandate is
the resolution of board and CEO appointments and a strive to attain board independence
considering the fiduciary responsibilities that are placed in the office of the ministry to
appoint the CEO, who consequently qualifies as a political appointee accountable to the
board which had no say in his or her appointment (Burmeister, 2013).
SOCs in South Africa are subjected to multiple legislatives, the Public Finance and
Management Act (PFMA), Act 29 of 1999 and the Companies Act of South Africa, Act No.71
of 2008. The former is a critical legislative applicable to the functionality of SOCs, and
provides key guiding principles in terms of the fiduciary responsibilities which are conferred
onto the SOCs, and include;
• The responsibility for governing bodies and accounting authorities to perform duties
with utmost care, ensure reasonable protection of the entity’s assets and financial
records
• The duty to act with fidelity, honesty and integrity in the best interest of the entity
(PFMA: Section 50, 1999)
©© UUnniivveerrssiittyy ooff PPrreettoorriiaa

18 | P a g e
Furthermore, South Africa SOCs are registered in terms of the Companies Act of 2008, a
key legislation that pertains to how companies are regulated. This legislation provides
essential guidelines to those charged with governance matters on how to carry out their
fiduciary responsibilities and maintain accountability to all stakeholders. The Act also
advocates for the necessity to equip organizations with directors who are independent, act in
good faith for the best interests of their organizations (Companies Act No,71, 2008) and
avert possible political influence and participation in governance matters of such institutions
(PWC, 2015). Both the PFMA and the Companies Act have legislative elements that are
non-congruent and at conflicts with each other to the detriment of stability at board levels,
moreover when it comes to board appointments, as the PFMA empowers the State through
the ministry and presidency to appoint the CEO, while the Companies Act, delegates this
responsibility to the board.
Over and above these two legislatives, SOCs have adopted the King Code on Corporate
Governance, a framework which advocates the best corporate practices and principles on
governance matters (Institute of Directors South Africa, 2009). This framework is not
legislated, and companies generally adopt it on a voluntary basis, and central to it, are the
principles on fair representation at board level, implementation of sound processes such as
transparency in respect of board appointments, attainment of diversity at a board level to
ensure that boards are reflective of the country’s demographics, ensuring that the board
comprises of a suitably mixture of qualified personnel (Hans Seidel Foundation, 2014) based
on merit rather than political affiliation and an ethical behavior. The rationale behind this
approach is that board appointments will come from diverse spheres, eliminate undue
influence and ensure that board independence is not compromised (Adam, 2013).
2.3 GOOD CORPORATE GOVERNANCE
The objective of corporate governance is to regulate the relationship between the main
stakeholders in the form of shareholders, directors and the executives (Sari, John, & Wahyu,
2010). Adam (2013) established that poor performance and corporate failure, being in the
private or public sector and is largely due to inadequate governance structures, and purports
that the demise of companies such as Enron and WorldCom Brothers had everything to do
with governance issues as opposed to ownership structures and performance (Adam, 2013).
©© UUnniivveerrssiittyy ooff PPrreettoorriiaa

19 | P a g e
Jurkonis & Petrusauskaitė (2014) advocates for the adequate implementation of best
management practices as is the case with the private sector entities. This inclination has
proven to have a positive impact on minimising market and political risks, and that should
they be extended to SOC structures, the likely outcome will be an improvement to
governance and controls, and subsequently performance (Jurkonis & Petrusauskaitė, 2014)
Governance is defined as the ability to make and enforce rules within an operational
environment and the exercise of an administrative authority at all levels in the management
of the organisation’s affairs (Fukuyama, 2013). It also extents to the sustainability and
coherence among a wide variety of actors (political, civil, institutions and groups) with
different purposes and objectives (Peters & Pierre, 2000), and that it comprises of the
mechanisms, processes and institutions through which all stakeholders can express their
interests and exercise their legal rights to hold those in authority accountable (United
Nations Educational, 2012).
The notion of governance has its origin from the Greek word, “kubernao” which means to
steer, guide and direct the course, and was forged by an ancient Greek philosopher, Plato
(Wikipedia, n.d.). In the context of organisations, this guidance pertains to the roles of
boards, and according to the King report on good governance, coupled with the laws and
regulations as covered by the Companies Act, 2008 (Act No.71 of 2008), governance entails
having institutional bodies, in the form of a board structures which should assist in the
development of a systematic approach and guidelines on good practices within an
organisation (Institute of Directors South Africa, 2009).
At the centre of good governance is essentially effective leadership that is characterised by
the ethical values of responsibility, accountability, fairness and transparency and the need to
achieve a sustainable economic, social and environmental performance (Institute of
Directors South Africa, 2009), augmented by cohesive operational structures, systems,
processes, regulatory certainty, the right mix of intelligence with knowledge and expertise
(McGregor, 2014) which are geared towards the composition of solid board structures
(Institute of Directors South Africa, 2009). Strategic and solid leadership form the base for
adequate implementation of good governance principles (Adam, 2013), a view confirmed by
PWC (2015) which emphasises that the leaders of future SOCs particularly the board and
©© UUnniivveerrssiittyy ooff PPrreettoorriiaa

20 | P a g e
executives will be required to comply with the following four attributes to attain operational
effectiveness within their organisation;
Attribute Explanation
1. Clarity Encompasses an understanding of the purpose and
objectives of the SOCs and their role in service delivery
2. Capacity The availability of time and resources to perform their
roles adequately
3. Capability Access to a wide spectrum of the required and relevant
experience and expertise to govern and manage the
SOCs
4. Commitment and integrity Serve all stakeholders with a purpose and sense of
accountability in the manner that adheres to rules and
defined guidelines
(PWC, 2015).
Heath & Norman (2004)’ study has observed a transformed approach across the globe on
the increase of boards performances of the SOCs and a strive for more accountable
governance from the boards and shareholders (Heath & Norman, 2004), and that some of
the implemented governance reforms include an approach to make the boards more
professional and act independently (Adam, 2013) as a strong board often translates into an
effective participation when it comes to strategy formulation and execution, and provides a
proper incentive for the management to maximise value for the best interests of all
stakeholders (Heath & Norman, 2004). In the context of South Africa, this has been
enhanced by the release of the King IV report on corporate governance, with the distinct
focus on:
• ethical behaviour and ethical management/leadership
• emphasis on active shareholding and holding the board to account for their decisions
• The role of the board
The adverse effect of the King IV report is that is has retained the principle of “Apply or
explain” which fails to hold organisations to be more compliant. This principle only requires
companies to issue a statement to the effect that they are compliant to the principles outlined
in this report, contrary to the United States and the UK, in which a similar framework
©© UUnniivveerrssiittyy ooff PPrreettoorriiaa
21 | P a g e
compels companies to explicitly outline their compliance level, and where they have failed to
achieve this, an explanation is required (Kanyane & Sausi, 2015).
2.4 IMPORTANCE OF BOARDS
The fundamental aspect with SOC governance has centred around clarification of their roles
and decision making powers that are bestowed on the board which plays which plays a
central function in the governance of the SOC (Frederick, 2011). The King IV report on good
corporate governance advocates for a board that is accountable to all stakeholders, and
strives to attain independence and control over the entity’s affairs, and thereby, advocates
for the board to comprise of much of independent non-executive directors who can hold the
management accountable. This proposition is enhanced by clauses in the Companies Act
(2008) which places emphasis on the board to manage it affairs, and explicitly requires that
boards should be at the forefront to manage and provide directions to the companies they
serve. Furthermore, this Act is specific in terms of board appointments and requires that
guidelines as stipulated in terms of section 66 of this legislation need to be adhered to for
any such appointments.
Boards generally comprises of several role players, the Chairman, CEO, directors and board
committees. It is essential distinguish between the roles of the directors as they are
segmented into two categories, executives and the non-executive. The former refers to
those that are actively involved in the running of daily operational demands and
responsibilities, while the latter, refers to those individuals that are focused more on strategic
avenues that impact the organisation. The CEO qualifies as an executive, while the
Chairman often qualifies as a non-executive function, hence the expectation to have them
serve as independent members on board structures. The guidelines on corporate
governance recommend that the role of both the Chairperson and CEO be separated, and
that the board should be tasked with such appointments (Institute of Directors South Africa,
2009).
©© UUnniivveerrssiittyy ooff PPrreettoorriiaa
22 | P a g e
2.5 BOARD COMPOSITION
There is no generic legislation that governs the recruitment and appointment of board
members to South African SOCs. The PFMA does not set out who should appoint the board
and chairperson but outlines the responsibilities of the board, and where there is no enabling
legislation, the SOC’s article of association often provides guidelines on the recruitment and
appointment of boards. The typical protocol that exists is that the board appoints the CEO
who becomes accountable to them and this responsibility also extends to the appointment of
non-executive directors.
In the case of SOCs, there is a guiding Handbook applicable to the appointment of persons
to boards of state controlled entities, and this serves purely as a guideline and is not
compulsory to apply. In the context of wholly owned SOC, the state generally has much
greater say in the composition of the board, a practice which is restricted where there is dual
ownership in a SOC that involves external shareholders, as the state has a limit of authority
which restricts it to the appointment of five non-executive directors for a fixed period of three
years, while a chairman is appointed for one year. This practice often creates challenges
when it comes to the attainment of board instability and is exacerbated by legislative
conflicts that exist between the PFMA and the Companies Act as the former affords
government as a shareholder the right to appoint and dismiss a CEO of the SOC, while the
latter requires the board’s input, and at times, disagreements amongst shareholders and the
board may ensue as to who has the final decision making powers.
OECD (2004) guidelines states that the boards of a SOC should be structured in a manner
that encourages objectivity and independent judgement, and where individuals are
mandated to serve on such boards, mechanisms should be developed to ensure that this
representation is exercised effectively and contributes to the enhancement of the board
skills, information and independence. The guidelines further recommend that the board
composition and representation should consider race, disability and gender (OECD, 2004), a
proposition which is augmented by the principles on good corporate governance which
stipulates that the board should comprise of a balance of executive and non-executive
directors, with a majority being non-executive independent directors to enable it to have an
unbiased approach towards the management of the operations. Based on this, it is essential
that a board comprises of members who are from diverse background with a different skill
sets to promote objectivity in decision making.
©© UUnniivveerrssiittyy ooff PPrreettoorriiaa
23 | P a g e
2.6 BOARD DIVERSITY
Diversity is the variation of social and cultural identities among people existing together in a
defined environment, market setting, social and cultural identity which have a significant
influence on people’s major life experiences with the key attributes being gender, race,
national origin, religion, age and work specialisation (Cox, 2001). Studies on diversity have
found that it comprises of two segments;
i. Demographics, which include age, race and ethnicity
ii. Cognitive, which may take the form of knowledge, education, value system,
perception, affection and personality traits (Petersen, 2000) (Timmermen, 2000)
The OECD (2015) principles on corporate governance recommends that boards should
regularly carry out evaluations to appraise their performance and assess whether they
possess the right mix of background and competences to implement and improve the board
practices, and this extends to boardroom quotas and other initiatives that enhances gender
diversity on boards and at senior management level (OECD, 2015), while the King report on
corporate governance sanctions that boards should consider whether its size, diversity and
demographics make it effective (Institute of Directors South Africa, 2009).
Swartz and Firer (2005) define board diversity to constitute a variety amongst the members
of boards of directors in terms of characteristics such as the level of expertise, managerial
background, personality, learning style, age, gender, education, values (Swartz & Firer,
2005), social connectedness, insider status and race (Ferreira, 2010), and simply translates
to the ability of the organisation to bring together individuals from various cultural
backgrounds, with a different skill set based on their fields of expertise, and from different
racial denominations (Dobbin & Jung , 2011).
Ferreira (2010) identified that an economical and managerial approach often compels firms
to choose directors for their characteristics, and that different board compositions provide
diverse connections with the outside environment such as competitors, suppliers, investors,
politicians, the media and other stakeholders, and as a result, the director’s characteristics
could affect their competency, incentive to monitor and advise managers, and create an
avenue to be pursued in maximizing shareholder value or protect the interests of executives
(Ferreira, 2010).
©© UUnniivveerrssiittyy ooff PPrreettoorriiaa
24 | P a g e
The literature confirms that the establishment of a diverse board structure provides benefits
towards the effective functionality of the board and those in favour of this approach cite the
following reasons in support of their proposition:
• Creativity and different perspectives in that people from various backgrounds with
different life experiences are likely to approach similar problems in different ways. Some
evidence indicates that more diverse groups foster creativity and produce a greater
range of perspectives and solutions to problems and are less likely to suffer from group
ideology as they are more likely to acquire information through a diverse set of sources
• Access to resources and connections, as the selection of directors with different
characteristics, organisations may gain access to different resources. Directors with
political connections may help firms deal with regulators or win government procurement
contracts. These reasons probably cannot explain a demand for some other
demographic characteristics such as gender, age, or ethnicity
• Career incentives through signalling and mentoring as diversity in the boardroom
may signal to lower-level employees that the company is committed to the promotion of
minority workers or at least that their minority status is not a hindrance to their careers in
the company (Kang, Cheng, & Gray, 2007) (Ferreira, 2010).
While diversity has its benefits, it goes without saying that shortcomings are inevitable, and
Ferreira (2010) identified the below as some of the adverse effects that are brought about by
a strive for diversity;
• Conflict, lack of cooperation, and insufficient communication due to social
psychology concept of group “fault-lines” which hypothetically may divide a group into
subgroups based on one or more attributes such as demographic dissimilarity which may
limit communication among subgroups, create conflict, and reduce interpersonal
attraction and group cohesiveness. In the case of corporate boards, perhaps a key
problem associated with diversity is the possibility of communication breakdowns
between top executives and minority outside directors
• Choosing directors with little experience, inadequate qualifications, or who are
overused mainly for their demographic characteristics is the possibility of neglecting
other important characteristics. This has the consequential impact of a board which is
young and inexperienced
• Conflicts of interests and agenda pushing as some directors may be more interested
in pushing their own personal agenda even at the expense of the company’s profits.
©© UUnniivveerrssiittyy ooff PPrreettoorriiaa

25 | P a g e
Perhaps more problematic is the case in which directors also represent the interests of
outsiders (for example, directors with financial industry connections). A more diverse
board may be in greater risk of being influenced by directors with distinct personal and
professional agendas (Ferreira, 2010).
Several studies on diversity reveal that the relationship between diversity and organizational
performance can either be positively or negatively correlated, and to an extent, diversity
enhances greater creativity, innovation and quality of decision making at a strategic level of
the board of directors (Daunfeldt & Rudholm, 2013) (Dobbin & Jung , 2011) (Ferreira, 2010).
Diversity can also lead to a negative impact on performance, and it is therefore, essential to
fully explore the advantages associated with a consistent or similar management structure
as they have been found to positively contribute to firm performance in comparison to a
diverse team (Knight, et al., 1999).
While the attainment of diversity at a board level is a process, Ferreira (2014) found that the
following considerations were prevalent and consistent with the establishment of a diverse
board:
• Firms appear to choose directors for their characteristics, and different types of firms
choose different levels of director heterogeneity
• Firms choose directors strategically to deal with external environment
• CEOs and top executives appear to prefer directors who are like themselves
• Social networks and commonality of background appear to affect director
appointments and the dynamics of the board
• Directors from minority groups perceive their minority status as a hindrance at their
work as a director
• Minority directors may serve interests other than those of shareholders (Ferreira,
2014)
2.6.1 Gender diversity
At the forefront of diversity is female representation in corporate boards and this has recently
become the focus point (Ferreira, 2014), augmented by racial diversity which has proven to
enable quicker decision making even though at times may fuel board conflicts and inhibit
©© UUnniivveerrssiittyy ooff PPrreettoorriiaa

26 | P a g e
decision making due to disparities (Dobbin & Jung , 2011). Adams & Ferreira (2007)
established that there is some interaction between gender and governance, and that female
directors have demonstrated independent traits than their male counterparts, and are more
likely to be tough monitors of controls and governance (Adams & Ferreira, 2007). The contra
argument is that independence comes at a cost, and the expectation that adding women to
board structures will result in a direct benefit to firm performance may not be realized as
confirmed in a study by (Adams, Hermalin, & Weisbach, 2010) which determined a weak
correlation between firm performance and board gender diversity, and that some firms
appeared to benefit from adding women to their board structures while others would
probably experience a decline in performance.
(Ahern & Dittmar, 2012; Matsa & Miller, 2013) also carried out a study on the impact of
introduction of quotas on Norwegian firms and identified that the introduction of quotas had a
negative impact on firm performance. The reasons cited in support of their findings were that
firms which are forced by regulation to do what is contrary to regular norms are likely to incur
costs which emanates from:
1. Enforced laws to hire based on quota for compliance purposes have not
demonstrated any evidence that the newly appointed directors will be as qualified as
the previous ones (incumbent)
2. Mandatory quota system is expected to reduce profitability unless,
o Management talent is in excess supply, or
o Most firms engage in Beckerian’s taste based discrimination and are thus
willing to sacrifice profits just to avoid employing based on quota (Ahern &
Dittmar, 2012) (Matsa & Miller, 2013)
A similar research undertaken by Campbell & Vera (2010) on legislative changes in Spain
reached an outcome which confirmed that positive discrimination in favor of female board
appointments and gender equality act make economic sense as stock markets reacted
positively to the appointment of female board members and a positive association with firm
value (Campbell & Vera, 2010). This is contrary to the findings of (Ahern & Dittmar, 2012)
(Matsa & Miller, 2013) on the issue of quotas on firm performance, the latter argued that
performance is impacted negatively by a quota system in that those appointed to board
positions based on this system often tend to be younger and possesses limited experience,
while the latter holds the view that effects of quota system on performance is merely a
©© UUnniivveerrssiittyy ooff PPrreettoorriiaa

27 | P a g e
function of leadership. Bøhren & Staubo (2014) arrived at a conclusion that the introduction
of the quota system influences board independence with the level of independence having
increased from 46% in 2003 to 67% in 2008, explained by the notion that women
participation in board structures had increased (Bøhren & Staubo, 2014). Daunfeldt &
Rudholm (2014) confirmed that greater gender diversity could lead to a better understanding
of markets and that a decision-making process could be improved since alternatives and
their consequences might be evaluated in detail (Daunfeldt & Rudholm, 2013).
2.6.2 Educational diversity
The attainment of diversity is supported by theories, one of which is the literature on
psychology which suggests that educational diversity in problem solving groups improves
performance (Milliken & Martins, 1996), while the literature on decision making indicates that
teams with functional heterogeneity are more effective at solving problems and
implementation of change than homogeneous teams. Lastly, the social identity theory
purports that people are drawn to those who have similar traits as them and that diversity at
times has the potential to divide groups on racial, experiences and educational lines (Dobbin
& Jung , 2011).
2.6.3 Cultural and ethnic diversity
The similarity-attraction theory speaks against diversity on the board structures and argues
that it decreases firm performance, as individuals prefer to affiliate with other individuals
whom they perceive as like them based on demographic characteristics. This also stems
from individuals having experienced similar historical events and simultaneously reaching
similar stages in private and family lives. It has also been found that excessive diversity can
negatively impact performance because of conflicts and communication breakdowns
(Murphy & McIntyre, 2007). On the other hand, the attainment of diversity in race, ethnicity
and lesser extent sex tends to bring about group conflict, hinder communication and interfere
with cooperation, thereby lowering performance (Carter, D'Souza, Simkins, & Simpson,
2010).
©© UUnniivveerrssiittyy ooff PPrreettoorriiaa

28 | P a g e
2.7 THE ROLE OF PRINCIPAL-AGENCY RELATIONSHIP
In accordance with (Marks, 1999; Berle & Means,1932) a company is an economic entity
with equity owned by its shareholders, for which the level of its management effectiveness is
highly dependent on the affiliation between the owners and those tasked with the
management of the entity, and that conflicts often arises due to the enforcement of contracts
between owners and managers (Marks, 1999) (Berle & Means, 1932). Menozzi & Vannoni
(2014) identified this aspect as a “double agency” problem that often originate from conflicts
that arises between managers and the board of directors, as well as between the politicians
and ultimate owners (Menozzi & Vannoni, 2014)
The distinct feature that emanates from the agency theory is the existence of a relationship
between two parties, the principal and the agent, and explores the partnership from a
behavioural and governance perspective (Jensen & Meckling, 1976). Eisenhardt (1989)
points out that this relationship is a depiction of any type of arrangement where tasks are
delegated from the principal to a manager (Eisenhardt, 1989), while, Jensen & Meckling
(1976) emphasised that this relationship is a contract under which one or more persons
engages another person to perform functions on their behalf with the full level of authority
(Jensen & Meckling, 1976).
In the context of SOCs, the state assumes the role of the principal due to its shareholding
and determines the mandates to be achieved by these organisations, and would appoint
members to board structures to carry out the set mandates on its behalf. The manner that
this relationship is managed is critical to ensure congruency and afford those in charge with
the platform to execute on their mandates without being impeded (Menozzi & Vannoni,
2014).
The literature further purports that modern corporations in which share ownership is widely
held, managerial actions often tend to depart from those required to maximise shareholder
returns (Donaldson & Davis, 1991), and the principal (shareholder) may at times be tempted
to induce the agent (directors and management) to perform tasks that serve the principal’s
best interests to the detriment of the organisation (Menozzi & Vannoni, 2014). This practice
at times fuel a culture that promotes bureaucratic tendencies that frustrates the system and
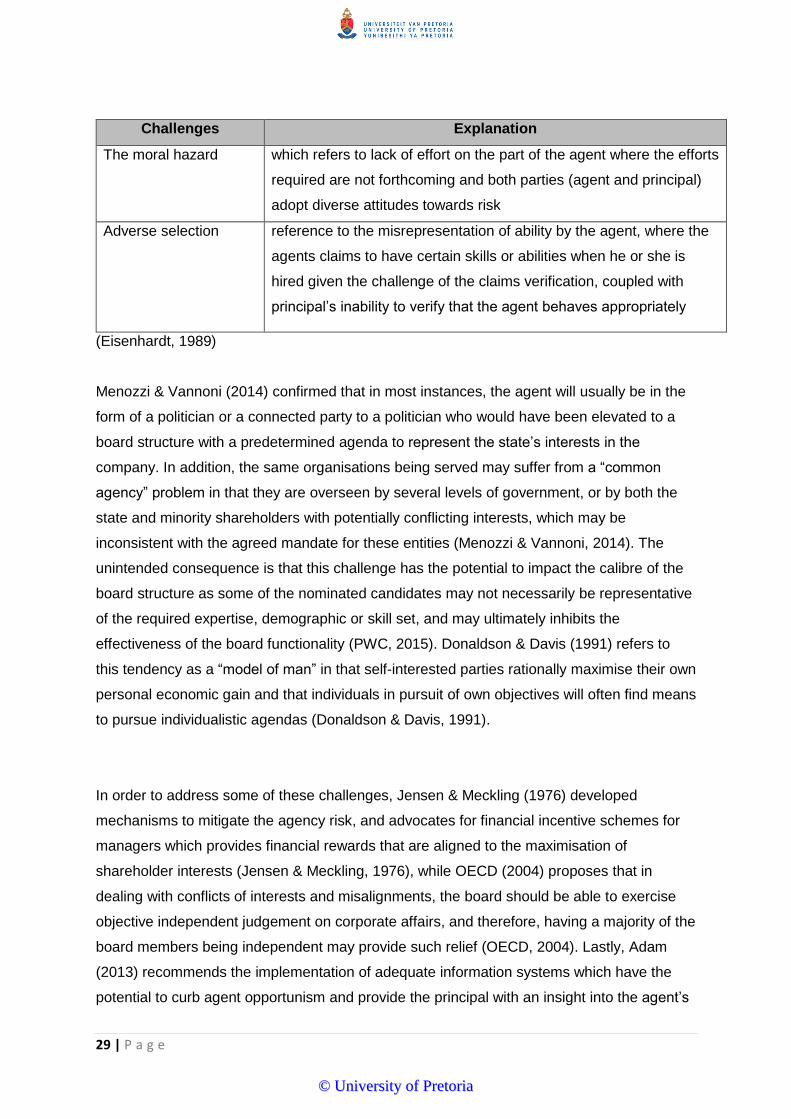
attainment of SOC objectives (Shapiro & Willig, 1990). Eisenhardt (1989) reduces these
challenges into two segments, namely;
©© UUnniivveerrssiittyy ooff PPrreettoorriiaa
29 | P a g e
Challenges Explanation
The moral hazard which refers to lack of effort on the part of the agent where the efforts
required are not forthcoming and both parties (agent and principal)
adopt diverse attitudes towards risk
Adverse selection reference to the misrepresentation of ability by the agent, where the
agents claims to have certain skills or abilities when he or she is
hired given the challenge of the claims verification, coupled with
principal’s inability to verify that the agent behaves appropriately
(Eisenhardt, 1989)
Menozzi & Vannoni (2014) confirmed that in most instances, the agent will usually be in the
form of a politician or a connected party to a politician who would have been elevated to a
board structure with a predetermined agenda to represent the state’s interests in the
company. In addition, the same organisations being served may suffer from a “common
agency” problem in that they are overseen by several levels of government, or by both the
state and minority shareholders with potentially conflicting interests, which may be
inconsistent with the agreed mandate for these entities (Menozzi & Vannoni, 2014). The
unintended consequence is that this challenge has the potential to impact the calibre of the
board structure as some of the nominated candidates may not necessarily be representative
of the required expertise, demographic or skill set, and may ultimately inhibits the
effectiveness of the board functionality (PWC, 2015). Donaldson & Davis (1991) refers to
this tendency as a “model of man” in that self-interested parties rationally maximise their own
personal economic gain and that individuals in pursuit of own objectives will often find means
to pursue individualistic agendas (Donaldson & Davis, 1991).
In order to address some of these challenges, Jensen & Meckling (1976) developed
mechanisms to mitigate the agency risk, and advocates for financial incentive schemes for
managers which provides financial rewards that are aligned to the maximisation of
shareholder interests (Jensen & Meckling, 1976), while OECD (2004) proposes that in
dealing with conflicts of interests and misalignments, the board should be able to exercise
objective independent judgement on corporate affairs, and therefore, having a majority of the
board members being independent may provide such relief (OECD, 2004). Lastly, Adam
(2013) recommends the implementation of adequate information systems which have the
potential to curb agent opportunism and provide the principal with an insight into the agent’s
©© UUnniivveerrssiittyy ooff PPrreettoorriiaa

30 | P a g e
behaviour, and that consequently, the agent is also likely to realise that they will not deceive
the principal and will change behaviour for the best interests of the principal and organisation
(Adam, 2013).
2.8 ORGANISATIONAL EFFECTIVENESS
The concept of organisational effectiveness is among the most elusive and controversial in
organisational theory, and is regarded by many as synonymous with goal attainment
(Kinnunen, Aapaoja, & Haapasalo , 2013) Cameron and Whetten (1983) specified that there
is no definite meaning of this concept as it is a construct that exist in the head of people but
have no objective reality as it cannot be pinpointed, counted or observed. It only exists
because it can be inferred from the results observable and may include social sciences in
the form of leadership, needs, intelligence, motivation and satisfaction (Cameron & Whetten,
1983). Reimann (1975) identified this concept as the ability of the organization, in either
relative or absolute terms, to exploit its environment in the acquisition of scarce and valued
resources, and that it is synonymous with the attainment of the organisation’s goals which
may not necessarily be accurate (Reimann, 1975).
Some businesses consider organisational effectiveness as the attainment of measurable
progress towards their goals, while others define it as outcome accountability which
embraces three aspects;
i. Defining the goals and objectives as appropriate to the organisation and mission
ii. Achieving observable progress towards specific outcomes for those objectives
iii. Demonstrating to stakeholders that the promised outcomes are being attained
Some of the authors that define organisational effectiveness as an outcome accountability
distinguish between the inputs, outputs, outcomes and the impact, coupled with the
understanding of the difficulties associated with evaluations. An analysis on organisational
effectiveness found that organisation competency (executive ratings of organisational
performance and executive turnover) is related primarily to management values regarding
firm’s stakeholders in the form of customers, suppliers, employees and government, and in
assessing the effectiveness of the organisation, the challenge appears to revolve around the
measurement techniques in that;
• What criteria are to be used in the assessment?
• What factors in the organisation’ settings are likely to influence this effectiveness?
©© UUnniivveerrssiittyy ooff PPrreettoorriiaa

31 | P a g e
Key propositions on organisational effectiveness illustrate the popularity of the goal model,
which is interpreted in terms of the accomplishment of goals such as;
• High productivity
• Morale
• Conformity
• Adaptiveness
• Institutionalisation
This model of measuring effectiveness raises the possibility that an organisation cannot be
effective if it means attainment of all or even most of its goals, and this requires that a
distinction be made between “official” and “operative” goals. Operative goals indicate what
the organisation really strives to achieve as opposed to its officially stated aims and tend to
be unique to a specific organisation, and make the comparison of the effectiveness of
complex organisations impossible (Reimann, 1975).
To understand the concept of organisational effectiveness, reference must be made to
notion of organisational competency as it forms the basis under which reliable measurement
can be attained. It is said that when an organisation satisfies its various participants by
providing incentives which are seen to exceed their contributions, it establishes the base for
effective accomplishment of its goals, and this might be called organisational competency.
The use of predictive measurement to determine effectiveness is also essential even though
these measurements may derive its own controversy as different factors are likely to predict
effectiveness in achieving goals such as high employee morale or low turnover from those
predicting the accomplishment of goals such ass productivity or sales growth. Different
studies have yielded numerous predictors such as profit growth, sales growth, attraction and
retention of high quality manpower, product quality, customer service, employee job
satisfaction and morale, protection for growth and competitive strength.
To create organizational effectiveness, business leaders need to focus on aligning and
engaging their people, the people management systems, and the structure and capabilities
(including organizational culture) to the strategy. Engagement is critical as it results in higher
financial performance, higher customer satisfaction, and higher employee retention, and an
organization that can sustain such alignment will achieve increased business results (Right
Management, 2011).
©© UUnniivveerrssiittyy ooff PPrreettoorriiaa

32 | P a g e
Although different studies have yielded different individual predictors, some agreement
seems to have emerged that certain factors which define the organization's setting or
environment, and its internal structure, should be considered as potential contributors to
organizational effectiveness. Aspect such as the management philosophy variable can be
strongly associated with a number of organizational variables, for instance the more positive
or "progressive" the management philosophies, the more decentralized and the more
effective in both financial and behavioural terms the firms appeared to be, and have further
found that a progressive management attitude toward its important publics or "task
environmental agents" is more likely to result in high organizational effectiveness than is a
non-progressive attitude (or a low score on management philosophy) (Reimann, 1975).
©© UUnniivveerrssiittyy ooff PPrreettoorriiaa

33 | P a g e
3 CHAPTER THREE: HYPOTHESIS
3.1 INTRODUCTION
Prasad, Rao & Rehani (2001) referenced (Creswell, 1994; Kerlinger, 1956) to outline what
constitutes a hypothesis, and established that it is a formal statement that presents the
expected relationship between an independent and dependent variable (Creswell, 1994), a
conjectural statement of the relation between two or more variables (Kerlinger, 1956), while
a research question is essentially a hypothesis asked in the form of a question (Prasad, Rao,
& Rehani, 2001). In this study two research questions have been raised, and are outlined as
follows:
i. Whether board compositions are essential for SOCs?
ii. What characteristics of a SOC board structure may influence the effectiveness of
these organisations and ultimately, their performance?
3.2 HYPOTHESES
3.2.1 First Hypothesis
Hypotheses were applied to explain how the direct correlation between two variables might
suggest a positive or negative effect on an outcome. The literature on corporate governance
outlined that there are challenges experienced by some of the SOCs, one of which, is the
lack of appropriate implementation of adequate governance guidelines, and the literature
has established that proper implementation of corporate governance principles positively
impacts on SOE management efficiencies through increased transparency and quality of
boards (Jurkonis & Petrusauskaite, 2014), while Adam (2013) established that poor
performance and corporate failure, being in the private or public sector and is largely due to
inadequate governance challenges as opposed to ownership structure (Adam, 2013). Based
on this, a statistical hypothesis was constructed to assess whether the lack of governance
structures leads to SOEs poor performance.
H1. The relationship between company performance and corporate board structures
is positive
©© UUnniivveerrssiittyy ooff PPrreettoorriiaa

34 | P a g e
Good corporate governance practices have been determined and assessed based on the
compliance and implementation of the following recommended principles;
• Chairman and CEO of the company being two different people
• Chairperson independence (non-executive directorship)
• Independent non-executives in majority
• Diversity (presence of various racial groups in the board structure)
• Diversity (presence of women in the board structures)
• Establishment of the Remuneration committee
• Establishment of the Audit Committee (McGregor, 2014).
3.2.2 Second Hypothesis
The literature also revealed that most of the SOCs lack stable boards and management due
to conflict between the PFMA and the Companies Act makes it difficult for boards to function
effectively. In accordance with the PFMA, government as a shareholder can appoint and
dismiss a SOC’s CEO, while the Companies Act empowers the board with such a
responsibility. This leads to agency problem, in that political appointees and interference in
the management of the boards may at times create agendas that conflicts with the interest of
the company. Consequently, a hypothesis was set out below to determine whether agency
appointments of board members to SOE board structures negatively influences the overall
board performance and sustainability of the SOEs
H2: Political appointees negatively impact the performance of SOCs
This hypothesis has been assessed based on the below outlined attributes;
• Existence of politically affiliated members in relation to company performance
• Assessment of board member background, experience to company
performance
• Quality of audit outcomes/ROA, EBIDTA impact
©© UUnniivveerrssiittyy ooff PPrreettoorriiaa

35 | P a g e
3.2.3 Third Hypothesis
The body of knowledge on board diversity outlines that the link between firm performance
and board diversity is weak and questionable (Ferreira, 2014) (Carter, D'Souza, Simkins, &
Simpson, 2010) (Murphy & McIntyre, 2007), while other finding were a complete contrast
and demonstrated a positive correlation between diversity and company performance
(Daunfeldt & Rudholm, 2013). It is this two contrast views that have prompted the
formulation of a third hypothesis which was geared to assess whether diversity at board level
leads to effectiveness and efficiency of SOEs
H3: The establishment of a diverse board structure and company performance are
positively related
This will be assessed based on the following criteria over the period under review:
• Racial profiles (proportional representation of racial groups in a board)
• Age diversity (age profiles within the board structures)
• Gender (proportional representation between males and females)
• Educational background
• Professional experiences
• ROA and EBITDA impact
©© UUnniivveerrssiittyy ooff PPrreettoorriiaa

36 | P a g e
4 CHAPTER 4: RESEARCH METHODOLOGY
4.1 INTRODUCTION
Various studies on board composition and firm performance have used different approaches
to reach their outcomes. Some have applied a qualitative approach (Thomas, 2004), while
others have applied a quantitative method (Dagsson & Larsson, 2011) (McIntyre, Murphy, &
Mitchell, 2007) . This research followed a quantitative approach to build up on already
established methodologies to determine the characteristics of a board structure which
influences the effectiveness of the SOCs and ultimately, their performance.
4.2 Research Design
According to Creswell (2003) there are three approaches to a research, quantitative,
qualitative and mixed methods. Quantitative refers to an approach which uses a scientific
method to develop knowledge, reduction of variables, questions and hypotheses and
employs strategies of enquiry such as experiments and surveys to collect data
predetermined instrument that yield statistical data (Creswell, 2003).
Quantitative studies are based on the notion of a postpositivist (positivism) knowledge claim,
which implies that the researcher tests a theory by specifying narrow hypotheses and the
collection of data to support or refute the hypotheses, and the data is collected through
various methods and analysed using statistical procedures and hypothesis testing (Creswell,
2003). As already outlined, this research is geared towards an understanding of the
relationship between board composition and board characteristics, independent variables to
overall performance of the organisation, a dependent variable. A regression analysis has
been performed to measure the cause and effect (a causal relationship) between two or
more variables, an independent variable, represented by the demographic characteristics
and the dependent variables, measured through various performance outcomes (EBITDA,
ROA and audit outcome (Wegner, 2015).
©© UUnniivveerrssiittyy ooff PPrreettoorriiaa

37 | P a g e
The regression analysis was represented by a statistical equation that fits a straight line and
defined as follows: y = a + b(x), where;
Y; represents a dependent variable, EBITDA, ROA and Audit outcome
X; outlines the drivers for outcome reached, and this comes in the form of board
characteristics or any other input factor towards the generation of outcomes
4.3 Unit of analysis
The unit of analysis represents the major object that is being analyzed in a study. In a social
science research, typical units of analysis include individuals (most common), groups, social
organizations and social artifacts (Wegner, 2015). This research is concerned with the
characteristics of a board structures of the SOCs in South Africa, and these attributes have
been drilled down to the following as per the table below:
Demographic Description
Age Defines the length of time that a person has lived and it is relevant criteria in
that it has been found to influence organisational performance (Dagsson &
Larsson, 2011).
Gender Describes the state of being male or female in a cultural and social climate.
This attribute has been found to have an inclusive impact on firm performance
(Rhode & Packel, 2014)
Race A group of people sharing the same culture, history, language or with
common features (ethnic group). It has been established that
homogenous top management cannot be ignored as it often contributes
to positive firm performance (Marimuthu, 2008)
Directorship
experience(Years)
Indicates the knowledge or skill acquired by a period of practical experience of
something, especially that gained in a position of directorship.
Professional
qualification
Evidence of a higher educational background attained through academic study
leading to a qualification.
Experience in
business areas
Indicates the knowledge or skill acquired by a period of practical experience of
something, especially that gained through business in general.
©© UUnniivveerrssiittyy ooff PPrreettoorriiaa

38 | P a g e
Quantitative information, which represents the dependent variable covered financial data in
the form of profit level, assets base and a return on assets (ROA). Corporate governance
attributes were represented in the form of board quality attributes in the form of an existence
of a Remuneration Committee, Audit and Risk Committee, Board member independence,
compliance in the form of overall audit opinion and legislative adherence. The below table
categorises these attributes:
Financial Outcome Quality of board Organisational effectiveness
Profitability level or EBITDA Board independence Quality of audits outcome
Return on Assets: Profit/Total Assets Board skills set Compliance to PFMA
Diversity levels Compliance to Companies Act and
Corporate governance principles
Existence of Remco
& Risk Committee
Clarity of goals and measurement
(Jurkonis & Petrusauskaite, 2014)
4.4 POPULATION AND SAMPLE
4.4.1 Population
A population is an entire underlying set of observations from which samples are drawn, and
reflects all observations that could ever be taken for range of inference, or the broader group
of people to whom one intend to generalize the results of the study (Wegner, 2015). The
examination of SOC management efficiency has been limited to secondary data analysis
based on the annual financial reports. Aspects on better corporate governance and board
characteristics were based on published qualitative information found in these reports,
restricted by the quality of the information provided.
The data gathered covered a period that ranges from the year 2009 to 2016, in view of the
government’s Medium Term Strategic Framework (MTSF) 2009 – 2014 which identified the
need to review SOCs as a strategic tool to drive its objectives and leverage the financial
power and support that the states provides to the SOCs (PRC, 2013). Furthermore, the
identified period coincided with the tenure over which there has been changes in the political
©© UUnniivveerrssiittyy ooff PPrreettoorriiaa

39 | P a g e
landscapes in South Africa characterised by a new presidential leadership structure headed
by President Jacob Zuma from that of his predecessors, President Kgalema Motlanthe and
President Thabo Mbeki. The transition had triggered changes in economic policies and the
direction that SOCs embarked upon.
South Africa has an excess of 700 SOCs and therefore, the coverage of all these entities in
this study would have posed a challenge from a timing perspective and impossible to
complete, and a result, a list of major SOCs was obtained from the National Government
Entities website (National Government Entities, 2017). The list reflected a total of 169 SOCs
and based on this, a @Microsoft Excel data matrix was developed to record and analyse the
data for a period that ranged from the year 2009 to 2016.
4.4.2 Sample size and selection
The study covered SOCs across a wide range of industries, and for analytical purposes
these organisations were initially segmented into various department based on allocations
published in the National Government Entities website (National Government Entities, 2017),
and subsequently clustered together for ease of data analysis and interpretation.
The use of probability sampling process is highly recommended as it eliminates elements of
biasness, however, in this instance, the data sample determination process was a non-
probability sampling, judgemental and involved various stages to arrive at the final sample
size. The initial population of size was 169 based on the list referred to above, and this was
reduced to final sample size of 57 SOCs which were subjected to statistical testing and
analysis. The process followed included;
©© UUnniivveerrssiittyy ooff PPrreettoorriiaa

40 | P a g e
Stages Outline
Phase 1 The determination of whether all 169 SOCs could be covered given the time
constraint under which the data collection was to be undertaken. Post the
review and consideration of the magnitude of the data for a time series of ten
years, a decision was taken to reduce the population size to an acceptable
level
Phase 2 The sample size target was then set at 50% (85 SOCs) of the original
available list of entities (169)
Phase 3 The selection of the entities was a judgmental process, with biasness
towards an inclusion of key SOCs such as SAA, SABC, Eskom, Transnet &
PIC to mention but a few, and the rationale was to ensure that the sample
does not exclude SOCs that are at the forefront of driving economic growth.
Entities for which there were missing Annual Financial Statements/Reports
(AFS) for at least one financial period were then removed from the total size
of 85, leaving the sample size at 57 entities. The rationale behind this was to
ensure that there is a full representation of data for the time series covered to
ensure completeness and validity.
Phase 4 The AFS were sourced from each entity’s website, accessed through the
National Government Entities website or using google search engine. The
data extraction processed was monotonous and extended over a period of
two months, with the extraction process being systematic based on the
alphabetic order listing of SOCs.
The below table lists the final sample size that has been statistically tested.
©© UUnniivveerrssiittyy ooff PPrreettoorriiaa
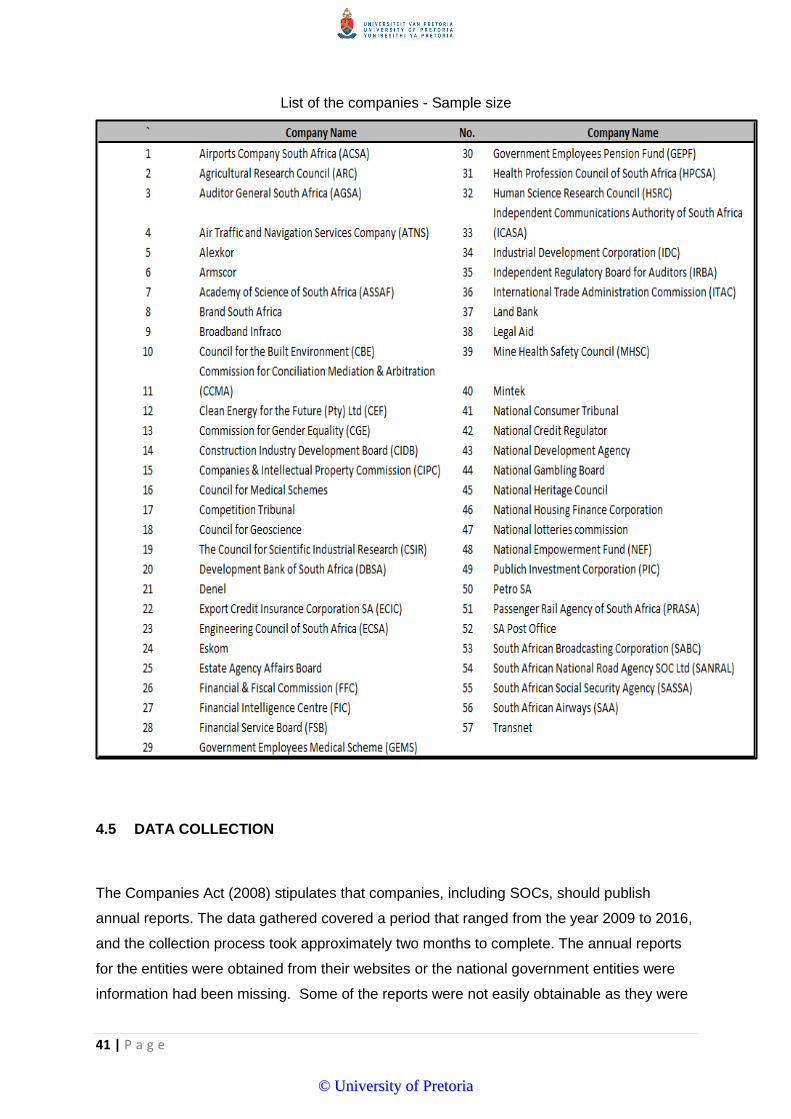
41 | P a g e
List of the companies - Sample size
4.5 DATA COLLECTION
The Companies Act (2008) stipulates that companies, including SOCs, should publish
annual reports. The data gathered covered a period that ranged from the year 2009 to 2016,
and the collection process took approximately two months to complete. The annual reports
for the entities were obtained from their websites or the national government entities were
information had been missing. Some of the reports were not easily obtainable as they were
©© UUnniivveerrssiittyy ooff PPrreettoorriiaa

42 | P a g e
either deleted from the companies’ systems or links were not functional, and thus at times
reliance had to be placed on comparatives from prior or preceding financial periods.
The necessary information was extracted from these reports, and as previously indicated,
some of the companies had missing records for certain periods, and an additional time was
allocated to source these records. At no time was direct contact made with any of these
organisations for further assistance as the data already gathered was deemed sufficient to
perform the statistical analysis. The time series depicting the data collection was sufficient to
ensure that any variation or changes at a point in time are addressed over a lengthier period.
The data collection process took the form of content analysis, where secondary source data
was obtained from the published annual financial reports of the SOCs. The data analysis
was segmented into two components, qualitative and quantitative. The primary focus of the
qualitative was on non-financial data which was categorical in nature and represented the
independent variable in the form of demographic information, and was examined to
determine the extent over which it has an influence on performance and organisational
effectiveness. Some of the key demographic data covered included the following (Donaldson
& Davis, 1991):
• Name of each director
• Position of each director
• Gender, age and racial denomination of each director
• Confirmation of educational qualification
• Board experience
• Director’s independence (Non-executive vs. Executive)
• Confirmation of political connection
Most of the qualitative information was obtained from the corporate governance section of
the annual reports and the disclosure for Directors’ emoluments section. The latter was
essential for the validation of the board size and members, as it provided a convenient
means to ensure that data was not duplicated or omitted. A director who was no longer on
the board structure would not have been remunerated during that financial year and was left
out of the matrix, the same applied to a director who was new to the organisation as they
would not have been compensated during the prior year, therefore, a check was done to
ensure that the director has been added to the matrix. For politically connected directors,
©© UUnniivveerrssiittyy ooff PPrreettoorriiaa
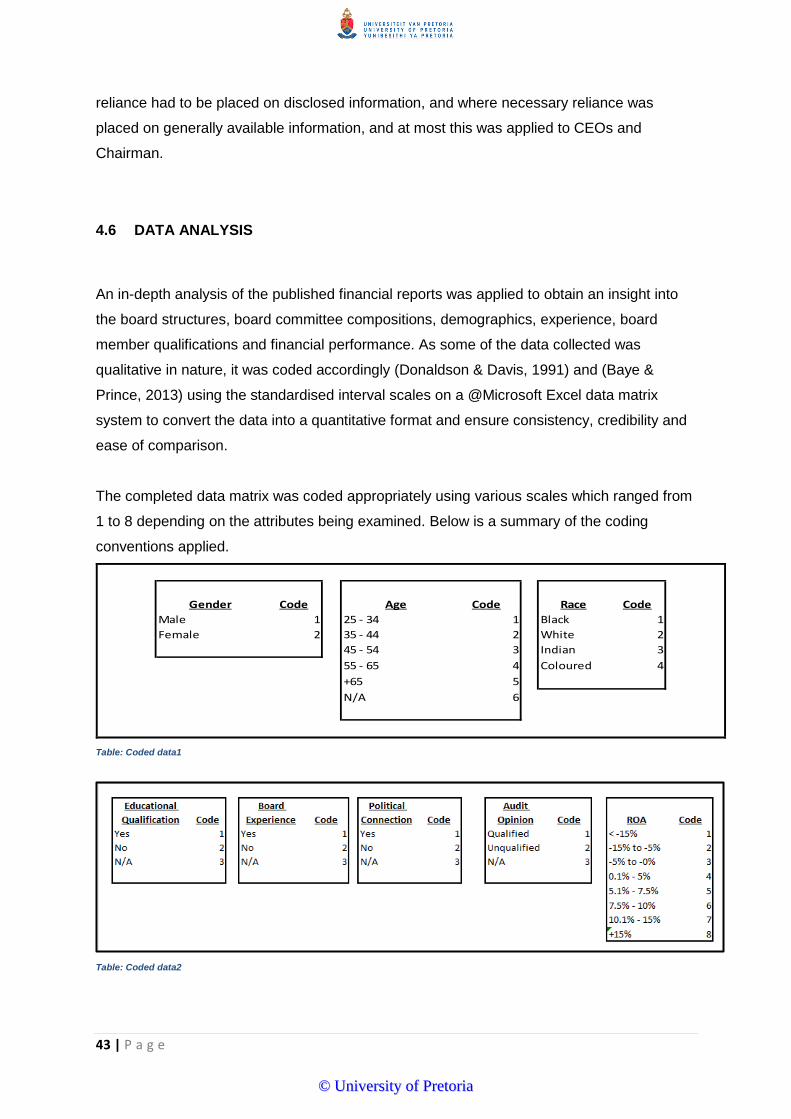
43 | P a g e
reliance had to be placed on disclosed information, and where necessary reliance was
placed on generally available information, and at most this was applied to CEOs and
Chairman.
4.6 DATA ANALYSIS
An in-depth analysis of the published financial reports was applied to obtain an insight into
the board structures, board committee compositions, demographics, experience, board
member qualifications and financial performance. As some of the data collected was
qualitative in nature, it was coded accordingly (Donaldson & Davis, 1991) and (Baye &
Prince, 2013) using the standardised interval scales on a @Microsoft Excel data matrix
system to convert the data into a quantitative format and ensure consistency, credibility and
ease of comparison.
The completed data matrix was coded appropriately using various scales which ranged from
1 to 8 depending on the attributes being examined. Below is a summary of the coding
conventions applied.
Gender Code Age Code Race Code
Male 1 25 - 34 1 Black 1
Female 2 35 - 44 2 White 2
45 - 54 3 Indian 3
55 - 65 4 Coloured 4
+65 5
N/A 6
Table: Coded data1
Table: Coded data2
©© UUnniivveerrssiittyy ooff PPrreettoorriiaa

44 | P a g e
Table: Coded data3
4.6.1 Data interpretation
The data used is quantitative in nature, therefore, the interpretation of the data required the
use of statistical models. A linear regression analysis has been performed to measure the
relationship between two or more variables, an independent variable, represented by the
demographic characteristics and the dependent variables, measured through various
performance outcomes (Wegner, 2015). To determine the existence of a relationship
between the input variables and output, a multiple regression was simulated using the
STATA statistical tool at 95% confidence interval, applying a time series which uses auto
regression.
STATA software is a program that uses Monte Carlo simulation to convert the raw output of
statistical procedures into results that are of direct interest to researchers, without changing
statistical assumptions or requiring new statistical models. The program, designed for use
with the Stata statistics package, offers a convenient way to implement the techniques
(Michael, Wittenberg, & King, 2003).
4.6.2 Validity and reliability of the results
The regression analysis was represented by a statistical equation that fits a straight line and
defined as follows: y = a + b(x). The equation was also applied in respect of each defined
hypothesis as follows:
©© UUnniivveerrssiittyy ooff PPrreettoorriiaa
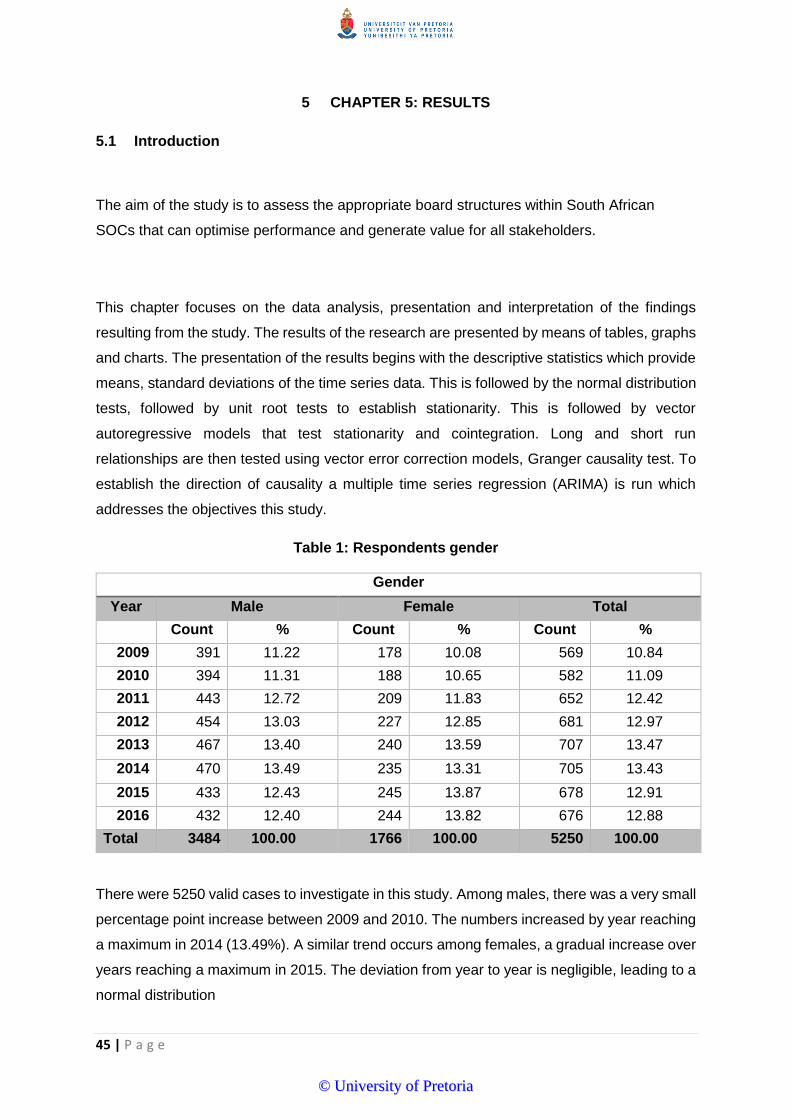
45 | P a g e
5 CHAPTER 5: RESULTS
5.1 Introduction
The aim of the study is to assess the appropriate board structures within South African
SOCs that can optimise performance and generate value for all stakeholders.
This chapter focuses on the data analysis, presentation and interpretation of the findings
resulting from the study. The results of the research are presented by means of tables, graphs
and charts. The presentation of the results begins with the descriptive statistics which provide
means, standard deviations of the time series data. This is followed by the normal distribution
tests, followed by unit root tests to establish stationarity. This is followed by vector
autoregressive models that test stationarity and cointegration. Long and short run
relationships are then tested using vector error correction models, Granger causality test. To
establish the direction of causality a multiple time series regression (ARIMA) is run which
addresses the objectives this study.
Table 1: Respondents gender
Gender
Year Male Female Total
Count % Count % Count %
2009 391 11.22 178 10.08 569 10.84
2010 394 11.31 188 10.65 582 11.09
2011 443 12.72 209 11.83 652 12.42
2012 454 13.03 227 12.85 681 12.97
2013 467 13.40 240 13.59 707 13.47
2014 470 13.49 235 13.31 705 13.43
2015 433 12.43 245 13.87 678 12.91
2016 432 12.40 244 13.82 676 12.88
Total 3484 100.00 1766 100.00 5250 100.00
There were 5250 valid cases to investigate in this study. Among males, there was a very small
percentage point increase between 2009 and 2010. The numbers increased by year reaching
a maximum in 2014 (13.49%). A similar trend occurs among females, a gradual increase over
years reaching a maximum in 2015. The deviation from year to year is negligible, leading to a
normal distribution
©© UUnniivveerrssiittyy ooff PPrreettoorriiaa
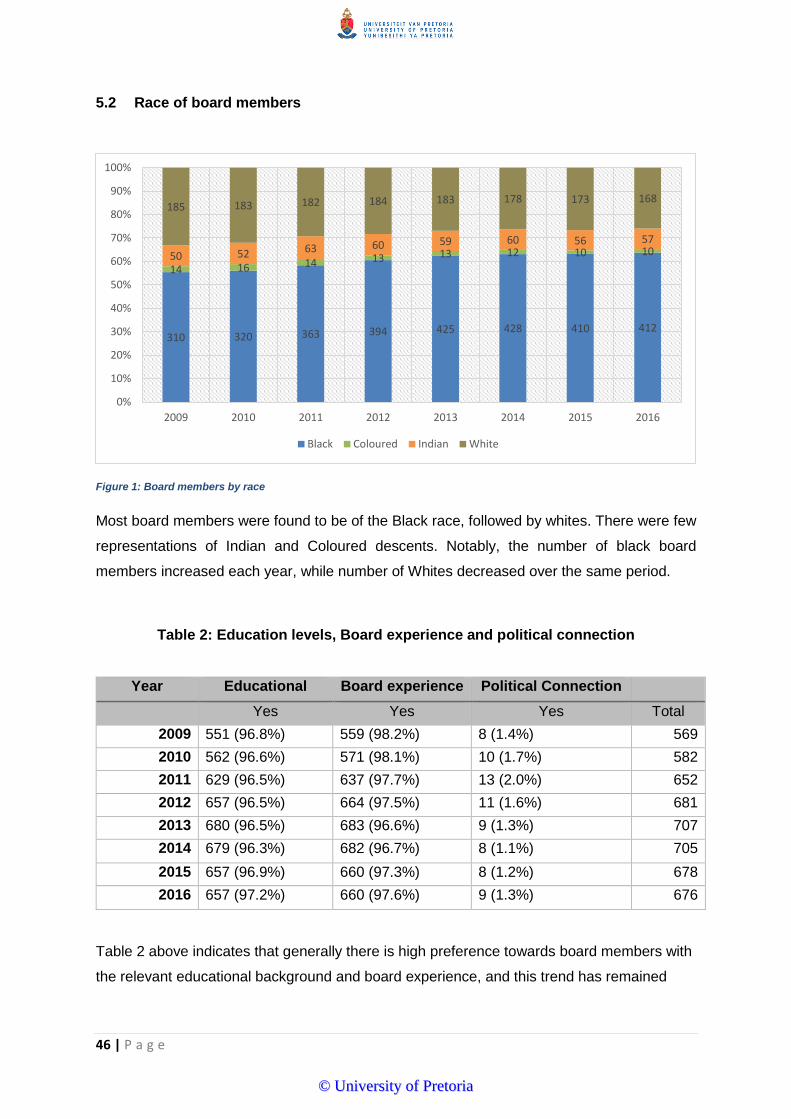
46 | P a g e
5.2 Race of board members
Figure 1: Board members by race
Most board members were found to be of the Black race, followed by whites. There were few
representations of Indian and Coloured descents. Notably, the number of black board
members increased each year, while number of Whites decreased over the same period.
Table 2: Education levels, Board experience and political connection
Year Educational Board experience Political Connection
Yes Yes Yes Total
2009 551 (96.8%) 559 (98.2%) 8 (1.4%) 569
2010 562 (96.6%) 571 (98.1%) 10 (1.7%) 582
2011 629 (96.5%) 637 (97.7%) 13 (2.0%) 652
2012 657 (96.5%) 664 (97.5%) 11 (1.6%) 681
2013 680 (96.5%) 683 (96.6%) 9 (1.3%) 707
2014 679 (96.3%) 682 (96.7%) 8 (1.1%) 705
2015 657 (96.9%) 660 (97.3%) 8 (1.2%) 678
2016 657 (97.2%) 660 (97.6%) 9 (1.3%) 676
Table 2 above indicates that generally there is high preference towards board members with
the relevant educational background and board experience, and this trend has remained
310 320 363 394 425 428 410 412
14 16 14 13 13 12 10 1050 52 63 60 59 60 56 57
185 183 182 184 183 178 173 168
0%
10%
20%
30%
40%
50%
60%
70%
80%
90%
100%
2009 2010 2011 2012 2013 2014 2015 2016
Black Coloured Indian White
©© UUnniivveerrssiittyy ooff PPrreettoorriiaa

47 | P a g e
consistent through the time series. Political connectedness appears quite insignificant and
reached its maximum level in 2011.
5.3 Position
Figure 2: Board members by position
Figure 2 indicates that the sample consisted of more non-Chief Executive Officers (CEOs),
followed by Board Chairpersons and lastly Chief Executives. Generally, the number of non-
CEOs seemed to increase over time (2009-2016). Their number slightly decreased between
2009 and 2010, increasing exponentially from 2011, through 2012, 2013 and 2014 before
declining in 2015 and 2016. The number of Board Chairpersons was almost constant over the
years with very slight increases from 2010 through 2011/14 before declining in 2015 and 2016.
The number of CEOs, who were least also had a constant slight increase over the years with
no decline at any point.
Figure 3: CEO by gender
154 158 161 163 165 164138 133
48 5366 64 64 65 69 69
189 183
216 227 238 241226 228
0
50
100
150
200
250
300
2009 2010 2011 2012 2013 2014 2015 2016
Position
Board chair CEO Non CEO
Log. (Board chair) Log. (CEO) Log. (Non CEO)
0
10
20
30
40
50
60
70
80
2009 2010 2011 2012 2013 2014 2015 2016
CEO, by Gender
Male Female Poly. (Male) Poly. (Female)
©© UUnniivveerrssiittyy ooff PPrreettoorriiaa

48 | P a g e
Figure 3 above shows that generally there was a huge difference in terms of absolute numbers
between male and female CEOs. Secondly, there was a general increasing trend over the
years for both males and females. For males, the numbers increased with a steep upward
slope between 2009 through 2010 to 2011, before declining in 2013 and 2014 periods. The
numbers increased slightly between 2014, 2015 and 2016. For females, the numbers
increased between 2009 and 2010, before decreasing in 2011. The numbers increased again
in 2012 and 2013 before declining in 2014 and increasing again in 2015 and 2015.
Figure 4: Non CEO by gender
Figure 4 above shows the distribution of non- CEOs over the years (2009-2016). There was a
general slight net increase in both males and females over the years. Their numbers increased
drastically between 2009-2011, continuing the trend up to 2014 before declining in 2015 and
2016. In respect of females, the numbers also increased steadily throughout the period 2009-
2016.
189 183
216227
238 241226 228
98 100116 123
138 135143 141
0
50
100
150
200
250
300
2009 2010 2011 2012 2013 2014 2015 2016
Non CEO by Gender
Male Female Poly. (Male) Poly. (Female)
©© UUnniivveerrssiittyy ooff PPrreettoorriiaa

49 | P a g e
Figure 5: Board Chair by gender
The number of Board Chairpersons saw an increasing trend among males up to 2013 before
drastically decreasing between 2015 and 2016. Females numbers increased up to 2012,
before slightly declining in in 2013 up to 2016.
5.4 Trends Analysis
Figure 6: EBITDA & Assets trend
154 158 161 163 165 164
138133
6166
7382
75 7566 65
0
20
40
60
80
100
120
140
160
180
2009 2010 2011 2012 2013 2014 2015 2016
Board Chair by Gender
Male Female Poly. (Male) Poly. (Female)
-500000000
0
500000000
1000000000
1500000000
2000000000
-
2 000 000 000
4 000 000 000
6 000 000 000
8 000 000 000
10 000 000 000
12 000 000 000
14 000 000 000
16 000 000 000
2016 2015 2014 2013 2012 2011 2010 2009
EBIT
DA
Ass
ets
EBITDA and Assets, (millions)
Assets EBITDA/Profit
©© UUnniivveerrssiittyy ooff PPrreettoorriiaa

50 | P a g e
Profitability/EBITDA had a trend that was not constant over the years, it was characterised by
short cycles of highs and lows. Between 2009 and 2010, there was a very steep increase in
the EBITDA, followed by a record low in 2011. This was followed by a steady increase from
2012 through 2013 to 2014. A steep decline occurred between 2014 and 2015, followed by a
slight increase towards 2016. Assets value increased throughout the study period with three
periods of lows (2011; 2013, 2015) and four periods of highs (2010, 2012, 2015 and 2016.
The steepest increase (gradient) was between 2013/14. Graphically there seems to be no
similar pattern between the stochastic trends of ABITDA and assets value.
Figure 7: EBITDA & ROA trend
Return on Assets and EBITDA seem to follow a somewhat similar pattern over the years. As
ROA drastically increases between 2009 and 2010, so does EBITDA. ROA drastically
decreases between 2010 and 2011, so does EBITDA between 2010 and 2012. ROA
drastically increases from 2012 towards mid-2013, while EBITDA increases at a decreasing
rate towards 2014 before dropping to a record low in 2015. Notably, ROA had a drop in 2015
while EBITDA had a high peak.
(10.00)
(8.00)
(6.00)
(4.00)
(2.00)
-
2.00
4.00
6.00
-500000000.00
0.00
500000000.00
1000000000.00
1500000000.00
2000000000.00
2016 2015 2014 2013 2012 2011 2010 2009
EBITDA and ROA
©© UUnniivveerrssiittyy ooff PPrreettoorriiaa

51 | P a g e
Figure 8: Governance compliance figure
Audit opinion has a stochastic trend, it increases between 2009 and 2010, followed by an
accelerated decrease between 2010 through 2011 to 2012. The trend continues with an
increase towards mid-2013, followed by a steady decline through 2015, and a record low in
2016. Remuneration committee and Risk committee seem not to have trends, the data series
seem to be stationary (a mean and standard deviation that does not vary over time. Such non-
trends could affect the inferential models.
5.5 Autocorrelation
When examining the relationship between two continuous variables always look at the
scatterplot, to see visually the pattern of the relationship between them and look for outliers
(observations lying away from the main body of points). Scatterplots should be produced for
each independent with the dependent variables to so see if the relationship is linear (scatter
forms a rough line) (Sasieni & Royston, 1996)
0.00
0.02
0.04
0.06
0.08
0.10
0.12
0.14
0.16
0.18
0.0
0.2
0.4
0.6
0.8
1.0
1.2
2016 2015 2014 2013 2012 2011 2010 2009
Governance compliance
Remuneration Committee Risk Committee Audit Committee Audit Opinion
©© UUnniivveerrssiittyy ooff PPrreettoorriiaa

52 | P a g e
Figure 9: Autocorrelation - Financial
Generally, there seem to be existence of very weak relationship-linear trend between EBITDA
and Assets, ROA as well as Assets and ROA. The data points are scattered with weak linear
patterns. There is an outlier in EBITDA that is extreme enough to be a data error, so does
assets and ROA. The scatter plot shows that there is a moderate relationship between ROA
and Assets, with a many outliers, a weak association between EBIT and Assets and ROA.
Figure 9: Autocorrelation – Board Committees and outcomes
EBITDA/Profit
Assets
ROA%
0.00
1000000000.00
2000000000.00
0.00 1000000000.002000000000.00
5.000e+09
1.000e+10
1.500e+10
5.000e+09 1.000e+10 1.500e+10
-10
-5
0
5
-10 -5 0 5
EBITDA/Profit
RemunerationCommittee
RiskCommittee
AuditCommittee
AuditOpinion
0.00
1000000000.00
2000000000.00
0.001000000000.002000000000.00
.8
.9
1
.8 .9 1
.96
.98
1
.96 .98 1
.96
.98
1
.96 .98 1
.05
.1
.15
.05 .1 .15
©© UUnniivveerrssiittyy ooff PPrreettoorriiaa

53 | P a g e
Figure 9 indicates that EBITDA has very weak associations with remuneration, Risk, Audit and
Audit opinion committees, as displayed by the scatter plots with dots that do not reflect a linear
line. This pattern is a sign of data that is full of outliers, not normally distributed and skewed.
Figure 10: Autocorrelation – Board member attributes
Figure 10 indicates that EBITDA has very weak associations with education qualifications,
Board experience, political connection, and position. The scatter plots with dots do not reflect
a linear line, a pattern that is a sign of data that is full of outliers, which could be a sign of
stationary data (with weak trends). It is to this effect that before running the models to establish
the relationship between EBITDA and the independent variables, we must run several tests to
ascertain the data is fit to run autoregressive lagged time series analysis.
5.6 Portmanteau test for white noise
Successive values over the years in the time series often correlate with each other
(autocorrelation). Correlation of a time series with its own past and future values is called
Autocorrelation. White noise refers to the fact that a variable does not have autocorrelation
EBITDA/Profit
EducationalQualification
BoardExperience
PoliticalConnection
Position
0.00
1000000000.00
2000000000.00
0.001000000000.002000000000.00
.998
.999
1
.998 .999 1
.998
.999
1
.998 .999 1
.01
.015
.02
.01 .015 .02
2.1
2.15
2.2
2.25
2.1 2.15 2.2 2.25
©© UUnniivveerrssiittyy ooff PPrreettoorriiaa

54 | P a g e
(Perron, 2006). Series correlation can drastically reduce the degrees of freedom in time series
modelling. To be able to test the hypothesis of independence between variables
(autocorrelation), a test of the white noise process given by the Ljun-Box-Pierce portmanteau
test statistics was used (Ljung, 1978) (Pierce, 1970). The null is that there is no serial
correlation.
Figure 11: White-Noise Test effects
0.0
00
.20
0.4
00
.60
0.8
01
.00
Cum
ula
tive p
erio
dog
ram
fo
r R
em
un
era
tion
Co
mm
itte
e
0.00 0.10 0.20 0.30 0.40 0.50Frequency
Bartlett's (B) statistic = 0.25 Prob > B = 1.0000
Cumulative Periodogram White-Noise Test
0.0
00
.20
0.4
00
.60
0.8
01
.00
Cum
ula
tive p
erio
dog
ram
fo
r E
BIT
DA
Pro
fit
0.00 0.10 0.20 0.30 0.40 0.50Frequency
Bartlett's (B) statistic = 0.35 Prob > B = 0.9997
Cumulative Periodogram White-Noise Test
0.0
00
.20
0.4
00
.60
0.8
01
.00
Cum
ula
tive p
erio
dog
ram
fo
r R
OA
0.00 0.10 0.20 0.30 0.40 0.50Frequency
Bartlett's (B) statistic = 0.55 Prob > B = 0.9258
Cumulative Periodogram White-Noise Test
0.0
00
.20
0.4
00
.60
0.8
01
.00
Cum
ula
tive p
erio
dog
ram
fo
r R
em
un
era
tion
Co
mm
itte
e
0.00 0.10 0.20 0.30 0.40 0.50Frequency
Bartlett's (B) statistic = 0.25 Prob > B = 1.0000
Cumulative Periodogram White-Noise Test
0.0
00
.20
0.4
00
.60
0.8
01
.00
Cum
ula
tive p
erio
dog
ram
fo
r A
ud
itC
om
mitte
e
0.00 0.10 0.20 0.30 0.40 0.50Frequency
Bartlett's (B) statistic = 0.48 Prob > B = 0.9746
Cumulative Periodogram White-Noise Test
0.0
00
.20
0.4
00
.60
0.8
01
.00
Cum
ula
tive p
erio
dog
ram
fo
r R
iskC
om
mitte
e
0.00 0.10 0.20 0.30 0.40 0.50Frequency
Bartlett's (B) statistic = 0.48 Prob > B = 0.9746
Cumulative Periodogram White-Noise Test
©© UUnniivveerrssiittyy ooff PPrreettoorriiaa

55 | P a g e
In the graphs above, most the values appear inside the confidence bands, indicating that
there are no strict white noise processes within the data series. The test statistic (p-value) is
higher than 0.05 for all the variables. In this case, there is no white noise in all the variables-
there are spurious outliers that may affect the analysis (regressions). Because of this white
noise non presence in all variables, further tests are done to check for stationarity
(existence of trends) of the data. Data has to be stationary for a good model (has to have a
trend).
5.7 Normal Distribution test
Tests for normality calculate the probability that the sample was drawn from a normal
population. When testing for normality, probabilities > 0.05 mean the data are normal while
probabilities < 0.05 mean the data are NOT normal. The data series that do not ‘look’ normal
could lead to misinterpretation of regression analysis. Below is a Shapiro Wilk test of normal
distribution.
Table 3: Shapiro Wilk Test for normal distribution
Variable Obs. W V z Prob.>z
EBITDA/Profit 8 0.67072 4.587 3.077 0.00105
Assets 8 0.79892 2.801 1.913 0.02788
ROA 8 0.81634 2.559 1.72 0.0427
Remunerati~e 8 0.93071 0.965 -0.056 0.52252
RiskCommit~e 8 0.81998 2.508 1.678 0.04664
AuditCommi~e 8 0.81998 2.508 1.678 0.04664
AuditOpinion 8 0.95806 0.584 -0.811 0.7914
Gender 8 0.90532 1.319 0.461 0.32227
Age 8 0.96479 0.491 -1.055 0.85425
Race 8 0.77422 3.145 2.168 0.01507
Educationa~n 8 0.56517 6.058 3.838 0.00006
BoardExper~e 8 0.98551 0.202 -2.168 0.98491
PoliticalC~n 8 0.91571 1.174 0.264 0.39602
Position 8 0.97181 0.393 -1.352 0.911
Data series are not normal due to outliers or unusual very high and low values displayed in
the graphs. Remuneration, Audit opinion, Gender, Age, Board experience, Political connection
and position seem to have near normal distribution of the data series. The results confirm
those from the scatter plots. The non-normality of distribution could lead to misinterpretation
of the general trend of the data, hence it is important to then interpret inferential models with
caution.
©© UUnniivveerrssiittyy ooff PPrreettoorriiaa

56 | P a g e
5.8 The Dickey-Fuller test
Having a unit root in a series mean that there is more than one trend in the series. Testing for
unit root implies testing for stationarity in the series. The Dickey-Fuller test is one of the most
commonly use tests for stationarity (Dickey & Fuller, 1979). Stationarity means that the
marginal distribution of the process (mean and variance) does not change with time. Time
series with persistence changing mean with time are non-stationary. For time series analysis,
it is imperative to work with stationary process (MacKinnon, 1994). In ADF tests, the null
hypothesis is that the series has a unit root. The decision to reject or not to reject the null
hypothesis of alpha = 0 is based on the Dickey-Fuller (DF) critical values of the (t) statistic
(MacKinnon, 1994). If the DF test fails to reject, conclude that Yt has a unit root, and where
there is a unit root then the forecasts can be poor. The following section tests for the presence
of unit roots in each of the series.
Table 4: Dickey-Fuller (DF) unit root test
Variable Test Statistic -Z(t)
1% Critical Value
5% Critical Value
10% Critical Value
MacKinnon approximate p-value
Unit Root
EBIT/Profitability Z(t) -3.146 -3.75 -3 -2.63 0.0233 Yes
Assets Z(t) -0.148 -3.75 -3 -2.63 0.9444 Yes
ROA Z(t) -5.194 -3.75 -3 -2.63 0 No
Remuneration Committee
Z(t) -4.124 -3.75 -3 -2.63 0.0009 Yes
Risk Committee Z(t) -2.032 -3.75 -3 -2.63 0.2726 Yes
Audit Committee Z(t) -2.032 -3.75 -3 -2.63 0.2726 Yes
AuditOpinion Z(t) -0.913 -3.75 -3 -2.63 0.7838 Yes
Educational Qualification
Z(t) -2.646 -3.75 -3 -2.63 0.0839 Yes
Board Experience Z(t) -1.92 -3.75 -3 -2.63 0.3226 Yes
Political Connection Z(t) -1.081 -3.75 -3 -2.63 0.7226 Yes
Position Z(t) -0.358 -3.75 -3 -2.63 0.9987 Yes
The critical values at the 10% level of significance are lower than the test statistic (Z(t)) for all
variables except for volume. The MacKinnon approximate p-values are greater than p=0.05
except for volume. In this case the null hypothesis is rejected for the presence/existence of a
unit roots during all periods is not rejected. This means that the variables have a data series
that are stationary, that do not show to vary much over time, hence lack of a trend (evidenced
by graphs that have sharp ups and downs. This is likely to influence the inferential models
since there seems to be co-movement of the minor trends over time (trend repeats itself).
Because of this, the next step is to test whether the integration of these two variables are of
the same order- cointegration among EBITDA (profitability) and the explanatory variables.
©© UUnniivveerrssiittyy ooff PPrreettoorriiaa

57 | P a g e
5.9 Johansen co-integration test
Johansen co-integration test procedure consists of estimating a vector autoregressive (VAR)
model which includes difference as well as the levels of the non-stationary variables
(Johansen, 1995). The output of VECM is the Johansen-Juselius (1988) cointegration test that
was used to determine whether there is a long run relationship between EBIT (profitability)
and the independent variables
Table 5: Johansen Co-integration Test
maximum Trace 5% Critical
rank Parms LL eigenvalue statistic value
0 21 -319.213 . 43.7521 29.68
1 26 -301.238 0.67483 7.8031* 15.41
2 29 -298.518 0.15636 2.362 3.76
3 30 -297.337 0.07115
Johansen-Juselius cointegration test utilizes the eigenvalue of a parameter to test whether the
series is cointegrated with another series. Since Johansen-Juselius test is based on the
Likelihood Ratio, it is also referred to as the Trace Statistic. At rank=1 the calculated test
statistic is lower than the critical value (15.4) extracted from at the 5% level of significance,
hence the null hypothesis of no cointegration is rejected. Thus, we accept the null hypothesis
that there is one cointegrating equation in the bivariate model. This means that the data series
are cointegrated with another series, implying there could be presence of long run
relationships between EBIT (profitability) and the independent variables over the years. If there
is cointegration among the variables in the model, it is possible that there is at least
unidirectional causality among the variables (Gujarati, 1999: 623). The next step is to check
whether there is a causal relationship between the various variables as stipulated in the
hypotheses.
©© UUnniivveerrssiittyy ooff PPrreettoorriiaa

58 | P a g e
5.10 Vector Error Correction Model (VECM)
Vector Error Correction Model (VECM) is applied to check if the modelling has empirically
meaningful relationships (Watson, 1994; Granger, 1981). The table below consists of multiple
equations. These equations often are interpreted as long-run or equilibrium relationships
between xt (EBITDA) and yt (independent variables). Short-run dynamics which may fluctuate
around this long-run relationship can also be established. Long-run causality is determined by
the error correction term, whereby if it is significant, then it indicates evidence of long run
causality from the explanatory variable to the dependent variable. Short-run causality is
determined as before, with a test on the joint significance of the lagged explanatory variables,
using an F-test or Wald test. The sizes of the parameters α1 and β1 determine the short-run
dynamics of the resulting volatility time series. If α1 is relatively high and β1 is relatively low,
then volatilities tend to be more ‘spiky’.
5.11 Vector Autoregression
Vector Autoregression (VAR) fits a multivariate time-series regression of each dependent
variable on lags of itself and on lags of all the other dependent variables.
Table 6: Vector Autoregression
Coef. Std. Err. z P>z [95% Conf. Interval]
EBITDAProfit
EBITDAProfit
L1. 7.20 7.09 0 7.20 7.20
Gender
L1. -1.24 .0436 0 -1.24 -1.24
Age
L1. -1.40 .0028 0 -1.40 -1.40
Race
L1. -7.91 .04323 0 -7.91 -7.91
Educational Qualification
L1. 8.57 0.005 . . .
Political Connection
L1. 7.09 .29509 0 7.09 7.09E
_cons -8.28 .09510 0 -8.28 -8.28E
R-squared=0.67 Sample: 2010 - 2016
©© UUnniivveerrssiittyy ooff PPrreettoorriiaa

59 | P a g e
Table 6 suggests that there was no long run causal relationship between EBITDA and
demographic factors (age, race, education) and political affiliation. Overall, the output
indicates that the model fits well (R-squared=0.67). The large lag coefficients, β1, for
education and political connection variables indicate that if there were relationships between
the variables, shocks to conditional variance could take a long time to die out, hence volatility
could be ‘persistent’ for this relationship.
Table 7: Position to EBITDA
Coef. Std. Err. z P>z [95% Conf. Interval]
EBITDAProfit
EBITDAProfit
L1. -0.1329807 0.026322 -5.05 0.043 -0.1845705 -0.0813909
Position
L1. 5.64E+09 6.39E+08 8.83 0.012 4.39E+09 6.90E+09
_cons 9.14E+09 8.19E+08 11.16 0.000 7.53E+09 1.07E+10
Table 7 suggests that there was no long run causal relationship between EBIT and position
(CEO or Non-CEO). Overall, the output indicates that the model fits adequately (R-
squared=0.56). The large lag coefficient, β1, indicate that if there were relationships between
profitability and position it was persistent.
Table 8: Political connection to EBITDA
Coef. Std. Err. z P>z [95% Conf. Interval]
EBITDA/Profit
EBITDA/Profit
L1. -0.159 0.193 -0.8 0.423 -0.5484779 0.2303362
Political Connection
L1. 1.03E 0.548 0.02 0.985 -1.05E+11 1.07E+11
_cons -1.27 2.809 -0.45 0.65 -6.77E+08 4.22E+08
Table 8 suggests that there was a long run causal relationship between EBIT and political
connection (p>0.05)). Overall, the output indicates that the model fits adequately (R-
squared=0.69). The small lag coefficient, β1, indicate that if there were relationships between
profitability and position it was not persistent, it was temporal.
©© UUnniivveerrssiittyy ooff PPrreettoorriiaa

60 | P a g e
Table 9: Board Experience to EBITDA
Coef. Std. Err. z P>z [95% Conf. Interval]
EBITDA Profit
EBITDA Profit
L1. -0.86700
0.178 -4.86 0 -1.216722 -0.5172789
Board Experience
L1. -7.43 1.31 -5.66 0 -1.00 -4.86
_cons 7.44 1.31 5.67 0 4.86 1.00
Table 9 suggests that there was a long run causal relationship between EBIT and board
experience. Overall, the output indicates that the model fits adequately (R-squared=0.89). The
large lag coefficient, β1, indicate that if there were relationships between profitability and
position it was persistent.
5.12 Regression analysis
A linear regression analysis has been performed to measure the relationship between two or
more variables, an independent variable, represented by the demographic characteristics and
the dependent variable (profitability and position), measured through various performance
outcomes (Wegner, 2015). This can be mathematically represented in the following equation.
Profitability/EBITDA = a + b1 (gender) + b2 (age) + b3 (race) + b4 (education) + b5 (board
experience) + b6 (position) + b7(political connection)
Table 10: Regression with Newey-West standard errors
(dependent variable)
Newey-West
EBITDAProfit Coef. Std. Err. t P>t [95% Conf. Interval]
Gender 1.32 3.86 3.42 0.181 -3.59 6.23
Age 1.88 3.49 0.54 0.685 -4.25 4.63
Race 1.51 1.33 1.13 0.461 -1.54 1.84
Educational Qualification
-9.81 1.63 -6.02
0.105 -3.05 1.09
Board Experience 1.68 0.54 3.07 0.002 3.45 1.06
Political Connection 1.08 0.37 2.95 0.003 -5.14 3.35
Position -5.30 0.36 -1.52
0.129 -6.34 2.56
_cons 1.23 2.29 5.38 0.117 -1.68 4.14
©© UUnniivveerrssiittyy ooff PPrreettoorriiaa

61 | P a g e
Significant results indicate that education qualifications ((β=-9.81), board experience (β=-
2.94), and political connection (β=-8.94) have statistically negative impacts on profitability.
This suggests that as qualifications, experience and political connections decreased, so did
profitability. Table xx indicates that not all results were statistically significant at 5% and 10%
levels. Although they are not significant, they are worthwhile since they provide a direction of
causality. Gender (β=1.32), age (β=1.88), and race (β=1.51) has as much as 1.3, 1.9, and 1.5
times effect on profitability respectively (p>0.05).
Table 11: Autoregressive integrated moving average (ARIMA) model
OPG
Position Coef. Std. Err. z P>z [95% Conf. Interval]
Remuneration Committee
0.40 0.11 3.56 0.007 0.1804 0.6219
Audit Opinion 0.21 0.12 1.73 0.083 -0.0278 0.4555
Gender -1.98 0.18 -11.1 0.009 -2.3272 -1.6285
Age 0.01 0.01 0.76 0.449 -0.0105 0.0238
Race 1.15 0.47 2.43 0.015 0.2219 2.0705
Political Connection -0.45 0.12 -12.5 .0.335 -0.3562 1.3459
_cons 0.62 0.84 0.73 0.467 -1.0406 2.2708
/sigma 0.00 0.00 1.14 0.126 0 0.004233
Note: Educational Qualification dropped because of collinearity Sample: 2009 - 2016 Wald chi2(5) = 1898.49 Log likelihood = 40.3, Prob > chi2 = 0.0000
Remuneration Committee (β=0.40), audit opinion (β=0.21), and race (β=1.15) all have as
much as 0.4, 0.21and 1.5 times effect on position respectively (p<0.05), results are statistically
significant at 5% level. Gender (β=-1.98) has a negative strong effect on position, being female
was associated with being non-CEO. Political connection could have negative impacts on
position; the less connected the less probability of becoming a CEO, although the results are
not statistically significant. Age has nothing to do with position, the effect is almost zero and
not statistically significant.
©© UUnniivveerrssiittyy ooff PPrreettoorriiaa
62 | P a g e
6 Chapter 6: DISCUSSION OF RESULTS
6.1 Introduction
This chapter discusses the outcomes of the research on based on the hypotheses
determined in chapter four. The discussion of the results follows the order in which the
hypotheses have been laid out.
i. relationship between between company performance and corporate board structures
of the SOC.
ii. Political appointees negatively impact the performance of SOCs
iii. The establishment of a diverse board structure and company performance are
positively related
The discussion of the findings has also been referenced to the literature review covered in
Chapter three of this research paper.
6.2 Analysis
6.2.1 Board structures and performance
The board structure of the SOC was assessed based on attributes that were set up in the
designed matrix, and this covered aspects such as board independence, establishment of
board committees, and attainment of positive audit outcomes. Independence is measured
through the presence of a high number of non-executive directors in relation to executives
within the boards of SOCs, and this has been observed through the following;
• The percentage of politically connected individuals is negligible as per Table 2, and
this suggests that the board structures are not infiltrated by a heavy presence of
politically appointed personalities. Furthermore, this may imply that there is a high
level of adherence to guidelines as set out in the PFMA, Companies Act and
corporate governance principles which advocates for the board to assume the
responsibility in the appointment of the majority of the board members, including that
of the Chairman, and CEO, thus reducing the role of the ministry/state to an
insignificant role.
©© UUnniivveerrssiittyy ooff PPrreettoorriiaa

63 | P a g e
• The current political landscapes in South Africa have also shifted and seen an active
participation from the official opposition parties such as the Democratic Alliance (DA)
and the Economic Freedom Fighters (EFF), as they have been actively involved in
ensuring that the management of SOCs are not infested with political appointees.
The most notable examples are;
o Legal actions by the Public Protector to remove the interim COO of the SABC
o Active participation by the opposing political parties to ensure that the former
CEO of Eskom (Brian Molefe) is denied a platform to be reinstated to his
position post his initial resignation when he attempted to pursue what would
be deemed a failed political career
o Direct involvement by the opposition parties to nominate suitable candidates
to serve on both the interim and official SABC board
o Participation in parliamentary processes to hold SOCs accountable
Furthermore, the outcomes from Figure 2 above suggest that the role of CEO and Chairman
are held by two different people, and that there is high prevalence of non-executive directors
as represented by a proportion of non-CEO roles. This also means that the level of
conformance to the recommendations of the OECD and corporate governance guidelines is
adhered to when it comes to ensuring that the roles of the CEO and chairperson of the board
are separated, and lastly, the Figure on (governance compliance) is consistent with the
literature on board structures and committees, in that there is a consistent prevalence of
established board committees in the form of Risk and Audit, coupled with the Remuneration
Committee, though these attributes have proven to have a weak relationship with the
positive audit outcomes (unqualified audit opinion). The descriptive stats outline a stochastic
trend on audit opinion, it increases between 2009 and 2010, followed by an accelerated
decrease from 2010 through to 2012, and this is consistent with the adverse finding by the
Auditor General 2013 that SOCs continue to receive adverse audit findings mainly due to a
high prevalence of expenditure which in not authorised, fruitless and unaccounted mainly
due to perceived inadequacies in their procurement policies and poor accounting practices
(Auditor General, 2013).
©© UUnniivveerrssiittyy ooff PPrreettoorriiaa

64 | P a g e
6.2.2 Political appointees negatively impact the performance of SOCs
Literature as discussed in Chapter three, found that there has been little evidence within the
SOCs in Italy to indicate that politically affiliated directors have an impact on the performance
of the SOCs. The results from the regression analysis tests as indicated in table xxx confirms
that political connection have statistically negative impacts on profitability. This suggests that
as political connections decreased, so did profitability.
The outcome further suggests that a politically connected personality does not have direct
influence on the entity’s performance, more when the entity has close ties to the
government. This is in contrast to Ferreira (2010) who purports that firms choose directors
for their characteristics, and that different board compositions provide diverse connections
with the outside environment such as competitors, suppliers, investors, politicians, the media
and other stakeholders, and as a result, the director’s characteristics could affect their
competency, incentive to monitor and advise managers, and create an avenue to be
pursued in maximizing shareholder value or protect the interests of executives (Ferreira,
2010). These results may suggest that perhaps politically connected individuals based within
the private sector are more likely to benefit and contribute to performance growth of their
entities as they can source business opportunities with the state and leverage on their
existing relationship.
6.3 The establishment of a diverse board structure and company performance are
positively related
6.3.1 Ethnic diversity
The matrix segmented board members in accordance with the demographic classification of
the country in accordance with the Broad Based Black Economic Empowerment (BBBEE) Act.
The classification refers to Blacks, Whites, Indian and Coloured denominations as a key
classification of individuals by race. In accordance with figure 1, the majority of board members
have been found to be Black, followed by whites, with a few Indians and Coloureds. Notably,
the number of blacks increased each year, while number of Whites decreased. The statistical
inference points to a positive correlation between race and performance. The notable increase
in black directors may be attributed to a strive to attain the BBBEE targets, while the reduction
©© UUnniivveerrssiittyy ooff PPrreettoorriiaa

65 | P a g e
in white board members may be attributed to the similarity-attraction theory which found that
diversity on the board structures decreases firm performance, as individuals prefer to affiliate
with other individuals whom they perceive as like them based on demographic characteristics.
This also stems from individuals having experienced similar historical events and
simultaneously reaching similar stages in private and family lives. It has also been found that
excessive diversity can negatively impact performance because of conflicts and
communication breakdowns (Murphy & McIntyre, 2007). The findings suggest that White
employees have moved away from state employment in pursuit of career interests within the
private sector as they provide clearer career path and have structured approaches in doing
business. The private sector has also been found to lack the willingness to transform and
accommodate other race groups, and this argument seem to be in support of the similarity-
attraction theory.
6.3.2 Gender Diversity
The theory on gender diversity have yielded somewhat opinions that differs, where in
Scandinavian countries, there has been evidence of a positive correlation between
performance of SOC and gender diversity (Daunfeldt & Rudholm, 2013). The gender metrics
are presented in Figure 3 to 5, outline a variety of outcomes as outlined below;
• Figure 3 reflects a CEO profile by gender, and overall there has been an upward trend
in 2014, when a dip was recorded, and this may be attributed to the inability to find
suitably qualified professional females, coupled with a biased approach towards the
appointment of male directors as emphasised by the similarity-attraction theory, where
males may adopt a biased approach towards female appoints.
• A similar trend is noted when it comes to the profiles of non-executive directors as
reflected in Figure 4, and Chairperson of the board.
In accordance with the Regression with Newey-West standard errors, there is a positive
correlation between gender and the level of profitability, as the p value was 0.181, and greater
than 0.05 and has proven to be significant, and confirms the finding as found in the literature
review. It should also be noted that 2010 provides an outlier in terms of the overall
EBITDA/profitability due a spike in economic activities driven by the hosting of the 2010 FIFA
©© UUnniivveerrssiittyy ooff PPrreettoorriiaa

66 | P a g e
Soccer World Cup, while the year 2011 was impacted by the financial crisis which destabilised
the financial sector and led to a general decline in economic activities.
6.3.3 Age Diversity
The theory on age diversity indicates that it has a positive effect on team performance in
situations where the task is complex (Wegge, Roth, Kanfer, & Neubach, 2008), a finding
confirmed by (McIntyre, Murphy, & Mitchell, 2007) in that age diversity was positively related
to firm performance. Based on the outcome of the Regression with Newey-West standard
errors, age has a positive relationship with the level of profitability, as depicted by a p value
of 0.685, which is greater than 0.05, proving the existence of a significant relationship.
From the above graph, the trend suggests that there is an inverse relationship between age
and profitability level of the organisation. The average age peaked at around 48.5 years in
2011, yet performance was at one of its lowest point. The same applied to the 2014 results,
where the decline in average age of 47.5 years yielded a higher profitability level. This
results suggests that the younger generation tend to bring with them new ideas and
innovative mindset to drive profitability, while the older generation tend to take longer to new
innovative means and technological advancements, which in turn, hampers the overall
performance of the SOCs. The results for the financial period of 2010 represents an outlier
for reasons related to the hosting of the FIFA world cup.
4747
.548
48.5
Age
0
5.00
0e+0
81.0
00e+
091.
500e
+092
.000
e+09
EBIT
DA/P
rofit
2008 2010 2012 2014 2016Year
EBITDA/Profit Age
©© UUnniivveerrssiittyy ooff PPrreettoorriiaa

67 | P a g e
6.3.4 Board experience and educational background
The principle on good governance outline that a board should be made up of individuals with
the right skill set and expertise to assist in driving performance for the business. The findings
from the statistical results points to significant results pertaining to education qualifications
and board experience as they have a p value greater than 0.05, which statistically means
that they have a negative impact on profitability.
Based on the above, 2010 represents a period marked with an outlier, and thereafter, the
pattern remains relatively similar in terms of profile, therefore, no inference can be deduced
between the variables and the level of profitability.
©© UUnniivveerrssiittyy ooff PPrreettoorriiaa

68 | P a g e
7 CHAPTER 7: SUMMARY, CONCLUSION AND RECOMMENDATIONS
7.1 Introduction
The research study assessed the corporate governance elements in SOCs across various
industries for a time series that span from the year 2009 to 2016. This chapter presents the
main research findings, limitations and plausible recommendations for future research.
7.2 Summary of main findings
The objective of this study was to determine the board characteristics within the SOC
structures that can optimize the level of organizational effectiveness, and in doing so two
research questions were raised, on;
i. Whether board compositions are essential for SOCs?
ii. What characteristics of a SOC board structure may influence the effectiveness of
these organisations and ultimately, their performance?
The attributes essential for determination of corporate governance adherence where
existence of the Audit and Remuneration Committee, the proportion of independent and
executive directors, availability of politically connected individuals in the board structures.
The determination of organizational effectiveness was based on the level of
EBITDA/Profitability, return on assets and audit opinion attained. The findings in respect of
various hypotheses points to the following outcomes;
H1: The relationship between company performance and corporate board structures
is positive
• The establishment of board committees in the form of Risk and Audit, coupled with
the Remuneration Committee proved to have a weak relationship with the positive
audit outcomes (unqualified audit opinion)
• The boards of SOCs are dominated by independent directors, and that the roles of
CEO and Chairman are held by different individuals.
These findings are consistent with previous studies as outlined in Chapter two of this
research study.
©© UUnniivveerrssiittyy ooff PPrreettoorriiaa

69 | P a g e
H2: Political appointees negatively impact the performance of SOCs
• The presence of politically connected individuals is negligible and have a weaker
impact on board structure’s independence and overall performance measured in
terms of ROA and EBITDA level
H3: The establishment of a diverse board structure and company performance are
positively related
• Ethnic diversity has been found to have a positive correlation to firm performance
• There is a positive correlation between gender and the level of profitability
• Age diversity has a positive relationship with the level of profitability
• Board experience and educational background has no impact on the level of
profitability
7.3 LIMITATIONS
The data collection process and analysis was quite extensive and several challenges were
experienced, and this provided limitations which had implications on the findings and
conclusions, and these are outlined as follows:
• Inability to cover all SOCs largely due to there being a significant variety of these
organisations and time constraint
• Poor quality of financial reports and lack of consistent standards of reporting from
SOCs. The disclosures of financial reports are not consistent across all these entities
due to an element of subjectivity in terms of what is considered essential for
disclosure purposes
• Certain board member profiles were not adequately disclosed, as essential
information such as age, racial background and gender were excluded and additional
checks were performed using prior year financials or google search engine
• Gaps in financial data which meant certain companies were excluded from the
population size
• Existence of biasness as the data selection process ensured that key SOCs such as
Eskom, PRASA, SAA and SABC are not excluded from the population
• Lack of transparency due to non-full disclosure of the required information in the
financial reports
©© UUnniivveerrssiittyy ooff PPrreettoorriiaa
70 | P a g e
7.4 RECOMMENDATIONS
This research has extended the study on aspect of board composition and company
performance for SOCs. The study results were not conclusive in respect of the inclusion of
education and professional background on the strength of the board. The study can be
extended to cover additional entities, although the process will be time consuming and
monotonous.
Furthermore, the influence of politically connected directors and their role on the quality of
the boards can be assessed and extended to private ownership business. Lastly, the
application of a qualitative study in addressing this subject may be explored.
©© UUnniivveerrssiittyy ooff PPrreettoorriiaa

71 | P a g e
References
Adam, M. (2013). Cooperative Governance of State Owned Entities in South Africa. In
Protecting the inheritance: Governance and Public Accountability in Democratic
South Africa (pp. 163 - 175).
Adams, R. B., & Ferreira, D. (2007). A theory of friendly boards. The Journal of Finance,Vol
62 (1), 217–250.
Adams, R. B., Hermalin, B. E., & Weisbach, M. S. (2010). The role of boards of directors in
corporate governance:A conceptual framework survey. Journal of Economic
Literature, Vol 48 (1), 58–107.
Aharoni, Y., & Vernon, R. (2014). State Owned Enterprises in the western economies
(Routledge Revivals).
Ahern, K. R., & Dittmar, A. (2012). The changing of the boards: The impact on firm valuation
of mandated female board representation. Quarterly Journal of Economics, Vol 127
(1), 137–197.
Ambe, I. M., & Badenhorst-Weiss, J. A. (2012). Procurement challenges in the South African
public sector. Journal of Transport and Supply Chain - UNISA, Vol 1(1) , 242 - 261.
ANC. (2012). Policy Discussion Paper on State Owned Entities and Development Finance
Institutions. [Online].
Available:http://www.anc.org.za/docs/discus/2012/economym.pdf [Accessed on 22
April 2017], pp. 4-7.
Auditor General. (2013). Auditor General’s Consolidated Report - Nombembe T. Pretoria:
Auditor General.
Baye, M. R., & Prince, J. T. (2013). Managerial Economics and Business Strategy.
Maidenhead, Berkshire: McGraw-Hill Education.
Berle, A. A., & Means, C. C. (1932). The Modern Corporation and Private Property. Journal
of Law and Economics, Vol 36, 237–268.
Bøhren, Ø., & Staubo, S. (2014). Does mandatory gender balance work? Changing
organizational form to avoid board upheaval. Journal of Corporate Finance, Vol 28
(1), 152–168.
Burmeister, S. (2013). Presidential Report on SOEs. Johannesburg: Amrop Laudelahni.
©© UUnniivveerrssiittyy ooff PPrreettoorriiaa

72 | P a g e
Cameron, S. K., & Whetten, D. A. (1983). Organizational Effectiveness: A comparison of
multiple models.
Campbell, K., & Vera, A. V. (2010). Female Board Appointments and Firm Valuation: Short
and Long-term Effects. Journal of Management & Governance, Vol. 14 (1), 37-59.
Carter, D. A., D'Souza, F., Simkins, B. J., & Simpson, W. G. (2010). The gender and ethnic
diversity of US boards and board committees and firm financial performance.
Corporate Governance: An International Review, Vol. 18 (5), 396 - 414.
Centre for Corporate Governance in Africa. (2012). Rating Corporate Governance of State
Owned Entities. Johannesburg: Centre for Corporate Governance in Africa.
Companies Act No,71. (2008). Companies Act of South Africa, Act No 71 of 2008. Republic
of South.
Cox, T. (2001). Creating the Multicultural Organization, A strategy for capturing the power of
diversity. US: Jossey-Bass.
Creswell, J. W. (2003). A framework for Design (Chapter One). In J. W. Creswell, Research
Design: Qualitative, Quantitative, and Mixed Methods Approaches: Second Edition
(pp. 18 - 21). Carlifonia: SAGE Publications.
Cronbrach, J. L. (1951). Coefficient alpha and the internal structure of tests. Psychometrika.
Dagsson, S., & Larsson, E. (2011). How age diversity on the Board of Directors affects Firm
Performance. Blekinge Institute of Technology School of Management, p21.
Daunfeldt, S.-O., & Rudholm, N. (2013). Does Gender Diversity in the Boardroom Improve
Firm Performance? HUI . Department of Economics, HUI Research, 1- 7.
Dickey, D. A., & Fuller, W. A. (1979). Distribution of the estimators for autoregressive time
series with a unit root. Journal of the American Statistical Association, Vol 74, 427–
431.
Dobbin , F., & Jung , J. (2011). Corporate Board Gender Diversity and Stock Performance:
The Competence Gap or Institutional Investor Bias? North Carolina Law Review, Vol
89 (1), 810 - 812.
Donaldson, L., & Davis, J. H. (1991). Stewardship theory or Agency theory: CEO
governance and shareholder returns. Australian Journal of Management .
©© UUnniivveerrssiittyy ooff PPrreettoorriiaa

73 | P a g e
Donaldson, L., & Davis, J. H. (1991). Stewardship Theory or Agency Theory: CEO
Governance and Shareholder Returns. Australian Journal of Management, p18.
Eisenhardt, K. M. (1989). Agency Theory: An assessment and review. The Academy of
Management Review, Vol.14, No.1, 57-74.
Ferreira, D. (2010). Board Diversity. In D. Ferreira, Internal Governance (pp. 225 - 241).
Ferreira, D. (2014). Board Diversity: Should We Trust Research to Inform Policy? Corporate
Governance: An International Review.
Frederick, R. W. (2011). Enhancing the role of the boards of Directors of State Owned
Enterprises. Paris [Online] http://dx.doi.org/10.1787/5kg9xfg6n4wj-en [Accessed on
22 Aug 2017]: OECD Publishing.
Fukuyama, F. (2013). What is Governance. Centre for Global Development .
Gang, F., & Hope, N. C. (2013). The Role of State-Owned Enterprises in the Chinese
Economy, Chapter 16. available at www.chinausfocus.com/2022. Retrieved from
www.uschina2022.com: https://www.chinausfocus.com/2022/wp-
content/uploads/Part+02-Chapter+16.pdf
Hans Seidel Foundation. (2014). Improving Corporate Governance of South African State
Owned Companies (SOCs). Stellenbosch: HANNS SEIDEL FOUNDATION SOUTH
AFRICA.
Hans Seidel Foundation, H. (2011). Rating Corporate Governance of State Owned
Enterprises. Hans Seidel Foundation.
Heath, J., & Norman, W. (2004). Stakeholder Theory, Corporate Governance and Public
Management: What can the history of state-run enterprises teach us in the post-
Enron era? Journal of Business Ethics, 53 (1), pp247-265.
http://www.govpage.co.za. (2016, December 08). Retrieved from National Entities:
http://www.govpage.co.za/national-entities.html
Institute of Directors South Africa. (2009). King Code of Governance Principles for South
Africa. Institute of Directors South Africa.
Jensen, M. C., & Meckling, H. W. (1976). Theory of the firm, managerial behaviour, agency
costs and ownership structure. Journal of Financial Economics 3.
©© UUnniivveerrssiittyy ooff PPrreettoorriiaa

74 | P a g e
Johansen, S. (1995). Likelihood-Based Inference in Cointegrated Vector Autoregressive
Models. Oxford: Oxford University Press.
Jurkonis, L., & Petrusauskaitė, D. (2014). Effects of corporate governance on management
efficiency of Lithuanian State Owned Entities. Ekonomica Vol. 93(2), 77 - 97.
Jurkonis, L., & Petrusauskaite, D. (2014). Effects of Corporate Governance on Managemtn
Efficiency of Lithunian State Owned Enterprises. Ekonomika, 82.
Kang, H., Cheng, M., & Gray, S. J. (2007). Corporate Governance and Board Composition:
diversity and independence of Australian boards. Corporate Governance, Vol 15 (2),
194 - 207.
Kanyane, M., & Sausi, K. (2015). Reviewing state-owned entities' governance landscape in
South Africa. African Journal of Business Ethics, Vol.9 (1), 28 - 41.
Kinnunen, T., Aapaoja, A., & Haapasalo , H. (2013). Analyzing Internal Stakeholders’
Salience in Product Development. Technology and Investment, Vol 5(2),
[Online]http://www.scirp.org/(S(351jmbntvnsjt1aadkposzje))/reference/ReferencesPa
pers.aspx?ReferenceID=1177421 [Accessed on 23 July 2017].
Knight, D., Pearce, C., Smith, K., Olian, J., Sims, H. P., Smith, K. A., & Flood, P. (1999). Top
Management Team Diversity, Group Process, and Strategic Consensus. Strategic
Management Journal, Vol 20 (1), 445-465.
Ljung, G. M. (1978). On a measure of lack of fit in time series models. Biometrika, Vol 65,
297–303.
MacKinnon, J. G. (1994). Approximate asymptotic distribution functions for unit-root and
cointegration tests. Journal of Business and Economic Statistics, Vol 12, 167– 176.
Mail & Guardian. (2017, August 18). www.mg.co.za. Retrieved from www.mg.co.za :
https://mg.co.za/article/2017-08-00-saa-squanders-sas-prized-assets [Accessed on 1
September 2017]
Marimuthu, M. (2008). Ethnic Diversity on Boards of Directors and Its Implications on Firm
Financial Performance. The Journal Of International Social Research Volume 1/4,
p433.
Marks, S. G. (1999). The separation of ownership and control. Boston University School of
Law, 693 - 700.
©© UUnniivveerrssiittyy ooff PPrreettoorriiaa
75 | P a g e
Matsa, D. A., & Miller, A. R. (2013). A female style in corporate leadership? Evidence from
quotas. American Economic Journal: Applied Economics, Vol 5 (1), 136–169.
McGregor, L. (2014). Improving Corporate Governance of South African State Owned
Companies. [Online] Available:
http://www.usb.ac.za/Shared%20Documents/Thinkpiece.Improving%20S.A.%20SOC
%20Corporate%20Gove.pdf [Accessed on 12 April 2017], pp. 5 - 23.
McIntyre, L. M., Murphy, A. S., & Mitchell, P. (2007). The top team: Examining board
composition and firm performance. Corporate Governance: The International Journal
of Effective Board Performance [online], Vol. 7 Issue 5,, pp547-561.
Menozzi, A., & Vannoni, D. (2014). Political connections in boards of directors. Network
Industries Quarterly Vol. 16 (3), 8 - 10.
Michael, T., Wittenberg, J., & King, G. (2003). Clarify: Software for interpreting and
presenting statistical results. Journal of Statistical Software, Vol 8(1), 1-30.
Milliken, F. J., & Martins, L. L. (1996). Searching for Common Threads:Understanding the
Multiple Effects of Diversity in Organizational Groups. 21 ACAD.MGMT. REV. 402,
410, 412.
Moneyweb. (2013, March 12). www.moneyweb.co.za. Retrieved from
https://www.moneyweb.co.za/archive/state-collects-44-of-gdp-in-revenue/:
https://www.moneyweb.co.za/archive/state-collects-44-of-gdp-in-revenue/ [Accessed
on 9 May 2017]
Moneyweb. (2017, July 31). www.moneyweb.co.za. Retrieved from www.moneyweb.co.za:
https://www.moneyweb.co.za/news/economy/sa-considers-privatisation-to-counter-
recession/ [Accessed on 18 August 2017]
Murphy, M., & McIntyre, M. L. (2007). Board of director performance: a group dynamics
perspective. Corporate Governance. The International Journal of Effective Board
Performance [online], Vol. 7 (2), 209-224.
National Assembly. (2017). Inquiry into the fitness of the SABC board . Cape Town: Adhoc
Committee on SABC Board.
National Entities. (2016, December 08). http://www.govpage.co.za. Retrieved from National
Entities: http://www.govpage.co.za/national-entities.html
©© UUnniivveerrssiittyy ooff PPrreettoorriiaa

76 | P a g e
National Government Entities. (2017, August 22). www.govpage.co.za. Retrieved from
www.govpage.co.za: https://www.govpage.co.za/national-entities.html
OECD. (2004). OECD Principles of Corporate Governance. Organisation for Economic Co-
operation and Development.
OECD. (2015). G20/OECD principles of corporate governance. Paris: OECD Publishing.
Perron, P. (2006). Dealing with structural breaks in Palgrave Handbook of Econometrics.
Econometric Theory, Vol 1 , 278 - 352.
Peters, B. G., & Pierre, J. (2000). Governance, Politics and the State. Basingstoke :
Macmillan.
Petersen, R. (2000). The Management of a Diverse Workforce in the Business Environment
of Israel and Possible Applications for South Africa. Dissertation Abstracts
International Section B: The Science and Engineering, 60, 4284.
PFMA: Section 50. (1999). Republic of South Africa:Public Finance Management Act, 1999
(Act No. 29 of 1999). Pretoria: Republic of South Africa.
Pierce, D. A. (1970). Distribution of residual autocorrelations in autoregressive-integrated
moving average time series models. Journal of the American Statistical Association,
Vol 65, 1509–1526.
Prasad, S., Rao, A., & Rehani, E. (2001). Developing Hypothesis and Research questions.
PRC. (2013, May 29). Report of the presidential review committee on state owned entities.
Retrieved from http://www.polity.org.za/article/report-of-the-presidential-review-
committee-on-state-owned-entities: www.polity.org.za
Public Protector. (2014). When Governance and Ethics Fail: Report of the Public Protector,
Report No.23 of 2013/2014. Pretoria: Public Protector.
PWC. (2015). State-owned enterprises: Catalysts for public value creation? [Online]
Available: https://www.pwc.com/gx/en/psrc/publications/assets/pwc-state-owned-
enterprise-psrc.pdf [Accessed on 17 May 2017], pp. 1 - 39.
Reimann, B. C. (1975). Organisational effectiveness and management of public values: A
canonical analysis. Academy of management journal.
Rhode, D., & Packel, A. (2014). Diversity on Corporate Boards: How Much Difference Does
Difference Make? Delaware Journal of Corporate Law, Vol. 39, pp377–426.
©© UUnniivveerrssiittyy ooff PPrreettoorriiaa

77 | P a g e
Right Management. (2011). Organisational effectiveness - Discovering how to make it
happen.
Sari, S. A., John, H., & Wahyu, S. (2010). The Roles of Board of Commissioners within the
Corporate Governance of Indonesian State-Owned Enterprises. 14th IRSPM
Conference, (p. 3). Berne Switzerland.
Sasieni, P. D., & Royston, P. (1996). Dotplots. Applied Statistics, 219 -234.
Saunders, M., & Lewis, P. (2012). Doing Research in Business and Management. Pearson.
Saunders, Mark; Lewis, Philip;. (2012). An Essential Guide to Planning Your Project. In
Doing Research in Business & Management (p. 139). Pearson Education.
Shapiro, C., & Willig, R. D. (1990). Economic rationales for the scope of privatization.
Sturesson, J., McIntyre, S., & Jones, N. C. (2015). State-Owned Enterprises: Catalysts for
public value creation. State-Owned Enterprises: Catalysts for public value creation,
43.
Swartz, N. P., & Firer, S. (2005). Board structure and intellectual capital performance in
South Africa. Meditari Accountancy Research, Vol 13 (2), 145 - 166.
Thomas, A. D. (2004). Diversity as strategy. Harvard Business Review [online], Vol. 82 Issue
9,, pp98 - 108.
Timmermen, T. (2000). Racial Diversity, Age Diversity, Interdependence and Team
Performance. Small Group Research, 31, 592-606.
United Nations Educational, S. a. (2012). Governance and Development. United Nations.
Urtiaga, G. M., & Menozzi, A. (2013). Board composition and performance in State-Owned
Enterprises:evidence from the Italian public utilities sector.
Wegge, J., Roth, C., Kanfer, R., & Neubach, B. (2008). Age and gender diversity as
determinants of performance and health in a public organization: the role of task
complexity and group size. Journal of Applied Psychology [online], Vol. 93 (6), 1301-
1313.
Wegner, T. (2015). Applied Business Statistics: Methods and Excel Based Applications - 4th
Edition. In T. Wegner, Applied Business Statistics: Methods and Excel Based
Applications - 4th Edition (p. 329). Cape Town: Juta & Company Ltd.
©© UUnniivveerrssiittyy ooff PPrreettoorriiaa

78 | P a g e
Wegner, T. (2015). Applied Business Statistics: Methods and Excel Based Applications - 4th
Edition. In T. Wegner, Applied Business Statistics: Methods and Excel Based
Applications - 4th Edition (p. 329). Cape Town: Juta & Company Ltd.
Wegner, T. (2015). Applied Business Statistics: Methods and Excel Based Applications 4th
Edition. In T. Wegner, Applied Business Statistics: Methods and Excel Based
Applications 4th Edition (pp. pp 336 -340). Cape Town: Juta & Company Ltd.
Wikipedia. (n.d.). https://en.wiktionary.org/wiki/government. Retrieved from
https://en.wiktionary.org/wiki/government [Online] [Accessed on 23 Septwmber 2017]
©© UUnniivveerrssiittyy ooff PPrreettoorriiaa
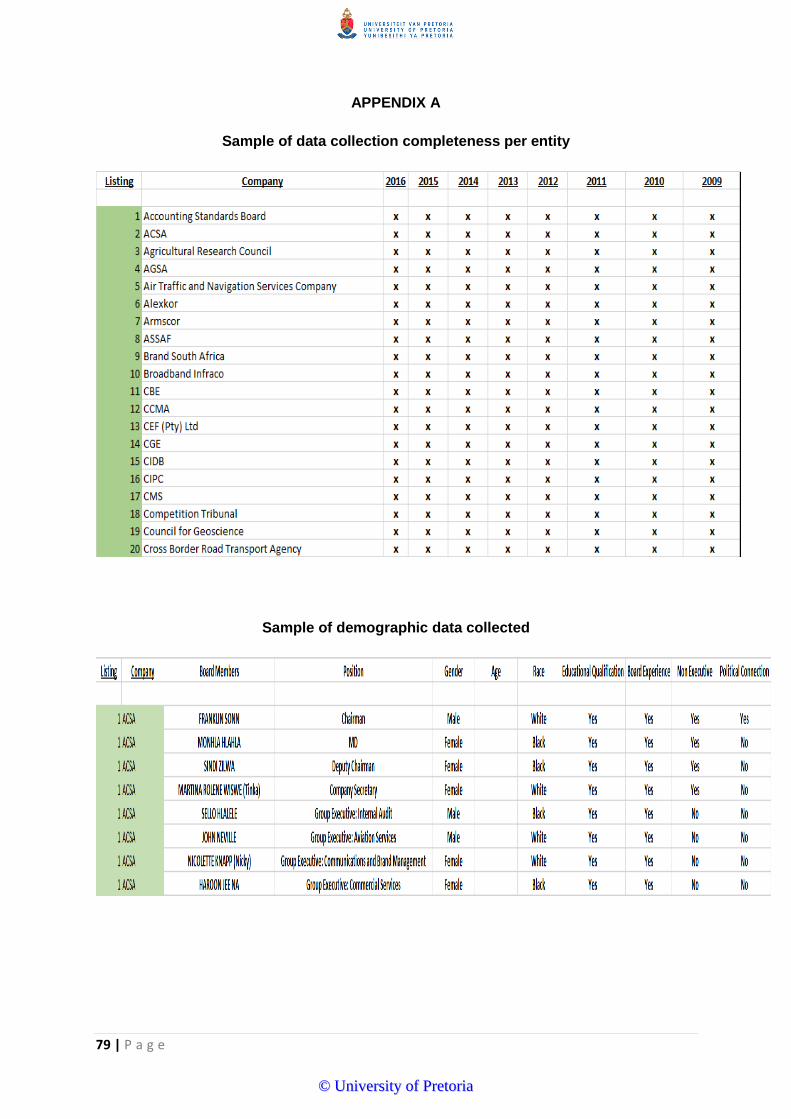
79 | P a g e
APPENDIX A
Sample of data collection completeness per entity
Sample of demographic data collected
©© UUnniivveerrssiittyy ooff PPrreettoorriiaa

80 | P a g e
APPENDIX B
Sample of financial data collected
©© UUnniivveerrssiittyy ooff PPrreettoorriiaa
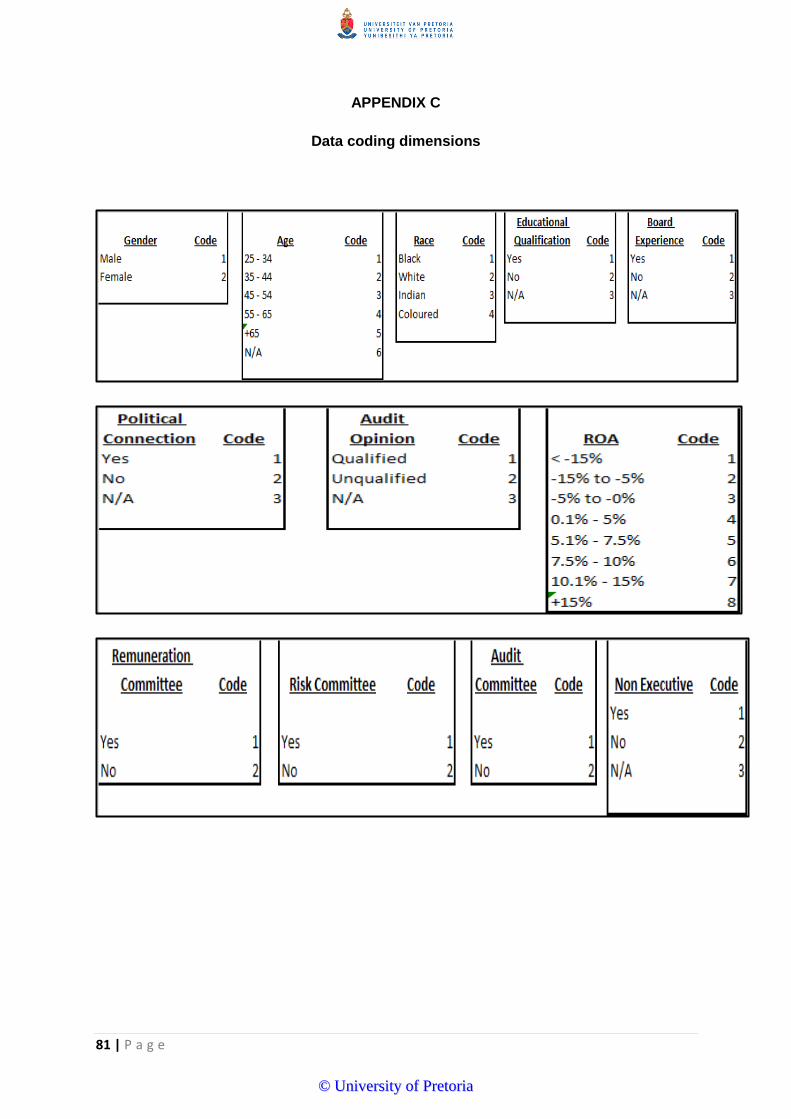
81 | P a g e
APPENDIX C
Data coding dimensions
©© UUnniivveerrssiittyy ooff PPrreettoorriiaa

82 | P a g e
APPENDIX D
Statistical logs - Refer to excel files
APPENDIX E
Listing of SOCs from the National Government Entities website
APPENDIX F
Ethical Clearance
©© UUnniivveerrssiittyy ooff PPrreettoorriiaa