board of directors agenda - sdforwardwelcome to sandag. members of the public may speak to the board...
TRANSCRIPT

Board Members
Jack Dale, Chair Councilmember, Santee
Jim Janney, First Vice Chair Mayor, Imperial Beach
Don Higginson, Second Vice Chair Mayor, Poway
Matt Hall Mayor, Carlsbad
Cheryl Cox Mayor, Chula Vista
Michael Woiwode Councilmember, Coronado
Terry Sinnott Mayor, Del Mar
Vacant El Cajon
Lisa Shaffer Deputy Mayor, Encinitas
Sam Abed Mayor, Escondido
Art Madrid Mayor, La Mesa
Mary Teresa Sessom Mayor, Lemon Grove
Ron Morrison Mayor, National City
Jack Feller Councilmember, Oceanside
Todd Gloria Interim Mayor, San Diego
Vacant San Diego
Chris Orlando Councilmember, San Marcos
Lesa Heebner Councilmember, Solana Beach
Judy Ritter Mayor, Vista
Greg Cox Chairman, County of San Diego
Bill Horn Supervisor, County of San Diego
Advisory Members
Hon. John Renison Supervisor, District 1 Imperial County
Malcolm Dougherty, Director California Department of Transportation
Harry Mathis, Chairman Metropolitan Transit System
Mark Packard, Vice Chairman North County Transit District
CAPT Darius Banaji, CEC, USN, CO, Naval Facilities Engineering Command Southwest U.S. Department of Defense
Ann Moore, Chair San Diego Unified Port District
Tom Wornham, Chairman San Diego County Water Authority
Allen Lawson, Chairman Southern California Tribal Chairmen’s Association
Remedios Gómez-Arnau Consul General of Mexico
Gary L. Gallegos Executive Director, SANDAG
BOARD OF DIRECTORS AGENDA
Friday, December 6, 2013 10 a.m. to 12 noon
SANDAG Board Room 401 B Street, 7th Floor
San Diego
AGENDA HIGHLIGHTS
• SAN DIEGO FORWARD: THE REGIONAL PLAN: ALTERNATIVE LAND USE SCENARIOS
PLEASE TURN OFF CELL PHONES DURING THE MEETING
YOU CAN LISTEN TO THE BOARD OF DIRECTORS
MEETING BY VISITING OUR WEBSITE AT WWW.SANDAG.ORG
MESSAGE FROM THE CLERK In compliance with Government Code §54952.3, the Clerk hereby announces that the compensation
for legislative body members attending the following simultaneous or serial meetings is: Executive
Committee (EC) $100, Board of Directors (BOD) $150, and Regional Transportation Commission (RTC)
$100. Compensation rates for the EC and BOD are set pursuant to the SANDAG Bylaws and the
compensation rate for the RTC is set pursuant to state law.
MISSION STATEMENT The 18 cities and county government are SANDAG serving as the forum for regional decision-making.
SANDAG builds consensus, makes strategic plans, obtains and allocates resources, plans, engineers,
and builds public transit, and provides information on a broad range of topics pertinent to the
region's quality of life.
San Diego Association of Governments ⋅ 401 B Street, Suite 800, San Diego, CA 92101-4231
(619) 699-1900 ⋅ Fax (619) 699-1905 ⋅ www.sandag.org

2 Rev. 102913
Welcome to SANDAG. Members of the public may speak to the Board of Directors on any item at the time the Board is considering the item. Please complete a Speaker’s Slip, which is located in the rear of the room, and then present the slip to the Clerk of the Board seated at the front table. Members of the public may address the Board on any issue under the agenda item entitled Public Comments/Communications/Member Comments. Public speakers are limited to three minutes or less per person. The Board of Directors may take action on any item appearing on the agenda. Public comments regarding the agenda can be sent to SANDAG via [email protected]. Please include the agenda item, your name, and your organization. Email comments should be received no later than 12 noon, two working days prior to the Board of Directors meeting. Any handouts, presentations, or other materials from the public intended for distribution at the Board of Directors meeting should be received by the Clerk of the Board no later than 12 noon, two working days prior to the meeting. In order to keep the public informed in an efficient manner and facilitate public participation, SANDAG also provides access to all agenda and meeting materials online at www.sandag.org/meetings. Additionally, interested persons can sign up for e-notifications via our e-distribution list at either the SANDAG website or by sending an email request to [email protected]. SANDAG operates its programs without regard to race, color, and national origin in compliance with Title VI of the Civil Rights Act. SANDAG has developed procedures for investigating and tracking Title VI complaints and the procedures for filing a complaint are available to the public upon request. Questions concerning SANDAG nondiscrimination obligations or complaint procedures should be directed to SANDAG General Counsel, John Kirk, at (619) 699-1997 or [email protected]. Any person who believes himself or herself or any specific class of persons to be subjected to discrimination prohibited by Title VI also may file a written complaint with the Federal Transit Administration. In compliance with the Americans with Disabilities Act (ADA), SANDAG will accommodate persons who require assistance in order to participate in SANDAG meetings. If such assistance is required, please contact SANDAG at (619) 699-1900 at least 72 hours in advance of the meeting. To request this document or related reports in an alternative format, please call (619) 699-1900, (619) 699-1904 (TTY), or fax (619) 699-1905. SANDAG agenda materials can be made available in alternative languages. To make a request call (619) 699-1900 at least 72 hours in advance of the meeting.
Los materiales de la agenda de SANDAG están disponibles en otros idiomas. Para hacer una solicitud, llame al (619) 699-1900 al menos 72 horas antes de la reunión.
如有需要, 我们可以把SANDAG议程材料翻译成其他語言.
请在会议前至少 72 小时打电话 (619) 699-1900 提出请求.
SANDAG offices are accessible by public transit. Phone 511 or see 511sd.com for route information. Bicycle parking is available in the parking garage of the SANDAG offices.

BOARD OF DIRECTORS
Friday, December 6, 2013
3
ITEM # RECOMMENDATION
1. PUBLIC COMMENTS/COMMUNICATIONS/MEMBER COMMENTS
Public comments under this agenda item will be limited to five public speakers. Members of the public shall have the opportunity to address the Board on any issue within the jurisdiction of SANDAG that is not on this agenda. Other public comments will be heard during the items under the heading “Reports.” Anyone desiring to speak shall reserve time by completing a “Request to Speak” form and giving it to the Clerk of the Board prior to speaking. Public speakers should notify the Clerk of the Board if they have a handout for distribution to Board members. Public speakers are limited to three minutes or less per person. Board members also may provide information and announcements under this agenda item.
REPORTS (Item 2)
+2. SAN DIEGO FORWARD: THE REGIONAL PLAN: ALTERNATIVE LAND USE SCENARIOS (Lemon Grove Mayor Mary Sessom, Regional Planning Committee Chair; Carolina Gregor)
DISCUSSION
This item presents the analysis of three alternative land use scenarios, which tests the potential to further reduce greenhouse gas emissions beyond what is projected in the Series 13 Regional Growth Forecast. The Board of Directors is asked to review and discuss the analysis, which will help inform San Diego Forward: The Regional Plan.
3. CONTINUED PUBLIC COMMENTS
If the five speaker limit for public comments was exceeded at the beginning of this agenda, other public comments will be taken at this time. Subjects of previous agenda items may not again be addressed under public comment.
4. UPCOMING MEETINGS INFORMATION
The next Board Business meeting is scheduled for Friday, December 20, 2013, at 9 a.m. (third Friday due to the holiday schedule).
5. ADJOURNMENT
+ next to an agenda item indicates an attachment * next to an agenda item indicates a San Diego County Regional Transportation Commission item
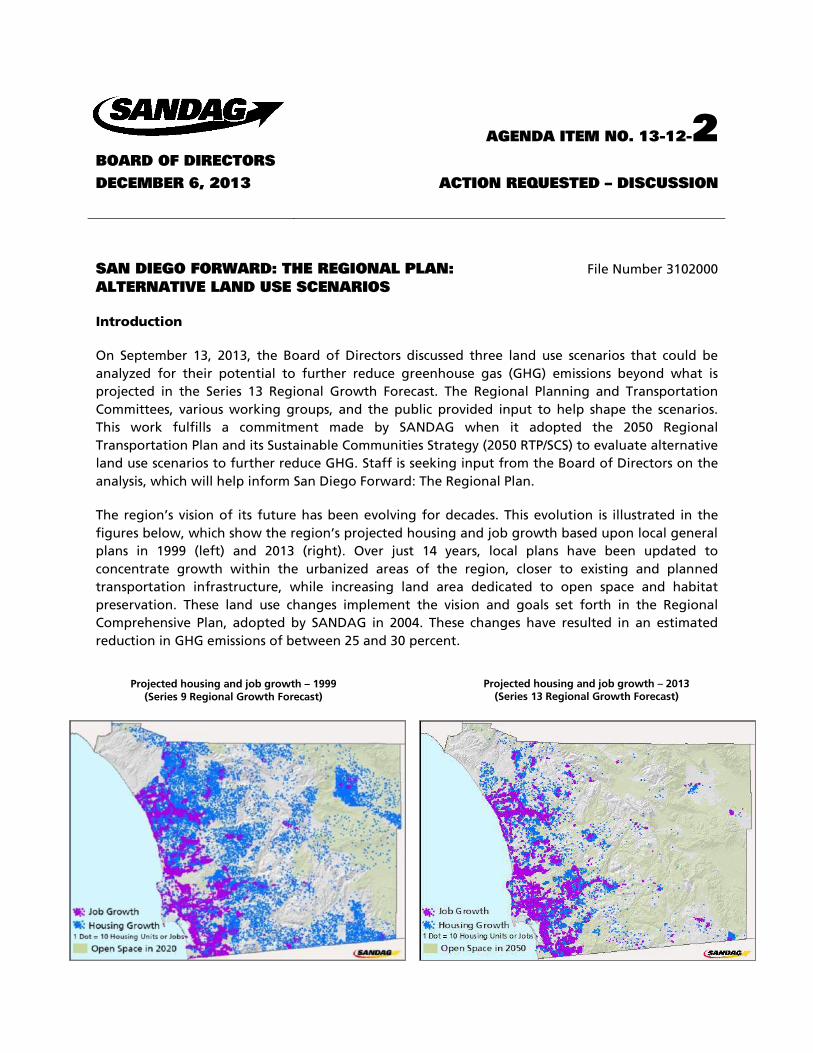
Projected housing and job growth – 1999 (Series 9 Regional Growth Forecast)
Projected housing and job growth – 2013 (Series 13 Regional Growth Forecast)
BOARD OF DIRECTORS
AGENDA ITEM NO. 13-12-2
DECEMBER 6, 2013 ACTION REQUESTED – DISCUSSION
SAN DIEGO FORWARD: THE REGIONAL PLAN: File Number 3102000 ALTERNATIVE LAND USE SCENARIOS
Introduction
On September 13, 2013, the Board of Directors discussed three land use scenarios that could be analyzed for their potential to further reduce greenhouse gas (GHG) emissions beyond what is projected in the Series 13 Regional Growth Forecast. The Regional Planning and Transportation Committees, various working groups, and the public provided input to help shape the scenarios. This work fulfills a commitment made by SANDAG when it adopted the 2050 Regional Transportation Plan and its Sustainable Communities Strategy (2050 RTP/SCS) to evaluate alternative land use scenarios to further reduce GHG. Staff is seeking input from the Board of Directors on the analysis, which will help inform San Diego Forward: The Regional Plan.
The region’s vision of its future has been evolving for decades. This evolution is illustrated in the figures below, which show the region’s projected housing and job growth based upon local general plans in 1999 (left) and 2013 (right). Over just 14 years, local plans have been updated to concentrate growth within the urbanized areas of the region, closer to existing and planned transportation infrastructure, while increasing land area dedicated to open space and habitat preservation. These land use changes implement the vision and goals set forth in the Regional Comprehensive Plan, adopted by SANDAG in 2004. These changes have resulted in an estimated reduction in GHG emissions of between 25 and 30 percent.

2
Possible Alternative Futures
Alternative Scenarios
The three alternative scenarios discussed by the Board of Directors are described below, with more detailed assumptions provided in Attachment 1. While each is different, all scenarios use the Series 13 Regional Growth Forecast as the numeric basei; assume the same transportation networkii; include the same environmental constraintsiii; protect university, military, and institutional lands; and assume entitled development projects to 2020. In addition, all three scenarios allocate all future growth within the identified boundaries shown below in brown, and assume no future growth outside the boundaries, except for currently entitled projects. The scenarios were created as a planning exercise and do not reflect locally planned land uses.
Greenhouse Gas Emissions Analysis
The initial analysis indicates that projected GHG emissions decrease most significantly between the Series 9 and Series 13 Regional Growth Forecasts (between 25 and 30 percent). GHG emissions have the potential to continue to decrease in comparison to Series 13 under the three scenarios, although at a slower pace (up to an additional 3 percent). Scenarios B and C are projected to achieve the greatest reductions.
Scenario A: Second Units and Infill
Scenario A constrains future residential and employment growth to the west of the incorporated cities boundaries, and tests the impact of second units.
Scenario B: Transit Oriented Development
Scenario B concentrates new housing and jobs around existing and future transit stations included in the 2050 RTP/SCS. New development consists primarily of urban/compact development.
Scenario C: Multiple Dense Cores
Scenario C focuses future growth into four dense cores. New housing and jobs consist of urban/compact development concentrated in North County; Mid-County; the greater Downtown area; and South County / International Border.
Series 13 Forecast: Current Plans
Series 9 Forecast: Pre-Regional Comprehensive Plan
Scenario A: Second Units
Scenario B: TOD
Scenario C: Multiple Cores
25%-30% GHG reductions 0%-3% GHG reductions
3
This analysis has been conducted with a sketch modeling tool (known as “UrbanFootprint”), which is in use by several regional agencies throughout California. This tool requires less effort than the more complex transportation models and is intended to give indications or a “sketch” of the results. The “UrbanFootprint” sketch modeling tool allows us to more quickly run and compare scenarios based on several indicators, including GHG reductions. This tool could eventually be used by jurisdictions for local planning efforts, which if adopted, could be incorporated into future regional forecasts.
Similar to other planning tools, the assumptions used as inputs affect the resulting outcomes. Of particular note, since the three land use scenarios were evaluated, additional collaborative work has been undertaken across the state to develop consistent vehicle operating cost and other assumptions to be incorporated into the more complex transportation models that are used in the RTPs. Therefore, it is important to recognize that these initial GHG results produced through the sketch planning tool may vary from future model results that will be reported using the more complex land use and transportation models in San Diego Forward: The Regional Plan.
Concurrent with the scenario planning effort, SANDAG has been developing the Series 13 Regional Growth Forecast through the horizon year of 2050. In October, the Board accepted Series 13 for planning purposes for San Diego Forward: The Regional Plan and related planning efforts. The forecast is a separate and independent effort from the scenarios.
Discussion and Next Steps
Staff is seeking input from the Board of Directors on the land use scenario results and how the results may help shape a refined vision for the region’s future growth and development. The Board’s discussions and policy direction concerning the scenarios described in this report could influence the vision contained in San Diego Forward: The Regional Plan. Over time, land use plans are expected to continue to change as they have over the past 14 years. Local general and specific plan updates have collectively moved the region toward more compact development patterns, resulting in fewer projected GHG emissions. Similar actions in the future may move the region further in this direction. Board discussion is requested on the scenario results and on ideas for how the scenario results could be considered in San Diego Forward: The Regional Plan and combined with future innovations in technology.
GARY L. GALLEGOS Executive Director
Attachment: 1. UrbanFootprint Scenario Development Method for SANDAG Alternative Land Use Scenarios, Prepared by Calthorpe Associates November 15, 2013
Key Staff Contact: Carolina Gregor, (619) 699-1989, [email protected] i Future growth consists of approximately 333,000 new homes; 490,000 new jobs; and 975,000 more people
between 2012 and 2050.
ii Transportation network consists of the currently adopted 2050 RTP/SCS revenue constrained network.
iii Environmentally constrained lands include parks, open space, protected lands, conserved habitat, and steep
slopes.

Calthorpe Associates | SANDAG UrbanFootprint Scenario Development Rules 4
UrbanFootprint Scenario Development Assumptions for SANDAG Alternative Land Use Scenarios i Prepared by Calthorpe Associates | November 22, 2013
The SANDAG alternative land use scenario development process explores alternative land use distributions to the Series 13 Regional Growth Forecast. Series 13 provides an updated base year (2012) environment for the San Diego region, and projects the region’s population, housing, and employment to 2050. Three land use alternatives, along with high-level assumptions, were outlined by the SANDAG Board of Directors, Policy Advisory Committee members, working group members, and the public. These alternatives (Scenarios A, B, and C) were then built by Calthorpe Associates using the ‘UrbanFootprint’ sketch modeling tool. For comparison purposes, Calthorpe Associates also ’translated‘ the Series 13 Forecast data into UrbanFootprint, and integrated a past-trend scenario based on the SANDAG Series 9 Forecast (1999) into the sketch modeling framework.
All scenarios are built upon a base year of 2012, with a horizon year of 2050. Each scenario accommodates the entire Series 13 Forecast to 2050, which consists of a growth increment of approximately 333,000 new housing units, 490,000 new jobs, and 975,000 new people. The year-2012 UrbanFootprint base data ‘canvas,’ the layer upon which all future growth or change is applied, was developed in close coordination with SANDAG staff based on the detailed parcel and related data of the Series 13 2012 base year datasets. In addition to these common forecast-level characteristics, the three alternative land use scenarios assumed the following constants:
• Used the same transportation network (the revenue constrained transportation network from the 2050 Regional Transportation Plan/Sustainable Communities Strategy [2050 RTP/SCS]);
• Included the same environmental constraints consistent with those depicted in the 2050 RTP/SCS, including parks, open space, protected lands, conserved lands, and steep slopes;
• Protected existing and planned university, military, and institutional lands, such as health care facilities and schools. Attributes1 from the Series 13 2050 Master Geographic Reference Areas (MGRAs)2 with Institutional/University/Military uses were passed directly into the respective MGRAs for all scenarios; and,
• Assumed the construction of development projects that are entitled for development between now and 2020. All MGRAs were passed attributes from the entitlement areas dataset if they were designated as having projects with plans that have already been approved (“Entitlement Area”).
1 Attributes consist of detailed information maintained by SANDAG on dwelling units, employment and land use (by type) for base and forecast years in its Geographic Information System (GIS).
2 Master Geographic Reference Areas (MGRAs) are geographic units roughly the size of a city block developed and maintained by SANDAG to support demographic modeling and forecasting.
Attachment 1

Calthorpe Associates | SANDAG UrbanFootprint Scenario Development Rules 5
Figure 1: SANDAG Regional Zones
Table 1: Series 13 Net Increment Growth by Zone
Regional housing and employment distributions were controlled to four regional zones identified by SANDAG (shown in Figure 1). The residential and employment growth totals projected for each zone according to the Series 13 Forecast were maintained in each of the alternative land use scenarios, with the restriction that growth occur within specified scenario boundaries within each zone. Table 1 details the Series 13 dwelling unit and employment distribution into the four regional zones.
Dwelling units* Employment*
Zone Number Percent Number Percent
1 53,502 16% 88,441 19%
2 181,717 56% 187,536 40%
3 28,421 9% 89,432 19%
4 62,180 19% 103,104 22%
Total 325,819 468,513 Varies from series 13 forecast increment due to specific unit type or employment type losses for some types in some zones over the 38-year forecast period (2012-2050).
Each of the land use alternatives was modeled to gauge its relative impacts on scenario performance metrics, including land consumption, passenger vehicle travel, greenhouse gas emissions, energy and water use, and local infrastructure costs. Modeling assumptions were developed by Calthorpe Associates in consultation with SANDAG staff and regional experts in relevant subject areas. As described in the following sections, each scenario varies in its growth boundaries, allocation of growth around high-quality transit nodes, integration of walkable street patterns, allocation of accessory units to existing single family parcels, and degree of growth focused within the defined Smart Growth Opportunity Areas (SGOAs) of the Smart Growth Concept Map. In all cases, scenario land uses were

Calthorpe Associates | SANDAG UrbanFootprint Scenario Development Rules 6
Table 2: Smart Growth Opportunity Area to Place Type Crosswalk
translated or built using the library of UrbanFootprint Place Types, which depict a full spectrum of development options ranging from the most urban mixed use conditions to more suburban and rural single-use residential and employment patterns. In the case of SGOAs, Place Types allocated to specific SGOA areas were applied based on a ‘crosswalk’ between the SGOAs and UrbanFootprint Place Types, as laid out in Table 2.
SANDAG SGOA Type Primary Focus Type UrbanFootprint Place Type
Urban Center Residential City Residential
Urban Center Commercial City Commercial
Urban Center Mixed City Mixed Use
Town Center Residential Town Residential
Town Center Commercial Town Commercial
Town Center Mixed Town Mixed Use
Community Center Residential Village Residential
Community Center Commercial Village Commercial
Community Center Mixed Village Mixed Use
Transit Corridor Residential Town Residential
Transit Corridor Commercial Town Commercial
Transit Corridor Mixed Town Mixed Use
In consultation with SANDAG staff, a series of scenario development ‘rules’ was developed to reflect different growth concepts, forming the basis of where and in what form growth would be allocated in each scenario. Scenarios were built in UrbanFootprint using the rules to establish spatial and quantitative distributions of land uses in terms of UrbanFootprint Place Types. The specific rules for each scenario are detailed in the following sections.
Scenario A: Second Units and Infill/Redevelopment in Urban and Suburban Areas
The focus of Scenario A is to constrain future residential and employment growth to the boundaries of existing incorporated jurisdictions (and within the unincorporated “islands” inside the incorporated city boundaries), and to test the impact of a focused distribution of second units to specified single family parcels (also known as accessory units or granny flats). This required that all Series 13 growth projected in the unincorporated areas outside of existing incorporated jurisdictional boundaries be reallocated to the Scenario A zone. The majority of accessory unit additions were focused within two miles of fixed-route transit
Figure 2: Scenario A Boundary

Calthorpe Associates | SANDAG UrbanFootprint Scenario Development Rules 7
stops, and the reallocation of other dwelling units and employment focused on SGOAs and the MGRAs within one mile of existing/planned fixed-route transit stops included in the 2050 RTP/SCS (including commuter rail, light rail, and bus rapid transit (BRT) stops). In addition to the common rules applied to all scenarios, Scenario A was built to meet the rules detailed as follows:
• Growth constrained by the Scenario A boundary. All new residential and employment growth fell within the Scenario A boundary as seen in Figure 2, except for Entitlement Areas and specified Institutional/University/Military zones from the Series 13 dataset.
• Allocation of Series 13 2050 attributes within the Scenario A boundary. To form the baseline scenario land use distribution, the first pass allocated Series 13 2050 attributes to all MGRAs within the Scenario A boundary.
• Allocation of accessory units. Parcels with a minimum size of 7,000 square feet and containing a single dwelling unit were identified as candidates for accessory units. Using the proportional zonal distribution of new single family units in the Series 13 2050 dataset, accessory units and their associated UrbanFootprint attributes (such as parcel acres and building square feet) were assigned to candidate parcels and loaded into the MGRA geography. The first pass of allocating accessory units placed 90 percent of the approximately 26,000 accessory units on candidate parcels within two miles of a high-quality/fixed route transit stop. The remaining 10 percent of units were assigned to candidate parcels outside of the two-mile buffer from transit stops.
• Allocation of all remaining growth within Scenario A boundary using scenario rules. The remaining growth from the Series 13 2050 dataset that fell outside of the Scenario A boundary, and was not single family or within an Institutional/University/Military area, was allocated within the Scenario A boundary. The rules allocated these remaining multi-family or attached housing units and jobs with a focus on SGOAs, transit proximity, and planned industrial areas (for industrial jobs). Additionally, these units were allocated so that total dwelling units, and total employment, including total retail, total office, and total industrial employment, were distributed across the four regional zones to match the distributions of the Series 13 2050 scenario.
• All new growth avoided ‘constrained land’. All parcels classified as constrained, which includes parks, open space, protected lands, conserved lands, and steep slopes, were not allowed to take new growth.
• Allocation of base-year attributes to all no-change areas. All remaining MGRAs that did not receive any new growth were passed attributes from the scenario base year (2012), as depicted in the UrbanFootprint base ‘canvas’ upon which all future growth or change is applied.

Calthorpe Associates | SANDAG UrbanFootprint Scenario Development Rules 8
Scenario B: Transit Oriented Development
Scenario B was a highly constrained scenario that required that all new growth be focused within one mile of a high-quality/fixed route transit stop. To allocate a land use pattern to meet regional and zonal distributions of dwelling units and employment by type, Scenario B had a high proportion of “refill development” (infill and redevelopment) and urban/ compact development. A detailed list of rules used to construct Scenario B follows:
• Growth constrained by the Scenario B boundary. All new residential and employment growth fell within the Scenario B boundary (one mile from high quality, fixed-route transit stops), except for Entitlement Areas and specified Institutional/University/Military zones from the Series 13 2050 dataset.
• Allocation of units to SGOA MGRAs. Growth was allocated to SGOA geographies within the Scenario B boundary. Place types were assigned based on the type of SGOA and a base-year assessment of whether a given MGRA had a residential, commercial, or mixed-use focus.
• Allocation of units to transit proximate locations. The next pass allocated units to transit-proximate locations using the base-year assessment of a given MGRA’s primary focus type and its proximity to transit within the Scenario B boundary. The intensity of new growth was determined by the quantity of dwelling units and employment to meet the zonal distributions of the Series 13 2050 scenario.
• Allocation of industrial units to planned industrial MGRAs within the Scenario B boundary. To meet the zonal distributions of industrial employment, industrial-focused Place Types were assigned to MGRAs within the Scenario B boundary that contained planned industrial land uses from the Series 13 2050 dataset.
• All new growth avoided redevelopment of single family dwelling unit parcels. A parcel-level analysis was used to identify which parcels fell within urban, greenfield, or constrained lands based on the UrbanFootprint landtype dataset. Single family parcels that fell within Scenario B boundaries, and were not specifically identified by SANDAG as being likely to redevelop or intensify in the Series 13 Forecast, were not allowed to take new growth or be redeveloped.
• All new growth avoided ‘constrained land’. All parcels classified as constrained, which includes parks, open space, protected lands, conserved lands and steep slopes, were not allowed to take new growth.
• Allocation of base-year attributes to all no-change areas. All remaining MGRAs that did not receive any new growth were passed attributes from the scenario base year (2012), as depicted in the UrbanFootprint base ‘canvas’ upon which all future growth or change is applied.
Figure 3: Scenario B Boundary
Calthorpe Associates | SANDAG UrbanFootprint Scenario Development Rules 4
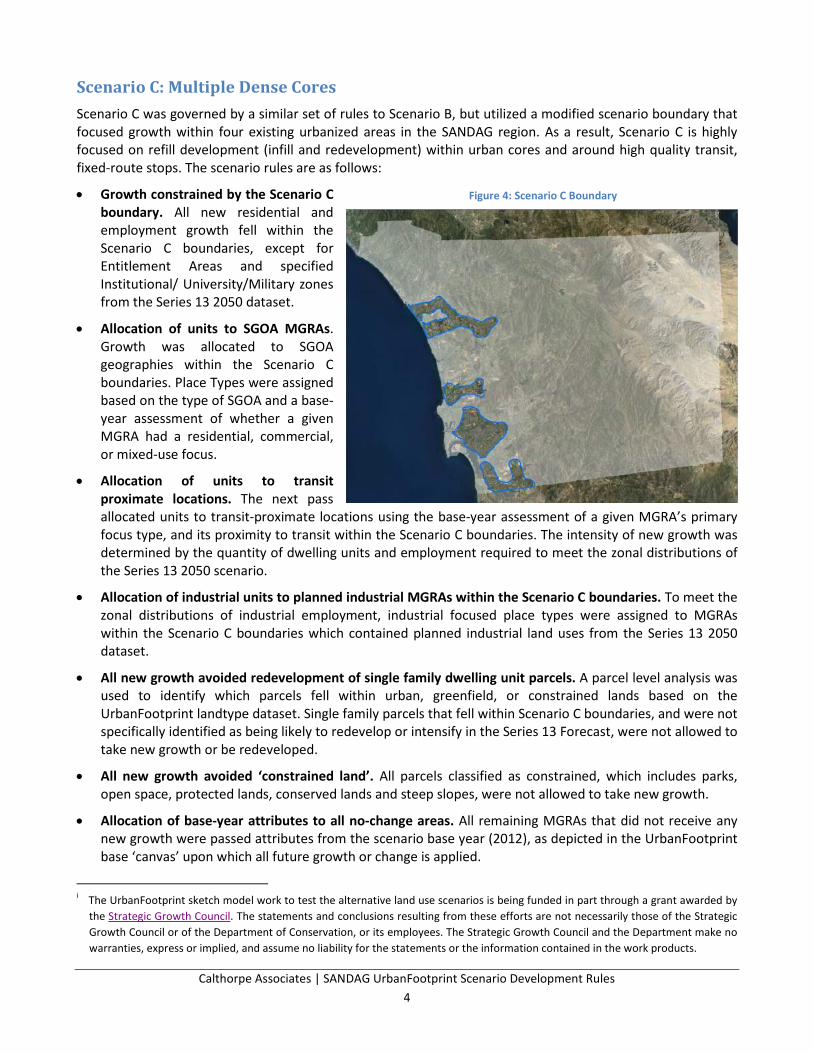
Scenario C: Multiple Dense Cores Scenario C was governed by a similar set of rules to Scenario B, but utilized a modified scenario boundary that focused growth within four existing urbanized areas in the SANDAG region. As a result, Scenario C is highly focused on refill development (infill and redevelopment) within urban cores and around high quality transit, fixed-route stops. The scenario rules are as follows:
• Growth constrained by the Scenario C boundary. All new residential and employment growth fell within the Scenario C boundaries, except for Entitlement Areas and specified Institutional/ University/Military zones from the Series 13 2050 dataset.
• Allocation of units to SGOA MGRAs. Growth was allocated to SGOA geographies within the Scenario C boundaries. Place Types were assigned based on the type of SGOA and a base-year assessment of whether a given MGRA had a residential, commercial, or mixed-use focus.
• Allocation of units to transit proximate locations. The next pass allocated units to transit-proximate locations using the base-year assessment of a given MGRA’s primary focus type, and its proximity to transit within the Scenario C boundaries. The intensity of new growth was determined by the quantity of dwelling units and employment required to meet the zonal distributions of the Series 13 2050 scenario.
• Allocation of industrial units to planned industrial MGRAs within the Scenario C boundaries. To meet the zonal distributions of industrial employment, industrial focused place types were assigned to MGRAs within the Scenario C boundaries which contained planned industrial land uses from the Series 13 2050 dataset.
• All new growth avoided redevelopment of single family dwelling unit parcels. A parcel level analysis was used to identify which parcels fell within urban, greenfield, or constrained lands based on the UrbanFootprint landtype dataset. Single family parcels that fell within Scenario C boundaries, and were not specifically identified as being likely to redevelop or intensify in the Series 13 Forecast, were not allowed to take new growth or be redeveloped.
• All new growth avoided ‘constrained land’. All parcels classified as constrained, which includes parks, open space, protected lands, conserved lands and steep slopes, were not allowed to take new growth.
• Allocation of base-year attributes to all no-change areas. All remaining MGRAs that did not receive any new growth were passed attributes from the scenario base year (2012), as depicted in the UrbanFootprint base ‘canvas’ upon which all future growth or change is applied.
i The UrbanFootprint sketch model work to test the alternative land use scenarios is being funded in part through a grant awarded by
the Strategic Growth Council. The statements and conclusions resulting from these efforts are not necessarily those of the Strategic Growth Council or of the Department of Conservation, or its employees. The Strategic Growth Council and the Department make no warranties, express or implied, and assume no liability for the statements or the information contained in the work products.
Figure 4: Scenario C Boundary
12/16/2013
1
San Diego Forward: The Regional PlanAlternative Land Use Scenarios
December 6, 2013
Why Prepare Scenarios?
2
Commitment to prepare alternative scenarios to explore what it would take to further reduce GHG emissions from cars and light trucks beyond those in the 2050 RTP/SCS.

12/16/2013
2
3
The Region’s Evolution
Comparing Growth Projected in 1999 and 2013
4
The Region’s EvolutionComparing Growth Projected in 1999 and 2013

12/16/2013
3
5
Iterative Planning Process
Smart Growth Concept Map
6

12/16/2013
4
7
Euclid Ave Trolley Station at Market Street
San Diego, CA
7
8
Euclid Ave Trolley Station at Market Street
San Diego, CA
Conceptual
Existing

12/16/2013
5
9
Three Alternative Land Use Concepts
Second Unitsand Infill
Transit OrientedDevelopment
MultipleDense Cores
Scenario A Scenario B Scenario C
10
Input and Ideas

12/16/2013
6
UrbanFootprint Sketch Model
11
12
UrbanFootprint Place Types
Examples of existing development in the region

12/16/2013
7
13
UrbanFootprint Place Types
Examples of proposed development projects
Chula Vista Bayfront – Port of San DiegoMillenia – Chula Vista
Park Village ‐ National CityUniversity Specific Plan – San Marcos Little Italy – San Diego
Park Station – La Mesa
14
Constants
• Series 13 forecast residential and job growth totals• 2050 RTP/SCS transportation network• Environmental constraints
• University, military, institutional lands
• Entitled projects

12/16/2013
8
15
Variables
Scenario A
Scenario B
Scenario C
16
Results and Board Discussion
1999 Forecast 2013 Forecast
25‐30% Per CapitaGHG Reductions
Scenario A Scenario B Scenario C2013 Forecast
0‐3% Per Capita GHG Reductions
Possible Alternative Futures:

12/16/2013
9
San Diego Forward: The Regional PlanAlternative Land Use Scenarios
December 6, 2013