contentscp.pict.com.pk/assets/files/76424.pdfboard of directors chairman capt. haleem a. siddiqui...
TRANSCRIPT


03
04
06
07
08
12
14
29
30
31
33
34
73
113
Vision & Mission Statement
Company Information
Board of Directors
Key Management
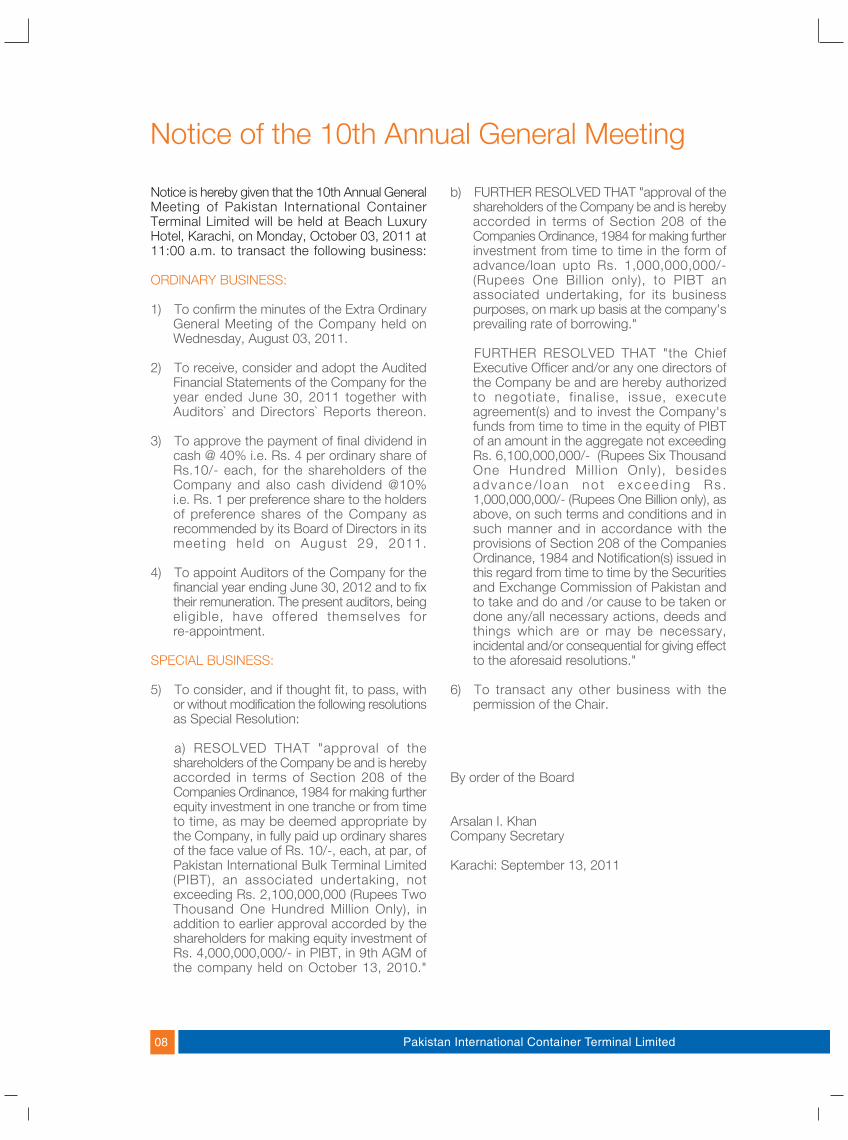
Notice of the 10th Annual General Meeting
Chairman’s Review
Directors’ Report
Key Operating & Financial Data
Statement of Value Added
Statement of Compliance with the Code of Corporate
Governance & Best Practices on Transfer Pricing
Review Report to the Members on Statement of Compliance with
Best Practices of the Code of Corporate Governance
Financial Statements
Consolidated Financial Statements
Pattern of Shareholding
Form of Proxy
Contents

VisionOperate a Container Terminal at Karachi Port that provides thehighest level of quality services to its clients.

MissionA Company dedicated to fulfilling the Port Service requirements ofCustomers and Users of Karachi Port at an economic cost throughoptimum use of human and financial resources and giving a fair returnto investors.

Board of Directors
ChairmanCapt. Haleem A. Siddiqui
Chief Executive OfficerCapt. Zafar Iqbal Awan
DirectorsMr. Aasim Azim SiddiquiMr. Sharique Azim SiddiquiSyed Nizam A. ShahMr. Ali Raza SiddiquiMr. M. Masood Ahmed Usmani, FCA
Chief Operating OfficerMr. Sharique Azim Siddiqui
Chief Financial OfficerMr. M. Masood Ahmed Usmani, FCA
Company SecretaryMr. Arsalan I. Khan, ACA
Audit Committee
ChairmanSyed Nizam A. Shah
MembersMr. Aasim Azim SiddiquiMr. Ali Raza Siddiqui
Chief Internal AuditorMr. Noman Yousuf
SecretaryMr. Arsalan I. Khan, ACA
AuditorsErnst & Young Ford Rhodes SidatHyder Chartered Accountants6th Floor, Progressive Plaza,Beaumont Road, P.O. Box 15541,Karachi-75530
Legal AdvisorsKabraji & Talibuddin, 64-A/1,Gulshan-e-Faisal, Bath Island,Karachi.
Usmani & Iqbal,6th Floor, Business Centre, MumtazHassan Road, Karachi.
The Continental Law Associates,Panorama Centre, Saddar, Karachi.
BankersFaysal Bank LimitedSamba Bank LimitedDubai Islamic Bank Pakistan LimitedNational Bank of PakistanHabib Bank LimitedJS Bank LimitedUnited Bank LimitedStandard Chartered Bank (Pakistan)LimitedHSBC Bank Middle East LimitedAlbaraka Islamic Bank Limited
Company Information

Registered & Head Office2nd Floor, Business Plaza,Mumtaz Hassan Road, Karachi.Tel. 92-21-32400450-3 Fax.92-21-32400281
TerminalBerth 6-9, East Wharf Karachi.UAN. 111-11-PICT (7428)Fax. 92-21-32855715
Registrar / Transfer AgentTechnology Trade (Pvt.) Ltd.241-C, Block-2, P.E.C.H.S.,Karachi.Tel: 92-21-34391316-7

Board of Directors
From left to right: Mr. Sharique Azim Siddiqui, Capt. Zafar Iqbal Awan, Syed Nizam A. Shah,Capt. Haleem A. Siddiqui, Mr. Asim Azim Siddiqui and Mr. M. Masood Ahmed Usmani
From left to right: Mr. Sharique Azim Siddiqui, Mr. Asim Azim Siddiqui, Capt. Zafar Iqbal Awan,Capt. Haleem A. Siddiqui, Syed Nizam A. Shah, Mr. M. Masood Ahmed Usmani andMr. Arsalan I. Khan

Key Management
Front Row: (Left to right)Cdre. (R) Salim Ahmad Siddiqui, Mr . M. Masood Ahmed Usmani, Capt. Zafar Iqbal A wan,Capt. Haleem A. Siddiqui, Syed Nizam A. Shah, Mr. Aasim Azim Siddiqui and Mr. Sharique Azim Siddiqui
Back Row: (Left to right)Mr. Rizwan Ahmed Khan, Mr . Perveiz Ahmed Khan, Mr . Kamran Samad, Syed M. Imran Moosa,Mr. Noman Y ousuf, Mr . Arsalan I. Khan, Mr . Riaz Ahmed Khan, Mr . Mobin Ahmed Qur eshi,Mr. M. Zahid Ahmed, Mr. Saud Ur Rehman, Mr. Sharaf Basit Alavi, Syed Asad Ali, Capt. Afzal Shaikh,Capt. Ibrahim Zaheer Khan, Mirza Mujeeb Baig, Mr . Mohsin Mushtaq, Mr . Mumtaz Hassan Penkar ,Capt. (R) Shaheen Pervez, Mr. Safdar Abbas, Mr. Mohammad Atiq, Syed Masroor-ul-Hassan, Syed Ziauddin,Mr. Moazzam Ali, Mr. Waqar Ali Khan, Col (R) Nadeem Gulzar
���������������� ���������������������
�� �������� ����������� ��� ���������� �
��������������������������������� ��������������������� �� ��������� �������������� ������������������ �����!�"���������!����#���� �$���%����&�'�����&�������!��&�(��������)&�*��������+����,�,��������������������"������������+
(-.�� -/�#01��211+
�3 ��������������������������2$����(�!����������������������� ������4������!���5�!���!��&� �������)&�*���,
*3 ����������&������!�����!��!�4����� �!���!6���������1������������������4�������������� ��!�!� 7���� )�&� *���� ��������"�� �!�����8� ��!�.��������8�-�4����� ������,
)3 ����44��������4��������������!���!��!�������9�:�;��,�,�-�,�:�4�����!������������-�,��<=����&� ��� ���������!������ �����4���� ��!� ����� ���� !���!��!�9��;�,�,�-�,���4���4����������������������!����� 4��������� ������ �� ������4���� ����������!�!��������#���!���.����������������������� ��!� ��� ������ *>&� *���,
:3 ����44����� �!��������������4�������������������������!����7����)�&�*��*���!�����$�����������������,����4���������!�����&��������������&� ���� ����!� ���������� ����=�44��������,
1�2�� �#01��211+
?3 ��������!��&���!�����������&����4���&�"�����"��������!����������������"������������������14������-���������+
�3� -21( @2.� �% �� A�44������ �� ��������!������������4���������!��������������!�!� ��� ������ �� 1������� *�B� �� �����4������(�!������&��>B:�����������������C������������������������������������������������&�����������!����!��44��4��������������4���&���������4��!��4���!����������������������������-�,���<=&����&����4��&�������������������������#������������� �����!D��#�3&� ��� ���������!� ��!��������&� ����$���!����-�,�*&���&���&����D-�4�����"�������!� (��� %��!��!��������� (���3&� ���!!������������������44�����������!�!������������!���������������C�����������������-�,�:&���&���&���<=������#�&����>�� ����������4������!����(��������)&�*���,A
�3� 60-�%2-�-21( @2.��% ��A�44����������������!������������4���������!��������������!�!� ��� ������ �� 1������� *�B� �� �����4������(�!������&��>B:��������������������������������������������������������!�����<����� �4��� -�,� �&���&���&���<=D-�4���� (��� #������� ����3&� ��� ��#�� �����������!� ��!��������&� ��� ���� ��������4��4����&����������4����������������4���E�4����������������������"���,A
60-�%2-� -21( @2.� �% �� A��� ���2$��������(�������!<�����������!����������������4���������!�����������������F�!��� ���������&� �������&� �����&� �$��������������D�3���!�����������������4���E���!��������������������������C���������#����������������������������������$���!���-�,�G&���&���&���<=��D-�4����1�$�������!(��� %��!��!� ��� � ���� (���3&� ����!���!�����< ���� � �� � � �$���! ��� � -� ,�&���&���&���<=�D-�4����(���#�����������3&��������&����������������!����!���������!����������������!� ��������!�����"��� ��4������������1�������*�B���������4�����(�!������&��>B:���!������������D�3������!������������!������������������������1�����������!�2$������������������������������!����������!�!����!�<�����������������������!�������<���������������������&�!��!����!������ "��� ���� ��� ���� ��� ���������&����!��������!<��������C�����������������������������������!������������,A
G3 ��� ��������� ���� ����� ���������"��� ��4�������������������,
#����!��������#���!
��������,�'�����4����1��������
'�����+�1�4��������)&�*���

��� � � � � � � � � � � � � �
���������������� ��������������������������� �� ��������� ������������������ � ��������!�������������"���������������������#��"������������� ��������������"$
�(�21+
�, ���1������������#�������������4���"������������!���!������������"�����������4��!��������������������1�4�������*G&�*������(������� �)&� *���� D���� !���� ���������3,
*, ����������������4���&��������!���������!&�4������!������������2$�����!�������������������������������!�����44������������4����������<���4��$����������!&��4������!�����������!�����<�����!���4��$������44�����!������������������&�������4����������!���&�4������� ��!� ������� ��� ��� 2$�����!������������� �������� ��� ���� ���������� ��� ��������,����$�����&������!����������������&���������������!�������-��������!�(�����������4�����������������:B���������������������,����4��$�����!������������������ ������4���,����4��$�������4��!�����<���������������4�����F�!�����������!���������!�D����3����4���4�������4���������!������,
), ��� ������� ���4������ ������&� ���#���!��.��������E<��������E� ����������<4�"��� ���������� "��� �4������� ���������� �� ��������������������������!�"������4��$��������������4���&���!����������������4��!���!�������������������������������������������������������!������,
:, ��������������C�����!����������������������������!!�����������!��������������-������������������ ���!�� D���,3� �!,&� *:�=�&�,2,�,%,1,&�#�����*&�'�����,
?, �������� "�� ���� ���� ���� ��������!4�����4�������������!����4�����F�!����������!����������!�D����3�������C�����!�������!���������������-����������������������!!������������������,
G, �.�� �������%��!����"���� ���������� ������"������!��=��������!����!�������������!!�"����������������!���!�*G�7�������*��������!� ��� ��� 1���������� ��!� 2$��������������������������,
,�� 6(-� ��2�.�����%2��22����
�, ������������!���!����&��������������!��������=����������!�����!<������4�����"��������������������������4����������!�������������������!������������4���!�!���4������-����������&�������������������� �!������� ��� ��"���� ��� �����������4�����F�!� ��������� �!������� ���!D����3&�������������4���4���������������������!���� ����������,��.�����������!���������������C�����!���������������.��4������4�����.����������!��������������,
��, �������������4������������&����#���!��.��������E<��������E�����������<4�"�������������"����4�������������������������������������4��!���!�D�����������������4����!�!��������3�����������������������,
#,�� 6(-� ��(��������-(H�21
�, ������������!���!����&��������������!��������=����������!�����!<������4�����"��������������������������4����������!�������������������!������������4���!�!���4������-����������&���������������4��$���������4��������������C��������D�����*������3,
��, ���4��$��������������"�������!�����"�4�������"���������&��!!���������!�����������������������������!���������,
���, ������!���4�����������������4���4�������������������"�������!����4��$���������������!�"������4��$�����,
��, ���4��$�������4��!��������������������������������4���4������� ��� ������� ���������,
�, �������������4������������&����#���!��.��������E<��������E�����������<4�"�������������"����4�������������������������������������4��!���!�D�����������������4����!�!��������3������"���4��$��������������4���,

�� �������� ����������� ��� ���������� �
1� �2�2�� � (6 � � �2- � � 6 ��1�(��2-� ��� � 1�2� � � #01 ��211�0-10 ��� �(�12���(�� �G�D�3D#3�(6� �%2�(�� ��21�(-.�� ��2&��>B:
���������������������$�!���������������������� ������ �������� �������� �� ����������������������������������������� �����!���������!���(��������)&�*�������"����4��������������������������������!+����4��4����������1������������������������������������������������������4��������������,
��2��?D�3�(6��%2� �2�.
�3 �����������������������#������������� �����!D��#�3�"��������4�����!����**������*���,��� ���4������ ����������4� ���"���� �����4���� ��!� ��#�� ��� �� ��� ���������!��!��������� ��� �������� �� ������!���������4,�������4���������!����������������C�����������������������������������������������������44��4�����&���������4��!�4� ��!������ ������ �� ��� ���� ������ �-�,��<=&� ���&� ��� 4��&� �� ��� ������� ����$���!����-�,�*&���&���&����D-�4�����"�������!�(���%��!��!���������(���3&������������������������C���������������������#�"���!� ���� �$���!� -�,� G&���&���&���<=D-�4����1�$�������!�(���%��!��!��������(���3&�����!������������������������������ � �! ����� < � � �� � �� � � � $���! � ��-�,�&���&���&���<=D-�4����(���#�������(���3&������������4��4���������#�,��������������!�����<�������������������������������"����������������4���&�"���"�������!��������!������#���!���.�����������������4���,
�3 ��#�E���������������������������"���� �����!�!�����4���&������������!��4������������&
�������<�������4�������!�����������"���!"�!�&��� ��!��� ��!� !���� "��� ���� ���!�� ��!!�����4�����������������&� �������4����&���!�!�"���������&������������������������=����������F�!��������������������������!����� ���4����!����������������!��!��������44������������������!��4����������������������!����!����������!�����������������4�������!������������!����!����������!�����"��,
�3 ���4�����!���4�������� ���4��I���� ��� ����!���B����������������4������������������������!���������"������������������4���*���������������4��������,� ��4���������������������������!���&����4��I������������01.��J����������44��$�������,
!3 ���������4�������� ��������������!���4�����44���������&��������$4����!�����������4���"������������������������4�����������������!����&����#���!���.�����������������4�������44����!������������!�������������������4�����C��������"��������!�����<���������#�����I�����������44��������������������������4������!���1�������*�B��������4������(�!������&��>B:,� ����!�����&�������������!��44��������������������������������������������������������#����4��4���!������,
�3 ���.�����������!�����2$���������������������4�������������������������#������������4������� ��4�������� ��� !��������<� ����$����������������!����������!�����������4���,
3 6������������������������������������������,1-(�BG?�D�3�<*����!���!�.���������G�*��������������"�+
�������������������4���
������&� ������� K� �$����� �� ����������
��������������4��������������������!�!������4������!�!������4����!������$���������������������!����4�����
#����=�4��������������������!�!�������4������!
�����������������������#������������� �����!
6�������C������������������������!���������������#����-�,�*&���&���&���<=���� ��������������-�,���<=&����&����4��&������������C��������������������#������������������"��������$���!� -�,� G&���&���&���<=&� ����!���!����� < � ��� � �� � � � $���! � �� � -� ,�&���&���&���<=,�����44�������&���������#���������������������������!�4���������4���,
-�,�>,>?�4�����������4��������!���!���������������������������������!�!�7����)�&�*���

��� � � � � � � � � � � � � �
���������"��������"�������4������!
2��������4����������������������4���������������������
1����������!�������"����������"������4������!
�����!����"��������������"���������!�
���4����������������
#����������������������
�����������.�����������!���������������������������������4���
#�������������4�������������������������4����������������������4������!��������������������
-�4����������!���
�����������������������������������������!���������"��&����������!�!&�4����!��I�����������������,
-�,����4����������������������������������!����������,
*���+�-�,��,�>�4�������*���+�-�,�D�&:?:&J�:3�4�������*��>+������44����������� ������4����"�������4�����!���������**&�*���
���4��4���!��������������������!�������#���� ��� ��4�� �� �C����� ����������� ��!�!�����<�����"������� ��!�!����� ������������������!� ���������� �� ��� ���4���,
#����� ����������� ��� ����C����� �,�,���!���������������#�&����4����!������!�������������!�!�����<�����"��������$���!�!��������������4����!������������,
��������������������������������!��������������!��������!�����������������,����������������� �$4����!� 4����� �� � � �� � ���"�,
1���������������������������������������������&�������&�������������������"�������������������4������!�������������������������!���,
���.�����������������4������!���������������������������������������������������������$������������������������������4�������4��"��� ����� ������!���� �� ��� ���4���,
����7����)�&�*���+6�$�!� �����+�-�,�:�)&::J&>?B<=������!�����+�-�,��G&:>G&>�><=���!� 04� ��4����+ � -�,� :*?&���&�J�<=1�������#�����������������!����������������4���������������������4��������4�����������������!�!�7����)�&�*���
����(4��������������#�������$+-�,�J&):�&>>?<=����(4�������������� ������$+-�,�B&�G?&G:*<=
-�4�������"����������������������!�����!���������������!�����<����
���#(.����������������!�������#�������������4��I������!���#��"���!������������������������4�������!�����<����&�������������������"������������������!
�3 ������4������������!����!���C������������������-�,�?:?&JG?&JG�<=����?:&?JG&?JG���!�������������-�&���<=���������#���4���7�����:&�*��������������44��������-�,�:&���&���&���<=�����!�!�����������������!��>�� �����������4������!����(��������)&�*���,�6��������������������C���������#������!����������!��!��������������������#(.�����#���������������!�������������������������������4�������������������4�����������!����������������������������4��I��������������C����� ��I�������"�����C����!,� ����!����������������!�������������������$��������"�������!������#�,�����4!���!����������4������������������������4�����������������!������������,

12 Pakistan International Container Terminal Limited
I am pleased with the ef forts made by themanagement of PICT for achieving gr owth incontainer handling in financial year 2010-11, inspitethe tough economic and trade conditions withinthe country and internationally. The company hashandled 669,806 TEUs (Twenty Foot EquivalentContainer Units) during the year as compared to602,106 TEUs last year- a growth of 11%. Ourrevenues have grown by 19% and consequentlynet profits before tax have seen a growth of 39%.Our growth has been commendable ever sincewe started commercial operations in 2002. Allthis has been possible by the Grace of God withthe full dedication of our team of pr ofessionals.
Our priority is to add shar eholder value byreinvesting our earnings to support our expansionplans in order to capture a significant share in thegrowth in Pakistan's container thr oughput. TheDirectors of the Company recommends final cashdividend @ 40% (Rs. 4/- per or dinary share)amounting to Rs. 436.61 million for the year endedJune 30, 2011. The Directors of the company alsorecommends final cash dividend on Pr eferenceShares on proportionate basis @ 10% p.a. (Re. 1per preference share) amounting to Rs. 18 million.Having completed all its development phases
much within the stipulated BOT concession period,PICT now endeavours to maximize ef ficienciesand improve its services to its customers throughour systems and to achieve higher standards ofproductivity. We are presently operating with atotal of Six Quayside Cranes, two Mobile HarbourCranes and twenty Rubber Tyred Gantry Cranesalong with the other ancillary equipment.
PICT has built a new Customer Services facilityat the entrance of the T erminal with impr ovedsystems and increased number of counters todeal with mor e customers at the same time.Customers can now find out the status of theircontainers through a newly introduced automatedmobile SMS facility.
Azim Gate Building was commissioned on April29, 2011 to have most of PICT's departmentsunder one roof. Azim Gate comprises of new eightlane entry and exit lanes to reduce traffic congestionat the entrance of the Terminal.
Chairman’s Review

PICT has enhanced the Customs ExaminationsArea to accommodate larger number ofContainers for grounding and examinations bythe Customs.
PICT has reduced its carbon emissions and itsfuel bill by converting its Rubber Tyred GantryCranes from diesel power to electric-power. Weare now exploring methods to further reduce ourdiesel costs by looking into the possibility ofintroducing Heavy Fuel Oil based gensets in ourPower Plant.
On behalf of PICT , I would like to thank themanagement of KPT , our Lenders- theInternational Finance Corporation and the OPEC
Fund for International Development, our clientsand our valued shareholders.
Our objective remains to build the first Pakistani-owned container terminal in the country and tosuccessfully operate at inter national norms ofproductivity and service, and to be second tonone.
Capt. Haleem A. SiddiquiChairman
Karachi: August 29, 2011
Our priority is to add shareholder valueby reinvesting our earnings in thecompany to support our expansionplans in order to capture a significantshare in the growth in Pakistan’scontainer throughput.


From left of right: Mr. Sharique Azim Siddiqui, Capt. Zafar Iqbal Awan, Syed Nizam A. Shah,Capt. Haleem A. Siddiqui, Mr. Asim Azim Siddiqui and Mr. M. Masood Ahmed Usmani
Mr. Ali Raza Siddiqui

16 Pakistan International Container Terminal Limited
Pictorial Review of Developments for the year
Azim Gate
Main Gate
PACCs Extention
Car Shed

17A n n u a l R e p o r t 2 0 1 1
Pavement
Rail Track Leveling
Sewerage Plant
Water Filter Plant

5,125.12
2010
2010
2010
6,123.78
eighth


20 Pakistan International Container Terminal Limited
Board of Directors
During the year four meetings of the Board ofDirectors of the Company wer e held. Thesewere attended as follows:
Name of Directors Meetings Attended
Capt. Haleem A. Siddiqui 3Capt. Zafar Iqbal Awan 3Mr. Aasim A. Siddiqui 4Mr. Sharique A. Siddiqui 3Syed Nizam A. Shah 3Mr. Ali Raza Siddiqui 4Mr. Masood Ahmed Usmani 4
Audit Committee
During the year four meetings of AuditCommittee were held.
Corporate Governance and Financial ReportingFramework:
• The financial statements, prepared by themanagement of the Company, present fairlyits state of affairs, the result of its operations,cash flows and changes in equity .
• Proper books of account have beenmaintained by the Company.
• Appropriate accounting policies have beenconsistently applied in pr eparation offinancial statements and accounting
estimates are based on r easonable andprudent judgment.
• International Accounting Standar ds, asapplicable in Pakistan, have been followedin pr eparation of financial statements.
• The system of internal control is sound indesign and has been ef fect ive lyimplemented and monitored.
• There are no significant doubts upon theCompany's ability to continue as a goingconcern.
• There has been no material departure fromthe best practices of corporate governance,as detailed in the Listing Regulations.
• There has been no departure from the bestpractices of transfer pricing, as detailed inthe Listing Regulations.
• The key operating and financial data isannexed.
• The value of investments of provident fundbased on their un-audited accounts as onJune 30, 2011 was Rs. 116million.
• Details of purchase/sale of shares of thecompany by its dir ectors, CEO, CFO,Company Secretary and their spouses andminor children are given on page 113.
• Pattern of shareholding is included in theannexed shar eholders' information.
Code of Ethics & Business Principles
The Board has adopted the Statement of Ethicsand Business Principles, which is signed and

Director’s Report
21A n n u a l R e p o r t 2 0 1 1
acknowledged by all the Dir ectors andemployees of the Company and ar e requiredto abide by the Code.
CORPORATE SOCIALRESPONSIBILITY
Pakistan Inter national Container Limitedembraces responsibility for the impact of itsactivities on the envir onment, consumers,employers, communities and all otherstakeholders of the public sphere. In the pastyear, PICT has undertaken various initiatives inthe ar eas of health, safety , education,environmental protection and preservation andother social activities of individuals and groups,attached directly or indirectly to its businessactivities.
The following describes the scope ofPICT's CSR programs:
Env i ronmenta l Pr otect ion Measur esDue to the pr essures of population andtechnology, our biophysical envir onment hasdeteriorated over the years, especially in urbanareas which ar e highly industrialized. PICTbelieves in the protection of the environmentand has an IMS policy which covers the followingth ree s tanda r ds : ISO 9001 :2008 ,ISO 14001:2004 and OHSAS 18001:2007.
The following measures have been undertakento ensur e envi r onmental pr otect ion:
Reducing Emissions: PICT has modified someof its existing diesel power ed Rubber TyredGantry (RTG) Cranes to electric power in orderto r educe fuel consumption and carbonemissions. The entire fleet of PICT RTG craneswhich ar e diesel power ed ar e now beingconverted o electric power . In addition,necessary environmental monitoring includingemission testing of terminal equipment is alsobeing performed at set intervals.
Sewerage Treatment Plant: After the installationand satisfactory performance of a SewerageTreatment Plant of around 20m3/day capacityat the new Executive Block, PICT has installedanother Sewerage T reatment Plant toaccommodate the environmental requirementsof its new expansions at the terminal.Furthermore, effluent testing is also being carriedout regularly in or der to ensur e complianceagainst the appl icable r equirements.
Waste Management: W aste generated issegregated into hazardous and non-hazardouswaste and stor ed in separate ar eas whereaccess is controlled. Disposal of waste is carriedout through Authorized Waste Contractor(s)according to the requirements.

22 Pakistan International Container Terminal Limited
Leaky Containers Area: In order to contain theleakage of any cargo, a proper Leaky ContainersArea has been developed and designated atthe terminal.
Oil Spill Control: PICT has a written procedureregarding oil spill contr ol. A secondarycontainment tray and saw dust, however, arealso available to control any spillage. Moreover,in case of any leakage at seaside, response issought fr om the Marine Pollution Contr olDepartment.
Work Permit System: There is a proper workpermit system in place for hot work and workat height etc.
Power Generation and Sound Attenuation: PICThas its own power house which generatesaround 10MW of electricity and fulfills the entiredomestic needs of the terminal. Louvers havebeen installed in the power house to achievesound attenuation and the staff working insidethe power house area, wear ear muffs as a partof personal protective equipment.
Welfare spending for under privileged classes:Children Education Assistance Pr ogram:PICT supports the low-paid salary staff by takingthe responsibility of meeting the educationalexpenses of their childr en. All such staf f isprovided with the faci l i ty of gett ingreimbursement for the educational and relatedexpenses of upto two childr en. Around 140members of staff have benefited from this facility.
Out Patient Department (OPD) Facility:To meet their medical expenses, the lowersalaried staf f has also been facilitated byproviding allowance for OPD visits with annuallimits prescribed on the basis of their salary .
This facility covers all the medical expensesincurred on their own treatment or the treatmentof family members including, spouses, childrenand parents. The company has also providedhospitalization for daily wages workers throughinsurance cover upto Rs. 150,000/- perindividual.
Burial Expenses: For all the lower salary staff,in the case of death of their immediate familymembers i.e. spouse, childr en and parents,PICT covers all the expenses pertaining to burial.
Sponsoring Staff for Hajj: In order to supportlow-paid salary staf f who cannot af ford toperform Hajj, PICT provides this opportunity byholding a ballot for all such employees. Everyyear two employees are picked through ballotand all the expenses pertaining to the holyjourney ar e bor ne by the Company .
Occupational Safety and Health: PICT wouldlike to improve the occupational health of itsemployees and to eliminate or minimize anysafety risks to its employees. We believe thatthe integration of OHSAS r equirements withexisting business processes achieves significantefficiencies. W e implement, maintain andcontinually improve an Occupational Health andSafety system which covers the following areasof activity:
Trainings: As part of OSHAS, safety awarenesssessions and trainings ar e carried out on aregular basis. A total of 75 training sessionswere conducted related to Occupational Safetyand Health. These were attended by a total of1050 participants. The topics covered in thesesessions included terminal and workplace safety,understanding fire safety arrangements, fir efighting and response to fire operations, basic

23A n n u a l R e p o r t 2 0 1 1
first aid and safe driving techniques etc. Ourmanagement has noticed a better response toworkplace safety guidelines among ouremployees as a r esult of these trainings andthere has also been a reduction in the numberof injuries at the workplace.
Ambulance/Dispensary: PICT has arranged andmanages a 24 hour dispensary and ambulanceat the terminal. Further, a casualty room withbasic facilities has been setup to pr ovide firstaid treatment on the spot. This emergencyfacility is available to all the persons directly orindirectly involved in the day to day activitiesbeing carried out within the pr emises.
Staff sports: PICT believes that people withhealthy bodies and mind can work withmaximum efficiency. To improve the performanceof staff members, an open opportunity wasgiven to all, to participate and perform inextracurricular activities. For this, a PICT cricketteam has been formed, which r egularlyparticipates and plays matches at professionalcricket grounds.
Rural Development: Organization for SocialDevelopment Initiatives (OSDI) is a think tankbased NGO which was established with thesupport of PICT for poverty alleviation and forthe promotion of sustainable development inthe rural ar eas of Pakistan. By pr ovidingnecessary r esources and skills to ruralcommunities, OSDI aims to impr ove livesthrough multi-faceted pr ograms such asLivelihood Assistance, Community Developmentand Food Security.
The purpose of the Livelihood AssistancePrograms is to enhance household incomes inrural Pakistan by means of sustained, predictable
financing of agricultural inputs and livestockanimals. Community Development Programs,on the other hand, ar e designed to r educeexpenditures by setting up affordable servicesand infrastructure in communities where noneexisted before. By investing in Education, Health,Water, Sanitation, Renewable Energy andCommunity Infrastructure, OSDI ensures thatthe basic needs of every human being in ourfocused communities are met so that savingsand asset creation can be attained. Lastly, the

24 Pakistan International Container Terminal Limited
Food Security Program meets the immediatenutritional requirements of the focused familiesin or der to pr event chr onic hunger in thevulnerable households.
The impact of individual projects is monitoredand documented in detail by OSDI so thatresearch can influence national policy on povertythrough precise data and quality research in thefuture. The outreach of on-going projects thusfar is 1,996 households covering a total numberof 12,261 people in 15 villages acr oss Sindhand Khyber-Pakhtunkhwa.
PICT Contribution to OSDI: PICT has fundedthe entire range of Health projects under OSDI'sflagship Community Development Program inDistrict Shikarpur, Matiari and Khairpur in Sindhand District Mardan in Khyber-Pakhtunkhwa.Quality healthcare is usually unavailable on areliable and affordable basis in rural Pakistan.OSDI initiatives in the health sector aim to fillgaps wherever there is a lack of adequatehealthcare in the rural areas.
The following projects have been financed byPICT:
Primary Healthcare Center (PHC): A PHC wasset up in Mar ch 2011 to pr ovide qualityhealthcare including qualified doctors, subsidizedmedicines and basic health infrastructur e for16 villages in District Shikarpur. These centersare accessible to the entire population of thesevillages and cater to between 10 and 15 patientsdaily. Two additional PHCs are in the pipelinefor District Khairpur in Sindh and District Mardanin Khyber-Pakhtoonkhwa.
Hygiene and Nutrition Campaign: A specialHygiene and Nutrition Campaign is being runwith the support of PICT in the T emporaryLearning Centres established by OSDI. Thepurpose of this campaign is to impr ove thenutrition and hygiene of the childr en in thesecommunities. The campaign includes generalmedical check-ups along with distribution ofmilk and healthy biscuits for the 102 children inthe TLCs. So far, PICT has donated Rs. 1.2million specifically for OSDI's health pr ojects.Details of the contribution in each pr oject areillustrated in the diagram below:
Hepatitis B & C prevention and Control Program:In collaboration with the Chief Minister's Initiativefor Hepatitis Free Sindh, the Hepatitis Preventionand Control Program has successfully screened
over 4,500 individuals (including children) in 6villages. It is designed to first screen the entirepopulation for the infection and subsequentlyto facilitate the treatment of Hepatitis positivepatients and vaccinate the remaining community.
Mobile Healthcare Camps: Since April 2011,OSDI has organized 4 mobile medical campsin 2 villages in District Matiari. Thus far between250 and 300 individuals have been diagnosedand treated for common diseases prevalent inrural communities.
52% Hepatitis Prevention & Control System
27% Primary Healthcare Center
5% Mobile Healthcare Camp
16% Salary & Admin
329,414
54,802192,000
629,929

Flood Relief
Due to the massive destruction caused by themonsoon floods in 2010, OSDI undertook floodrelief operations in mid-August 2010 in DistrictCharsadda in Khyber Pukhtoonkhwa (KPK) andDistricts Shikarpur, Khairpur, Matiari and Thattain Sindh. The relief activities lasted until 30thNovember 2010 with OSDI's field teamssupervising and ensuring a r egular supply offood and non-food items, shelter, health, cleandrinking water, clothes and blankets, sanitationfacilities and medical assistance to floodaffectees in five districts acr oss Pakistan.
In Sindh alone, PICT took care of approximately3,555 beneficiaries from 300 households withthe assistance of OSDI's f ie ld staf f.As part of the r elief operation, damage andhealth assessment surveys were also conductedin order to evaluate damages to infrastructure,livestock, and cr ops as well as to evaluateaffectees' health conditions to ensure that theyreceive proper care. Based on the health surveyfindings, a total number of 1,197 people werescreened and vaccinated against dif ferentpreventable diseases such as Hepatitis B andTetanus. 1,275 people were physically examinedby other doctors who visited OSDI camps fromtime to time. More than 500 people were treatedby OSDI doctors in these camps. Ar ound 13pregnancy cases were also referred to differenthospital as critical cases.
A total of PKR 8.3 million was donated by PICTspecifically for OSDI's flood r elief operations.
Skill Development Initiatives: PICT supports skilldevelopment to pr omote the economic wellbeing of the country. In this context, we supportinstitutes that will lead to the development ofskilled youth in the country . We support skilldevelopment by supporting educationalinstitutions that will provide higher educationand training to our youth, as well as supportingprimary education that will develop studentsqualified to enter institutes of higher lear ning.We also support The Karigar Training Institutethat imparts basic trade skills to youngunemployed men. The details of these initiativesare below:
The Zindagi Trust: PICT and its boar d haveextended its support to pr ojects aimed atimparting quality education to the underprivilegedchildren of Pakistan. In this r egard, the PICTteam visited SMB Fatima Jinnah GovernmentGirls School which is looked after by a localNGO namely, Zindagi T rust. The T rust hassuccessfully transformed the conventionalgovernment school where 2200 students arecurrently enrolled, into a centre of excellencethrough a well designed teaching methodologyand an improved curriculum.
In 2010, PICT made a donation of PKR 2 millionto the Zindagi Trust.
Institute of Business Administration (IBA):To support initiatives in higher education, PICTdonated PKR 2 mill ion to the GeneralEndowment Fund of IBA. IBA is Pakistan'sleading business school and pr emier highereducation institution and this donation willenhance its capacity for the development ofhighly trained individuals who can become thefuture leaders of Pakistan.
25A n n u a l R e p o r t 2 0 1 1

26 Pakistan International Container Terminal Limited
The Karigar Training Institute: The Karigar TrainingInstitute provides vocational skills training toyoung men who have studied up to 8th classor a higher level, to become economicallyindependent and productive citizens of Pakistan.Since November 2010, PICT has started ascholarship program in partnership with theKarigar Institute. Under , this pr ogram PICTcovers the tuition cost for students who wouldlike to complete a technical training course inone of the following four basic trades: motorcyclerepair, plumbing, electrical wiring and AC andRefrigerator repair. The duration of the courseis four months and the students also have tocomplete a two month inter nship in order toreceive a certificate for the course. SinceNovember 2010, PICT has sponsor ed 28students through this program.PICT is now also pr oviding assistance to an'Entrepreneur Support Program' through theKarigar Institute. Through this program, two ofthe students from the Institute are now beingassisted in running their own motorcycle repairworkshops.
Community Investment and welfareschemes:
Adopted schools: In November 2009, PakistanInternational Container Terminal Ltd. (PICT)adopted five schools at the Hatim Ali AlviCampus in Keamari. We have provided ongoingassistance to these schools but would like tohighlight two main events that were organizedthrough PICT:
Design for Change contest: One of the adoptedschools, the Hatim Ali Alvi School, at thiscampus, was awarded a prize for one of the
boldest ideas to participate in “Design forChange Contest” in Pakistan. The idea was toencourage women from the community to sendtheir children to school. The childr en went tovarious homes in their neighborhood and invitedmothers to come to the school. The Hatim AliAlvi parents were invited to the school in October.There were a total of 41 mothers and 13 fatherspresent at the school. The childr en gave apresentation about their experience at theschools and encouraged their mothers tounderstand the significance of their education.
Eye camp at Hatim Ali Alvi Campus:In November 2010, r epresentatives from theAl-Ibrahim Eye hospital were invited to conducta primary eye-car e training session for theprimary school teachers at the Hatim Ali Alvicampus. The aim of this session was to enableprimary school teachers from the five schoolsto learn how to measur e the visual acuity oftheir students. A total of 1179 students wer escreened through these tests to measure theirvisual acuity. After the tests were completed,an eye-camp was arranged at the Hatim Ali Alvicampus for those students that had failed thetest.
The eye-camp lasted two days. A total of 66students; 24 male and 42 female, r eceived arecommendation for spectacles. Spectacleswere then arranged for the students by PICTthrough Al-Ibrahim Eye Hospital.

Support for teachers: PICT has supportedteacher training pr ograms at the followinglocation:
Teachers' Training For Early Child Car e &Development (ECCD)
Location : Kalar Kahar V illage inDistrict Chakwal
Population ofVillage : 200,000 (surr ounding
villages: 300,000 people)School : Manara V illage Primary
SchoolStatus of School : Non-Government (Private)Current Level ofEnrollment : 45 childr en (aged 3-5
years)
Additional Teacher Training Programs weresupported with the collaboration of, DAMP(Dhaka Ahsania Mission) which is a Bangladeshbased NGO specializing in ECD (Early ChildCare & Development) for 3 days, Agha KhanFoundation (AKF) - ECD School (Abbotabad)for 2 days and IQRA University (Islamabad)for2 days
Additional CSR Activities at the terminalEye Camp at Terminal: An eye camp and bloodsugar testing was arranged for terminalemployees. A total of 408 employees at theterminal underwent the eye-screening process.Of these, 169 needed spectacles, 46 neededmedicine and 9 patients r equired furtherintervention.
All employees also had their blood sugar tested.Of the employees that were tested, 11 gave ahistory of diabetes but their disease was well-controlled. All the other employees had a normalblood sugar level.
Sehri & Aftar for Staf f: During the holy monthof Ramzan, all the employees working on shiftbasis were given free Aftar as well as Sehri.
Adult education sessions at terminal: An adulteducation series was initiated at the terminal inJanuary 2010. The series pr ovided adulteducation classes for participants at the terminal.A trained adult education professional was hiredto conduct sessions that lasted for 2 hours.The first hour consisted of an interactive lectureand the second hour consisted of an interactiveparticipatory activity. The maximum number ofmen in each session was 27 and a total of 5sessions were conducted. Through the processof these sessions, the intention was to educatemen regarding their current social concerns.
The issues covered ranged from allowing womenfrom the household to engage in gainfulemployment to solutions for workplace conflictsand proper custodial rights for childr en ofdivorced parents.
Corporate Philanthropy: PICT believes in givingcharitable donations as part of its broader socialresponsibility. Charitable giving forms a majorl ink between an organization and thecommunities its serves and leads to theformation of healthier communities. Charitabledonations have been made by PICT to thefollowing organizations:
Behbud Association, Citizens Police LiaisonCommittee, JPMC Department of OrthopaedicSurgery, Nigahban Welfare Association, PakistanDisabled Persons Welfare Organization, PakturkInternational School & Colleges, Patients BehbudSociety for AKUH, Poor Patients Aid Society,SZABIST Student Council, The Karachi Oxford& Cambridge Society, Child Aid Association,The Indus Hospital, Kiran Patients W elfareSociety, The National Institute for CardiovascularDiseases, The Sindh Institute of Ur ology &Transplantation, SOS Childr en's V illages ofSindh, Support fund for victims of Ashura CDGK,Fakhr-e-Imdad Foundation, Edhi Foundation,Ahmed E.H. Jaffer Foundation and The RabiaAzim Trust.
Material Changes & Commitments:The Board of Directors in its meeting held onJuly 11, 2011 has proposed to distribute 54.577million ordinary shares (100% of the issued,subscribed and paid up capital) of its subsidiarycompany, Pakistan International Bulk Terminal(Private) Limited (PIBTL), having face value ofRs 10 each, to the members of the Companyas 'specie dividend' in the ratio of 1:2, i.e. oneordinary share of PIBTL for every two ordinaryshares held of the existing issued, subscribedand paid up capital of the Company . Themembers have approved the said distributionat the Extra Ordinary General Meeting (EOGM)held on August 3, 2011 ther eby resulting inceasing of the Company's equity holding inPIBTL. The financial statements for the yearended June 30, 2011 do not r eflect thisappropriation of Specie Dividend.
PICT invested Rs 425 million in its subsidiaryPIBT as at June 30, 2011, and subsequent tothe balance sheet date, PIBTL has further issued12.077 million ordinary shares of Rs 10 to theCompany, increasing the total investment ofPICT to Rs 545.77 million.
27A n n u a l R e p o r t 2 0 1 1

28 Pakistan International Container Terminal Limited
The Board of Directors in their board meetinghave recommended a final cash dividend ofRs. 4/- per or dinary shar e amounting toRs. 436.12 million (2010: Rs. 2.5/- - 25% perordinary share amounting to Rs. 272.883 million)for the year ended June 30, 2011. The Directorshave also proposed a final dividend for the yearended June 30, 2011 of Re.1.00 - 10% (2010:Re.1.00 - 10%) per preference share amountingto Rs. 18 million. The Companies Or dinance,1984 requires that events subsequent to thebalance sheet date including declaration ofdividend should be incorporated in the year itis declared. Therefore, the cash dividend onordinary and preference shares proposed bythe directors in the meeting held on August 29,2011 shall be incorporated in the financialstatements for the year ending June 30, 2012.
For and on behalf of Boar d of Dir ectors
Capt. Zafar Iqbal AwanChief Executive Officer
Karachi: August 29, 2011
29A n n u a l R e p o r t 2 0 1 1
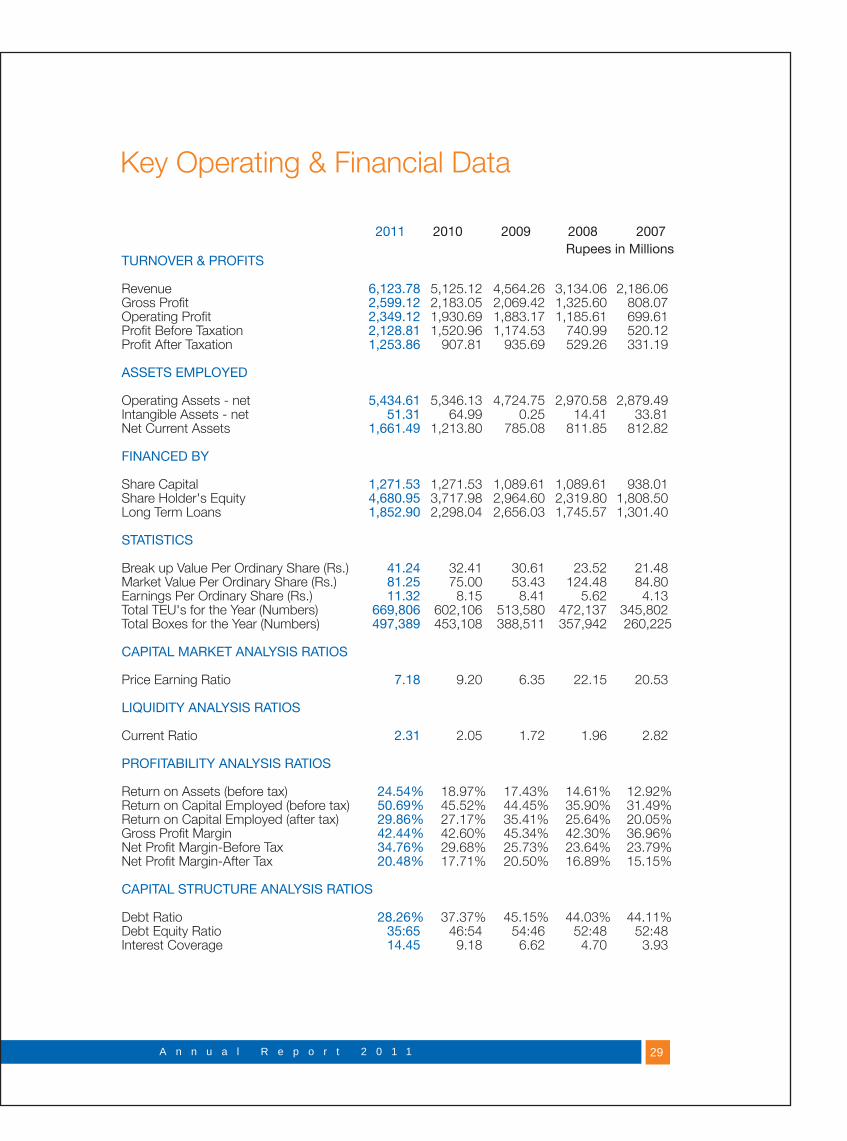
Key Operating & Financial Data
TURNOVER & PROFITS
Revenue 6,123.78 5,125.12 4,564.26 3,134.06 2,186.06Gross Profit 2,599.12 2,183.05 2,069.42 1,325.60 808.07Operating Profit 2,349.12 1,930.69 1,883.17 1,185.61 699.61Profit Before Taxation 2,128.81 1,520.96 1,174.53 740.99 520.12Profit After Taxation 1,253.86 907.81 935.69 529.26 331.19
ASSETS EMPLOYED
Operating Assets - net 5,434.61 5,346.13 4,724.75 2,970.58 2,879.49Intangible Assets - net 51.31 64.99 0.25 14.41 33.81Net Current Assets 1,661.49 1,213.80 785.08 811.85 812.82
FINANCED BY
Share Capital 1,271.53 1,271.53 1,089.61 1,089.61 938.01Share Holder's Equity 4,680.95 3,717.98 2,964.60 2,319.80 1,808.50Long Term Loans 1,852.90 2,298.04 2,656.03 1,745.57 1,301.40
STATISTICS
Break up Value Per Ordinary Share (Rs.) 41.24 32.41 30.61 23.52 21.48Market Value Per Ordinary Share (Rs.) 81.25 75.00 53.43 124.48 84.80Earnings Per Ordinary Share (Rs.) 11.32 8.15 8.41 5.62 4.13Total TEU's for the Year (Numbers) 669,806 602,106 513,580 472,137 345,802Total Boxes for the Year (Numbers) 497,389 453,108 388,511 357,942 260,225
CAPITAL MARKET ANALYSIS RATIOS
Price Earning Ratio 7.18 9.20 6.35 22.15 20.53
LIQUIDITY ANALYSIS RATIOS
Current Ratio 2.31 2.05 1.72 1.96 2.82
PROFITABILITY ANALYSIS RATIOS
Return on Assets (before tax) 24.54% 18.97% 17.43% 14.61% 12.92%Return on Capital Employed (before tax) 50.69% 45.52% 44.45% 35.90% 31.49%Return on Capital Employed (after tax) 29.86% 27.17% 35.41% 25.64% 20.05%Gross Profit Margin 42.44% 42.60% 45.34% 42.30% 36.96%Net Profit Margin-Before Tax 34.76% 29.68% 25.73% 23.64% 23.79%Net Profit Margin-After Tax 20.48% 17.71% 20.50% 16.89% 15.15%
CAPITAL STRUCTURE ANALYSIS RATIOS
Debt Ratio 28.26% 37.37% 45.15% 44.03% 44.11%Debt Equity Ratio 35:65 46:54 54:46 52:48 52:48Interest Coverage 14.45 9.18 6.62 4.70 3.93
2011 2010 2009 2008 2007Rupees in Millions

30
Statement of Value Added
Value Added
Revenue 6,878,333Net Cost of services rendered 2,190,829
4,687,504Other Income 221,083
4,908,587Distribution
Employees- Salaries & Wages 643,574
Karachi Port Trust- Royalty & HMS Charges 675,595
Government- Taxes 1,487,001
Lenders- Mark up on Loans and Leased Assets 158,319
Preference Share Holders- Cash Dividend 18,000
Ordinary Share Holders- Cash Dividend 272,883
Retained in Business 1,653,215 4,908,587
Distribution - %
Employees 13.1%KPT 13.8%Government 30.3%Lenders 3.2%Preference Share Holders 0.4%Ordinary Share Holders 5.6%Retained in Business - For future Expansion 33.7%
100%
2011(Rs. in 000’)
30.3%
3.2%
0.4%
5.6%
33.7%
13.1%13.8%
Retained in Business - For future Expansion
Employees
KPT
Government
Lenders
Preference Share Holders
Ordinary Share Holders
Pakistan International Container Terminal Limited

Statement of Compliance with the Code ofCorporate Governance for the year endedJune 30, 2011
This statement is being pr esented to complywith the Code of Corporate Gover nancecontained in the listing regulations of KarachiStock Exchange for the purpose of establishinga framework of good governance, whereby alisted company is managed in compliance withthe best practices of corporate gover nance.
The company has applied the principlescontained in the Code in the following manner:
1. The Company encourages representationof independent Non-Executive Dir ectors.At present the Boar d consists of sevenDirectors out of which two ar e Non-Executive Directors, who are the nomineedirectors.
2. The Directors have confirmed that none ofthem is serving as a Director in more thanten listed companies, including thiscompany.
3. All the Dir ectors of the Company ar eregistered as tax payers and none of themhas defaulted in payment of any loan to abanking company , a DFI or NBFI.No Director in the boar d is a member ofany of the Stock Exchanges in Pakistan.
4. There has been no casual vacancy in theBoard during the year 2010-2011.
5. No new appointment of CFO or Head ofInternal Audit has been made during theyear.
6. The Company has prepared a “Statementof Ethics and Business Practices”, whichhas been signed by all of the directors andemployees of the Company.
7. The Board has developed a vision / missionstatement, overall corporate strategy andsignificant policies of the Company . Acomplete record of particulars of significantpolicies along with the dates on which theywere appr oved or amended has beenmaintained.
8. All the powers of the Board have been dulyexercised and decisions on materialtransactions including appointment anddetermination of remuneration and termsand conditions of employment of the ChiefE x e c u t i v e O f f i c e r a n d o t h e rExecutive Directors, have been taken bythe Board.
9. The meetings of the Board were presidedover by the Chairman and, in his absence,by a Director elected by the Board for thispurpose and the Board met atleast once inevery quarter. Written notices of the Boardmeetings, along with agenda and workingpapers, were circulated at least seven daysbefore the meetings. The minutes of themeetings were appropriately recorded andcirculated.
10. The director's report for this year has beenprepared in accor dance with therequirements of Code and fully describesthe salient matters required to be disclosed.
11. The Directors' report for the year endedJune 30, 2011 has been pr epared incompliance with the r equirements of theCode and fully describes the salient mattersrequired to be disclosed.
12. The financial statements of the Companywere duly endorsed by Chief ExecutiveOfficer and Chief Financial Of ficer beforeapproval of the Board.
13. The Directors, Chief Executive Officer andExecutives do not hold any interest in theshares of the Company other than thatdisclosed in the patter n of shareholding.
14. The Company has complied with all thecorporate and f inancia l r eport ingrequirements of the Code.
15. The related party transaction have beenplaced before the audit committee andapproved by the Boar d of dir ectors tocomply with the r equirements of listingregulations 35 of the Karachi StockExchange (Guarantee) Limited.
31A n n u a l R e p o r t 2 0 1 1

32 Pakistan International Container Terminal Limited
16. The Board has formed an Audit Committeecomprising of three members including theChairman of the Committee. T wo of themembers are Non-Executive Dir ectors.
17. The meetings of the audit committee wereheld at least once every quarter prior toapproval of interim and final results of theCompany and as r equired by the Code.The terms of r eference of the committeehave been formulated and advised to thecommittee for compliance.
18. The Board has set up an effective internalaudit function.
19. The statutory Auditors of the Companyhave confirmed that they have been givena satisfactory rating under the quality controlreview program of the Institute of CharteredAccountants of Pakistan, that they or anyof the partners of the firm, their spousesand minor children do not hold shar es ofthe Company and that the firm and all itspartners are in compliance with InternationalFederation of Accountants (IFAC) guidelineson code of ethics as adopted by Instituteof Charter ed Accountants of Pakistan.
20. The statutory auditors or the personsassociated with them have not beenappointed to provide other services exceptin accordance with the listing r egulationsand the auditors have confirmed that theyhave observed IFAC guidelines in this regard.
21. We confirm that all other material principlescontained in the Code have been compliedwith.
Capt. Zafar Iqbal AwanChief Executive Officer
KARACHI: AUGUST 29, 2011
Statement of Compliance with theBest practices on T ransfer Pricingfor the year ended June 30, 2011
The Company has fully complied with the Bestpractices on Transfer Pricing as contained inthe Listing Regulations of the Stock Exchange.
Capt. Zafar Iqbal AwanChief Executive Officer
Karachi: August 29, 2011


Auditors' Report to the Members
35
We have audited the annexed balance sheet of PAKISTAN INTERNATIONAL CONTAINER TERMINAL LIMITED (the Company) as at 30 June 2011 and the related profit and loss account, statement of comprehensive income, cash flow statement and statement of changes in equity together with the notes forming part thereof, for the year then ended and we state that we have obtained all the information and explanations which, to the best of our knowledge and belief, were necessary for the purposes of our audit.
It is the responsibility of the Company's management to establish and maintain a system of internal control, and prepare and present the above said statements in conformity with the approved accounting standards and the requirements of the Companies Ordinance, 1984. Our responsibility is to express an opinion on these statements based on our audit.
We conducted our audit in accordance with the auditing standards as applicable in Pakistan. These standards require that we plan and perform the audit to obtain reasonable assurance about whether the above said statements are free of any material misstatement. An audit includes examining, on a test basis, evidence supporting the amounts and disclosures in the above said statements. An audit also includes assessing the accounting policies and significant estimates made by management, as well as, evaluating the overall presentation of the above said statements. We believe that our audit provides a reasonable basis for our opinion and, after due verification, we report that :
a) in our opinion, proper books of account have been kept by the Company as required by the Companies Ordinance, 1984;
b) in our opinion:i) the balance sheet and profit and loss account together with the notes thereon have been drawn
up in conformity with the Companies Ordinance, 1984, and are in agreement with the books of account and are further in accordance with accounting policies consistently applied, except for changes as stated in note 2.3 to the accompanying financial statements with which we concur;
ii) the expenditure incurred during the year was for the purpose of the Company's business; andiii) the business conducted, investments made and the expenditure incurred during the year were
in accordance with the objects of the Company;c) in our opinion and to the best of our information and according to the explanations given to us, the
balance sheet, profit and loss account, statement of comprehensive income, cash flow statement and statement of changes in equity together with the notes forming part thereof conform with approved accounting standards as applicable in Pakistan, and, give the information required by the Companies Ordinance, 1984, in the manner so required and respectively give a true and fair view of the state of the Company's affairs as at 30 June 2011 and of the profit, its comprehensive income, cash flows and changes in equity for the year then ended; and
d) in our opinion, Zakat deductible at source under the Zakat and Ushr Ordinance, 1980 (XVIII of 1980), was deducted by the Company and deposited in the Central Zakat Fund established under section 7 of that Ordinance.
We draw attention to the contents of note 15.2.3 to the financial statements. As fully explained in the said note, preference shares have been treated as part of equity in view of the requirements of the Companies Ordinance, 1984 and the matter of its classification will be dealt with in accordance with the clarification from the Securities and Exchange Commission of Pakistan. Our report is not qualified in respect of this matter.
Karachi: August 29, 2011 Ernst & Young Ford Rhodes Sidat HyderCHARTERED ACCOUNTANTSAudit Engagement Partner: Riaz A. Rehman Chamdia

Capt. Zafar Iqbal Awan Aasim Azim SiddiquiCHIEF EXECUTIVE DIRECTOR
Balance SheetAs at June 30, 2011
Note 2011 2010Rs '000 Rs '000
ASSETS
NON-CURRENT ASSETSProperty, plant and equipmentIntangible assetsLong-term investmentLong-term deposits
CURRENT ASSETSStores and sparesTrade debtsAdvances - unsecured, considered goodDeposits and prepayments Other receivablesShort term investments Taxation - netCash and bank balances
TOTAL ASSETS
EQUITY AND LIABILITIES
SHARE CAPITAL AND RESERVESAuthorised capital
Issued, subscribed and paid-up capitalUnappropriated profit
NON-CURRENT LIABILITIESLong-term financing - securedLiabilities against assets subject to finance leaseDeferred tax liabilityStaff compensated absences
CURRENT LIABILITIESTrade and other payablesAccrued interestTaxation - netCurrent maturity of long-term financingCurrent maturity of liabilities against assets subject to finance lease
CONTINGENCIES AND COMMITMENTS
TOTAL EQUITY AND LIABILITIES
45 67
8910111213
14
15.1
15.2
16171819
20
16
17
21
5,548,06351,307
425,00083,705
6,108,075
340,791227,34069,72716,72421,638
548,004 -
1,702,3962,926,620
9,034,695
2,000,000
1,271,5323,409,4184,680,950
1,852,896113,485
1,087,30634,928
3,088,615
608,63551,28770,014
475,285
59,9091,265,130
9,034,695
5,800,33864,989
-83,705
5,949,032
301,086237,35235,56456,09330,181
592,37287,282
1,026,1762,366,106
8,315,138
2,000,000
1,271,5322,446,4443,717,976
2,298,040173,394944,79328,628
3,444,855
516,71755,899 -
519,782
59,9091,152,307
8,315,138
The annexed notes from 1 to 37 form an integral part of these financial statements.
36
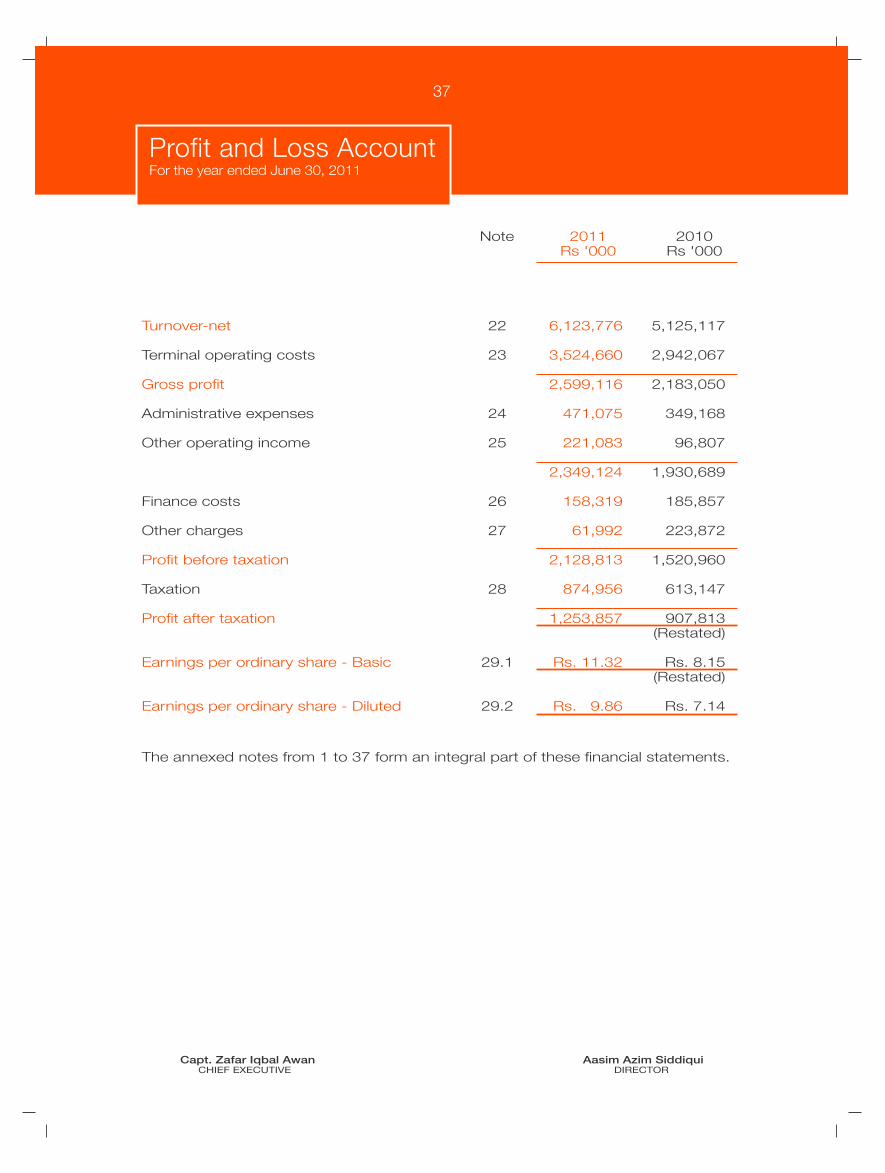
Profit and Loss AccountFor the year ended June 30, 2011
Capt. Zafar Iqbal Awan Aasim Azim SiddiquiCHIEF EXECUTIVE DIRECTOR
Turnover-net
Terminal operating costs
Gross profit
Administrative expenses
Other operating income
Finance costs
Other charges
Profit before taxation
Taxation
Profit after taxation
Earnings per ordinary share - Basic
Earnings per ordinary share - Diluted
Note 2011 2010Rs '000 Rs '000
22
23
24
25
26
27
28
29.1
29.2
6,123,776
3,524,660
2,599,116
471,075
221,083
2,349,124
158,319
61,992
2,128,813
874,956
1,253,857
Rs. 11.32
Rs. 9.86
5,125,117
2,942,067
2,183,050
349,168
96,807
1,930,689
185,857
223,872
1,520,960
613,147
907,813(Restated)
Rs. 8.15(Restated)
Rs. 7.14
The annexed notes from 1 to 37 form an integral part of these financial statements.
37

Statement Of Comprehensive IncomeFor the year ended June 30, 2011
Profit for the year
Other comprehensive income - net of taxation
Total comprehensive income for the year
Capt. Zafar Iqbal Awan Aasim Azim SiddiquiCHIEF EXECUTIVE DIRECTOR
2011 2010Rs '000 Rs '000
1,253,857
-
1,253,857
907,813
-
907,813
The annexed notes from 1 to 37 form an integral part of these financial statements.
38

Cash Flow StatementFor the year ended June 30, 2011
Capt. Zafar Iqbal Awan Aasim Azim SiddiquiCHIEF EXECUTIVE DIRECTOR
The annexed notes from 1 to 37 form an integral part of these financial statements.
CASH FLOWS FROM OPERATIONSTaxes paidLeave encashment paidFinance costs paid
Net cash generated from operating activities
CASH FLOWS FROM INVESTING ACTIVITIESPurchase of property, plant and equipmentProceeds from sale of property, plant and equipmentPayment in relation to capital work-in-progressPurchase of Investments - netInterest received
Net cash used in investing activities
CASH FLOWS FROM FINANCING ACTIVITIESRepayment of long-term financing - netDividends paid on preference sharesDividend paid on ordinary sharesSecurity deposits against leased assetsLease rentals paid
Net cash used in financing activities
Net increase in cash and cash equivalentsCash and cash equivalents at the beginning of the year
Cash and cash equivalents at the end of the year
Note 2011 2010Rs '000 Rs '000
33
14
2,776,421(600,598)
(1,557)(105,610)
2,068,656
(94,110)
6,671(198,630)(326,201)114,602
(497,668)
(523,498)(18,000)
(272,883) -
(80,387)
(894,768)
676,220
1,026,176
1,702,396
2,374,306(404,236)
(548)(157,099)
1,812,423
(159,095)
3,576(421,229)(25,534)59,844
(542,438)
(485,186)(18,000)
(139,252)(172)
(92,387)
(734,997)
534,988
491,188
1,026,176
39

Statement Of Changes In EquityFor the year ended June 30, 2011
Capt. Zafar Iqbal Awan Aasim Azim SiddiquiCHIEF EXECUTIVE DIRECTOR
The annexed notes from 1 to 37 form an integral part of these financial statements.
Balance as at June 30, 2009
Profit for the yearOther comprehensive income, net of tax
Total comprehensive income
Bonus shares issued during the period in theratio of 1 ordinary share for every 5 shares held
Dividend on preference shares @10% for the year ended June 30, 2009
Interim dividend on ordinary shares @ 15%for the year ended June 30, 2010
Balance as at June 30, 2010
Profit for the yearOther comprehensive income, net of tax
Total comprehensive income
Dividend on preference shares @ 10% for the year ended June 30, 2010
Dividend on ordinary shares @ 25% for the year ended June 30, 2010
Balance as at June 30, 2011
909,610
--
-
181,922
-
-
1,091,532
--
-
-
-
1,091,532
180,000
--
-
-
-
-
180,000
--
-
-
-
180,000
1,874,994
907,813-
907,813
(181,922)
(18,000)
(136,441)
2,446,444
1,253,857-
1,253,857
(18,000)
(272,883)
3,409,418
2,964,604
907,813-
907,813
-
(18,000)
(136,441)
3,717,976
1,253,857-
1,253,857
(18,000)
(272,883)
4,680,950
Issued, subscribed andpaid-up capital
Ordinaryshares
Redeemablepreference
shares
Unappropriatedprofit
Total
Rs '000
40

Notes To The Financial StatementsFor the year ended June 30, 2011
1. CORPORATE INFORMATION AND OPERATIONS
1.1. Pakistan International Container Terminal Limited (the Company) was incorporated in Pakistan as a private limited company in June 2002. Subsequently, it was converted to an unquoted public limited company and later on, listed on the Karachi Stock Exchange on October 15, 2003. The registered office of the Company is situated at 2nd Floor, Business Plaza, Mumtaz Hassan Road, Karachi. The terminal office of the Company is located at berths 6 to 9, East Wharf, Kemari Road, Karachi Port.
1.2. The Company has a Build Operate Transfer (BOT) contract with Karachi Port Trust (KPT) for the exclusive construction, development, operations and management of a common user container terminal at Karachi Port for a period of twenty-one years commencing June 18, 2002.
1.3. These financial statements are separate financial statements of the Company in which investment in a subsidiary is accounted for on the basis of direct equity interest and is not consolidated.
2. BASIS OF PREPARATION
2.1 Statement of compliance
These financial statements have been prepared in accordance with approved accounting standards as applicable in Pakistan. Approved accounting standards comprise of such International Financial Reporting Standards (IFRSs) issued by the International Accounting Standards Board as are notified under the Companies Ordinance, 1984, provisions of and directives issued under the Companies Ordinance, 1984. In case requirements differ, the provisions or directives of the Companies Ordinance, 1984 shall prevail.
The Securities and Exchange Commission of Pakistan in pursuance of the Circular No. 21 dated June 22, 2009 has given relaxation for the implementation of IFRIC 12 - “Service Concession Arrangements” due to the practical difficulties facing the companies till the conclusion of the agreements entered on or before June 30, 2010 with the Government or other authority/entity. However, the SECP made it mandatory to disclose the impact on the results of application of IFRIC-12 (Refer note 36).
2.2 Accounting convention
These financial statements have been prepared under the historical cost convention except for certain investments and derivatives which are carried at fair value as referred to in notes 3.8 and 3.21 below.
2.3 New and amended standards and interpretations
The accounting policies adopted in the preparation of these financial statements are consistent with those of previous financial year except as disclosed below:
The Company has adopted the following new and amended IFRS and IFRIC interpretations which became effective during the year:
41

Notes To The Financial StatementsFor the year ended June 30, 2011
IFRS 2 – Group Cash-settled Share-based Payment Arrangements
IAS 32 – Financial Instruments: Presentation – Classification of Rights Issues (Amendment)
IFRIC 19 – Extinguishing Financial Liabilities with Equity Instruments
Improvements to various standards issued by IASB
Issued in 2009
IFRS 5 – Non-Current Assets Held for Sale and Discontinued OperationsIFRS 8 – Operating SegmentsIAS 1 – Presentation of Financial StatementsIAS 7 – Statement of Cash flows Presentation of Financial StatementsIAS 17 – LeasesIAS 36 – Impairment of AssetsIAS 39 – Financial Instruments : Recognition and Measurement
Issued in May 2010
IFRS 3 – Business CombinationsIAS 27 – Consolidated and Separate Financial Statements
The adoption of the above standards, amendments / improvements and interpretations did not have any material effect on the financial statements.
2.4 Standards, interpretations and amendments to approved accounting standards that are not yet effective:
The following revised standards and interpretations with respect to approved accounting standards as applicable in Pakistan would be effective from the dates mentioned below against the respective revised standard and interpretation:
Standards or interpretation Effective date (accounting periods beginning on
or after)
IAS 1 – Presentation of Financial Statements -Amendments to revise the way other comprehensive 01 July 2012income is presented
IFRS 7 – Financial Instruments : Disclosures –Amendments enhancing disclosures about transfers of 01 July 2011financial assets
IAS 12 – Income Tax (Amendment) –Deferred Taxes : Recovery of Underlying Assets 01 January 2012
42

Notes To The Financial StatementsFor the year ended June 30, 2011
IAS 19 – Employee Benefits - Amended Standardresulting from the Post-Employment Benefits andTermination Benefits projects 01 January 2013
IAS 24 – Related Party Disclosures (Revised) 01 January 2011
IFRIC 14 – Prepayments of a Minimum FundingRequirement (Amendment) 01 January 2011
The Company expects that the adoption of the above revisions, amendments and interpretations of the standards will not have material effect the Company's financial statements in the period of initial application.
In addition to the above, amendments to various accounting standards have also been issued by the IASB. Such improvements are generally effective for accounting periods beginning on or after 01 January 2011. The Company expects that such improvements to the standards will not have any material impact on the Company's financial statements in the period of initial application
Further, the following new standards have been issued by IASB which are yet to be notified by the Securities and Exchange Commission of Pakistan for the purpose of applicability in Pakistan.
IASB Effective date(annual periods beginning
Standard on or after)
IFRS 9 – Financial Instruments 01 January 2015
IFRS 10 – Consolidated Financial Statements 01 January 2013
IFRS 11 – Joint Arrangements 01 January 2013
IFRS 12 – Disclosure of Interests in Other Entities 01 January 2013
IFRS 13 – Fair Value Measurement 01 January 2013
2.5. Significant accounting judgments, estimates and assumptions
The preparation of the Company’s financial statements requires management to make judgments, estimates and assumptions that affect the reported amounts of revenues, expenses, assets and liabilities, and the disclosure of contingent liabilities, at the end of the reporting period. However, uncertainty about these assumptions and estimates could result in outcomes that require a material adjustment to the carrying amount of the asset or liability affected in future periods.
In the process of applying the accounting policies, management has made the following estimates and judgments which are significant to the financial statements:
Property, plant and equipment and intangible assets
The Company reviews appropriateness of the rate of depreciation/amortization, useful life and residual value used in the calculation of depreciation/amortization.
43

Notes To The Financial StatementsFor the year ended June 30, 2011
Further, where applicable, an estimate of the recoverable amount of assets is made for possible impairment on an annual basis. In making these estimates, the Company uses the technical resources available with the Company. Any change in the estimates in the future might affect the carrying amount of respective item of property, plant and equipment and intangible assets, with corresponding effects on the depreciation / amortization charge and impairment.
Stores and spares
The Company reviews the net realizable value of stores and spares to assess any diminution in the respective carrying values. Net realizable value is estimated with reference to the estimated selling price in the ordinary course of business less the estimated cost necessary to make the sale.
Trade debts
The Company reviews it’s doubtful trade debts at each reporting date to assess whether provision should be recorded in the profit and loss account. In particular, judgment by management is required in the estimation of the amount and timing of future cash flows when determining the level of provision required. Such estimates are based on assumptions about a number of factors and actual results may differ, resulting in future changes to the provisions.
Taxation
In making the estimate for income tax payable by the Company, the Company takes into account the applicable tax laws and the decision by appellate authorities on certain issues in the past.
Deferred tax assets are recognized for all unused tax losses and credits to the extent that it is probable that taxable profit will be available against which such losses and credits can be utilized. Significant management judgment is required to determine the amount of deferred tax assets that can be recognized, based upon the likely timing and level of future taxable profits together with future tax planning strategies.
Provision for impairment
The Company reviews carrying amount of assets annually to determine whether there is any indication of impairment. If any such indication exists, the assets recoverable amount is estimated and impairment losses are recognized in the profit and loss account.
Contingencies
The assessment of the contingencies inherently involves the exercise of significant judgment as the outcome of the future events cannot be predicted with certainty. The Company, based on the availability of the latest information, estimates the value of contingent assets and liabilities which may differ on the occurrence / non-occurrence of the uncertain future event(s).
44

Notes To The Financial StatementsFor the year ended June 30, 2011
3. SUMMARY OF SIGNIFICANT ACCOUNTING POLICIES
3.1. Fixed assets and depreciation
3.1.1 Property, plant and equipment
Owned
Operating property, plant and equipment are stated at cost less accumulated depreciation and accumulated impairment losses, if any.
Depreciation is charged to profit and loss using straight line method so as to write off the historical cost of the assets over their estimated useful lives at the rates specified in note 4.1 to these financial statements. Depreciation on additions is charged from the month in which the asset is available to use and on disposals up to the month the respective asset was in use. Assets residual values, useful lives and methods are reviewed, and adjusted, if appropriate, at each financial year end.
The carrying values of property, plant and equipment are reviewed at each reporting date for indication that an asset may be impaired and carrying values may not be recovered. If any such indication exists and where the carrying values exceed the estimated recoverable amount, the assets or cash generating units are written down to their recoverable amount. The recoverable amount of property, plant and equipment is the greater of net selling price and value in use.
Maintenance and normal repairs are charged to profit and loss as and when incurred. Major renewals and improvements, if any, are capitalized when it is probable that respective future economic benefits will flow to the Company.
An item of property, plant and equipment is derecognized upon disposal or when no future economic benefits are expected from its use. Gains and losses on disposals are determined by comparing proceeds with the carrying amount of the relevant assets. These are included in the profit and loss account in the period in which they arise.
Leased
Assets held under finance lease are stated at cost less accumulated depreciation and accumulated impairment losses, if any. These are accounted for by recording the asset at the lower of present value of minimum lease payments under the lease agreements and the fair value of asset acquired. The related obligation under the lease is accounted for as liability. Financial charges are allocated to the accounting period in a manner so as to provide a constant periodic rate of charge on the outstanding liability.
Depreciation is charged to the profit and loss using the same basis as for owned assets.
3.1.2 Capital work-in-progress
These are stated at cost less accumulated impairment losses, if any. All expenditure connected with specific assets incurred during installation and construction period are carried under this head. These are transferred to specific assets as and when these assets are available for use.
45

Notes To The Financial StatementsFor the year ended June 30, 2011
3.2. Intangible assets
An intangible asset is recognized if it is probable that the future economic benefits that are attributable to the asset will flow to the enterprise and that the cost of such asset can also be measured reliably.
Costs incurred on the acquisition of computer software are capitalized and are amortized on straight line basis over their estimated useful life. Amortization is charged in the month in which the asset is put to use at the rates stated in note 5 to these financial statements.
Development expenditure incurred on the project is capitalized when its future recoverability can reasonably be regarded as assured. These are amortized over a period of five years on straight line basis commencing from the date of completion of the project, on a monthly pro-rata basis.
Useful lives of intangible assets are reviewed, at each financial year end and adjusted if appropriate.
The carrying value of intangible assets are reviewed for impairment at each financial year end when events or changes in circumstances, indicate that the carrying value may not be recoverable.
3.3. Borrowing costs
Borrowing costs that are directly attributable to the acquisition and construction of assets and incurred during the period in connection with the activities necessary to prepare the asset for its intended use are capitalized as a part of the cost of related asset.
All other borrowing costs are recognised as an expense in the period in which they are incurred.
3.4. Stores and spares
These are valued at lower of moving average cost and net realizable value. Provision is made for slow moving items where necessary to bring these down to approximate net realizable value and is recognised in income. Net realizable value is estimated with reference to the estimated selling price in the ordinary course of business less the estimated cost necessary to make the sale.
3.5. Trade debts
Trade debts originated by the Company are recognised and carried at original invoice amounts less an allowance for doubtful debts. Provision for doubtful debts is based on the management's assessment of customers' outstanding balances and creditworthiness. Bad debts are written-off when identified.
3.6. Loans, advances and other receivables
After initial measurement these are carried at amortized cost less any allowance for impairment.
Gains and losses are recognised in the profit or loss when the loans, advances and other receivables are derecognised or impaired.
46

Notes To The Financial StatementsFor the year ended June 30, 2011
3.7. Investment in subsidiary
Investment in shares of the Company’s subsidiary is stated at cost. Provision is made, for permanent impairment in the value of investment, if any.
3.8. Investments
The investments of the Company, upon initial recognition, are classified as investment at fair value through profit or loss, held to maturity investment or available for sale investment, as appropriate. The Company determines the classification of its financial assets after initial recognition and, where allowed and appropriate, re-evaluates this designation at each financial year-end.
When investments are recognized initially, they are measured at fair value, plus, in the case of investments not at fair value through profit or loss, directly attributable transaction costs.
Investments at fair value through profit or lossFinancial assets at fair value through profit or loss includes financial assets held for trading and financial assets designated upon initial recognition as at fair value through profit or loss.
Investments which are acquired principally for the purpose of generating profit from short term fluctuations in price or dealer’s margin are classified as held for trading. After initial recognition, these are stated at fair values with any resulting gains or losses recognized directly in the profit and loss account. Transaction costs are charged to profit and loss account when incurred.
Held-to-maturity investmentsInvestments with fixed or determinable payments and fixed maturity where management has both the positive intent and ability to hold to maturity are classified as held to maturity and are stated at amortized cost using the effective interest method. Gains and losses are recognized in profit and loss account when the investments are derecognized or impaired, as well as through the amortization process.
Available for sale investmentsInvestments which are intended to be held for an indefinite period of time but may be sold in response to the need for liquidity or changes in interest rates are classified as available for sale. They are initially measured at fair value plus directly attributable transaction costs. After initial measurement, these are stated at fair values (except for unquoted investments where active market does not exist) with unrealized gains or losses recognized directly in other comprehensive income until the investment is disposed or determined to be impaired. At the time of disposal, the cumulative gain or loss previously recorded in other comprehensive income is recognized in the profit and loss account.
Fair value of investmentsThe fair value of investments that are actively traded in organized financial markets is determined by reference to quoted market bid prices at the close of business on the balance sheet date. For investments where there is no active market, fair value is determined using valuation techniques.
47

Notes To The Financial StatementsFor the year ended June 30, 2011
3.9. Cash and cash equivalents
For the purpose of cash flow statement, cash and cash equivalents consist of cash in hand and balances with banks, cheques in hand, deposits held at call with banks and other short-term highly liquid investments with original maturities of three months or less.
3.10. Taxation
Current
The charge for current taxation is based on taxable income at the current rates of taxation after taking into account applicable tax credits, rebates and exemptions available, if any or on one percent of turnover under Section 113 of the Income Tax Ordinance, 2001, whichever is higher.
Deferred
Deferred tax is recognized using the balance sheet liability method, on all temporary differences arising at the balance sheet date between the tax base of assets and liabilities and their carrying amounts for financial reporting purposes.
Deferred tax liabilities are recognized for all taxable temporary differences. Deferred tax assets are recognized for all deductible temporary differences to the extent that it is probable that the future taxable profits will be available against which the assets may be utilized. Deferred tax assets are reduced to the extent that it is no longer probable that the related tax benefit will be realized.
The carrying amount of deferred tax asset is reviewed at each balance sheet date and reduced to the extent that it is no longer probable that sufficient taxable profits will be available to allow all or part of the deferred tax asset to be recognized. Unrecognized deferred tax assets are reassessed at each balance sheet date and are recognized to the extent that it has become probable that future taxable profit will allow deferred tax asset to be recovered.
Deferred tax assets and liabilities are measured at the tax rates that are expected to apply to the period when the asset is realized or the liability is settled, based on the tax rates (and tax laws) that have been enacted or substantively enacted at the balance sheet date.
3.11. Interest-bearing loans and borrowings
All loans and borrowings are initially recognized at fair value less directly attributable transaction costs, and have not been designated ‘as at fair value through profit or loss’. After initial recognition, interest bearing loans and borrowings are subsequently measured at amortized cost using effective interest rate method.
Gains and losses are recognized in profit or loss when the liabilities are derecognized as well as through the amortization process.
3.12. Trade and other payables
Liabilities for trade and other amounts payable are carried at cost which is the fair value of the consideration to be paid in future for goods and services render whether or not billed to the Company.
48

Notes To The Financial StatementsFor the year ended June 30, 2011
3.13. Provisions
Provisions are recognized when the Company has a present legal or constructive obligation as a result of past events and it is probable that an outflow of resources embodying economic benefits will be required to settle the obligation and a reliable estimate of the amount can be made. Provision are reviewed at each balance sheet date and adjusted to reflect the current best estimate.
3.14. Transactions with related parties
All transactions with related parties are carried out by the company using the methods prescribed under the Ordinance.
3.15. Revenue
• Revenues from port operations are recognized when services are rendered;• Profit on deposits / saving accounts are recognized on time proportion basis; and• Dividend income is recognized when the Company’s right to receive the same is established.
3.16. Staff retirement benefits
The Company operates an approved contributory provident fund for all eligible employees. Equal monthly contributions are made by the Company and the employees to the fund at the rate of 8.33% of the basic salary.
Contributions from the Company are charged to profit and loss account for the year.
3.17. Staff compensated absences
The Company provides for its estimated liability towards leaves accumulated by employees on an accrual basis using current salary levels.
3.18. Financial Instruments
Financial assets and financial liabilities are recognized at the time when the Company becomes a party to the contractual provisions of the instrument and are derecognized in case of assets, when the contractual rights under the instrument are realized, expire or surrendered and in case of liability, when the obligation is discharged, cancelled or expired.
3.19. Offsetting of financial assets and financial liabilities
A financial asset and a financial liability is offset and the net amount reported in the balance sheet, if the Company has the enforceable legal right to set off the transaction and also intends either to settle on net basis or to realize the asset and settle the liability simultaneously. Income and expense arising from such assets and liabilities are also offset accordingly.
3.20. Foreign currency translations
Foreign currency transactions are translated into Pakistani Rupee (functional currency) using the exchange rates ruling at the dates of the transactions. Monetary assets and liabilities in foreign currencies are re-translated into Pakistani Rupee using the exchange rate ruling at the balance sheet date. Foreign exchange gains
49

Notes To The Financial StatementsFor the year ended June 30, 2011
and losses resulting from the settlement of such transactions and from the translations at the year end exchange rates of monetary assets and liabilities denominated in foreign currencies are taken to profit and loss account currently.
3.21. Derivative financial instruments
The Company uses derivative financial instruments such as interest rate and cross currency swaps to hedge its risk associated with interest and exchange rate fluctuations. Such derivative financial instruments are initially recognized at fair value on the date on which a derivative contract is entered into and are subsequently re-measured at fair value. Derivatives with positive market values (unrealized gains) are included in other asset and derivatives with negative market values (unrealized losses) are included in other liabilities in the balance sheet. Any gains or losses arising from changes in fair value on derivatives during the year that do not qualify for hedge accounting are taken directly to the profit and loss account.
3.22. Dividend and other appropriation to reserves
Dividend and appropriation to reserves are recognized in the financial statements in the period in which these are approved.
3.23. Impairment
3.23.1Financial assets
A financial asset is assessed at each reporting date to determine whether there is any objective evidence that it is impaired. A financial asset is considered to be impaired if objective evidence indicates that one or more events have had a negative effect of the estimated future cash flows of that asset.
3.23.2Non-financial assets
The carrying value of non-financial assets other than inventories and deferred tax assets are assessed at each reporting date to determine whether there is any indication of impairment. If any such indications exist, then the recoverable amount is estimated. An impairment loss is recognised, as an expense in the profit and loss account, for the amount by which an asset’s carrying amount exceeds it recoverable amount. The recoverable amount is the higher of an asset’s fair value less cost to sell and value in use. Value in use is determined through discounting of estimated future cash flows using a discount rate that reflects current market assessments of the time value of money and risk specific to the assets. For the purpose of assessing impairment, assets are grouped at the lowest levels for which they are separately identifiable cash flows (cash generating units).
3.24. Functional and presentation currency
These financial statements are presented in Pakistani Rupee, which is the Company's functional and presentation currency.
4. PROPERTY, PLANT AND EQUIPMENT
Note 2011 2010Rs '000 Rs '000
Operating fixed assets Capital work-in-progress
4.14.2
5,434,610113,453
5,548,063
5,346,132454,206
5,800,338
50

Notes To The Financial StatementsFor the year ended June 30, 2011
4.1 The following is a statement of operating fixed assets:
Owned Leasehold improvementsPort improvementsMobile Harbour Crane Ship to Shore Cranes – STSGantry tracks Rubber Tyred GantryCranes – RTGPort equipment Port Power GenerationVehiclesComputers Furniture and fixturesOffice equipment
LeasedShip to Shore Cranes – STSRubber Tyred GantryCranes – RTGPort equipment
Total - 2011
289,5981,176,608
101,8192,007,164
12,254
1,545,030703,591301,806
93,57752,20633,60540,420
6,357,678
380,973
67,90842,747
491,628
6,849,306
As atJuly 01,
2010
Rs '000
82,260356,635
- - -
47,17013,37827,57035,69215,46623,248
4,317
605,736
-
--
-
605,736
-----
---
19,503---
19,503
-
--
-
19,503
371,8581,533,243
101,8192,007,164
12,254
1,592,200716,969329,376109,766
67,67256,85344,737
6,943,911
380,973
67,90842,747
491,628
7,435,539
56,598164,660101,819385,011
3,797
258,968210,748
92,28739,35740,16210,30420,798
1,384,509
82,728
13,51722,420
118,665
1,503,174
59,67085,574 -
123,193613
102,49352,13724,97619,347
8,9693,7843,581
484,337
23,087
4,0742,992
30,153
514,490
------
--
16,735---
16,735
-
--
-
16,735
116,268250,234101,819508,204
4,410
361,461262,885117,263
41,96949,13114,08824,379
1,852,111
105,815
17,59125,412
148,818
2,000,929
255,5901,283,009
-1,498,960
7,844
1,230,739454,084212,113
67,79718,54142,76520,358
5,091,800
275,158
50,31717,335
342,810
5,434,610
205-7.14
205-6.98
5
6-6.987-205- 10
2033.33
1010-20
5-6.06
67-20
Additions DisposalsAs at
June 30,2011
As atJuly 01,
2010
For theyear Disposals
As atJune 30,
2011
Writtendown value
as atJune 30,
2011
Deprate %
perannum
COST ACCUMULATED DEPRECIATION
2011
Owned Leasehold improvementsPort improvementsMobile Harbour Crane Ship to Shore Cranes – STSGantry tracks Rubber Tyred GantryCranes – RTGPort equipment Port Power GenerationVehiclesComputers Furniture and fixturesOffice equipment
LeasedShip to Shore Cranes – STSRubber Tyred GantryCranes – RTGPort equipment
Total - 2010
18,799581,722101,819
2,007,16412,254
1,545,030611,651228,610
72,60542,07023,10933,302
5,278,135
380,973
67,90842,747
491,628
5,769,763
As atJuly 01,
2009
Rs '000
270,799594,886
---
-91,94073,19630,90210,13610,496
7,118
1,089,473
-
--
-
1,089,473
-----
---
9,930---
9,930
-
--
-
9,930
289,5981,176,608
101,8192,007,164
12,254
1,545,030703,591301,806
93,57752,20633,60540,420
6,357,678
380,973
67,90842,747
491,628
6,849,306
15,910103,322101,819258,259
3,184
153,623163,558
75,07131,36931,375
7,20711,808
956,505
59,641
10,52518,346
88,512
1,045,017
40,68861,338
-126,752
613
105,34547,19017,21615,081
8,7873,0978,990
435,097
23,087
2,9924,074
30,153
465,250
-----
---
7,093---
7,093
-
--
-
7,093
56,598164,660101,819385,011
3,797
258,968210,748
92,28739,35740,16210,30420,798
1,384,509
82,728
13,51722,420
118,665
1,503,174
233,0001,011,948
-1,622,153
8,457
1,286,062492,843209,519
54,22012,04423,30119,622
4,973,169
298,245
54,39120,327
372,963
5,346,132
205-7.14
205-6.98
5
6-6.987-205- 10
2033.33
1010-20
5-6.06
67-20
Additions DisposalsAs at
June 30,2010
As atJuly 01,
2009
For theyear Disposals
As atJune 30,
2010
Writtendown value
as atJune 30,
2010
Deprate %
perannum
COST ACCUMULATED DEPRECIATION
2010
51

Notes To The Financial StatementsFor the year ended June 30, 2011
4.1.1.Disposal of operating fixed assets:
Cost Accumulateddepreciation
Writtendownvalue
Rs '000Vehicles
Honda CityHonda City
Honda City
Honda CityHonda CityHonda CityHonda CityHonda CityHonda CitySuzuki BolanSuzuki Alto
Suzuki Alto
Suzuki Alto
Suzuki AltoDaihatsu CuoreMercedes BenzHonda AccordChanganChangan
846846
846
846846846846846
1,457150504
504
499
504434
5,3682,648
285382
19,503
169169
169
169169169169169995
-92
92
91
-654037
--
2,764
677677
677
677677677677677462150412
412
408
504369
5,3282,611
285382
16,739
169169
169
169169169169169
1,2406092
92
91
30065
2,1501,000
102127
6,671
--
-
-----
24560
-
-
-
300-
2,110 963
102 127
3,907
Company policyCompany policy
Company policy
Company policyCompany policyCompany policyCompany policyCompany policy
NegotiationNegotiation
Company policy
Company policy
Company policy
NegotiationCompany policy
NegotiationNegotiationNegotiationNegotiation
Mr. Muhammed Atiq (Employee)Mr. Muhammed Kamal(Employee)Mr. Pervaiz Ahmed Khan(Employee)Mr. Syed Ziauddin (Employee)Mr. Imran Moosa (Employee)Mr. Waqar Ali Khan (Employee)Mr. Safdar Abbas (Employee)Mr. Zahid Ahmed (Employee)Mr. Shamim Akhter (Third Party)Mr. Fazal Said (Third Party)Mr. Najeeb Khan Durrani(Employee)Mr. Shehbaz Ali Naveed(Employee)Mr. Rehan Mehmood Janjua(Employee)Mr. Hasnain Mirza (Employee)Mr. Zeshan Sabro (Employee) Mr. Sheeraz Ansari (Third Party)Mr. Yasir Mehmood (Third Party)Mr. Tahir Naeem (Employee)Mr. Baleeguddin Alvi (Employee)
SalesPrice
Gain Mode ofdisposal
Particulars of Buyer
Note 2011 2010Rs '000 Rs '000
Terminal operating costsAdministrative expenses
2324
452,75161,739
514,490
409,08756,163
465,250
4.2 Capital work-in-progress
Civil worksAdvances to suppliers and contractors Mobilization advance - for purchase of cranes and related equipments
33,98772,597
6,869113,453
314,502132,835
6,869454,206
4.1.2 Depreciation charge for the year has been allocated as under:
52

Notes To The Financial StatementsFor the year ended June 30, 2011
4.2.1.Movement
Balance as at June 30, 2009Capital expenditure incurred / advances made during the yearTransfer to operating fixed assets / intangible assets
Balance as at June 30, 2010
Capital expenditure incurred / advances made during the yearTransfer to related party Transfer from advances to suppliers and contractors to civil worksTransfer to operating fixed assets / intangible assets
Balance as at June 30, 2011
809,730
264,391
(759,619)
314,502
155,224(27,755)
52,581
(460,565)
33,987
Civilworks
Rs '000
158,958
107,386
(133,509)
132,835
43,406 -
(52,581)
(51,063)
72,597
Advances tosuppliers andcontractors
2,666
41,453
(37,250)
6,869
- -
-
-
6,869
Advance for purchase ofcranes and
related equipments
60,410
8,000
(68,410)
-
--
-
-
-
Advance for purchase /
development of computer
software
1,031,764
421,230
(998,788)
454,206
198,630(27,755)
-
(511,628)
113,453
Total
5. INTANGIBLE ASSETS
Computer software
Project development cost
20112010
105,767
37,889
143,65675,246
As atJuly 01,
2010
Rs '000
-
-
-68,410
105,767
37,889
143,656143,656
40,778
37,889
78,66774,995
13,682
-
13,6823,672
54,460
37,889
92,34978,667
AdditionsAs at
June 30,2011
As atJuly 01,
2010
Chargefor theyear
As atJune 30,
2011
COST ACCUMULATED AMORTIZATION
5.1.1
Note
51,307
-
51,30764,989
Book valueas at June30, 2011
Amortizationrate%
20-33.33
20
5.1.1.These include legal and professional charges, litigation settlement, salaries, benefits and traveling expenses incurred in connection with the main project during the pre operating period.
5.1.2.Amortization charge for the year has been allocated to terminal operating costs:
Note 2011 2010Rs '000 Rs '000
23 13,682 3,672
6. LONG TERM INVESTMENT – at cost
Pakistan International Bulk Terminal(Private) Limited
Unquoted subsidiary
Number of ordinaryshares of Rs.10/- each
2011 2010
42,500,007 7Bulk
Terminal
Activity
100
2011%
100
2010%
425,000
2011
7
2010
6.1 As discussed in note 35.2 to these financial statements, the Company has subsequently distributed the shares of its wholly owned subsidiary as dividend in specie. The members have approved the said distribution at the Extra Ordinary General Meeting (EOGM) held on 03 August 2011.
Holding
Rs '000
53

Notes To The Financial StatementsFor the year ended June 30, 2011
7. LONG TERM DEPOSITSRepresents mainly security deposits against leased assets.
StoresSpares
Note 2011 2010Rs '000 Rs '000
9.1 & 9.2
9.3
95,421245,370340,791
84,304216,782301,086
8. STORES AND SPARES
Considered good
Considered doubtful
Less: Provision for doubtful debts
227,340
1,475228,815
1,475227,340
237,352
3,641240,993
3,641237,352
9. TRADE DEBTS
9.1 The aging of trade debts at June 30 is as follows:
Neither past due nor impairedPast due but not impaired- within 90 days- 91 to 180 days- over 180 days
213,581
8,1155,644
-227,340
204,521
22,7264,1165,989
237,352
9.2 Includes Rs. 0.3 million (2010: Rs. 0.3 million) due from Marine Services (Private) Limited and Rs. Nil (2010: Rs. 0.313 million) due from Premier Mercantile Services (Private) Limited (related parties).
9.3 Movement of provision for doubtful debts
Opening balanceProvision for the yearWritten off during the year
3,641 -(2,166)1,475
4,810924
(2,093)3,641
- to employees - to suppliers
6,95262,77569,727
5,14930,41535,564
10. ADVANCES - unsecured, considered good
Security deposits Prepayments
- Insurance - Others
9,336
6736,715
16,724
9,214
41,9394,940
56,093
11. DEPOSITS AND PREPAYMENTS
Accrued profit on term depositsAccrued profit on certificate of investmentsOther receivables – considered good
1,34816,6883,602
21,638
1,04315,64813,49030,181
12. OTHER RECEIVABLES
12.112.2
12.1 Accrued profit on certificate of investmentsLess: Provision for impairment
18,854(2,166)16,688
17,814(2,166)15,648
54

2011 2010
Rs '000
Notes To The Financial StatementsFor the year ended June 30, 2011
12.2 Includes Rs. Nil (2010: Rs. 10.133) million due from Pakistan International Bulk Terminal (Private) Limited, a wholly owned subsidiary, in respect of incorporation expenses paid by the Company.
Designated at fair value through profit or lossHeld to maturity – Related party
Note 2011 2010Rs '000 Rs '000
13.113.2
509,75438,250
548,004
539,12253,250
592,372
13. SHORT TERM INVESTMENTS
13.1 Designated at fair value through profit or loss
1,160,9803,556,039
-107,415112,781
6,39324,350
519,048
-4,236,041
458,051-
101,6835,633
24,350-
Number ofunits / shares
2011 2010
ABL Cash FundJS Cash FundCrosby Phoenix FundPICIC Income FundAtlas Money Market FundJS - Unit Trust of PakistanUTP Large Cap Fund - Class BUBL Liquidity Plus Fund - Class C
Unrealized gain on revaluation of investments
Listed - Mutual Funds (Open Ended)
10,000332,990
-10,00052,244
582757
50,000456,573
53,181509,754
Cost
11,091374,456
-11,09358,308
6622,129
52,015509,754
-509,754
Fair value
-429,958
46,135-
50,000511757
-527,361
11,761539,122
Cost
-434,025
51,256-
52,224582
1,035-
539,122
-539,122
Fair Value
Note 2011 2010Rs '000 Rs '000
13.3 56,000(17,750)38,250
71,000(17,750)53,250
13.2 Held to Maturity Investments - Related party Saudi Pak Leasing Company - COILess: Provision for impairment
13.3 Represents investments in Certificates of Investments (COIs) of Saudi Pak Leasing Company (the Leasing Company) – a related party, having face value of Rs. 56 million (2010: Rs. 71 million) carrying interest at the rate of 7% (2010: 13.5%) per annum.
The Leasing Company made default in repayment against COIs in August 2009 due to liquidity crunch induced by the stoppage of credit lines from the commercial banks/DFIs and impairment in repayment capacity of the lessees as reported in its half yearly financial statements for the period ended December 31, 2010. The Leasing Company proposed a restructuring schedule under which the COIs are repayable in 46 monthly installments. The Company has received Rs. 15 million (2010: 19 million) against the above investment. The management is actively pursuing the Leasing Company and is confident that the Company will recover its investment in due course. However, due to uncertainties involved, on the basis of prudence, Company continues to carry impairment provision of Rs 17.750 million in these financial statements.
55

Notes To The Financial StatementsFor the year ended June 30, 2011
With banks:
- in current accounts - in saving accounts - in deposit accounts
Cash in hand
Note 2011 2010Rs '000 Rs '000
14.114.214.3
47,1351,488,383
150,0001,685,518
16,8781,702,396
275,914601,740135,000
1,012,65413,522
1,026,176
14. CASH AND BANK BALANCES
14.1 Includes Rs. Nil (June 30, 2010: Rs. 255 million) deposited by the Company in Debt Reserve Account maintained for debt services under “Debt Reserve Account Agreement” entered into with IFC and OFID. The balance of the said account is now transferred to a savings account in the current year and carries profit at the rate of 11.95% per annum.
14.2 These carry profit at the rates ranging from 5 to 11.95 percent (2010: 5 to 11.5 percent) per annum.
14.3 These carry profit at the rates ranging from 10.65 to 12.90 percent (2010: 10.65 to 12.2 percent) per annum.
15. SHARE CAPITAL
15.1 Authorised capital
(Number of shares)2011 2010 2011 2010
Rs '000 Rs '000
1,820,000180,000
2,000,000
182,000,00018,000,000
200,000,000
182,000,00018,000,000
200,000,000
Ordinary shares of Rs.10/- each Preference shares of Rs. 10/- each
1,820,000180,000
2,000,000
15.2 Issued, subscribed and paid-up capital
(Number of shares)2011 2010 Note 2011 2010
Rs '000 Rs '000
637,612333,524
120,3961,091,532
180,000
1,271,532
63,761,20033,352,352
12,039,600109,153,152
18,000,000
127,153,152
63,761,20033,352,352
12,039,600109,153,152
18,000,000
127,153,152
Ordinary shares of Rs.10/- each
637,612333,524
120,3961,091,532
180,000
1,271,532
- fully paid in cash - issued as bonus shares - issued for consideration other than cash 15.2.1
Preference shares of Rs. 10/- each
- fully paid in cash 15.2.2 & 15.2.3
15.2.1. Represents shares issued in consideration for mobile harbour cranes, port equipment and a vehicle.
15.2.2. These are cumulative redeemable preference shares, issued in the ratio of 1 preference share for 3.54 ordinary shares held and carry a dividend of 10 percent on the issue price, redeemable 7 years after the issue date. The shareholders, inter alia, have the right to convert these into ordinary shares in the ratio of 1 ordinary share for 1 preference share held, if the Company fails to redeem these shares.
56

Notes To The Financial StatementsFor the year ended June 30, 2011
15.2.3 The above stated preference shares have been treated as part of equity on the following bases:
- The preference shares were issued under the provision of Section 86 of the Companies Ordinance, 1984 (the Ordinance) read with Section 90 of the Ordinance and the Companies Share Capital (Variation in Rights and Privileges) Rules, 2000.
- The authorised capital of the Company and the issue of the preference shares were duly approved by the shareholders of the Company at the Extraordinary General Meeting held on December 24, 2004.
- Return of allotment of shares was filed under Section 93(1) of the Ordinance.
- The Company is required to set-up a reserve for redemption of preference shares under Section 85 of the Ordinance in respect of the shares redeemed which effectively makes preference shares a part of equity.
- Dividend on the preference shares is appropriation of profit both under the Ordinance and the tax laws.
- The requirements of the Ordinance take precedence over the requirements of IFRSs.
- As stated in 15.2.2 above, shareholders have the right to convert these preference shares into ordinary shares or else retain their preference shares, provided that the Company shall pay the preferred dividend for each financial year following the expiry of the term date at the rate of 12% (instead of 10%) per annum on the face value.
- These preference shares are listed on the Karachi Stock Exchange.
However, considering the requirements of the IFRSs for classification of debt and equity instruments, which suggests that the above preference shares be classified as debt, the Company has sought a clarification from the SECP in respect of the presentation of preference shares in the financial statements prepared in accordance with the requirements of the Companies Ordinance, 1984. Pending the decision of the SECP in this matter, the preference shares have been reflected as equity of the Company.
15.3 Premier Mercantile Services (Private) Limited – a related party holds 38,544,040 ordinary shares (2010: 38,544,040 ordinary shares) of nominal value of Rs.10/- each representing 35.3 percent (2010: 35.3 percent) of the ordinary paid-up capital of the Company.
Jahangir Siddiqui & Company Limited – a related party holds 23,000,000 ordinary shares (2010: 24,000,000 ordinary shares) of nominal value of Rs.10/- each representing 21.07 percent (2010: 21.9 percent) of the ordinary paid-up capital of the Company.
15.4 The Company has entered into long term loan agreements with IFC and OFID. These agreements restrict the Company from declaring or paying any dividend on ordinary shares or making any distribution on its share capital (other than dividends or distributions payable in preference shares of the Company) unless agreed by IFC and OFID subject to certain conditions of the agreements.
57

Notes To The Financial StatementsFor the year ended June 30, 2011
International Finance Corporation (IFC)First Loan- Loan A- Loan C
Second LoanThird LoanFourth Loan
OPEC Fund for International Development (OFID)First LoanSecond LoanThird LoanFourth Loan
Less: - Unamortized transaction costs - Current maturity of long-term financing
2011 2010Rs '000 Rs '000
185,247129,075314,322309,78086,051
860,5001,570,653
185,247309,78032,269
258,150785,446
2,356,099
27,918475,285503,203
1,852,896
257,989128,400386,389376,640256,800856,000
1,875,829
257,989376,64096,300
256,800987,729
2,863,558
45,736519,782565,518
2,298,040
16. LONG-TERM FINANCING – secured
16.1.1 In addition to the above, IFC is entitled to additional interest to be computed at the rate of US Dollar 1.85 per TEU (Twenty Feet Equivalent Container Units) in excess of 150,000 TEUs per annum subject to cap of upto US Dollars 225,000 per annum upto year 2011 and progressively increasing to US Dollar 300,000 per annum upto year 2014.
16.1 The principal terms and conditions of the above loans are summarized as follows:
- Principal amount in US Dollars
- Interest rate per annum
- Repayment terms:• Number of installments• First installment• Last installment
IFC
7,750,000
LIBORplus 3.875%
18 semi-annualApril 15, 2005
October 15, 2013
Second Loan
Third Loan
Fourth LoanLoan CLoan A
First Loan
1,500,000
5%(Note 16.1.1)
2 equal installmentsApril 15, 2014
October 15, 2014
6,000,000
LIBORplus 3.375%
18 semi-annualJanuary 15, 2007
July 15, 2015
8,000,000
LIBORPlus 3.25%
16 semi-annualOctober 15, 2007
April 15, 2015
10,000,000
LIBORplus 3.125%
14 semi-annualJuly 15, 2011
January 15, 2018
- Principal amount in US Dollars
- Interest rate per annum
- Repayment terms:
• Number of installments• First installment• Last installment
OFID
Second Loan
Third Loan
Fourth Loan
6,000,000
LIBORplus 3.375%
18 semi-annualJanuary 15, 2007
July 15, 2015
3,000,000
LIBORPlus 3.25%
16 semi-annualOctober 15, 2007
April 15, 2015
3,000,000
LIBORplus 3.125%
14 semi-annualJuly 15, 2011
January 15, 2018
FirstLoan
7,750,000
LIBORplus 3.875%
18 semi-annualApril 15, 2005
October 15, 2013
58

Notes To The Financial StatementsFor the year ended June 30, 2011
16.1.2 The above loans are secured as follows:
IFC Loans (First Loan A , Second Loan, Third Loan and Fourth Loan) and OFID LoansThese loans are secured by way of a first equitable mortgage on land, building, equipments, immovable assets and leasehold interest in project site and first hypothecation over all other movable assets.
IFC Loan CThis loan is secured by way of a second equitable mortgage on land, building, equipments, immovable assets and leasehold interest in project site and second hypothecation over all other movable assets.
16.1.3 As discussed in note 35.1 to these financial statements, the Company has subsequently paid off the whole outstanding balance of loan as at 30 June 2011 by 22 July 2011.
17. LIABILITIES AGAINST ASSETS SUBJECT TO FINANCE LEASE
Represent finance leases entered into with leasing companies for Ship to Shore Crane (STS), Rubber Tyre Gantry Crane (RTG) and port equipments. Total lease rentals due under various lease agreements aggregate Rs. 187.731 (2010: Rs. 265.912) million and are payable in quarterly and six monthly installments latest by 2012. Overdue rental payments are subject to an additional charge upto 0.1 percent per day. Taxes, repairs, replacement and insurance costs are to be borne by the lessee. In case of termination of agreement, the lessee has to pay the entire rent for unexpired period. Financing rates of approximately 14.60 to 16.04 (2010: 14.60 to 15.01) percent per annum have been used as discounting factor. These lease obligations are based on six months KIBOR. Purchase options can be exercised by the lessee in accordance with the respective lease agreements.
17.1 The Company has entered into a cross currency interest rate swap agreement with a local commercial bank for a notional amount of Rs. 343.50 million, maturing up to July 2011. Under swap arrangement the principal payable amount of Rs. 343.750 million is swapped with US dollar component at Rs. 60.49 per US dollar making loan amount to US dollar 5.682 million. Besides foreign currency component, the Company would receive three months KIBOR rates and pay three months LIBOR and spread of 3.15% as per the respective arrangement, which will be settled quarterly. The swap is being used to hedge the exposure to change in the fair value of Company’s lease obligations which are based on KIBOR. The outstanding balance of this arrangement is Rs. 109.375 million as at the balance sheet date. The net fair value of this cross currency interest rate swap was Rs. 44.018 million unfavorable to the Company as of the balance sheet date. Subsequent to the year end, the Company has settled the aforesaid swap arrangement and paid-off the above outstanding liability.
Within one yearAfter one year but not more than five yearsMore than five years Total minimum lease paymentsLess: Amount representing finance chargesPresent value of minimum lease paymentsLess: Current portion
71,830115,901
-187,73114,337
173,39459,909
113,485
Minimumlease
Payments
Rs '000
59,909113,485
-173,394
-173,39459,909
113,485
PresentValue
79,512186,400
-265,91232,609
233,30359,909
173,394
Minimum lease
Payments
59,909173,394
-233,303
-233,30359,909
173,394
PresentValue
2011 2010
59

Notes To The Financial StatementsFor the year ended June 30, 2011
Taxable temporary differencesAccelerated tax depreciation / amortization allowance
Deductible temporary differencesProvision for compensated absencesProvision for doubtful debtsFair value loss on derivativeOthers
Note 2011 2010Rs '000 Rs '000
1,181,082
(12,225)(516)
(15,406)(65,629)
1,087,306
986,219
(10,020)(1,274)
(23,162)(6,970)
944,793
18. DEFERRED TAX LIABILITY
20.1 Includes Rs. 89.951 million (2010: Rs. 58.003 million) payable to Premier Mercantile Services (Private) Limited – a related party.
20.2 Includes Rs. 34.6 million (2010: Rs. 34.6 million) withheld by the company from handling and marshalling charges billed by KPT as fully explained in note 21.1.2.
21. CONTINGENCIES AND COMMITMENTS
21.1 Contingencies
21.1.1 During the year ended 30 June 2007, the Trustees of the Port of Karachi filed a civil suit against the Company in the Honorable High Court of Sindh alleging mis-declaration of the category of goods upon import of Quayside Container Crane and Rubber Tyre Gantry Cranes in the year 2004 and thereby claiming a sum of Rs. 101.5 million being additional wharfage charges and Rs. 203 million as penalty, with interest. According to the opinion of the legal counsel of the Company, there is no merit in this claim and hence there is a remote possibility that the case would be decided against the Company. Further, the legal counsel has also stated that, in any case, the penalty imposed will be disallowed by the Honorable High Court. In view thereof, no provision for any liability has been made in these financial statements.
Opening balanceAccrual for the yearLess: Encashments
Closing balance
28,6287,857
(1,557)
34,928
24,1525,024(548)
28,628
19. STAFF COMPENSATED ABSENCES
Trade Creditors
Due to Karachi Port TrustRoyaltyWharfageHandling and marshalling charges
Accrued expensesLegal and professional chargesSalaries and wagesOthers
Other liabilitiesAdvances from customersRetention moneySales tax payableFair value loss on derivatives Workers’ Welfare FundDividend payable Others
175,449
46,11444,368
34,554125,036
5,75091,1961,353
98,299
58,0209,959
48,84044,01843,445
2,0493,520
209,851608,635
152,375
42,64750,461
34,604127,712
5,28323,1301,525
29,938
35,27126,50539,02266,17730,6161,2827,819
206,692516,717
20. TRADE AND OTHER PAYABLES
20.1
20.2 &21.1.2
17.1
60

Notes To The Financial StatementsFor the year ended June 30, 2011
21.1.2 During the year ended 30 June 2007, the Company filed an interpleader civil suit against the Deputy District Officer, Excise and Taxation and the Trustees of the Port of Karachi (KPT) in the Honorable High Court of Sindh against the demand raised by the Deputy District Officer, Excise and Taxation under Section 14 of the Property Tax Act, 1958 to pay the property tax amounting to Rs. 34.6 million for the period from 2003 to 2007 out of the rent payable to KPT. The Honorable High Court of Sindh granted a stay order to Company ensuring that no coercive action is taken against the Company in due course until the case has been finalized. During the year ended June 30 2008, the Company has withheld the amount of Rs. 34.6 million from the handling and marshalling charges billed by KPT for the period from July 01, 2007 till December 31, 2007, in accordance with the Honorable High Court’s short order dated June 29, 2007. According to the opinion of the legal counsel of the Company, there is full merit in this case and the property tax imposed will be disallowed by the Honorable High Court. In view thereof, no provision for any liability has been made in these financial statements.
21.2.1 Commitments for capital expenditureCivil works Intangible assets
21.2.2 Letter of guarantees
21.2.3 Letters of credit
Note 2011 2010Rs '000 Rs '000
15,000 -15,000
86,050
16,624
15,0005,400
20,400
85,600
3,876
21.2 Commitments
TurnoverLess: Federal Excise Duty
Sales tax
6,878,333(571,230)(183,327)
6,123,776
5,739,637(466,940)(147,580)
5,125,117
22. TURNOVER - net
Salaries, wages and benefits Contracted labourStaff trainingRoyalty Handling and Marshalling chargesCrane usage chargesPort maintenanceStevedoring Custom sealsStorage charges Stores, spares and other maintenance chargesFuel consumedTravelling and conveyanceOffice maintenanceVehicles running expensesInsurancePrinting and stationeryUtilitiesDepreciation AmortizationOthers
363,11034,002
916560,356115,23929,16310,451
847,1434,700
33,185292,529576,030
2,93543,09510,42687,0213,8275,235
452,75113,68238,864
3,524,660
259,98124,460
956500,381111,50739,2051,370
776,1313,082
19,251222,266410,089
2,17431,6839,924
86,2453,2456,919
409,0873,672
20,4392,942,067
23. TERMINAL OPERATING COSTS
23.1
4.1.25.1.2
23.1 This includes Rs.8.77 (2010: Rs. 6.424) million in respect of staff retirement benefits and Rs. 4.49 (2010: Rs. 2.55) million in respect of compensated absences.
61

Notes To The Financial StatementsFor the year ended June 30, 2011
Note 2011 2010Rs '000 Rs '000
24. ADMINISTRATIVE EXPENSES
Salaries, wages and benefits Travelling and conveyanceAdvertising expenseAuditors' remunerationLegal and professional chargesOffice maintenanceVehicles running expensesSecurity expensesInsurance expenseCommunicationPrinting and stationeryUtilitiesDepreciation AmortisationFees and subscriptionEntertainmentDonationsProvision for doubtful debtsOthers
246,4626,7473,5173,211
13,79514,38613,2288,1322,9365,542
13,5082,492
61,73919,5574,819
16,67823,941
-10,385
471,075
162,2176,8254,2012,866
13,6799,8719,7174,6012,1834,988
11,9571,962
56,16319,2144,755
13,71810,055
9249,272
349,168
24.1
24.2
4.1.2 16
24.3
24.1 This includes Rs.6.45 (2010: Rs. 5.218) million in respect of staff retirement benefits and Rs. 3.40 (2010: Rs. 1.92) million in respect of compensated absences.
2011 2010Rs '000 Rs '000
24.2 Auditors' remuneration
Statutory audit feeFee for review of compliance with Code of
Corporate Governance and half yearly accountsTax and corporate advisory servicesOut of pocket expenses
1,400
5281,167
1163,211
1,100
4681,198
1002,866
24.3 Includes Rs.3.6 (2010: Rs. 2.50) million paid to Rabia Azeem Trust in which Capt. Haleem A. Siddiqui, Mr. Aasim Azim Siddiqui and Mr. Sharique Azim Siddiqui are Trustees and Rs. 11.392 (2010: Rs. Nil) million paid to Organization for Social Development Initiative in which Mr. Aasim Azim Siddiqui and Mr. Sharique Azim Siddiqui are Trustees. No other directors or their spouses have any interest in any donee’s fund to which donation was made.
2011 2010Rs '000 Rs '000
25. OTHER OPERATING INCOME
Income from financial assetsProfit on deposit accountsGain on re-measurement of investments
designated at fair value through profit or lossFair value gain on derivativesGain realised on disposal of investments
Income from non financial assetsDividend incomeGain on disposal of fixed assets Liabilities no longer payable written backOthers
118,092
53,18122,1581,505
194,936
513,907
22,17910
26,147
221,083
70,402
11,761 -12,98195,144
-739
-924
1,663
96,807
62

Notes To The Financial StatementsFor the year ended June 30, 2011
28.1
28.1 Relationship between tax expense and accounting profit
Profit Before tax
Tax at the applicable tax rate of 35%
Tax effect of expenses that are inadmissible in determining taxable income
Tax effect due to higher taxation rate
Tax effect of expenses that are admissible but not included in determining accounting profit
Net effect of income tax provision relating to prior years
Tax effect of taxable temporary differences
Tax effect of deductible temporary differences
2,128,813
745,085
208,128
30,209
(262,710)
11,732
236,289
(93,777)
874,956
1,520,960
532,336
206,326
-
(361,662)
38,682
292,876
(95,411)
613,147
Note 2011 2010Rs '000 Rs '000
26. FINANCE COSTS
Interest on long-term financingFinancial charges on leased assetsBank charges
120,87335,4711,975
158,319
147,20138,200
456185,857
27. OTHER CHARGES
Exchange loss on long term financingFair value loss on derivativesWorkers’ Welfare FundProvision for impairment
18,547 -
43,445 -
61,992
161,39511,94530,61619,916
223,872
28. TAXATION
Current Deferred Prior
720,712142,512
11,732874,956
377,000197,46538,682
613,147
29. EARNINGS PER SHARE
Profit after tax Preferred dividend on cumulative preference shares Profit after taxation attributable to ordinary shareholdersWeighted average number of ordinary shares in issue
during the year Numbers in ‘000
Basic earnings per share Rupees
1,253,857(18,000)
1,235,857
109,153
11.32
907,813(18,000)889,813
109,153
8.15
29.1 Basic earnings per share
63

Notes To The Financial StatementsFor the year ended June 30, 2011
2011 2010Rs '000 Rs '000
Profit after taxation attributable to ordinary shareholders Preferred dividend on cumulative preference shares
Weighted average number of ordinary shares in issue during the year Numbers in ‘000
Adjustment of preference shares Numbers in ‘000
Diluted earnings per share Rupees
1,235,85718,000
1,253,857
109,15318,000
127,153
9.86
889,81318,000
907,813
109,15318,000
127,153
7.14
29.2 Diluted earnings per share
30. FINANCIAL RISK MANAGEMENT OBJECTIVES AND POLICIES
The main risks arising from the Company’s financial instruments are credit risk, liquidity risk, foreign currency risk, interest rate risk and equity price risk. No changes made to the objectives and policies during the year ended 30 June 2011. The Board of Directors reviews and agrees policies for managing each of these risks which are summarised below.
30.1 Credit RiskCredit risk is the risk which arises with the possibility that one party to a financial instrument will fail to discharge its obligation and cause the other party to incur a financial loss. The Company attempts to control credit risk by monitoring credit exposures, limiting transactions with specific counterparties and continually assessing the creditworthiness of counterparties.
Concentrations of credit risk arise when a number of counterparties are engaged in similar business activities or have similar economic features that would cause their ability to meet contractual obligations to be similarly affected by changes in economic, political or other conditions. Concentrations of credit risk indicate the relative sensitivity of the Company’s performance to developments affecting a particular industry.
The Company is exposed to credit risk on long-term deposits, trade debts, advances, deposits, other receivables, investments and bank balances. The Company seeks to minimize the credit risk exposure through having exposures only to customers considered credit worthy and obtaining securities where applicable. The maximum exposure to credit risk at the reporting date is:
2011 2010Rs '000 Rs '000
Long-term depositsTrade debts - unsecuredAdvances - unsecuredDepositsOther receivables - unsecuredInvestmentsBank balances
83,705227,34069,7279,336
21,638548,004
1,685,5182,645,268
83,705237,35235,5649,214
30,181592,372
1,012,6542,001,042
Carrying Values
64

Notes To The Financial StatementsFor the year ended June 30, 2011
Quality of financial assets
The credit quality of financial assets that are neither past due nor impaired can be assessed by reference to external credit ratings or the historical information about counter party default rates as shown below:
2011 2010Rs '000 Rs '000
Customers with no defaults in the past one yearCustomers with some defaults in past one year which have been fully recovered
170,505
56,835227,340
154,174
50,347204,521
Carrying Values
30.1.1 Trade debts
2011 2010Rs '000 Rs '000
30.2 Liquidity RiskLiquidity risk is the risk that the company will not be able to meet its financial obligations as they fall due. The Company applies the prudent risk management policies by maintaining sufficient cash and bank balances and by keeping committed credit lines. The table below summarises the maturity profile of the Company's financial liabilities at the following reporting dates:
Year ended 30 June 2011
Long-term financing – securedLiabilities against assets subject to finance leaseTrade and other payablesAccrued interest on long-term financing
--
307,456-
307,456
Ondemand
Rs '000
148,743-
143,41429,654
321,811
Less than3 months
326,54259,90964,90721,633
543,829
3 to 12 months
1,561,196113,485
--
1,674,681
1 to 5years
319,616---
319,616
> 5 years
2,356,097173,394515,777
51,2873,096,479
Total
65
In Mutual Funds
Ratings by PACRA5 StarAA+(f)
Ratings by JCRA(f)A+(f)AA+(f)
Certificate of InvestmentRating by JCRD
2,79158,30861,099
-11,093
437,562
38,250486,905548,004
1,03552,80653,841
51,256 -434,025
53,250538,531592,372
30.1.2 Investments
A1A1+A2F1+WD
747,825920,11532,918
930220
1,702,008
596,398416,146
110 - -
1,012,654
30.1.3 Cash with Banks

Notes To The Financial StatementsFor the year ended June 30, 2011
2011 2010US$ '000 US$ '000
Long - term financingLiability under swap arrangementAccrued interest on long term financingTrade and other payables
27,381 2,324
596438
30,739
29,0533,357
649524
33,583
Year ended 30 June 2010
Long-term financing – securedLiabilities against assets subject to finance leaseTrade and other payablesAccrued interest on long-term financing
--
175,505-
175,505
Ondemand
Rs '000
--
135,23748,839
184,076
Less than3 months
519,78259,909
100,7767,060
687,527
3 to 12 months
245,349173,394
--
418,743
1 to 5years
2,098,427---
2,098,427
> 5 years
2,863,558233,303411,518
55,8993,564,278
Total
30.3 Foreign Currency RiskForeign currency risk is the risk that the value of financial assets or a financial liability will fluctuate due to a change in a foreign exchange rates. It arises mainly where receivables and payables exist due to transactions in foreign currency. The Company's exposure to foreign currency risk is as follows:
2011 2010
The following significant exchange rates have beenapplied at the reporting dates:
Exchange Rates 86.05 85.6
The foreign currency exposure is partly covered as the majority of the Company’s billing is determined in dollars which is converted into rupees at the exchange rate prevailing at the transaction date. The Company has assessed that hedging its foreign currency borrowings will be more expensive than assuming the risk itself.
Sensitivity analysis:
The following table demonstrates the sensitivity to a reasonably possible change in the US dollar exchange rate, with all other variables held constant, of the Company’s profit before tax and the Company’s equity.
30 June 2011
30 June 2010
(235,475)235,475
(287,470)287,470
(153,059)153,059
(186,856)186,856
Change inUS dollarrate (%)
Effect of translation of
foreign currency liabilities on
profit or (loss)Effect on
equity
+10-10+10-10
Rs '000
66

Notes To The Financial StatementsFor the year ended June 30, 2011
30.4 Interest rate risk
Interest rate risk is the risk that the fair value of future cash flows of a financial instrument will fluctuate because of changes in market interest rates. The Company's exposure to the risk of changes in market interest rates relates primarily to the Company's long-term debt obligations with floating interest rates.
To manage the interest rate risk on lease obligations, the Company has entered into cross currency interest rate swap agreement as disclosed in note 17.1 to these financial statements. At 30 June 2011, the Company’s entire borrowings are at floating rate of interest.
Sensitivity Analysis:
The following figures demonstrate the sensitivity to a reasonably possible change in interest rate, with all other variables held constant, of the Company’s profit before tax:
2011
USD LIBORUSD LIBOR
2010
USD LIBORUSD LIBOR
Increase / decrease in basis points
+15-15
+15-15
(27,809)27,809
(27,809)27,809
Effect on profit before tax
30.5 Equity price risk
Equity price risk is the risk that the fair value of future cashflows of financial instruments will fluctuate because of changes in market prices (other than those arising from interest rate risk or currency risk), whether those changes are caused by factors specific to the individual financial instrument or its issuer, or factors affecting all similar financial instruments traded in the market.
The Company's quoted equity securities are susceptible to market price risk arising from uncertainties about future values of the investment securities. The Company manages the equity price risk through diversification. Reports on the equity portfolio are submitted to the Company's Board of Directors on a regular basis. The Board of Directors review and approve all equity investment decisions.
The following table summarizes the Company's equity price risk as of 30 June 2011 and 2010. It shows the effects of an estimated increase of 5% in the equity market prices as on those dates. A decrease of 5% in the fair values of the quoted securities would affect profit and equity of the Company in a similar but opposite manner.
30 June 2011
30 June 2010
106
51.75
68.9
33.64
Price change
Effect onprofit forthe year
Effect on shareholders’
equity
5% increase
5% increase
Fair Value
2,129
1,035
Rs '000Rs '000
Rs '000
67

Notes To The Financial StatementsFor the year ended June 30, 2011
30.6 Capital risk management
The primary objective of the Company's capital management is to maintain healthy capital ratios, strong credit rating and optimal capital structures in order to ensure ample availability of finance for its existing and potential investment projects, to maximise shareholder value and reduce the cost of capital.
The Company manages its capital structure and makes adjustment to it, in light of changes in economic conditions. In order to maintain or adjust the capital structure, the Company may adjust the amount of dividends paid to shareholders, return capital to shareholders or issue new shares.
The Company monitors capital using a gearing ratio, which is net debt divided by total capital plus net debt. Net debt is calculated as total loans and borrowings including any finance cost thereon, trade and other payables, less cash and bank balances and investments. Capital signifies equity as shown in the balance sheet plus net debt.
The gearing ratios as at 30 June 2011 and 2010 were as follows:
2011 2010Rs '000 Rs '000
Long term financingTrade and other payablesAccrued interest / mark-up on borrowingsLiabilities against asset subject to finance leaseTotal debt
Less: Cash and bank balances Short term investments
Net debt
Share capitalUnappropriated profitEquity
Capital
Gearing ratio
2,328,181608,63551,287
173,3943,161,497
(1,702,396)(548,004)
911,097
1,271,5323,409,4184,680,950
5,592,047
16.29%
2,817,822516,71755,899
233,3033,623,741
(1,026,176)(592,372)
2,005,193
1,271,5322,446,4443,717,976
5,723,169
35.04%
The Company finances its investment portfolio through equity, borrowings and management of its working capital with a view to maintaining an appropriate mix between various sources of finance to minimise risk.
30.7 Fair value of financial instruments
Fair value is the amount for which an asset could be exchanged, or a liability settled, between knowledgeable willing parties in an arm’s length transaction.
Financial assets which are tradable in an open market are revalued at the market prices prevailing on the balance sheet date. The estimated fair value of all other financial assets and liabilities is considered not significantly different from book value.
The following table shows financial instruments recognized at fair value, analysed between those whose fair value is based on:
Level 1: Quoted prices in active markets for identical assets or liabilities
Level 2: Those involving inputs other than quoted prices included in Level 1 that are observable for the asset or liability, either directly (as prices) or indirectly (derived from prices); and
Level 3: Those whose inputs for the asset or liability that are not based on observable market date (unobservable inputs)
68

Notes To The Financial StatementsFor the year ended June 30, 2011
30 June 2011Investments designated at fair value through profit or loss
30 June 2010Investments designated at fair value through profit or loss
509,754509,754
539,122539,122
Total
509,754509,754
539,122539,122
Level 1
--
--
Level 2 Level 3
Rs '000
--
--
Financial assets measured at fair value
30 June 2011Fair value loss on derivative
30 June 2010Fair value loss on derivative
44,01844,018
66,17766,177
Total Level 1
--
--
Level 2 Level 3
Rs '000Financial assets measured at fair value
44,01844,018
66,17766,177
--
--
During the year ended 30 June 2011, there were no transfers between level 1 and level 2 fair value measurements, and no transfers into and out of level 3 fair value measurement.
31. REMUNERATION OF CHIEF EXECUTIVE, DIRECTORS AND EXECUTIVES
31.1 The aggregate amount, charged in the financial statements for the year is as follows:
Remuneration(including bonus)Housing rentRetirement benefitsMedical AllowanceUtilitiesConveyance
Number
61,8249,2732,5753,0913,0911,533
81,387
4
Directors
Rs '000
48,3159,6722,2533,2243,2241,705
68,393
40
Executives
15,2322,284
634762762280
19,954
1
53,7608,0642,2392,6882,688
93070,369
4
2011 2010
17,5172,628
730876876280
22,907
1
ChiefExecutive
33,3726,5851,6482,1952,1951,280
47,275
30
Directors ExecutivesChief
Executive
31.2 The Chief Executive, some of directors and executives of the Company are also provided with the use of the Company maintained car, club memberships and medical benefits in accordance with their terms of service.
31.3 The aggregate amount paid to the Directors as a fee for attending the Board of Director’s meetings amount to Rs. 0.214 million (2010: Rs. 0.014 million).
32. RELATED PARTIES TRANSACTIONS
The related parties include subsidiary, major shareholders, entities having directors in common with the Company, directors and other key management personnel. Transactions with related parties, other than remuneration and benefits to key management personnel under the terms of their employment and transactions with such related parties reflected elsewhere in these financial statements are as under:
69

Notes To The Financial StatementsFor the year ended June 30, 2011
2011 2010Rs '000 Rs '000
Subsidiary CompanyPakistan International Bulk Terminal (Private) Limited
Pre-commencement expenditure Issue of share capital
Major ShareholdersPremier Mercantile Services (Private) Limited
Stevedoring charges Storage charges Equipment charges
Entities having directors in common with the CompanyPremier Software (Private) Limited
Software maintenance chargesMarine Services (Private) Limited
Revenue from container handling Port Link International (Private) Limited
Revenue from container handling AMI Pakistan (Private) Limited
Revenue from container handling Travel Club (Private) Limited
Traveling expensesSaudi Pak Leasing Company Limited
Rollover of Certificate of InvestmentsRepayment of principal of Certificate of InvestmentsProfit on Certificate of investments
Rabia Azeem TrustDonation
Organization for Social Development InitiativeDonation
Staff retirement contribution planContribution to staff provident fund
-425,000
605,57233,18527,600
3,450
4,497
3,170
1,224
7,361
71,00015,0003,269
3,094
11,392
14,191
10,133 -
590,54933,67627,600
3,760
7,110
1,089
-
5,943
90,00019,0009,151
2,500
-
11,641
32.1 Balances outstanding with related parties have been disclosed in the respective notes to these financial statements.
32.2 The above transactions with related parties are entered into on arm’s length basis.
70

2011 2010Rs '000 Rs '000
Notes To The Financial StatementsFor the year ended June 30, 2011
33. CASH FLOWS FROM OPERATING ACTIVITIES
Profit before taxationAdjustments for non-cash items:
DepreciationAmortisation Accrual for staff compensated absencesFinance costs Unrealised exchange lossFair value (gain) / loss on derivativesUnrealised gain on investmentInterest incomeGain on disposal of fixed assets
ImpairmentProvision for doubtful debts
Operating profit before working capital changes
(Increase)/decrease in current assetsStores and sparesTrade debtsAdvances, deposits, prepayments and other receivables
Increase/(decrease) in current liabilitiesTrade payables and other liabilities
Cash generated from operations
2,128,813
514,49033,2397,857
158,3193,210
(22,158)(53,181)
(118,092)(3,907) - -
519,777 2,648,590
(39,705)10,01213,749
(15,944)2,632,646
143,775
2,776,421
1,520,960
465,25022,8865,024
185,850143,84711,945
(11,761)(70,402)
(739)19,916
924772,740
2,293,700
(47,171)150,694(30,776)72,747
2,366,447
7,859
2,374,306
34. DATE OF AUTHORISATION FOR ISSUE
These financial statements have been authorised for issue by the Board of Directors of the Company on August 29, 2011.
35. NON-ADJUSTING EVENTS AFTER THE BALANCE SHEET DATE
35.1 Subsequent to the year end, the Company has obtained a long term local currency loan facility upto Rs. 2,500 million from a commercial bank and has fully paid off the outstanding foreign currency loans amounting to Rs. 2,328 million as at June 30, 2011 which were payable in different installments by January 15, 2018. The foreign currency loans outstanding as at the year-end are shown as long term liability in these financial statements.
35.2 DIVIDENDS AND APPROPRIATIONS
35.2.1 The Board of Directors in its meeting held on 11 July 2011 has proposed to distribute 54.577 million ordinary shares (100% of the issued, subscribed and paid up capital) of its subsidiary company, Pakistan International Bulk Terminal (Private) Limited (PIBTL), having face value of Rs 10 each, to the members of the Company as ‘specie dividend’ in the ratio of 1:2, i.e. one ordinary share of PIBTL for every two ordinary shares held of the existing issued, subscribed and paid up capital of the Company. The members have approved the said distribution at the Extra Ordinary General Meeting (EOGM) held on 03 August 2011 thereby resulting in ceasing of the Company’s equity holding in PIBTL. These financial statements do not reflect this appropriation.
PIBTL was incorporated on 22 March 2010 as a private limited company fully owned by PICTL, with principal activities as terminal operator of coal, clinker and cement and other bulk cargo. PIBTL has not commenced its operations. The carrying value of the investment in subsidiary to be distributed at 30 June 2011 is Rs 425 million, and subsequent to the balance sheet date, PIBTL has further issued 12.077 million ordinary shares of Rs 10 to the Company, increasing the carrying
71

Notes To The Financial StatementsFor the year ended June 30, 2011
2011 2010Rs '000 Rs '000
Reclassification from depreciation expense to amortization expense
Reclassification from property, plant and equipment to intangible assets (Port Concession Rights) – written down value
352,299
3,656,828
301,096
3,501,719
amount to Rs 545.77 million. The fair value of the investment in subsidiary does not significantly differ from its carrying value.
According to section 25 of the Listing Regulations, a company distributing shares of its unlisted subsidiary company in the form of specie dividend, shall get such subsidiary company listed within a period of 120 days from the date of approval of such distribution. The Company, in pursuance of the above regulation, intends to apply to Karachi Stock Exchange (KSE) for the listing of PIBTL subsequent to the approval of distribution at EOGM held on 03 August 2011. However, in the event of non compliance with the above regulation, the KSE may suspend the trading of shares of the Company or it may be delisted. Furthermore, the Company will be obliged to encash the said shares, at the options of the recipients, at a price not less than the current breakup value or face value of the shares of PIBTL, whichever is higher, within 30 days from such non – compliance.
35.2.2 The Board of Directors in their board meeting held on 29 August 2011 have recommended a final cash dividend of Rs. 4.00/- - 40% per ordinary share amounting to Rs. 436.613 million (2010: Rs. 2.5/- - 25% per ordinary share amounting to Rs. 272.883 million) for the year ended 30 June 2011. The Directors have also proposed a final dividend for the year ended 30 June 2011 of Re.1.00 – 10% (2010: Re.1.00 – 10%) per preference share. The financial statements for the year ended 30 June 2011 do not include the effect of the final dividend which will be accounted for in the financial statements for the year ending 30 June 2012.
36. EXEMPTION FROM APPLICABILITY OF IFRIC – 12 “SERVICE CONCESSION ARRANGEMENTS”
As explained in note 2.1, the required mandatory disclosure is as follows:
Under IFRIC-12, the consideration required to be made by operator (the Company) for the right to use the asset is to be accounted for as an intangible asset under IAS – 38 “Intangible Assets”. If the Company were to follow IFRIC-12 and IAS-38, the effect on the financial statements would be as follows:
37. GENERAL
37.1 There were no material reclassifications that could affect the financial statements materially.
37.2 Amounts have been rounded off to the nearest thousand rupees unless otherwise stated.
Capt. Zafar Iqbal Awan Aasim Azim SiddiquiCHIEF EXECUTIVE DIRECTOR
72

75
76
77
78
79
80
81
Auditors’ Report to the Members
Consolidated Balance Sheet
Consolidated Profit and Loss Account
Consolidated Statement of Comprehensive Income
Consolidated Cash Flow Statement
Consolidated Statement of Changes in Equity
Notes to the Consolidated Financial Statements
Consolidated Financial Statements


Auditors' Report to the Members
75
We have audited the annexed consolidated financial statements comprising of consolidated balance sheet of PAKISTAN INTERNATIONAL CONTAINER TERMINAL LIMITED and its subsidiary company as at30 June 2011 and the related consolidated profit and loss account, consolidated statement of comprehensive income, consolidated cash flow statement and consolidated statement of changes in equity together with the notes forming part thereof, for the year then ended. We have also expressed separate opinion on the financial statements of Pakistan International Container Terminal Limited and Pakistan International Bulk Terminal (Private) Limited. These financial statements are the responsibility of the Holding Company's Management. Our responsibility is to express an opinion on theses financial statements, based on our audit.
Our audit was conducted in accordance with the International Standards on Auditing as applicable in Pakistan and accordingly includes such tests of accounting records and such other auditing procedures as we considered necessary in the circumstances.
In our opinion the consolidated financial statements present fairly the financial position of Pakistan International Container Terminal Limited and its subsidiary company as at 30 June 2011 and the results of their operations, comprehensive income, cash flows and changes in equity for the year then ended.
We draw attention to the contents of note 14.2.3 to the financial statements. As fully explained in the said note, preference shares have been treated as part of equity in view of the requirements of the Companies Ordinance, 1984 and the matter of its classification will be dealt with in accordance with the clarification from the Securities and Exchange Commission of Pakistan. Our report is not qualified in respect of this matter.
Karachi: August 29, 2011 Ernst & Young Ford Rhodes Sidat HyderCHARTERED ACCOUNTANTSAudit Engagement Partner: Riaz A. Rehman Chamdia

Capt. Zafar Iqbal Awan Aasim Azim SiddiquiCHIEF EXECUTIVE DIRECTOR
Consolidated Balance SheetAs at June 30, 2011
Note 2011 2010Rs '000 Rs '000
ASSETS
NON-CURRENT ASSETSProperty, plant and equipmentIntangible assetsLong-term deposits
CURRENT ASSETSStores and sparesTrade debtsAdvances - unsecured, considered goodDeposits and prepayments Other receivablesShort term investments Taxation - netCash and bank balances
TOTAL ASSETS
EQUITY AND LIABILITIES
SHARE CAPITAL AND RESERVESAuthorised capital
Issued, subscribed and paid-up capitalUnappropriated profit
NON-CURRENT LIABILITIESLong-term financing - securedLiabilities against assets subject to finance leaseDeferred tax liabilityStaff compensated absences
CURRENT LIABILITIESTrade and other payablesAccrued interestTaxation - netCurrent maturity of long-term financingCurrent maturity of liabilities against assets subject to finance lease
CONTINGENCIES AND COMMITMENTS
TOTAL EQUITY AND LIABILITIES
456
789101112
13
14.1
14.2
15
161718
19
15
16
20
5,951,51151,30783,705
6,086,523
340,791227,34069,72717,72421,638
548,004 -
1,718,8932,944,117
9,030,640
2,000,000
1,271,5323,407,4014,678,933
1,852,896
113,4851,083,680
34,9283,084,989
610,20951,28770,028
475,285
59,9091,266,718
9,030,640
5,800,33864,98983,705
5,949,032
301,086237,35235,56456,09320,048
592,37287,282
1,026,1762,355,973
8,305,005
2,000,000
1,271,5322,436,2613,707,793
2,298,040
173,394944,79328,628
3,444,855
516,76755,899 -
519,782
59,9091,152,357
8,305,005
The annexed notes from 1 to 36 form an integral part of these financial statements.
76

Consolidated Profit and Loss AccountFor the year ended June 30, 2011
Capt. Zafar Iqbal Awan Aasim Azim SiddiquiCHIEF EXECUTIVE DIRECTOR
Turnover-net
Terminal operating costs
Gross profit
Administrative expenses
Other operating income
Finance costs
Other charges
Profit before taxation
Taxation
Profit after taxation
Earnings per ordinary share - Basic
Earnings per ordinary share - Diluted
Note 2011 2010Rs '000 Rs '000
21
22
23
24
25
26
27
28.1
28.2
6,123,776
3,524,660
2,599,116
471,251
228,750
2,356,615
158,319
62,142
2,136,154
874,131
1,262,023
Rs. 11.40
Rs. 9.93
5,125,117
2,942,067
2,183,050
359,351
96,807
1,920,506
185,857
223,872
1,510,777
613,147
897,630(Restated)
Rs. 8.06(Restated)
Rs. 7.06
The annexed notes from 1 to 36 form an integral part of these financial statements.
77

Consolidated Statement Of Comprehensive IncomeFor the year ended June 30, 2011
Profit for the year after tax
Other comprehensive income – net of taxation
Total comprehensive income for the year – net of tax
Capt. Zafar Iqbal Awan Aasim Azim SiddiquiCHIEF EXECUTIVE DIRECTOR
2011 2010Rs '000 Rs '000
1,262,023
-
1,262,023
897,630
-
897,630
The annexed notes from 1 to 36 form an integral part of these financial statements.
78

Consolidated Cash Flow StatementFor the year ended June 30, 2011
Capt. Zafar Iqbal Awan Aasim Azim SiddiquiCHIEF EXECUTIVE DIRECTOR
The annexed notes from 1 to 36 form an integral part of these financial statements.
CASH FLOWS FROM OPERATIONSTaxes paidLeave encashment paidFinance costs paid
Net cash generated from operating activities
CASH FLOWS FROM INVESTING ACTIVITIESPurchase of property, plant and equipmentProceeds from sale of property, plant and equipmentPayment in relation to capital work-in-progressPurchase of Investments - netInterest received
Net cash used in investing activities
CASH FLOWS FROM FINANCING ACTIVITIESRepayment of long-term financing - netProceeds from issue of sharesDividends paid on preference sharesDividend paid on ordinary sharesSecurity deposits against leased assetsLease rentals paid
Net cash used in financing activities
Net increase in cash and cash equivalentsCash and cash equivalents at the beginning of the year
Cash and cash equivalents at the end of the year
Note 2011 2010Rs '000 Rs '000
32
13
2,766,486(603,386)
(1,557)(105,610)
2,055,933
(94,110)
6,671(602,078)(326,201)122,269
(893,449)
(523,498)425,000(18,000)
(272,883)-
(80,386)
(469,767)
692,717
1,026,176
1,718,893
2,374,306(404,236)
(548)(157,099)
1,812,423
(159,095)
3,576(421,229)(25,534)59,844
(542,438)
(485,186)-
(18,000)(139,252)
(172)(92,387)
(734,997)
534,988
491,188
1,026,176
79

Consolidated Statement Of Changes In EquityFor the year ended June 30, 2011
Capt. Zafar Iqbal Awan Aasim Azim SiddiquiCHIEF EXECUTIVE DIRECTOR
The annexed notes from 1 to 36 form an integral part of these financial statements.
Balance as at June 30, 2009
Profit for the yearOther comprehensive income, net of tax
Total comprehensive income
Bonus shares issued during the period in theratio of 1 ordinary share for every 5 shares held
Dividend on preference shares @10% for the year ended June 30, 2009
Interim dividend on ordinary shares @ 15% for the year ended June 30, 2010
Balance as at June 30, 2010
Profit for the yearOther comprehensive income, net of tax
Total comprehensive income
Dividend on preference shares @ 10% for the year ended June 30, 2010
Dividend on ordinary shares @ 25% for the year ended June 30, 2010
Balance as at June 30, 2011
909,610
--
-
181,922
-
-
1,091,532
--
-
-
-
1,091,532
180,000
--
-
-
-
-
180,000
--
-
-
-
180,000
1,874,994
897,630-
897,630
(181,922)
(18,000)
(136,441)
2,436,261
1,262,023-
1,262,023
(18,000)
(272,883)
3,407,401
2,964,604
897,630-
897,630
-
(18,000)
(136,441)
3,707,793
1,262,023-
1,262,023
(18,000)
(272,883)
4,678,933
Issued, subscribed andpaid-up capital
Ordinaryshares
Redeemablepreference
shares
Unappropriatedprofit
Total
Rs '000
80

Notes To The Consolidated Financial StatementsFor the year ended June 30, 2011
1. CORPORATE INFORMATION AND OPERATIONS
The “Group” consists of:
Holding Company
1.1. Pakistan International Container Terminal Limited (the Company) was incorporated in Pakistan as a private limited company in June 2002. Subsequently, it was converted to an unquoted public limited company and listed on the Karachi Stock Exchange on October 15, 2003. The registered office of the Company is situated at 2nd Floor, Business Plaza, Mumtaz Hassan Road, Karachi. The terminal office of the Company is located at berths 6 to 9, East Wharf, Kemari Road, Karachi Port.
1.2. The Company has a Build Operate Transfer (BOT) contract with Karachi Port Trust (KPT) for the exclusive construction, development, operations and management of a common user container terminal at Karachi Port for a period of twenty-one years commencing June 18, 2002.
Subsidiary Company
1.3. Pakistan International Bulk Terminal (Private) Limited (the Company) is a wholly owned subsidiary of Pakistan International Container Terminal Limited and was incorporated under the Companies Ordinance, 1984 (the Ordinance) on March 22, 2010 as a private limited company. The registered office of the Company is situated at 2nd Floor, Business Plaza, Mumtaz Hassan Road, Karachi. The Company is in start-up phase and has not commenced its operations. The principal activities of the Company will be business of container terminal operators, terminal operator of coal, clinker and cement and other bulk cargo etc.
2. BASIS OF PREPARATION
2.1 Statement of compliance
These consolidated financial statements have been prepared in accordance with approved accounting standards as applicable in Pakistan. Approved accounting standards comprise of such International Financial Reporting Standards (IFRSs) issued by the International Accounting Standards Board and Islamic Financial Accounting Standards (IFASs) issued by the Institute of Chartered Accountants of Pakistan as are notified under the Companies Ordinance, 1984, provisions of and directives issued under the Companies Ordinance, 1984. In case requirements differ, the provisions or directives of the Companies Ordinance, 1984 shall prevail.
The Securities and Exchange Commission of Pakistan in pursuance of the Circular No. 21 dated June 22, 2009 has given relaxation for the implementation of IFRIC 12 – “Service Concession Arrangements” due to the practical difficulties facing the companies till the conclusion of the agreements / letter of intent (LOI) entered on or before June 30, 2010 with the Government or other authority/entity.
2.2 Accounting convention
These consolidated financial statements have been prepared under the historical cost convention except for certain investments and derivatives which are carried at fair value as referred to in notes 3.7 and 3.20 below.
81

Notes To The Consolidated Financial StatementsFor the year ended June 30, 2011
2.3 Basis of consolidation
The consolidated financial statements comprise the financial statements of the holding company and its subsidiary (the group). The financial statements of the subsidiary are prepared for the same reporting period as of the holding company, using consistent accounting policies.
The assets and liabilities of subsidiary company have been consolidated on a line by line basis and the carrying value of investments held by the holding company is eliminated against the subsidiary’s shareholders’ equity in the consolidated financial statements.
All material intra-group balances, transactions, income and expenses and profits and losses resulting from intra-group transactions are eliminated in full.
2.4 New and amended standards and interpretations
The accounting policies adopted in the preparation of these financial statements are consistent with those of previous financial year except as disclosed below:
The Group has adopted the following new and amended IFRS and IFRIC interpretations which became effective during the year:
IFRS 2 – Group Cash-settled Share-based Payment Arrangements
IAS 32 – Financial Instruments: Presentation – Classification of Rights Issues (Amendment)
IFRIC 19 – Extinguishing Financial Liabilities with Equity InstrumentsImprovements to various standards issued by IASB
Issued in 2009
IFRS 5– Non-Current Assets Held for Sale and Discontinued OperationsIFRS 8– Operating SegmentsIAS 1 – Presentation of Financial StatementsIAS 7 – Statement of Cash flows Presentation of Financial StatementsIAS 17– LeasesIAS 36– Impairment of AssetsIAS 39– Financial Instruments : Recognition and Measurement
Issued in May 2010
IFRS 3 – Business CombinationsIAS 27 – Consolidated and Separate Financial Statements
The adoption of the above standards, amendments / improvements and interpretations did not have any material effect on the financial statements.
2.5 Standards, interpretations and amendments to approved accounting standards that are not yet effective:
The following revised standards and interpretations with respect to approved accounting standards as applicable in Pakistan would be effective from the dates mentioned below against the respective revised standard and interpretation:
82

Notes To The Consolidated Financial StatementsFor the year ended June 30, 2011
Standards or interpretation Effective date (accounting periods beginning on
or after)
IAS 1 – Presentation of Financial Statements -Amendments to revise the way other comprehensive 01 July 2012income is presented
IFRS 7 – Financial Instruments : Disclosures –Amendments enhancing disclosures about transfers of 01 July 2011financial assets
IAS 12 – Income Tax (Amendment) –Deferred Taxes : Recovery of Underlying Assets 01 January 2012
IAS 19 – Employee Benefits - Amended Standardresulting from the Post-Employment Benefits andTermination Benefits projects 01 January 2013
IAS 24 – Related Party Disclosures (Revised) 01 January 2011
IFRIC 14 – Prepayments of a Minimum FundingRequirement (Amendment) 01 January 2011
The Group expects that the adoption of the above revisions, amendments and interpretations of the standards will not have material effect the Group's financial statements in the period of initial application.
In addition to the above, amendments to various accounting standards have also been issued by the IASB. Such improvements are generally effective for accounting periods beginning on or after 01 January 2011. The Group expects that such improvements to the standards will not have any material impact on the Group's financial statements in the period of initial application.
Further, the following new standards have been issued by IASB which are yet to be notified by the Securities and Exchange Commission of Pakistan for the purpose of applicability in Pakistan.
IASB Effective date(annual periods beginning
Standard on or after)
IFRS 9 – Financial Instruments 01 January 2015
IFRS 10 – Consolidated Financial Statements 01 January 2013
IFRS 11 – Joint Arrangements 01 January 2013
IFRS 12 – Disclosure of Interests in Other Entities 01 January 2013
IFRS 13 – Fair Value Measurement 01 January 2013
83

Notes To The Consolidated Financial StatementsFor the year ended June 30, 2011
2.6. Significant accounting judgments, estimates and assumptions
The preparation of the Group’s financial statements requires management to make judgments, estimates and assumptions that affect the reported amounts of revenues, expenses, assets and liabilities, and the disclosure of contingent liabilities, at the end of the reporting period. However, uncertainty about these assumptions and estimates could result in outcomes that require a material adjustment to the carrying amount of the asset or liability affected in future periods.
In the process of applying the accounting policies, management has made the following estimates and judgments which are significant to the financial statements:
Property, plant and equipment and intangible assets
The Group reviews appropriateness of the rate of depreciation/amortization, useful life and residual value used in the calculation of depreciation/amortization. Further, where applicable, an estimate of the recoverable amount of assets is made for possible impairment on an annual basis. In making these estimates, the Group uses the technical resources available with the Group. Any change in the estimates in the future might affect the carrying amount of respective item of property, plant and equipment and intangible assets, with corresponding effects on the depreciation / amortization charge and impairment.
Stores and spares
The Group reviews the net realizable value of stores and spares to assess any diminution in the respective carrying values. Net realizable value is estimated with reference to the estimated selling price in the ordinary course of business less the estimated cost necessary to make the sale.
Trade debts
The Group reviews it’s doubtful trade debts at each reporting date to assess whether provision should be recorded in the profit and loss account. In particular, judgment by management is required in the estimation of the amount and timing of future cash flows when determining the level of provision required. Such estimates are based on assumptions about a number of factors and actual results may differ, resulting in future changes to the provisions.
Taxation
In making the estimate for income tax payable by the Group, the Group takes into account the applicable tax laws and the decision by appellate authorities on certain issues in the past.
Deferred tax assets are recognized for all unused tax losses and credits to the extent that it is probable that taxable profit will be available against which such losses and credits can be utilized. Significant management judgment is required to determine the amount of deferred tax assets that can be recognized, based upon the likely timing and level of future taxable profits together with future tax planning strategies.
Provision for impairment
The Group reviews carrying amount of assets annually to determine whether there is any indication of impairment. If any such indication exists, the assets recoverable
84

Notes To The Consolidated Financial StatementsFor the year ended June 30, 2011
amount is estimated and impairment losses are recognized in the profit and loss account.
Contingencies
The assessment of the contingencies inherently involves the exercise of significant judgment as the outcome of the future events cannot be predicted with certainty. The Group, based on the availability of the latest information, estimates the value of contingent assets and liabilities which may differ on the occurrence / non-occurrence of the uncertain future event(s).
3. SUMMARY OF SIGNIFICANT ACCOUNTING POLICIES
3.1. Fixed assets and depreciation
3.1.1 Property, plant and equipment
OwnedOperating property, plant and equipment are stated at cost less accumulated depreciation and accumulated impairment losses, if any.
Depreciation is charged to profit and loss using straight line method so as to write off the historical cost of the assets over their estimated useful lives at the rates specified in note 4.1 to these financial statements. Depreciation on additions is charged from the month in which the asset is available to use and on disposals up to the month the respective asset was in use. Assets residual values, useful lives and methods are reviewed, and adjusted, if appropriate, at each financial year end.
The carrying values of property, plant and equipment are reviewed at each reporting date for indication that an asset may be impaired and carrying values may not be recovered. If any such indication exists and where the carrying values exceed the estimated recoverable amount, the assets or cash generating units are written down to their recoverable amount. The recoverable amount of property, plant and equipment is the greater of net selling price and value in use.
Maintenance and normal repairs are charged to profit and loss as and when incurred. Major renewals and improvements, if any, are capitalized when it is probable that respective future economic benefits will flow to the Group.
An item of property, plant and equipment is derecognized upon disposal or when no future economic benefits are expected from its use. Gains and losses on disposals are determined by comparing proceeds with the carrying amount of the relevant assets. These are included in the profit and loss account in the period in which they arise.
LeasedAssets held under finance lease are stated at cost less accumulated depreciation and accumulated impairment losses, if any. These are accounted for by recording the asset at the lower of present value of minimum lease payments under the lease agreements and the fair value of asset acquired. The related obligation under the lease is accounted for as liability. Financial charges are allocated to the accounting period in a manner so as to provide a constant periodic rate of charge on the outstanding liability.
Depreciation is charged to the profit and loss using the same basis as for owned assets.
85

Notes To The Consolidated Financial StatementsFor the year ended June 30, 2011
3.1.2 Capital work-in-progress
These are stated at cost less accumulated impairment losses, if any. All expenditure connected with specific assets incurred during installation and construction period are carried under this head. These are transferred to specific assets as and when these assets are available for use.
3.2. Intangible assets
An intangible asset is recognized if it is probable that the future economic benefits that are attributable to the asset will flow to the enterprise and that the cost of such asset can also be measured reliably.
Costs incurred on the acquisition of computer software are capitalized and are amortized on straight line basis over their estimated useful life. Amortization is charged in the month in which the asset is put to use at the rates stated in note 5 to these financial statements.
Development expenditure incurred on the project is capitalized when its future recoverability can reasonably be regarded as assured. These are amortized over a period of five years on straight line basis commencing from the date of completion of the project, on a monthly pro-rata basis.
Useful lives of intangible assets are reviewed, at each financial year end and adjusted if appropriate.
The carrying value of intangible assets are reviewed for impairment at each financial year end when events or changes in circumstances, indicate that the carrying value may not be recoverable.
3.3. Borrowing costs
Borrowing costs that are directly attributable to the acquisition and construction of assets and incurred during the period in connection with the activities necessary to prepare the asset for its intended use are capitalized as a part of the cost of related asset.
All other borrowing costs are recognised as an expense in the period in which they are incurred.
3.4. Stores and spares
These are valued at lower of moving average cost and net realizable value. Provision is made for slow moving items where necessary to bring these down to approximate net realizable value and is recognised in income. Net realizable value is estimated with reference to the estimated selling price in the ordinary course of business less the estimated cost necessary to make the sale.
3.5. Trade debts
Trade debts originated by the Group are recognised and carried at original invoice amounts less an allowance for doubtful debts. Provision for doubtful debts is based on the management's assessment of customers' outstanding balances and creditworthiness. Bad debts are written-off when identified.
86

Notes To The Consolidated Financial StatementsFor the year ended June 30, 2011
3.6. Loans, advances and other receivables
After initial measurement these are carried at amortized cost less any allowance for impairment.
Gains and losses are recognised in the profit or loss when the loans, advances and other receivables are derecognised or impaired.
3.7. Investments
The investments of the Group, upon initial recognition, are classified as investment at fair value through profit or loss, held to maturity investment or available for sale investment, as appropriate. The Group determines the classification of its financial assets after initial recognition and, where allowed and appropriate, re-evaluates this designation at each financial year-end.
When investments are recognized initially, they are measured at fair value, plus, in the case of investments not at fair value through profit or loss, directly attributable transaction costs.
Investments at fair value through profit or lossFinancial assets at fair value through profit or loss includes financial assets held for trading and financial assets designated upon initial recognition as at fair value through profit or loss.
Investments which are acquired principally for the purpose of generating profit from short term fluctuations in price or dealer’s margin are classified as held for trading. After initial recognition, these are stated at fair values with any resulting gains or losses recognized directly in the profit and loss account. Transaction costs are charged to profit and loss account when incurred.
Held-to-maturity investmentsInvestments with fixed or determinable payments and fixed maturity where management has both the positive intent and ability to hold to maturity are classified as held to maturity and are stated at amortized cost using the effective interest method. Gains and losses are recognized in profit and loss account when the investments are derecognized or impaired, as well as through the amortization process.
Available for sale investmentsInvestments which are intended to be held for an indefinite period of time but may be sold in response to the need for liquidity or changes in interest rates are classified as available for sale. They are initially measured at fair value plus directly attributable transaction costs. After initial measurement, these are stated at fair values (except for unquoted investments where active market does not exist) with unrealized gains or losses recognized directly in other comprehensive income until the investment is disposed or determined to be impaired. At the time of disposal, the cumulative gain or loss previously recorded in other comprehensive income is recognized in the profit and loss account.
Fair value of investmentsThe fair value of investments that are actively traded in organized financial markets is determined by reference to quoted market bid prices at the close of business on the balance sheet date. For investments where there is no active market, fair value is determined using valuation techniques.
87

Notes To The Consolidated Financial StatementsFor the year ended June 30, 2011
3.8. Cash and cash equivalents
For the purpose of cash flow statement, cash and cash equivalents consist of cash in hand and balances with banks, cheques in hand, deposits held at call with banks and other short-term highly liquid investments with original maturities of three months or less.
3.9. Taxation
CurrentThe charge for current taxation is based on taxable income at the current rates of taxation after taking into account applicable tax credits, rebates and exemptions available, if any or on one percent of turnover under Section 113 of the Income Tax Ordinance, 2001, whichever is higher.
DeferredDeferred tax is recognized using the balance sheet liability method, on all temporary differences arising at the balance sheet date between the tax base of assets and liabilities and their carrying amounts for financial reporting purposes.
Deferred tax liabilities are recognized for all taxable temporary differences. Deferred tax assets are recognized for all deductible temporary differences to the extent that it is probable that the future taxable profits will be available against which the assets may be utilized. Deferred tax assets are reduced to the extent that it is no longer probable that the related tax benefit will be realized.
The carrying amount of deferred tax asset is reviewed at each balance sheet date and reduced to the extent that it is no longer probable that sufficient taxable profits will be available to allow all or part of the deferred tax asset to be recognized. Unrecognized deferred tax assets are reassessed at each balance sheet date and are recognized to the extent that it has become probable that future taxable profit will allow deferred tax asset to be recovered.
Deferred tax assets and liabilities are measured at the tax rates that are expected to apply to the period when the asset is realized or the liability is settled, based on the tax rates (and tax laws) that have been enacted or substantively enacted at the balance sheet date.
3.10. Interest-bearing loans and borrowings
All loans and borrowings are initially recognised at fair value less directly attributable transaction costs, and have not been designated ‘as at fair value through profit or loss’. After initial recognition, interest bearing loans and borrowings are subsequently measured at amortized cost using effective interest rate method.
Gains and losses are recognized in profit or loss when the liabilities are derecognized as well as through the amortization process.
3.11. Trade and other payables
Liabilities for trade and other amounts payable are carried at cost which is the fair value of the consideration to be paid in future for goods and services render whether or not billed to the Group.
88

Notes To The Consolidated Financial StatementsFor the year ended June 30, 2011
3.12. Provisions
Provisions are recognized when the Group has a present legal or constructive obligation as a result of past events and it is probable that an outflow of resources embodying economic benefits will be required to settle the obligation and a reliable estimate of the amount can be made. Provision are reviewed at each balance sheet date and adjusted to reflect the current best estimate.
3.13. Transactions with related parties
All transactions with related parties are carried out by the Group using the methods prescribed under the Ordinance.
3.14. Revenue
• Revenues from port operations are recognised when services are rendered;• Profit on deposits / saving accounts are recognised on time proportion basis; and• Dividend income is recognised when the Group’s right to receive the same is
established.
3.15. Staff retirement benefits
The Group operates an approved contributory provident fund for all eligible employees. Equal monthly contributions are made by the Group and the employees to the fund at the rate of 8.33% of the basic salary.
Contributions from the Group are charged to profit and loss account for the year.
3.16. Staff compensated absences
The Group provides for its estimated liability towards leaves accumulated by employees on an accrual basis using current salary levels.
3.17. Financial Instruments
Financial assets and financial liabilities are recognized at the time when the Group becomes a party to the contractual provisions of the instrument and are derecognised in case of assets, when the contractual rights under the instrument are realized, expire or surrendered and in case of liability, when the obligation is discharged, cancelled or expired.
3.18. Offsetting of financial assets and financial liabilities
A financial asset and a financial liability is offset and the net amount reported in the balance sheet, if the Group has the enforceable legal right to set off the transaction and also intends either to settle on net basis or to realize the asset and settle the liability simultaneously. Income and expense arising from such assets and liabilities are also offset accordingly.
3.19. Foreign currency translations
Foreign currency transactions are translated into Pakistani Rupee (functional currency) using the exchange rates ruling at the dates of the transactions. Monetary assets and liabilities in foreign currencies are re-translated into Pakistani Rupee using the exchange rate ruling at the balance sheet date. Foreign exchange gains and
89

Notes To The Consolidated Financial StatementsFor the year ended June 30, 2011
losses resulting from the settlement of such transactions and from the translations at the year-end exchange rates of monetary assets and liabilities denominated in foreign currencies are taken to profit and loss account currently.
3.20. Derivative financial instruments
The Group uses derivative financial instruments such as interest rate and cross currency swaps to hedge its risk associated with interest and exchange rate fluctuations. Such derivative financial instruments are initially recognized at fair value on the date on which a derivative contract is entered into and are subsequently re-measured at fair value. Derivatives with positive market values (unrealized gains) are included in other asset and derivatives with negative market values (unrealized losses) are included in other liabilities in the balance sheet. Any gains or losses arising from changes in fair value on derivatives during the year that do not qualify for hedge accounting are taken directly to the profit and loss account.
3.21. Dividend and other appropriation to reserves
Dividend and appropriation to reserves are recognized in the financial statements in the period in which these are approved.
3.22. Impairment
3.23 Financial assets
A financial asset is assessed at each reporting date to determine whether there is any objective evidence that it is impaired. A financial asset is considered to be impaired if objective evidence indicates that one or more events have had a negative effect of the estimated future cash flows of that asset.
3.23.1Non-financial assets
The carrying value of non-financial assets other than inventories and deferred tax assets are assessed at each reporting date to determine whether there is any indication of impairment. If any such indications exist, then the recoverable amount is estimated. An impairment loss is recognised, as an expense in the profit and loss account, for the amount by which an asset’s carrying amount exceeds it recoverable amount. The recoverable amount is the higher of an asset’s fair value less cost to sell and value in use. Value in use is determined through discounting of estimated future cash flows using a discount rate that reflects current market assessments of the time value of money and risk specific to the assets. For the purpose of assessing impairment, assets are grouped at the lowest levels for which they are separately identifiable cash flows (cash generating units).
3.23.2Functional and presentation currency
These financial statements are presented in Pakistani Rupee, which is the Group's functional and presentation currency
4. PROPERTY, PLANT AND EQUIPMENT
Note 2011 2010Rs '000 Rs '000
Operating fixed assets Capital work-in-progress
4.14.2
5,434,610516,901
5,951,511
5,346,132454,206
5,800,338
90

Notes To The Consolidated Financial StatementsFor the year ended June 30, 2011
4.1 The following is a statement of operating fixed assets:
Owned Leasehold improvementsPort improvementsMobile Harbour Crane Ship to Shore Cranes – STSGantry tracks Rubber Tyred GantryCranes – RTGPort equipment Port Power GenerationVehiclesComputers Furniture and fixturesOffice equipment
LeasedShip to Shore Cranes – STSRubber Tyred GantryCranes – RTGPort equipment
Total - 2011
289,5981,176,608
101,8192,007,164
12,254
1,545,030703,591301,806
93,57752,20633,60540,420
6,357,678
380,973
67,90842,747
491,628
6,849,306
As atJuly 01,
2010
Rs '000
82,260356,635
- - -
47,17013,37827,57035,69215,46623,248
4,317
605,736
-
--
-
605,736
-----
---
19,503---
19,503
-
--
-
19,503
371,8581,533,243
101,8192,007,164
12,254
1,592,200716,969329,376109,766
67,67256,85344,737
6,943,911
380,973
67,90842,747
491,628
7,435,539
56,598164,660101,819385,011
3,797
258,968210,748
92,28739,35740,16210,30420,798
1,384,509
82,728
13,51722,420
118,665
1,503,174
59,67085,574 -
123,193613
102,49352,13724,97619,347
8,9693,7843,581
484,337
23,087
4,0742,992
30,153
514,490
------
--
16,735---
16,735
-
--
-
16,735
116,268250,234101,819508,204
4,410
361,461262,885117,263
41,96949,13114,08824,379
1,852,111
105,815
17,59125,412
148,818
2,000,929
255,5901,283,009
-1,498,960
7,844
1,230,739454,084212,113
67,79718,54142,76520,358
5,091,800
275,158
50,31717,335
342,810
5,434,610
205-7.14
205-6.98
5
6-6.987-205- 10
2033.33
1010-20
5-6.06
67-20
Additions DisposalsAs at
June 30,2011
As atJuly 01,
2010
For theyear Disposals
As atJune 30,
2011
Writtendown value
as atJune 30,
2011
Deprate %
perannum
COST ACCUMULATED DEPRECIATION
2011
Owned Leasehold improvementsPort improvementsMobile Harbour Crane Ship to Shore Cranes – STSGantry tracks Rubber Tyred GantryCranes – RTGPort equipment Port Power GenerationVehiclesComputers Furniture and fixturesOffice equipment
LeasedShip to Shore Cranes – STSRubber Tyred GantryCranes – RTGPort equipment
Total - 2010
18,799581,722101,819
2,007,16412,254
1,545,030611,651228,610
72,60542,07023,10933,302
5,278,135
380,973
67,90842,747
491,628
5,769,763
As atJuly 01,
2009
Rs '000
270,799594,886
---
-91,94073,19630,90210,13610,496
7,118
1,089,473
-
--
-
1,089,473
-----
---
9,930---
9,930
-
--
-
9,930
289,5981,176,608
101,8192,007,164
12,254
1,545,030703,591301,806
93,57752,20633,60540,420
6,357,678
380,973
67,90842,747
491,628
6,849,306
15,910103,322101,819258,259
3,184
153,623163,558
75,07131,36931,375
7,20711,808
956,505
59,641
10,52518,346
88,512
1,045,017
40,68861,338
-126,752
613
105,34547,19017,21615,081
8,7873,0978,990
435,097
23,087
2,9924,074
30,153
465,250
-----
---
7,093---
7,093
-
--
-
7,093
56,598164,660101,819385,011
3,797
258,968210,748
92,28739,35740,16210,30420,798
1,384,509
82,728
13,51722,420
118,665
1,503,174
233,0001,011,948
-1,622,153
8,457
1,286,062492,843209,519
54,22012,04423,30119,622
4,973,169
298,245
54,39120,327
372,963
5,346,132
205-7.14
205-6.98
5
6-6.987-205- 10
2033.33
1010-20
5-6.06
67-20
Additions DisposalsAs at
June 30,2010
As atJuly 01,
2009
For theyear Disposals
As atJune 30,
2010
Writtendown value
as atJune 30,
2010
Deprate %
perannum
COST ACCUMULATED DEPRECIATION
2010
91

Notes To The Consolidated Financial StatementsFor the year ended June 30, 2011
4.1.1.Disposal of operating fixed assets:
Cost Accumulateddepreciation
Writtendownvalue
Rs '000Vehicles
Honda CityHonda City
Honda City
Honda CityHonda CityHonda CityHonda CityHonda CityHonda CitySuzuki BolanSuzuki Alto
Suzuki Alto
Suzuki Alto
Suzuki AltoDaihatsu CuoreMercedes BenzHonda AccordChanganChangan
846846
846
846846846846846
1,457150504
504
499
504434
5,3682,648
285382
19,503
169169
169
169169169169169995
-92
92
91
-654037
--
2,764
677677
677
677677677677677462150412
412
408
504369
5,3282,611
285382
16,739
169169
169
169169169169169
1,2406092
92
91
30065
2,1501,000
102127
6,671
--
-
-----
24560
-
-
-
300-
2,110 963
102 127
3,907
Group policyGroup policy
Group policy
Group policyGroup policyGroup policyGroup policyGroup policyNegotiationNegotiation
Group policy
Group policy
Group policy
NegotiationGroup policyNegotiationNegotiationNegotiationNegotiation
Mr. Muhammed Atiq (Employee)Mr. Muhammed Kamal(Employee)Mr. Pervaiz Ahmed Khan(Employee)Mr. Syed Ziauddin (Employee)Mr. Imran Moosa (Employee)Mr. Waqar Ali Khan (Employee)Mr. Safdar Abbas (Employee)Mr. Zahid Ahmed (Employee)Mr. Shamim Akhter (Third Party)Mr. Fazal Said (Third Party)Mr. Najeeb Khan Durrani(Employee)Mr. Shehbaz Ali Naveed(Employee)Mr. Rehan Mehmood Janjua(Employee)Mr. Hasnain Mirza (Employee)Mr. Zeshan Sabro (Employee) Mr. Sheeraz Ansari (Third Party)Mr. Yasir Mehmood (Third Party)Mr. Tahir Naeem (Employee)Mr. Baleeguddin Alvi (Employee)
SalesPrice
Gain Mode ofdisposal
Particulars of Buyer
4.1.2 Depreciation charge for the year has been allocated as under:
Note 2011 2010Rs '000 Rs '000
Terminal operating costsAdministrative expenses
2223
452,75161,739
514,490
409,08756,163
465,250
4.2 Capital work-in-progress
Civil worksAdvances to suppliers and contractors Consultancy and survey feesMobilization advance - for purchase of cranes and related equipments - for purchase / development of computer software
355,44772,59778,860
9,847150
516,901
314,502132,835
-
6,869-
454,206
92
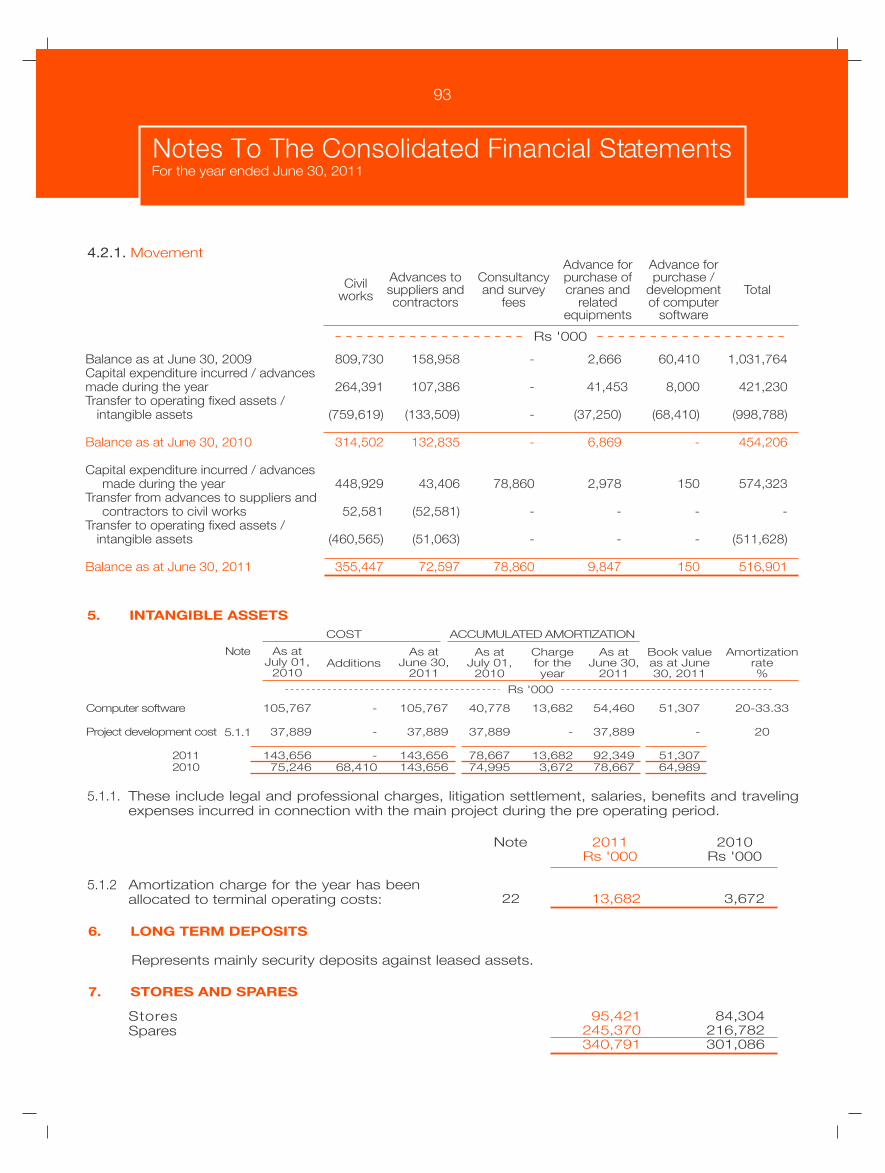
Notes To The Consolidated Financial StatementsFor the year ended June 30, 2011
5. INTANGIBLE ASSETS
Computer software
Project development cost
20112010
105,767
37,889
143,65675,246
As atJuly 01,
2010
Rs '000
-
-
-68,410
105,767
37,889
143,656143,656
40,778
37,889
78,66774,995
13,682
-
13,6823,672
54,460
37,889
92,34978,667
AdditionsAs at
June 30,2011
As atJuly 01,
2010
Chargefor theyear
As atJune 30,
2011
COST ACCUMULATED AMORTIZATION
5.1.1
Note
51,307
-
51,30764,989
Book valueas at June30, 2011
Amortizationrate%
20-33.33
20
5.1.1. These include legal and professional charges, litigation settlement, salaries, benefits and traveling expenses incurred in connection with the main project during the pre operating period.
4.2.1.Movement
Balance as at June 30, 2009Capital expenditure incurred / advances made during the yearTransfer to operating fixed assets / intangible assets
Balance as at June 30, 2010
Capital expenditure incurred / advances made during the year
Transfer from advances to suppliers and contractors to civil works
Transfer to operating fixed assets / intangible assets
Balance as at June 30, 2011
809,730
264,391
(759,619)
314,502
448,929
52,581
(460,565)
355,447
Civilworks
158,958
107,386
(133,509)
132,835
43,406
(52,581)
(51,063)
72,597
Advances tosuppliers andcontractors
2,666
41,453
(37,250)
6,869
2,978
-
-
9,847
Advance for purchase ofcranes and
related equipments
60,410
8,000
(68,410)
-
150
-
-
150
Advance for purchase /
development of computer
software
1,031,764
421,230
(998,788)
454,206
574,323
-
(511,628)
516,901
Total
-
-
-
-
78,860
-
-
78,860
Consultancy and survey
fees
Rs '000
5.1.2 Amortization charge for the year has been allocated to terminal operating costs:
Note 2011 2010Rs '000 Rs '000
22 13,682 3,672
6. LONG TERM DEPOSITS
Represents mainly security deposits against leased assets.
7. STORES AND SPARES
StoresSpares
95,421245,370340,791
84,304216,782301,086
93

Considered good
Considered doubtful
Less: Provision for doubtful debts
Note 2011 2010Rs '000 Rs '000
8.1 &8.2
8.3
227,340
1,475228,815
1,475227,340
237,352
3,641240,993
3,641237,352
8. TRADE DEBTS - Unsecured
8.1 The aging of trade debts at June 30 is as follows:
Neither past due nor impairedPast due but not impaired- within 90 days- 91 to 180 days- over 180 days
213,581
8,1155,644
-227,340
204,521
22,7264,1165,989
237,352
8.2 Includes Rs. 0.3 million (2010: Rs. 0.3 million) due from Marine Services (Private) Limited and Rs. Nil (2010: Rs. 0.313 million) due from Premier Mercantile Services (Private) Limited (related parties).
8.3 Movement of provision for doubtful debts
Opening balanceProvision for the yearWritten off during the year
3,641 -(2,166)1,475
4,810924
(2,093)3,641
- to employees - to suppliers
6,95262,77569,727
5,14930,41535,564
9. ADVANCES - unsecured, considered good
Security deposits Prepayments
- Insurance - Others
10,336
6736,715
17,724
1,043
15,6483,357
20,048
10. DEPOSITS AND PREPAYMENTS
Accrued profit on term depositsAccrued profit on certificate of investmentsOther receivables – considered good
1,34816,6883,602
21,638
1,04315,6483,357
20,048
11. OTHER RECEIVABLES
11.1
11.1 Accrued profit on certificate of investmentsLess: Provision for impairment
18,854(2,166)16,688
17,814(2,166)15,648
Notes To The Consolidated Financial StatementsFor the year ended June 30, 2011
94

Notes To The Consolidated Financial StatementsFor the year ended June 30, 2011
Designated at fair value through profit or lossHeld to maturity – Related party
Note 2011 2010Rs '000 Rs '000
12.112.2
509,75438,250
548,004
539,12253,250
592,372
12. SHORT TERM INVESTMENTS
12.1 Designated at fair value through profit or loss
1,160,9803,556,039
-107,415112,781
6,39324,350
519,048
-4,236,041
458,051-
101,6835,633
24,350-
Number ofunits / shares
2011 2011
ABL Cash FundJS Cash FundCrosby Phoenix FundPICIC Income FundAtlas Money Market FundJS - Unit Trust of PakistanUTP Large Cap Fund - Class BUBL Liquidity Plus Fund - Class C
Unrealized gain on revaluation of investments
Listed - Mutual Funds (Open Ended)
2011 2010
10,000332,990
-10,00052,244
582757
50,000456,573
53,181509,754
Cost
11,091374,456
-11,09358,308
6622,129
52,015509,754
-509,754
Fair value
-429,958
46,135-
50,000511757
-527,361
11,761539,122
Cost
-434,025
51,256-
52,224582
1,035-
539,122
-539,122
Fair Value
Note 2011 2010Rs '000 Rs '000
12.3 56,000(17,750)38,250
71,000(17,750)53,250
12.2 Held to Maturity Investments - Related party Saudi Pak Leasing Company - COILess: Provision for impairment
12.3 Represents investments in Certificates of Investments (COIs) of Saudi Pak Leasing Company (the Leasing Company) - a related party, having face value of Rs. 56 million (2010: Rs. 71 million) carrying interest at the rate of 7% (2010: 13.5%) per annum.
The Leasing Company made default in repayment against COIs in August 2009 due to liquidity crunch induced by the stoppage of credit lines from the commercial banks/DFIs and impairment in repayment capacity of the lessees as reported in its half yearly financial statements for the period ended December 31, 2010. The Leasing Company proposed a restructuring schedule under which the COIs are repayable in 46 monthly installments. The Holding Company has received Rs. 15 million (2010: 19 million) against the above investment. The management is actively pursuing the Leasing Company and is confident that the Holding Company will recover its investment in due course. However, due to uncertainties involved, on the basis of prudence, Holding Company continues to carry impairment provision of Rs 17.750 million in these financial statements.
Rs '000
95

Notes To The Consolidated Financial StatementsFor the year ended June 30, 2011
With banks:
- in current accounts - in saving accounts - in deposit accounts
Cash in hand
Note 2011 2010Rs '000 Rs '000
13.113.213.3
47,1401,504,868
150,0001,702,008
16,8851,718,893
275,914601,740135,000
1,012,65413,522
1,026,176
13. CASH AND BANK BALANCES
13.1 Includes Rs. Nil (2010: Rs. 255 million) deposited by the Holding Company in Debt Reserve Account maintained for debt services under “Debt Reserve Account Agreement” entered into with IFC and OFID. The balance of the said account is now transferred to a savings account in the current year and carries profit at the rate of 11.95% per annum.
13.2 These carry profit at the rates ranging from 5 to 11.95 percent (2010: 5 to 11.5 percent) per annum.
13.3 These carry profit at the rates ranging from 10.65 to 12.90 percent (2010: 10.65 to 12.2 percent) per annum.
14. SHARE CAPITAL
14.1 Authorised capital
(Number of shares)2011 2010 2011 2010
Rs '000 Rs '000
1,820,000180,000
2,000,000
182,000,00018,000,000
200,000,000
182,000,00018,000,000
200,000,000
Ordinary shares of Rs.10/- each Preference shares of Rs. 10/- each
1,820,000180,000
2,000,000
14.2 Issued, subscribed and paid-up capital
(Number of shares)2011 2010 Note 2011 2010
Rs '000 Rs '000
637,612333,524
120,3961,091,532
180,000
1,271,532
63,761,20033,352,352
12,039,600109,153,152
18,000,000
127,153,152
63,761,20033,352,352
12,039,600109,153,152
18,000,000
127,153,152
Ordinary shares of Rs.10/- each637,612333,524
120,3961,091,532
180,000
1,271,532
- fully paid in cash - issued as bonus shares - issued for consideration other than cash 14.2.1
Preference shares of Rs. 10/- each- fully paid in cash 14.2.2 & 14.2.3
14.2.1 Represents shares issued in consideration for mobile harbour cranes, port equipment and a vehicle.
14.2.2 These are cumulative redeemable preference shares, issued in the ratio of 1 preference share for 3.54 ordinary shares held and carry a dividend of 10 percent on the issue price, redeemable 7 years after the issue date. The shareholders, inter alia, have the right to convert these into ordinary shares in the ratio of 1 ordinary share for 1 preference share held, if the Holding Company fails to redeem these shares.
96
Notes To The Consolidated Financial StatementsFor the year ended June 30, 2011
14.2.3 The above stated preference shares have been treated as part of equity on the following bases:
- The preference shares were issued under the provision of Section 86 of the Companies Ordinance, 1984 (the Ordinance) read with Section 90 of the Ordinance and the Companies Share Capital (Variation in Rights and Privileges) Rules, 2000.
- The authorised capital of the Holding Company and the issue of the preference shares were duly approved by the shareholders of the Holding Company at the Extraordinary General Meeting held on December 24, 2004.
- Return of allotment of shares was filed under Section 93(1) of the Ordinance.
- The Holding Company is required to set-up a reserve for redemption of preference shares under Section 85 of the Ordinance in respect of the shares redeemed which effectively makes preference shares a part of equity.
- Dividend on the preference shares is appropriation of profit both under the Ordinance and the tax laws.
- The requirements of the Ordinance take precedence over the requirements of IFRSs.
- As stated in 14.2.2 above, shareholders have the right to convert these preference shares into ordinary shares or else retain their preference shares, provided that the Holding Company shall pay the preferred dividend for each financial year following the expiry of the term date at the rate of 12% (instead of 10%) per annum on the face value.
- These preference shares are listed on the Karachi Stock Exchange.
However, considering the requirements of the IFRSs for classification of debt and equity instruments, which suggests that the above preference shares be classified as debt, the Holding Company has sought a clarification from the SECP in respect of the presentation of preference shares in the financial statements prepared in accordance with the requirements of the Companies Ordinance, 1984. Pending the decision of the SECP in this matter, the preference shares have been reflected as equity of the Group.
14.3 Premier Mercantile Services (Private) Limited - a related party holds 38,544,040 ordinary shares (2010: 38,544,040 ordinary shares) of nominal value of Rs.10/- each representing 35.3 percent (2010: 35.3 percent) of the ordinary paid-up capital of the Group.
Jahangir Siddiqui & Company Limited - a related party holds 23,000,000 ordinary shares (2010: 24,000,000 ordinary shares) of nominal value of Rs.10/- each representing 21.07 percent (2010: 21.9 percent) of the ordinary paid-up capital of the Group.
14.4 The Holding Company has entered into long term loan agreements with IFC and OFID. These agreements restrict the Holding Company from declaring or paying any dividend on ordinary shares or making any distribution on its share capital (other than dividends or distributions payable in preference shares of the Holding Company) unless agreed by IFC and OFID subject to certain conditions of the agreements.
97

Notes To The Consolidated Financial StatementsFor the year ended June 30, 2011
International Finance Corporation (IFC)First Loan- Loan A- Loan C
Second LoanThird LoanFourth Loan
OPEC Fund for International Development (OFID)First LoanSecond LoanThird LoanFourth Loan
Less: - Unamortized transaction costs - Current maturity of long-term financing
2011 2010Rs '000 Rs '000
185,247129,075314,322309,78086,051
860,5001,570,653
185,247309,78032,269
258,150785,446
2,356,099
27,918475,285503,203
1,852,896
257,989128,400386,389376,640256,800856,000
1,875,829
257,989376,64096,300
256,800987,729
2,863,558
45,736519,782565,518
2,298,040
15. LONG-TERM FINANCING – secured
15.1 The principal terms and conditions of the above loans are summarized as follows:
- Principal amount in US Dollars
- Interest rate per annum
- Repayment terms:• Number of installments• First installment• Last installment
IFC
7,750,000
LIBORplus 3.875%
18 semi-annualApril 15, 2005
October 15, 2013
Second Loan
Third Loan
Fourth LoanLoan CLoan A
First Loan
1,500,000
5%(Note 15.1.1)
2 equal installmentsApril 15, 2014
October 15, 2014
6,000,000
LIBORplus 3.375%
18 semi-annualJanuary 15, 2007
July 15, 2015
8,000,000
LIBORPlus 3.25%
16 semi-annualOctober 15, 2007
April 15, 2015
10,000,000
LIBORplus 3.125%
14 semi-annualJuly 15, 2011
January 15, 2018
15.1.1 In addition to the above, IFC is entitled to additional interest to be computed at the rate of US Dollar 1.85 per TEU (Twenty Feet Equivalent Container Units) in excess of 150,000 TEUs per annum subject to cap of upto US Dollars 225,000 per annum upto year 2011 and progressively increasing to US Dollar 300,000 per annum upto year 2014.
- Principal amount in US Dollars
- Interest rate per annum
- Repayment terms:
• Number of installments• First installment• Last installment
OFID
Second Loan
Third Loan
Fourth Loan
6,000,000
LIBORplus 3.375%
18 semi-annualJanuary 15, 2007
July 15, 2015
3,000,000
LIBORPlus 3.25%
16 semi-annualOctober 15, 2007
April 15, 2015
3,000,000
LIBORplus 3.125%
14 semi-annualJuly 15, 2011
January 15, 2018
FirstLoan
7,750,000
LIBORplus 3.875%
18 semi-annualApril 15, 2005
October 15, 2013
98

Notes To The Consolidated Financial StatementsFor the year ended June 30, 2011
15.1.2 The above loans are secured as follows:
IFC Loans (First Loan A , Second Loan, Third Loan and Fourth Loan) and OFID LoansThese loans are secured by way of a first equitable mortgage on land, building, equipments, immovable assets and leasehold interest in project site and first hypothecation over all other movable assets.
IFC Loan CThis loan is secured by way of a second equitable mortgage on land, building, equipments, immovable assets and leasehold interest in project site and second hypothecation over all other movable assets.
15.1.3 As discussed in note 34.1 to these financial statements, the Group has subsequently paid off the whole outstanding balance of loan as at 30 June 2011 by 22 July 2011.
16. LIABILITIES AGAINST ASSETS SUBJECT TO FINANCE LEASE
Represent finance leases entered into with leasing companies for Ship to Shore Crane (STS), Rubber Tyre Gantry Crane (RTG) and port equipments. Total lease rentals due under various lease agreements aggregate Rs. 187.731 (2010: Rs. 265.912) million and are payable in quarterly and six monthly installments latest by 2012. Overdue rental payments are subject to an additional charge upto 0.1 percent per day. Taxes, repairs, replacement and insurance costs are to be borne by the lessee. In case of termination of agreement, the lessee has to pay the entire rent for unexpired period. Financing rates of approximately 14.60 to 16.04 (2010: 14.60 to 15.01) percent per annum have been used as discounting factor. These lease obligations are based on six months KIBOR. Purchase options can be exercised by the lessee in accordance with the respective lease agreements.
16.1 The Group has entered into a cross currency interest rate swap agreement with a local commercial bank for a notional amount of Rs. 343.50 million, maturing up to July 2011. Under swap arrangement the principal payable amount of Rs. 343.750 million is swapped with US dollar component at Rs. 60.49 per US dollar making loan amount to US dollar 5.682 million. Besides foreign currency component, the Group would receive three months KIBOR rates and pay three months LIBOR and spread of 3.15% as per the respective arrangement, which will be settled quarterly. The swap is being used to hedge the exposure to change in the fair value of Group's lease obligations which are based on KIBOR. The outstanding balance of this arrangement is Rs. 109.375 million as at the balance sheet date. The net fair value of this cross currency interest rate swap was Rs. 44.018 million unfavorable to the Group as of the balance sheet date. Subsequent to the year end, the Group has settled the aforesaid swap arrangement and paid-off the above outstanding liability.
Within one yearAfter one year but not more than five yearsMore than five years Total minimum lease paymentsLess: Amount representing finance chargesPresent value of minimum lease paymentsLess: Current portion
71,830115,901
-187,73114,337
173,39459,909
113,485
Minimumlease
Payments
Rs '000
59,909113,485
-173,394
-173,39459,909
113,485
PresentValue
79,512186,400
-265,91232,609
233,30359,909
173,394
Minimum lease
Payments
59,909173,394
-233,303
-233,30359,909
173,394
PresentValue
2011 2010
99

Notes To The Consolidated Financial StatementsFor the year ended June 30, 2011
Taxable temporary differencesAccelerated tax depreciation / amortization allowance
Deductible temporary differencesProvision for compensated absencesPre-incorporation expensesProvision for doubtful debtsFair value loss on derivativeOthers
Note 2011 2010Rs '000 Rs '000
1,181,082
(12,225)(3,626)
(516)(15,406)(65,629)
1,083,680
986,219
(10,020)-
(1,274)(23,162)(6,970)
944,793
17. DEFERRED TAX LIABILITY
19.1 Includes Rs. 89.951 million (2010: Rs. 58.003 million) payable to Premier Mercantile Services (Private) Limited – a related party.
19.2 Includes Rs. 34.6 (2010: Rs. 34.6) million withheld by the Holding Company from handling and marshalling charges billed by KPT as fully explained in note 20.1.2.
20. CONTINGENCIES AND COMMITMENTS
20.1 Contingencies
20.1.1 During the year ended 30 June 2007, the Trustees of the Port of Karachi filed a civil suit against the Holding Company in the Honorable High Court of Sindh alleging mis-declaration of the category of goods upon import of Quayside Container Crane and Rubber Tyred Gantry Cranes in the year 2004 and thereby claiming a sum of Rs. 101.5 million being additional wharfage charges and Rs 203 million as penalty, with interest. According to the opinion of the legal counsel of the Holding Company, there is no merit in this claim and hence there is a remote possibility that the case would be decided against the Holding Company. Further, the legal counsel has also stated that, in any case, the penalty imposed will be disallowed by the Honorable High Court. In view thereof, no provision for any liability has been made in these financial statements.
Opening balanceAccrual for the yearLess: Encashments
Closing balance
28,6287,857
(1,557)
34,928
24,1525,024(548)
28,628
18. STAFF COMPENSATED ABSENCES
Trade Creditors
Due to Karachi Port TrustRoyaltyWharfageHandling and marshalling charges
Accrued expensesLegal and professional chargesSalaries and wagesOthers
Other liabilitiesAdvances from customersRetention moneySales tax payableFair value loss on derivatives Workers’ Welfare FundDividend payable Others
175,449
46,11444,36834,554
125,036
5,90091,1961,353
98,449
58,0209,959
48,84044,01843,595
2,0494,794
211,275610,209
152,375
42,64750,46134,604
127,712
5,28323,1301,525
29,938
35,27126,50539,02266,17730,6161,2827,819
206,692516,717
19. TRADE AND OTHER PAYABLES
19.1
19.2 & 20.1.2
100

Notes To The Consolidated Financial StatementsFor the year ended June 30, 2011
20.1.2During the year ended 30 June 2007, the Holding Company filed a interpleader civil suit against the Deputy District Officer, Excise and Taxation and the Trustees of the Port of Karachi (KPT) in the Honorable High Court of Sindh against the demand raised by the Deputy District Officer, Excise and Taxation under Section 14 of the Property Tax Act, 1958 to pay the property tax amounting to Rs. 34.6 million for the period from 2003 to 2007 out of the rent payable to KPT. The Honorable High Court of Sindh granted a stay order to Holding Company ensuring that no coercive action is taken against the Holding Company in due course until the case has been finalized. During the year ended June 30 2008, the Holding Company has withheld the amount of Rs. 34.6 million from the handling and marshalling charges billed by KPT for the period from July 01, 2007 till December 31, 2007, in accordance with the Honorable High Court's short order dated June 29, 2007. According to the opinion of the legal counsel of the Holding Company, there is full merit in this case and the property tax imposed will be disallowed by the Honorable High Court. In view thereof, no provision for any liability has been made in these financial statements.
20.2.1 Commitments for capital expenditureCivil works Intangible assets
20.2.2 Letter of guarantees
20.2.3 Letters of credit
Note 2011 2010Rs '000 Rs '000
15,000 -15,000
300,300
16,624
15,0005,400
20,400
85,600
3,876
20.2 Commitments
TurnoverLess: Federal Excise Duty
Sales tax
6,878,333(571,230)(183,327)
6,123,776
5,739,637(466,940)(147,580)
5,125,117
21. TURNOVER - net
Salaries, wages and benefits Contracted labourStaff trainingRoyalty Handling and Marshalling chargesCrane usage chargesPort maintenanceStevedoring Custom sealsStorage charges Stores, spares and other maintenance chargesFuel consumedTravelling and conveyanceOffice maintenanceVehicles running expensesInsurancePrinting and stationeryUtilitiesDepreciation AmortizationOthers
363,11034,002
916560,356115,23929,16310,451
847,1434,700
33,185292,529576,030
2,93543,09510,42687,0213,8275,235
452,75113,68238,864
3,524,660
259,98124,460
956500,381111,50739,2051,370
776,1313,082
19,251222,266410,089
2,17431,6839,924
86,2453,2456,919
409,0873,672
20,4392,942,067
22. TERMINAL OPERATING COSTS
22.1
4.1.25.1.2
22.1 This includes Rs.8.77 (2010: Rs. 6.424) million in respect of staff retirement benefits and Rs. 4.49 (2010: Rs. 2.55) million in respect of compensated absences.
101

Notes To The Consolidated Financial StatementsFor the year ended June 30, 2011
Note 2011 2010Rs '000 Rs '000
23. ADMINISTRATIVE EXPENSES
Salaries, wages and benefits Travelling and conveyanceAdvertising expenseAuditors' remunerationLegal and professional chargesOffice maintenanceVehicles running expensesSecurity expensesInsurance expenseCommunicationPrinting and stationeryUtilitiesDepreciation Amortisation Fees and subscriptionEntertainmentDonationsProvision for doubtful debtsOthers
246,4626,7473,5173,387
13,79514,38613,2288,1322,9365,542
13,5082,492
61,73919,5574,819
16,67823,941 -
10,385471,251
162,2176,8254,2012,916
23,8129,8719,7174,6012,1834,988
11,9571,962
56,16319,2144,755
13,71810,055
9249,272
359,351
23.1
23.2
4.1.3 15
23.3
23.1 This includes Rs.6.45 (2010: Rs. 5.218) million in respect of staff retirement benefits and Rs. 3.40 (2010: Rs. 1.92) million in respect of compensated absences.
2011 2010Rs '000 Rs '000
23.2 Auditors' remuneration
Statutory audit feeFee for review of compliance with Code of
Corporate Governance and half yearly accountsTax and corporate advisory servicesOut of pocket expenses
1,550
5531,167
1173,387
1,150
4681,198
1002,916
23.3 Includes Rs.3.6 (2010: Rs. 2.50) million paid to Rabia Azeem Trust in which Capt. Haleem A. Siddiqui, Mr. Aasim Azim Siddiqui and Mr. Sharique Azim Siddiqui are Trustees and Rs. 11.392 (2010: Rs. Nil) million paid to Organization for Social Development Initiative in which Mr. Aasim Azim Siddiqui and Mr. Sharique Azim Siddiqui are Trustees. No other directors or their spouses have any interest in any donee’s fund to which donation was made.
2011 2010Rs '000 Rs '000
24. OTHER OPERATING INCOME
Income from financial assetsProfit on deposit accountsGain on re measurement of investments
at fair value through profit or lossFair value gain on derivativesGain realised on disposal of investments
Income from non financial assetsDividend incomeProfit on sale of fixed assets Liabilities no longer payable written backOthers
125,759
53,18122,1581,505
202,603
513,907
22,17910
26,147
228,750
70,402
11,761 -12,98195,144
-739
-924
1,663
96,807
102

Notes To The Consolidated Financial StatementsFor the year ended June 30, 2011
Profit after tax Preferred dividend on cumulative preference shares
Profit after taxation attributable to ordinary shareholdersWeighted average number of ordinary shares in issue
during the year Numbers in ‘000
Basic earnings per share Rupees
Note 2011 2010Rs '000 Rs '000
25. FINANCE COSTS
Interest on long-term financingFinancial charges on leased assetsBank charges
120,87335,4711,975
158,319
147,20138,200
456185,857
27.1
27.1 Relationship between tax expense and accounting profit
Profit Before tax
Tax at the applicable tax rate of 35%
Tax effect of expenses that are inadmissible in determining taxable income
Tax effect due to higher taxation rate
Tax effect of expenses that are admissible but not included in determining accounting profit
Net effect of income tax provision relating to prior years
Tax effect of taxable temporary differences
Tax effect of deductible temporary differences
2,136,154
747,654
208,208
30,361
(262,710)
11,732
236,289
(97,403)
874,131
1,510,777
528,772
206,326
-
(361,662)
38,682
296,440
(95,411)
613,147
26. OTHER CHARGES
Exchange loss on long term financingFair value loss on derivativesWorkers’ Welfare FundProvision for impairment
18,547 -
43,595 -62,142
161,39511,94530,61619,916
223,87227. TAXATION
Current Deferred Prior
723,513138,88611,732
874,131
373,436201,02938,682
613,147
28. EARNINGS PER SHARE
1,262,023(18,000)
1,244,023
109,153
11.40
897,630(18,000)
879,630
109,153
8.06
28.1 Basic earnings per share
103

Notes To The Consolidated Financial StatementsFor the year ended June 30, 2011
2011 2010Rs '000 Rs '000
Profit after taxation attributable to ordinary shareholders Preferred dividend on cumulative preference shares
Weighted average number of ordinary shares in issue during the year Numbers in ‘000
Adjustment of preference shares Numbers in ‘000
Diluted earnings per share Rupees
1,244,02318,000
1,262,023
109,15318,000
127,153
9.93
879,63018,000
897,630
109,15318,000
127,153
7.06
28.2 Diluted earnings per share
29. FINANCIAL RISK MANAGEMENT OBJECTIVES AND POLICIES
The main risks arising from the Group's financial instruments are credit risk, liquidity risk, foreign currency risk, interest rate risk and equity price risk. No changes made to the objectives and policies during the year ended 30 June 2011. The Board of Directors reviews and agrees policies for managing each of these risks which are summarised below.
29.1 Credit RiskCredit risk is the risk which arises with the possibility that one party to a financial instrument will fail to discharge its obligation and cause the other party to incur a financial loss. The Group attempts to control credit risk by monitoring credit exposures, limiting transactions with specific counterparties and continually assessing the creditworthiness of counterparties.
Concentrations of credit risk arise when a number of counterparties are engaged in similar business activities or have similar economic features that would cause their ability to meet contractual obligations to be similarly affected by changes in economic, political or other conditions. Concentrations of credit risk indicate the relative sensitivity of the Group's performance to developments affecting a particular industry.
The Group is exposed to credit risk on long-term deposits, trade debts, advances, deposits, other receivables, investments and bank balances. The Group seeks to minimize the credit risk exposure through having exposures only to customers considered credit worthy and obtaining securities where applicable. The maximum exposure to credit risk at the reporting date is:
2011 2010Rs '000 Rs '000
Long-term depositsTrade debts - unsecuredAdvances - unsecuredDepositsOther receivables - unsecuredInvestmentsBank balances
83,705227,34069,72710,33621,638
548,0041,702,0082,662,758
83,705237,35235,5649,214
30,181592,372
1,012,6542,001,042
Carrying Values
104

Notes To The Consolidated Financial StatementsFor the year ended June 30, 2011
Quality of financial assets
The credit quality of financial assets that are neither past due nor impaired can be assessed by reference to external credit ratings or the historical information about counter party default rates as shown below:
2011 2010Rs '000 Rs '000
Customers with no defaults in the past one yearCustomers with some defaults in past one year which have been fully recovered
170,505
56,835227,340
154,174
50,347204,521
Carrying Values
29.1.1 Trade debts
2011 2010Rs '000 Rs '000
In Mutual Funds
Ratings by PACRA5 StarAA+(f)
Ratings by JCRA(f)A+(f)AA+(f)
Certificate of InvestmentRating by JCRD
2,79158,30861,099
-11,093
437,562
38,250486,905548,004
1,03552,80653,841
51,256 -434,025
53,250538,531592,372
29.1.2 Investments
A1A1+A2F1+WD
747,825920,11532,918
930220
1,702,008
596,398416,146
110 - -
1,012,654
29.1.3 Cash with Banks
29.2 Liquidity RiskLiquidity risk is the risk that the company will not be able to meet its financial obligations as they fall due. The Group applies the prudent risk management policies by maintaining sufficient cash and bank balances and by keeping committed credit lines. The table below summarises the maturity profile of the Group's financial liabilities at the following reporting dates:
Year ended 30 June 2011
Long-term financing – securedLiabilities against assets subject to finance leaseTrade and other payablesAccrued interest on long-term financing
--
308,935-
308,935
Ondemand
Rs '000
148,743-
143,41429,654
321,811
Less than3 months
326,54259,90965,00321,633
543,829
3 to 12 months
1,561,196113,485
--
1,674,681
1 to 5years
319,616---
319,616
> 5 years
2,356,097173,394517,352
51,2873,098,130
Total
105

Notes To The Consolidated Financial StatementsFor the year ended June 30, 2011
2011 2010US$ '000 US$ '000
Long - term financingLiability under swap arrangementAccrued interest on long term financingTrade and other payables
27,381 2,324
596438
30,739
29,0533,357
649524
33,583
Year ended 30 June 2010
Long-term financing – securedLiabilities against assets subject to finance leaseTrade and other payablesAccrued interest on long-term financing
--
185,688-
185,688
Ondemand
Rs '000
--
135,23748,839
184,076
Less than3 months
519,78259,909
100,7767,060
687,527
3 to 12 months
245,349173,394
--
418,743
1 to 5years
2,098,427---
2,098,427
> 5 years
2,863,558233,303421,701
55,8993,574,461
Total
29.3 Foreign Currency RiskForeign currency risk is the risk that the value of financial assets or a financial liability will fluctuate due to a change in a foreign exchange rates. It arises mainly where receivables and payables exist due to transactions in foreign currency. The Group's exposure to foreign currency risk is as follows:
2011 2010
The following significant exchange rates have beenapplied at the reporting dates:
Exchange Rates 86.05 85.6
The foreign currency exposure is partly covered as the majority of the Group's billing is determined in dollars which is converted into rupees at the exchange rate prevailing at the transaction date. The Group has assessed that hedging its foreign currency borrowings will be more expensive than assuming the risk itself.
Sensitivity analysis:
The following table demonstrates the sensitivity to a reasonably possible change in the US dollar exchange rate, with all other variables held constant, of the Group's profit before tax and the Group's equity.
30 June 2011
30 June 2010
(235,475)235,475
(287,470)287,470
(153,059)153,059
(186,856)186,856
Change inUS dollarrate (%)
Effect of translation of
foreign currency liabilities on
profit or (loss)Effect on
equity
+10-10+10-10
Rs '000
106

29.4 Interest rate risk
Interest rate risk is the risk that the fair value of future cash flows of a financial instrument will fluctuate because of changes in market interest rates. The Group's exposure to the risk of changes in market interest rates relates primarily to the Group's long-term debt obligations with floating interest rates.
To manage the interest rate risk on lease obligations, the Group has entered into cross currency interest rate swap agreement as disclosed in note 16.1 to these financial statements. At 30 June 2011, the Group's entire borrowings are at floating rate of interest.
Sensitivity Analysis:
The following figures demonstrate the sensitivity to a reasonably possible change in interest rate, with all other variables held constant, of the Group's profit before tax:
2011
USD LIBORUSD LIBOR
2010
USD LIBORUSD LIBOR
Increase / decrease in basis points
+15-15
+15-15
Rs '000
(27,809)27,809
(27,809)27,809
Effect on profit before tax
29.5 Equity price risk
Equity price risk is the risk that the fair value of future cashflows of financial instruments will fluctuate because of changes in market prices (other than those arising from interest rate risk or currency risk), whether those changes are caused by factors specific to the individual financial instrument or its issuer, or factors affecting all similar financial instruments traded in the market.
The Group's quoted equity securities are susceptible to market price risk arising from uncertainties about future values of the investment securities. The Group manages the equity price risk through diversification. Reports on the equity portfolio are submitted to the Group's Board of Directors on a regular basis. The Board of Directors review and approve all equity investment decisions.
The following table summarizes the Group's equity price risk as of 30 June 2011 and 2010. It shows the effects of an estimated increase of 5% in the equity market prices as on those dates. A decrease of 5% in the fair values of the quoted securities would affect profit and equity of the Group in a similar but opposite manner.
30 June 2011
30 June 2010
106
51.75
68.9
33.64
Price change
Effect onprofit forthe year
Effect on shareholders’
equity
5% increase
5% increase
Fair Value
2,129
1,035
Rs '000Rs '000
Notes To The Consolidated Financial StatementsFor the year ended June 30, 2011
107

Notes To The Consolidated Financial StatementsFor the year ended June 30, 2011
29.6 Capital risk management
The primary objective of the Group's capital management is to maintain healthy capital ratios, strong credit rating and optimal capital structures in order to ensure ample availability of finance for its existing and potential investment projects, to maximise shareholder value and reduce the cost of capital.
The Group manages its capital structure and makes adjustment to it, in light of changes in economic conditions. In order to maintain or adjust the capital structure, the Group may adjust the amount of dividends paid to shareholders, return capital to shareholders or issue new shares.
The Group monitors capital using a gearing ratio, which is net debt divided by total capital plus net debt. Net debt is calculated as total loans and borrowings including any finance cost thereon, trade and other payables, less cash and bank balances and investments. Capital signifies equity as shown in the balance sheet plus net debt.
The gearing ratios as at 30 June 2011 and 2010 were as follows:
2011 2010Rs '000 Rs '000
Long term financingTrade and other payablesAccrued interest / mark-up on borrowingsLiabilities against asset subject to finance leaseTotal debt
Less: Cash and bank balances Short term investments
Net debt
Share capitalUnappropriated profitEquity
Capital
Gearing ratio
2,328,181610,20951,287
173,3943,163,071
(1,718,893)(548,004)
896,174
1,271,5323,407,4014,678,933
5,575,107
16.07%
2,817,822516,76755,899
233,3033,623,791
(1,026,176)(592,372)
2,005,243
1,271,5322,436,2613,707,793
5,713,036
35.10%
The Group finances its investment portfolio through equity, borrowings and management of its working capital with a view to maintaining an appropriate mix between various sources of finance to minimise risk.
29.7 Fair value of financial instruments
Fair value is the amount for which an asset could be exchanged, or a liability settled, between knowledgeable willing parties in an arm's length transaction.
Financial assets which are tradable in an open market are revalued at the market prices prevailing on the balance sheet date. The estimated fair value of all other financial assets and liabilities is considered not significantly different from book value.
The following table shows financial instruments recognized at fair value, analysed between those whose fair value is based on:
Level 1: Quoted prices in active markets for identical assets or liabilities
Level 2: Those involving inputs other than quoted prices included in Level 1 that are observable for the asset or liability, either directly (as prices) or indirectly (derived from prices); and
Level 3: Those whose inputs for the asset or liability that are not based on observable market date (unobservable inputs)
108

Notes To The Consolidated Financial StatementsFor the year ended June 30, 2011
30 June 2011Investments designated at fair value through profit or loss
30 June 2010Investments designated at fair value through profit or loss
509,754509,754
539,122539,122
Total
509,754509,754
539,122539,122
Level 1
--
--
Level 2 Level 3
Rs '000
--
--
Financial assets measured at fair value
30 June 2011Fair value loss on derivative
30 June 2010Fair value loss on derivative
44,01844,018
66,17766,177
Total Level 1
--
--
Level 2 Level 3
Rs '000Financial assets measured at fair value
44,01844,018
66,17766,177
--
--
During the year ended 30 June 2011, there were no transfers between level 1 and level 2 fair value measurements, and no transfers into and out of level 3 fair value measurement.
30. REMUNERATION OF CHIEF EXECUTIVE, DIRECTORS AND EXECUTIVES
30.1 The aggregate amount, charged in the financial statements for the year is as follows:
Remuneration(including bonus)Housing rentRetirement benefitsMedical AllowanceUtilitiesConveyance
Number
61,8249,2732,5753,0913,0911,533
81,387
4
Directors
Rs '000
49,1159,9122,3203,3043,3041,732
69,687
41
Executives
15,2322,284
634762762280
19,954
1
53,7608,0642,2392,6882,688
93070,369
4
2011 2010
17,5172,628
730876876280
22,907
1
ChiefExecutive
33,3726,5851,6482,1952,1951,280
47,275
30
Directors ExecutivesChief
Executive
30.2 The Chief Executive, some of directors and executives of the Group are also provided with the use of the Group maintained car, club memberships and medical benefits in accordance with their terms of service.
30.3 The aggregate amount paid to the Directors as a fee for attending the Board of Director's meetings amount to Rs. 0.214 million (2010: Rs. 0.014 million).
31. RELATED PARTIES TRANSACTIONS
The related parties include subsidiary, major shareholders, entities having directors in common with the Group, directors and other key management personnel. Transactions with related parties, other than remuneration and benefits to key management personnel under the terms of their employment and transactions with such related parties reflected elsewhere in these financial statements are as under:
109
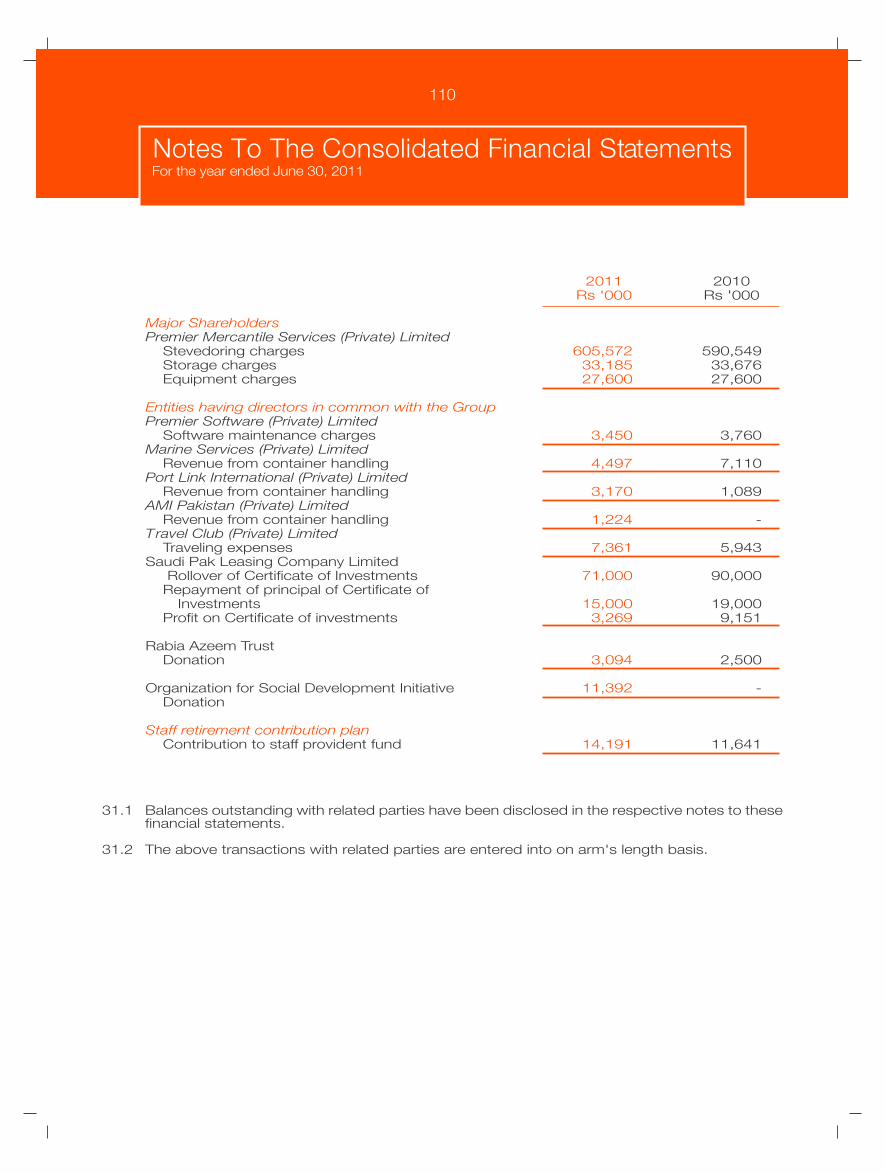
Notes To The Consolidated Financial StatementsFor the year ended June 30, 2011
2011 2010Rs '000 Rs '000
Major ShareholdersPremier Mercantile Services (Private) Limited
Stevedoring charges Storage charges Equipment charges
Entities having directors in common with the GroupPremier Software (Private) Limited
Software maintenance chargesMarine Services (Private) Limited
Revenue from container handling Port Link International (Private) Limited
Revenue from container handling AMI Pakistan (Private) Limited
Revenue from container handling Travel Club (Private) Limited
Traveling expensesSaudi Pak Leasing Company Limited
Rollover of Certificate of InvestmentsRepayment of principal of Certificate of
InvestmentsProfit on Certificate of investments
Rabia Azeem TrustDonation
Organization for Social Development InitiativeDonation
Staff retirement contribution planContribution to staff provident fund
605,57233,18527,600
3,450
4,497
3,170
1,224
7,361
71,000
15,0003,269
3,094
11,392
14,191
590,54933,67627,600
3,760
7,110
1,089
-
5,943
90,000
19,0009,151
2,500
-
11,641
31.1 Balances outstanding with related parties have been disclosed in the respective notes to these financial statements.
31.2 The above transactions with related parties are entered into on arm's length basis.
110

Notes To The Consolidated Financial StatementsFor the year ended June 30, 2011
2011 2010Rs '000 Rs '000
32. CASH FLOWS FROM OPERATING ACTIVITIES
Profit before taxationAdjustments for non-cash items:
DepreciationAmortisation Accrual for staff compensated absencesFinance costs Unrealised exchange lossFair value (gain) / loss on derivativesUnrealised gain on investmentInterest incomeGain on disposal of fixed assets
ImpairmentProvision for doubtful debts
Operating profit before working capital changes
(Increase)/decrease in current assetsStores and sparesTrade debtsAdvances, deposits, prepayments and other receivables
Increase/(decrease) in current liabilitiesTrade payables and other liabilities
Cash generated from operations
2,136,154
514,49033,2397,857
158,3193,210
(22,158)(53,181)
(125,759)(3,907) - -
512,110
2,648,264
(39,705)10,01212,749
(16,944)2,631,320
135,166
2,766,486
1,510,777
465,25022,8865,024
185,850143,84711,945
(11,761)(70,402)
(739)19,916
924772,740
2,283,517
(47,171)150,694(30,776)72,747
2,356,264
18,042
2,374,306
33. DATE OF AUTHORISATION FOR ISSUE
These financial statements have been authorised for issue by the Board of Directors of the Holding Company on August 29, 2011.
34. NON-ADJUSTING EVENTS AFTER THE BALANCE SHEET DATE
34.1 Subsequent to the year end, the Holding Company has obtained a long term local currency loan facility upto Rs. 2,500 million from a commercial bank and has fully paid off the outstanding foreign currency loans amounting to Rs. 2,328 million as at June 30, 2011 which were payable in different installments by January 15, 2018. The foreign currency loans outstanding as at the year-end are shown as long term liability in these financial statements.
34.2 DIVIDENDS AND APPROPRIATIONS
34.2.1 The Board of Directors in its meeting held on 11 July 2011 has proposed to distribute 54.577 million ordinary shares (100% of the issued, subscribed and paid up capital) of its subsidiary company, Pakistan International Bulk Terminal (Private) Limited (PIBTL), having face value of Rs 10 each, to the members of the Holding Company as 'specie dividend' in the ratio of 1:2, i.e. one ordinary share of PIBTL for every two ordinary shares held of the existing issued, subscribed and paid up capital of the Holding Company. The members have approved the said distribution at the Extra Ordinary General Meeting (EOGM) held on 03 August 2011 thereby resulting in ceasing of the Holding Company's equity holding in PIBTL. These financial statements do not reflect this appropriation.
PIBTL was incorporated on 22 March 2010 as a private limited company fully owned by PICTL, with principal activities as terminal operator of coal, clinker and cement and other bulk cargo. PIBTL has not commenced its operations. The carrying value of the investment in subsidiary to be distributed at 30 June 2011 is Rs 425 million, and subsequent to the balance sheet date, PIBTL
111

Notes To The Consolidated Financial StatementsFor the year ended June 30, 2011
2011 2010Rs '000 Rs '000
Reclassification from depreciation expense to amortization expense
Reclassification from property, plant and equipment to intangible assets (Port Concession Rights) – written down value
352,299
4,060,276
289,009
3,485,796
has further issued 12.077 million ordinary shares of Rs 10 to the Holding Company, increasing the carrying amount to Rs 545.77 million. The fair value of the investment in subsidiary does not significantly differ from its carrying value.
According to section 25 of the Listing Regulations, a company distributing shares of its unlisted subsidiary company in the form of specie dividend, shall get such subsidiary company listed within a period of 120 days from the date of approval of such distribution. The Company, in pursuance of the above regulation, intends to apply to Karachi Stock Exchange (KSE) for the listing of PIBTL subsequent to the approval of distribution at EOGM held on 03 August 2011. However, in the event of non compliance with the above regulation, the KSE may suspend the trading of shares of the Company or it may be delisted. Furthermore, the Company will be obliged to encash the said shares, at the options of the recipients, at a price not less than the current breakup value or face value of the shares of PIBTL, whichever is higher, within 30 days from such non - compliance.from such non – compliance.
34.2.2 The Board of Directors in their board meeting held on 30 August 2011 have recommended a final cash dividend of Rs. 4.00/- - 40% per ordinary share amounting to Rs. 436.613 million (2010: Rs. 2.5/- - 25% per ordinary share amounting to Rs. 272.883 million) for the year ended 30 June 2011. The Directors have also proposed a final dividend for the year ended 30 June 2011 of Re.1.00 - 10% (2010: Re.1.00 - 10%) per preference share. The financial statements for the year ended 30 June 2011 do not include the effect of the final dividend which will be accounted for in the financial statements for the year ending 30 June 2012.
35. EXEMPTION FROM APPLICABILITY OF IFRIC – 12 “SERVICE CONCESSION ARRANGEMENTS”
As explained in note 2.1, the required mandatory disclosure is as follows:
Under IFRIC-12, the consideration required to be made by operator (the Group) for the right to use the asset is to be accounted for as an intangible asset under IAS - 38 “Intangible Assets”. If the Group were to follow IFRIC-12 and IAS-38, the effect on the financial statements would be as follows:
36. GENERAL
36.1 There were no material reclassifications that could affect the financial statements materially.
36.2 Amounts have been rounded off to the nearest thousand rupees unless otherwise stated.
Capt. Zafar Iqbal Awan Aasim Azim SiddiquiCHIEF EXECUTIVE DIRECTOR
112

Pattern Of Shareholding (Ordinary Shares)As at June 30, 2011
NUMBER OFSHAREHOLDERS
14,099 113,838 686,089 601,166 324,837 171,162 134,172 179,354 141,381 149,465 88,200 99,680 62,000
138,432 73,563 80,189 85,540
110,328 130,000 141,984 171,082 219,900 250,000 800,915 360,000 391,999 428,329 499,999 508,640 603,607 667,711 822,849
1,076,186 1,101,698 2,213,136 1,138,212 1,471,298 2,925,657 3,989,349 7,286,822
17,155,639 23,000,000 38,544,645 109,153,152
TOTAL SHARES HELDSHARE HOLDING FROM TO
73650089527045148854221211111111131111111111211111111
2524
1101501
10015001
100011500120001250013500140001450016000165001700018000185001
110001125001140001170001215001245001265001355001390001425001495001505001600001665001820001
10750011100001110500111350011470001292500139850017285001
171550012299500138540001
100500
10005000
10000150002000025000300004000045000500006500070000750008500090000
115000130000145000175000220000250000270000360000395000430000500000510000605000670000825000
10800001105000111000011400001475000293000039900007290000
171600002300000038545000
113

Pattern Of Shareholding (Ordinary Shares)As at June 30, 2011
Associated Companies, undertakings and related partiesPremier Mercantile Services (Pvt.) Ltd. Jahangir Siddiqui & Co.
NIT and ICP Investment Companies
Directors, CEO and their spouse and minor childrenCapt. Haleem A.SiddiquiCapt. Zafar Iqbal AwanMrs. Saba HaleemMr. Aasim A.SiddiquiMr. Sharique A. SiddiquiMr. M. Masood Ahmed Usmani
ExecutivesSalim A. SiddiquiArsalan Iftikhar Khan
Public Sector Companies and Corporations
Banks, DFI's, NBFI's, Insurance Companies, Modarabas and Mutual Funds
Joint Stock Companies, Investment Companies Foreign Investors and Others
Individuals
TOTAL
INDIVIDUALSINSURANCE COMPANIESFINANCIAL INSTITUTIONSMODARABA AND MUTUAL FUNDSFOREIGN INVESTORSOTHERS:
TOTAL
243952
117
60
2,524
Categories of Shareholders
15,146,446404,182266,212
5,782,49822,552,94665,000,868
109,153,152
Number ofShareholders
13.880.370.245.30
20.6659.55
100.00
Number of Shares held Percentage
11
-
111111
11
-
18
58
2438
2524
Categories of Shareholders
38,544,645 23,000,000
-
7,286,822 720
667,711 1,138,212 1,105,636
11,075
391,999 2,000
-
6,452,892
26,009,169
4,542,271
109,153,152
Number ofShareholders
56.38
9.35
0.36
5.91
23.83
4.16
100.00
Number of Shares held Percentage
Shareholders holding 10% or more voting interest
Premier Mercantile Services (Pvt.) Ltd.Jahangir Siddiqui & Co.Aeolina Investments Ltd.
111
38,544,645 23,000,000 17,155,639
114

Pattern Of Shareholding (Ordinary Shares)As at June 30, 2011
Haleem A. SiddiquiSaba Haleem
Aasim A.Siddiqui
Sharique A. Siddiqui
08.12.201008.12.201016.09.201011.10.201008.12.201014.12.201005.03.201108.03.201110.03.201118.03.201128.03.201129.03.201130.03.201121.04.201122.08.201116.09.201011.10.201008.12.201001.03.201130.03.201121.04.2011
Name
100000100000
2789250000
1000006000
35000900
2383123423652187
3650050306
16282789050000
10000035000
365050000
Date of Purchase/Sale
747471
60.8674
73.66667
67.567.5
67676771
76.6771
60.8674666771
Number of Shares Rate
Details of Purchase/Sale of Shares ByDirectors, CEO, CFO, Company Secretary and their spousesor Minor Children during Year Ended June 30, 2011
115

As at June 30, 2011Pattern Of Shareholding (Preference Share)
NUMBER OF SHAREHOLDERS
SHARE HOLDINGFROM TO
TOTALSHARES HELD
1101501
10015001
1000125001300015500170001
24500121050012110001249500135950016945001
100500
10005000
100001500030000350006000075000
25000021100002115000250000036000006950000
275 84,667 25,741 80,375 36,158 34,491 55,424 32,957 57,734 75,000
250,000 2,107,108 2,110,750 2,500,000 3,600,000 6,949,320
18,000,000
8467
3838
532111111111
570
CATEGORIES OFSHAREHOLDERS
NUMBER OFSHAREHOLDERS
TOTALSHARES HELD
54922
17
570
414,651 4,217,858 2,557,734
10,809,757
18,000,000
INDIVIDUALSMODARBAS & MUTUAL FUNDSFINANCIAL INSTITUTIONSOTHERS:
Associated Companies, undertakings and related partiesPremier Mercantile Services (Pvt.) Ltd.
NIT and ICP Investment Companies
Banks, DFI's, NBFI's, Insurance CompaniesModarabas and Mutual Funds
Joint Stock Companies & Others
Individuals
1
-
22
11
554
570
Categories of Shareholders
3,600,000
-
2,557,734 4,217,858
7,209,757
414,651
18,000,000
Number ofShareholders
20.00
14.21 23.43
40.06
2.30
100.00
Number of Shares held Percentage
Shareholders holding 10% or more voting interest
Premier Mercantile Services (Pvt.) Ltd. CDC-Trustee Faysal Balanced Growth FundCDC-Trustee Faysal Income & Growth FundJS Global Capital Ltd.Pak Kuwait Investment Co. (Pvt.) Ltd.
11111
3,600,000 2,110,750 2,107,108 6,949,320 2,500,000
Details of Purchase/Sale of Shares ByDirectors, CEO, CFO, Company Secretary and their spousesor Minor Children during Year Ended June 30, 2011
NIL
116

Form Of Proxy
The Company SecretaryPakistan International Container Terminal Limited2nd Floor, Business Plaza,Mumtaz Hassan RoadKarachiSignature onRs. 5/-RevenueStamp
I/We, ofbeing member of Pakistan International Container Terminal Limited and holder of Ordinary Shares as per Share Register Folio No . and/or CDC Participant I. D . N o . hereby appoint Mr./Mrs./Miss of (full address) as my/us proxy to attend, speak and vote for me/us and on my/our behalf at the 10th Annual General Meeting of the Company to be held on Monday, October 03, 2011 and at any adjournment thereof.
Signed this day of 2011
Witnesses:1. Name
AddressCNIC No.Signature
2. NameAddressCNIC No.Signature
Notes:1. A member entitled to attend and vote at the meeting may appoint another member as his/her
proxy who shall have such rights as respects attending, speaking and voting at the meeting as are available to a member.
2. The proxy in order to be valid must be signed across Five Rupees Revenue Stamp and should be deposited with the Company not later than 48 hours before the time of holding the Meeting.
3. The proxy shall authenticate his/her identity by showing his/her original CNIC or original passport and bring folio number at the time of attending the meeting.
4. Signature should agree with the specimen signature registered with the Company.
5. CDC shareholders and their Proxies must attach either an attested photocopy of their National Identity Card or Passport with this Proxy Form.
6. In case of proxy by a corporate entity, Board of Directors resolution/power of attorney with specimen signature and attested copies of CNCI or Passport of the proxy shall be submitted along with the proxy form.
Please affix Rs. 5/-revenuestamp