board of investments
TRANSCRIPT
A RepoRtto the
MontAnALegisLAtuRe
LegisLAtive Auditdivision
08-04B
FinAnciAL Audit
noveMbeR 2009
Board of InvestmentsFor the Two Fiscal Years Ended
June 30, 2009

Financial AuditsFinancial audits are conducted by the Legislative Audit Division to determine if the financial statements included in this report are presented fairly and the agency has complied with laws and regulations having a direct and material effect on the financial statements. In performing the audit work, the audit staff uses standards set forth by the American Institute of Certified Public Accountants and the United States Government Accountability Office. Financial audit staff members hold degrees with an emphasis in accounting. Most staff members hold Certified Public Accountant (CPA) certificates.
Government Auditing Standards, the Single Audit Act Amendments of 1996 and OMB Circular A‑133 require the auditor to issue certain financial, internal control, and compliance reports. This individual agency audit report is not intended to comply with these requirements and is therefore not intended for distribution to federal grantor agencies. The Legislative Audit Division issues a statewide biennial Single Audit Report which complies with the above reporting requirements. The Single Audit Report for the two fiscal years ended June 30, 2007, was issued January 23, 2008. The Single Audit Report for the two fiscal years ended June 30, 2009, will be issued by March 31, 2010. Copies of the Single Audit Report can be obtained by contacting:
Single Audit Coordinator Legislative Audit DivisionOffice of Budget and Program Planning Room 160, State CapitolRoom 277, State Capitol P.O. Box 201705P.O. Box 200802 Helena, MT 59620‑1705Helena, MT 59620‑0802
Legislative AuditCommittee
RepresentativesDee Brown, Vice Chair
Betsy HandsScott Mendenhall
Carolyn Pease‑LopezWayne StahlBill Wilson
SenatorsMitch Tropila, Chair
Greg BarkusJohn BrendenTaylor BrownMike CooneyCliff Larsen
Audit StaffFinancial-Compliance
Anthony CacaceJohn Fine
Brenda Kedish
Fraud HotlineHelp eliminate fraud, waste, and abuse in state government.
Call the Fraud Hotline at:(Statewide)
1‑800‑222‑4446(in Helena)
444‑4446
Direct comments or inquiries to:Legislative Audit DivisionRoom 160, State Capitol
P.O. Box 201705Helena, MT 59620‑1705
(406) 444‑3122Reports can be found in electronic format at:
http://leg.mt.gov/audit
Room 160 • State Capitol Building • P.O. Box 201705 • Helena, MT • 59620-1705Phone (406) 444-3122 • FAX (406) 444-9784 • E-Mail [email protected]
LEGISLATIVE AUDIT DIVISION Tori Hunthausen, Legislative Auditor Deputy Legislative AuditorsMonica Huyg, Legal Counsel James Gillett Angie Grove
November 2009
The Legislative Audit Committeeof the Montana State Legislature:
This is our financial audit report on the Board of Investments (Board) for the two fiscal years ended June 30, 2009. We performed this audit of the Board in compliance with Article VIII, Section 13 of the Montana Constitution, and §17-6-321, MCA. The objectives of our financial audit included determining whether the Board’s financial statements presented fairly its financial position and results of operations at and for the periods ended June 30, 2009, and 2008 and the Board’s compliance with laws and regulations that have a direct and material impact on the financial statements.
The Board, created in 1971, is attached to the Department of Commerce for administrative purposes. The Board employs an executive director and chief investment officer who in turn hire and manage staff. The staff members advise the Board, implement its decisions, and perform daily investment, economic development, and record keeping functions. Included in this report is a list of the members of the Board of Investments and its Administrative Officials (page i).
This report contains unqualified Independent Auditor’s Reports for the Board’s Consolidated Unified Investment Program and Enterprise Fund. The Independent Auditor’s Reports cover two fiscal years because the Board presents two fiscal years in the financial statements for comparative purposes. The Board’s response to this report is on page B-1.
This report does not contain any recommendations to the Board. The prior financial-compliance audit report, issued for the two fiscal years ended June 30, 2008, contained two recommendations to the Board. The Board implemented one recommendation and partially implemented the other. The recommendation partially implemented is related to the Board’s involvement in the construction of the Montana State Fund Building. The Board is still involved in the construction of the building and plans to remain involved until construction is complete. As a result, we will follow up on this again during our next audit. We make no further recommendation at this time.
We thank the members of the Board of Investments and their staff for their cooperation and assistance during the audit.
Respectfully submitted,
/s/ Tori HunthausenTori Hunthausen, CPALegislative Auditor


Appointed and Administrative Officials
Term ExpiresMontana Board of Investments Terry Moore, Chairman Billings 1/2011
Elouise Cobell Browning 1/2013
Teresa Cohea Helena 1/2013
Karl Englund Missoula 1/2011
Maureen Fleming Missoula 1/2011
Patrick McKittrick Great Falls 1/2013
Jack Prothero Great Falls 1/2013
Jon Satre Helena 1/2011
Jim Turcotte Helena 1/2013
Greg Barkus Senate Liaison
Brady Wiseman House of Representatives Liaison
Administrative Officials Carroll South, Executive Director
Geri Burton, Deputy Director
Cliff Sheets, Chief Investment Officer
Gayle L. Moon, Accounting Fiscal Manager
For additional information concerning the Montana Board of Investments, contact:
Carroll South, Executive DirectorP.O. Box 200126Helena, MT 59620-0126(406) 444-0001e-mail: [email protected]
08-04B
i

Financial Statements Index
INDEPENDENT AUDITOR’S REPORTS AND BOARD OF INVESTMENTS FINANCIAL STATEMENTS
Consolidated Unified Investment ProgramIndependent Auditor’s Report and Financial Statements ....................................... A-1
Enterprise FundIndependent Auditor’s Report and Financial Statements ..................................... A-59
Montana Legislative Audit Divisionii
Independent Auditor’s Report
The Legislative Audit Committeeof the Montana State Legislature:
We have audited the accompanying Statement of Net Asset Value/Investments Managed of the Montana Board of Investments, Consolidated Unified Investment Program as of June 30, 2009, and 2008, and the related Statement of Changes in Net Asset Value/Investments Managed, and Statement of Investment Income and Distribution, for each of the fiscal years then ended. The information contained in these financial statements is the responsibility of the Board’s management. Our responsibility is to express an opinion on these financial statements based on our audit.
We conducted our audit in accordance with auditing standards generally accepted in the United States of America. Those standards require that we plan and perform the audit to obtain reasonable assurance about whether the financial statements are free of material misstatement. An audit includes examining, on a test basis, evidence supporting the amounts and disclosures in the financial statements. An audit also includes assessing the accounting principles used and significant estimates made by management, as well as evaluating the overall financial statement presentation. We believe that our audit provides a reasonable basis for our opinion.
In our opinion, the financial statements referred to above present fairly, in all material respects, the net asset value of the Montana Board of Investments, Consolidated Unified Investment Program as of June 30, 2009, and 2008, and its changes in net asset value/investments managed and investment income and distribution for each of the fiscal years then ended, in conformity with accounting principles generally accepted in the United States of America.
Respectfully submitted,
/s/ James Gillet
James Gillett, CPADeputy Legislative Auditor
October 27, 2009
Room 160 • State Capitol Building • P.O. Box 201705 • Helena, MT • 59620-1705Phone (406) 444-3122 • FAX (406) 444-9784 • E-Mail [email protected]
LEGISLATIVE AUDIT DIVISION Tori Hunthausen, Legislative Auditor Deputy Legislative AuditorsMonica Huyg, Legal Counsel James Gillett Angie Grove
A-1

A-2

STATE OF MONTANA BOARD OF INVESTMENTS CONSOLIDATED UNIFIED INVESTMENT PROGRAM FINANICAL STATEMENT
2009 2008
Assets
Cash $ 9,230,879 $ 17,266,879 Security lending cash collateral (Note 5) 1,200,731,501 836,203,843 Broker receivable for securities sold but not settled (Note 2A) 69,143,177 33,967,399 Dividend and interest receivable (Note 2E) 54,603,280 68,543,146 STIP investment portfolio at amortized cost (Note 2B) 2,301,281,468 2,322,008,128 Investment portfolios at fair value (Note 2B) 8,823,470,364 10,473,336,072
Total assets (Note 2B) $ 12,458,460,669 $ 13,751,325,467
Liabilities
Income due participants (Notes 2E) $ 23,811,192 $ 31,121,618Broker payable for securities purchased but not settled (Note 2A) 43,878,167 99,374,745Security lending obligations (Note 5) 1,200,731,501 836,203,843Security lending expense payable 404,942 1,587,852Unrealized foreign exchange market gain (loss) 133,099 249,585Other payables 2,799,578 206,737Administrative fee payable 2,716,909 4,238,184STIP reserve (Note 7) 1,427,621 4,352,667
Total liabilities (Note 2B) 1,275,903,009 977,335,231
Net asset value/investments managed (Note 2B, 2C) $ 11,182,557,660 $ 12,773,990,236
Pool Units Outstanding (Note 2B, 2C) 2,374,560,621 2,390,312,896
Net asset value/investments, beginning of year $ 12,773,990,236 $ 13,469,961,763 Value of pool units/investments purchased (Note 2D) 13,196,815,945 13,874,166,338 Value of pool units/investments sold/matured (Note 2D) (13,034,950,059) (13,979,187,863) Increase (decrease) in AOF interest receivable (2,066,822) (531,143) Increase (decrease) in AOF broker receivable 70,376 (78,728) (Increase) decrease in AOF accounts payable (6,097) 33,207 (Increase) decrease in AOF security lending expense payable 317,686 741,098 Changes in current value of investments managed (Note 2D) (1,751,613,605) (591,114,436)
Net asset value/investments managed, end of year $ 11,182,557,660 $ 12,773,990,236
Net realized gain (loss) (Note 2E) $ (16,324,497) $ 26,598,055 Dividend/interest income (Note 2E) 332,619,985 380,536,951 Amortization/accretion (Note 2E) 30,860,796 73,207,790 Security lending income (Note 5) 23,851,652 42,135,165 Security lending expense (Note 5) (9,949,320) (34,612,280) Administrative expenses (Note 2F) (37,373,150) (41,612,233) Other expenses (204,871) (841,495) STIP reserve expense (Note 7) (9,242,500) (4,346,500) Income due participants, beginning of year 31,121,618 34,290,689
Income available for distribution (Note 2E) 345,359,713 475,356,142 Distribution (Note 2E) 321,548,521 444,234,524
Income due participants, end of year (Note 2E) $ 23,811,192 $ 31,121,618
STATEMENT OF NET ASSET VALUE/INVESTMENTS MANAGED JUNE 30, 2009 AND 2008
The accompanying notes are an integral part of these financial statements.
STATEMENT OF CHANGES IN NET ASSET VALUE/INVESTMENTS MANAGED
STATEMENT OF INVESTMENT INCOME and DISTRIBUTION FOR FISCAL YEARS ENDED JUNE 30, 2009 AND 2008
FOR FISCAL YEARS ENDING JUNE 30, 2009 AND 2008
A-3

STATE OF MONTANA BOARD OF INVESTMENTS CONSOLIDATED UNIFIED INVESTMENT PROGRAM FINANICAL STATEMENT
NOTES TO FINANCIAL STATEMENTS JUNE 30, 2009 AND 2008
1. HISTORY AND ORGANIZATION
The Board was created by the Legislature to manage the Unified Investment Program established by the state Constitution. The Investment Program is comprised of all state funds, including pensions, trusts, insurance, and cash. Local government entities may only invest in the Short Term Investment Pool portion of the Program. The Board manages the Investment Program pursuant to the “Prudent Expert Principle” mandated by state law, which requires an investment manager to: (a) discharge the duties with the care, skill, prudence, and diligence, under the circumstances then prevailing, that a prudent person acting in a like capacity with the same resources and familiar with like matters exercises in the conduct of an enterprise of a like character with like aims; (b) diversify the holdings of each fund within the unified investment program to minimize the risk of loss and to maximize the rate of return unless, under the circumstances, it is clearly prudent not to do so; and (c) discharge the duties solely in the interest of and for the benefit of the funds forming the unified investment program.
Currently, only the nine retirement funds and the Montana State Fund (Workers’ Compensation) may invest in stock. All other state funds must be invested in fixed-income type investments. Neither state law nor the state Constitution place restrictions on retirement fund investments. The funds are invested solely at the discretion of the Board pursuant to the “Prudent Expert Principle.”
To facilitate management of the Investment Program, the Board created seven investment pools (Pools) that operate similar to mutual funds. All state agencies and many local government entities participate in one or more Pools. By investing in large Pools with other participants the smaller participants are provided broad diversification not otherwise possible. Some Pools are dedicated solely to the state’s nine retirement funds, while others are open to other state and local government funds. State agencies, ineligible to participate in a long term investment pool, have direct fixed income, equity, real estate, loan and mortgage investments. These investments are combined and reported as All Other Funds (AOF) Investments Managed. The Pools, AOF Investments Managed, Pool creation date and eligible participants are shown below.
Pool/Investments Managed Name Creation Date Eligible Participants
Retirement Funds Bond Pool (RFBP) 04/01/95Trust Funds Bond Pool (TFBP) 10/01/95Montana Domestic Equity Pool (MDEP) 07/01/80Montana International Equity Pool (MTIP) 06/01/96Montana Private Equity Pool (MPEP) 05/01/02Montana Real Estate Pool (MTRP) 06/01/06Short Term Investment Pool (STIP) 07/01/74All Other Funds (AOF) Investments Managed NA
Nine Retirement Funds OnlyNine Retirement Funds Only
Non-Pool State Agency Investments
Nine Retirement Funds Only
All State Funds and Local Governments
Nine Retirement Funds/Small Trusts
Nine Retirement Funds OnlyVarious State Trust Funds
2. SUMMARY OF SIGNIFICANT ACCOUNTING POLICIES
A. Valuation and Timing – The value of stocks and bonds are recorded at both “book” and “fair” value. The book or carrying value of a stock is the average cost of the shares held. If the same stock has been purchased several times, the average of the purchase prices is the book value. The book value of bonds is the “amortized” cost, which represents the original cost, adjusted for premium and discount amortization where applicable. If bonds are purchased at more than the par value, the difference is called a premium. If they are purchased for less than par value, the difference is called discount. Premiums and discounts are amortized/accreted using the straight-line or scientific method to the call, average life, or maturity date of the securities. The fair value of publicly traded stocks and bonds is determined by reference to market prices supplied by State Street Bank (the custodial bank). Because a public market does not exist for private equity and real estate investments, the fair value of these investments is the value reported in the most recent external managers’ valuation reports. The book or carrying value of these private investments is the capital invested less capital returned. Except for STIP, all investment portfolios presented in the Statement of Net Asset Value are at “fair” value.
A-4
STATE OF MONTANA BOARD OF INVESTMENTS CONSOLIDATED UNIFIED INVESTMENT PROGRAM FINANICAL STATEMENT
Accounting for stock and bond securities is based on the “trade date”, which means the sale or purchase of a security is recorded on the trade date, rather than the “settlement” date. This generally accepted practice results in a purchased security included in the investment portfolio on the trade date even though payment will not occur until the settlement date. Conversely, a sold security will be eliminated from the investment portfolio on the trade date even though the sale proceeds will not be received until the settlement date. This delayed timing requires that “receivables” and “payables” for securities sold/purchased but not yet settled must be reported in the financial statement and calculated in the Net Asset Value. Private equity and real estate investments are included in the portfolio when funds are wired.
Currency exposures may be hedged, partially or fully, at the discretion of the manager to preserve the U.S. dollar value of investments made. Currency speculation, such as over-hedging, reverse hedging or other trading activity not specifically aimed at preserving the U.S. dollar value of investments is not authorized.
B. Pool Net Asset Value/Investments Managed – The Pool Net Asset Value (NAV) must be calculated accurately to ensure participants are paying or receiving a “fair” price when units are purchased and sold. The NAV must include not only the fair value of the investment portfolio (except for STIP at book value) but any liabilities payable by the Pool and receivables due the Pool on the NAV calculation date. Investment accounting uses the “accrual” basis, which means bond interest due is recorded when earned, rather than when cash is received. Interest “due” is recorded as a receivable (asset) and included in the NAV on the date of the calculation. Dividends are recorded as of “ex-dividend date.” Income due to Pool participants is recorded on the date due to the participants, rather than on actual distribution date. Income Due Participants is a payable (liability) and included in the NAV on the calculation date. The effect of assets and liabilities on the Pool NAV is depicted in the table below. The difference between Pool investment portfolios at fair value and the NAV is the net of other assets and liabilities. The STIP portfolio is shown in the Statement of Net Asset Value at amortized cost or “book” value. The All Other Funds (AOF) Investments Managed (IM) represent direct investments by approximately 20 state agencies in fixed income securities, an equity index fund, real estate buildings, commercial loans and residential mortgages. These state agencies do not buy or sell participant units based on a NAV calculation for their AOF Investments Managed. The book value, fair value, Pool NAV and AOF Investments Managed (IM) are shown in the table on the next page.
{This area intentionally left blank}
A-5

STATE OF MONTANA BOARD OF INVESTMENTS CONSOLIDATED UNIFIED INVESTMENT PROGRAM FINANICAL STATEMENT
Pool Book Value Fair Value * NAV/IM
Retirement Funds Bond Pool (RFBP) 1,758,946,863 1,707,369,797 1,736,529,044Trust Funds Bond Pool (TFBP) 1,646,130,686 1,633,759,215 1,640,908,965Montana Domestic Equity Pool (MDEP) 2,529,966,617 2,117,338,971 2,120,395,971Montana International Equity Pool (MTIP) 1,059,445,808 973,481,473 978,855,571Montana Private Equity Pool (MPEP) 774,019,696 671,456,150 670,867,274Montana Real Estate Pool (MTRP) 389,576,100 287,943,521 287,866,728Short Term Investment Pool (STIP)* 2,301,281,468 2,301,281,468 2,301,489,605All Other Funds (AOF) Investments Managed 1,431,182,507 1,432,121,237 1,445,644,502
Total 11,890,549,745 11,124,751,832 11,182,557,660
Pool Book Value Fair Value * NAV/IM
Retirement Funds Bond Pool (RFBP) 1,995,227,873 1,991,701,315 1,966,209,536Trust Funds Bond Pool (TFBP) 1,543,685,172 1,545,945,703 1,525,195,966Montana Domestic Equity Pool (MDEP) 2,949,750,890 2,965,611,148 2,972,686,616Montana International Equity Pool (MTIP) 1,320,309,704 1,437,640,868 1,446,301,196Montana Private Equity Pool (MPEP) 640,012,167 744,098,947 744,061,238Montana Real Estate Pool (MTRP) 319,436,934 329,186,301 326,540,885Short Term Investment Pool (STIP)* 2,322,008,128 2,322,008,128 2,318,634,887All Other Funds (AOF) Investments Managed 1,444,468,005 1,459,151,790 1,474,359,912
Total 12,534,898,874 12,795,344,200 12,773,990,236* The STIP portfolio is recorded at amortized cost in the Fair Value column.
June 30, 2009 Investment Portfolios and Net Asset Value (NAV)/Investments Managed (IM)
June 30, 2008 Investment Portfolios and Net Asset Value (NAV)/Investments Managed (IM)
{This area intentionally left blank}
A-6

STATE OF MONTANA BOARD OF INVESTMENTS CONSOLIDATED UNIFIED INVESTMENT PROGRAM FINANICAL STATEMENT
The table below shows the individual Pool and AOF assets, liabilities, and NAV/Investments Managed. Included in the Pool and Investments Managed assets are the value of the investment portfolios, cash, receivables for securities sold but not yet settled, and dividend/interest receivables. Included in the liabilities are payables for securities purchased but not yet settled, income due participants, and other miscellaneous payables. The “securities lending” asset/liability shown in the Statement of Net Asset Value/ Investments Managed nets to zero and has no “net” effect on the Pool NAV and AOF Investments Managed.
Pool Assets Liabilities NAV/IM
Retirement Funds Bond Pool (RFBP) 2,085,682,263 349,153,219 1,736,529,044Trust Funds Bond Pool (TFBP) 1,948,176,454 307,267,489 1,640,908,965Montana Domestic Equity Pool (MDEP) 2,301,364,588 180,968,617 2,120,395,971Montana International Equity Pool (MTIP) 1,053,008,013 74,152,442 978,855,571Montana Private Equity Pool (MPEP) 671,456,150 588,876 670,867,274Montana Real Estate Pool (MTRP) 287,947,713 80,985 287,866,728Short Term Investment Pool (STIP) 2,455,844,596 154,354,991 2,301,489,605All Other Funds (AOF) Investments Managed 1,654,980,892 209,336,390 1,445,644,502
Total 12,458,460,669 1,275,903,009 11,182,557,660
Pool Assets Liabilities NAV/IM
Retirement Funds Bond Pool (RFBP) 2,114,919,548 148,710,012 1,966,209,536Trust Funds Bond Pool (TFBP) 1,650,953,561 125,757,595 1,525,195,966Montana Domestic Equity Pool (MDEP) 3,277,358,234 304,671,618 2,972,686,616Montana International Equity Pool (MTIP) 1,541,240,521 94,939,325 1,446,301,196Montana Private Equity Pool (MPEP) 744,098,947 37,709 744,061,238Montana Real Estate Pool (MTRP) 329,201,987 2,661,102 326,540,885Short Term Investment Pool (STIP) 2,429,451,415 110,816,528 2,318,634,887All Other Funds (AOF) Investments Managed 1,664,101,254 189,741,342 1,474,359,912
Total 13,751,325,467 977,335,231 12,773,990,236
2009 Assets, Liabilities and Net Asset Value (NAV)/Investments Managed (IM)
2008 Assets, Liabilities and Net Asset Value (NAV)/Investments Managed (IM)
{This area intentionally left blank}
A-7

STATE OF MONTANA BOARD OF INVESTMENTS CONSOLIDATED UNIFIED INVESTMENT PROGRAM FINANICAL STATEMENT
C. Pool Participant Units – Pool units are purchased and sold similar to individuals investing in mutual funds. The STIP participants purchase and sell units, at $1 per unit, at their discretion. All non-STIP Pool units and AOF direct investments are purchased and sold at the discretion of Board investment staff based on asset allocations approved by the Board. For non-STIP Pool participants to purchase and sell units, the units must be “priced.” Once the Pool NAV is calculated, the unit value is priced by dividing the NAV by the number of outstanding units. The unit value is then used when units are purchased or sold. Like securities, Pool units also have a “book” value, which is the price of the unit when it was purchased. The book value does not change unless the participant purchased additional units at different prices. Because the AOF Investments Managed (IM) is not an investment pool, there are no Units Outstanding or a Pool Unit Value. The calculations for Pool unit values are shown below:
Pool Name NAV/IM Units Outstanding Unit Value
Retirement Funds Bond Pool (RFBP) 1,736,529,044 17,652,501 98.37 Trust Funds Bond Pool (TFBP) 1,640,908,965 17,101,938 95.95 Montana Domestic Equity Pool (MDEP) 2,120,395,971 20,811,325 101.89 Montana International Equity Pool (MTIP) 978,855,571 8,766,849 111.65 Montana Private Equity Pool (MPEP) 670,867,274 4,882,666 137.40 Montana Real Estate Pool (MTRP) 287,866,728 3,855,737 74.66 Short Term Investment Pool (STIP) 2,301,489,605 2,301,489,605 1.00 All Other Funds (AOF) Investments Managed 1,445,644,502 NA NA
Total 11,182,557,660 2,374,560,621 NA
Pool Name NAV/IM Units Outstanding Unit Value
Retirement Funds Bond Pool (RFBP) 1,966,209,536 19,563,664 100.50 Trust Funds Bond Pool (TFBP) 1,525,195,966 15,723,233 97.00 Montana Domestic Equity Pool (MDEP) 2,972,686,616 20,972,463 141.74 Montana International Equity Pool (MTIP) 1,446,301,196 8,223,227 175.88 Montana Private Equity Pool (MPEP) 744,061,238 4,085,576 182.12 Montana Real Estate Pool (MTRP) 326,540,885 3,109,846 105.00 Short Term Investment Pool (STIP) 2,318,634,887 2,318,634,887 1.00 All Other Funds (AOF) Investments Managed 1,474,359,912 NA NA
Total 12,773,990,236 2,390,312,896 NA
2008 NAV/IM - Units Outstanding - Unit Value
2009 NAV/IM - Units Outstanding - Unit Value
{This area intentionally left blank}
A-8

STATE OF MONTANA BOARD OF INVESTMENTS CONSOLIDATED UNIFIED INVESTMENT PROGRAM FINANICAL STATEMENT
D. Changes in Net Asset Value/Investments Managed – This table depicts the change in NAV/IM from the previous year to the current year. There are three components contributing to the changes: 1) the value of Pool participant units and AOF investments purchased; 2) the value of Pool participant units and AOF investments sold; and 3) the change in the value of investments managed. The change in NAV for each Pool and AOF Investments Managed is shown in the table below.
Value of Units/ Value of Units/ Change in ValueInvestments Investments of
Pool Purchased Sold Investments
Retirement Funds Bond Pool (RFBP) 1,400,000 (195,866,968) (35,213,524)Trust Funds Bond Pool (TFBP) 157,204,824 (27,240,483) (14,251,342)Montana Domestic Equity Pool (MDEP) 8,690,000 (16,163,780) (844,816,865)Montana International Equity Pool (MTIP) 56,905,000 (2,447,065) (521,903,560)Montana Private Equity Pool (MPEP) 138,530,000 - (211,723,964)Montana Real Estate Pool (MTRP) 72,930,000 - (111,604,157)Short Term Investment Pool (STIP) 8,030,240,358 (8,047,385,640) - All Other Funds (AOF) Investments Managed 4,730,915,763 (4,745,846,123) (12,100,193)
Total 13,196,815,945 (13,034,950,059) (1,751,613,605)
Value of Units/ Value of Units/ Change in ValueInvestments Investments of
Pool Purchased Sold Investments
Retirement Funds Bond Pool (RFBP) 2,800,000 (6,958,243) 643,439 Trust Funds Bond Pool (TFBP) 138,167,302 - 5,215,885 Montana Domestic Equity Pool (MDEP) 6,190,000 (14,934,944) (484,916,424)Montana International Equity Pool (MTIP) 5,255,000 (136,765) (174,413,721)Montana Private Equity Pool (MPEP) 63,120,000 - 59,444,093 Montana Real Estate Pool (MTRP) 161,500,000 - 7,539,883 Short Term Investment Pool (STIP) 7,460,338,229 (7,934,240,967) - All Other Funds (AOF) Investments Managed 6,036,795,807 (6,022,916,944) (4,627,591)
Total 13,874,166,338 (13,979,187,863) (591,114,436)
2008 Pool Unit/AOF Investment Activity and Change in Value of Investments
2009 Pool Unit/AOF Investment Activity and Change in Value of Investments
{This area intentionally left blank}
A-9

STATE OF MONTANA BOARD OF INVESTMENTS CONSOLIDATED UNIFIED INVESTMENT PROGRAM FINANICAL STATEMENT
E. Distributable Income – Bond Pool and AOF distributable income reported in the Statement of Investment Income and Distribution includes accrued interest, miscellaneous income, amortization/accretion of discount/premium, and realized gains (losses) on sales. STIP income is comprised of accrued interest and amortization of discount. Public equity, private equity, and private real estate Pools distributable income consists primarily of dividends. Realized capital gains in the MPEP and MTRP are not distributed unless the gains are needed to pay management fees. Income Due Participants is distributed monthly on the first calendar day of each month. Realized Bond Pool and AOF portfolio gains/losses are distributed monthly.
In fiscal year 2009, the sale of pool units from the Retirement Funds Bond Pool, Montana Domestic Equity Pool (MDEP), Trust Funds Bond Pool (TFBP), and the Montana International Equity Pool (MTIP) generated a net loss to participants of $4,303,432. In fiscal year 2008, the sale of pool units from the Montana Domestic Equity Pool (MDEP), Montana International Equity Pool (MTIP), and Retirement Fund Bond Pool (RFBP) generated a net gain to participants of $20,420,061. These gains were recorded as AOF activity. The major distributable income for each Pool and the AOF is shown below.
Gain Dividend\ Amortization\Pool (Loss) Interest Accretion
Retirement Funds Bond Pool (RFBP) (63,964) 88,473,972 661,798 Trust Funds Bond Pool (TFBP) (6,919,879) 81,666,966 3,566,638 Montana Domestic Equity Pool (MDEP) - 32,536,045 - Montana International Equity Pool (MTIP) - 22,145,326 - Montana Private Equity Pool (MPEP) 8,899,848 6,203,082 - Montana Real Estate Pool (MTRP) 311,758 12,188,033 - Short Term Investment Pool (STIP) - 21,007,551 24,987,498 All Other Funds (AOF) Investments Managed (18,552,260) 68,399,011 1,644,862
Total (16,324,497) 332,619,986 30,860,796
Gain Dividend\ Amortization\Pool (Loss) Interest Accretion
Retirement Funds Bond Pool (RFBP) 801,665 106,519,052 5,892,443 Trust Funds Bond Pool (TFBP) 46,769 78,164,854 4,795,586 Montana Domestic Equity Pool (MDEP) - 30,657,473 - Montana International Equity Pool (MTIP) - 30,475,684 - Montana Private Equity Pool (MPEP) 4,650,076 11,120,564 - Montana Real Estate Pool (MTRP) - 11,057,248 - Short Term Investment Pool (STIP) - 43,512,626 60,575,090 All Other Funds (AOF) Investments Managed 21,099,545 69,029,450 1,944,671
Total 26,598,055 380,536,951 73,207,790
2009 Major Sources of Distributable Income
2008 Major Sources of Distributable Income
{This area intentionally left blank}
A-10

STATE OF MONTANA BOARD OF INVESTMENTS CONSOLIDATED UNIFIED INVESTMENT PROGRAM FINANICAL STATEMENT
Distributable income for the fiscal year may not be distributed by June 30. Any undistributed amount is recorded as a payable against the NAV of the Pool at year-end. The distributable and undistributed income is shown below.
Pool Name Distributable Distributed Undistributed
Retirement Funds Bond Pool (RFBP) 101,262,029 92,360,540 8,901,489Trust Funds Bond Pool (TFBP) 88,216,641 79,135,296 9,081,345Montana Domestic Equity Pool (MDEP) 28,621,988 26,812,182 1,809,806Montana International Equity Pool (MTIP) 20,871,513 19,307,633 1,563,880Montana Private Equity Pool (MPEP) 2,570,541 1,981,665 588,876Montana Real Estate Pool (MTRP) 7,485,470 7,404,485 80,985Short Term Investment Pool (STIP) 43,544,455 41,759,644 1,784,811All Other Funds (AOF) Investments Managed 52,787,076 52,787,076 0
Total 345,359,713 321,548,521 23,811,192
Pool Name Distributable Distributed Undistributed
Retirement Funds Bond Pool (RFBP) 123,139,399 112,860,568 10,278,831Trust Funds Bond Pool (TFBP) 90,747,626 82,700,924 8,046,702Montana Domestic Equity Pool (MDEP) 23,799,314 20,847,818 2,951,496Montana International Equity Pool (MTIP) 25,686,193 23,069,221 2,616,972Montana Private Equity Pool (MPEP) 1,813,803 1,776,094 37,709Montana Real Estate Pool (MTRP) 5,593,848 2,932,746 2,661,102Short Term Investment Pool (STIP) 112,122,210 107,593,404 4,528,806All Other Funds (AOF) Investments Managed 92,453,749 92,453,749 0
Total 475,356,142 444,234,524 31,121,618
2009 Distributable and Undistributed Income
2008 Distributable and Undistributed Income
{This area intentionally left blank}
A-11

STATE OF MONTANA BOARD OF INVESTMENTS CONSOLIDATED UNIFIED INVESTMENT PROGRAM FINANICAL STATEMENT
F. Investment Management Fees – The Legislature sets the maximum management fee the Board may charge the accounts it manages. The maximum fee is set at the aggregate level and at the beginning of each fiscal year. The Board allocates the aggregate fees across the Pools and AOF investments managed outside the Pools. Custodial bank fees are paid by a statutory appropriation from the state general fund. The Board allocates custodial bank fees across the Pools and accounts invested outside the Pools and deposits the proceeds in the general fund. The State Treasurer then pays the monthly custodial bank fees from the general fund. External manager fees are paid directly from the accounts they manage. Investment management fees charged each Pool and the AOF investments are shown below.
Custodial ExternalPool Board Bank Managers Total
Retirement Funds Bond Pool (RFBP) 541,428 146,928 270,357 958,713Trust Funds Bond Pool (TFBP) 473,556 119,412 - 592,968Montana Domestic Equity Pool (MDEP) 666,312 521,316 7,647,925 8,835,553Montana International Equity Pool (MTIP) 652,584 218,497 4,220,452 5,091,533Montana Private Equity Pool (MPEP) 528,360 74,982 11,763,522 12,366,864Montana Real Estate Pool (MTRP) 505,608 30,570 7,137,608 7,673,786Short Term Investment Pool (STIP) 472,740 288,860 - 761,600All Other Funds (AOF) Investments Managed 873,157 155,520 63,456 1,092,133
Total 4,713,745 1,556,085 31,103,320 37,373,150
Custodial ExternalPool Board Bank Managers Total
Retirement Funds Bond Pool (RFBP) 419,493 107,484 - 526,977Trust Funds Bond Pool (TFBP) 399,237 85,596 - 484,833Montana Domestic Equity Pool (MDEP) 763,959 268,504 9,451,735 10,484,198Montana International Equity Pool (MTIP) 635,222 401,789 6,795,462 7,832,473Montana Private Equity Pool (MPEP) 501,500 78,320 13,422,569 14,002,389Montana Real Estate Pool (MTRP) 536,133 28,032 5,944,802 6,508,967Short Term Investment Pool (STIP) 462,467 248,408 - 710,875All Other Funds (AOF) Investments Managed 878,289 119,596 63,636 1,061,521
Total 4,596,300 1,337,729 35,678,204 41,612,233
Fiscal 2008 Management Fees
Fiscal 2009 Management Fees
{This area intentionally left blank}
A-12

STATE OF MONTANA BOARD OF INVESTMENTS CONSOLIDATED UNIFIED INVESTMENT PROGRAM FINANICAL STATEMENT
3. INVESTMENT COMMITMENTS
Investments in private equity and private real estate are usually made via Limited Partnership Agreements that involve many limited partners and a General Partner who is responsible for all investment decisions. The Limited Partners make an original commitment, after which capital is called as needed by the General Partner to make investments. These Agreements will usually last for a minimum of 10 years. The table below shows the remaining Board commitments to private equity funds.
Original Commitment Carrying FairFund Manager Name Commitment Remaining Value Value
Adams Street 284,954,433$ 37,655,391$ 186,510,950$ 161,260,747$ Affinity Equity Partners 15,000,000 11,158,726 3,075,440 1,386,599ArcLight 50,000,000 6,278,158 33,953,117 33,423,928Avenue Capital 35,000,000 5,845,689 27,943,678 19,512,819Buerk Dale Victor 15,000,000 8,493,750 6,600,000 5,617,062Carlyle Partners 60,000,000 13,333,398 42,563,474 38,164,593CCMP Capital Advisors 30,000,000 21,078,371 7,944,068 6,565,542First Reserve Corporation 55,000,000 24,949,862 29,611,426 25,652,600HarbourVest Partners 61,823,772 51,217,597 10,578,431 8,338,314Hellman & Friedman 40,000,000 24,349,118 15,363,776 13,342,072Highway 12 Investors 10,000,000 5,982,483 3,428,226 2,966,993Industry Ventures 10,000,000 16,346 7,758,929 7,365,001J.C. Flowers & Co 25,000,000 565,404 22,876,213 7,121,684JLL Partners 25,000,000 3,045,166 18,832,481 17,566,411Lexington Capital Partners 140,000,000 51,143,061 39,841,724 47,109,359Madison Dearborn 75,000,000 27,057,671 40,516,906 36,856,052MatlinPatterson Global Advisers 30,000,000 11,970,000 17,285,321 9,934,444MHR Institutional Investors 25,000,000 9,500,000 14,438,692 11,632,330NB Co-investment Partners 35,000,000 11,115,775 17,796,240 14,404,170Oak Hill Capital Partners 45,000,000 16,057,287 26,847,714 27,942,306Oaktree 35,000,000 8,750,000 25,749,460 22,576,225Odyssey 45,000,000 20,919,488 17,342,172 18,139,341Performance Equity Management 25,000,000 23,667,548 1,133,000 1,060,352Portfolio Advisors 55,000,000 27,736,893 25,042,564 22,356,655Quintana Energy Partners 15,000,000 4,588,772 9,946,620 8,477,435Siguler Guff 25,000,000 14,256,129 10,550,520 9,482,206TA Associates 10,000,000 10,000,000 0 0Terra Firma Capital Partners 25,432,997 9,940,268 13,886,770 4,056,428Trilantic Capital Partners 11,098,351 7,111,275 3,471,692 3,276,999Welsh Carson 75,000,000 14,041,026 43,292,320 49,058,142
Total MPEP Commitments 1,388,309,553$ 481,824,652$ 724,181,924$ 634,646,809$
MPEP Commitments as of June 30, 2009
{This area intentionally left blank}
A-13

STATE OF MONTANA BOARD OF INVESTMENTS CONSOLIDATED UNIFIED INVESTMENT PROGRAM FINANICAL STATEMENT
The table below shows the remaining Board commitments to private real estate funds.
Original Commitment Carrying Fair Fund Manager Name Commitment Remaining Value Value
ABR Chesapeake $ 20,000,000 $ 2,000,000 $ 17,770,784 $ 18,109,958 AG (Angelo Gordon) Realty 40,000,000 27,100,000 12,576,366 10,607,192 Apollo Real Estate Finance Corp. 20,000,000 10,921,000 9,079,000 9,081,470 Beacon Capital Partners 25,000,000 8,437,500 16,562,500 7,250,218 Carlyle Europe Real Estate Partners 29,920,000 21,796,895 8,844,179 5,768,448 CIM 25,000,000 23,503,568 1,496,432 271,332 DRA Advisors 35,000,000 18,960,405 13,261,356 11,758,089 Liquid Realty 30,000,000 11,390,823 15,535,698 11,603,582 Macquarie Global Property 30,000,000 17,626,226 12,529,074 3,619,286 O'Connor North American Property Partners 15,000,000 6,355,503 8,245,199 3,148,058 Rothschild: Five Arrows Realty Securities 30,000,000 26,418,769 3,208,215 3,450,932 Strategic Partners Value Enhancement 19,200,000 1,714,481 16,765,519 18,727,286 TA Associates Realty 15,000,000 15,000,000 - - JER Real Estate Partners 20,000,000 4,688,122 15,311,878 8,240,899 Total MTRP Commitments $ 354,120,000 $ 195,913,292 $ 151,186,200 $ 111,636,750
MTRP Commitments as of June 30, 2009
4. TYPES OF INVESTMENTS
Bond Pools and AOF Investments – The RFBP, TFBP and AOF fixed income portfolios include corporate and foreign government bonds; U.S. government direct obligations and U.S. government agency securities; and cash equivalents. U.S. government direct obligations include U.S. Treasury securities and debt explicitly guaranteed by the U.S. government. U.S. government agency securities include U.S. government agency and mortgage-backed securities. U.S. government mortgage-backed securities reflect participation in a pool of residential mortgages.
The bond Pools also include structured financial instruments known as REMIC securities (Real Estate Mortgage Investment Conduits). These investments are pass-through vehicles for multi class mortgage-backed securities and some may be interest-only strips (IO). These investments represent the separate purchase of the principal and interest cash flows of a mortgage security and receive cash flows from the interest payment component on underlying mortgage loans. These securities are identified and reported as U.S. government agency in the investment risk and portfolio disclosures.
Public Equity Pools -The public equity Pools may include common stock, equity index shares, preferred stock, convertible equity securities, American Depositary Receipts (ADR), equity derivatives, and commingled funds. Common stock represents ownership units (shares) of a public corporation. Common stock owners may vote on director selection and other important matters and receive dividends if the company pays dividends. Equity index investments are comprised of shares in institutional commingled funds with equity portfolios that match a broad based index or specific industry composite. Preferred stocks pay dividends at a specified rate and have preference in the payment of dividends and liquidation of assets. Preferred stock holders do not usually have voting rights.
Convertible securities permit the holder to exchange, or “convert” the instrument for other securities of the issuer or of another issuer. This definition most often applies to preferred stocks or corporate bonds carrying the right to exchange for a fixed number of shares of the issuer’s common stock. ADR investments are receipts issued by a U.S. depositary bank representing shares of a foreign stock or bonds held abroad by the foreign sub-custodian of the American depositary bank. Equity derivatives, such as futures and options, “derive” their value from underlying equity instruments. An institutional commingled fund combines assets from several institutional investors that are blended or pooled together, to reduce management and administration costs. The investor buys shares in the fund.
The MDEP portfolio is limited to domestic stock or ADR investments, while the MTIP portfolio may include holdings of securities of foreign-based corporations listed on legal and recognized foreign exchanges as well as domestic exchanges.The MTIP portfolio invests in both developed and emerging markets.
A-14

STATE OF MONTANA BOARD OF INVESTMENTS CONSOLIDATED UNIFIED INVESTMENT PROGRAM FINANICAL STATEMENT
Alternative Investment Pools - The Montana Private Equity Pool (MPEP) may include venture capital, leveraged buyout, mezzanine, distressed debt, special situation and secondary investments. These investments are made via Limited Partnership Agreements in which the Board and other institutional investors invest as Limited Partners in funds managed by a General Partner. These investments are riskier with higher potential return than public equity investments and are less liquid because the funds are usually committed for at least 10 years. Because of the risk and illiquidity, these investments are limited to sophisticated investors only. The MPEP invests its cash in the State Street SPIFF (Stock Performance Index Futures Fund).
The Montana Real Estate Pool (MTRP) includes investments in private core, value-added, and opportunistic real estate. Core investments are the least risky with the lowest return and are usually managed in commingled accounts in which the investor purchases shares. Value-added and opportunistic real estate investments provide more risk and return and are less liquid than core investments. These investments are usually made through Limited Partnership Agreements. The MTRP invests its cash in STIP.
STIP –This Pool is managed to preserve principal, while obtaining money market type returns and 24-hour liquidity. Funds may be invested for one or more days. Although it is not registered with the Securities and Exchange Commission (SEC) as an investment company, STIP is managed consistent with the SEC rule 2a7 of the Investment Company Act of 1940. As a 2a7-like pool, the STIP utilizes an amortized cost unit value to report net assets. The portfolio may include asset-backed securities, commercial paper, corporate, U.S. government direct obligations, U.S. government agency securities, repurchase agreements, institutional money market funds, certificates of deposit and variable-rate (floating-rate) instruments. Investments must have a maximum maturity of 397 days or less unless they have rate reset dates. The portfolio is carried at amortized cost or book value with a constant unit value of $1.00.
Asset-backed securities are debt securities collateralized by a pool of mortgage and non-mortgage assets such as trade and loan receivables, equipment leases, credit cards, etc. Commercial paper is unsecured short-term debt with maturities ranging from 1 to 270 days. Commercial paper issued at a discount, direct or by brokers, is backed by bank credit lines. U.S. government direct-backed securities include direct obligations of the U.S. Treasury and obligations explicitly guaranteed by the U.S. government. U.S. government indirect-backed obligations include U.S. government agency and mortgage-backed securities. Repurchase agreements (REPO) represent an agreement between a seller and a buyer, usually of U.S. government securities, whereby the seller agrees to repurchase the securities at an agreed upon price and stated time. Variable-rate (floating-rate) securities pay a variable rate of interest until maturity. The STIP portfolio’s variable-rate securities float with LIBOR (London Interbank Offered Rate).
AOF - In addition to fixed income investments, the AOF portfolio includes an equity index fund, real estate buildings, commercial loans and residential mortgages. Equity index investments are investments in institutional commingled funds whose equity portfolios match a broad based index or composite.
The AOF Montana mortgages and loans receivable represent residential mortgages and commercial loans funded by the Public Employees’ and Teachers’ pension funds and the Coal Severance Tax Trust fund. The Coal Severance Tax Trust loan portfolio includes loans made by the Montana Science and Technology Alliance (MSTA) Board. The MSTA Board was abolished on July 1, 1999 and the MSTA portfolio was assigned to the Board. (See Note 10) for the Montana mortgages and loans portfolio). There are no uncollectible account balances for Montana mortgages and loans receivable as of June 30, 2009 and 2008.
5. SECURITIES LENDING
The Board is authorized by law to lend its securities and has contracted with the custodial bank, State Street Bank and Trust “the Bank”, to lend the Board’s securities to broker-dealers and other entities with a simultaneous agreement to return the collateral for the same securities in the future. The custodial bank is required to maintain collateral equal to 102 percent of the fair value of domestic securities and 105 percent of the fair value of international securities while the securities are on loan. The Board and the bank split the earnings on security lending activities.
During fiscal years 2009 and 2008, the custodial bank lent Board public securities and received U.S. dollar and foreign currency cash, securities issued or guaranteed by the U.S. government, sovereign debt rated A or better, convertible bonds, and irrevocable bank letters of credit as collateral. The custodial bank cannot pledge or sell collateral securities unless the borrower defaults. The Board imposed no restrictions on the amount of securities available to lend during fiscal years 2009 and 2008. There were no failures by any borrowers to return loaned securities or pay distributions thereon during the period that resulted in a declaration and notice of Default of the Borrower (other than the default by Lehman Brothers Inc. which occurred in September 2008 and the Board was made whole in the process). There were no losses resulting from a borrower default.
A-15

STATE OF MONTANA BOARD OF INVESTMENTS CONSOLIDATED UNIFIED INVESTMENT PROGRAM FINANICAL STATEMENT
During fiscal years 2009 and 2008, the Board and the borrowers maintained the right to terminate all securities lending transactions on demand. The cash collateral received for each loan was invested, together with the cash collateral of other qualified plan lenders, in a collective investment pool. The Securities Lending Quality Trust had an average duration of 43 and 41 days, respectively, as of June 30, 2009 and 2008. The Quality D Trust had an average duration of 31 and 42 days, respectively, as of June 30, 2009 and 2008. Because the loans were terminable at will, their duration generally did not match the duration of the investments made with cash collateral. At year-end 2009 and 2008, the Board had no credit risk exposure to borrowers because the collateral pledged by the borrowers exceeded the value of the securities borrowed. The private equity and real estate Pools do not participate in securities lending. The Pool and AOF securities on loan, at fair value, and the collateral pledged are shown below.
Fair Value Collateral Collateral CollateralPool/AOF On Loan Cash Securities Total
Retirement Funds Bond Pool (RFBP) 599,522,116$ 313,453,011$ 299,510,661$ 612,963,672$ Trust Funds Bond Pool (TFBP) 571,971,070 296,273,391 288,554,755 584,828,146 Montana Domestic Equity Pool (MDEP) 166,222,056 167,431,181 3,863,114 171,294,295 Montana International Equity Pool (MTIP) 65,213,389 63,303,243 5,881,313 69,184,556 Short Term Investment Pool (STIP) 694,243,673 151,016,485 557,737,295 708,753,780 AOF Investments Managed 383,273,644 209,254,190 181,932,110 391,186,300
Total 2,480,445,948$ 1,200,731,501$ 1,337,479,248$ 2,538,210,749$
Fair Value Collateral Collateral CollateralPool/AOF On Loan Cash Securities Total
Retirement Funds Bond Pool (RFBP) 757,648,616$ 100,299,351$ 673,980,520$ 774,279,871$ Trust Funds Bond Pool (TFBP) 523,354,390 86,356,146 448,208,570 534,564,716 Montana Domestic Equity Pool (MDEP) 297,267,013 281,984,538 23,804,824 305,789,362 Montana International Equity Pool (MTIP) 121,418,250 76,460,958 50,812,599 127,273,557 Short Term Investment Pool (STIP) 389,544,349 101,755,298 295,637,500 397,392,798 AOF Investments Managed 446,160,367 189,347,552 265,784,180 455,131,732
Total 2,535,392,985$ 836,203,843$ 1,758,228,193$ 2,594,432,036$
June 30, 2009
June 30, 2008
{This area intentionally left blank}
A-16

STATE OF MONTANA BOARD OF INVESTMENTS CONSOLIDATED UNIFIED INVESTMENT PROGRAM FINANICAL STATEMENT
Securities lending income and expenses are shown below.
Pool/AOF Gross Income Expenses Net Income
Retirement Funds Bond Pool (RFBP) 4,978,874$ 2,108,769$ 2,870,105$ Trust Funds Bond Pool (TFBP) 4,173,161 1,723,979 2,449,182 Montana Domestic Equity Pool (MDEP) 4,136,857 2,166,856 1,970,001 Montana International Equity Pool (MTIP) 1,723,900 523,151 1,200,749 Short Term Investment Pool (STIP) 4,555,947 1,531,248 3,024,699 AOF Investments Managed 4,282,913 1,895,317 2,387,596
Total 23,851,652$ 9,949,320$ 13,902,332$
Pool/AOF Gross Income Expenses Net Income
Retirement Funds Bond Pool (RFBP) 5,591,740$ 4,349,359$ 1,242,381$ Trust Funds Bond Pool (TFBP) 4,682,296 3,704,509 977,787 Montana Domestic Equity Pool (MDEP) 13,405,691 11,571,573 1,834,118 Montana International Equity Pool (MTIP) 5,207,845 3,873,964 1,333,881 Short Term Investment Pool (STIP) 3,187,854 2,494,740 693,114 AOF Investments Managed 10,059,739 8,618,135 1,441,604
Total 42,135,165$ 34,612,280$ 7,522,885$
Fiscal Year 2009
Fiscal Year 2008
6. INVESTMENT RISK DISCLOSURES
Effective June 30, 2005, the Board implemented the provisions of Governmental Accounting Standards Board (GASB) Statement No. 40 – Deposit and Investment Risk Disclosures. The investment risk disclosures are described in the following paragraphs.
Credit Risk - Credit risk is defined as the risk that an issuer or other counterparty to an investment will not fulfill its obligation. With the exception of the U.S. government securities, the RFBP, TFBP and AOF fixed income instruments have credit risk as measured by major credit rating services. This risk is that the issuer of a fixed income security may default in making timely principal and interest payments. The Board of Investments’ policy requires RFBP, TFBP and AOF fixed income investments, at the time of purchase, to be rated an investment grade as defined by Moody’s or by Standard & Poor’s (S&P) rating services. The U.S. government securities are guaranteed directly or indirectly by the U.S. government. Obligations of the U.S. government or obligations explicitly guaranteed by the U.S. government are not considered to have credit risk and do not require disclosure of credit quality. The credit ratings presented in the tables below are provided by the S&P rating services. If an S&P rating is not available, a Moody’s rating has been used.
Custodial Credit Risk - Custodial credit risk is the risk that, in the event of the failure of the counterparty to a transaction, the Board may not be able to recover the value of the investment or collateral securities that are in the possession of an outside party. As of June 30, 2009 and 2008, all the public securities as well as securities held by the separate public equity account managers were registered in the nominee name for the Montana Board of Investments and held in the possession of the Board’s custodial bank, State Street Bank. The Equity Index, US Bank repurchase agreement, Real Estate, Mortgage and Loan investments were purchased and recorded in the Board’s name. Commingled fund investments are registered in the name of the Montana Board of Investments.
Concentration of Credit Risk – Concentration of credit risk is the risk of loss attributed to the magnitude of an investor’s investment in a single issuer. Investments issued or explicitly guaranteed by the U.S. government are excluded from the concentration of credit risk requirement.
A-17

STATE OF MONTANA BOARD OF INVESTMENTS CONSOLIDATED UNIFIED INVESTMENT PROGRAM FINANICAL STATEMENT
Although the RFBP Investment Policy does not address concentration of credit risk, the TFBP Investment Policy states: “with the exception of U.S. government/agency securities, additional purchases will not be made in a credit if the credit risk exceeds 2 percent of the portfolio at the time of purchase”. The RFBP had concentration of credit risk exposure to the Federal National Mortgage Association (Fannie Mae) of 16.06% as of June 30, 2009 and 9.62% as of June 30, 2008, while the TFBP had concentration of credit risk exposure to the same issuer of 22.63% as of June 30, 2009 and 12.96% as of June 30, 2008. The RFBP had concentration of credit risk exposure to the Federal Home Loan Mortgage Corp. (Freddie Mac) of 13.44% as of June 30, 2009 and 23.01% as of June 30, 2008, while the TFBP had concentration of credit risk exposure to the same issuer of 13.60% as of June 30, 2009 and 22.79% as of June 30, 2008.
With the exception of one fund, the 19 investment policy statements for various AOF state agencies do not address concentration of credit risk. One fund requires credit risk to be limited to 3 percent in any one name except AAA rated issues will be limited to 6%. This fund also has specific client preferences. Investments by various state agencies, pooled as the All Other Funds, are excluded from the concentration of credit risk requirement.
MDEP - As of June 30, 2009 and 2008, there were no single issuer investments that exceeded 5% of the MDEP portfolio.
STIP - The STIP had concentration of credit risk exposure to the Federal Home Loan Bank of 10.04%, Federal National Mortgage Association (Fannie Mae) of 8.67 % and the Federal Home Loan Mortgage Corp. (Freddie Mac) of 8.69% as of June 30, 2009. The STIP had concentration of credit risk exposure to the Federal Home Loan Bank of 6.86%, Federal National Mortgage Association (Fannie Mae) of 7.55 % and the Federal Home Loan Mortgage Corp. (Freddie Mac) of 5.71% as of June 30, 2008.
{This area intentionally left blank}
A-18

STATE OF MONTANA BOARD OF INVESTMENTS CONSOLIDATED UNIFIED INVESTMENT PROGRAM FINANICAL STATEMENT
Foreign Currency Risk - Foreign currency risk is the risk that changes in exchange rates will adversely affect the fair value of an investment. As of the June 30, 2009 exchange date, the MPEP, MTRP and MTIP U.S. dollar equivalent cash and equity positions, by currency, are reported in the tables below.
Carrying Fair Carrying FairCurrency Fund Manager Name Value Value Value Value
EURO Terra Firma Fund III 13,886,770$ 4,056,428 12,173,472$ 13,310,847 EURO HarbourVest Intl Private Equity Fund VI 187,381 142,142 - - EURO Carlyle Europe Real Estate Partners III 8,844,179 5,768,448 6,343,764 6,093,311
Total MPEP and MTRP 22,918,330$ 9,967,018 18,517,236$ 19,404,158
MPEP and MTRP Investment by Foreign Currency
2009 2008
Carrying Fair Carrying FairCash Amount Value Amount Value
Australian Dollar 480,564$ 483,283$ 388,969$ 392,722$ Brazilian Real 39,031 38,924 18,417 18,974 Canadian Dollar 104,992 104,101 729,945 732,038 Danish Krone 35,639 35,544 64,175 66,795 Hong Kong Dollar 232,036 232,037 1,278,638 1,280,107 Indonesian Rupiah - - 697 701 Hungarian Forint 224 176 - - Euro 2,006,216 2,007,550 2,529,837 2,565,670 Israeli Shekel 629 631 17,983 18,058 Japanese Yen 1,002,547 995,437 1,814,509 1,829,773 South Korean Won 12,222 12,353 8,686 8,651 Malaysian Ringgit 65,941 66,269 13,344 13,381 Mexican Peso 37,585 37,820 69,810 70,029 New Zealand Dollar 5,816 6,783 7,480 7,075 Norwegian Krone 92,283 91,305 495,854 503,343 Philippine Peso 21,355 21,022 638 636 Polish Zloty - - 477 489 Singapore Dollar 74,424 74,866 471,294 475,107 South African Rand 16,854 17,043 - - Swedish Krona 92,988 93,486 863,157 883,046 Swiss Franc 258,450 258,297 47,494 49,286 New Taiwan Dollar 1,039,862 1,042,486 73,658 73,838 Thailand Baht 21,545 21,524 6,001 5,997 Turkish Lira 819 829 288 290 UK Pound Sterling 86,390 86,284 464,024 468,669 US Dollar - - 3,937 3,937 Total Cash 5,728,412$ 5,728,050$ 9,369,313$ 9,468,612$
MTIP Cash by Currency
2009 2008
A-19

STATE OF MONTANA BOARD OF INVESTMENTS CONSOLIDATED UNIFIED INVESTMENT PROGRAM FINANICAL STATEMENT
Carrying Fair Carrying FairSecurities Amount Value Amount Value
Australian Dollar 30,260,841 32,903,810 35,668,174 47,035,005 Brazilian Real 4,628,122 5,251,484 6,283,707 6,965,888 Canadian Dollar 31,433,124 32,034,694 41,840,802 49,716,338 Czech Koruna 214,664 201,470 418,951 769,564 Danish Krone 3,866,154 4,577,923 8,647,759 12,176,042 Euro-Austria 2,580,038 1,655,778 12,591,907 13,804,890 Euro-Belgium 5,046,800 4,782,666 12,405,503 8,427,354 Euro-Finland 3,413,508 2,624,201 15,820,495 15,418,566 Euro-France 53,382,050 45,184,925 73,476,141 67,502,708 Euro-Germany 40,116,313 33,401,278 71,763,475 78,858,322 Euro-Greece 2,269,731 1,872,287 6,809,661 6,768,565 Euro-Ireland 1,192,290 1,116,947 591,692 629,007 Euro-Italy 13,990,529 12,035,287 40,017,833 36,404,573 Euro-Netherlands 26,702,968 22,729,981 34,642,646 35,886,023 Euro-Portugal 1,281,398 1,162,378 2,510,681 2,616,331 Euro-Spain 20,592,370 20,969,426 34,179,576 34,032,983 Euro-Subtotal 170,567,996 147,535,153 304,809,610 300,349,321 Hong Kong Dollar 36,060,481 39,976,913 44,311,905 44,072,366 Indonesian Rupiah 932,591 991,352 1,462,993 1,404,300 Hungarian Forint 1,167,430 846,555 - - Israeli Shekel 458,194 478,830 1,322,599 1,972,933 Japanese Yen 124,323,207 111,939,135 175,132,645 168,174,661 South Korean Won 13,108,496 13,388,723 17,699,117 18,269,893 Malaysian Ringgit 2,127,041 2,306,644 1,922,403 1,857,066 Mexican Peso 1,113,465 1,028,059 5,722,857 5,914,973 New Zealand Dollar - - 344,101 244,630 Norwegian Krone 6,199,345 5,253,753 10,467,297 13,130,710 Philippine Peso 256,703 306,009 1,108,064 1,099,907 Polish Zloty 1,686,632 975,614 924,737 997,288 Singapore Dollar 7,482,675 8,205,570 11,685,220 13,421,869 South Africian Rand 3,357,737 3,561,828 4,466,878 4,657,980 Swedish Krona 9,103,044 8,897,260 9,726,554 8,781,470 Swiss Franc 38,689,550 34,738,384 40,893,896 42,437,671 New Taiwan Dollar 9,612,517 9,423,341 8,325,947 8,560,020 Thailand Baht 2,324,852 3,075,413 2,096,267 2,082,642 Turkish Lira 1,331,487 1,403,368 1,403,549 1,744,517 UK Pound Sterling 93,001,078 85,236,377 135,918,845 129,715,160 Total Equity 593,307,425 554,537,663 872,604,876 885,552,215
MTIP Equities by Currency
2009 2008
Interest Rate Risk - Bond Pool and AOF interest rate risk is the risk that changes in interest rates will adversely affect the fair value of an investment. The AOFs’ investment policies do not formally address interest rate risk. In accordance with GASB Statement No. 40, the Board utilizes the effective duration method to disclose interest rate risk for the Bond Pool and AOF portfolios. This method provided by the custodial bank and analytic software is “An option-adjusted measure of a bond’s (or portfolio’s) sensitivity to changes in interest rates. Duration is calculated as the average percentage change in a bond’s price for a given change in interest rates. Prices move inversely to interest rates. The effective duration method incorporates the effect of the embedded options for bonds and changes in prepayments for mortgage-backed securities (including pass-through securities, CMO, and ARM securities).”
A-20

STATE OF MONTANA BOARD OF INVESTMENTS CONSOLIDATED UNIFIED INVESTMENT PROGRAM FINANICAL STATEMENT
Corporate asset-backed securities are based on cash flows from principal and interest payments on underlying auto loan receivables, credit card receivables, and other assets. These securities, while sensitive to prepayments due to interest rate changes, have less credit risk than securities not backed by pledged assets.
As reported in the U.S. government agency category, the RFBP portfolio held REMIC securities totaling $215,648 and $249,844 at amortized cost, respectively, as of June 30, 2009 and June 30, 2008, while the TFBP portfolio held REMIC securities totaling $34,264 and $46,806 at amortized cost respectively. REMICs (Real Estate Mortgage Investment Conduits) are pass-through vehicles for multiclass mortgage-backed securities. These securities are based on separate or combined cash flows from principal and interest payments on underlying mortgages.
The Bond Pools and AOF portfolio fixed income securities pay a fixed rate of interest until maturity while the variable rate (floating rate) securities pay a variable rate of interest until maturity. As of June 30, 2009 and 2008, these portfolios held certain variable rate issues. These securities float with LIBOR (London Interbank Offered Rate). See Note 14 for the Year End Portfolios.
As of June 30, 2009 and 2008, the Bond Pools and AOF portfolio held five Collateralized Debt Obligations (CDO). A CDO is security backed by a pool of bonds, loans and other assets. CDOs do not specialize in one type of debt but are often non-mortgage loans or bonds. These CDO positions, totaling $135 million par, are categorized as rated corporate debt in the three portfolios.
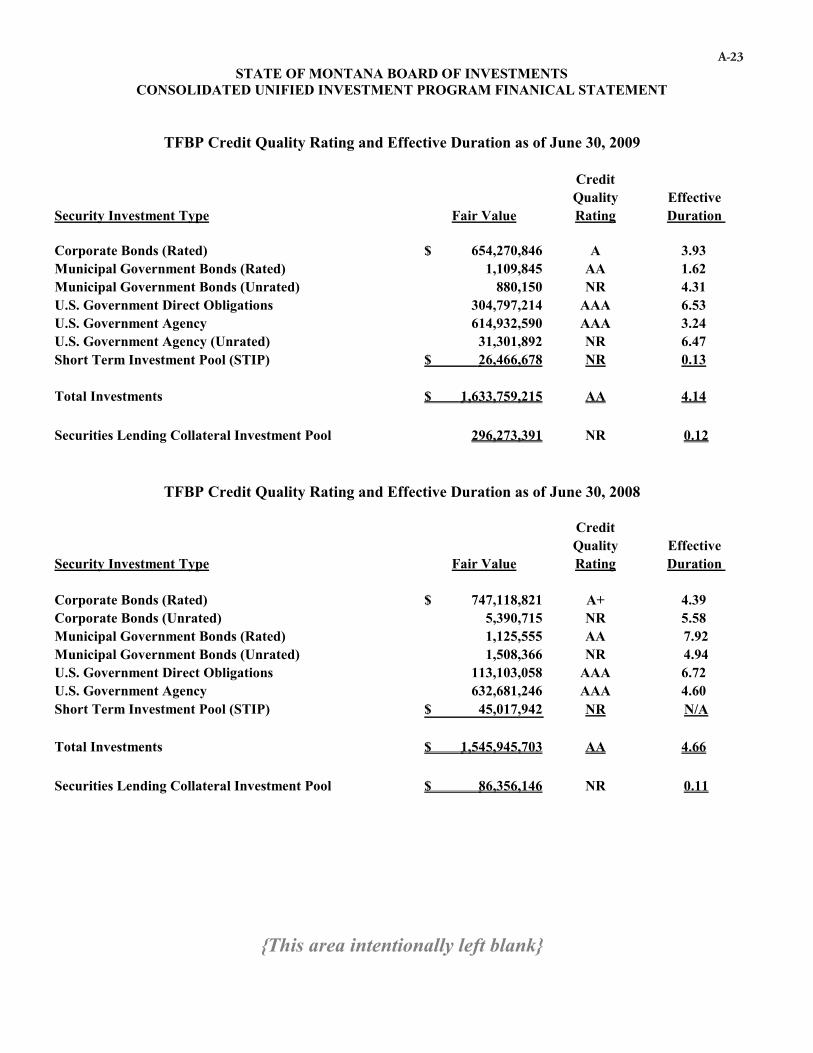
Bond Pool and AOF investments are categorized below to disclose credit and interest rate risk as of June 30, 2009 and June 30, 2008. Credit risk reflects the bond quality rating, by investment type, as of the June 30 report date. Interest rate risk is disclosed using effective duration. If a bond investment type is unrated, the quality type is indicated by NR (not rated). The credit quality ratings have been calculated excluding non-rated cash equivalents. If duration has not been calculated, duration is indicated by NA (not applicable).
{This area intentionally left blank}
A-21

STATE OF MONTANA BOARD OF INVESTMENTS CONSOLIDATED UNIFIED INVESTMENT PROGRAM FINANICAL STATEMENT
CreditQuality Effective
Security Investment Type Fair Value Rating Duration
Corporate Bonds (Rated) 801,929,008$ A- 4.29Corporate Bonds (Unrated) 17,277 NR 1.39U.S. Government Direct Obligations 252,322,011 AAA 5.99U.S. Government Agency 569,776,106 AAA 3.05U.S. Government Agency (Unrated) 35,919,192 NR 7.63State Street Short Term Investment Fund (STIF) 44,565,804 NR 0.15State Street Repurchase Agreement* 2,721,652 AA- 0.00Short Term Investment Pool (STIP) 118,747 NR 0.13 Total Fixed Income Investments 1,707,369,797$ AA- 4.08
Securities Lending Collateral Investment Pool 313,453,011$ NR 0.08
CreditQuality Effective
Security Investment Type Fair Value Rating Duration
Corporate Bonds (Rated) 996,726,110$ A 4.77Corporate Bonds (Unrated) 13,016,381 NR 6.43U.S. Government Direct Obligations 127,133,284 AAA 5.23U.S. Government Agency 783,061,173 AAA 4.33Short Term Investment Pool (STIP) 71,764,367 NR NA Total Fixed Income Investments 1,991,701,315$ AA 4.63
Securities Lending Collateral Investment Pool 100,299,351$ NR 0.12
RFBP Credit Quality Rating and Effective Duration as of June 30, 2009
*At June 30, 2009, the State Street Bank repurchase agreement, per contract, was collateralized at 102% for $2,778,649 by a U.S. Treasury bill maturing October 1, 2009. This security carries a AAA credit rating.
RFBP Credit Quality Rating and Effective Duration as of June 30, 2008
{This area intentionally left blank}
A-22
STATE OF MONTANA BOARD OF INVESTMENTS CONSOLIDATED UNIFIED INVESTMENT PROGRAM FINANICAL STATEMENT
CreditQuality Effective
Security Investment Type Fair Value Rating Duration
Corporate Bonds (Rated) 654,270,846$ A 3.93Municipal Government Bonds (Rated) 1,109,845 AA 1.62Municipal Government Bonds (Unrated) 880,150 NR 4.31U.S. Government Direct Obligations 304,797,214 AAA 6.53U.S. Government Agency 614,932,590 AAA 3.24U.S. Government Agency (Unrated) 31,301,892 NR 6.47Short Term Investment Pool (STIP) 26,466,678$ NR 0.13
Total Investments 1,633,759,215$ AA 4.14
Securities Lending Collateral Investment Pool 296,273,391 NR 0.12
CreditQuality Effective
Security Investment Type Fair Value Rating Duration
Corporate Bonds (Rated) 747,118,821$ A+ 4.39Corporate Bonds (Unrated) 5,390,715 NR 5.58Municipal Government Bonds (Rated) 1,125,555 AA 7.92Municipal Government Bonds (Unrated) 1,508,366 NR 4.94U.S. Government Direct Obligations 113,103,058 AAA 6.72U.S. Government Agency 632,681,246 AAA 4.60Short Term Investment Pool (STIP) 45,017,942$ NR N/A
Total Investments 1,545,945,703$ AA 4.66
Securities Lending Collateral Investment Pool 86,356,146$ NR 0.11
TFBP Credit Quality Rating and Effective Duration as of June 30, 2009
TFBP Credit Quality Rating and Effective Duration as of June 30, 2008
{This area intentionally left blank}
A-23

STATE OF MONTANA BOARD OF INVESTMENTS CONSOLIDATED UNIFIED INVESTMENT PROGRAM FINANICAL STATEMENT
CreditQuality
Security Investment Type Fair Value Rating
Corporate Bonds (Rated) 537,914,438$ A 3.64Corporate Bonds (Unrated) 3,000,000 NR (2.20)U.S. Government Direct Obligations 120,977,683 AAA 6.20U.S. Government Agency 398,775,241 AAA 3.32US Bank Sweep Repurchase Agreement* 15,845,774 NR 0 Total Fixed Income Investments 1,076,513,136$ AA 3.74
Direct InvestmentsEquity Index Fund 81,742,906$ Real Estate 17,294,299MT Mortgages and Loans 256,570,896 Total Direct Investments 355,608,101$
TOTAL INVESTMENTS 1,432,121,237$
Securities Lending Collateral Investment Pool 209,254,190$ NR 0.12
CreditQuality
Security Investment Type Fair Value Rating
Corporate Bonds (Rated) 499,796,852$ A+ 3.68U.S. Government Direct Obligations 63,654,728 AAA 5.56U.S. Government Agency 524,206,909 AAA 3.03US Bank Sweep Repurchase Agreement* 12,123,446 NR NA Total Fixed Income Investments 1,099,781,935$ AA 3.06
Direct InvestmentsEquity Index Fund 87,443,325$ Real Estate 17,282,489MT Mortgages and Loans 254,644,041 Total Direct Investments 359,369,855$
TOTAL INVESTMENTS 1,459,151,790$
Securities Lending Collateral Investment Pool 189,347,553$ NR 0.11
*At June 30, 2008, the US Bank repurchase agreement, per contract,was collateralized at 102% for $12,368,170 by a Federal National Mortgage FNCI maturing September 1, 2018. This security carries a AAA credit quality rating.
Effective Duration
Effective Duration
AOF Credit Quality Rating and Effective Duration as of June 30, 2009
*At June 30, 2009, the US Bank repurchase agreement, per contract,was collateralized at 102% for $16,162,802 by two Federal Home Loan Mortgage Corporation Gold securities maturing July 1, 2018 and November 1, 2035. These securities carry AAA credit quali
AOF Credit Quality Rating and Effective Duration as of June 30, 2008
A-24

STATE OF MONTANA BOARD OF INVESTMENTS CONSOLIDATED UNIFIED INVESTMENT PROGRAM FINANICAL STATEMENT
STIP investments are categorized below to disclose credit risk as of June 30, 2009 and June 30, 2008. Credit risk reflects the security quality rating by investment type, as of the June 30 report date. If a security investment type is unrated, the quality type is indicated by NR (not rated). Although the STIP investments have been rated by investment security type, STIP, as an external investment pool, has not been rated.
STIP interest rate risk is determined using the weighted average maturity (WAM) method. The WAM measure expresses investment time horizons – the time when investments are due and payable in days, months or years – weighted to reflect the dollar size of the individual investments within an investment type. The WAM, calculated in days, for the STIP portfolio is disclosed below. The June 30, 2008 WAM, previously stated in months, has been restated in days. The WAM is not available for the SIV securities.
Credit WAMQuality in
Security Investment Type Amortized Cost Rating Days
Asset Backed Commercial Paper $ 299,326,610 A1 23Corporate Commercial Paper 164,976,250 A1 16Corporate Fixed 36,474,136 A3 196Corporate Variable-Rate 364,248,333 A3 67Certificates of Deposit Fixed 25,000,000 A1+ 360Certificates of Deposit Variable-Rate 105,000,000 A1 62U.S. Government Agency Fixed 140,672,204 A1+ 73U.S. Government Agency Variable -Rate 750,530,748 A1+ 45Money Market Funds (Unrated) 121,427,621 NR 1Money Market Funds (Rated) 180,000,000 A1+ 1Structured Investment Vehicles (SIV) 113,625,566 D NA
Total Investments $ 2,301,281,468 A1 46
Securities Lending Collateral Investment Pool $ 151,016,485 NR 43
Credit WAMQuality in
Security Investment Type Amortized Cost Rating Days
Commercial Paper $ 1,278,677,750 A1+ 28Corporate Variable-Rate 179,971,989 A1 48Certificates of Deposit 79,997,934 A1+ 98U.S. Government Agency 439,007,788 A1+ 107Money Market Funds (Unrated) 149,352,667 NR 1Money Market Funds (Rated) 55,000,000 A1+ 1Structured Investment Vehicles (SIV) 140,000,000 D NA
Total Investments $ 2,322,008,128 A1 46
Securities Lending Collateral Investment Pool $ 101,755,297 NR 41
STIP Credit Quality Ratings and Weighted Average Maturity as of June 30, 2009
STIP Credit Quality Ratings and Weighted Average Maturity as of June 30, 2008
A-25

STATE OF MONTANA BOARD OF INVESTMENTS CONSOLIDATED UNIFIED INVESTMENT PROGRAM FINANICAL STATEMENT
Legal and Credit Risk
STIP - In January 2007, the Board purchased a $25 million par issue of Orion Finance USA. In April 2007, the Board purchased two issues of Axon Financial Funding totaling $90 million par and another $25 million par issue of Orion Finance USA. As of June 30, 2007, these Structured Investment Vehicle (SIV) securities held in the STIP portfolio carried a combined amortized cost of $139,991,131 representing 5.02% of the total portfolio. At the time of purchase and as of June 30, 2007, these four issues received the highest investment grade rating of AAA by Standard & Poors and Aaa by Moody’s. As of June 30, 2009 and 2008, these issues carried a D rating by Standard & Poors. On November 20, 2007, an insolvency event was declared by Axon Finance USA. Orion Financial Funding declared an insolvency event on January 14, 2008. On the January and April 2008 maturity dates, these securities matured at their amortized cost of $140 million. The Board has determined that it is currently in the best interest of the STIP to continue to hold these securities in the investment portfolio. These SIV securities are currently generating cash to be applied to the securities.
Of the $5,687,990 Interest Receivable total as of June 30, 2008, $2,729,889 is attributable to the above securities for interest accrued to their respective maturity dates. While payment of the Orion Finance USA interest receivable of $903,922 remains unknown as of June 30, 2009, the Board received 100% payment of $1,825,967 on the Axon Financial Funding interest receivable on November 14, 2008. Refer to Note 13 – Subsequent Events for additional information.
In fiscal year 2009, the Board also received Axon Financial Funding payments on principal of $12,374,434 and interest compensation of $1,807,998 in excess of the accrued interest receivable. Axon Financial Funding payments totaled $16,008,399 for fiscal year 2009. In June 2009, the Board applied $14 million from the STIP reserve to the outstanding principal for the Axon Financial Funding and Orion Finance USA securities. As of June 30, 2009, the Axon Financial Funding and Orion Finance USA outstanding balances are $68,625,566 and $45 million, respectively, for a combined SIV total of $113,625,566. Refer to Note 13 – Subsequent Events for additional information.
On September 16, 2008, the U.S. Government acquired 80% of AIG stock and extended $85 billion in financing to the company. The loan will be repaid by the sale of AIG assets. The loan is collateralized by all the company’s assets, valued at $1.05 trillion as of June, 30, 2008. The two STIP AIG securities matured on July 21, 2008 and July 30, 2008.
STIP, Bond Pool and AOF - The Federal National Mortgage Association and Federal Home Loan Mortgage Corp. were put into conservatorship on September 7, 2008.
Bond Pool and AOF - On September 14, 2008, Lehman Brothers filed for Chapter 11 bankruptcy. The Bond Pool and AOF portfolios held a $15 million position in Lehman Brothers Holdings, Inc., 2.778%, 05/25/2010. The AOF portfolio also includes a $5 million position in Lehman Brothers Holdings, Inc., 5%, 01/14/2011. As of September 30, 2008, the book value of these bond positions was written down to 80% of par. On October 30, 2008, the book value of these bonds was further written down to 65% of par. Four additional write downs occurred during fiscal year 2009. As of June 30, 2009, the book value of these bonds represents 20% of par.
On September 26, 2008, Washington Mutual filed for Chapter 11 bankruptcy. The bonds are now in default following the seizure of the bank by the Office of Thrift Supervision on September 25, 2008. The Bond Pool and AOF portfolios held a $20 million position in Washington Mutual, Inc. 4.2%, 01/15/2010. On September 26, 2008, the Board sold $10 million par, at a price of $38, with an October 1, 2008 settlement date. This sale generated a loss of $6.2 million. As of September 30, 2008, the book value of the remaining $10 million bond position was written down to 85% of par. On October 20, 2008, the remaining $10 million position was sold for a realized loss of $1,684,700.
On October 30, 2008, the book value of the Galena CDO bonds was written down to 70% of par. The Bond Pool and AOF portfolios hold a $25 million position in this security. Due to several defaults and credit enhancement deterioration, four additional write downs occurred during fiscal year 2009. As of June 30, 2009, the book value of these bonds represents 10% of par.
Bond Pool - On January 29, 2009, the book value of the Kellwood Inc., 7.625%, 10/15/2017 was written down to 50% of par due to impairment and industry weakness. The RFBP internal bond pool and the TFBP held $18.55 million par in this security. Two additional write downs occurred in fiscal year 2009 with a June 30, 2009 book value of the bonds at 10% of par as of June 30, 2009. On July 23, 2009, the Board sold $10 million par at a price of $19 and the remaining $8.55 million at a price of $19.375 with a July 23, 2009 settlement date. This sale generated a combined gain of $1.7 million.
A-26

STATE OF MONTANA BOARD OF INVESTMENTS CONSOLIDATED UNIFIED INVESTMENT PROGRAM FINANICAL STATEMENT
AOF – As of June 30, 2008, the Board was not aware of any legal risks regarding any AOF investments.
7. STIP RESERVE
The STIP Reserve account was established in November 2007. Income is distributed to STIP participants based on accrued interest and discount amortization. To avoid distributing cash to participants based on accrued interest on certain SIVs that may be uncollectible; the accrued interest amount was deposited in this account. Additional accrued income was deposited in the account to pay for any incidental direct expenses incurred as a part of any SIV restructuring activity not to be paid from SIV assets. Accrued income was also deposited in the account to offset any potential principal loss on these securities in the future.
8. COAL TAX LOAN AND MORTGAGE COMMITMENTS
The Board makes firm commitments to fund loans from the Coal Severance Tax Trust fund. These commitments have expiration dates and may be extended according to the Board's policies. As of June 30, 2009, the Board had committed but not yet purchased $22,760,363 in loans from Montana lenders, compared to $26,138,839 as of June 30, 2008. In addition to the above commitments, lenders had reserved $26,207,197 for loans as of June 30, 2009, compared to $7,474,356 on the same date in 2008.
The Board makes reservations to fund mortgages from the Public Employees' and Teachers' retirement funds. As of June 30, 2009, mortgage reservations totaled $214,625. As of June 30, 2008, mortgage reservations totaled $394,947. Effective December 1, 2005, all Board residential mortgage purchases are processed by the Montana Board of Housing (MBOH). The MBOH does not differentiate between a mortgage reservation and a funding commitment.
9. PENSION FUND REAL ESTATE INVESTMENTS
100 North Park Building
In January 1996, the Board, purchased for the Public Employees’ and Teachers' Retirement funds portfolios, the 100 North Park Avenue Building in Helena, Montana as a real estate investment. Acquired for a cost of $4,864,326, the building carries a fair value of $6,584,252 as of June 30, 2009. During fiscal year 2009, building improvements for build-outs, heating/cooling, and lease changes totaling $1,392 were added to the cost of the building. Building improvements for build-outs, HVAC improvements, and leasing fees totaling $81,989 were included in the cost of the building in fiscal year 2008. The three-story building provides office space for six tenants.
2401 Colonial Drive Building
In August 1997, the Board authorized the construction of an office building as a real estate investment in the Public Employees’ and Teachers’ Retirement funds portfolios. Construction costs, including interest capitalization, totaled $6,481,741 as of June 30, 2000. For fiscal year 2009, $14,638 was capitalized for Cupola updates and heating/cooling system improvements. In fiscal year 2008, sprinkler system and heating/cooling system improvements of $51,992 were added to the building cost. The three-story building, providing office space for three tenants, was occupied in November 1999. As of June 30, 2009, the building carries a cost and fair value of $7,250,580 and $7,785,377, respectively.
2273 Boot Hill Court Building
In August 1999, the Board authorized the purchase of a new office building in Bozeman, Montana. Upon building completion, the Board purchased the building for the Public Employees’ and Teachers’ Retirement funds portfolios in March 2004, for $2,051,032. In fiscal years 2009 and 2008, there were no improvements made to this building. The building, located on state school trust land, is occupied by four state agencies. As of June 30, 2009, the building carries a fair value of $2,123,654.
1712 Ninth Avenue Building
In November 2000, the Land Board authorized the transfer of the Public Employees’ Retirement Administration (PERA) office building, located at 1712 Ninth Avenue, Helena, to the Board. By issuance of a corrective deed, the Board was named owner and building manager for the use and benefit of the PERA. In fiscal year 2009, there were no improvements made to this building. In fiscal year 2008, $180 was capitalized for space pre-design. As of June 30, 2009, the building, occupied by one tenant, is valued at $579,626.
A-27

STATE OF MONTANA BOARD OF INVESTMENTS CONSOLIDATED UNIFIED INVESTMENT PROGRAM FINANICAL STATEMENT
The schedule below details the minimum future rentals for the above buildings with non-cancelable operating leases as of June 30, 2009 and 2008:
Minimum future rentals for the year ending June 30, 2009:
2010 2011 2012 2013 2014 2015+ Total$403,482 $285,905 $258,743 $219,189 0 0 $1,167,319
Minimum future rentals for the year ending June 30, 2008:
2009 2010 2011 2012 2013 2014+ Total$827,768 $510,068 $416,432 $258,743 $219,189 0 $2,232,198
California Street Property
In December 1998, the Board acquired a parcel of land adjacent to the Colonial Drive building for the Public Employees’ and Teachers’ Retirement funds portfolios to provide for additional parking. This land was purchased for $204,835. For fiscal years 2008 and 2009, there were no improvements made to this property. As of June 30, 2009 the property carries a fair value of $221,390.
{This area intentionally left blank}
A-28

STATE OF MONTANA BOARD OF INVESTMENTS CONSOLIDATED UNIFIED INVESTMENT PROGRAM FINANICAL STATEMENT
10. MONTANA MORTGAGES AND LOANS
The Montana mortgages and loans portfolio is shown below. 2009 2008
Book Value Book Value
45,270,143$ 59,702,382
3,812,268 4,217,637Montana University System 8,640,027 8,722,199
373,010 2,547,0006,821,687 4,878,661
20,591,953 19,951,84413,538,774 14,305,523
158,245,959 141,063,339
Permanent Coal Trust Loans 212,023,678 195,686,203
Total Montana Mortgages and Loans 257,293,821$ 255,388,585
Montana Mortgages and Loans
Residential Mortgages
Science and Technology Alliance (1)
Value-added LoansCommercial Loans
Department of JusticeMontana Facility Finance Local Government Infrastructure
(1) The Montana Science and Technology Alliance (MSTA) loans include funding for research and development, mezzanine and seed capital loans.
11. LOAN GUARANTEES
As of June 30, 2009, loan guarantees provided by the Coal Severance Tax Permanent Trust to the Enterprise Fund and the Montana Facility Finance Authority total $198,465,022. Board exposure to bond issues of the Enterprise Fund is $88,920,000 while exposure to bond issues, surety bonds and designated loans of the Facility Finance Authority is $109,545,022.
As of June 30, 2008, loan guarantees provided by the Coal Severance Tax Permanent Trust to the Enterprise Fund and the Montana Facility Finance Authority total $182,393,408. Board exposure to bond issues of the Enterprise Fund is $98,390,000 while exposure to bond issues, surety bonds and designated loans of the Facility Finance Authority is $84,003,408.
12. POOL RESTRUCTURE
On May 14, 2008, the Board approved a staff recommendation to create a structure for the Retirement Funds Bond Pool for both internal and external asset management. In July 2008, four new managers were hired. The managers named include Reams Asset Management, Artio Global Management, Lehman Brothers Asset Management and Post Advisory Group. On October 1, 2008, Reams Asset Management was funded approximately $200 million in cash and securities. In May and August 2009, Post Advisory Group and Artio Global Management were funded $50.7 million and $100.5 million in cash and securities, respectively.
In February 2008, the three MDEP long/short (130/30) investment managers of Analytic Investors, JP Morgan and Martingale Asset Management were funded approximately $400 million. On September 1, 2009, JP Morgan was funded an additional $75 million.
On May 12, 2009, the Board approved a staff recommendation to diversify income sources within the Trust Funds Bond Pool and change the pool name to the Trust Funds Investment Pool effective July 1, 2009. This Board action resulted in a $30 million purchase of the Post Traditional High Yield Fund on September 1, 2009.
In early September 2009, the Board completed a restructure of the Montana International Equity Pool (MTIP) by funding the Barclays Global Investors ACWI ex US Index Superfund A approximately $295 million in cash and securities by terminating two external managers, closing one fund and downsizing three external managers.
Also in September 2009, the Board transitioned approximately $135 million in cash and securities to the State Street SPIFF (Stock Performance Index Futures Fund), T. Rowe Price, Artisan Partners, TimesSquare Capital Management and Vaughan Nelson Investment Management by closing a commingled account and reducing the portfolios for two existing managers.
A-29

STATE OF MONTANA BOARD OF INVESTMENTS CONSOLIDATED UNIFIED INVESTMENT PROGRAM FINANICAL STATEMENT
13. SUBSEQUENT EVENTS
On August 28, 2009, the Board received an Axon Financial Funding payment of $4,086,193 representing $3,893,968 in principal and interest compensation of $192,225. An additional interest compensation payment of $153,270 from Axon Financial Funding was received on October 1, 2009.
On October 14, 2009, the Board received its initial payment from Orion Finance USA totaling $12,490,293. This payment applied $9,867,165 to principal, $903,922 to the accrued interest receivable as of the January 16, 2008 and April 21, 2008 maturity dates and $1,719,206 to interest compensation.
Refer to Note 6 – Investment Risk Disclosures, page B-25 for additional information.
14. YEAR END PORTFOLIOS
The June 30, 2009 portfolios of the Pools and AOF are listed on the following pages. The security type percentage is based on the fair value or the amortized cost ratio of the specific security investment type to the total portfolio.
RETIREMENT FUNDS BOND POOL
Security Name Coupon Maturity Par Amortized Cost Fair Value %
SHORT TERM INVESTMENT POOL NA NA 118,747 118,747 118,747 0.01%
STATE STREET REPO 0.01 7/1/2009 2,721,652 2,721,652 2,721,652 0.16%
STATE STREET BANK + TRUST CO NA NA 44,565,804 44,565,804 44,565,804 2.61%
Cash Equivalents 3 Issue(s) 47,406,203 47,406,203 47,406,203 2.78%
AA / FT WORTH HQ FIN TR 5.50 10/5/2010 2,098,895 2,084,062 2,076,374 0.12%
AES EASTN ENERGY LP 9.00 1/2/2017 545,400 561,333 507,222 0.03%
AFLAC INC 8.50 5/15/2019 1,475,000 1,529,035 1,573,891 0.09%
AIG SUNAMERICA GLOBAL FING VI 6.30 5/10/2011 820,000 740,854 766,952 0.04%
AMB PPTY L P MEDIUM TERM NTS 6.30 6/1/2013 1,200,000 1,168,882 1,116,000 0.07%
AMC ENTERTAINMENT INC 8.75 6/1/2019 500,000 487,983 470,000 0.03%
AOL TIME WARNER INC 6.75 4/15/2011 4,000,000 4,066,455 4,179,386 0.24%
AOL TIME WARNER INC 7.70 5/1/2032 1,000,000 886,730 982,555 0.06%
AERO 1 HQ FIN TR 4.64 7/7/2010 5,745,000 5,745,000 5,564,377 0.33%
ALCOA INC 5.90 2/1/2027 660,000 452,960 468,600 0.03%
ALCOA INC 5.95 2/1/2037 560,000 370,303 375,200 0.02%
ALCOA INC 6.75 7/15/2018 1,595,000 1,244,522 1,371,700 0.08%
ALLSTATE CORP 7.45 5/16/2019 1,375,000 1,379,551 1,482,034 0.09%
AMERICA WEST AIRLS TR 7.93 1/2/2019 3,687,096 3,687,096 3,014,201 0.18%
AMERICAN ACHIEVEMENT CORP 8.25 4/1/2012 200,000 187,026 187,000 0.01%
AMER AIRLN PT TRST 09 1A 10.38 7/2/2019 1,170,000 1,170,000 1,178,775 0.07%
AMERICAN EXPRESS BK FSB 0.44 5/29/2012 5,000,000 4,203,689 4,608,078 0.27%
AMERICAN EXPRESS BK 6.00 9/13/2017 5,000,000 4,989,953 4,596,610 0.27%
AMERICAN EXPRESS CO 8.13 5/20/2019 1,965,000 1,980,275 2,053,018 0.12%
AMERICAN EXPRESS CR CORP 0.50 12/2/2010 5,000,000 4,516,049 4,776,453 0.28%
AMERICAN GEN FIN CORP MTN 5.38 10/1/2012 350,000 192,592 201,250 0.01%
AMERICAN GEN FIN CORP MTN 5.90 9/15/2012 5,125,000 4,761,867 2,946,875 0.17%
AMERICAN GEN FIN CORP 6.90 12/15/2017 1,840,000 813,558 978,480 0.06%
AMERICAN PRESIDENT COS LTD 8.00 1/15/2024 5,000,000 4,805,201 3,512,500 0.21%
AMERICAN REAL ESTATE PARTNERS 8.13 6/1/2012 550,000 501,811 506,000 0.03%
A-30

STATE OF MONTANA BOARD OF INVESTMENTS CONSOLIDATED UNIFIED INVESTMENT PROGRAM FINANICAL STATEMENT
RETIREMENT FUNDS BOND POOL
Security Name Coupon Maturity Par Amortized Cost Fair Value %
ANGIOTECH PHARMACEUTICALS INC 4.42 12/1/2013 850,000 637,468 641,750 0.04%
ANHEUSER BUSCH COS INC 5.60 3/1/2017 3,000,000 3,008,766 2,904,677 0.17%
APRIA HEALTHCARE GROUP 11.25 11/1/2014 1,000,000 974,213 965,000 0.06%
ARIA CDO II JERSEY NO 1 LTD 2.13 10/10/2012 25,000,000 25,000,000 7,500,000 0.44%
ASIF GLOBAL FINANCNG XIX 4.90 1/17/2013 160,000 116,289 133,633 0.01%
AXCAN INTERMEDIATE HOLD 9.25 3/1/2015 500,000 504,945 502,500 0.03%
BB+T CORPORATION 6.85 4/30/2019 1,480,000 1,457,181 1,541,698 0.09%
BACM09 RR A4 5.62 7/6/2039 1,865,000 1,509,339 1,509,339 0.09%
BANC AMER COML MTG INC COML 5.38 1/15/2049 15,000,000 15,038,381 14,000,853 0.82%
BANC AMER COML MTG TR 5.89 7/10/2044 1,475,000 1,297,003 1,141,457 0.07%
BANC AMER COML MTG TR 5.36 7/10/2046 2,159,570 2,161,711 2,175,785 0.13%
BANC AMER COML MTG TR 5.19 9/10/2047 7,162,908 7,165,698 7,218,308 0.42%
BANC AMER COML MTG TR 5.41 9/10/2047 1,720,000 1,416,953 1,382,916 0.08%
BANC AMER COML MTG TR 2007 2 5.63 4/10/2049 9,000,000 9,025,624 8,360,882 0.49%
BANC AMER COML MTG TR 5.84 6/10/2049 16,440,000 16,287,997 15,342,367 0.90%
BANC AMER COML MTG TR 5.55 2/10/2051 15,000,000 15,044,003 13,837,014 0.81%
BANK AMER CORP 5.42 3/15/2017 1,630,000 1,311,612 1,364,466 0.08%
BANK AMER FDG CORP 5.65 5/1/2018 2,650,000 2,336,701 2,333,397 0.14%
BARCLAYS BANK PLC 6.75 5/22/2019 1,770,000 1,766,236 1,754,266 0.10%
BARCLAYS BK PLC 6.05 12/4/2017 1,950,000 1,562,361 1,654,105 0.10%
BEAR STEARNS COML MTG SECS TR 5.59 6/11/2040 7,962,358 7,969,977 8,116,034 0.48%
BELLSOUTH TELECOMM INC 6.30 12/15/2015 9,336,600 9,850,519 9,315,123 0.55%
BERRY PLATICS CORP 5.88 2/15/2015 500,000 428,509 441,250 0.03%
BIO RAD LABS 8.00 9/15/2016 450,000 443,711 445,500 0.03%
BISHOPSGATE CDO LTD 5.18 6/30/2010 25,000,000 25,000,000 20,000,000 1.17%
BORGER ENERGY ASSOCS L P CORP 7.26 12/31/2022 1,677,751 1,565,961 1,442,866 0.08%
BOSTON SCIENTIFIC CORP 5.45 6/15/2014 500,000 449,668 460,000 0.03%
BRITISH TELECOMMUNICATIONS PLC 5.95 1/15/2018 1,940,000 1,670,344 1,733,213 0.10%
CITIGROUP/DEUTSCHE BK COMM MOR 5.54 1/15/2046 1,075,000 777,887 877,871 0.05%
CIT GROUP INC 1.31 11/3/2010 510,000 375,744 382,500 0.02%
CIT GROUP INC REORGANIZED AS 7.63 11/30/2012 990,000 787,614 688,050 0.04%
CIT GROUP INC 5.80 7/28/2011 3,500,000 2,342,451 2,625,000 0.15%
CIT GROUP INC 1.17 2/13/2012 100,000 64,161 58,500 0.00%
CIT GROUP INC MEDIUM TERM 1.01 12/21/2012 140,000 84,662 77,700 0.00%
CSC HLDGS INC 8.50 6/15/2015 700,000 693,095 686,000 0.04%
CVS CAREMARK CORP 6.94 1/10/2030 92,305 73,209 85,075 0.00%
CVS CAREMARK CORP 2.15 9/10/2010 2,500,000 2,346,448 2,493,100 0.15%
CWHEQ HOME EQUITY LN TR 5.76 6/25/2035 891,462 363,202 188,319 0.01%
CWHEQ INC 6.09 7/25/2027 1,430,992 266,779 242,367 0.01%
CALPINE CONSTRUCTION FIN 8.00 6/1/2016 500,000 477,755 480,000 0.03%
CANADIAN PAC LTD 9.45 8/1/2021 5,000,000 5,099,472 5,548,566 0.32%
CAPITAL ONE FINL CORP 6.75 9/15/2017 5,000,000 5,000,450 4,721,742 0.28%
A-31

STATE OF MONTANA BOARD OF INVESTMENTS CONSOLIDATED UNIFIED INVESTMENT PROGRAM FINANICAL STATEMENT
RETIREMENT FUNDS BOND POOL
Security Name Coupon Maturity Par Amortized Cost Fair Value %
CATERPILLAR FINL SVCS 1.35 6/24/2011 10,000,000 9,048,788 9,795,471 0.57%
CD MTG TR 5.62 10/15/2048 1,110,000 883,255 896,312 0.05%
CELESTICA INC 7.88 7/1/2011 500,000 499,403 500,000 0.03%
CENTENNIAL COMMUNICATIONS CORP 8.13 2/1/2014 1,000,000 1,025,713 1,025,000 0.06%
CHRYSLER LLC 1.00 8/3/2013 2,081,647 958,894 22,128 0.00%
CINEMARK USA INC 8.63 6/15/2019 200,000 195,123 197,500 0.01%
CITIGROUP INC 6.13 5/15/2018 2,165,000 1,836,280 1,888,653 0.11%
CITIGROUP INC 8.50 5/22/2019 3,500,000 3,597,233 3,552,226 0.21%
COMCAST CORP 7.05 3/15/2033 2,000,000 2,161,297 2,078,867 0.12%
COMM MTG TR 5.54 6/10/2046 2,920,113 2,919,822 2,931,453 0.17%
COMMUNICATIONS + PWR INDS INC 8.00 2/1/2012 525,000 500,014 506,625 0.03%
CONTINENTAL AIRLS 5.98 4/19/2022 2,020,000 1,488,659 1,696,800 0.10%
CONTINENTAL AIRLS PASS THRU TR 6.55 8/2/2020 5,790,479 5,790,479 5,327,240 0.31%
CORPORATE PPTY INVS 7.88 3/15/2016 12,000,000 11,930,856 12,447,738 0.73%
CORRECTIONS CORP AMER NEW 7.50 5/1/2011 500,000 500,000 496,875 0.03%
CORRECTIONS CORP AMER NEW 6.25 3/15/2013 125,000 119,469 118,125 0.01%
CORRECTIONS CORP OF AMER 7.75 6/1/2017 350,000 340,003 343,000 0.02%
CREDIT SUISSE N Y 6.00 2/15/2018 2,200,000 1,799,225 2,196,312 0.13%
CRICKET COMMUNICATIONS I 7.75 5/15/2016 500,000 480,868 481,250 0.03%
CYPRESSTREE SYNTHETIC CDO LTD 2.65 12/30/2010 25,000,000 25,000,000 10,000,000 0.59%
DAVITA INC 6.63 3/15/2013 250,000 238,930 234,063 0.01%
DAVITA INC 7.25 3/15/2015 150,000 144,790 140,625 0.01%
DEERE JOHN CAP CORP MTN BK ENT 1.11 2/26/2010 1,950,000 1,930,820 1,939,939 0.11%
DEERE JOHN CAP CORP MTN BK ENT 1.40 6/10/2011 2,150,000 2,067,849 2,133,862 0.12%
DELTA AIR LINES INC DEL 7.92 5/18/2012 400,000 368,801 368,000 0.02%
DELTA AIR LINES INC DEL PASS T 6.72 7/2/2024 4,198,303 2,731,683 3,190,710 0.19%
DEUTSCHE TELEKOM INT FIN 6.00 7/8/2019 3,090,000 3,064,814 3,095,805 0.18%
DIRECT HOLDINGS 7.63 5/15/2016 550,000 532,336 535,563 0.03%
DONNELLEY R R + SONS 4.95 4/1/2014 5,000,000 4,799,856 4,350,000 0.25%
ERAC USA FIN CO 6.38 10/15/2017 2,760,000 2,221,044 2,393,694 0.14%
ERAC USA FIN CO 7.00 10/15/2037 615,000 395,142 469,405 0.03%
ESI TRACTEBEL ACQUISITION CORP 7.99 12/30/2011 314,000 306,856 305,758 0.02%
EASTERN ENERGY LTD 7.25 12/1/2016 5,000,000 4,966,647 5,064,454 0.30%
ECHOSTAR DBS CORP 6.63 10/1/2014 200,000 184,050 185,500 0.01%
ECHOSTAR DBS CORP 7.75 5/31/2015 500,000 476,575 476,250 0.03%
EL PASO NAT GAS CO 8.63 1/15/2022 5,000,000 5,145,910 5,445,782 0.32%
ELAN FIN PLC 7.75 11/15/2011 850,000 799,196 785,188 0.05%
ENTERGY ARK INC 4.50 6/1/2010 5,000,000 4,995,941 4,951,252 0.29%
ENTERGY LA LLC 5.50 4/1/2019 140,000 135,423 131,229 0.01%
FPL ENERGY NATL WIND LLC 5.61 3/10/2024 2,320,440 2,320,440 1,922,873 0.11%
FARMERS EXCHANGE CAP 7.05 7/15/2028 1,255,000 770,907 868,804 0.05%
FEDERAL EXPRESS CORP PSTHR TR 7.52 1/15/2018 4,440,042 4,429,121 4,251,518 0.25%
A-32

STATE OF MONTANA BOARD OF INVESTMENTS CONSOLIDATED UNIFIED INVESTMENT PROGRAM FINANICAL STATEMENT
RETIREMENT FUNDS BOND POOL
Security Name Coupon Maturity Par Amortized Cost Fair Value %
FERRELLGAS L P FERRELLGAS FIN 6.75 5/1/2014 350,000 308,048 304,500 0.02%
FIRST UN CORP 7.50 4/15/2035 1,305,000 1,118,869 1,295,351 0.08%
FLORIDA GAS TRANSMISSION CO 9.19 11/1/2024 8,000,000 8,026,168 8,587,142 0.50%
FORD MTR CR CO 7.38 10/28/2009 8,650,000 8,639,604 8,477,000 0.50%
FORD MTR CR CO 8.00 12/15/2016 2,740,000 1,673,429 2,096,100 0.12%
FORD MTR CR CO 7.80 6/1/2012 570,000 345,461 487,350 0.03%
FORTUNE BRANDS INC 5.38 1/15/2016 3,000,000 2,987,655 2,736,711 0.16%
GATX CORP 8.75 5/15/2014 10,000,000 9,987,883 10,499,999 0.61%
GE COML MTG CORP TR 5.42 12/10/2049 15,000,000 15,040,008 13,012,246 0.76%
GMAC LLC 6.75 12/1/2014 1,152,000 846,847 921,600 0.05%
GSPA MONETIZATION TR 6.42 10/9/2029 12,941,847 13,045,350 10,839,573 0.63%
GALENA CDO I CAYMAN IS NO 1LTD 5.06 1/11/2013 12,000,000 1,200,000 1,200,000 0.07%
GAZPROM INTL S A 7.20 2/1/2020 2,253,166 2,282,113 2,117,976 0.12%
GENERAL CABLE CORP 3.58 4/1/2015 300,000 248,367 243,000 0.01%
GENERAL ELEC CAP CORP 5.55 5/4/2020 3,000,000 2,477,549 2,775,133 0.16%
GENERAL ELEC CAP CORP 1.36 1/8/2016 5,000,000 3,885,158 3,999,147 0.23%
GENERAL MTRS ACCEP CORP 6.75 12/1/2014 1,710,000 1,093,025 1,368,000 0.08%
GENWORTH FINL INC 5.65 6/15/2012 2,400,000 2,399,618 1,920,000 0.11%
GENWORTH GLOBAL FDG TRS 5.75 5/15/2013 105,000 81,641 96,600 0.01%
GENWORTH LIFE INST FUND 5.88 5/3/2013 1,510,000 1,206,367 1,151,375 0.07%
GEORGIA PWR CO 5.25 12/15/2015 3,000,000 3,000,116 3,103,721 0.18%
GMACM HOME EQUITY LN TR 6.32 5/25/2036 970,000 479,736 263,822 0.02%
GMAC MTG CORP LN TR 5.81 10/25/2036 1,105,000 610,906 220,646 0.01%
GOLDMAN SACHS GROUP INC 1.64 1/12/2015 5,000,000 3,787,028 4,318,750 0.25%
GOLDMAN SACHS GROUP INC 1.06 3/22/2016 4,000,000 2,925,205 3,370,000 0.20%
GOLDMAN SACHS GROUP 5.30 2/14/2012 2,000,000 1,998,867 2,075,718 0.12%
GREAT ATLANTIC + PAC TEA 5.13 6/15/2011 550,000 399,074 401,500 0.02%
GREAT RIV ENERGY 7.23 7/1/2038 135,000 148,030 127,913 0.01%
GREIF INC 6.75 2/1/2017 525,000 491,059 481,688 0.03%
HCA INC 8.50 4/15/2019 550,000 540,455 539,000 0.03%
HSBC FIN CORP 5.50 1/19/2016 4,000,000 3,988,193 3,733,825 0.22%
HARRAHS OPERATING ESCROW 11.25 6/1/2017 350,000 339,141 329,000 0.02%
HARTFORD FINL SVCS GROUP INC 6.10 10/1/2041 280,000 143,472 176,400 0.01%
HARTFORD FINL SVCS GROUP INC 5.95 10/15/2036 330,000 190,003 214,500 0.01%
HARTFORD FINL SVCS GROUP INC 5.38 3/15/2017 1,010,000 700,907 797,900 0.05%
HARTFORD FINL SVCS GROUP INC 6.30 3/15/2018 920,000 653,850 736,000 0.04%
HARTFORD LIFE GLOBAL FDG TRS 0.73 3/15/2011 200,000 170,892 177,073 0.01%
HAWAIIAN ELEC INDS INC MEDIUM 6.14 8/15/2011 3,000,000 3,040,361 3,194,086 0.19%
HEALTH CARE PPTY INVS INC 7.07 6/8/2015 1,200,000 1,083,900 1,095,384 0.06%
HERTZ VEH FING LLC 0.56 11/25/2011 660,000 598,074 609,110 0.04%
HERTZ VEH FING LLC 5.08 11/25/2011 1,340,000 1,199,284 1,298,059 0.08%
HOMER CITY FDG LLC 8.14 10/1/2019 330,600 339,994 289,275 0.02%
A-33

STATE OF MONTANA BOARD OF INVESTMENTS CONSOLIDATED UNIFIED INVESTMENT PROGRAM FINANICAL STATEMENT
RETIREMENT FUNDS BOND POOL
Security Name Coupon Maturity Par Amortized Cost Fair Value %
HUNTSMAN LLC 11.63 10/15/2010 550,000 555,923 564,438 0.03%
ING SEC LIFE INSTL FDG 4.25 1/15/2010 7,000,000 6,973,561 6,841,814 0.40%
INERGY L P + INERGY FIN CORP 6.88 12/15/2014 500,000 461,692 455,000 0.03%
INTELSAT JACKSON HLDGS LTD 9.50 6/15/2016 250,000 255,568 250,625 0.01%
INTELSAT SUBSIDIARY HLDG CO LT 8.88 1/15/2015 750,000 740,762 720,000 0.04%
INTERNATIONAL LEASE FIN CORP 4.75 1/13/2012 405,000 257,640 319,950 0.02%
INTL LEASE FIN CORP MTN 5.63 9/20/2013 2,145,000 1,428,764 1,630,200 0.10%
INTL LEASE FIN CORP MTN 5.35 3/1/2012 1,070,000 812,570 856,000 0.05%
INTL LEASE FIN CORP MTN 5.63 9/15/2010 500,000 456,511 460,000 0.03%
INTL LEASE FIN CORP MTN 4.55 10/15/2009 2,000,000 2,000,457 1,920,000 0.11%
INTERPUBLIC GROUP COS 10.00 7/15/2017 525,000 517,322 534,188 0.03%
IRON MNT INC PA 8.63 4/1/2013 500,000 500,612 498,750 0.03%
JPMORGAN CHASE + CO FORMERLY 6.00 1/15/2018 2,885,000 2,856,235 2,880,343 0.17%
JPMORGAN CHASE + CO 6.30 4/23/2019 11,215,000 11,198,233 11,300,192 0.66%
J P MORGAN CHASE COML MTG 4.56 6/12/2041 6,071,115 6,071,062 6,055,936 0.35%
J P MORGAN CHASE COML MTG 3.05 1/15/2038 357,408 350,454 355,340 0.02%
JARDEN CORP 8.00 5/1/2016 550,000 535,049 532,125 0.03%
JERSEY CENT PWR + LT CO 5.65 6/1/2017 4,000,000 3,988,950 3,906,670 0.23%
JOHNSON CTLS INC 5.25 1/15/2011 1,000,000 997,031 994,607 0.06%
KCT INTERMODAL TRANSN CORP 6.88 8/1/2018 2,784,533 2,784,533 2,914,977 0.17%
KELLWOOD CO 7.63 10/15/2017 10,550,000 1,055,381 1,582,500 0.09%
KERR MCGEE CORP 7.13 10/15/2027 7,000,000 7,067,185 5,271,701 0.31%
KEYBANK NATL ASSN CLEVELAND OH 5.50 9/17/2012 5,000,000 4,945,339 4,950,000 0.29%
KEYBANK NATL ASSN MTN 5.45 3/3/2016 10,000,000 9,535,951 8,572,872 0.50%
KIOWA PWR PARTNERS LLC 4.81 12/30/2013 60,334 60,186 58,644 0.00%
KNOWLEDGE LEARNING CORP 7.75 2/1/2015 500,000 458,157 465,625 0.03%
LB COML MTG TR 6.15 7/15/2044 840,000 622,384 651,440 0.04%
LB UBS COML MTG 5.42 2/15/2040 1,227,000 871,922 899,737 0.05%
LB UBS 5.37 9/15/2039 1,950,000 1,575,350 1,616,626 0.09%
LB UBS COML MTG TR 5.43 2/15/2040 1,775,000 1,392,140 1,279,854 0.07%
LB UBS COML MTG TR 5.16 2/15/2031 3,455,000 3,044,677 2,938,075 0.17%
LEUCADIA NATL CORP 7.13 3/15/2017 550,000 425,471 446,875 0.03%
LEVEL 3 FING INC 12.25 3/15/2013 500,000 472,601 475,000 0.03%
LIBERTY MUT INS CO 8.50 5/15/2025 165,000 126,359 132,083 0.01%
LIBERTY PPTY LTD PARTNERSHIP 6.63 10/1/2017 1,275,000 1,117,278 1,058,250 0.06%
LINCOLN NATL CORP IN 8.75 7/1/2019 3,295,000 3,281,898 3,400,015 0.20%
LINN ENERGY LLC 11.75 5/15/2017 350,000 338,649 340,375 0.02%
LOCAL INSIGHT REGATTA HLDGS IN 11.00 12/1/2017 500,000 130,601 130,000 0.01%
M + I MARSHALL + ILSLEY BK 0.92 12/4/2012 3,390,000 2,811,156 2,356,830 0.14%
MGM MIRAGE 13.00 11/15/2013 500,000 551,533 553,750 0.03%
ML CFC COML MTG TR 5.55 6/12/2050 6,947,507 6,951,738 7,043,468 0.41%
MACKINAW PWR LLC 6.30 10/31/2023 603,834 495,357 537,860 0.03%
A-34
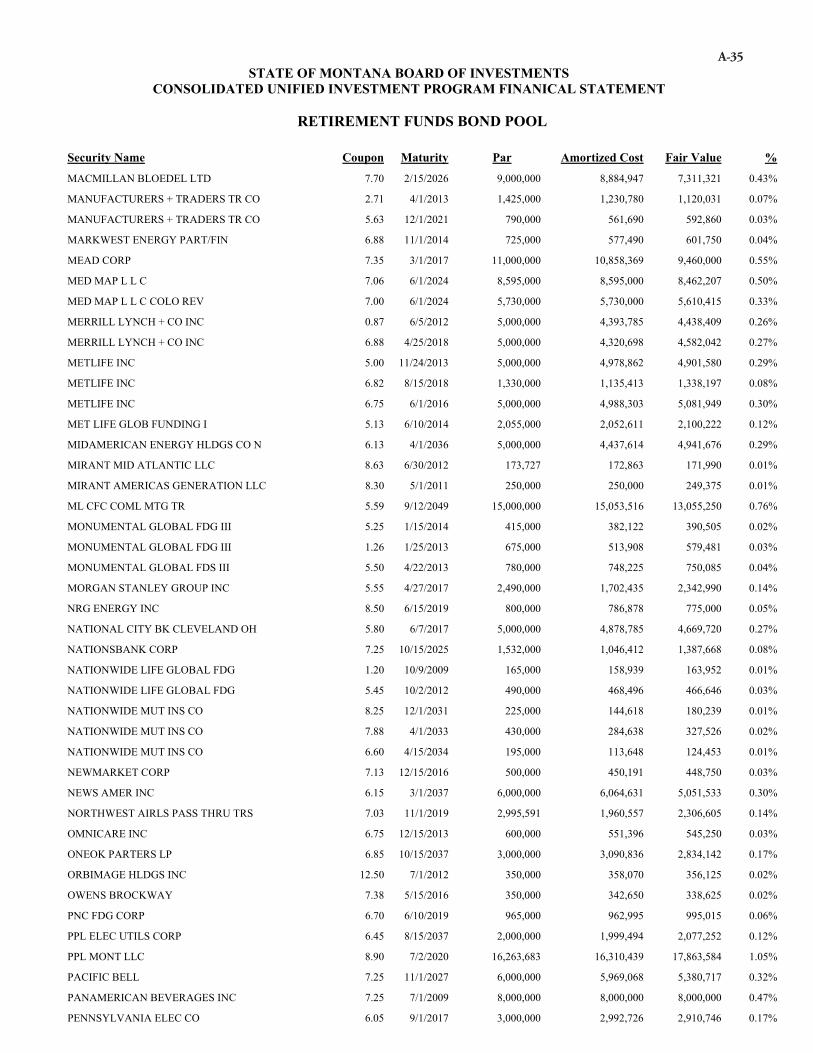
STATE OF MONTANA BOARD OF INVESTMENTS CONSOLIDATED UNIFIED INVESTMENT PROGRAM FINANICAL STATEMENT
RETIREMENT FUNDS BOND POOL
Security Name Coupon Maturity Par Amortized Cost Fair Value %
MACMILLAN BLOEDEL LTD 7.70 2/15/2026 9,000,000 8,884,947 7,311,321 0.43%
MANUFACTURERS + TRADERS TR CO 2.71 4/1/2013 1,425,000 1,230,780 1,120,031 0.07%
MANUFACTURERS + TRADERS TR CO 5.63 12/1/2021 790,000 561,690 592,860 0.03%
MARKWEST ENERGY PART/FIN 6.88 11/1/2014 725,000 577,490 601,750 0.04%
MEAD CORP 7.35 3/1/2017 11,000,000 10,858,369 9,460,000 0.55%
MED MAP L L C 7.06 6/1/2024 8,595,000 8,595,000 8,462,207 0.50%
MED MAP L L C COLO REV 7.00 6/1/2024 5,730,000 5,730,000 5,610,415 0.33%
MERRILL LYNCH + CO INC 0.87 6/5/2012 5,000,000 4,393,785 4,438,409 0.26%
MERRILL LYNCH + CO INC 6.88 4/25/2018 5,000,000 4,320,698 4,582,042 0.27%
METLIFE INC 5.00 11/24/2013 5,000,000 4,978,862 4,901,580 0.29%
METLIFE INC 6.82 8/15/2018 1,330,000 1,135,413 1,338,197 0.08%
METLIFE INC 6.75 6/1/2016 5,000,000 4,988,303 5,081,949 0.30%
MET LIFE GLOB FUNDING I 5.13 6/10/2014 2,055,000 2,052,611 2,100,222 0.12%
MIDAMERICAN ENERGY HLDGS CO N 6.13 4/1/2036 5,000,000 4,437,614 4,941,676 0.29%
MIRANT MID ATLANTIC LLC 8.63 6/30/2012 173,727 172,863 171,990 0.01%
MIRANT AMERICAS GENERATION LLC 8.30 5/1/2011 250,000 250,000 249,375 0.01%
ML CFC COML MTG TR 5.59 9/12/2049 15,000,000 15,053,516 13,055,250 0.76%
MONUMENTAL GLOBAL FDG III 5.25 1/15/2014 415,000 382,122 390,505 0.02%
MONUMENTAL GLOBAL FDG III 1.26 1/25/2013 675,000 513,908 579,481 0.03%
MONUMENTAL GLOBAL FDS III 5.50 4/22/2013 780,000 748,225 750,085 0.04%
MORGAN STANLEY GROUP INC 5.55 4/27/2017 2,490,000 1,702,435 2,342,990 0.14%
NRG ENERGY INC 8.50 6/15/2019 800,000 786,878 775,000 0.05%
NATIONAL CITY BK CLEVELAND OH 5.80 6/7/2017 5,000,000 4,878,785 4,669,720 0.27%
NATIONSBANK CORP 7.25 10/15/2025 1,532,000 1,046,412 1,387,668 0.08%
NATIONWIDE LIFE GLOBAL FDG 1.20 10/9/2009 165,000 158,939 163,952 0.01%
NATIONWIDE LIFE GLOBAL FDG 5.45 10/2/2012 490,000 468,496 466,646 0.03%
NATIONWIDE MUT INS CO 8.25 12/1/2031 225,000 144,618 180,239 0.01%
NATIONWIDE MUT INS CO 7.88 4/1/2033 430,000 284,638 327,526 0.02%
NATIONWIDE MUT INS CO 6.60 4/15/2034 195,000 113,648 124,453 0.01%
NEWMARKET CORP 7.13 12/15/2016 500,000 450,191 448,750 0.03%
NEWS AMER INC 6.15 3/1/2037 6,000,000 6,064,631 5,051,533 0.30%
NORTHWEST AIRLS PASS THRU TRS 7.03 11/1/2019 2,995,591 1,960,557 2,306,605 0.14%
OMNICARE INC 6.75 12/15/2013 600,000 551,396 545,250 0.03%
ONEOK PARTERS LP 6.85 10/15/2037 3,000,000 3,090,836 2,834,142 0.17%
ORBIMAGE HLDGS INC 12.50 7/1/2012 350,000 358,070 356,125 0.02%
OWENS BROCKWAY 7.38 5/15/2016 350,000 342,650 338,625 0.02%
PNC FDG CORP 6.70 6/10/2019 965,000 962,995 995,015 0.06%
PPL ELEC UTILS CORP 6.45 8/15/2037 2,000,000 1,999,494 2,077,252 0.12%
PPL MONT LLC 8.90 7/2/2020 16,263,683 16,310,439 17,863,584 1.05%
PACIFIC BELL 7.25 11/1/2027 6,000,000 5,969,068 5,380,717 0.32%
PANAMERICAN BEVERAGES INC 7.25 7/1/2009 8,000,000 8,000,000 8,000,000 0.47%
PENNSYLVANIA ELEC CO 6.05 9/1/2017 3,000,000 2,992,726 2,910,746 0.17%
A-35

STATE OF MONTANA BOARD OF INVESTMENTS CONSOLIDATED UNIFIED INVESTMENT PROGRAM FINANICAL STATEMENT
RETIREMENT FUNDS BOND POOL
Security Name Coupon Maturity Par Amortized Cost Fair Value %
PREMIUM ASSET TR 0.83 9/28/2010 4,000,000 3,640,396 3,640,000 0.21%
PRICOA GLOBAL FDG I 5.40 10/18/2012 880,000 853,806 853,750 0.05%
PRIDE INTERNATIONAL INC 8.50 6/15/2019 125,000 124,555 123,438 0.01%
PRICOA GLOBAL FUNDING 1 5.45 6/11/2014 1,495,000 1,490,593 1,492,415 0.09%
PROLOGIS 6.63 5/15/2018 575,000 507,559 448,500 0.03%
PROTECTIVE LIFE SECD TRS SECD 5.45 9/28/2012 5,300,000 5,276,680 5,273,623 0.31%
PRUDENTIAL FINL INC 5.50 3/15/2016 8,000,000 7,889,991 7,256,368 0.43%
PRUDENTIAL FINL INC 6.10 6/15/2017 625,000 385,141 575,923 0.03%
PRUDENTIAL FINL INC MED TERM 6.00 12/1/2017 1,180,000 906,222 1,076,122 0.06%
PRUDENTIAL FINANCIAL INC 7.38 6/15/2019 490,000 489,985 481,545 0.03%
PUBLIC SVC CO COLO 6.25 9/1/2037 5,000,000 5,111,061 5,446,799 0.32%
PUGET SOUND PWR + LT CO 5.20 10/1/2015 6,000,000 5,846,427 5,898,300 0.35%
QUEBECOR MEDIA INC 7.75 3/15/2016 650,000 583,108 585,000 0.03%
QWEST CORP 3.88 6/15/2013 500,000 455,795 447,500 0.03%
RALI TR 5.75 12/25/2021 3,070,327 2,545,956 2,560,904 0.15%
RAS LAFFAN LIQUEFIED NAT GAS 5.30 9/30/2020 9,000,000 8,576,093 8,055,000 0.47%
RAS LAFFAN LIQUEFIED NAT GAS 6.33 9/30/2027 6,000,000 5,888,713 5,130,000 0.30%
REGENCY CTRS L P 5.88 6/15/2017 975,000 698,746 760,500 0.04%
REGENCY ENERGY PARTNERS 9.38 6/1/2016 975,000 926,315 950,625 0.06%
REGIONS BK BIRMINGHAM ALA 7.50 5/15/2018 1,040,000 882,634 915,623 0.05%
REMINGTON ARMS INC NEW 10.50 2/1/2011 350,000 346,650 352,625 0.02%
RESIDENTIAL FUNDING MRTG SEC 5.31 2/25/2036 1,668,521 679,132 538,511 0.03%
RITE AID CORP 8.63 3/1/2015 500,000 307,655 332,500 0.02%
RITE AID CORP 9.75 6/12/2016 100,000 98,209 100,000 0.01%
RYERSON INC 8.40 11/1/2014 375,000 270,269 272,813 0.02%
SLM CORP 5.13 8/27/2012 4,000,000 3,731,147 3,460,000 0.20%
SLM CORP 5.38 1/15/2013 4,000,000 3,997,589 3,380,000 0.20%
SEALED AIR CORP 7.88 6/15/2017 300,000 293,540 268,151 0.02%
SEALY CORPORATION 10.88 4/15/2016 350,000 341,177 366,625 0.02%
SECURITY CAP GROUP INC 7.70 6/15/2028 3,000,000 3,416,966 2,692,793 0.16%
SEMPRA ENERGY 6.15 6/15/2018 5,000,000 4,881,068 4,974,708 0.29%
SERVICE CORP INTL 7.88 2/1/2013 350,000 326,972 336,875 0.02%
SIMON PPTY GROUP L P 5.10 6/15/2015 745,000 665,228 685,204 0.04%
SMITHFIELD FOODS INC 10.00 7/15/2014 250,000 240,503 246,875 0.01%
SOURCE GAS LLC 5.90 4/1/2017 190,000 161,494 143,917 0.01%
SOUTHERN POWERCO 6.38 11/15/2036 3,000,000 2,532,425 2,390,126 0.14%
SOUTHERN UN CO NEW 7.60 2/1/2024 6,000,000 5,899,026 5,407,777 0.32%
SOUTHWESTERN BELL TEL CO 7.00 11/15/2027 3,000,000 2,997,465 2,633,070 0.15%
SPRINT CAP CORP 7.63 1/30/2011 500,000 491,723 495,000 0.03%
SUBURBAN PROPANE PARTNERS LP 6.88 12/15/2013 500,000 465,129 460,000 0.03%
SUNCOR ENERGY INC 6.50 6/15/2038 3,000,000 3,008,369 2,809,854 0.16%
SUNGUARD DATA SYS INC 9.13 8/15/2013 550,000 519,850 519,750 0.03%
A-36

STATE OF MONTANA BOARD OF INVESTMENTS CONSOLIDATED UNIFIED INVESTMENT PROGRAM FINANICAL STATEMENT
RETIREMENT FUNDS BOND POOL
Security Name Coupon Maturity Par Amortized Cost Fair Value %
SUPERVALUE INC 8.00 5/1/2016 375,000 367,586 370,313 0.02%
TRW AUTOMOTIVE INC 7.25 3/15/2017 450,000 318,394 292,500 0.02%
TENNESSEE GAS PIPELINE CO 7.50 4/1/2017 550,000 548,501 578,758 0.03%
TERREMARK WORLDWIDE INC 12.00 6/15/2017 325,000 309,224 312,000 0.02%
TEXAS GAS TRANSMISSION CORP 7.25 7/15/2027 3,000,000 2,819,510 2,581,297 0.15%
TIME WARNER COS INC 9.15 2/1/2023 185,000 189,133 196,647 0.01%
TIME WARNER INC 6.63 5/15/2029 6,000,000 6,174,117 5,312,748 0.31%
TORCHMARK INC 9.25 6/15/2019 1,225,000 1,225,000 1,243,025 0.07%
TRANSCANADA PIPELINES LTD 7.63 1/15/2039 1,000,000 999,734 1,152,121 0.07%
TRANSCONTINENTAL GAS PIPE LINE 7.25 12/1/2026 3,000,000 2,998,703 3,007,213 0.18%
TRISTATE GEN + TRANS ASSN 6.04 1/31/2018 6,096,960 6,136,533 5,951,426 0.35%
TYCO ELECTRONICS GROUP S A 5.95 1/15/2014 1,045,000 1,034,921 977,075 0.06%
USG CORP 9.25 1/15/2018 525,000 430,416 446,250 0.03%
US ONCOLOGY INC 9.13 8/15/2017 875,000 859,036 868,438 0.05%
ULTRAMAR DIAMOND SHAMROCK CORP 7.20 10/15/2017 3,000,000 2,991,114 3,007,406 0.18%
UNION PAC CORP 4.88 1/15/2015 2,000,000 1,941,346 1,957,366 0.11%
UNION PAC CORP 6.15 5/1/2037 2,000,000 1,883,454 1,919,144 0.11%
UNITED AIR LINES 6.64 1/2/2024 2,537,058 1,662,196 1,902,794 0.11%
UNITED STATES STL CORP 7.00 2/1/2018 230,000 168,984 201,250 0.01%
UNITED STS STL CORP NEW 5.65 6/1/2013 1,005,000 935,693 904,524 0.05%
UNITED STS STL CORP NEW 6.05 6/1/2017 295,000 210,131 251,604 0.01%
U S WEST COMMUNICATIONS INC 7.13 11/15/2043 1,520,000 1,008,798 1,048,800 0.06%
UNITEDHEALTH GROUP INC 4.88 4/1/2013 3,000,000 2,908,703 2,956,039 0.17%
ASIF I 1.24 7/26/2010 135,000 116,154 112,288 0.01%
VALERO ENERGY CORP 6.63 6/15/2037 1,475,000 1,202,063 1,262,105 0.07%
VERIZON COMMUNICATIONS INC 6.40 2/15/2038 2,000,000 1,906,141 1,970,373 0.12%
VIACOM INC 6.25 4/30/2016 1,290,000 1,149,742 1,263,689 0.07%
VIDEOTRON LTEE 6.88 1/15/2014 625,000 591,110 578,125 0.03%
WMG ACQUSITION CORP 9.50 6/15/2016 600,000 583,930 597,000 0.03%
WACHOVIA BK COML MTG TR 5.42 1/15/2045 525,000 384,403 406,975 0.02%
WACHOVIA BK COML MTG TR 5.56 3/15/2045 1,410,000 1,153,219 1,111,955 0.07%
WASHOVIA BK NATL ASSN 5.60 3/15/2016 9,000,000 8,991,685 8,345,534 0.49%
WACHOVIA BK COML MTG TR 5.42 4/15/2047 450,000 413,645 414,770 0.02%
WELLPOINT INC 5.88 6/15/2017 5,550,000 5,518,360 5,379,061 0.32%
WELLS FARGO + CO NEW 1.19 1/24/2012 4,500,000 4,139,242 4,247,181 0.25%
WELLS FARGO + CO NEW 5.63 12/11/2017 2,430,000 2,321,102 2,390,073 0.14%
WELLS FARGO MTG BACKED SECS 5.50 3/25/2036 1,012,390 864,849 712,883 0.04%
WENDYS ARBYS GROUP INC 10.00 7/15/2016 425,000 414,548 419,687 0.02%
WESTVACO CORP 7.65 3/15/2027 8,113,000 7,952,580 6,896,050 0.40%
WEYERHAEUSER CO 8.50 1/15/2025 6,000,000 6,187,375 5,165,380 0.30%
WINDSOR FING LLC 5.88 7/15/2017 641,400 583,590 564,239 0.03%
WYNDHAM WORLDWIDE CORP 6.00 12/1/2016 5,000,000 4,982,956 3,725,000 0.22%
A-37

STATE OF MONTANA BOARD OF INVESTMENTS CONSOLIDATED UNIFIED INVESTMENT PROGRAM FINANICAL STATEMENT
RETIREMENT FUNDS BOND POOL
Security Name Coupon Maturity Par Amortized Cost Fair Value %
XM SATELLITE RADIO INC 11.25 6/15/2013 500,000 475,482 496,250 0.03%
XANTERRA SOUTH RIM LLC 5.69 12/15/2011 10,000,000 10,000,000 9,813,300 0.57%
ZIONS BANCORPORATION 5.65 5/15/2014 2,000,000 1,982,478 1,449,887 0.08%
Corporate Bonds (Rated) 322 Issue(s) 927,449,360 862,470,688 801,929,008 46.97%
MERIDIAN TRAILER TRAIN 9.85 1/29/2010 16,404 16,404 17,277 0.00%
Corporate Bonds (Unrated) 1 Issue(s) 16,404 16,404 17,277 0.00%
FNMATBA AUG 30 SINGLE FAM 4.50 12/1/2099 3,610,000 3,559,234 3,587,579 0.21%
FED HM LN PC POOL G11670 4.00 3/1/2015 12,974,810 12,852,527 13,101,477 0.77%
FED HM LN PC POOL G30006 7.00 7/1/2013 109,492 109,780 114,691 0.01%
FED HM LN PC POOL E99081 4.50 9/1/2018 11,681,588 11,635,185 12,119,215 0.71%
FED HM LN PC POOL G02070 5.50 3/1/2036 19,221,658 18,841,123 19,859,387 1.16%
FED HM LN PC POOL G03037 5.50 7/1/2037 22,366,257 22,273,493 23,097,384 1.35%
FED HM LN PC POOL G03150 5.50 8/1/2037 12,185,181 11,822,992 12,583,501 0.74%
FED HM LN PC POOL G03458 5.50 11/1/2037 22,418,040 22,504,384 23,150,860 1.36%
FED HM LN PC POOL G03511 6.00 10/1/2037 11,861,335 11,954,792 12,384,453 0.73%
FED HM LN PC POOL G08269 5.50 5/1/2038 11,933,677 11,763,146 12,321,337 0.72%
FED HM LN PC POOL C90973 6.00 6/1/2026 13,993,794 13,891,525 14,705,353 0.86%
FREDDIE MAC 2.50 4/8/2013 10,000,000 10,000,000 9,921,237 0.58%
FED HM LN PC POOL C01523 5.00 3/1/2033 6,394,741 6,350,506 6,540,311 0.38%
FED HM LN PC POOL A85005 4.50 3/1/2039 13,938,976 14,189,791 13,905,149 0.81%
FED HM LN PC POOL E00659 6.00 4/1/2014 196,703 196,636 208,807 0.01%
FED HM LN PC POOL E01425 4.50 8/1/2018 12,527,351 12,505,821 12,996,663 0.76%
FED HM LN PC POOL A36931 5.50 8/1/2035 20,886,935 21,395,166 21,631,733 1.27%
FEDERAL FARM CR BKS CONS 3.88 10/7/2013 30,000,000 31,562,997 31,463,670 1.84%
FED HM LN PC POOL G11812 5.00 12/1/2020 19,927,943 19,709,307 20,763,425 1.22%
FEDERAL HOME LN BKS 7.45 2/3/2020 5,000,000 5,021,659 6,438,541 0.38%
FEDERAL HOME LN BKS 4.50 11/14/2014 3,000,000 3,205,110 3,156,034 0.18%
FEDERAL HOME LOAN BANK 4.88 5/17/2017 20,000,000 19,791,723 21,536,434 1.26%
FEDERAL HOME LN MTG PC GTD 9.30 11/15/2020 45,828 45,011 48,338 0.00%
FEDERAL NATL MTG ASSN 0.00 10/9/2019 30,000,000 18,558,731 15,158,316 0.89%
FEDERAL NATL MTG ASSN 5.38 4/11/2022 6,000,000 6,166,469 6,111,585 0.36%
FEDERAL NATL MTG ASSN REMIC 9.50 3/25/2020 174,603 170,638 196,168 0.01%
FNMA POOL 256083 6.00 1/1/2026 14,146,439 14,101,831 14,866,572 0.87%
FNMA POOL 256714 5.50 5/1/2027 10,656,731 10,609,139 11,064,231 0.65%
FNMA POOL 256895 5.50 9/1/2037 6,131,746 6,088,894 6,332,015 0.37%
FNMA POOL 257160 5.00 4/1/2038 8,905,154 8,471,793 9,080,611 0.53%
FNMA POOL 303125 7.50 1/1/2010 7,300 7,298 7,376 0.00%
FNMA POOL 303202 6.50 5/1/2014 239,480 238,536 250,680 0.01%
FNMA POOL 303590 7.00 11/1/2010 47,910 47,910 49,184 0.00%
FNMA POOL 313999 6.00 2/1/2013 218,975 218,581 232,327 0.01%
FNMA POOL 572220 6.00 3/1/2016 302,495 302,052 322,434 0.02%
FNMA POOL 592327 5.50 6/1/2016 529,144 522,713 557,214 0.03%
A-38

STATE OF MONTANA BOARD OF INVESTMENTS CONSOLIDATED UNIFIED INVESTMENT PROGRAM FINANICAL STATEMENT
RETIREMENT FUNDS BOND POOL
Security Name Coupon Maturity Par Amortized Cost Fair Value %
FNMA POOL 725425 5.50 4/1/2034 21,404,468 20,866,075 22,182,246 1.30%
FNMA POOL 735578 5.00 6/1/2035 9,532,922 9,050,348 9,742,474 0.57%
FNMA POOL 745250 5.00 1/1/2021 17,077,282 17,019,497 17,794,850 1.04%
FNMA POOL 745275 5.00 2/1/2036 22,296,028 21,004,572 22,786,138 1.33%
FNMA POOL 745327 6.00 3/1/2036 13,223,291 13,280,291 13,856,462 0.81%
FNMA POOL 745515 5.00 5/1/2036 16,191,272 15,407,333 16,547,187 0.97%
FNMA POOL 780956 4.50 5/1/2019 9,761,870 9,759,940 10,098,198 0.59%
FNMA POOL 899502 5.00 5/1/2037 9,098,774 9,096,065 9,278,124 0.54%
FNMA POOL 929842 6.00 8/1/2038 19,945,312 20,245,559 20,844,715 1.22%
FNMA POOL 941028 6.50 7/1/2037 9,850,769 10,145,386 10,500,360 0.62%
FNMA POOL 962533 5.50 4/1/2038 4,408,381 4,535,841 4,552,082 0.27%
FNMA POOL 972399 6.00 2/1/2038 15,827,392 16,518,547 16,541,104 0.97%
FNMA POOL 982043 6.00 5/1/2038 18,384,382 18,434,416 19,213,398 1.13%
FNMA POOL 985121 6.00 7/1/2038 12,159,729 12,136,714 12,708,053 0.74%
FNMA POOL 995118 6.50 7/1/2048 3,083,291 3,207,581 3,266,421 0.19%
U.S. Government Agency 51 Issue(s) 563,879,444 551,394,660 569,776,106 33.37%
DOT HEADQUARTERS II LEASE MTG 6.00 12/7/2021 30,000,000 30,000,000 23,632,200 1.38%
U S ARMY HOSPTLTY CASH MGT FD 7.47 5/1/2032 13,760,000 13,760,000 12,286,992 0.72%
U.S. Government Agency (Unrated) 2 Issue(s) 43,760,000 43,760,000 35,919,192 2.10%
GNMA II POOL 001254 9.50 9/20/2019 16,422 16,374 18,577 0.00%
GNMA POOL 046249 10.00 12/15/2010 1,552 1,558 1,631 0.00%
GNMA POOL 135544 10.00 1/15/2016 22,978 22,920 25,730 0.00%
GNMA POOL 688143 6.00 12/15/2038 6,751,090 7,027,721 7,033,064 0.41%
GNMA POOL 697855 5.50 2/15/2039 23,553,122 24,540,202 24,376,888 1.43%
GNMA POOL 701864 5.00 4/15/2039 11,471,539 11,910,741 11,729,767 0.69%
GLOBAL INDS LTD 7.71 2/15/2025 6,400,000 6,400,000 6,453,248 0.38%
UNITED STATES TREAS BILLS 0.29 12/3/2009 2,205,000 2,202,252 2,202,252 0.13%
UNITED STATES TREAS BILLS 0.33 12/24/2009 10,500,000 10,483,653 10,483,653 0.61%
UNITED STATES TREAS BDS 5.25 2/15/2029 7,000,000 7,540,043 7,873,880 0.46%
US TREASURY BDS 4.50 2/15/2036 10,000,000 9,947,218 10,301,599 0.60%
UNITED STATES TREAS BDS 4.50 5/15/2038 245,000 302,456 252,909 0.01%
UNITED STATES TREAS BDS 3.50 2/15/2039 15,000,000 14,402,788 12,968,250 0.76%
US TREASURY NTS 4.38 8/15/2012 4,000,000 4,341,897 4,330,960 0.25%
US TREASURY NTS 4.25 8/15/2015 10,000,000 10,573,000 10,725,600 0.63%
UNITED STATES TREAS NTS 4.63 2/15/2017 10,000,000 10,720,818 10,879,701 0.64%
UNITED STATES TREAS NTS 4.75 8/15/2017 22,000,000 23,527,940 24,120,140 1.41%
UNITED STATES TREAS NTS 3.13 4/30/2013 10,000,000 10,468,688 10,395,000 0.61%
UNITED STATES TREAS NTS 3.38 6/30/2013 12,000,000 12,424,784 12,570,960 0.74%
US TREASURY NOTE 1.50 12/31/2013 6,000,000 5,999,149 5,779,320 0.34%
UNITED STATES TREAS NTS 2.13 1/15/2019 5,357,931 5,502,171 5,538,761 0.32%
UNITED STATES TREAS NTS 2.75 2/15/2019 15,000,000 14,685,695 14,048,100 0.82%
UNITED STATE TREAS NTS 2.63 2/29/2016 15,000,000 15,003,438 14,563,800 0.85%
A-39

STATE OF MONTANA BOARD OF INVESTMENTS CONSOLIDATED UNIFIED INVESTMENT PROGRAM FINANICAL STATEMENT
RETIREMENT FUNDS BOND POOL
Security Name Coupon Maturity Par Amortized Cost Fair Value %
UNITED STATES TREAS NTS 2.38 3/31/2016 15,000,000 14,887,099 14,294,100 0.84%
WI TREASURY SEC 0.88 5/31/2011 12,130,000 12,054,641 12,086,453 0.71%
WI TREASURY N/B 1.13 6/30/2011 12,240,000 12,226,672 12,241,469 0.72%
UNITED STATES TRES SC STRP INT 0.00 8/15/2018 10,000,000 6,684,990 7,026,200 0.41%
U.S. Government Direct Obligations 27 Issue(s) 251,894,633 253,898,907 252,322,011 14.78%
RFBP Total 406 Issue(s) 1,834,406,044 1,758,946,862 1,707,369,797 100.00%
{This area intentionally left blank}
A-40

STATE OF MONTANA BOARD OF INVESTMENTS CONSOLIDATED UNIFIED INVESTMENT PROGRAM FINANICAL STATEMENT
TRUST FUNDS BOND POOL
Security Name Coupon Maturity Par Amortized Cost Fair Value %SHORT TERM INVESTMENT POOL N/A N/A 26,466,678 26,466,678 26,466,678 1.62%
Cash Equivalents 1 Issue(s) 26,466,678 26,466,678 26,466,678 1.62%
AA / FT WORTH HQ FIN TR 5.500 10/05/10 2,728,564 2,728,564 2,699,286 0.17%
AOL TIME WARNER INC 6.750 04/15/11 5,000,000 5,083,069 5,224,233 0.32%
AERO 1 HQ FIN TR 4.640 07/07/10 9,255,000 9,255,000 8,964,023 0.55%
AMERICA WEST AIRLS TR 7.930 01/02/19 2,458,064 2,458,064 2,009,467 0.12%
AMERICAN EXPRESS BK 6.000 09/13/17 4,000,000 3,991,963 3,677,288 0.23%
AMERICAN EXPRESS CO 7.250 05/20/14 2,000,000 1,996,916 2,077,895 0.13%
AMERICAN EXPRESS CENTURION BK 4.375 07/30/09 2,000,000 1,998,656 2,000,757 0.12%
AMERICAN EXPRESS CR CORP 0.000 12/02/10 5,000,000 4,516,049 4,776,453 0.29%
AMERICAN GEN FIN CORP MTN 5.900 09/15/12 4,000,000 3,994,862 2,300,000 0.14%
ANHEUSER BUSCH COS INC 5.600 03/01/17 2,000,000 2,005,844 1,936,451 0.12%
BANC AMER COML MTG INC COML 5.381 01/15/49 10,000,000 10,025,587 9,333,902 0.57%
BANC AMER COML MTG TR 5.363 07/10/46 1,619,677 1,621,284 1,631,839 0.10%
BANC AMER COML MTG TR 5.185 09/10/47 4,297,745 4,299,419 4,330,985 0.27%
BANC AMER COML MTG TR 2007 2 5.634 04/10/49 6,000,000 6,017,083 5,573,922 0.34%
BANC AMER COML MTG TR 5.837 06/10/49 10,000,000 9,998,061 9,332,340 0.57%
BANC AMER COML MTG TR 5.546 09/10/12 5,000,000 5,014,668 4,612,338 0.28%
BANK AMER CORP 5.375 09/11/12 5,000,000 4,729,193 5,000,760 0.31%
BANK OF NEW YORK MELLON 4.300 05/15/14 3,000,000 2,999,066 3,018,377 0.18%
BEAR STEARNS TR 5.540 09/11/41 8,385,000 5,973,853 7,342,930 0.45%
BEAR STEARNS COML MTG SECS TR 5.593 06/11/40 3,981,179 3,984,988 4,058,017 0.25%
BELLSOUTH TELECOMM INC 6.300 12/15/15 7,002,450 7,387,889 6,986,342 0.43%
BISHOPSGATE CDO LTD 5.180 06/30/10 10,000,000 10,000,000 8,000,000 0.49%
BURLINGTON NORTHN SANTA FE RY 7.160 01/02/20 10,432,649 10,432,649 11,400,120 0.70%
CIT GROUP EQUIP FING INC 6.490 01/05/21 7,942,500 7,942,500 4,030,819 0.25%
CSX CORP 5.750 03/15/13 6,000,000 5,989,571 6,037,387 0.37%
CVS CAREMARK CORP 5.750 06/01/17 4,000,000 3,893,482 4,031,633 0.25%
CVS CAREMARK CORP 2.150 09/10/10 2,500,000 2,346,448 2,493,100 0.15%
CAPITAL ONE FINL CORP 6.750 09/15/17 4,000,000 4,000,360 3,777,393 0.23%
CATERPILLAR FINL SVCS 1.354 06/24/11 10,000,000 9,048,788 9,795,471 0.60%
CITIGROUP INC 5.500 04/11/13 5,000,000 5,014,050 4,674,263 0.29%
COMCAST CORP 7.050 03/15/33 2,000,000 2,161,297 2,078,867 0.13%
COMM MTG TR 5.540 06/10/46 1,825,071 1,824,889 1,832,158 0.11%
CONTINENTAL AIRLS PASS THRU TR 6.545 02/02/19 5,066,669 5,066,669 4,661,335 0.29%
CORPORATE PPTY INVS 7.875 03/15/16 3,000,000 2,996,495 3,111,935 0.19%
CYPRESSTREE SYNTHETIC CDO LTD 2.648 12/30/10 15,000,000 15,000,000 6,000,000 0.37%
DONNELLEY R R + SONS CO 4.950 04/01/14 5,000,000 4,799,856 4,350,000 0.27%
DUN + BRADSTREET CORP DEL NEW 5.500 03/15/11 5,000,000 5,000,885 5,112,278 0.31%
EASTERN ENERGY LTD 7.250 12/01/16 10,000,000 9,933,294 10,128,908 0.62%
ENTERGY ARK INC 4.500 06/01/10 5,000,000 4,995,941 4,951,252 0.30%
FEDERAL EXPRESS CORP PSTHR TR 7.520 01/15/18 4,385,677 4,374,899 4,199,461 0.26%
FLORIDA GAS TRANSMISSION CO 9.190 11/01/24 4,000,000 4,000,000 4,293,571 0.26%
A-41

STATE OF MONTANA BOARD OF INVESTMENTS CONSOLIDATED UNIFIED INVESTMENT PROGRAM FINANICAL STATEMENT
TRUST FUNDS BOND POOL
Security Name Coupon Maturity Par Amortized Cost Fair Value %FLORIDA GAS TRANSMISSION CO 7.000 07/17/12 3,000,000 2,998,676 3,076,136 0.19%
FORD MTR CR CO 7.375 10/28/09 7,000,000 7,000,372 6,860,000 0.42%
FORTUNE BRANDS INC 5.375 01/15/16 3,000,000 2,987,655 2,736,711 0.17%
GATX CORP 8.750 05/15/14 10,000,000 9,987,888 10,499,999 0.64%
GE COML MTG CORP TR 5.417 12/10/49 10,000,000 10,026,672 8,674,831 0.53%
GS MTG SECS CORP II 4.751 07/10/39 10,000,000 7,825,288 8,579,508 0.53%
GSPA MONETIZATION TR 6.422 10/09/29 11,946,320 12,041,862 10,005,760 0.61%
GALENA CDO I CAYMAN IS NO 1LTD 5.060 01/11/13 9,000,000 900,000 900,000 0.06%
GAZPROM INTL S A 7.201 02/01/20 1,502,111 1,521,408 1,411,984 0.09%
GENERAL ELEC CAP CORP 1.156 05/11/16 5,000,000 3,787,345 3,980,770 0.24%
GENERAL ELEC CAP CORP 0.000 09/15/14 5,000,000 4,035,408 4,236,668 0.26%
GENERAL ELEC CAP CORP 5.000 01/08/16 2,000,000 1,991,492 1,927,365 0.12%
GENERAL ELEC CAP CORP 5.875 02/15/12 5,000,000 5,004,593 5,235,133 0.32%
GENWORTH GLOBAL FDG TRS SECD 5.125 03/15/11 3,000,000 2,997,100 2,928,520 0.18%
GEORGIA PWR CO 5.250 12/15/15 2,000,000 2,000,077 2,069,147 0.13%
GOLDMAN SACHS GROUP INC 1.059 03/22/16 6,000,000 4,387,808 5,055,000 0.31%
GOLDMAN SACHS GROUP 5.300 02/14/12 2,000,000 1,998,867 2,075,718 0.13%
GOODRICH CORP 6.125 03/01/19 4,050,000 3,991,835 4,079,189 0.25%
HSBC FIN CORP 0.000 09/14/12 4,000,000 3,468,832 3,490,875 0.21%
HSBC FIN CORP 5.500 01/19/16 5,000,000 4,985,241 4,667,281 0.29%
HSBC FIN CORP 5.900 06/19/12 5,000,000 4,995,936 5,038,071 0.31%
HAWAIIAN ELEC INDS INC MEDIUM 6.141 08/15/11 4,000,000 4,000,000 4,258,782 0.26%
ING SEC LIFE INSTL FDG 4.250 01/15/10 5,000,000 4,998,815 4,887,010 0.30%
INTL LEASE FIN CORP MTN 4.550 10/15/09 3,000,000 3,000,685 2,880,000 0.18%
JPMORGAN CHASE + CO 6.300 04/23/19 10,000,000 9,986,363 10,075,963 0.62%
JPMORGAN CHASE + CO 4.650 06/01/14 5,000,000 4,989,946 4,976,064 0.30%
J P MORGAN CHASE COML MTG 4.555 06/12/41 4,047,410 4,047,375 4,037,291 0.25%
J P MORGAN CHASE COML MTG 3.053 01/15/38 1,072,224 1,052,005 1,066,019 0.07%
J P MORGAN CHASE COML MTG SECS 5.336 05/15/47 10,000,000 7,466,347 7,113,485 0.44%
JP MORGAN CHASE 5.279 12/12/43 7,111,848 7,115,794 7,190,949 0.44%
JERSEY CENT PWR + LT CO 5.650 06/01/17 4,000,000 3,988,950 3,906,670 0.24%
KCT INTERMODAL TRANSN CORP 6.884 08/01/18 1,392,267 1,392,267 1,457,489 0.09%
KELLWOOD CO 7.625 10/15/17 8,000,000 800,000 1,200,000 0.07%
KERR MCGEE CORP 7.125 10/15/27 3,000,000 3,028,794 2,259,301 0.14%
KEYBANK NATL ASSN CLEVELAND OH 5.500 09/17/12 5,000,000 4,999,552 4,950,000 0.30%
KEYBANK NATL ASSN MTN 5.450 03/03/16 5,000,000 4,999,199 4,286,436 0.26%
LB UBS COML MTG TR 5.661 03/15/39 10,000,000 7,705,139 8,482,617 0.52%
LB UBS COML MTG TR 5.858 07/15/40 10,000,000 7,124,077 7,761,806 0.48%
LEHMAN BROTHERS HLDGS INC 5.500 05/25/10 5,000,000 1,000,000 737,500 0.05%
LOCKHEED MARTIN CORP 4.121 03/14/13 10,000,000 9,874,812 10,123,679 0.62%
ML CFC COML MTG TR 5.549 06/12/50 3,473,753 3,475,869 3,521,734 0.22%
MACMILLAN BLOEDEL LTD 7.700 02/15/26 5,000,000 4,917,761 4,061,845 0.25%
MEAD CORP 7.350 03/01/17 4,000,000 3,998,288 3,440,000 0.21%
MED MAP L L C 7.060 06/01/24 4,005,000 4,005,000 3,943,123 0.24%
A-42

STATE OF MONTANA BOARD OF INVESTMENTS CONSOLIDATED UNIFIED INVESTMENT PROGRAM FINANICAL STATEMENT
TRUST FUNDS BOND POOL
Security Name Coupon Maturity Par Amortized Cost Fair Value %MED MAP L L C COLO REV 7.000 06/01/24 4,405,000 4,405,000 4,313,068 0.26%
MELLON FDG CORP 1.033 05/15/14 5,000,000 5,000,000 4,609,429 0.28%
MERRILL LYNCH + CO INC 0.000 06/05/12 5,000,000 4,393,785 4,438,409 0.27%
MERRILL LYNCH + CO INC 6.875 04/25/18 10,000,000 8,899,580 9,164,083 0.56%
METLIFE INC 5.000 11/24/13 5,000,000 4,978,862 4,901,580 0.30%
METLIFE INC 6.750 06/01/16 5,000,000 4,988,303 5,081,949 0.31%
METROPOLITAN LIFE GOLBAL MTN 4.250 07/30/09 2,000,000 1,999,984 2,001,819 0.12%
METROPOLITAN LIFE GLOBAL FDG I 1.358 06/25/10 1,000,000 947,264 996,631 0.06%
MORGAN STANLEY 1.449 01/09/14 5,000,000 3,735,595 4,456,250 0.27%
NEWS AMER INC 6.150 03/01/37 3,000,000 3,032,315 2,525,766 0.15%
ONEOK PARTERS LP 6.850 10/15/37 2,000,000 2,060,557 1,889,428 0.12%
PPL ELEC UTILS CORP 6.450 08/15/37 2,000,000 1,999,494 2,077,252 0.13%
PPL MONT LLC 8.903 07/02/20 16,263,683 16,310,439 17,863,584 1.09%
PACIFIC BELL 7.250 11/01/27 4,000,000 3,979,379 3,587,145 0.22%
PACIFIC LIFE GLOBAL FDG 5.150 04/15/13 3,000,000 2,998,909 2,909,096 0.18%
PANAMERICAN BEVERAGES INC 7.250 07/01/09 8,000,000 8,000,000 8,000,000 0.49%
PENNSYLVANIA ELEC CO 6.050 09/01/17 2,000,000 1,995,150 1,940,498 0.12%
POTASH CORP SASKATCHEWAN 6.500 05/15/19 2,000,000 1,998,348 2,151,485 0.13%
PREMIUM ASSET TR 0.000 09/28/10 2,000,000 1,820,000 1,820,000 0.11%
PROTECTIVE LIFE SECD TRS SECD 5.450 09/28/12 4,000,000 3,995,615 3,980,093 0.24%
PRUDENTIAL FINL INC 5.500 03/15/16 5,000,000 4,931,244 4,535,230 0.28%
PUBLIC SVC CO COLO 6.250 09/01/37 4,000,000 4,088,848 4,357,440 0.27%
PUGET SOUND PWR + LT CO 5.197 10/01/15 6,000,000 5,914,135 5,898,300 0.36%
RAS LAFFAN LIQUEFIED NAT GAS 5.298 09/30/20 6,000,000 5,717,395 5,370,000 0.33%
RAS LAFFAN LIQUEFIED NAT GAS 6.332 09/30/27 4,000,000 3,925,841 3,420,000 0.21%
SLM CORP 5.125 08/27/12 2,000,000 1,865,573 1,730,000 0.11%
SLM CORP 5.375 01/15/13 3,000,000 2,998,192 2,535,000 0.16%
ST PAUL TRAVELERS COS INC 6.250 06/20/16 3,000,000 3,139,551 3,168,863 0.19%
SAN DIEGO GAS + ELEC CO 6.125 09/15/37 1,000,000 997,065 1,071,810 0.07%
SEARIVER MARITIME FINL HLDGS 0.000 09/01/12 20,000,000 17,330,840 18,105,840 1.11%
SECURITY CAP GROUP INC 7.700 06/15/28 2,000,000 2,277,977 1,795,195 0.11%
SEMPRA ENERGY 6.150 06/15/18 5,000,000 4,881,068 4,974,708 0.30%
SOUTHERN POWERCO 6.375 11/15/36 2,000,000 1,688,283 1,593,417 0.10%
SOUTHERN UN CO NEW 7.600 02/01/24 8,000,000 7,572,810 7,210,370 0.44%
SOUTHWESTERN BELL TEL CO 7.000 11/15/27 2,000,000 1,998,310 1,755,380 0.11%
SUNCOR ENERGY INC 6.500 06/15/38 2,000,000 2,005,579 1,873,236 0.11%
TTX CO MEDIUM TERM NTS BOOK 6.050 06/15/16 5,000,000 4,993,173 4,681,350 0.29%
TEXAS GAS TRANSMISSION CORP 7.250 07/15/27 2,000,000 1,879,673 1,720,865 0.11%
TIME WARNER INC 6.625 05/15/29 3,000,000 3,087,058 2,656,374 0.16%
TRANSCANADA PIPELINES LTD 7.625 01/15/39 3,000,000 2,999,203 3,456,362 0.21%
TRANSCONTINENTAL GAS PIPE LINE 7.250 12/01/26 2,000,000 2,001,360 2,004,809 0.12%
TRAVELERS LIFE ANNUITY GLOBAL 4.250 10/01/10 10,000,000 10,022,187 9,645,820 0.59%
TRISTATE GEN + TRANS ASSN 6.040 01/31/18 5,334,840 5,361,222 5,207,497 0.32%
USX MARATHON GROUP 9.375 02/15/12 5,000,000 5,369,122 5,713,616 0.35%
A-43
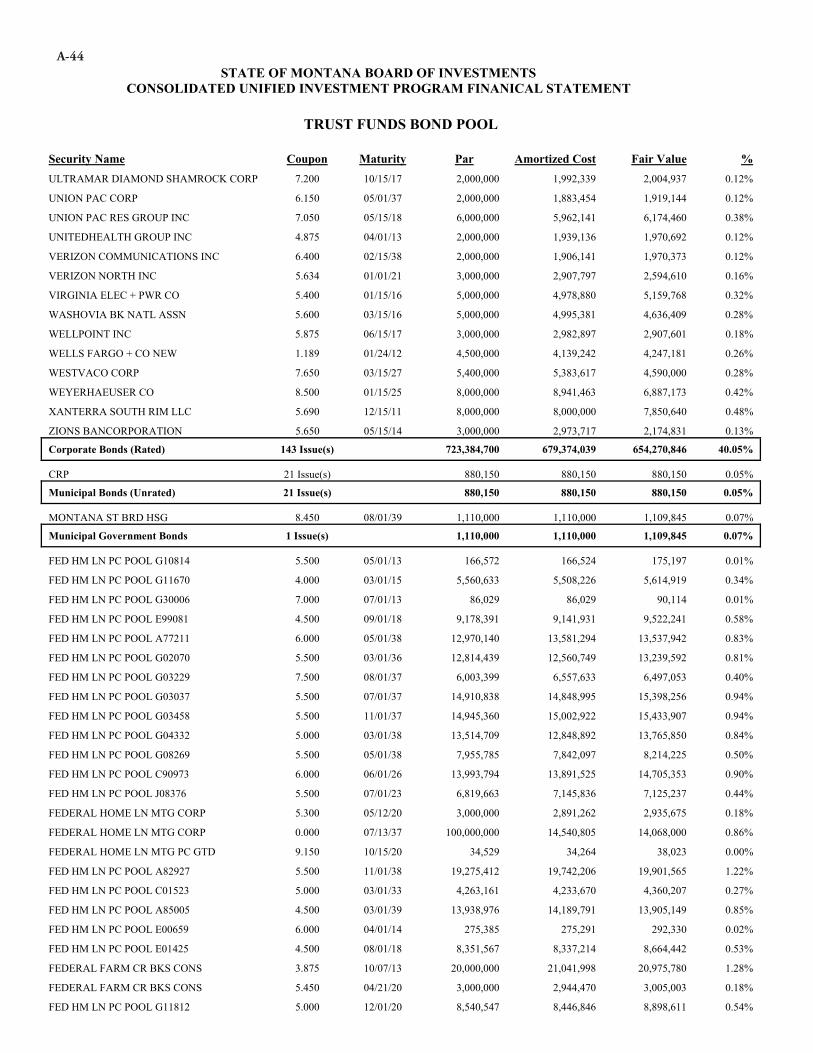
STATE OF MONTANA BOARD OF INVESTMENTS CONSOLIDATED UNIFIED INVESTMENT PROGRAM FINANICAL STATEMENT
TRUST FUNDS BOND POOL
Security Name Coupon Maturity Par Amortized Cost Fair Value %ULTRAMAR DIAMOND SHAMROCK CORP 7.200 10/15/17 2,000,000 1,992,339 2,004,937 0.12%
UNION PAC CORP 6.150 05/01/37 2,000,000 1,883,454 1,919,144 0.12%
UNION PAC RES GROUP INC 7.050 05/15/18 6,000,000 5,962,141 6,174,460 0.38%
UNITEDHEALTH GROUP INC 4.875 04/01/13 2,000,000 1,939,136 1,970,692 0.12%
VERIZON COMMUNICATIONS INC 6.400 02/15/38 2,000,000 1,906,141 1,970,373 0.12%
VERIZON NORTH INC 5.634 01/01/21 3,000,000 2,907,797 2,594,610 0.16%
VIRGINIA ELEC + PWR CO 5.400 01/15/16 5,000,000 4,978,880 5,159,768 0.32%
WASHOVIA BK NATL ASSN 5.600 03/15/16 5,000,000 4,995,381 4,636,409 0.28%
WELLPOINT INC 5.875 06/15/17 3,000,000 2,982,897 2,907,601 0.18%
WELLS FARGO + CO NEW 1.189 01/24/12 4,500,000 4,139,242 4,247,181 0.26%
WESTVACO CORP 7.650 03/15/27 5,400,000 5,383,617 4,590,000 0.28%
WEYERHAEUSER CO 8.500 01/15/25 8,000,000 8,941,463 6,887,173 0.42%
XANTERRA SOUTH RIM LLC 5.690 12/15/11 8,000,000 8,000,000 7,850,640 0.48%
ZIONS BANCORPORATION 5.650 05/15/14 3,000,000 2,973,717 2,174,831 0.13%
Corporate Bonds (Rated) 143 Issue(s) 723,384,700 679,374,039 654,270,846 40.05%
CRP 21 Issue(s) 880,150 880,150 880,150 0.05%
Municipal Bonds (Unrated) 21 Issue(s) 880,150 880,150 880,150 0.05%
MONTANA ST BRD HSG 8.450 08/01/39 1,110,000 1,110,000 1,109,845 0.07%
Municipal Government Bonds 1 Issue(s) 1,110,000 1,110,000 1,109,845 0.07%
FED HM LN PC POOL G10814 5.500 05/01/13 166,572 166,524 175,197 0.01%
FED HM LN PC POOL G11670 4.000 03/01/15 5,560,633 5,508,226 5,614,919 0.34%
FED HM LN PC POOL G30006 7.000 07/01/13 86,029 86,029 90,114 0.01%
FED HM LN PC POOL E99081 4.500 09/01/18 9,178,391 9,141,931 9,522,241 0.58%
FED HM LN PC POOL A77211 6.000 05/01/38 12,970,140 13,581,294 13,537,942 0.83%
FED HM LN PC POOL G02070 5.500 03/01/36 12,814,439 12,560,749 13,239,592 0.81%
FED HM LN PC POOL G03229 7.500 08/01/37 6,003,399 6,557,633 6,497,053 0.40%
FED HM LN PC POOL G03037 5.500 07/01/37 14,910,838 14,848,995 15,398,256 0.94%
FED HM LN PC POOL G03458 5.500 11/01/37 14,945,360 15,002,922 15,433,907 0.94%
FED HM LN PC POOL G04332 5.000 03/01/38 13,514,709 12,848,892 13,765,850 0.84%
FED HM LN PC POOL G08269 5.500 05/01/38 7,955,785 7,842,097 8,214,225 0.50%
FED HM LN PC POOL C90973 6.000 06/01/26 13,993,794 13,891,525 14,705,353 0.90%
FED HM LN PC POOL J08376 5.500 07/01/23 6,819,663 7,145,836 7,125,237 0.44%
FEDERAL HOME LN MTG CORP 5.300 05/12/20 3,000,000 2,891,262 2,935,675 0.18%
FEDERAL HOME LN MTG CORP 0.000 07/13/37 100,000,000 14,540,805 14,068,000 0.86%
FEDERAL HOME LN MTG PC GTD 9.150 10/15/20 34,529 34,264 38,023 0.00%
FED HM LN PC POOL A82927 5.500 11/01/38 19,275,412 19,742,206 19,901,565 1.22%
FED HM LN PC POOL C01523 5.000 03/01/33 4,263,161 4,233,670 4,360,207 0.27%
FED HM LN PC POOL A85005 4.500 03/01/39 13,938,976 14,189,791 13,905,149 0.85%
FED HM LN PC POOL E00659 6.000 04/01/14 275,385 275,291 292,330 0.02%
FED HM LN PC POOL E01425 4.500 08/01/18 8,351,567 8,337,214 8,664,442 0.53%
FEDERAL FARM CR BKS CONS 3.875 10/07/13 20,000,000 21,041,998 20,975,780 1.28%
FEDERAL FARM CR BKS CONS 5.450 04/21/20 3,000,000 2,944,470 3,005,003 0.18%
FED HM LN PC POOL G11812 5.000 12/01/20 8,540,547 8,446,846 8,898,611 0.54%
A-44

STATE OF MONTANA BOARD OF INVESTMENTS CONSOLIDATED UNIFIED INVESTMENT PROGRAM FINANICAL STATEMENT
TRUST FUNDS BOND POOL
Security Name Coupon Maturity Par Amortized Cost Fair Value %FEDERAL HOME LN BKS 4.500 11/14/14 3,000,000 3,205,110 3,156,034 0.19%
FEDERAL HOME LOAN BANK 4.875 05/17/17 15,000,000 14,797,563 16,152,326 0.99%
FEDERAL HOME LN MTG CORP 8.250 06/01/26 5,000,000 5,081,373 6,667,450 0.41%
FEDERAL NATL MTG ASSN 0.000 10/09/19 20,000,000 12,373,722 10,105,544 0.62%
FEDERAL NATL MTG ASSN 5.375 04/11/22 4,000,000 4,110,979 4,074,390 0.25%
FEDERAL NATL MTG ASSN 5.000 04/26/17 10,000,000 9,765,419 10,150,403 0.62%
FNMA POOL 190353 5.000 08/01/34 17,386,559 17,989,084 17,778,852 1.09%
FNMA POOL 190375 5.500 11/01/36 6,597,534 6,605,595 6,816,791 0.42%
FEDERAL NATL MTG ASSOC 0.000 07/30/37 100,000,000 14,489,056 14,059,700 0.86%
FNMA POOL 254233 5.000 03/01/17 2,905,537 2,851,083 3,030,809 0.19%
FNMA POOL 254476 5.500 09/01/32 9,387,558 9,776,434 9,724,989 0.60%
FNMA POOL 254631 5.000 02/01/18 3,714,870 3,692,648 3,890,489 0.24%
FNMA POOL 256600 5.500 02/01/27 13,480,774 13,490,706 13,996,262 0.86%
FNMA POOL 255731 5.000 06/01/25 1,752,279 1,793,207 1,797,640 0.11%
FNMA POOL 256083 6.000 01/01/26 14,146,439 14,101,832 14,866,572 0.91%
FNMA POOL 256714 5.500 05/01/27 14,208,974 14,146,510 14,752,308 0.90%
FNMA POOL 256895 5.500 09/01/37 3,284,865 3,261,908 3,392,152 0.21%
FNMA POOL 303202 6.500 05/01/14 359,219 357,798 376,019 0.02%
FNMA POOL 313999 6.000 02/01/13 109,487 109,290 116,163 0.01%
FNMA POOL 572220 6.000 03/01/16 302,495 302,052 322,434 0.02%
FNMA POOL 592327 5.500 06/01/16 407,034 402,087 428,626 0.03%
FNMA POOL 646203 6.500 07/01/32 2,012,269 2,169,104 2,162,720 0.13%
FNMA POOL 723551 4.500 08/01/23 580,067 587,392 584,021 0.04%
FNMA POOL 725232 5.000 03/01/34 25,400,194 24,145,512 25,987,810 1.59%
FNMA POOL 725946 5.500 11/01/34 1,516,957 1,560,948 1,571,539 0.10%
FNMA POOL 735141 5.500 01/01/35 8,030,170 8,265,550 8,319,108 0.51%
FNMA POOL 735989 5.500 02/01/35 17,165,495 17,105,681 17,789,240 1.09%
FNMA POOL 745250 5.000 01/01/21 11,384,855 11,346,331 11,863,233 0.73%
FNMA POOL 745515 5.000 05/01/36 14,286,355 13,594,647 14,600,396 0.89%
FNMA POOL 780956 4.500 05/01/19 4,880,935 4,880,084 5,049,099 0.31%
FNMA POOL 899502 5.000 05/01/37 7,516,379 7,514,141 7,664,538 0.47%
FNMA POOL 929842 6.000 08/01/38 17,343,749 17,599,560 18,125,839 1.11%
FNMA POOL 933853 6.000 05/01/38 14,022,743 14,069,387 14,655,078 0.90%
FNMA POOL 936499 6.000 06/01/37 16,387,071 16,643,434 17,141,951 1.05%
FNMA POOL 944622 5.500 07/01/37 11,465,730 11,809,553 11,840,212 0.72%
FNMA POOL 954878 6.500 11/01/37 20,947,182 22,256,601 22,328,508 1.37%
FNMA POOL 962533 5.500 04/01/38 4,408,381 4,535,841 4,552,082 0.28%
FNMA POOL 968044 6.500 02/01/38 4,092,281 4,206,100 4,361,359 0.27%
FNMA POOL 972562 6.000 03/01/38 17,380,275 17,998,326 18,164,012 1.11%
FNMA POOL 985023 5.500 06/01/38 9,937,939 10,249,879 10,261,890 0.63%
FNMA POOL 990939 6.500 09/01/38 5,337,161 5,603,743 5,688,094 0.35%
FNMA POOL 995118 6.500 07/01/48 9,658,966 10,048,327 10,232,655 0.62%
SMALL BUSINESS ADMIN 6.220 12/01/28 2,934,115 2,934,115 3,170,941 0.19%
TENNESSEE VALLEY AUTH FBE STRP 0.000 01/15/27 7,125,000 3,062,161 2,797,641 0.17%
A-45
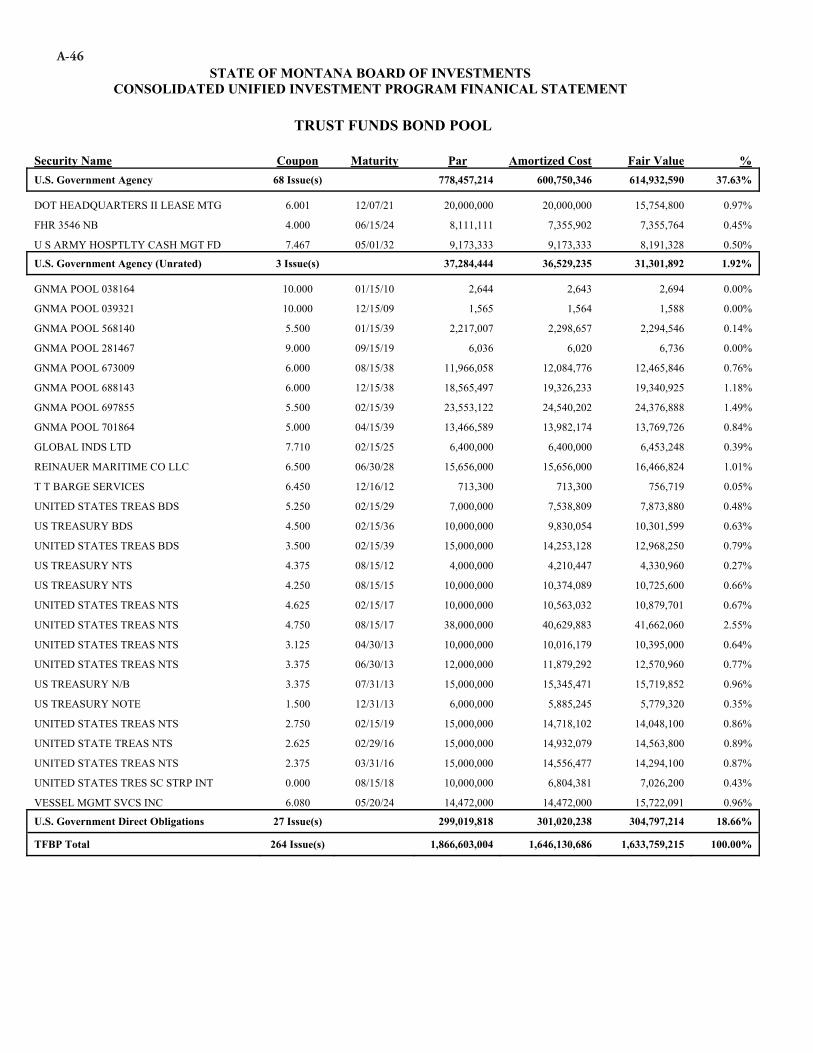
STATE OF MONTANA BOARD OF INVESTMENTS CONSOLIDATED UNIFIED INVESTMENT PROGRAM FINANICAL STATEMENT
TRUST FUNDS BOND POOL
Security Name Coupon Maturity Par Amortized Cost Fair Value %U.S. Government Agency 68 Issue(s) 778,457,214 600,750,346 614,932,590 37.63%
DOT HEADQUARTERS II LEASE MTG 6.001 12/07/21 20,000,000 20,000,000 15,754,800 0.97%
FHR 3546 NB 4.000 06/15/24 8,111,111 7,355,902 7,355,764 0.45%
U S ARMY HOSPTLTY CASH MGT FD 7.467 05/01/32 9,173,333 9,173,333 8,191,328 0.50%
U.S. Government Agency (Unrated) 3 Issue(s) 37,284,444 36,529,235 31,301,892 1.92%
GNMA POOL 038164 10.000 01/15/10 2,644 2,643 2,694 0.00%
GNMA POOL 039321 10.000 12/15/09 1,565 1,564 1,588 0.00%
GNMA POOL 568140 5.500 01/15/39 2,217,007 2,298,657 2,294,546 0.14%
GNMA POOL 281467 9.000 09/15/19 6,036 6,020 6,736 0.00%
GNMA POOL 673009 6.000 08/15/38 11,966,058 12,084,776 12,465,846 0.76%
GNMA POOL 688143 6.000 12/15/38 18,565,497 19,326,233 19,340,925 1.18%
GNMA POOL 697855 5.500 02/15/39 23,553,122 24,540,202 24,376,888 1.49%
GNMA POOL 701864 5.000 04/15/39 13,466,589 13,982,174 13,769,726 0.84%
GLOBAL INDS LTD 7.710 02/15/25 6,400,000 6,400,000 6,453,248 0.39%
REINAUER MARITIME CO LLC 6.500 06/30/28 15,656,000 15,656,000 16,466,824 1.01%
T T BARGE SERVICES 6.450 12/16/12 713,300 713,300 756,719 0.05%
UNITED STATES TREAS BDS 5.250 02/15/29 7,000,000 7,538,809 7,873,880 0.48%
US TREASURY BDS 4.500 02/15/36 10,000,000 9,830,054 10,301,599 0.63%
UNITED STATES TREAS BDS 3.500 02/15/39 15,000,000 14,253,128 12,968,250 0.79%
US TREASURY NTS 4.375 08/15/12 4,000,000 4,210,447 4,330,960 0.27%
US TREASURY NTS 4.250 08/15/15 10,000,000 10,374,089 10,725,600 0.66%
UNITED STATES TREAS NTS 4.625 02/15/17 10,000,000 10,563,032 10,879,701 0.67%
UNITED STATES TREAS NTS 4.750 08/15/17 38,000,000 40,629,883 41,662,060 2.55%
UNITED STATES TREAS NTS 3.125 04/30/13 10,000,000 10,016,179 10,395,000 0.64%
UNITED STATES TREAS NTS 3.375 06/30/13 12,000,000 11,879,292 12,570,960 0.77%
US TREASURY N/B 3.375 07/31/13 15,000,000 15,345,471 15,719,852 0.96%
US TREASURY NOTE 1.500 12/31/13 6,000,000 5,885,245 5,779,320 0.35%
UNITED STATES TREAS NTS 2.750 02/15/19 15,000,000 14,718,102 14,048,100 0.86%
UNITED STATE TREAS NTS 2.625 02/29/16 15,000,000 14,932,079 14,563,800 0.89%
UNITED STATES TREAS NTS 2.375 03/31/16 15,000,000 14,556,477 14,294,100 0.87%
UNITED STATES TRES SC STRP INT 0.000 08/15/18 10,000,000 6,804,381 7,026,200 0.43%
VESSEL MGMT SVCS INC 6.080 05/20/24 14,472,000 14,472,000 15,722,091 0.96%
U.S. Government Direct Obligations 27 Issue(s) 299,019,818 301,020,238 304,797,214 18.66%
TFBP Total 264 Issue(s) 1,866,603,004 1,646,130,686 1,633,759,215 100.00%
A-46

STATE OF MONTANA BOARD OF INVESTMENTS CONSOLIDATED UNIFIED INVESTMENT PROGRAM FINANICAL STATEMENT
MONTANA DOMESTIC EQUITY POOL( MDEP) BY MANAGER
Manager Shares Carrying Value Fair Value %BGI EQUITY INDEX FUND 1,967,009 591,551,226 538,484,994 25.43%
BGI MIDCAP EQUITY INDEX FUND 1,021,487 17,955,912 15,548,391 0.73%
DIMENSIONAL FUND ADVISORS INC 52,280 35,190,238 41,413,149 1.96%
GOLDMAN SACHS ENHANCED LARGE 9,330,103 125,956,387 93,207,726 4.40%
STATE STREET SPIF ALT INV 28,712 3,395,598 3,664,672 0.17%
WESTERN ASSET US INDX PLUS LLC 13,632,891 206,937,301 93,508,002 4.42% Total Commingled Accounts 26,032,482 980,986,662 785,826,934 37.11%
JP MORGAN INVESTMENTS - 248 Issues 5,054,651 166,292,261 153,394,659 7.24%
T ROWE PRICE - 304 Issues 5,971,998 174,472,838 147,209,455 6.95%
BARROW HANLEY MEWHINNEY - 91 Issues 6,930,267 192,398,921 136,409,835 6.44%
INTECH - 434 Issues 5,599,602 146,859,848 131,280,908 6.20%
RENAISSANCE INVESTMENTS - 56 Issues 3,804,595 115,313,652 103,759,459 4.90%
RAINIER INVESTMENTS - 76 Issues 4,009,725 108,637,629 99,654,292 4.71%
COLUMBUS CIRCLE - 53 Issues 6,324,530 103,630,746 98,429,699 4.65%
QUANTITATIVE MANAGEMENT - 145 Issues 4,435,866 134,342,838 86,885,727 4.10%
ANALYTICS INVESTMENTS - 392 Issues 3,604,860 84,213,105 80,925,561 3.82%
MARTINGALE - 155 Issues 3,595,045 73,333,062 69,239,941 3.27%
TIMESSQUARE - 71 Issues 4,045,701 67,909,722 59,807,035 2.82%
MARTINGALE INVESTMENTS - 281 Issues 2,177,042 60,039,995 53,061,445 2.51%
ARTISAN - 57 Issues 4,118,193 57,935,745 48,469,300 2.29%
VAUGHAN NELSON - 68 Issues 2,732,920 35,562,574 35,707,458 1.69%
NORTHPOINTE - 77 Issues 3,278,347 28,037,019 27,277,260 1.29%Total Manager Accounts 65,683,342 1,548,979,955 1,331,512,034 62.89%
MDEP TOTAL - 2514 Issues 91,715,824 2,529,966,617 2,117,338,968 100.00%
{This area intentionally left blank}
A-47

STATE OF MONTANA BOARD OF INVESTMENTS CONSOLIDATED UNIFIED INVESTMENT PROGRAM FINANICAL STATEMENT
MONTANA INTERNATIONAL EQUITY POOL(MTIP) BY MANAGER
Manager Shares Carrying Value Fair Value %BGI ACWI EX US SUPERFUND A 4,105,385 60,000,587 59,582,815 6.12%
BGI MSCI EQUITY INDEX FD EUROP 10,300,478 93,208,727 102,239,711 10.50%
BGI GLOBAL EX US ALPHA TILT FD 5,048,801 101,210,818 79,828,258 8.20%
AXA ROSENBERG INTL SMALL CAP 2,564,175 46,908,465 30,055,820 3.09%
DFA INTL SMALL CO PORTFOLIO 3,352,447 50,564,305 39,793,549 4.09%
EAFE STOCK PERFORMANCE INDEX 711,371 13,604,025 13,927,219 1.43% Total Commingled Accounts 26,082,657 365,496,927 325,427,372 33.43% BATTERYMARCH - 205 Issues 17,900,340 116,485,174 111,198,353 11.42% ARTIO GLOBAL - 299 Issues 8,497,510 114,946,599 111,228,699 11.43% ACADIAN - 307 Issues 35,274,736 87,312,680 79,612,513 8.18% BERNSTEIN - 123 Issues 8,566,213 109,013,836 84,651,921 8.70% MARTIN CURRIE - 55 Issues 8,128,425 74,637,948 77,981,184 8.01% HANSBERGER - 68 Issues 8,939,201 86,210,995 79,712,890 8.19% PRINCIPAL - 206 Issues 4,699,770 40,033,266 38,785,989 3.98% NOMURA - 212 Issues 22,066,964 65,308,383 64,882,552 6.67% Total Manager Accounts 114,073,159 693,948,881 648,054,101 66.57% MTIP Total - 1481 Issues 140,155,816 1,059,445,808 973,481,473 100.00%
{This area intentionally left blank}
A-48
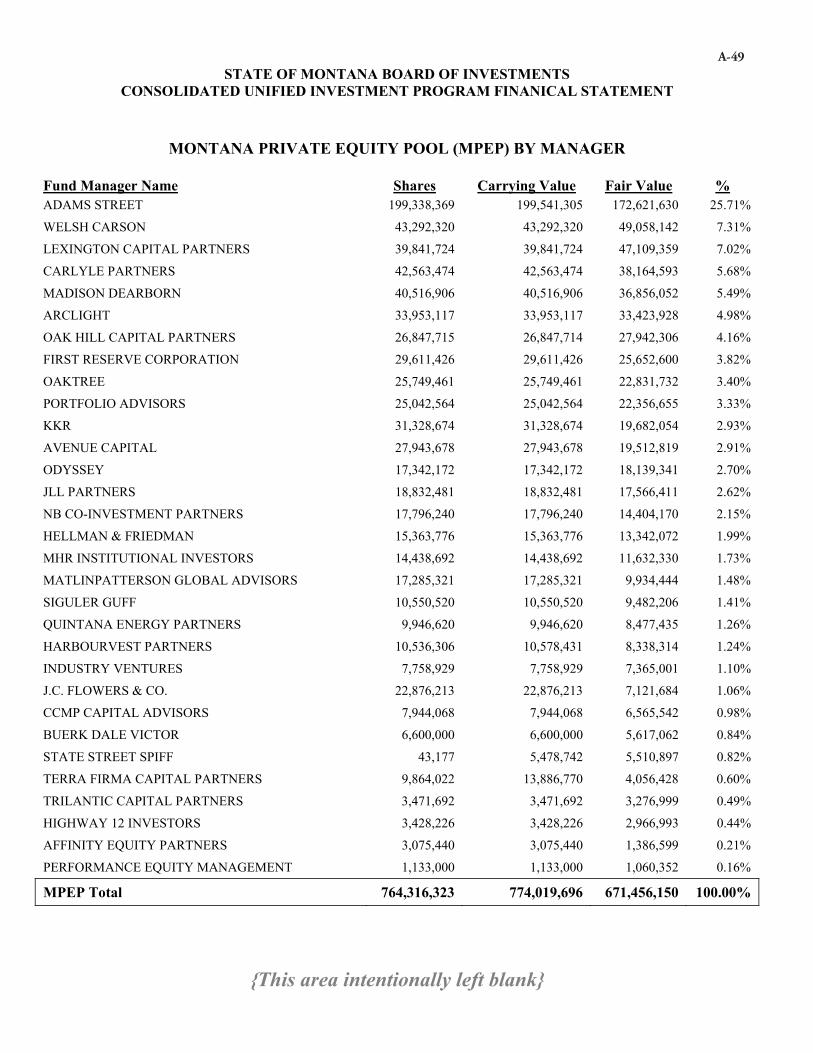
STATE OF MONTANA BOARD OF INVESTMENTS CONSOLIDATED UNIFIED INVESTMENT PROGRAM FINANICAL STATEMENT
MONTANA PRIVATE EQUITY POOL (MPEP) BY MANAGER
Fund Manager Name Shares Carrying Value Fair Value %ADAMS STREET 199,338,369 199,541,305 172,621,630 25.71%
WELSH CARSON 43,292,320 43,292,320 49,058,142 7.31%
LEXINGTON CAPITAL PARTNERS 39,841,724 39,841,724 47,109,359 7.02%
CARLYLE PARTNERS 42,563,474 42,563,474 38,164,593 5.68%
MADISON DEARBORN 40,516,906 40,516,906 36,856,052 5.49%
ARCLIGHT 33,953,117 33,953,117 33,423,928 4.98%
OAK HILL CAPITAL PARTNERS 26,847,715 26,847,714 27,942,306 4.16%
FIRST RESERVE CORPORATION 29,611,426 29,611,426 25,652,600 3.82%
OAKTREE 25,749,461 25,749,461 22,831,732 3.40%
PORTFOLIO ADVISORS 25,042,564 25,042,564 22,356,655 3.33%
KKR 31,328,674 31,328,674 19,682,054 2.93%
AVENUE CAPITAL 27,943,678 27,943,678 19,512,819 2.91%
ODYSSEY 17,342,172 17,342,172 18,139,341 2.70%
JLL PARTNERS 18,832,481 18,832,481 17,566,411 2.62%
NB CO-INVESTMENT PARTNERS 17,796,240 17,796,240 14,404,170 2.15%
HELLMAN & FRIEDMAN 15,363,776 15,363,776 13,342,072 1.99%
MHR INSTITUTIONAL INVESTORS 14,438,692 14,438,692 11,632,330 1.73%
MATLINPATTERSON GLOBAL ADVISORS 17,285,321 17,285,321 9,934,444 1.48%
SIGULER GUFF 10,550,520 10,550,520 9,482,206 1.41%
QUINTANA ENERGY PARTNERS 9,946,620 9,946,620 8,477,435 1.26%
HARBOURVEST PARTNERS 10,536,306 10,578,431 8,338,314 1.24%
INDUSTRY VENTURES 7,758,929 7,758,929 7,365,001 1.10%
J.C. FLOWERS & CO. 22,876,213 22,876,213 7,121,684 1.06%
CCMP CAPITAL ADVISORS 7,944,068 7,944,068 6,565,542 0.98%
BUERK DALE VICTOR 6,600,000 6,600,000 5,617,062 0.84%
STATE STREET SPIFF 43,177 5,478,742 5,510,897 0.82%
TERRA FIRMA CAPITAL PARTNERS 9,864,022 13,886,770 4,056,428 0.60%
TRILANTIC CAPITAL PARTNERS 3,471,692 3,471,692 3,276,999 0.49%
HIGHWAY 12 INVESTORS 3,428,226 3,428,226 2,966,993 0.44%
AFFINITY EQUITY PARTNERS 3,075,440 3,075,440 1,386,599 0.21%
PERFORMANCE EQUITY MANAGEMENT 1,133,000 1,133,000 1,060,352 0.16%
MPEP Total 764,316,323 774,019,696 671,456,150 100.00%
{This area intentionally left blank}
A-49

STATE OF MONTANA BOARD OF INVESTMENTS CONSOLIDATED UNIFIED INVESTMENT PROGRAM FINANICAL STATEMENT
Fund Manager Name Shares Carrying Value Fair Value %
JP MORGAN CHASE BANK STRATEGIC PROPERTIES 37,804 71,383,708 53,054,243 18.43%INVESCO CORE REAL ESTATE 309 45,000,000 38,137,553 13.24%CLARION LION PROPERTIES 31,957 45,000,000 32,738,588 11.37%HUDSON REALTY CAPITAL 25,000,000 25,000,000 22,056,950 7.66%STRATEGIC PARTNERS VALUE ENHANCEMENT 16,765,519 16,765,519 18,727,286 6.50%TA ASSOCIATES REALTY 20,000,000 20,000,000 18,153,620 6.30%ABR CHESAPEAKE 17,770,784 17,770,784 18,109,957 6.29%DRA ADVISORS 13,261,356 13,261,356 11,758,088 4.08%LIQUID REALTY 15,535,697 15,535,698 11,603,582 4.03%AG (ANGELO GORDON) REALTY 12,576,366 12,576,366 10,607,192 3.68%APOLLO REAL ESTATE FINANCE CORP. 9,079 9,079,000 9,081,470 3.15%JER REAL ESTATE PARTNERS 15,311,878 15,311,878 8,240,899 2.86%MORGAN STANLEY REAL ESTATE 27,536,302 27,536,302 7,695,928 2.67%BEACON CAPITAL PARTNERS 16,562,500 16,562,500 7,250,218 2.52%CARLYLE EUROPE REAL ESTATE PARTNERS 5,686,485 8,844,179 5,768,448 2.00%SHORT TERM INVESTMENT POOL 4,469,890 4,469,890 4,469,890 1.55%MACQUARIE GLOBAL PROPERTY 12,529,074 12,529,074 3,619,286 1.26%ROTHSCHILD: FIVE ARROWS REALTY SECURITIES 3,208,215 3,208,215 3,450,933 1.20%O'CONNOR NORTH AMERICAN PROPERTY PARTNERS 8,245,199 8,245,199 3,148,058 1.09%CIM 1,496,432 1,496,432 271,332 0.09%MTRP TOTAL 216,034,846 389,576,100 287,943,521 100.00%
REAL ESTATE POOL (MTRP) BY MANAGER
A-50

STATE OF MONTANA BOARD OF INVESTMENTS CONSOLIDATED UNIFIED INVESTMENT PROGRAM FINANICAL STATEMENT
SHORT TERM INVESTMENT POOL
Security Name Coupon Maturity Par Amortized Cost %APRECO LLC 0.250 07/01/09 10,000,000 10,000,000 0.43% BUNGE ASSET FDG. COR 1.200 07/14/09 15,000,000 14,993,500 0.65% CHARTA LLC 0.280 07/28/09 20,000,000 19,995,800 0.87% CIESCO LLC 0.280 07/24/09 20,000,000 19,996,422 0.87% CIESCO LLC 0.350 08/17/09 15,000,000 14,993,146 0.65% ENTERPRISE FDG CO LLC 0.300 07/08/09 21,002,000 21,000,775 0.91% FORRESTAL CERT FDG T 1.050 08/11/09 20,000,000 19,976,083 0.87% FORRESTAL CERT FDG T 1.050 08/17/09 20,000,000 19,972,583 0.87% GOLDEN FUNDING CORP 1.000 07/09/09 19,426,000 19,421,683 0.84% GOLDEN FUNDING CORP 1.000 07/15/09 10,000,000 9,996,111 0.43% GOTHAM FDG CORP 0.300 07/29/09 20,000,000 19,995,333 0.87% JUPITER SECT CO LLC 0.270 07/30/09 30,000,000 29,993,475 1.30% MARKET ST FNDG CORP 0.650 07/01/09 15,000,000 15,000,000 0.65% STRAIGHT A FDG LLC 0.270 07/13/09 15,000,000 14,998,650 0.65% VICTORY RECEIVABLES 0.280 07/02/09 15,000,000 14,999,883 0.65% VICTORY RECEIVABLES 0.290 07/10/09 15,000,000 14,998,913 0.65% YORKTOWN CAPITAL LL 0.330 08/03/09 19,000,000 18,994,253 0.83% Asset Backed Commercial Paper 17 Issues 299,428,000 299,326,610 13.01%
ORION FIN USA LLC N/A N/A 22,500,000 22,500,000 0.98% ORION FIN USA LLC N/A N/A 22,500,000 22,500,000 0.98% AXON FINL FDG LTD / LLC N/A N/A 30,772,873 30,772,873 1.34% AXON FINL FDG LTD / LLC N/A N/A 37,852,693 37,852,693 1.64% Structured Investment Vehicles 4 Issue(s) 113,625,566 113,625,566 4.94%
ALLIANCEBERNSTEIN 0.600 07/15/09 10,000,000 9,997,667 0.43% ALLIANCEBERNSTEIN 0.430 07/22/09 10,000,000 9,997,492 0.43% CALYON NORTH AMERICA I 0.250 07/02/09 15,000,000 14,999,896 0.65% DANSKE CORP. 0.300 07/27/09 25,000,000 24,994,583 1.09% LLOYDS BANK PLC 0.450 07/27/09 15,000,000 14,995,125 0.65%
MITSUBISHI INT'L CO 0.300 07/07/09 20,000,000 19,999,000 0.87% MITSUBISHI INT'L CO 0.330 07/17/09 15,000,000 14,997,800 0.65% SOCIETE GEN NO AMER 0.240 07/31/09 20,000,000 19,996,000 0.87% WAL-MART FUNDING COR 0.270 07/06/09 35,000,000 34,998,688 1.52% Corporate Commercial Paper 9 Issues 165,000,000 164,976,250 7.17%
BANK OF AMERICA 7.800 02/15/10 16,016,000 16,517,513 0.72% GENERAL ELEC CAP CORP 3.750 12/15/09 20,000,000 19,956,623 0.87% Corporate Fixed 2 Issues 36,016,000 36,474,136 1.58%
AMERICAN HONDA FIN CORP MTN 0.763 09/18/09 40,000,000 40,000,000 1.74% BB + T BRH BKG + TR CO GLOBAL 1.033 09/09/09 40,000,000 40,000,000 1.74% BEAR STEARNS CO INC 0.751 02/23/10 25,000,000 24,968,911 1.09% BEAR STEARNS COS INC MTN 0.903 09/09/09 20,000,000 19,995,514 0.87% CITIGROUP INC 0.631 12/28/09 25,000,000 24,531,110 1.07% CREDIT SUISSE FIRST BOSTON USA 1.371 01/15/10 16,862,000 16,521,851 0.72% CREDIT SUISSE USA INC 0.865 11/20/09 20,000,000 19,721,445 0.86% GENERAL ELEC CAP CORP 0.709 06/06/11 25,000,000 24,039,364 1.04% ING BK NV LONDON BRH 0.924 09/16/09 40,000,000 40,000,000 1.74% PROCTER + GAMBLE CO 0.663 09/09/09 45,000,000 44,986,290 1.95% TOYOTA MTR CR CORP MTN BK ENT 1.650 12/03/09 25,000,000 24,998,965 1.09%
WELLS FARGO + CO NEW 0.672 03/23/10 25,130,000 24,661,005 1.07% WELLS FARGO CO NEW 1.484 01/29/10 20,000,000 19,823,879 0.86%
A-51

STATE OF MONTANA BOARD OF INVESTMENTS CONSOLIDATED UNIFIED INVESTMENT PROGRAM FINANICAL STATEMENT
SHORT TERM INVESTMENT POOL
Security Name Coupon Maturity Par Amortized Cost %Corporate Variable Rate 13 Issues 366,992,000 364,248,333 15.83%
BARCLAYS BANK PLC 1.550 06/25/10 25,000,000 25,000,000 1.09% Certificates of Deposit Fixed 1 Issues 25,000,000 25,000,000 1.09%
ABBEY NAT'L TREASURY 1.270 08/13/09 40,000,000 40,000,000 1.74% CALYON NY BRANCH 1.053 12/20/10 25,000,000 25,000,000 1.09% RABOBANK NEDERLAND N Y 0.607 06/07/10 40,000,000 40,000,000 1.74% Certificates of Deposit Variable Rate 3 Issues 105,000,000 105,000,000 4.56%
FEDERAL HOME LN BK CONS DSC NT 0.180 07/15/09 25,000,000 24,998,250 1.09% FEDERAL HOME LN BK CONS DSC NT 2.920 08/10/09 25,000,000 24,918,889 1.08% FEDERAL HOME LOAN BANKS 3.875 02/12/10 15,900,000 16,184,148 0.70% FEDERAL HOME LN MTG DISC NTS 3.020 07/20/09 25,000,000 24,960,153 1.08% FEDERAL NATL MTG ASSN DISC NTS 2.950 10/01/09 25,000,000 24,811,528 1.08% FEDERAL NATL MTG ASSN DISC NTS 2.950 10/07/09 25,000,000 24,799,236 1.08% U. S. Government Agency Fixed Rate 6 Issues 140,900,000 140,672,204 6.11%
BANK OF AMERICA NA FDIC GTD 0.659 09/13/10 40,000,000 40,000,000 1.74% CITIGROUP FUNDING INC FDIC GTD 1.139 07/30/10 25,000,000 25,000,000 1.09% CITIGROUP FUNDING INC FDIC GTD 0.596 06/03/11 25,000,000 25,000,000 1.09% CITIGROUP FUNDING INC FDIC GTD 0.936 05/05/11 20,000,000 20,000,000 0.87% CITIGROUP FUNDING INC FDIC GTD 1.183 12/09/10 35,000,000 35,322,746 1.53% FANNIE MAE 0.800 05/13/11 75,000,000 75,000,000 3.26% FEDERAL HOME LOAN BANKS 1.166 11/05/09 40,000,000 40,000,000 1.74% FEDERAL HOME LOAN BANKS 0.839 01/13/10 50,000,000 50,000,000 2.17% FEDERAL HOME LN MTG CORP 0.580 09/24/10 25,000,000 24,993,852 1.09% FEDERAL HOME LN MTG CORP 1.089 01/28/11 25,000,000 25,000,000 1.09% FEDERAL HOME LOAN BANKS 0.404 12/17/09 25,000,000 24,959,968 1.08% FEDERAL HOME LOAN BANKS 0.635 11/19/10 50,000,000 49,986,150 2.17% FEDERAL HOME NTG CORP 1.039 07/12/10 50,000,000 50,000,000 2.17% FEDERAL NATL MTG ASSN 1.192 10/27/09 25,000,000 25,000,000 1.09%
FEDERAL NATL MTG ASSN 0.883 02/12/10 50,000,000 49,912,256 2.17% FREDDIE MAC 0.888 02/01/11 25,000,000 25,000,000 1.09% FREDDIE MAC 0.926 05/04/11 25,000,000 25,044,397 1.09% FREDDIE MAC 0.896 05/05/11 25,000,000 24,989,859 1.09% GENERAL ELEC CAP CORP FDIC GTD 1.207 07/08/10 25,000,000 25,000,000 1.09% GOLDMAN SACHS GROUP INC FDIC GTD 1.150 12/03/10 50,000,000 50,321,521 2.19% GOLDMAN SACHS GROUP INC FDIC GTD 0.709 03/15/11 25,000,000 25,000,000 1.09% JPMORGAN CHASE + CO FDIC GTD 0.741 02/23/11 8,000,000 8,000,000 0.35% UNION BANK NA FDIC GTD 0.704 03/16/11 7,000,000 7,000,000 0.30% U. S. Government Agency Variable Rate 23 Issues 750,000,000 750,530,748 32.61%
BGI INSTITUTIONAL MMF 0.360 N/A 10,000,000 10,000,000 0.43%
FIDELITY INSTL MONEY MARKET 0.740 N/A 110,000,000 110,000,000 4.78% STATE STREET BANK + TRUST CO 0.417 N/A 1,427,621 1,427,621 0.06% Money Market Funds (Unrated) 3 Issues 121,427,621 121,427,621 5.28%
BLACKROCK MONEY MARKET 0.451 N/A 80,000,000 80,000,000 3.48% STATE STR INSTL LIQUID RESERVES 0.398 N/A 100,000,000 100,000,000 4.35% Money Market Funds (Rated) 2 Issues 180,000,000 180,000,000 7.82%
STIP Total 83 Issue(s) 2,303,389,187 2,301,281,468 100.00%
A-52

STATE OF MONTANA BOARD OF INVESTMENTS CONSOLIDATED UNIFIED INVESTMENT PROGRAM FINANICAL STATEMENT
ALL OTHER FUNDS
Security Name Coupon Maturity Par Amortized Cost Fair Value %US BANK SWEEP REPO 0.250 07/01/09 15,845,774 15,845,774 15,845,774 1.11%
Cash Equivalents 15,845,774 15,845,774 15,845,774 1.11%
ARIA CDO II JERSEY NO 1 LTD 2.130 10/10/12 10,000,000 10,000,000 3,000,000 0.21%
Corporate Bonds (Unrated) 10,000,000 10,000,000 3,000,000 0.21%
AA / FT WORTH HQ FIN TR 5.500 10/05/10 2,770,542 2,770,542 2,740,814 0.19% AT+T INC 5.800 02/15/19 5,000,000 4,985,078 5,082,859 0.35% ABBOTT LABS 5.125 04/01/19 5,000,000 4,974,320 5,134,944 0.36% ALCOA INC 6.500 06/01/11 3,000,000 2,937,990 3,045,000 0.21% ALLSTATE LIFE GBL FDG SECD 5.375 04/30/13 5,000,000 4,996,169 5,141,636 0.36% ALTRIA GROUP INC 9.700 11/10/18 5,000,000 5,013,537 5,720,713 0.40% AMERICAN EXPRESS CO 5.500 09/12/16 5,000,000 4,981,677 4,574,654 0.32% AMERICAN EXPRESS CO 7.000 03/19/18 3,000,000 2,989,986 2,928,322 0.20% AMERICAN EXPRESS CR CORP 7.300 08/20/13 5,000,000 5,002,731 5,195,820 0.36% AMERICAN GEN FIN CORP MTN 4.875 05/15/10 5,000,000 4,999,878 4,208,187 0.29% AMERICAN GEN FIN CORP MTN 5.900 09/15/12 5,000,000 4,981,430 2,875,000 0.20% B J SERVICES 5.750 06/01/11 5,000,000 4,997,479 5,111,585 0.36% BANC AMER COML MTG INC COML 5.381 01/15/49 5,000,000 5,012,794 4,666,951 0.33% BANC AMER COML MTG TR 2007 2 5.634 04/10/49 5,000,000 5,014,236 4,644,935 0.32% BANC AMER COML MTG TR 5.837 06/10/49 5,000,000 4,999,031 4,666,170 0.33% BANC AMER COML MTG TR 5.546 02/10/51 5,000,000 5,014,668 4,612,338 0.32% BANC AMER COML MTG TR 5.434 12/10/12 10,000,000 10,038,002 9,084,145 0.63% BANK AMER CORP 5.375 06/15/14 5,000,000 4,977,319 4,752,828 0.33% BANK AMER CORP MEDIUM TERM 2.100 04/30/12 17,000,000 16,988,361 17,062,426 1.19% BANK OF AMERICA NA FDIC GTD 1.700 12/23/10 750,000 750,643 758,529 0.05% BUNGE NA FINANCE LP 5.900 04/01/17 5,000,000 4,995,595 4,583,907 0.32% BURLINGTON NORTHN SANTA FE RY 7.160 01/02/20 3,477,550 3,477,550 3,800,040 0.27% BURLINGTON NORTHN SANTA FE 7.000 02/01/14 3,000,000 2,999,547 3,260,950 0.23% CIT GROUP EQUIP FING INC 6.490 01/05/21 5,295,000 5,295,000 2,687,213 0.19% CSX CORP 5.750 03/15/13 5,000,000 4,991,309 5,031,156 0.35% CVS CAREMARK CORP 5.750 06/01/17 5,000,000 4,844,115 5,039,542 0.35% CAPITAL ONE FINL CORP 6.750 09/15/17 5,000,000 4,977,826 4,721,742 0.33% CATERPILLAR INC 7.000 12/15/13 2,000,000 1,999,574 2,211,778 0.15% CITIGROUP INC 6.000 02/21/12 5,000,000 4,999,511 4,896,484 0.34% CITIGROUP INC 5.500 08/27/12 5,000,000 5,006,816 4,808,529 0.34% COMCAST CORP NEW 5.450 11/15/10 5,000,000 5,002,922 5,196,293 0.36% COMM MTG TR 5.540 06/10/46 4,380,170 4,379,732 4,397,180 0.31% CONOCOPHILLIPS 5.750 02/01/19 5,000,000 4,996,144 5,253,790 0.37% CONOCOPHILLIPS CDA FDG CO I 5.625 10/15/16 6,000,000 5,999,650 6,254,498 0.44% CONTINENTAL AIRLS 6.563 08/15/13 5,000,000 5,007,417 4,518,750 0.32% CREDIT SUISSE NEW YORK 3.450 07/02/12 5,000,000 4,993,500 5,018,727 0.35% DETROIT EDISON CO 5.200 10/15/12 5,000,000 4,977,201 5,237,489 0.37% DONNELLEY R R + SONS 4.950 04/01/14 5,000,000 4,900,783 4,350,000 0.30% DU PONT E I DE NEMOURS + CO 5.875 01/15/14 7,000,000 6,970,718 7,582,330 0.53% ENTERGY ARK INC 4.500 06/01/10 3,000,000 2,997,564 2,970,751 0.21% FIFTH THIRD BANCORP 5.450 01/15/17 5,000,000 4,986,895 3,787,748 0.26% FORTUNE BRANDS INC 5.375 01/15/16 3,000,000 2,986,910 2,736,711 0.19%
A-53

STATE OF MONTANA BOARD OF INVESTMENTS CONSOLIDATED UNIFIED INVESTMENT PROGRAM FINANICAL STATEMENT
ALL OTHER FUNDS
Security Name Coupon Maturity Par Amortized Cost Fair Value %GATX CORP 8.750 05/15/14 5,000,000 4,998,788 5,250,000 0.37% GE COML MTG CORP TR 5.417 12/10/49 10,000,000 10,026,672 8,674,831 0.61% GALENA CDO I CAYMAN IS NO 1LTD 5.060 01/11/13 4,000,000 400,000 400,000 0.03% GENERAL ELEC CO 5.250 12/06/17 5,000,000 5,010,218 4,908,447 0.34% GENERAL ELEC CAP CORP 5.000 04/10/12 4,950,000 4,935,384 5,063,228 0.35% GENERAL ELEC CAP CORP 0.953 08/15/11 1,500,000 1,347,488 1,419,461 0.10% GENERAL ELEC CAP CORP 4.375 11/21/11 10,000,000 9,879,021 10,159,747 0.71% GENERAL ELEC CAP CORP FDIC GTD 3.000 12/09/11 5,000,000 4,988,323 5,155,539 0.36% GENWORTH FINL INC 5.650 06/15/12 5,000,000 4,993,508 4,000,000 0.28% GOLDMAN SACHS GROUP INC 5.350 01/15/16 5,000,000 4,962,487 4,885,760 0.34% GOLDMAN SACHS GROUP 5.300 02/14/12 4,750,000 4,747,932 4,929,829 0.34% HSBC FIN CORP 5.500 01/19/16 5,000,000 5,005,915 4,667,281 0.33% HSBC FIN CORP 5.900 06/19/12 5,000,000 4,992,643 5,038,071 0.35% HARTFORD FINL SVCS GROUP INC 5.375 03/15/17 5,000,000 4,989,656 3,950,000 0.28% HARTFORD FINL SVCS GROUP INC 6.300 03/15/18 5,000,000 5,004,603 4,000,000 0.28% HERSHEY FOODS CORP 5.300 09/01/11 1,000,000 999,152 1,059,336 0.07% ING SEC LIFE INSTL FDG 4.250 01/15/10 3,000,000 2,999,289 2,932,206 0.20% INTERNATIONAL LEASE FIN CORP 5.125 11/01/10 5,000,000 4,994,722 4,600,000 0.32% INTL LEASE FIN CORP MTN 4.550 10/15/09 5,000,000 5,007,584 4,800,000 0.34% JPMORGAN CHASE + CO 4.750 05/01/13 5,000,000 4,987,868 5,068,098 0.35% J P MORGAN CHASE COML MTG SECS 4.200 07/12/35 8,432,930 8,466,593 8,406,714 0.59% J P MORGAN CHASE COML MTG 3.053 01/15/38 357,408 350,670 355,340 0.02% JP MORGAN CHASE 5.279 12/12/43 3,555,924 3,557,897 3,595,474 0.25% JERSEY CENT PWR + LT CO 5.650 06/01/17 3,000,000 2,991,712 2,930,002 0.20% JPMORGAN CHASE+CO FDIC GTD TLG 3.125 12/01/11 1,255,000 1,290,507 1,298,319 0.09% JPMORGAN CHASE+CO FDIC GTD TLG 2.625 12/01/10 750,000 760,937 768,043 0.05% JPMORGAN CHASE + CO FDIC 1.650 02/23/11 2,000,000 1,999,357 2,018,037 0.14% JPMORGAN CHASE + CO FDIC 2.200 06/15/12 7,000,000 6,996,120 7,040,265 0.49% KCT INTERMODAL TRANSN CORP 6.884 08/01/18 2,784,533 2,784,533 2,914,977 0.20% KEYBANK NATL ASSN CLEVELAND OH 5.500 09/17/12 5,000,000 4,999,552 4,950,000 0.35% KEYBANK NATL ASSN MTN 5.450 03/03/16 5,000,000 4,999,199 4,286,436 0.30% KRAFT FOODS INC 5.625 11/01/11 5,000,000 5,206,164 5,285,435 0.37% LEHMAN BROTHERS HLDGS INC 5.500 05/25/10 5,000,000 1,000,000 737,500 0.05% LEHMAN BROTHERS HLDGS INC 5.000 01/14/11 5,000,000 977,700 737,500 0.05% LILLY ELI + CO 3.550 03/06/12 1,000,000 999,089 1,029,217 0.07% LILLY ELI + CO 4.200 03/06/14 2,000,000 1,999,158 2,054,765 0.14% LOCKHEED MARTIN CORP 4.121 03/14/13 2,000,000 1,974,962 2,024,736 0.14% MARATHON OIL CORP 5.900 03/15/18 5,000,000 4,985,712 4,957,950 0.35% MASSMUTUAL GLOBAL FUNDING 3.625 07/16/12 2,000,000 1,998,440 2,001,010 0.14% MCKESSON CORP NEW 5.250 03/01/13 3,000,000 2,992,289 3,008,819 0.21% MERCK + CO INC 5.000 06/30/19 2,000,000 1,987,401 2,030,802 0.14% MERRILL LYNCH + CO INC 6.400 08/28/17 5,000,000 4,994,045 4,505,895 0.31% METLIFE INC 5.000 11/24/13 5,000,000 4,978,862 4,901,580 0.34% ML CFC COML MTG TR 5.590 09/12/49 10,000,000 10,035,678 8,703,500 0.61% MORGAN STANLEY 4.000 01/15/10 5,000,000 4,995,652 5,032,467 0.35% MORGAN STANLEY 5.050 01/21/11 4,750,000 4,746,209 4,851,818 0.34% MORGAN STANLEY FDIC GTD TLGP 2.900 12/01/10 500,000 509,460 513,971 0.04% NATNL CITY BK CLEVELAND OH 5.250 12/15/16 5,000,000 4,996,535 4,491,776 0.31%
A-54
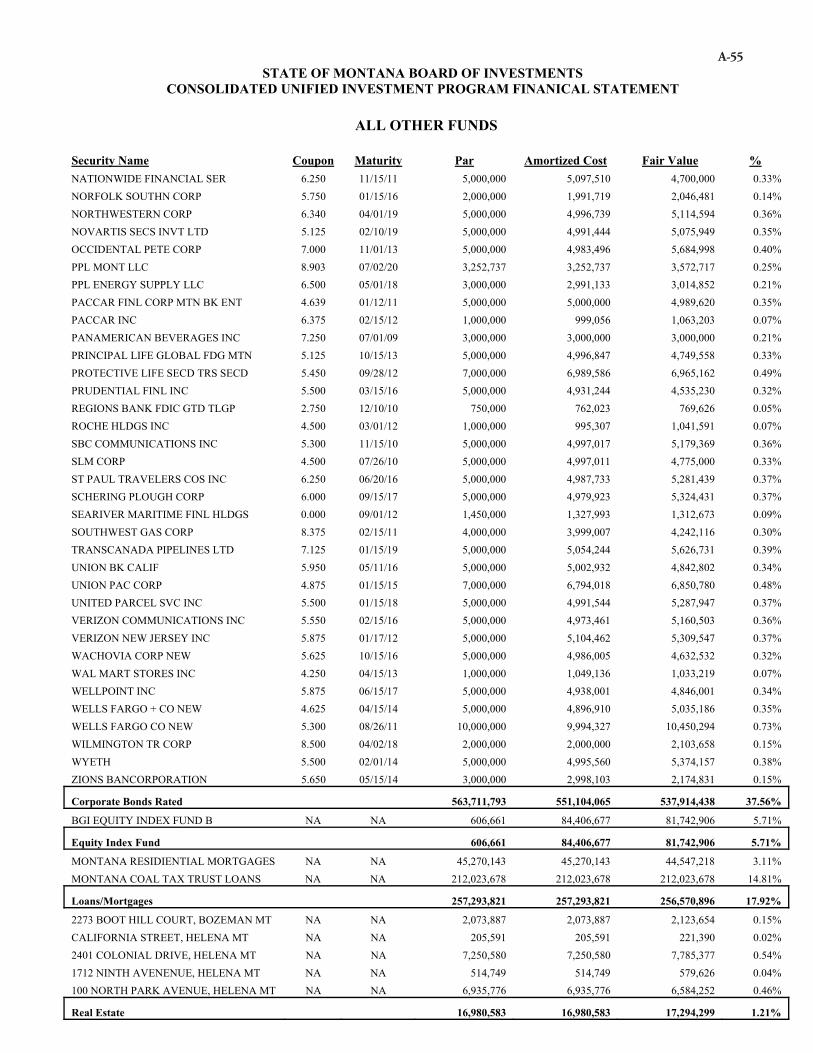
STATE OF MONTANA BOARD OF INVESTMENTS CONSOLIDATED UNIFIED INVESTMENT PROGRAM FINANICAL STATEMENT
ALL OTHER FUNDS
Security Name Coupon Maturity Par Amortized Cost Fair Value %NATIONWIDE FINANCIAL SER 6.250 11/15/11 5,000,000 5,097,510 4,700,000 0.33% NORFOLK SOUTHN CORP 5.750 01/15/16 2,000,000 1,991,719 2,046,481 0.14% NORTHWESTERN CORP 6.340 04/01/19 5,000,000 4,996,739 5,114,594 0.36% NOVARTIS SECS INVT LTD 5.125 02/10/19 5,000,000 4,991,444 5,075,949 0.35% OCCIDENTAL PETE CORP 7.000 11/01/13 5,000,000 4,983,496 5,684,998 0.40% PPL MONT LLC 8.903 07/02/20 3,252,737 3,252,737 3,572,717 0.25% PPL ENERGY SUPPLY LLC 6.500 05/01/18 3,000,000 2,991,133 3,014,852 0.21% PACCAR FINL CORP MTN BK ENT 4.639 01/12/11 5,000,000 5,000,000 4,989,620 0.35% PACCAR INC 6.375 02/15/12 1,000,000 999,056 1,063,203 0.07% PANAMERICAN BEVERAGES INC 7.250 07/01/09 3,000,000 3,000,000 3,000,000 0.21% PRINCIPAL LIFE GLOBAL FDG MTN 5.125 10/15/13 5,000,000 4,996,847 4,749,558 0.33% PROTECTIVE LIFE SECD TRS SECD 5.450 09/28/12 7,000,000 6,989,586 6,965,162 0.49% PRUDENTIAL FINL INC 5.500 03/15/16 5,000,000 4,931,244 4,535,230 0.32% REGIONS BANK FDIC GTD TLGP 2.750 12/10/10 750,000 762,023 769,626 0.05% ROCHE HLDGS INC 4.500 03/01/12 1,000,000 995,307 1,041,591 0.07% SBC COMMUNICATIONS INC 5.300 11/15/10 5,000,000 4,997,017 5,179,369 0.36% SLM CORP 4.500 07/26/10 5,000,000 4,997,011 4,775,000 0.33% ST PAUL TRAVELERS COS INC 6.250 06/20/16 5,000,000 4,987,733 5,281,439 0.37% SCHERING PLOUGH CORP 6.000 09/15/17 5,000,000 4,979,923 5,324,431 0.37% SEARIVER MARITIME FINL HLDGS 0.000 09/01/12 1,450,000 1,327,993 1,312,673 0.09% SOUTHWEST GAS CORP 8.375 02/15/11 4,000,000 3,999,007 4,242,116 0.30% TRANSCANADA PIPELINES LTD 7.125 01/15/19 5,000,000 5,054,244 5,626,731 0.39% UNION BK CALIF 5.950 05/11/16 5,000,000 5,002,932 4,842,802 0.34% UNION PAC CORP 4.875 01/15/15 7,000,000 6,794,018 6,850,780 0.48% UNITED PARCEL SVC INC 5.500 01/15/18 5,000,000 4,991,544 5,287,947 0.37% VERIZON COMMUNICATIONS INC 5.550 02/15/16 5,000,000 4,973,461 5,160,503 0.36% VERIZON NEW JERSEY INC 5.875 01/17/12 5,000,000 5,104,462 5,309,547 0.37% WACHOVIA CORP NEW 5.625 10/15/16 5,000,000 4,986,005 4,632,532 0.32% WAL MART STORES INC 4.250 04/15/13 1,000,000 1,049,136 1,033,219 0.07% WELLPOINT INC 5.875 06/15/17 5,000,000 4,938,001 4,846,001 0.34% WELLS FARGO + CO NEW 4.625 04/15/14 5,000,000 4,896,910 5,035,186 0.35% WELLS FARGO CO NEW 5.300 08/26/11 10,000,000 9,994,327 10,450,294 0.73% WILMINGTON TR CORP 8.500 04/02/18 2,000,000 2,000,000 2,103,658 0.15% WYETH 5.500 02/01/14 5,000,000 4,995,560 5,374,157 0.38% ZIONS BANCORPORATION 5.650 05/15/14 3,000,000 2,998,103 2,174,831 0.15%
Corporate Bonds Rated 563,711,793 551,104,065 537,914,438 37.56%
BGI EQUITY INDEX FUND B NA NA 606,661 84,406,677 81,742,906 5.71%
Equity Index Fund 606,661 84,406,677 81,742,906 5.71%
MONTANA RESIDIENTIAL MORTGAGES NA NA 45,270,143 45,270,143 44,547,218 3.11% MONTANA COAL TAX TRUST LOANS NA NA 212,023,678 212,023,678 212,023,678 14.81%
Loans/Mortgages 257,293,821 257,293,821 256,570,896 17.92%
2273 BOOT HILL COURT, BOZEMAN MT NA NA 2,073,887 2,073,887 2,123,654 0.15% CALIFORNIA STREET, HELENA MT NA NA 205,591 205,591 221,390 0.02% 2401 COLONIAL DRIVE, HELENA MT NA NA 7,250,580 7,250,580 7,785,377 0.54% 1712 NINTH AVENENUE, HELENA MT NA NA 514,749 514,749 579,626 0.04% 100 NORTH PARK AVENUE, HELENA MT NA NA 6,935,776 6,935,776 6,584,252 0.46%
Real Estate 16,980,583 16,980,583 17,294,299 1.21%
A-55

STATE OF MONTANA BOARD OF INVESTMENTS CONSOLIDATED UNIFIED INVESTMENT PROGRAM FINANICAL STATEMENT
ALL OTHER FUNDS
Security Name Coupon Maturity Par Amortized Cost Fair Value %FED HM LN PC POOL G10814 5.500 05/01/13 666,288 666,095 700,786 0.05% FED HM LN PC POOL G12310 5.500 08/01/21 5,251,330 5,255,923 5,487,650 0.38% FED HM LN PC POOL G13081 5.000 04/01/23 7,620,895 7,620,895 7,886,662 0.55% FED HM LN PC POOL G18244 4.500 02/01/23 7,503,598 7,369,194 7,671,184 0.54% FED HM LN PC POOL J08160 5.000 12/01/22 7,950,076 7,940,628 8,232,552 0.57% FEDERAL HOME LN MTG CORP 5.050 01/26/15 10,000,000 9,982,275 10,751,311 0.75% FREDDIE MAC 2.500 04/08/13 5,000,000 5,000,000 4,960,619 0.35% FED HM LN PC POOL E00540 6.000 03/01/13 407,706 407,223 432,340 0.03% FED HM LN PC POOL E00659 6.000 04/01/14 511,429 511,255 542,898 0.04% FEDERAL FARM CR BKS 2.125 06/18/12 2,000,000 2,000,178 2,011,283 0.14% FEDERAL FARM CR BKS 4.450 09/23/13 7,000,000 6,858,802 7,484,935 0.52% FEDERAL FARM CR BKS CONS SYSTE 4.000 09/24/10 2,000,000 2,004,727 2,082,111 0.15% EDERAL FARM CR BKS 5.100 04/12/17 20,000,000 19,780,738 21,774,586 1.52% FEDERAL FARM CREDIT BANK 3.400 02/07/13 19,000,000 19,000,000 19,524,978 1.36% FEDERAL FARM CREDIT BANK 4.950 03/12/18 5,000,000 4,995,651 5,015,322 0.35% FEDERAL HOME LN BKS 4.125 08/13/10 10,000,000 9,997,990 10,377,494 0.72% FEDERAL HOME LN BKS 4.750 09/11/15 10,000,000 9,808,804 10,450,588 0.73% FEDERAL HOME LOAN BANK 4.875 11/18/11 1,900,000 1,898,114 2,047,779 0.14% FEDERAL HOME LN BANKS 4.750 12/16/16 15,000,000 14,888,608 16,055,595 1.12% FEDERAL HOME LN BKS 5.125 03/10/17 10,000,000 10,074,026 10,611,026 0.74% FEDERAL HOME LOAN BKS 4.875 06/08/12 4,900,000 4,873,383 5,226,095 0.36% FEDERAL HOME LN BK 4.500 10/09/09 1,500,000 1,502,987 1,517,355 0.11% FEDERAL HOME LOAN BANK 4.875 10/30/17 4,000,000 4,243,782 4,177,669 0.29% FEDERAL HOME LOAN BANK 3.000 12/10/10 7,000,000 6,981,575 7,195,113 0.50% FEDERAL HOME LN BKS 3.125 06/10/11 5,000,000 4,913,842 5,169,626 0.36% FEDERAL HOME LN BKS 3.500 07/16/10 5,000,000 5,030,102 5,146,255 0.36% FEDERAL HOME LN BKS 3.625 09/16/11 10,000,000 9,987,841 10,474,477 0.73% FEDERAL HOME LN BKS 3.000 12/30/13 10,000,000 10,000,000 9,809,752 0.68% FEDERAL HOME LN BKS 2.500 02/19/13 5,000,000 5,000,000 5,024,840 0.35% FEDERAL HOME LN BKS 3.000 03/04/13 2,935,000 2,935,000 2,943,716 0.21% FEDERAL HOME LN MTG CORP 5.625 03/15/11 10,000,000 10,015,851 10,748,772 0.75% FEDERAL HOME LN MTG CORP 6.000 06/15/11 15,000,000 14,997,401 16,359,894 1.14% FEDERAL NATL MTG ASSN DEB STRP 0.000 11/15/11 1,000,000 950,760 953,015 0.07% FEDERAL NATL MTG ASSN DEB STRP 0.000 11/15/12 271,000 247,398 243,204 0.02% FEDERAL NATL MTG ASSN DEB STRP 0.000 11/15/13 1,000,000 892,694 866,824 0.06% FEDERAL NATL MTG ASSN 5.550 02/16/17 20,000,000 20,032,899 20,461,130 1.43% FEDERAL NATL MTG ASSN 5.000 04/26/17 5,000,000 4,882,709 5,075,202 0.35% FEDERAL NATL MTG ASSN 0.000 06/01/17 14,600,000 8,901,856 10,386,631 0.73% FEDERAL NATL MTG ASSN 6.625 11/15/10 10,000,000 10,059,752 10,795,011 0.75% FEDERAL NATL MTG ASSN 4.375 07/17/13 20,000,000 19,682,400 21,207,502 1.48% FEDERAL NATL MTG ASSN 4.125 04/15/14 10,000,000 9,690,357 10,586,065 0.74% FEDERAL NATL MTG ASSN 4.625 10/15/14 10,000,000 10,079,835 10,800,063 0.75% FEDERAL NATL MTG ASSN 4.250 08/15/10 5,000,000 5,074,276 5,196,483 0.36% FEDERAL HOME LN MTG CORP 0.000 01/15/13 1,000,000 927,454 889,688 0.06% FEDERAL NATL MTG ASSN DEB 0.000 07/15/14 1,000,000 873,100 835,249 0.06% FNMA POOL 190985 7.500 08/01/09 4,895 4,895 4,963 0.00% FNMA POOL 254140 5.500 01/01/17 3,486,707 3,478,541 3,671,670 0.26% FNMA POOL 254233 5.000 03/01/17 2,905,536 2,851,078 3,030,808 0.21%
A-56
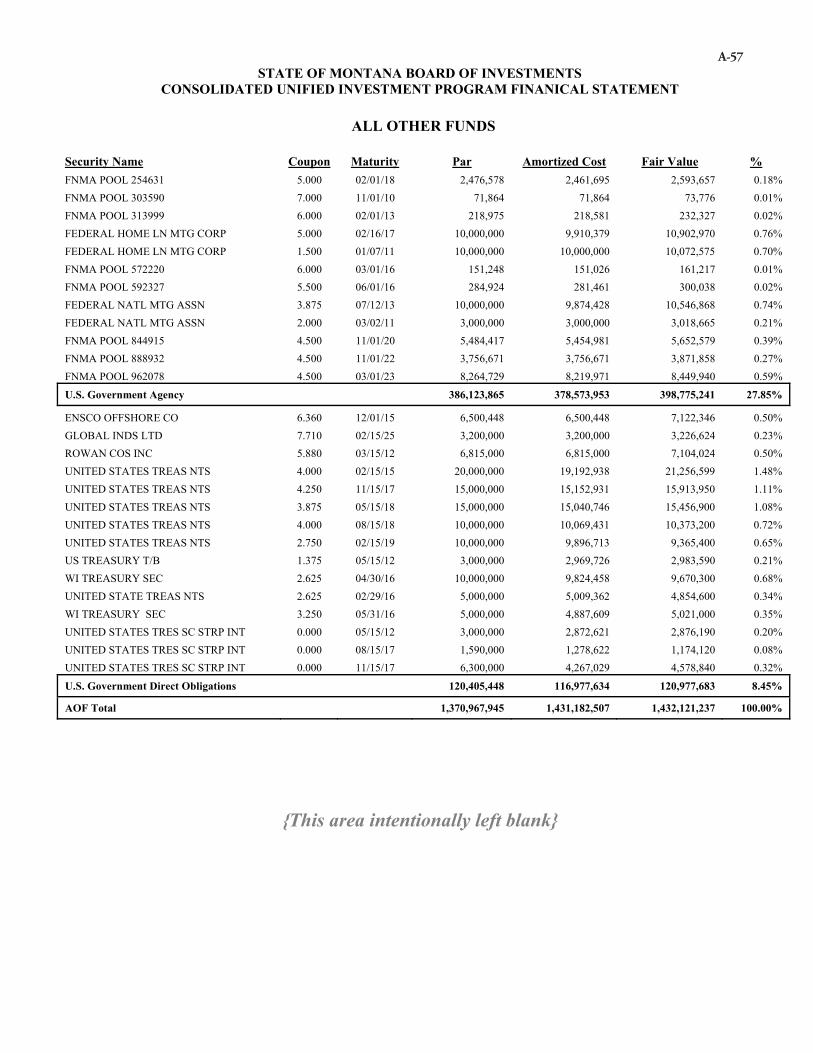
STATE OF MONTANA BOARD OF INVESTMENTS CONSOLIDATED UNIFIED INVESTMENT PROGRAM FINANICAL STATEMENT
ALL OTHER FUNDS
Security Name Coupon Maturity Par Amortized Cost Fair Value %FNMA POOL 254631 5.000 02/01/18 2,476,578 2,461,695 2,593,657 0.18% FNMA POOL 303590 7.000 11/01/10 71,864 71,864 73,776 0.01% FNMA POOL 313999 6.000 02/01/13 218,975 218,581 232,327 0.02% FEDERAL HOME LN MTG CORP 5.000 02/16/17 10,000,000 9,910,379 10,902,970 0.76% FEDERAL HOME LN MTG CORP 1.500 01/07/11 10,000,000 10,000,000 10,072,575 0.70% FNMA POOL 572220 6.000 03/01/16 151,248 151,026 161,217 0.01% FNMA POOL 592327 5.500 06/01/16 284,924 281,461 300,038 0.02% FEDERAL NATL MTG ASSN 3.875 07/12/13 10,000,000 9,874,428 10,546,868 0.74% FEDERAL NATL MTG ASSN 2.000 03/02/11 3,000,000 3,000,000 3,018,665 0.21% FNMA POOL 844915 4.500 11/01/20 5,484,417 5,454,981 5,652,579 0.39% FNMA POOL 888932 4.500 11/01/22 3,756,671 3,756,671 3,871,858 0.27% FNMA POOL 962078 4.500 03/01/23 8,264,729 8,219,971 8,449,940 0.59%
U.S. Government Agency 386,123,865 378,573,953 398,775,241 27.85%
ENSCO OFFSHORE CO 6.360 12/01/15 6,500,448 6,500,448 7,122,346 0.50% GLOBAL INDS LTD 7.710 02/15/25 3,200,000 3,200,000 3,226,624 0.23% ROWAN COS INC 5.880 03/15/12 6,815,000 6,815,000 7,104,024 0.50% UNITED STATES TREAS NTS 4.000 02/15/15 20,000,000 19,192,938 21,256,599 1.48% UNITED STATES TREAS NTS 4.250 11/15/17 15,000,000 15,152,931 15,913,950 1.11% UNITED STATES TREAS NTS 3.875 05/15/18 15,000,000 15,040,746 15,456,900 1.08% UNITED STATES TREAS NTS 4.000 08/15/18 10,000,000 10,069,431 10,373,200 0.72% UNITED STATES TREAS NTS 2.750 02/15/19 10,000,000 9,896,713 9,365,400 0.65% US TREASURY T/B 1.375 05/15/12 3,000,000 2,969,726 2,983,590 0.21% WI TREASURY SEC 2.625 04/30/16 10,000,000 9,824,458 9,670,300 0.68% UNITED STATE TREAS NTS 2.625 02/29/16 5,000,000 5,009,362 4,854,600 0.34% WI TREASURY SEC 3.250 05/31/16 5,000,000 4,887,609 5,021,000 0.35% UNITED STATES TRES SC STRP INT 0.000 05/15/12 3,000,000 2,872,621 2,876,190 0.20% UNITED STATES TRES SC STRP INT 0.000 08/15/17 1,590,000 1,278,622 1,174,120 0.08% UNITED STATES TRES SC STRP INT 0.000 11/15/17 6,300,000 4,267,029 4,578,840 0.32%
U.S. Government Direct Obligations 120,405,448 116,977,634 120,977,683 8.45%
AOF Total 1,370,967,945 1,431,182,507 1,432,121,237 100.00%
{This area intentionally left blank}
A-57

A-58

A-59
Room 160 • State Capitol Building • P.O. Box 201705 • Helena, MT • 59620-1705Phone (406) 444-3122 • FAX (406) 444-9784 • E-Mail [email protected]
LEGISLATIVE AUDIT DIVISION Tori Hunthausen, Legislative Auditor Deputy Legislative AuditorsMonica Huyg, Legal Counsel James Gillett Angie Grove
Independent Auditor’s Report
The Legislative Audit Committeeof the Montana State Legislature:
We have audited the accompanying Statement of Net Assets of the Enterprise Fund of the Montana Board of Investments as of June 30, 2009, and 2008, and the related Statement of Revenues, Expenses and Changes in Fund Net Assets, and Statement of Cash Flows for each of the fiscal years then ended. The information contained in these financial statements is the responsibility of the Board's management. Our responsibility is to express an opinion on these financial statements based on our audit.
We conducted our audit in accordance with auditing standards generally accepted in the United States of America. Those standards require that we plan and perform the audit to obtain reasonable assurance about whether the financial statements are free of material misstatement. An audit includes examining, on a test basis, evidence supporting the amounts and disclosures in the financial statements. An audit also includes assessing the accounting principles used and significant estimates made by management, as well as evaluating the overall financial statement presentation. We believe that our audit provides a reasonable basis for our opinion.
In our opinion, the financial statements referred to above present fairly, in all material respects, the financial position of the Enterprise Fund of the Montana Board of Investments as of June 30, 2009, and 2008, and its changes in net assets and cash flows for each of the fiscal years then ended, in conformity with accounting principles generally accepted in the United States of America.
Respectfully submitted,
/s/ James Gillett
James Gillett, CPADeputy Legislative Auditor
October 27, 2009

A-60

Assets2009 2008
Current assets: Cash and cash equivalents (Note 1) $ 9,450,048 $ 9,230,138 Interest receivable 612,231 878,280 Notes/loans receivable (Note 1) 7,305,015 9,779,321 Interfund notes/loans and interest receivable (Note 1) 3,914,397 4,133,105 Component Unit notes/loans and interest receivable (Note 1) 1,902,780 1,856,884 Short-term investments at fair value (Notes 1 and 2) 1,735,074 9,907,678 Security lending cash collateral (Note 3) 7,985 1,370
Total current assets 24,927,530 35,786,776
Noncurrent assets: Restricted investments at fair value (Notes 1 and 2) 3,065,218 3,920,255 Long-term investments at fair value (Notes 1 and 2) 10,124 2,914 Notes/loans receivable (Note 1) 35,021,551 34,841,007 Interfund notes/loans and interest receivable (Note 1) 24,102,946 21,577,526 Component Unit notes/loans receivable (Note 1) 7,548,335 8,260,506 Capitalized cost of issue (Note 1) 1,315,245 1,419,379 Equipment 6,090 6,090 Accumulated depreciation (3,758) (2,977)
Total noncurrent assets 71,065,751 70,024,700
Total assets $ 95,993,281 $ 105,811,476
LiabilitiesCurrent liabilities: Due to other funds 1,926 2,434 Accrued expenses 12,090 13,873 Accrued interest payable 689,258 1,146,090 Security lending obligations (Note 3) 7,985 1,370 Arbitrage rebate tax payable 19,454 25,370 Compensated absences 12,424 12,385 Current bonds/notes payable (Note 4) 88,956,456 98,462,463
Total current liabilities 89,699,593 99,663,985Noncurrent liabilities Bonds/notes payable (Note 4 ) 843,694 1,435,903 Compensated absences 14,902 40,684 Arbitrage rebate tax payable 14,426 OPEB implicit rate subsidy (Note 10) 29,408 14,910
Total noncurrent liabilities 888,004 1,505,923
Total liabilities $ 90,587,597 $ 101,169,908
Net Assets Invested in capital assets, net of related debt $ 2,332 $ 3,113 Restricted (Note 1) 1,936,397 3,132,940 Unrestricted 3,466,955 1,505,515Total net assets (Note 7) $ 5,405,684 $ 4,641,568
Total liabilities and net assets $ 95,993,281 $ 105,811,476
STATE OF MONTANA BOARD OF INVESTMENTS ENTERPRISE FUNDSTATEMENT OF NET ASSETS AS OF JUNE 30, 2009 AND 2008
The accompanying notes are an integral part of these financial statements.
A-61

Operating revenue 2009 2008
Reimbursements $ 25,927 $ 33,321Investment income 403,540 1,043,973Security lending income 559 321Financing income 3,132,033 3,425,902
Total operating revenue 3,562,059 4,503,517
Operating expenses
Personal services 195,598 297,247Contracted services 18,611 32,163Supplies and materials 3,296 5,419Communications 12,793 6,830Travel 3,257 2,132Rent 43,916 42,893Repair and maintenance 315 300Indirect and other costs 36,778 44,603OPEB (Note 10) 14,498 14,910Depreciation expense 781 47Arbitrage rebate tax expense (Note 9) (20,343) 23,580Security lending expense 188 251Debt service Interest expense 2,855,503 3,729,900 Trustee fee expense 66,055 66,473 Bond issuance cost amortization expense 104,134 106,752 Other debt service expense 187,563 179,280
Total operating expenses 3,522,943 4,552,780
Operating income (loss) 39,116 (49,263)
Nonoperating income:Transfers from other funds (Note 8) 725,000 0
Change in net assets 764,116 (49,263)Beginning net assets 4,641,568 4,690,831Ending net assets (Note 7) $ 5,405,684 $ 4,641,568
The accompanying notes are an integral part of these financial statements.
STATE OF MONTANA BOARD OF INVESTMENTS ENTERPRISE FUNDSTATEMENT OF REVENUES, EXPENSES, AND CHANGES IN FUND NET ASSETS
FOR THE FISCAL YEARS ENDED JUNE 30, 2009 AND 2008
A-62

2009 2008Cash flows from operating activities: Receipts for sales and services $ 25,927 $ 33,321 Payments to suppliers for goods and services (117,651) (142,063) Payments to employees (222,986) (296,865)
Net cash (used for) operating activities (314,710) (405,607)
Cash flows from non-capital financing activities: Payment of principal and interest on bonds and notes (13,664,170) (5,840,364) Proceeds from issuance of bonds and notes 0 429,549 Transfers from other funds (Note 8) 725,000 0
Net cash provided by (used for) non-capital financing activities (12,939,170) (5,410,815)
Cash flows from capital and related financing activities: Acquisition of fixed assets 0 (3,100)
Net cash (used for) capital and related financing activities 0 (3,100)
Cash flows from investing activities: Collections for principal and interest on loans 26,933,904 23,480,099 Cash payments for loans (22,949,550) (30,025,737) Purchase of investments (816,761) (10,043,998) Proceeds from security lending 559 321 Security lending costs (188) (251) Proceeds from sales or maturities of investments 9,835,095 1,076,000 Interest on investments 470,731 893,515 (Payment for) refund from arbitrage rebate tax 0 (43,105)
Net cash provided by (used for) investing activities 13,473,790 (14,663,156)
Net increase (decrease) in cash and cash equivalents 219,910 (20,482,678) Cash and cash equivalents, July 1 9,230,138 29,712,816 Cash and cash equivalents, June 30 9,450,048 9,230,138
Reconciliation of net income to net cash (used for) operating activities: Net operating (loss) income 39,116 (49,263) Adjustments to reconcile net income to net cash (used for) operating activities Depreciation 781 47 Interest on investments (403,540) (1,043,973) Financing income (3,132,033) (3,425,902) Interest expense 3,213,257 4,082,405 Security lending income (559) (321) Security lending expense 188 251 Arbitrage rebate tax expense (Note 9) (20,343) 23,580 Change in assets and liabilities: (Increase) decrease in other assets 1,959 (4,995) Increase (decrease) in other payables (1,783) (7,358) Increase (decrease) in due to other funds (508) (2,846) Increase (decrease) in compensated absences payable (25,743) 7,858 Increase (decrease) in OPEB payables (Note 10) 14,498 14,910
Total adjustments (353,826) (356,344)
Net cash (used for) operating activities $ (314,710) $ (405,607)
Schedule of noncash transactions:Increase/(decrease) in fair value of investments $ 21,613 $ (147,098)Total noncash transactions $ 21,613 $ (147,098)
The accompanying notes are an integral part of these financial statements.
STATE OF MONTANA BOARD OF INVESTMENTS ENTERPRISE FUNDSTATEMENT OF CASH FLOWS FOR THE YEARS ENDED JUNE 30, 2009 AND 2008
A-63

STATE OF MONTANA BOARD OF INVESTMENTS ENTERPRISE FUND
NOTES TO FINANCIAL STATEMENTS FOR THE FISCAL YEARS ENDED JUNE 30, 2009 AND JUNE 30, 2008
1. SUMMARY OF SIGNIFICANT ACCOUNTING POLICIES
a. Basis of Accounting
The Board uses the accrual basis of accounting for the Enterprise Fund. Under the accrual basis of accounting, expenses are recorded when incurred and revenues are recorded when earned. The financial statements are prepared from the Statewide Accounting, Budgeting, and Human Resource System (SABHRS) and information contained in the bond trustee statements. The statements include the financial activity administered by the Board in the Enterprise Fund.
b. Presentation of Programs
The Board uses the Enterprise Fund to account for its programs created under the Economic Development Bond Act and the Municipal Finance Consolidation Act.
Economic Development Bond Act programs include:
The Stand Alone Economic Development Bond Program provides access to limited economic development projects through the issuance of conduit debt.
The Conservation Reserve Enhancement Program (CRP), created in 1990 by issuing bonds, allows farmers to receive a lump sum payment by assigning their federal CRP contract to the Board. The farmers under contract must comply with seeding and other requirements. The Conservation Reserve Enhancement Program is currently funded by the Montana Trust Funds Bond Pool.
Municipal Finance Consolidation Act programs include:
The INTERCAP loan program provides funds to eligible Montana governments to finance capital expenditures for up to fifteen years.
The Irrigation District Pooled Loan Program provided funds for the Board to purchase the refunding bonds from participating irrigation districts for the purpose of prepaying the U.S. Department of Interior, Bureau of Reclamation Projects Loans.
c. Fixed Asset Depreciation
The equipment fixed assets recorded in the Enterprise Fund are depreciated on a straight-line basis value, in accordance with state policy.
d. Receivables
The Enterprise Fund notes/loans receivables of $79,435,279 as of June 30, 2009 and $80,024,100 as of June 30, 2008, represent loans made to Montana businesses, state and local governments. The Enterprise Fund notes/loans are classified in three categories as follows:
1) Notes/loans receivable from local governments and Montana businesses 2) Interfund notes/loans receivable from state agency governments 3) Component Unit notes/loans receivable from certain state agencies and university units for which the State is
financially accountable.
The InterFund notes/loans receivable as of June 30, 2009 and 2008 includes $356,710 and $419,254, respectively, in interest accruals from state agencies and university units.
e. Capitalized Cost of Issue
The Enterprise Fund capitalized cost of issue asset of $1,315,245 and $1,419,379 as of June 30, 2009 and June 30, 2008, respectively, represents paid bond issuance costs which have been capitalized and are being amortized, using the straight-line method over the life of the bonds.
A-64
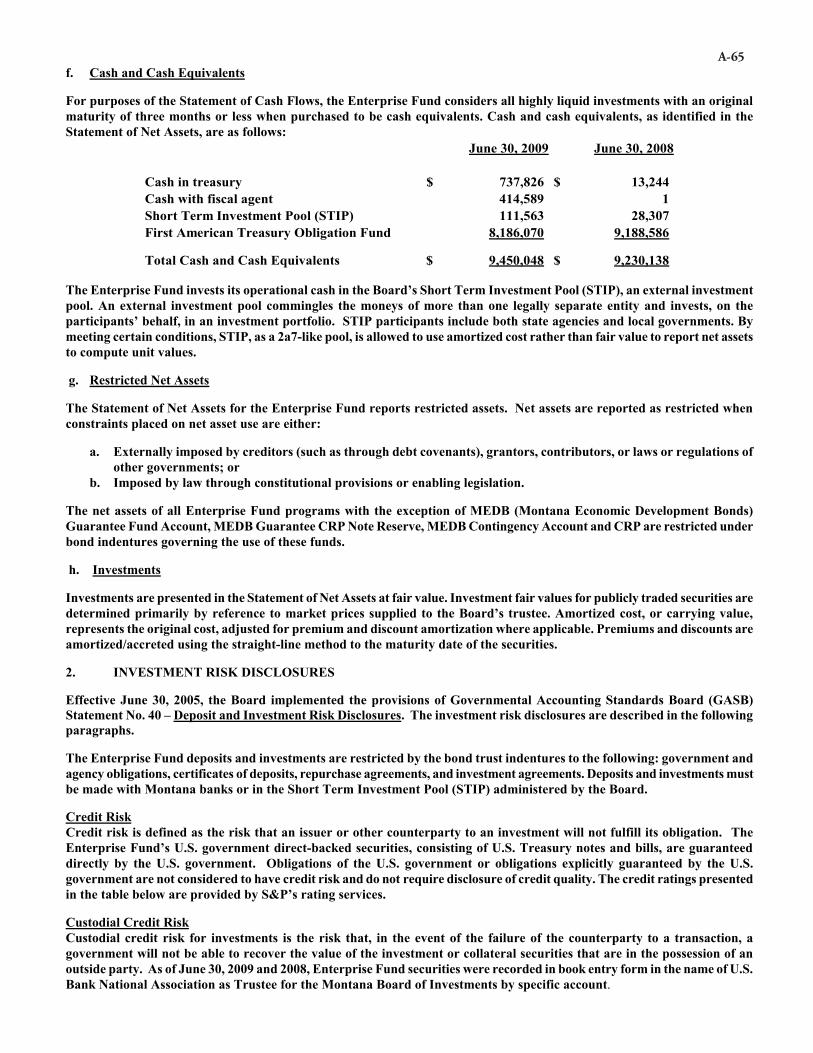
f. Cash and Cash Equivalents
For purposes of the Statement of Cash Flows, the Enterprise Fund considers all highly liquid investments with an original maturity of three months or less when purchased to be cash equivalents. Cash and cash equivalents, as identified in the Statement of Net Assets, are as follows:
June 30, 2009 June 30, 2008
Cash in treasury $ 737,826 $ 13,244Cash with fiscal agent 414,589 1Short Term Investment Pool (STIP) 111,563 28,307First American Treasury Obligation Fund 8,186,070 9,188,586
Total Cash and Cash Equivalents $ 9,450,048 $ 9,230,138
The Enterprise Fund invests its operational cash in the Board’s Short Term Investment Pool (STIP), an external investment pool. An external investment pool commingles the moneys of more than one legally separate entity and invests, on the participants’ behalf, in an investment portfolio. STIP participants include both state agencies and local governments. By meeting certain conditions, STIP, as a 2a7-like pool, is allowed to use amortized cost rather than fair value to report net assetsto compute unit values.
g. Restricted Net Assets
The Statement of Net Assets for the Enterprise Fund reports restricted assets. Net assets are reported as restricted when constraints placed on net asset use are either:
a. Externally imposed by creditors (such as through debt covenants), grantors, contributors, or laws or regulations of other governments; or
b. Imposed by law through constitutional provisions or enabling legislation.
The net assets of all Enterprise Fund programs with the exception of MEDB (Montana Economic Development Bonds) Guarantee Fund Account, MEDB Guarantee CRP Note Reserve, MEDB Contingency Account and CRP are restricted under bond indentures governing the use of these funds.
h. Investments
Investments are presented in the Statement of Net Assets at fair value. Investment fair values for publicly traded securities aredetermined primarily by reference to market prices supplied to the Board’s trustee. Amortized cost, or carrying value, represents the original cost, adjusted for premium and discount amortization where applicable. Premiums and discounts are amortized/accreted using the straight-line method to the maturity date of the securities.
2. INVESTMENT RISK DISCLOSURES
Effective June 30, 2005, the Board implemented the provisions of Governmental Accounting Standards Board (GASB) Statement No. 40 – Deposit and Investment Risk Disclosures. The investment risk disclosures are described in the following paragraphs.
The Enterprise Fund deposits and investments are restricted by the bond trust indentures to the following: government and agency obligations, certificates of deposits, repurchase agreements, and investment agreements. Deposits and investments must be made with Montana banks or in the Short Term Investment Pool (STIP) administered by the Board.
Credit RiskCredit risk is defined as the risk that an issuer or other counterparty to an investment will not fulfill its obligation. TheEnterprise Fund’s U.S. government direct-backed securities, consisting of U.S. Treasury notes and bills, are guaranteed directly by the U.S. government. Obligations of the U.S. government or obligations explicitly guaranteed by the U.S. government are not considered to have credit risk and do not require disclosure of credit quality. The credit ratings presentedin the table below are provided by S&P’s rating services.
Custodial Credit RiskCustodial credit risk for investments is the risk that, in the event of the failure of the counterparty to a transaction, a government will not be able to recover the value of the investment or collateral securities that are in the possession of an outside party. As of June 30, 2009 and 2008, Enterprise Fund securities were recorded in book entry form in the name of U.S. Bank National Association as Trustee for the Montana Board of Investments by specific account.
A-65

As of June 30, 2009 and 2008, the Enterprise Fund had $3,240,541 and $10,041,084, respectively, in Certificates of Deposits (CDs), of which $250,000 and $100,000, respectively, are covered by FDIC (Federal Deposit Insurance Corporation) insurance. The remaining balances of $2,990,541 and $9,941,084, respectively, are not covered by deposit insurance but are collateralizedby securities held by U.S. Bank’s Trust Department. The securities used as collateral are held by U.S. Bank’s Trust Department at 100% of the Certificate of Deposit amount in a pool for multiple depositors.
Concentration of Credit RiskConcentration of credit risk is the risk of loss attributed to the magnitude of a government’s investment in a single issuer. TheEnterprise Fund investments include investments directly issued or explicitly guaranteed by the U.S. government, and investments in mutual funds. These investments are excluded from the concentration of credit risk requirement. The Enterprise Fund also invests in US Bank Certificates of Deposit. As of June 30, 2009 and 2008 these CDs represent 24.7% and 43.6% of the investment portfolio, respectively.
Interest Rate RiskInterest rate risk is the risk that changes in interest rates will adversely affect the fair value of an investment. The EnterpriseFunds’ bond indentures do not formally address interest rate risk. In accordance with GASB Statement No. 40, the Board has selected the duration method to disclose interest rate risk.
State of Montana Enterprise Fund investments are categorized below to disclose credit and interest rate risk as of June 30, 2009 and June 30, 2008. Credit risk reflects the bond quality rating, by investment type, as of the June 30 report date. Interest rate risk is disclosed using duration as calculated by Board staff. If a bond investment type is unrated, the qualitytype is indicated by NR (not rated). Both the credit quality ratings and duration have been calculated excluding cash equivalents. If duration has not been calculated, duration is indicated by NA (not applicable).
Security Investment Type Fair Value
First American Treasury Obligation Fund $ 8,186,070 AAA NAShort Term Investment Pool (STIP) 121,687 NR 0.13U.S. Government Direct Obligations 1,559,751 AAA 1.00Certificates of Deposit 3,240,541 A+ 2.32 Total Investments $ 13,108,049 AA+ 1.85
Securities Lending Collateral Investment Pool $ 7,985 NR NA
Security Investment Type Fair Value
First American Treasury Obligation Fund $ 9,188,586 AAA NAShort Term Investment Pool (STIP) 31,221 NR NAU.S. Government Direct Obligations 3,786,848 AAA 1.17Certificates of Deposit 10,041,084 AA 1.21 Total Investments $ 23,047,739 AA+ 1.20
Securities Lending Collateral Investment Pool $ 1,370 NR NA
CreditQuality Rating
Effective Duration
Credit Quality Rating and Effective Duration as of June 30, 2009
Credit Quality Rating and Effective Duration as of June 30, 2008
CreditQuality Rating
Effective Duration
There were no derivative transactions during the above fiscal years for investments held by the trustee.
3. SECURITY LENDING
The Enterprise Fund is a participant in the Board’s Short Term Investment Pool (STIP). In fiscal years 2009 and 2008, security lending transactions were recorded for STIP.
A-66

The Board is authorized by law to lend its securities and has contracted with the custodial bank, State Street Bank and Trust “the Bank”, to lend the Board’s securities to broker-dealers and other entities with a simultaneous agreement to return the collateral for the same securities in the future. The custodial bank is required to maintain collateral equal to 102 percent ofthe fair value of domestic securities and 105 percent of the fair value of international securities while the securities are on loan. The Board and the Bank split the earnings on security lending activities.
During fiscal years 2009 and 2008, the Bank lent Board public securities and received U.S. dollar and foreign currency cash, securities issued or guaranteed by the U.S. government, sovereign debt rated A or better, convertible bonds, and irrevocable bank letters of credit as collateral. The Bank cannot pledge or sell collateral securities unless the borrower defaults. The Board imposed no restrictions on the amount of securities available to lend during fiscal years 2009 and 2008. There were no failures by any borrowers to return loaned securities or pay distributions thereon during the period that resulted in a declaration and notice of Default of the Borrower (other than the default by Lehman Brothers Inc. which occurred in September, 2008 and the Board of Investments was made whole in connection with this). Also, there were no losses resulting from a borrower default.
During fiscal years 2009 and 2008, the Board and the borrowers maintained the right to terminate all securities lending transactions on demand. The cash collateral received for each loan was invested, together with the cash collateral of other qualified plan lenders, in a collective investment pool. The Securities Lending Quality Trust had an average duration of 31 and 41 days, respectively, as of June 30, 2009 and 2008. The Quality D Trust had an average duration of 43 and 42 days, respectively, as of June 30, 2009 and 2008. Because the loans were terminable at will, their duration generally did not matchthe duration of the investments made with cash collateral. At year-end 2009 and 2008, the Board had no credit risk exposure to borrowers because the collateral pledged by the borrowers exceeded the value of the securities borrowed.
4. BONDS PAYABLE
Long-Term Bonds Payable
Economic Development Bonds (EDB) and Municipal Finance Consolidation Act Bonds (MFCAB)These bonds are issued under the Economic Development Bond Act, and the Municipal Finance Consolidation Act, for the purpose of assisting Montana's small businesses and local governments in obtaining low cost financing. Outstanding obligations are listed as follows (in thousands):
Amount Interest BalanceProgram Series Issued Range % FY 2010 @ Maturity June 30, 2009
Municipal Finance Consolidation Act Bonds (Irrigation Program) (1) 1988 4,976$ 6.60-7.75 50$ 70 (2014) 300$ Conservation Reserve Enhancement Program (CRP Bonds) (2) 880 6.00-7.40 286 108(2013) 880 Total Bonds Payable 5,856$ 336$ 1,180$ Less Current Portion (FY2009 Principal Payments) (336) Total Long-Term Bonds Payable 844$
Amount Interest BalanceProgram Series Issued Range % FY 2009 @ Maturity June 30, 2008
Municipal Finance Consolidation Act Bonds (Irrigation Program) (1) 1988 4,976$ 6.60-7.75 45$ 70 (2014) 345$ Conservation Reserve Enhancement Program (CRP Bonds) (2) 1,508 6.00-7.50 372 98(2014) 1,508 Total Bonds Payable 6,484$ 417$ 1,853$ Less Current Portion (FY2008 Principal Payments) (417) Total Long-Term Bonds Payable 1,436$
Bonds Payable as of June 30, 2009
Principal Payments
Bonds Payable as of June 30, 2008
Principal Payments
A-67
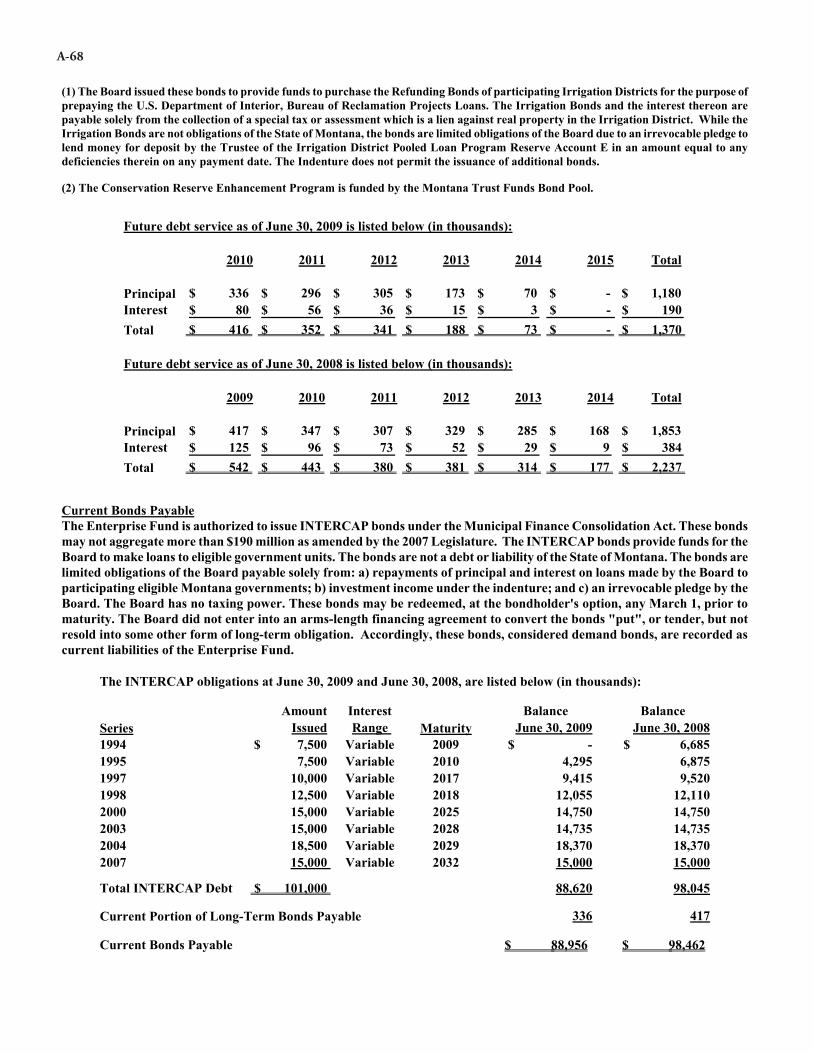
(1) The Board issued these bonds to provide funds to purchase the Refunding Bonds of participating Irrigation Districts for the purpose of prepaying the U.S. Department of Interior, Bureau of Reclamation Projects Loans. The Irrigation Bonds and the interest thereon arepayable solely from the collection of a special tax or assessment which is a lien against real property in the Irrigation District. While the Irrigation Bonds are not obligations of the State of Montana, the bonds are limited obligations of the Board due to an irrevocable pledge to lend money for deposit by the Trustee of the Irrigation District Pooled Loan Program Reserve Account E in an amount equal to anydeficiencies therein on any payment date. The Indenture does not permit the issuance of additional bonds.
(2) The Conservation Reserve Enhancement Program is funded by the Montana Trust Funds Bond Pool.
2010 2011 2012 2013 2014 2015 Total
Principal $ 336 $ 296 $ 305 $ 173 $ 70 $ - $ 1,180 Interest $ 80 $ 56 $ 36 $ 15 $ 3 $ - $ 190 Total $ 416 $ 352 $ 341 $ 188 $ 73 $ - $ 1,370
2009 2010 2011 2012 2013 2014 Total
Principal $ 417 $ 347 $ 307 $ 329 $ 285 $ 168 $ 1,853 Interest $ 125 $ 96 $ 73 $ 52 $ 29 $ 9 $ 384 Total $ 542 $ 443 $ 380 $ 381 $ 314 $ 177 $ 2,237
Future debt service as of June 30, 2008 is listed below (in thousands):
Future debt service as of June 30, 2009 is listed below (in thousands):
Current Bonds PayableThe Enterprise Fund is authorized to issue INTERCAP bonds under the Municipal Finance Consolidation Act. These bonds may not aggregate more than $190 million as amended by the 2007 Legislature. The INTERCAP bonds provide funds for the Board to make loans to eligible government units. The bonds are not a debt or liability of the State of Montana. The bonds are limited obligations of the Board payable solely from: a) repayments of principal and interest on loans made by the Board to participating eligible Montana governments; b) investment income under the indenture; and c) an irrevocable pledge by the Board. The Board has no taxing power. These bonds may be redeemed, at the bondholder's option, any March 1, prior to maturity. The Board did not enter into an arms-length financing agreement to convert the bonds "put", or tender, but not resold into some other form of long-term obligation. Accordingly, these bonds, considered demand bonds, are recorded as current liabilities of the Enterprise Fund.
Amount Interest Balance Balance Issued Range June 30, 2009 June 30, 2008
1994 $ 7,500 Variable 2009 $ - $ 6,685 1995 7,500 Variable 2010 4,295 6,8751997 10,000 Variable 2017 9,415 9,5201998 12,500 Variable 2018 12,055 12,1102000 15,000 Variable 2025 14,750 14,7502003 15,000 Variable 2028 14,735 14,7352004 18,500 Variable 2029 18,370 18,3702007 15,000 Variable 2032 15,000 15,000
Total INTERCAP Debt $ 101,000 88,620 98,045
336 417
88,956$ 98,462$ Current Bonds Payable
Current Portion of Long-Term Bonds Payable
The INTERCAP obligations at June 30, 2009 and June 30, 2008, are listed below (in thousands):
Series Maturity
A-68

5. OTHER DEBT
Conduit DebtIn this program, the Board is authorized to issue stand-alone industrial revenue bonds, under the Economic Development Act, as conduit (no commitment) debt. Assets and revenues of the borrower are pledged to repay the bonds. Because the Board has no obligation for this debt, these bond issues are not reflected on the Board's financial statements. Bonds issued by the Boardas conduit (no-commitment) debt are listed below (in thousands):
Balance Balance Project Issue Date Maturity Date June 30, 2009 June 30, 2008
Colstrip October 1989 12/30/15 $ 60,800 $ 42,300 $ 45,300 Yellowstone Energy (BGI) July 1993 12/31/19 118,345 104,600 110,145Stillwater Mining July 2000 07/01/20 30,000 30,000 30,000Gainey Foundation October 2002 09/01/14 6,000 3,290 3,775Total conduit debt $ 215,145 $ 180,190 $ 189,220
Amount Issued
QZAB DebtIn this program, the Board is authorized to issue Qualified Zone Academy Bonds (QZAB), under the Municipal FinanceConsolidation Act, as conduit (no commitment) debt. The revenues, and in some cases the taxing power, of the borrower are pledged to repay the bonds. Because the Board has no obligation for this debt, these bond issues are not reflected on the Board's financial statements. Bonds issued by the Board as QZAB conduit (no-commitment) debt are listed below (in thousands):
Balance Balance Project Issue Date Maturity Date June 30, 2009 June 30, 2008Huntley Project K-12 Schools December 2000 07/01/13 $ 750 $ 750 $ 750 Bozeman Public Schools November 2003 11/25/12 1,586 1,586 1,586Philipsburg Schools December 2003 12/10/17 2,000 2,000 2,000Cut Bank Elementary August 2005 08/18/21 825 825 825Cut Bank High School August 2005 08/18/21 625 625 625Bozeman Public Schools December 2006 12/19/15 1,459 1,459 1,459Billings School December 2008 06/15/18 773 773 0Lewistown Elementary School June 2009 06/15/17 2,087 2,087 0Total QZAB conduit debt $ 10,105 $ 10,105 $ 7,245
Amount Issued
6. INTERCAP PROGRAM LOAN COMMITMENTS
The Board makes firm commitments to fund loans from the INTERCAP loan program. As of June 30, 2009 and 2008, respectively, the Board committed to make loans to eligible Montana governments totaling $29,249,486 and $30,926,556.
7. NET ASSETS
Net Assets represents the accumulated net profits of the Enterprise Fund programs. The Net Assets for fiscal years ended June 30, 2009 and June 30, 2008 include $61,256 and $82,869, respectively, in unrealized appreciation (depreciation) in reporting the fair value of the Enterprise Fund investments.
8. TRANSFERS FROM OTHER FUNDS
In fiscal year 2009, the Board of Investments’ Investment account transferred $725,000 to the Enterprise Fund. This transfer was a partial repayment of transfers to the Board of Investments’ Investment accounts made in fiscal years 2007 and 2003 for $900,074 and $297,266. No transfers were made in fiscal year 2008.
9. ARBITRAGE
The fiscal year 2009 Arbitrage Rebate Tax Expense represents an over accrual of estimated arbitrage liability as calculated by a contracted vendor.
A-69

10. OPEB – OTHER POST EMPLOYMENT BENEFITS
Refer to the State of Montana Comprehensive Annual Financial Report (CAFR) Note 7. The State of Montana CAFR is available at the Department of Administration, Administrative and Financial Service Division’s website at http://afsd.mt.gov/cafr/cafr.asp .
11. SUBSEQUENT EVENT
On July 1, 2009, U.S. Bank established a mandatory 100% redemption of the conduit debt bonds for The Gainey Foundation for $3,290,000. The bonds were redeemed in accordance with the loan agreement which requires a renewed or substitute letter of credit be presented to the Bank 45 days prior to the expiration or termination of the current letter of credit.
{This area intentionally left blank}
A-70

B-1