board of regents meeting september 18-20, 2019 executive
TRANSCRIPT

Board of Regents Meeting September 18-20, 2019
Item #13 EXECUTIVE SUMMARY Page 1 of 5
Contact Information: Lisa Rulney, UA [email protected] 520- 621-5977
Item Name: FY 2021 – 2023 Capital Improvement Plan (UA)
Action Item Strategic Alignment with the University’s Institutional Priorities
• For more than 130 years, the University of Arizona has been a leader in research
achievements, quality academic programs and economic impact and service to the community. Today, we are poised to lead innovation in health, big data and the environment to name a few, and are now in a position to enable more dynamic human interaction in an increasingly digital world. The implementation of our Strategic Plan is addressing these goals and providing a roadmap for the future while this Capital Improvement Plan reflects the physical aspects of our overall strategic priorities.
• The university’s Capital Improvement Plan (CIP) addresses the critical needs of both growth and renewal. Modern sustainable facilities are required to accommodate research, instruction and growth, to remain competitive, and to facilitate modern paradigms. An investment in building renewal is required to address critical deferred maintenance across campus. Part of this plan is being supported by matching State Appropriation Funds and the UA is focused on maximizing this benefit.
• As noted in the CIP report, the amount of Building Renewal funding due to the UA under the state formula this year would be $93,560,700.
Capital Improvement Plan One and Two-Year Forecast • One-Year Capital Plan for FY 2021: The University of Arizona presents two projects in
the FY 2021 One-Year Capital Plan. The projects total $62 million in estimated costs. Descriptions for these projects are included in the table below. Additional information is included in the FY 2021 Project Descriptions section of the CIP.
Requested Action: The University of Arizona asks the board to approve the proposed Capital Improvement Plan Fiscal Years 2021 – 2023, as described in this executive summary.
Board of Regents Meeting September 18-20, 2019
Item #13 EXECUTIVE SUMMARY Page 2 of 5
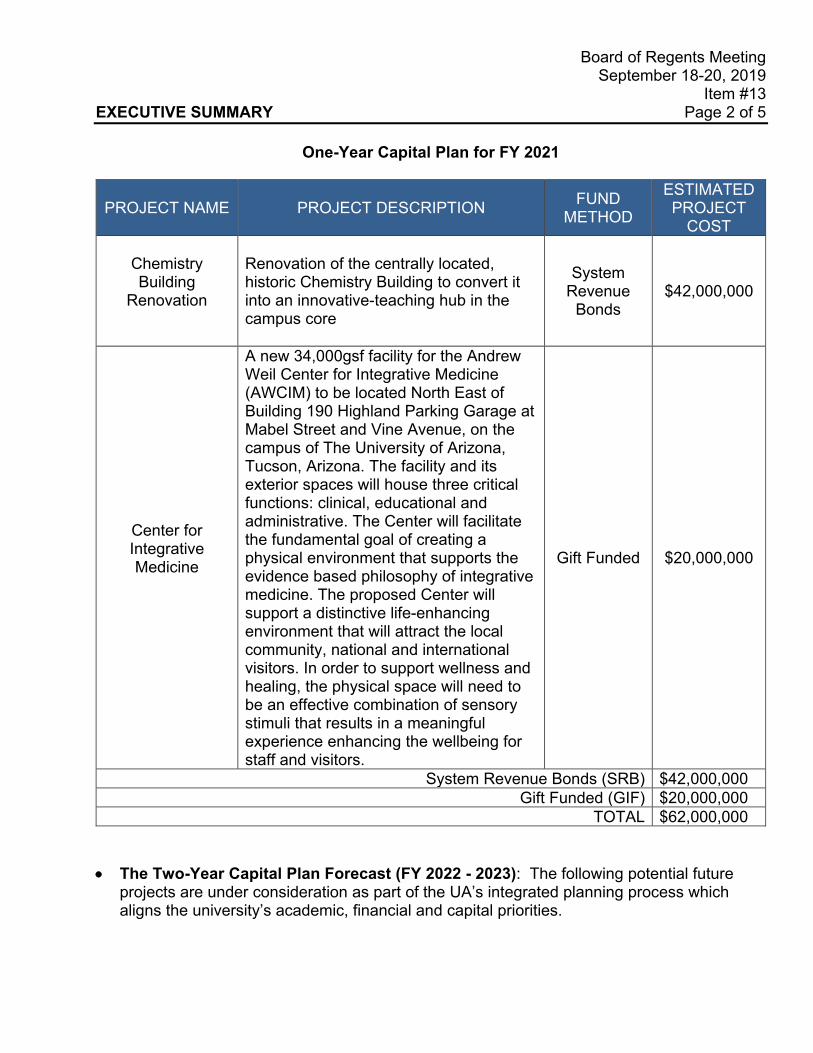
One-Year Capital Plan for FY 2021
PROJECT NAME PROJECT DESCRIPTION FUND METHOD
ESTIMATED PROJECT
COST
Chemistry Building
Renovation
Renovation of the centrally located, historic Chemistry Building to convert it into an innovative-teaching hub in the campus core
System Revenue
Bonds $42,000,000
Center for Integrative Medicine
A new 34,000gsf facility for the Andrew Weil Center for Integrative Medicine (AWCIM) to be located North East of Building 190 Highland Parking Garage at Mabel Street and Vine Avenue, on the campus of The University of Arizona, Tucson, Arizona. The facility and its exterior spaces will house three critical functions: clinical, educational and administrative. The Center will facilitate the fundamental goal of creating a physical environment that supports the evidence based philosophy of integrative medicine. The proposed Center will support a distinctive life-enhancing environment that will attract the local community, national and international visitors. In order to support wellness and healing, the physical space will need to be an effective combination of sensory stimuli that results in a meaningful experience enhancing the wellbeing for staff and visitors.
Gift Funded $20,000,000
System Revenue Bonds (SRB) $42,000,000 Gift Funded (GIF) $20,000,000
TOTAL $62,000,000
• The Two-Year Capital Plan Forecast (FY 2022 - 2023): The following potential future projects are under consideration as part of the UA’s integrated planning process which aligns the university’s academic, financial and capital priorities.

Board of Regents Meeting September 18-20, 2019
Item #13 EXECUTIVE SUMMARY Page 3 of 5
Two-Year Capital Plan (FY 2022-2023)
PROJECT NAME PROJECT DESCRIPTION
Graduate Housing (P3 Project)
The university is exploring the potential to facilitate additional graduate student housing on campus.
Hotel Conference Center
(P3 Project)
The university is exploring the potential to facilitate a hotel and conference center on campus.
Phoenix Center for
Collaboration and Outreach (P3 Project)
The university is exploring the potential to facilitate a collaboration center at or near the downtown Phoenix campus.
College of Architecture, Planning and Landscape
Architecture (CAPLA)
Reconfiguration of CAPLA’s current space to improve space utilization and provide facilities that will enhance learning.
Facilities Management
Relocation and Consolidation
New facility to relocate and consolidate Facilities Management operation.
University Office Building
The university is exploring the potential to provide a new office facility to facilitate growth and consolidation.
Deferred Maintenance Deferred maintenance to highest priority buildings and building systems across campus.
AZPM/SBS New Facility
A multi-disciplinary facility to house Arizona Public Media (AZPM), and three related Social Behavioral Sciences department programs, Information School, Communication and Journalism. Consideration will be given to the possibility of co-locating partner organizations.
Engineering Design Center
New building to include hands-on Makerspace for the Engineering Senior Design Capstone course, offices and conference rooms for faculty and staff who will operate the Engineering Senior Design Capstone course.
Laboratory Modernization and Renovations
Renovations will facilitate the increased utilization of existing, inefficient research lab space and reduce the new building needs.
Centennial Hall Renovations
This renovation and expansion will address the most critical needs of patrons, performance and support. The renovations include improving seating and sight lines, acoustics/sound, adding restrooms, and improving point of sale opportunities. This project will also prioritize future improvement opportunities for potential donors including amenities such as additional rehearsal, lecture
Board of Regents Meeting September 18-20, 2019
Item #13 EXECUTIVE SUMMARY Page 4 of 5
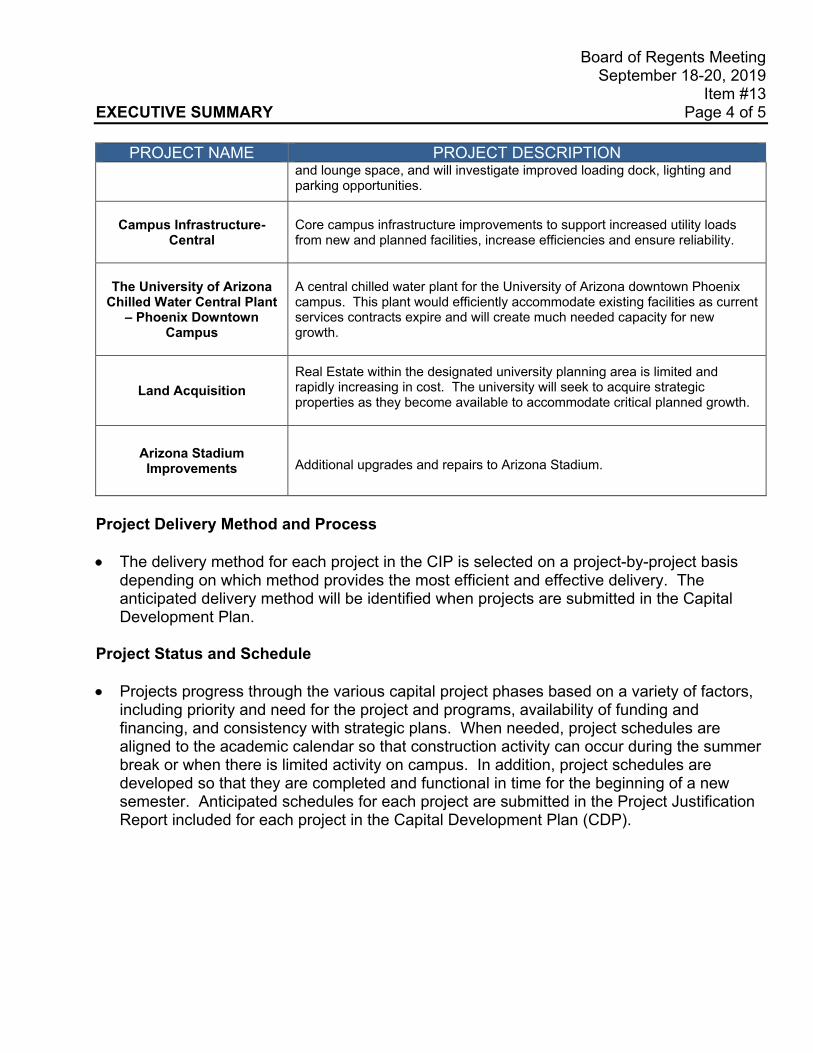
PROJECT NAME PROJECT DESCRIPTION and lounge space, and will investigate improved loading dock, lighting and parking opportunities.
Campus Infrastructure-Central
Core campus infrastructure improvements to support increased utility loads from new and planned facilities, increase efficiencies and ensure reliability.
The University of Arizona
Chilled Water Central Plant – Phoenix Downtown
Campus
A central chilled water plant for the University of Arizona downtown Phoenix campus. This plant would efficiently accommodate existing facilities as current services contracts expire and will create much needed capacity for new growth.
Land Acquisition Real Estate within the designated university planning area is limited and rapidly increasing in cost. The university will seek to acquire strategic properties as they become available to accommodate critical planned growth.
Arizona Stadium Improvements
Additional upgrades and repairs to Arizona Stadium.
Project Delivery Method and Process • The delivery method for each project in the CIP is selected on a project-by-project basis
depending on which method provides the most efficient and effective delivery. The anticipated delivery method will be identified when projects are submitted in the Capital Development Plan.
Project Status and Schedule • Projects progress through the various capital project phases based on a variety of factors,
including priority and need for the project and programs, availability of funding and financing, and consistency with strategic plans. When needed, project schedules are aligned to the academic calendar so that construction activity can occur during the summer break or when there is limited activity on campus. In addition, project schedules are developed so that they are completed and functional in time for the beginning of a new semester. Anticipated schedules for each project are submitted in the Project Justification Report included for each project in the Capital Development Plan (CDP).

Board of Regents Meeting September 18-20, 2019
Item #13 EXECUTIVE SUMMARY Page 5 of 5 Fiscal Impact and Financing Plan • The Annual Assessment of Debt Capacity report, contained in the FY 2021 - 2023 CIP,
provides a summary of the UA’s outstanding debt and debt ratios. The projected debt ratio in relation to ABOR policy and state statute is the total annual debt service on bonds and certificates of participation to total university expenses. The report demonstrates the UA’s ability to finance additional capital projects through the issuance of debt while complying with ABOR policy and the state statute debt ratio limit of 8%.
• Debt Ratio Impact: Based on the university’s current outstanding debt, projects in the approved FY 2019 CDP, and the projects in the first year of the FY 2021 - 2023 CIP, the projected highest debt ratio is 5.3% in FY 2022. The projected highest debt ratio including SPEED Revenue Bonds debt service is 6.5% in FY 2022.
Occupancy Plan
• Projects included in the CIP typically create space that will allow for the creation, expansion and/or relocation of programs. The space the projects provide house programs that will fulfill various objectives within the university Strategic Plan, including academic, research and student success goals. Project Justification Reports submitted when these projects are transitioned to the CDP will provide additional detail on occupancy plans for new or renovated space.
Committee Review and Recommendation The Finance, Capital and Resources Committee reviewed this item at its September 5, 2019 meeting but did not take action. Statutory/Policy Requirements
• Board Policy 7-106 requires committee review and board approval of the annual Capital
Improvement Plan.

This page intentionally left blank
THE UNIVERSITY OF ARIZONA CAPITAL IMPROVEMENT PLAN
FY 2021 - 2023

CAPITAL IMPROVEMENT PLAN
FISCAL YEARS 2021-2023
Submitted to the ARIZONA BOARD OF REGENTS
September 2019

This page intentionally left blank

University of Arizona
FY 2021-2022 Capital Improvement Plan
Table of Contents

THE UNIVERSITY OF ARIZONA
CAPITAL IMPROVEMENT PLAN FISCAL YEARS 2021-2023
Table of Contents
Transmittal Statement .......................................................................................................................................................................... 1
All Funds Summary
All Funds Summary, Capital Allocations ........................................................................................................................................... 2
Building Renewal Report
State Appropriated Building Renewal Summary ................................................................................................................................ 3 Building Renewal Formula Allocation Forecast .................................................................................................................................. 4
Deferred Maintenance Report
Definition and Explanation of Deferred Maintenance for the Arizona University System ................................................................. 5 Deferred Maintenance Status ............................................................................................................................................................... 5 Action Plan to Address Deferred Maintenance in FY 2019 ................................................................................................................ 5 Allocations to Reduce Deferred Maintenance ..................................................................................................................................... 7 Facility Code Index Map .................................................................................................................................................................... 8
Building Inventory Report
Building Inventory Summary ............................................................................................................................................................. 9 Building Inventory Report ................................................................................................................................................................ 10
Lease Report
Summary of Leases in Effect During Fiscal Year 2019 ................................................................................................................... 30 Property Leases in Effect During Fiscal Year 2019, University as Lessee ...................................................................................... 31 Property Leases in Effect During Fiscal Year 2019, University as Lessor ....................................................................................... 42

THE UNIVERSITY OF ARIZONA
CAPITAL IMPROVEMENT PLAN FISCAL YEARS 2021-2023
Land Report
Report on Acquisitions and Sales of Land and Improvements FY 2019 .......................................................................................... 49
Capital Project Status Report
Capital Expenditures Summary FY 2019 ......................................................................................................................................... 50 Status of JCCR Projects ..................................................................................................................................................................... 51 Capital Project Status Report (Projects $100,000 and Greater) ............................................................................................................ 52 Capital Project Status Report (Projects Less Than $100,000) .............................................................................................................. 55 Funding Source Codes ...................................................................................................................................................................... 56 Capital Project Categories ................................................................................................................................................................. 57
Three-Year Capital Plan
One-Year Capital Plan (FY 2021) .................................................................................................................................................... 58 Two-Year Capital Plan Forecast (FY 2022-2023) ............................................................................................................................ 59
FY 2021 Project Description, Justification, Scope & Cost
Chemistry Building Renovation ....................................................................................................................................................... 61 Center for Integrative Medicine ....................................................................................................................................................... 63 Debt Report
Annual Assessment of Debt Capacity ............................................................................................................................................... 65 Supplemental Debt Information ........................................................................................................................................................ 67
This page intentionally left blank

University of Arizona
FY 2021-2022 Capital Improvement Plan
Transmittal Statement


University of Arizona
FY 2021-2022 Capital Improvement Plan
All Funds Summary
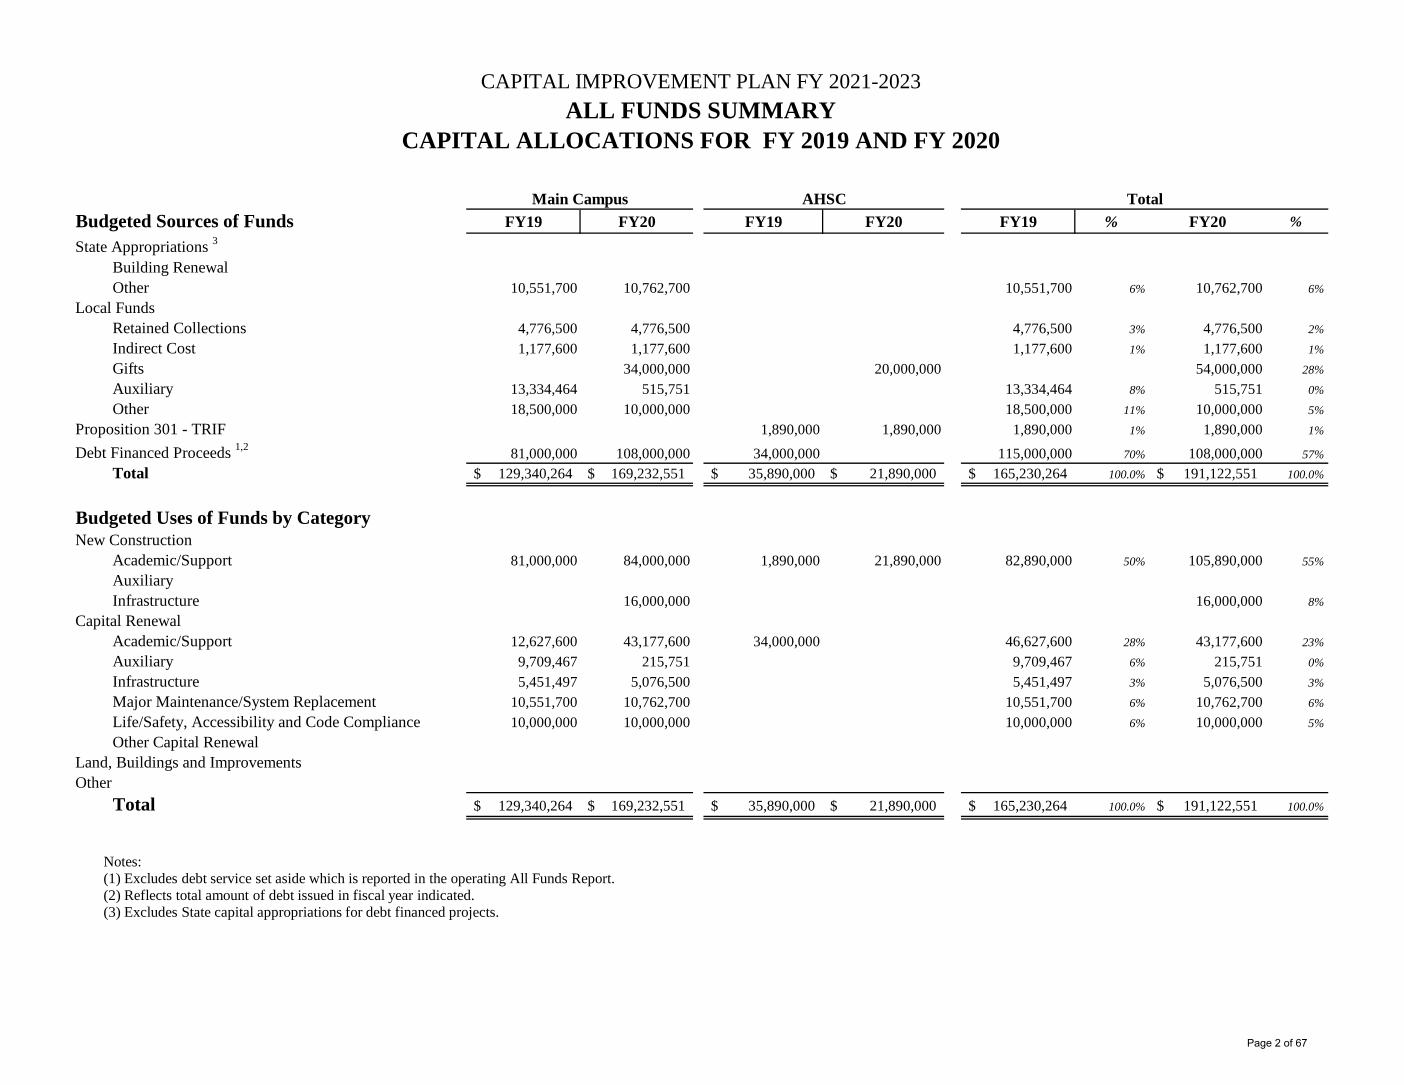
CAPITAL IMPROVEMENT PLAN FY 2021-2023ALL FUNDS SUMMARY
CAPITAL ALLOCATIONS FOR FY 2019 AND FY 2020
Main Campus AHSC TotalBudgeted Sources of Funds FY19 FY20 FY19 FY20 FY19 % FY20 %
State Appropriations 3
Building Renewal Other 10,551,700 10,762,700 10,551,700 6% 10,762,700 6%
Local FundsRetained Collections 4,776,500 4,776,500 4,776,500 3% 4,776,500 2%
Indirect Cost 1,177,600 1,177,600 1,177,600 1% 1,177,600 1%
Gifts 34,000,000 20,000,000 54,000,000 28%
Auxiliary 13,334,464 515,751 13,334,464 8% 515,751 0%
Other 18,500,000 10,000,000 18,500,000 11% 10,000,000 5%
Proposition 301 - TRIF 1,890,000 1,890,000 1,890,000 1% 1,890,000 1%
Debt Financed Proceeds 1,2 81,000,000 108,000,000 34,000,000 115,000,000 70% 108,000,000 57%
Total 129,340,264$ 169,232,551$ 35,890,000$ 21,890,000$ 165,230,264$ 100.0% 191,122,551$ 100.0%
Budgeted Uses of Funds by CategoryNew Construction
Academic/Support 81,000,000 84,000,000 1,890,000 21,890,000 82,890,000 50% 105,890,000 55%
AuxiliaryInfrastructure 16,000,000 16,000,000 8%
Capital RenewalAcademic/Support 12,627,600 43,177,600 34,000,000 46,627,600 28% 43,177,600 23%
Auxiliary 9,709,467 215,751 9,709,467 6% 215,751 0%
Infrastructure 5,451,497 5,076,500 5,451,497 3% 5,076,500 3%
Major Maintenance/System Replacement 10,551,700 10,762,700 10,551,700 6% 10,762,700 6%
Life/Safety, Accessibility and Code Compliance 10,000,000 10,000,000 10,000,000 6% 10,000,000 5%
Other Capital RenewalLand, Buildings and ImprovementsOther
Total 129,340,264$ 169,232,551$ 35,890,000$ 21,890,000$ 165,230,264$ 100.0% 191,122,551$ 100.0%
Notes:(1) Excludes debt service set aside which is reported in the operating All Funds Report.(2) Reflects total amount of debt issued in fiscal year indicated.(3) Excludes State capital appropriations for debt financed projects.
Page 2 of 67

University of Arizona
FY 2021-2022 Capital Improvement Plan
Building Renewal Report
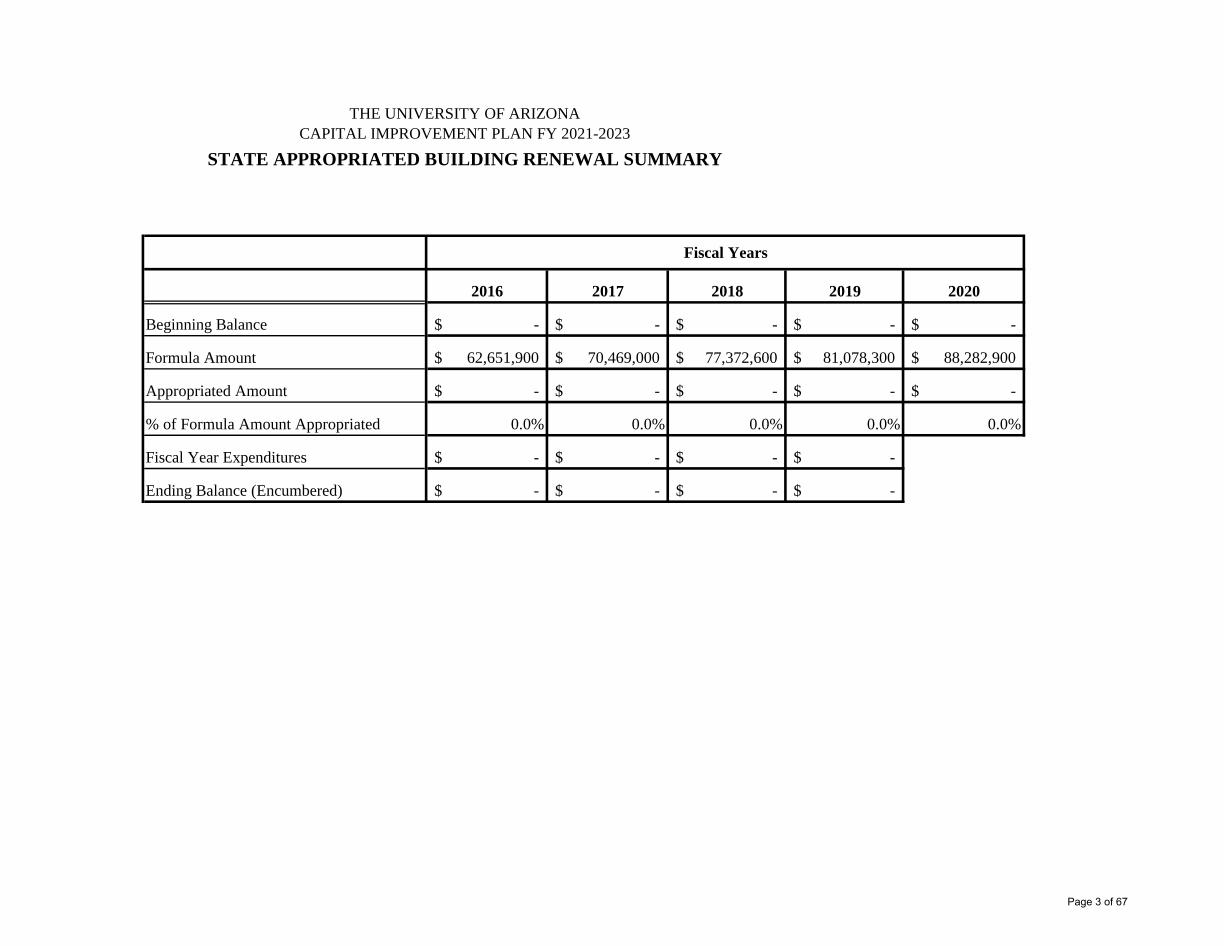
2016 2017 2018 2019 2020
Beginning Balance -$ -$ -$ -$ -$
Formula Amount 62,651,900$ 70,469,000$ 77,372,600$ 81,078,300$ 88,282,900$
Appropriated Amount -$ -$ -$ -$ -$
% of Formula Amount Appropriated 0.0% 0.0% 0.0% 0.0% 0.0%
Fiscal Year Expenditures -$ -$ -$ -$
Ending Balance (Encumbered) -$ -$ -$ -$
THE UNIVERSITY OF ARIZONACAPITAL IMPROVEMENT PLAN FY 2021-2023
STATE APPROPRIATED BUILDING RENEWAL SUMMARY
Fiscal Years
Page 3 of 67
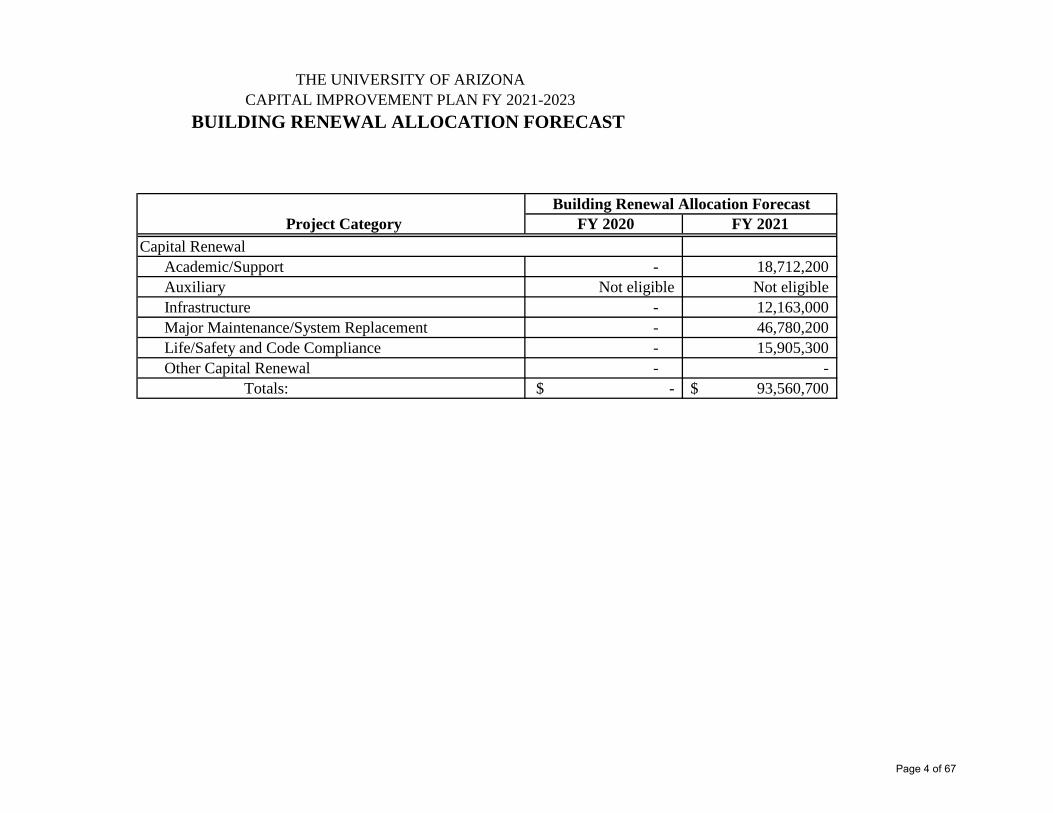
Project Category FY 2020 FY 2021Capital Renewal
Academic/Support - 18,712,200 Auxiliary Not eligible Not eligibleInfrastructure - 12,163,000 Major Maintenance/System Replacement - 46,780,200 Life/Safety and Code Compliance - 15,905,300 Other Capital Renewal - - Totals: -$ 93,560,700$
THE UNIVERSITY OF ARIZONACAPITAL IMPROVEMENT PLAN FY 2021-2023
BUILDING RENEWAL ALLOCATION FORECAST
Building Renewal Allocation Forecast
Page 4 of 67

This page intentionally left blank

University of Arizona
FY 2021-2022 Capital Improvement Plan
Deferred Maintenance Report
THE UNIVERSITY OF ARIZONA FY 2021-2023 CAPITAL IMPROVEMENT PLAN DEFERRED MAINTENANCE REPORT
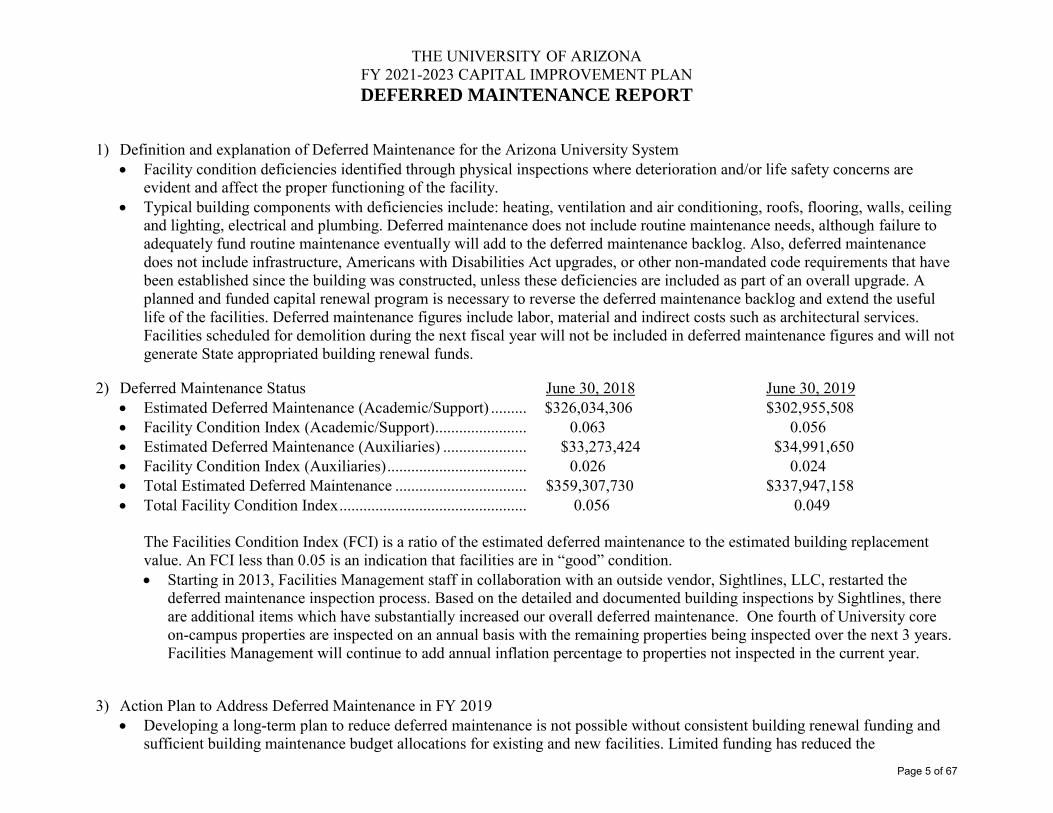
1) Definition and explanation of Deferred Maintenance for the Arizona University System
Facility condition deficiencies identified through physical inspections where deterioration and/or life safety concerns are evident and affect the proper functioning of the facility.
Typical building components with deficiencies include: heating, ventilation and air conditioning, roofs, flooring, walls, ceiling and lighting, electrical and plumbing. Deferred maintenance does not include routine maintenance needs, although failure to adequately fund routine maintenance eventually will add to the deferred maintenance backlog. Also, deferred maintenance does not include infrastructure, Americans with Disabilities Act upgrades, or other non-mandated code requirements that have been established since the building was constructed, unless these deficiencies are included as part of an overall upgrade. A planned and funded capital renewal program is necessary to reverse the deferred maintenance backlog and extend the useful life of the facilities. Deferred maintenance figures include labor, material and indirect costs such as architectural services. Facilities scheduled for demolition during the next fiscal year will not be included in deferred maintenance figures and will not generate State appropriated building renewal funds.
2) Deferred Maintenance Status June 30, 2018 June 30, 2019 Estimated Deferred Maintenance (Academic/Support) ......... $326,034,306 $302,955,508 Facility Condition Index (Academic/Support) ....................... 0.063 0.056 Estimated Deferred Maintenance (Auxiliaries) ..................... $33,273,424 $34,991,650 Facility Condition Index (Auxiliaries) ................................... 0.026 0.024 Total Estimated Deferred Maintenance ................................. $359,307,730 $337,947,158 Total Facility Condition Index ............................................... 0.056 0.049
The Facilities Condition Index (FCI) is a ratio of the estimated deferred maintenance to the estimated building replacement
value. An FCI less than 0.05 is an indication that facilities are in “good” condition. Starting in 2013, Facilities Management staff in collaboration with an outside vendor, Sightlines, LLC, restarted the
deferred maintenance inspection process. Based on the detailed and documented building inspections by Sightlines, there are additional items which have substantially increased our overall deferred maintenance. One fourth of University core on-campus properties are inspected on an annual basis with the remaining properties being inspected over the next 3 years. Facilities Management will continue to add annual inflation percentage to properties not inspected in the current year.
3) Action Plan to Address Deferred Maintenance in FY 2019 Developing a long-term plan to reduce deferred maintenance is not possible without consistent building renewal funding and
sufficient building maintenance budget allocations for existing and new facilities. Limited funding has reduced the Page 5 of 67
THE UNIVERSITY OF ARIZONA FY 2021-2023 CAPITAL IMPROVEMENT PLAN DEFERRED MAINTENANCE REPORT
University’s ability to address deferred maintenance issues; however, funding to reduce deferred maintenance will continue to be a high priority along with building renewal activities in other user areas. Addressing life and safety repairs and maintaining the building envelope, such as roofs and windows remains a high priority. Building maintenance activities will, whenever possible, address deferred maintenance problems to further limit financial expenses. In addition, deferred maintenance projects will also attempt to reduce energy costs by fixing leaking valves, repairing HVAC systems, and improving lighting systems.
Page 6 of 67
THE UNIVERSITY OF ARIZONA FY 2021-2023 CAPITAL IMPROVEMENT PLAN DEFERRED MAINTENANCE REPORT
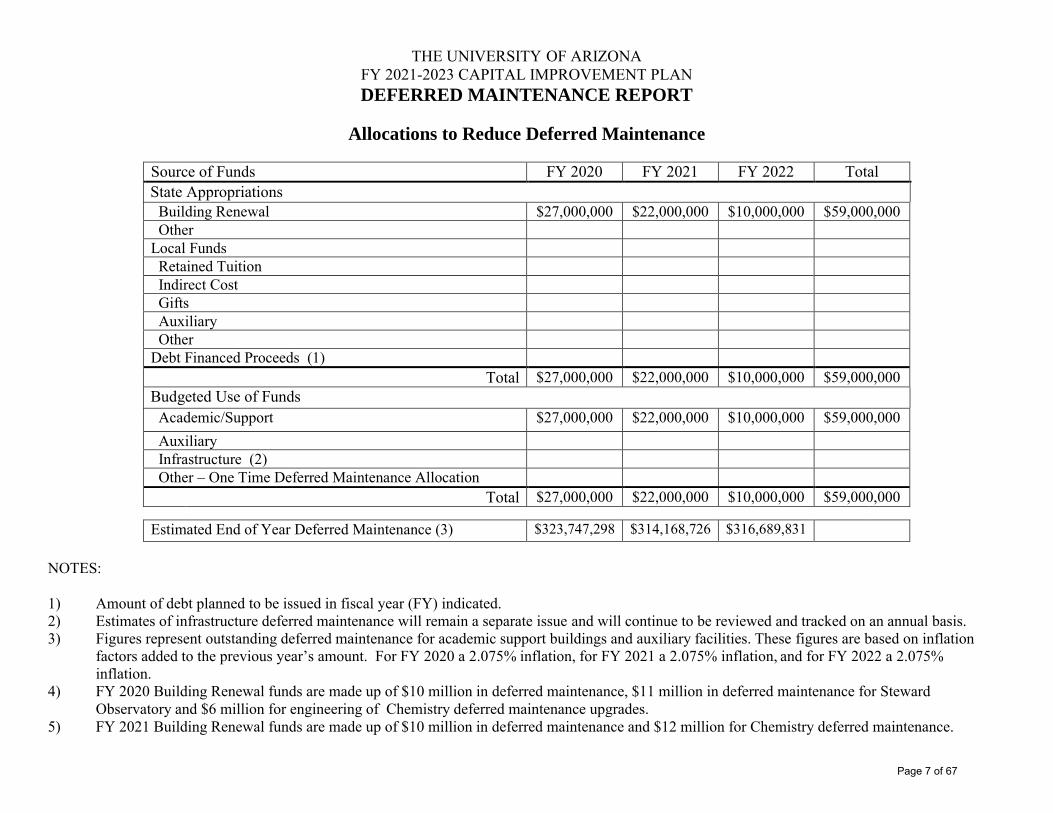
Allocations to Reduce Deferred Maintenance
Source of Funds FY 2020 FY 2021 FY 2022 Total State Appropriations Building Renewal $27,000,000 $22,000,000 $10,000,000 $59,000,000 Other Local Funds Retained Tuition Indirect Cost Gifts Auxiliary Other Debt Financed Proceeds (1)
Total $27,000,000 $22,000,000 $10,000,000 $59,000,000 Budgeted Use of Funds Academic/Support $27,000,000 $22,000,000 $10,000,000 $59,000,000 Auxiliary Infrastructure (2) Other – One Time Deferred Maintenance Allocation
Total $27,000,000 $22,000,000 $10,000,000 $59,000,000
Estimated End of Year Deferred Maintenance (3) $323,747,298 $314,168,726 $316,689,831
NOTES:
1) Amount of debt planned to be issued in fiscal year (FY) indicated.2) Estimates of infrastructure deferred maintenance will remain a separate issue and will continue to be reviewed and tracked on an annual basis.3) Figures represent outstanding deferred maintenance for academic support buildings and auxiliary facilities. These figures are based on inflation
factors added to the previous year’s amount. For FY 2020 a 2.075% inflation, for FY 2021 a 2.075% inflation, and for FY 2022 a 2.075% inflation.
4) FY 2020 Building Renewal funds are made up of $10 million in deferred maintenance, $11 million in deferred maintenance for Steward Observatory and $6 million for engineering of Chemistry deferred maintenance upgrades.
5) FY 2021 Building Renewal funds are made up of $10 million in deferred maintenance and $12 million for Chemistry deferred maintenance.
Page 7 of 67

FACILITY CODE INDEX MAPThe University of Arizona September 2019
Note: Map background showsan illustrative build-out conceptof campus development (theComprehensive Campus Plan -ABOR 2009).
Facility Code Index is the deferredmaintenance dollars divided by thetotal building replacement cost.These percentages are basedon the most current available data.
Facility Code Index<5% Good
5-10% Fair
>10% Poor
Demolish
Page
8 o
f 67

This page intentionally left blank
University of Arizona
FY 2021-2022 Capital Improvement Plan
Building Inventory Report
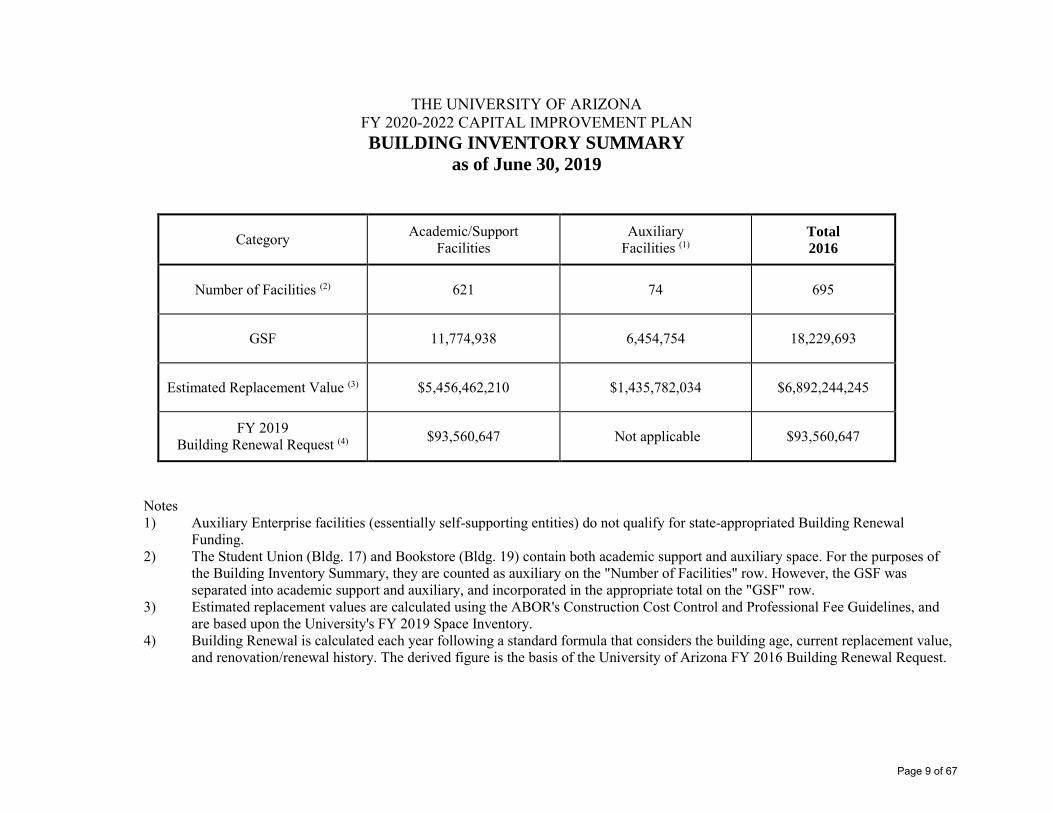
THE UNIVERSITY OF ARIZONA FY 2020-2022 CAPITAL IMPROVEMENT PLAN BUILDING INVENTORY SUMMARY
as of June 30, 2019
Category Academic/Support Facilities
Auxiliary Facilities (1)
Total
2016
Number of Facilities (2) 621 74 695
GSF 11,774,938 6,454,754 18,229,693
Estimated Replacement Value (3) $5,456,462,210 $1,435,782,034 $6,892,244,245
FY 2019 Building Renewal Request (4) $93,560,647 Not applicable $93,560,647
Notes 1) Auxiliary Enterprise facilities (essentially self-supporting entities) do not qualify for state-appropriated Building Renewal
Funding. 2) The Student Union (Bldg. 17) and Bookstore (Bldg. 19) contain both academic support and auxiliary space. For the purposes of
the Building Inventory Summary, they are counted as auxiliary on the "Number of Facilities" row. However, the GSF was separated into academic support and auxiliary, and incorporated in the appropriate total on the "GSF" row.
3) Estimated replacement values are calculated using the ABOR's Construction Cost Control and Professional Fee Guidelines, and are based upon the University's FY 2019 Space Inventory.
4) Building Renewal is calculated each year following a standard formula that considers the building age, current replacement value, and renovation/renewal history. The derived figure is the basis of the University of Arizona FY 2016 Building Renewal Request.
Page 9 of 67

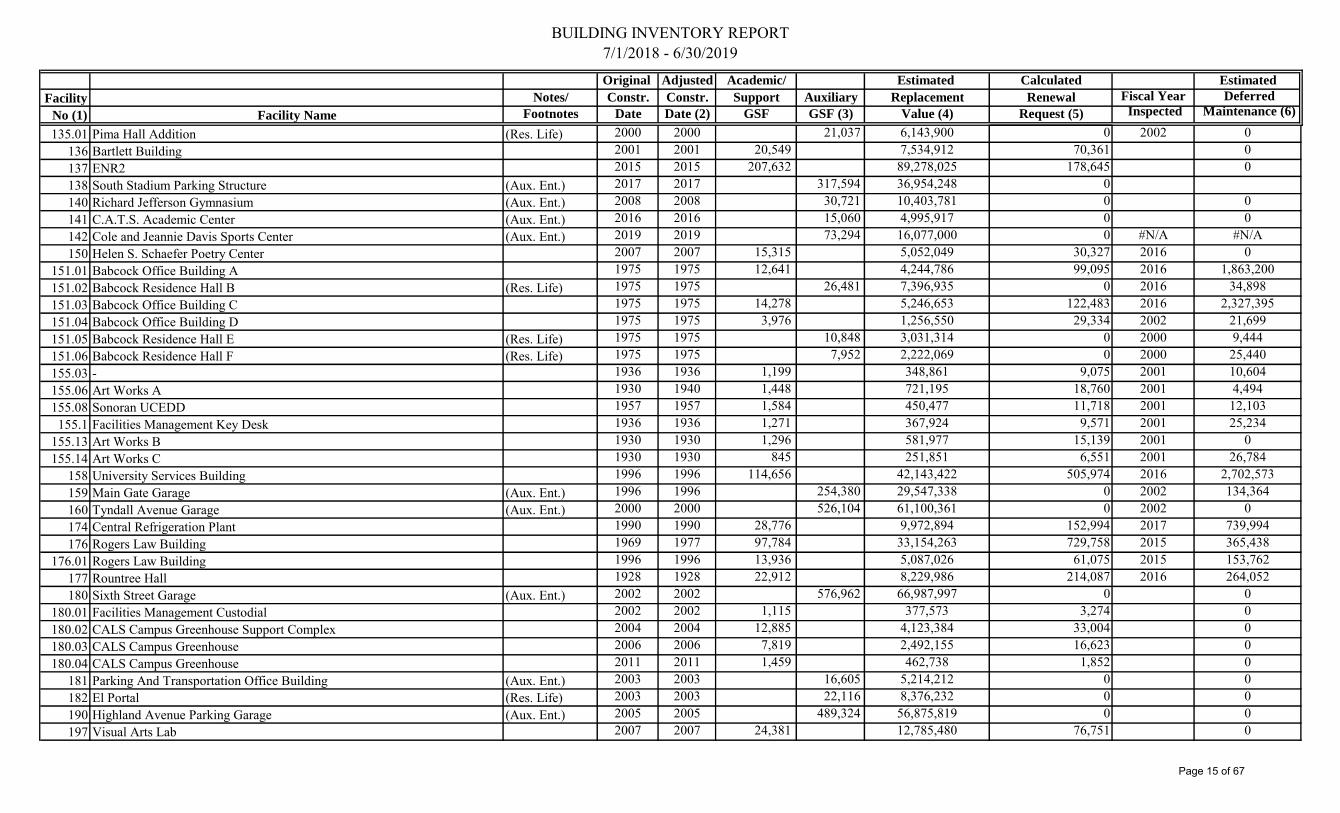
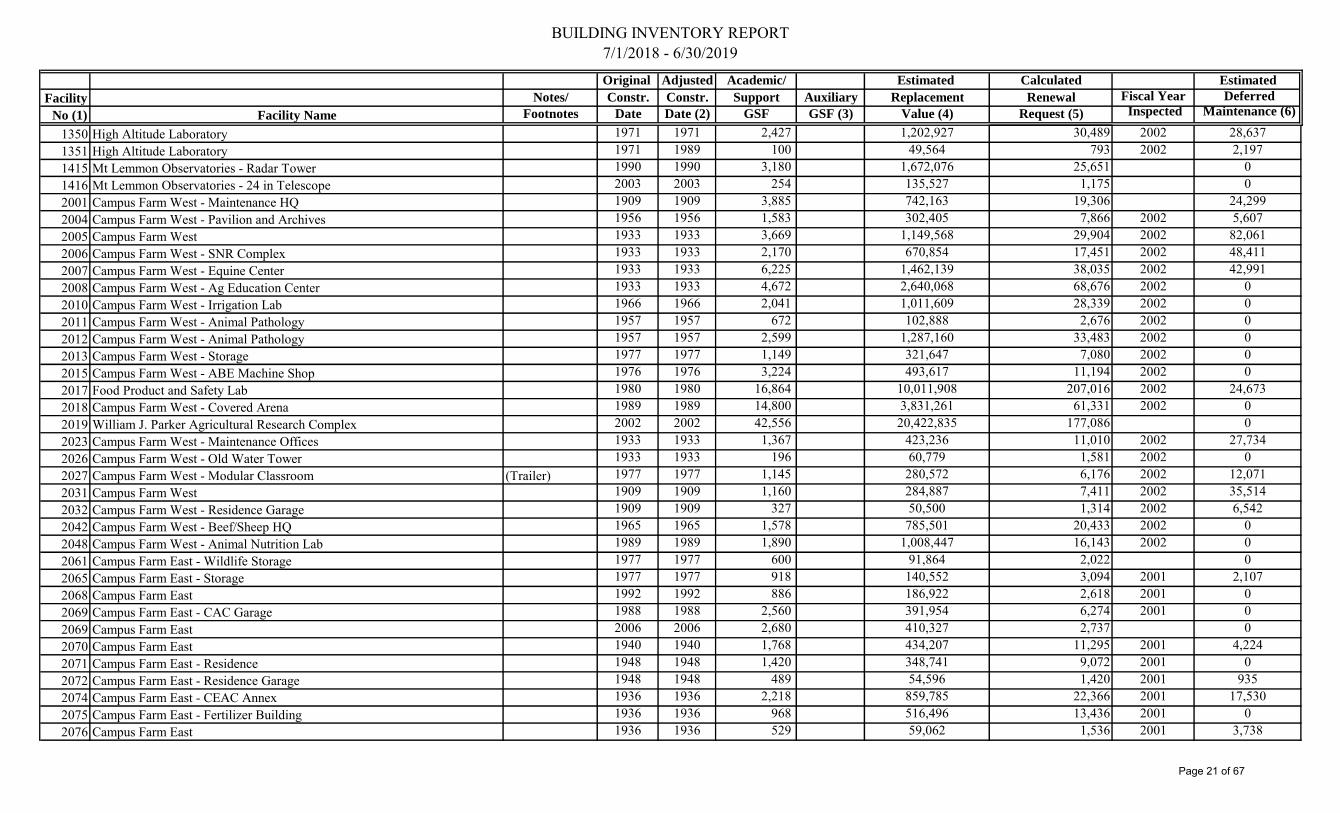
BUILDING INVENTORY REPORT7/1/2018 - 6/30/2019Original Adjusted Academic/ Estimated Calculated Estimated
Facility Notes/ Constr. Constr. Support Auxiliary Replacement Renewal Fiscal Year Deferred
No (1) Facility Name Footnotes Date Date (2) GSF GSF (3) Value (4) Request (5) Inspected Maintenance (6)
2 Art Building & Art Museum 1957 1962 71,382 42,186,562 1,097,399 2015 7,157,4812.01 Art Building Addition 1992 1992 21,924 10,132,092 141,920 2016 464,719
3 Drama 1956 1956 29,081 18,863,220 490,689 2015 1,985,7723.01 Drama Addition 1992 1992 61,116 39,423,871 552,210 2016 1,469,917
4 Fred Fox School of Music 1957 1966 59,611 35,308,562 989,134 2015 3,046,8674.01 Fred Fox School of Music Addition 1992 1992 53,236 22,790,747 319,230 2016 944,794
5 Coconino Residence Hall (Res. Life) 1954 1954 29,568 8,209,235 0 2002 339,6466 Slonaker House 1940 1950 10,821 3,555,130 92,480 2016 845,6627 Manzanita Residence Hall (Res. Life) 1956 1956 44,046 12,077,695 0 1999 136,052
7.01 Mohave Residence Hall (Res. Life) 1956 1956 42,043 11,554,693 0 1999 138,3478 Gila Residence Hall (R.L.-Historic) 1937 1937 39,421 10,695,734 0 2002 368,3689 Maricopa Residence Hall (R.L.-Historic) 1921 1922 33,410 9,591,220 0 2002 4,217
10 Yuma Residence Hall (R.L.-Historic) 1937 1937 40,195 10,962,988 0 2002 76,48611 Harshbarger Building 1958 1959 74,211 38,504,143 1,001,608 2017 8,029,32912 Mines And Metallurgy 1939 1944 39,495 21,881,889 569,214 2017 6,300,09514 Transitional Office Building 1939 1944 10,561 3,938,379 102,449 2016 736,73317 Student Union Memorial Center (7)(Aux./Acad.) 2001 2002 1,225 243,810 114,713,517 4,973 2002 019 Student Union Memorial Center - Bookstore (8)(Aux./Acad.) 2001 2002 39,781 113,223 52,549,630 118,471 2002 020 Engineering (Historic) 1919 1960 65,064 34,038,531 885,444 1998 6,309,27021 Old Main (Historic) 1891 1980 55,827 19,191,817 396,829 2017 146,53023 Chavez Building 1952 1952 59,932 22,260,540 579,063 2015 5,431,85024 Center For English As A Second Language (Historic) 1936 1945 19,547 5,985,795 155,708 2015 1,647,70025 Communication (Historic) 1909 1957 26,629 10,416,061 270,953 2015 2,513,84926 Arizona State Museum North (Historic) 1934 1934 122,191 57,679,189 1,500,409 2014 10,291,54827 Social Sciences 1950 1950 80,346 28,511,250 741,663 2014 5,186,02628 Douglass (Historic) 1904 1967 20,502 8,337,125 227,995 2015 2,135,77229 Centennial Hall (Historic) 1936 1985 85,881 39,116,547 704,450 2016 10,414,39230 Arizona State Museum South (Historic) 1936 1962 27,380 13,646,914 354,997 2014 2,127,218
30.01 Haury Anthropology Building 1962 1962 38,906 19,453,700 506,049 2016 943,10131 Cochise Residence Hall (R.L.-Historic) 1921 1921 43,714 12,234,740 0 2002 45,42532 South Hall (Historic) 1912 1987 14,793 4,155,379 69,291 2015 1,448,68133 Saguaro Hall 1959 1959 43,859 21,668,587 563,665 2015 2,656,60934 Yavapai Residence Hall (Res. Life) 1942 1942 40,453 11,257,399 0 2002 258,47735 Herring Hall (Historic) 1903 2004 7,774 3,930,237 31,458 2015 80,55736 Forbes (Historic) 1915 1963 77,403 38,645,860 1,005,295 2017 6,490,44337 Marvel Laboratories Of Chemistry 1973 1973 63,108 40,568,605 974,133 2014 2,230,062
Page 10 of 67
BUILDING INVENTORY REPORT7/1/2018 - 6/30/2019Original Adjusted Academic/ Estimated Calculated Estimated
Facility Notes/ Constr. Constr. Support Auxiliary Replacement Renewal Fiscal Year Deferred
No (1) Facility Name Footnotes Date Date (2) GSF GSF (3) Value (4) Request (5) Inspected Maintenance (6)
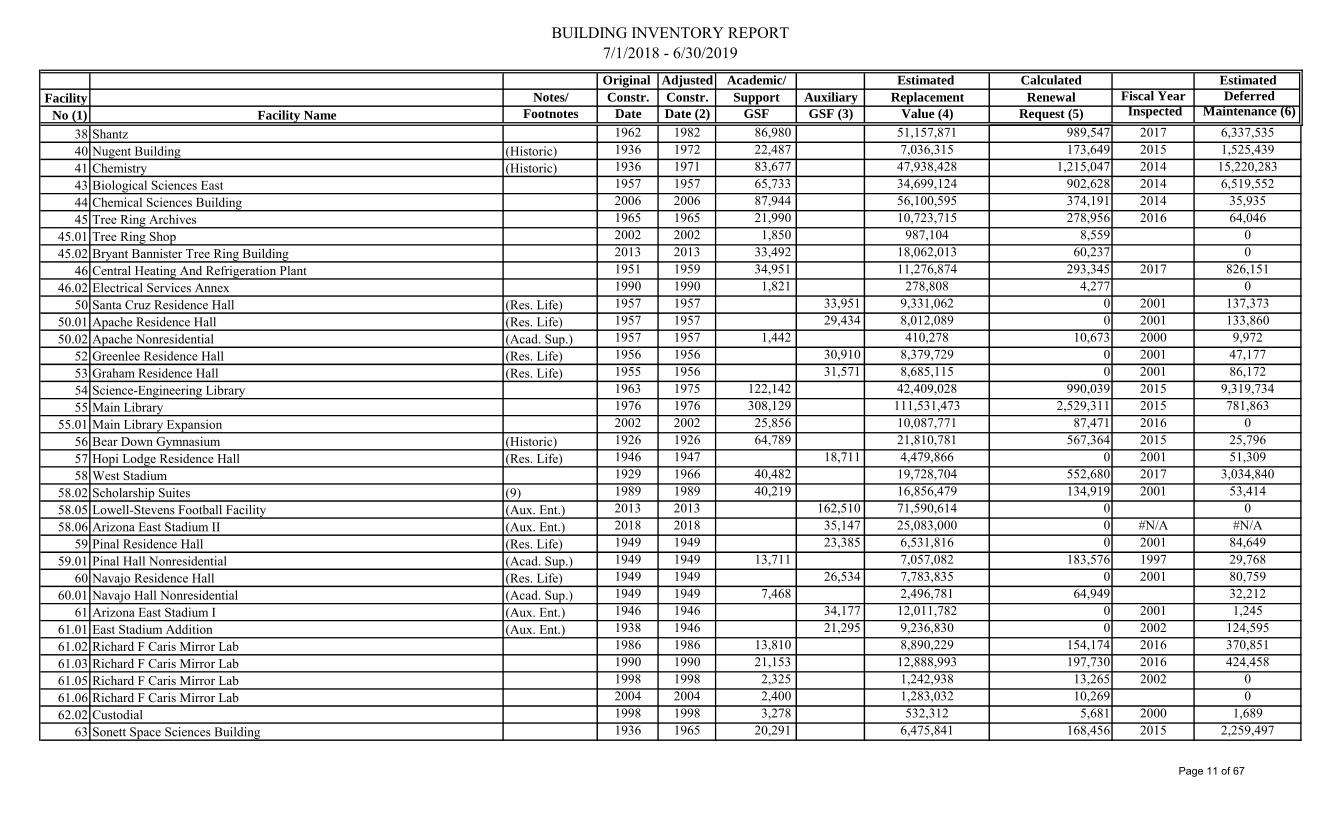
38 Shantz 1962 1982 86,980 51,157,871 989,547 2017 6,337,53540 Nugent Building (Historic) 1936 1972 22,487 7,036,315 173,649 2015 1,525,43941 Chemistry (Historic) 1936 1971 83,677 47,938,428 1,215,047 2014 15,220,28343 Biological Sciences East 1957 1957 65,733 34,699,124 902,628 2014 6,519,55244 Chemical Sciences Building 2006 2006 87,944 56,100,595 374,191 2014 35,93545 Tree Ring Archives 1965 1965 21,990 10,723,715 278,956 2016 64,046
45.01 Tree Ring Shop 2002 2002 1,850 987,104 8,559 045.02 Bryant Bannister Tree Ring Building 2013 2013 33,492 18,062,013 60,237 0
46 Central Heating And Refrigeration Plant 1951 1959 34,951 11,276,874 293,345 2017 826,15146.02 Electrical Services Annex 1990 1990 1,821 278,808 4,277 0
50 Santa Cruz Residence Hall (Res. Life) 1957 1957 33,951 9,331,062 0 2001 137,37350.01 Apache Residence Hall (Res. Life) 1957 1957 29,434 8,012,089 0 2001 133,86050.02 Apache Nonresidential (Acad. Sup.) 1957 1957 1,442 410,278 10,673 2000 9,972
52 Greenlee Residence Hall (Res. Life) 1956 1956 30,910 8,379,729 0 2001 47,17753 Graham Residence Hall (Res. Life) 1955 1956 31,571 8,685,115 0 2001 86,17254 Science-Engineering Library 1963 1975 122,142 42,409,028 990,039 2015 9,319,73455 Main Library 1976 1976 308,129 111,531,473 2,529,311 2015 781,863
55.01 Main Library Expansion 2002 2002 25,856 10,087,771 87,471 2016 056 Bear Down Gymnasium (Historic) 1926 1926 64,789 21,810,781 567,364 2015 25,79657 Hopi Lodge Residence Hall (Res. Life) 1946 1947 18,711 4,479,866 0 2001 51,30958 West Stadium 1929 1966 40,482 19,728,704 552,680 2017 3,034,840
58.02 Scholarship Suites (9) 1989 1989 40,219 16,856,479 134,919 2001 53,41458.05 Lowell-Stevens Football Facility (Aux. Ent.) 2013 2013 162,510 71,590,614 0 058.06 Arizona East Stadium II (Aux. Ent.) 2018 2018 35,147 25,083,000 0 #N/A #N/A
59 Pinal Residence Hall (Res. Life) 1949 1949 23,385 6,531,816 0 2001 84,64959.01 Pinal Hall Nonresidential (Acad. Sup.) 1949 1949 13,711 7,057,082 183,576 1997 29,768
60 Navajo Residence Hall (Res. Life) 1949 1949 26,534 7,783,835 0 2001 80,75960.01 Navajo Hall Nonresidential (Acad. Sup.) 1949 1949 7,468 2,496,781 64,949 32,212
61 Arizona East Stadium I (Aux. Ent.) 1946 1946 34,177 12,011,782 0 2001 1,24561.01 East Stadium Addition (Aux. Ent.) 1938 1946 21,295 9,236,830 0 2002 124,59561.02 Richard F Caris Mirror Lab 1986 1986 13,810 8,890,229 154,174 2016 370,85161.03 Richard F Caris Mirror Lab 1990 1990 21,153 12,888,993 197,730 2016 424,45861.05 Richard F Caris Mirror Lab 1998 1998 2,325 1,242,938 13,265 2002 061.06 Richard F Caris Mirror Lab 2004 2004 2,400 1,283,032 10,269 062.02 Custodial 1998 1998 3,278 532,312 5,681 2000 1,689
63 Sonett Space Sciences Building 1936 1965 20,291 6,475,841 168,456 2015 2,259,497
Page 11 of 67

BUILDING INVENTORY REPORT7/1/2018 - 6/30/2019Original Adjusted Academic/ Estimated Calculated Estimated
Facility Notes/ Constr. Constr. Support Auxiliary Replacement Renewal Fiscal Year Deferred
No (1) Facility Name Footnotes Date Date (2) GSF GSF (3) Value (4) Request (5) Inspected Maintenance (6)
63.01 Sonett Space Sciences Building 1989 1989 13,120 4,810,593 77,008 2016 1,183,78464 Steward Observatory Annex 1953 1953 5,674 2,207,305 57,419 2016 393,579
64.01 Steward Observatory Temporary Modular Building 1921 1921 1,440 391,926 10,195 065 Steward Observatory (Historic) 1921 1964 22,144 8,891,961 231,307 2016 3,253,709
65.01 Steward Observatory Addition 1985 1985 57,476 30,782,127 554,355 2016 1,865,28365.02 Steward Observatory Expansion 1991 1991 41,020 16,999,669 249,453 2016 1,318,53865.03 Steward Observatory Exp I 2000 2000 8,467 3,119,337 31,209 2016 247,412
66 Administration 1966 1966 61,081 22,986,410 643,941 2015 4,014,67067 Modern Languages 1966 1966 130,287 47,701,388 1,336,307 2015 6,416,72068 Psychology 1968 1968 84,870 45,782,969 1,221,490 2014 4,001,41969 Education 1964 1970 121,986 48,131,960 1,219,953 2015 4,318,46170 Pacheco Integrated Learning Center 2002 2002 85,944 30,992,595 268,737 2017 252,24171 Speech And Hearing Sciences 1952 1965 48,326 20,973,383 545,581 2016 3,279,80772 Civil Engineering 1965 1966 61,197 33,557,991 940,094 2014 4,193,17573 CCIT 1967 1967 51,285 18,929,150 517,655 2015 1,365,783
73.01 CCIT Addition 1988 1988 41,285 14,290,603 228,764 2017 71,17274 SBS 1st Street Annex 1969 1969 8,839 2,894,875 75,304 2016 500,05675 CAPLA - West 1965 1968 38,168 21,633,522 577,182 2015 1,288,621
75.01 CAPLA - East 2007 2007 41,088 19,906,417 119,498 2015 1,935,54376 Harvill Building 1979 1981 92,052 33,946,899 679,277 2014 1,432,05777 Gould-Simpson 1985 1985 228,089 132,888,846 2,393,195 2014 4,622,34878 McClelland Park 2008 2008 71,386 26,489,301 159,015 2017 079 Huachuca Residence Hall (Res. Life) 1956 1957 33,863 9,562,097 0 2000 142,742
79.01 Kaibab Residence Hall (Res. Life) 1958 1958 36,318 10,078,832 0 2000 152,94279.02 Kaibab Hall Nonresidential (Acad. Sup.) 1958 1958 1,576 636,768 16,564 1997 10,62479.03 Huachuca Hall Nonresidential (Acad. Sup.) 1958 1958 2,617 794,161 20,658 1998 0
81 Physics-Atmospheric Sciences 1960 1968 133,848 77,702,343 2,073,099 2014 9,598,92282 Facilities Management Elevator Shop 1959 1959 3,253 1,027,349 26,724 2002 9,96883 Sonora Residence Hall (Res. Life) 1962 1963 65,536 18,779,431 0 2000 100,87284 Arizona Residence Hall (Res. Life) 1963 1964 62,367 17,851,917 0 2000 280,66585 Coronado Residence Hall (Res. Life) 1965 1965 147,356 42,659,985 0 2000 846,311
85.01 La Aldea (Res. Life) 2003 2003 184,446 55,627,299 0 086.02 Archive Of Visual Arts 1946 1946 6,970 1,389,737 36,151 2017 99,43186.03 TBA 1928 1928 1,229 429,752 11,179 1997 32,62086.06 TBA (Leased Out) 1952 1952 377 116,601 0 0 086.07 TBA (Leased Out) 1957 1957 1,476 419,658 0 0 0
Page 12 of 67
BUILDING INVENTORY REPORT7/1/2018 - 6/30/2019Original Adjusted Academic/ Estimated Calculated Estimated
Facility Notes/ Constr. Constr. Support Auxiliary Replacement Renewal Fiscal Year Deferred
No (1) Facility Name Footnotes Date Date (2) GSF GSF (3) Value (4) Request (5) Inspected Maintenance (6)
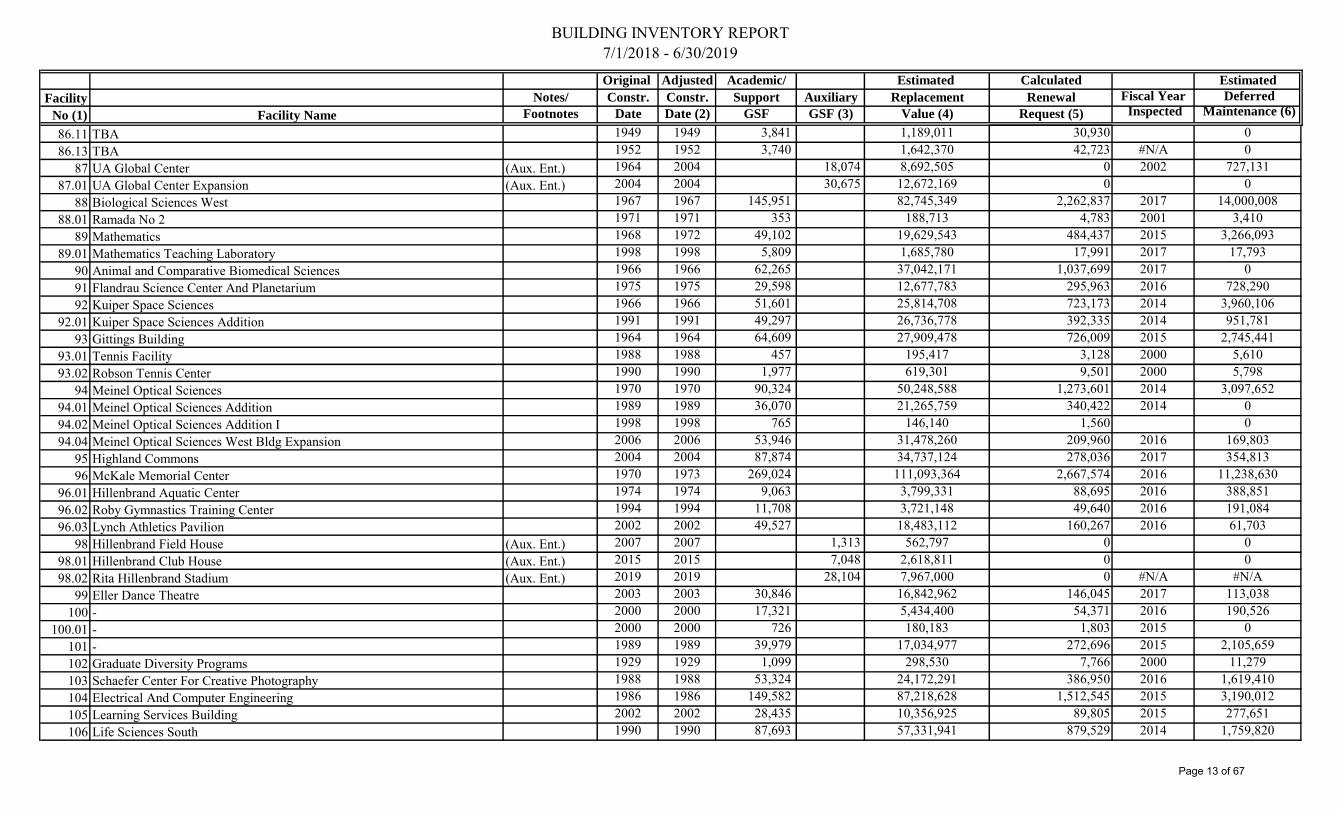
86.11 TBA 1949 1949 3,841 1,189,011 30,930 086.13 TBA 1952 1952 3,740 1,642,370 42,723 #N/A 0
87 UA Global Center (Aux. Ent.) 1964 2004 18,074 8,692,505 0 2002 727,13187.01 UA Global Center Expansion (Aux. Ent.) 2004 2004 30,675 12,672,169 0 0
88 Biological Sciences West 1967 1967 145,951 82,745,349 2,262,837 2017 14,000,00888.01 Ramada No 2 1971 1971 353 188,713 4,783 2001 3,410
89 Mathematics 1968 1972 49,102 19,629,543 484,437 2015 3,266,09389.01 Mathematics Teaching Laboratory 1998 1998 5,809 1,685,780 17,991 2017 17,793
90 Animal and Comparative Biomedical Sciences 1966 1966 62,265 37,042,171 1,037,699 2017 091 Flandrau Science Center And Planetarium 1975 1975 29,598 12,677,783 295,963 2016 728,29092 Kuiper Space Sciences 1966 1966 51,601 25,814,708 723,173 2014 3,960,106
92.01 Kuiper Space Sciences Addition 1991 1991 49,297 26,736,778 392,335 2014 951,78193 Gittings Building 1964 1964 64,609 27,909,478 726,009 2015 2,745,441
93.01 Tennis Facility 1988 1988 457 195,417 3,128 2000 5,61093.02 Robson Tennis Center 1990 1990 1,977 619,301 9,501 2000 5,798
94 Meinel Optical Sciences 1970 1970 90,324 50,248,588 1,273,601 2014 3,097,65294.01 Meinel Optical Sciences Addition 1989 1989 36,070 21,265,759 340,422 2014 094.02 Meinel Optical Sciences Addition I 1998 1998 765 146,140 1,560 094.04 Meinel Optical Sciences West Bldg Expansion 2006 2006 53,946 31,478,260 209,960 2016 169,803
95 Highland Commons 2004 2004 87,874 34,737,124 278,036 2017 354,81396 McKale Memorial Center 1970 1973 269,024 111,093,364 2,667,574 2016 11,238,630
96.01 Hillenbrand Aquatic Center 1974 1974 9,063 3,799,331 88,695 2016 388,85196.02 Roby Gymnastics Training Center 1994 1994 11,708 3,721,148 49,640 2016 191,08496.03 Lynch Athletics Pavilion 2002 2002 49,527 18,483,112 160,267 2016 61,703
98 Hillenbrand Field House (Aux. Ent.) 2007 2007 1,313 562,797 0 098.01 Hillenbrand Club House (Aux. Ent.) 2015 2015 7,048 2,618,811 0 098.02 Rita Hillenbrand Stadium (Aux. Ent.) 2019 2019 28,104 7,967,000 0 #N/A #N/A
99 Eller Dance Theatre 2003 2003 30,846 16,842,962 146,045 2017 113,038100 - 2000 2000 17,321 5,434,400 54,371 2016 190,526
100.01 - 2000 2000 726 180,183 1,803 2015 0101 - 1989 1989 39,979 17,034,977 272,696 2015 2,105,659102 Graduate Diversity Programs 1929 1929 1,099 298,530 7,766 2000 11,279103 Schaefer Center For Creative Photography 1988 1988 53,324 24,172,291 386,950 2016 1,619,410104 Electrical And Computer Engineering 1986 1986 149,582 87,218,628 1,512,545 2015 3,190,012105 Learning Services Building 2002 2002 28,435 10,356,925 89,805 2015 277,651106 Life Sciences South 1990 1990 87,693 57,331,941 879,529 2014 1,759,820
Page 13 of 67
BUILDING INVENTORY REPORT7/1/2018 - 6/30/2019Original Adjusted Academic/ Estimated Calculated Estimated
Facility Notes/ Constr. Constr. Support Auxiliary Replacement Renewal Fiscal Year Deferred
No (1) Facility Name Footnotes Date Date (2) GSF GSF (3) Value (4) Request (5) Inspected Maintenance (6)
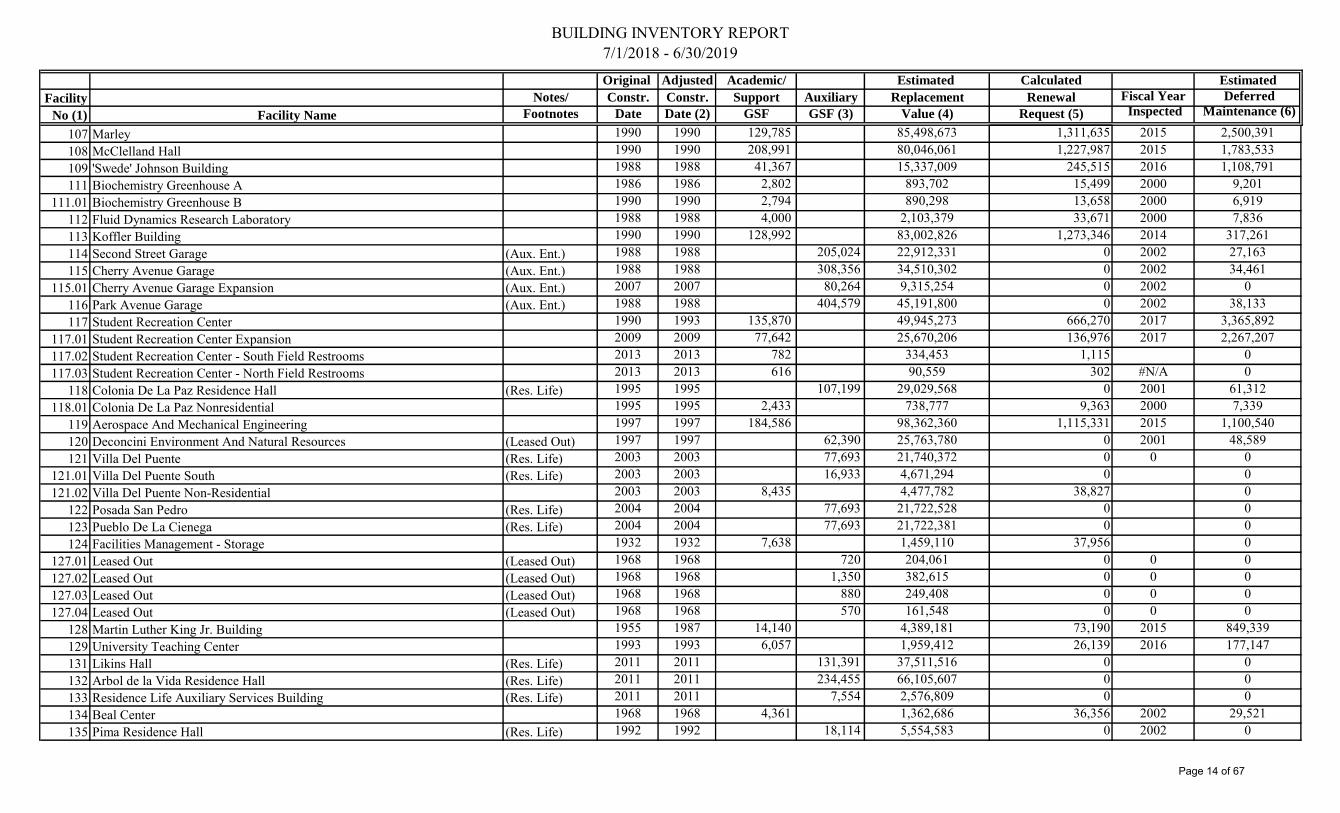
107 Marley 1990 1990 129,785 85,498,673 1,311,635 2015 2,500,391108 McClelland Hall 1990 1990 208,991 80,046,061 1,227,987 2015 1,783,533109 'Swede' Johnson Building 1988 1988 41,367 15,337,009 245,515 2016 1,108,791111 Biochemistry Greenhouse A 1986 1986 2,802 893,702 15,499 2000 9,201
111.01 Biochemistry Greenhouse B 1990 1990 2,794 890,298 13,658 2000 6,919112 Fluid Dynamics Research Laboratory 1988 1988 4,000 2,103,379 33,671 2000 7,836113 Koffler Building 1990 1990 128,992 83,002,826 1,273,346 2014 317,261114 Second Street Garage (Aux. Ent.) 1988 1988 205,024 22,912,331 0 2002 27,163115 Cherry Avenue Garage (Aux. Ent.) 1988 1988 308,356 34,510,302 0 2002 34,461
115.01 Cherry Avenue Garage Expansion (Aux. Ent.) 2007 2007 80,264 9,315,254 0 2002 0116 Park Avenue Garage (Aux. Ent.) 1988 1988 404,579 45,191,800 0 2002 38,133117 Student Recreation Center 1990 1993 135,870 49,945,273 666,270 2017 3,365,892
117.01 Student Recreation Center Expansion 2009 2009 77,642 25,670,206 136,976 2017 2,267,207117.02 Student Recreation Center - South Field Restrooms 2013 2013 782 334,453 1,115 0117.03 Student Recreation Center - North Field Restrooms 2013 2013 616 90,559 302 #N/A 0
118 Colonia De La Paz Residence Hall (Res. Life) 1995 1995 107,199 29,029,568 0 2001 61,312118.01 Colonia De La Paz Nonresidential 1995 1995 2,433 738,777 9,363 2000 7,339
119 Aerospace And Mechanical Engineering 1997 1997 184,586 98,362,360 1,115,331 2015 1,100,540120 Deconcini Environment And Natural Resources (Leased Out) 1997 1997 62,390 25,763,780 0 2001 48,589121 Villa Del Puente (Res. Life) 2003 2003 77,693 21,740,372 0 0 0
121.01 Villa Del Puente South (Res. Life) 2003 2003 16,933 4,671,294 0 0121.02 Villa Del Puente Non-Residential 2003 2003 8,435 4,477,782 38,827 0
122 Posada San Pedro (Res. Life) 2004 2004 77,693 21,722,528 0 0123 Pueblo De La Cienega (Res. Life) 2004 2004 77,693 21,722,381 0 0124 Facilities Management - Storage 1932 1932 7,638 1,459,110 37,956 0
127.01 Leased Out (Leased Out) 1968 1968 720 204,061 0 0 0127.02 Leased Out (Leased Out) 1968 1968 1,350 382,615 0 0 0127.03 Leased Out (Leased Out) 1968 1968 880 249,408 0 0 0127.04 Leased Out (Leased Out) 1968 1968 570 161,548 0 0 0
128 Martin Luther King Jr. Building 1955 1987 14,140 4,389,181 73,190 2015 849,339129 University Teaching Center 1993 1993 6,057 1,959,412 26,139 2016 177,147131 Likins Hall (Res. Life) 2011 2011 131,391 37,511,516 0 0132 Arbol de la Vida Residence Hall (Res. Life) 2011 2011 234,455 66,105,607 0 0133 Residence Life Auxiliary Services Building (Res. Life) 2011 2011 7,554 2,576,809 0 0134 Beal Center 1968 1968 4,361 1,362,686 36,356 2002 29,521135 Pima Residence Hall (Res. Life) 1992 1992 18,114 5,554,583 0 2002 0
Page 14 of 67
BUILDING INVENTORY REPORT7/1/2018 - 6/30/2019Original Adjusted Academic/ Estimated Calculated Estimated
Facility Notes/ Constr. Constr. Support Auxiliary Replacement Renewal Fiscal Year Deferred
No (1) Facility Name Footnotes Date Date (2) GSF GSF (3) Value (4) Request (5) Inspected Maintenance (6)
135.01 Pima Hall Addition (Res. Life) 2000 2000 21,037 6,143,900 0 2002 0136 Bartlett Building 2001 2001 20,549 7,534,912 70,361 0137 ENR2 2015 2015 207,632 89,278,025 178,645 0138 South Stadium Parking Structure (Aux. Ent.) 2017 2017 317,594 36,954,248 0140 Richard Jefferson Gymnasium (Aux. Ent.) 2008 2008 30,721 10,403,781 0 0141 C.A.T.S. Academic Center (Aux. Ent.) 2016 2016 15,060 4,995,917 0 0142 Cole and Jeannie Davis Sports Center (Aux. Ent.) 2019 2019 73,294 16,077,000 0 #N/A #N/A150 Helen S. Schaefer Poetry Center 2007 2007 15,315 5,052,049 30,327 2016 0
151.01 Babcock Office Building A 1975 1975 12,641 4,244,786 99,095 2016 1,863,200151.02 Babcock Residence Hall B (Res. Life) 1975 1975 26,481 7,396,935 0 2016 34,898151.03 Babcock Office Building C 1975 1975 14,278 5,246,653 122,483 2016 2,327,395151.04 Babcock Office Building D 1975 1975 3,976 1,256,550 29,334 2002 21,699151.05 Babcock Residence Hall E (Res. Life) 1975 1975 10,848 3,031,314 0 2000 9,444151.06 Babcock Residence Hall F (Res. Life) 1975 1975 7,952 2,222,069 0 2000 25,440155.03 - 1936 1936 1,199 348,861 9,075 2001 10,604155.06 Art Works A 1930 1940 1,448 721,195 18,760 2001 4,494155.08 Sonoran UCEDD 1957 1957 1,584 450,477 11,718 2001 12,103
155.1 Facilities Management Key Desk 1936 1936 1,271 367,924 9,571 2001 25,234155.13 Art Works B 1930 1930 1,296 581,977 15,139 2001 0155.14 Art Works C 1930 1930 845 251,851 6,551 2001 26,784
158 University Services Building 1996 1996 114,656 42,143,422 505,974 2016 2,702,573159 Main Gate Garage (Aux. Ent.) 1996 1996 254,380 29,547,338 0 2002 134,364160 Tyndall Avenue Garage (Aux. Ent.) 2000 2000 526,104 61,100,361 0 2002 0174 Central Refrigeration Plant 1990 1990 28,776 9,972,894 152,994 2017 739,994176 Rogers Law Building 1969 1977 97,784 33,154,263 729,758 2015 365,438
176.01 Rogers Law Building 1996 1996 13,936 5,087,026 61,075 2015 153,762177 Rountree Hall 1928 1928 22,912 8,229,986 214,087 2016 264,052180 Sixth Street Garage (Aux. Ent.) 2002 2002 576,962 66,987,997 0 0
180.01 Facilities Management Custodial 2002 2002 1,115 377,573 3,274 0180.02 CALS Campus Greenhouse Support Complex 2004 2004 12,885 4,123,384 33,004 0180.03 CALS Campus Greenhouse 2006 2006 7,819 2,492,155 16,623 0180.04 CALS Campus Greenhouse 2011 2011 1,459 462,738 1,852 0
181 Parking And Transportation Office Building (Aux. Ent.) 2003 2003 16,605 5,214,212 0 0182 El Portal (Res. Life) 2003 2003 22,116 8,376,232 0 0190 Highland Avenue Parking Garage (Aux. Ent.) 2005 2005 489,324 56,875,819 0 0197 Visual Arts Lab 2007 2007 24,381 12,785,480 76,751 0
Page 15 of 67
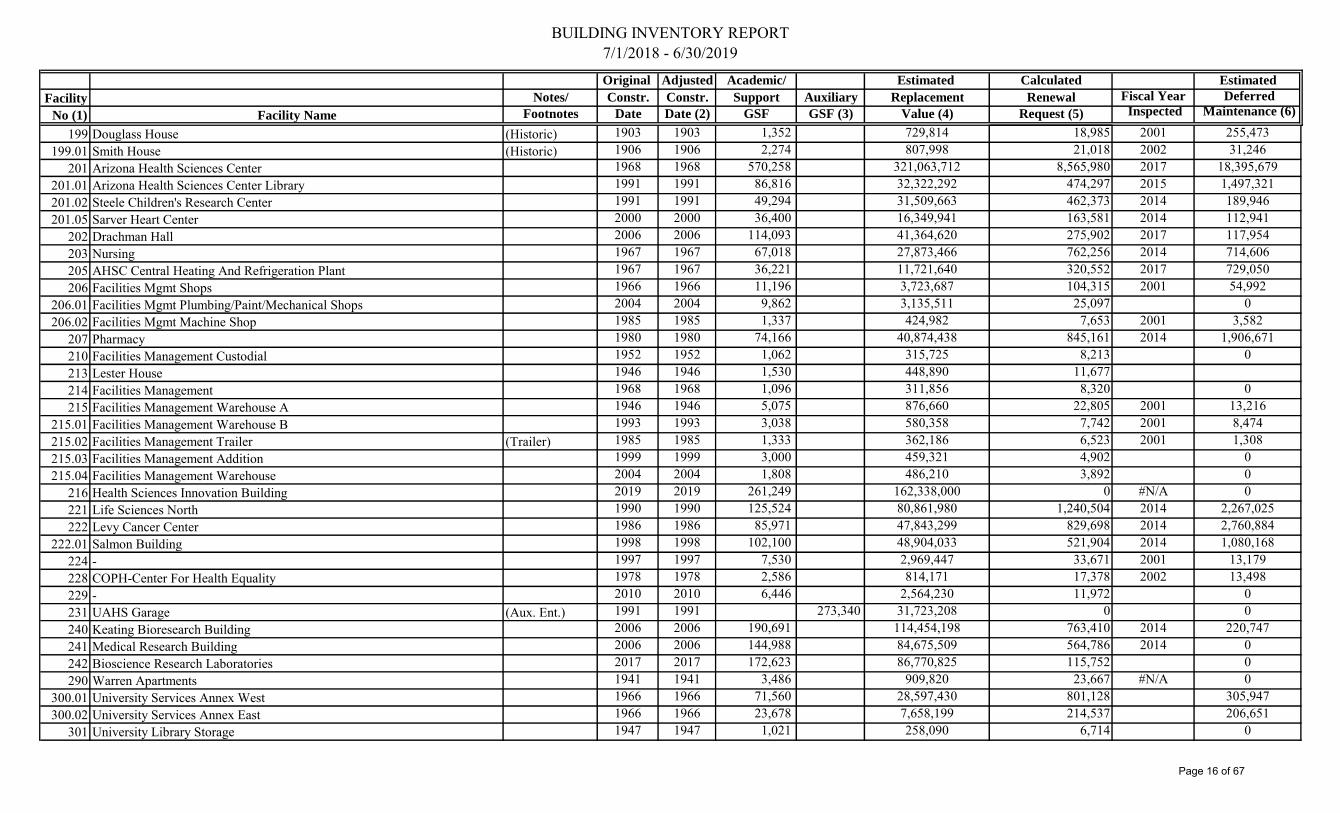
BUILDING INVENTORY REPORT7/1/2018 - 6/30/2019Original Adjusted Academic/ Estimated Calculated Estimated
Facility Notes/ Constr. Constr. Support Auxiliary Replacement Renewal Fiscal Year Deferred
No (1) Facility Name Footnotes Date Date (2) GSF GSF (3) Value (4) Request (5) Inspected Maintenance (6)
199 Douglass House (Historic) 1903 1903 1,352 729,814 18,985 2001 255,473199.01 Smith House (Historic) 1906 1906 2,274 807,998 21,018 2002 31,246
201 Arizona Health Sciences Center 1968 1968 570,258 321,063,712 8,565,980 2017 18,395,679201.01 Arizona Health Sciences Center Library 1991 1991 86,816 32,322,292 474,297 2015 1,497,321201.02 Steele Children's Research Center 1991 1991 49,294 31,509,663 462,373 2014 189,946201.05 Sarver Heart Center 2000 2000 36,400 16,349,941 163,581 2014 112,941
202 Drachman Hall 2006 2006 114,093 41,364,620 275,902 2017 117,954203 Nursing 1967 1967 67,018 27,873,466 762,256 2014 714,606205 AHSC Central Heating And Refrigeration Plant 1967 1967 36,221 11,721,640 320,552 2017 729,050206 Facilities Mgmt Shops 1966 1966 11,196 3,723,687 104,315 2001 54,992
206.01 Facilities Mgmt Plumbing/Paint/Mechanical Shops 2004 2004 9,862 3,135,511 25,097 0206.02 Facilities Mgmt Machine Shop 1985 1985 1,337 424,982 7,653 2001 3,582
207 Pharmacy 1980 1980 74,166 40,874,438 845,161 2014 1,906,671210 Facilities Management Custodial 1952 1952 1,062 315,725 8,213 0213 Lester House 1946 1946 1,530 448,890 11,677214 Facilities Management 1968 1968 1,096 311,856 8,320 0215 Facilities Management Warehouse A 1946 1946 5,075 876,660 22,805 2001 13,216
215.01 Facilities Management Warehouse B 1993 1993 3,038 580,358 7,742 2001 8,474215.02 Facilities Management Trailer (Trailer) 1985 1985 1,333 362,186 6,523 2001 1,308215.03 Facilities Management Addition 1999 1999 3,000 459,321 4,902 0215.04 Facilities Management Warehouse 2004 2004 1,808 486,210 3,892 0
216 Health Sciences Innovation Building 2019 2019 261,249 162,338,000 0 #N/A 0221 Life Sciences North 1990 1990 125,524 80,861,980 1,240,504 2014 2,267,025222 Levy Cancer Center 1986 1986 85,971 47,843,299 829,698 2014 2,760,884
222.01 Salmon Building 1998 1998 102,100 48,904,033 521,904 2014 1,080,168224 - 1997 1997 7,530 2,969,447 33,671 2001 13,179228 COPH-Center For Health Equality 1978 1978 2,586 814,171 17,378 2002 13,498229 - 2010 2010 6,446 2,564,230 11,972 0231 UAHS Garage (Aux. Ent.) 1991 1991 273,340 31,723,208 0 0240 Keating Bioresearch Building 2006 2006 190,691 114,454,198 763,410 2014 220,747241 Medical Research Building 2006 2006 144,988 84,675,509 564,786 2014 0242 Bioscience Research Laboratories 2017 2017 172,623 86,770,825 115,752 0290 Warren Apartments 1941 1941 3,486 909,820 23,667 #N/A 0
300.01 University Services Annex West 1966 1966 71,560 28,597,430 801,128 305,947300.02 University Services Annex East 1966 1966 23,678 7,658,199 214,537 206,651
301 University Library Storage 1947 1947 1,021 258,090 6,714 0
Page 16 of 67
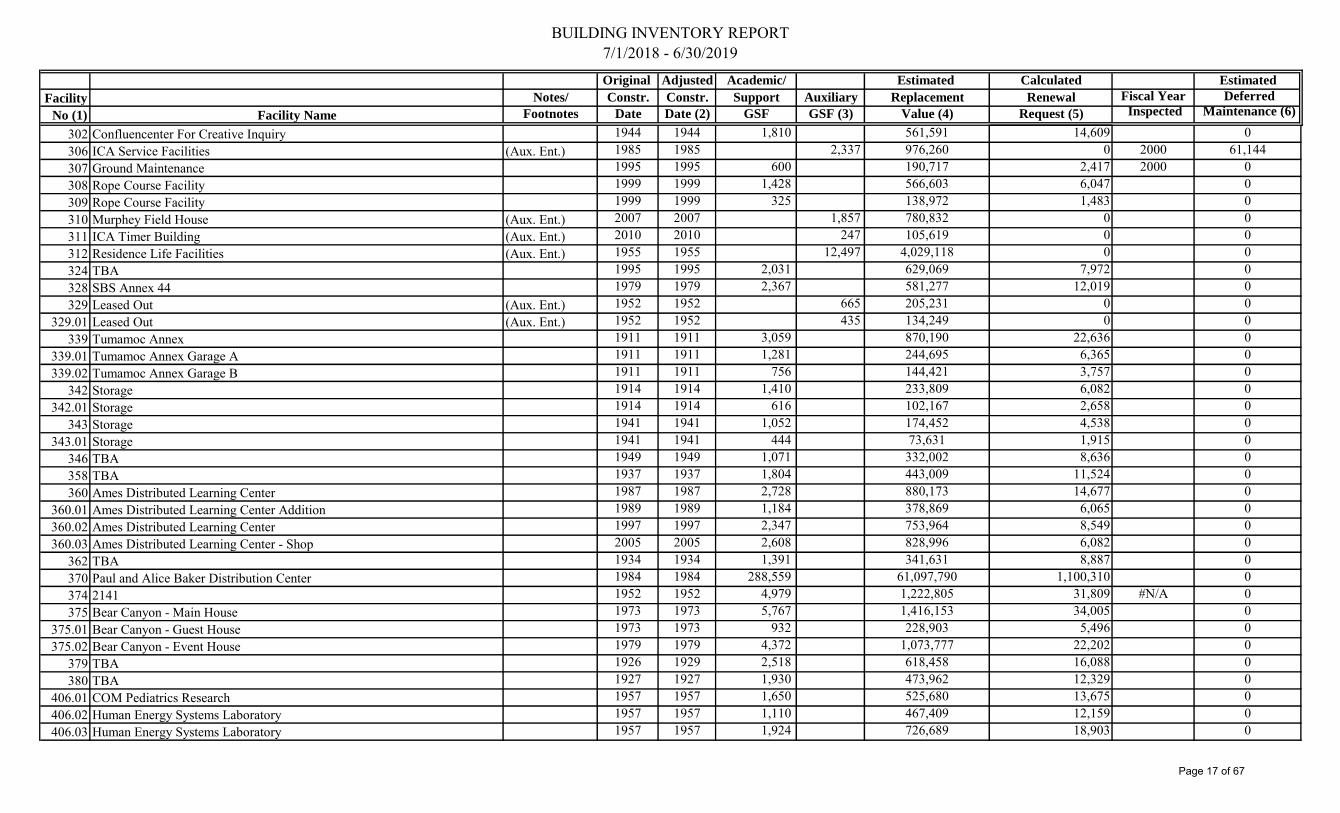
BUILDING INVENTORY REPORT7/1/2018 - 6/30/2019Original Adjusted Academic/ Estimated Calculated Estimated
Facility Notes/ Constr. Constr. Support Auxiliary Replacement Renewal Fiscal Year Deferred
No (1) Facility Name Footnotes Date Date (2) GSF GSF (3) Value (4) Request (5) Inspected Maintenance (6)
302 Confluencenter For Creative Inquiry 1944 1944 1,810 561,591 14,609 0306 ICA Service Facilities (Aux. Ent.) 1985 1985 2,337 976,260 0 2000 61,144307 Ground Maintenance 1995 1995 600 190,717 2,417 2000 0308 Rope Course Facility 1999 1999 1,428 566,603 6,047 0309 Rope Course Facility 1999 1999 325 138,972 1,483 0310 Murphey Field House (Aux. Ent.) 2007 2007 1,857 780,832 0 0311 ICA Timer Building (Aux. Ent.) 2010 2010 247 105,619 0 0312 Residence Life Facilities (Aux. Ent.) 1955 1955 12,497 4,029,118 0 0324 TBA 1995 1995 2,031 629,069 7,972 0328 SBS Annex 44 1979 1979 2,367 581,277 12,019 0329 Leased Out (Aux. Ent.) 1952 1952 665 205,231 0 0
329.01 Leased Out (Aux. Ent.) 1952 1952 435 134,249 0 0339 Tumamoc Annex 1911 1911 3,059 870,190 22,636 0
339.01 Tumamoc Annex Garage A 1911 1911 1,281 244,695 6,365 0339.02 Tumamoc Annex Garage B 1911 1911 756 144,421 3,757 0
342 Storage 1914 1914 1,410 233,809 6,082 0342.01 Storage 1914 1914 616 102,167 2,658 0
343 Storage 1941 1941 1,052 174,452 4,538 0343.01 Storage 1941 1941 444 73,631 1,915 0
346 TBA 1949 1949 1,071 332,002 8,636 0358 TBA 1937 1937 1,804 443,009 11,524 0360 Ames Distributed Learning Center 1987 1987 2,728 880,173 14,677 0
360.01 Ames Distributed Learning Center Addition 1989 1989 1,184 378,869 6,065 0360.02 Ames Distributed Learning Center 1997 1997 2,347 753,964 8,549 0360.03 Ames Distributed Learning Center - Shop 2005 2005 2,608 828,996 6,082 0
362 TBA 1934 1934 1,391 341,631 8,887 0370 Paul and Alice Baker Distribution Center 1984 1984 288,559 61,097,790 1,100,310 0374 2141 1952 1952 4,979 1,222,805 31,809 #N/A 0375 Bear Canyon - Main House 1973 1973 5,767 1,416,153 34,005 0
375.01 Bear Canyon - Guest House 1973 1973 932 228,903 5,496 0375.02 Bear Canyon - Event House 1979 1979 4,372 1,073,777 22,202 0
379 TBA 1926 1929 2,518 618,458 16,088 0380 TBA 1927 1927 1,930 473,962 12,329 0
406.01 COM Pediatrics Research 1957 1957 1,650 525,680 13,675 0406.02 Human Energy Systems Laboratory 1957 1957 1,110 467,409 12,159 0406.03 Human Energy Systems Laboratory 1957 1957 1,924 726,689 18,903 0
Page 17 of 67

BUILDING INVENTORY REPORT7/1/2018 - 6/30/2019Original Adjusted Academic/ Estimated Calculated Estimated
Facility Notes/ Constr. Constr. Support Auxiliary Replacement Renewal Fiscal Year Deferred
No (1) Facility Name Footnotes Date Date (2) GSF GSF (3) Value (4) Request (5) Inspected Maintenance (6)
406.05 COM Pediatrics Accounting 1957 1957 750 235,248 6,120 0406.06 College of Medicine Continuing Education 1957 1957 1,335 418,222 10,879 0
407 COM Pediatrics 1955 1955 1,387 441,013 11,472 0408 Native American Research & Training Center 1956 1956 2,625 853,251 22,196 2002 58,014
408.01 Enrollment Management Systems and Communication 1949 1949 1,618 471,406 12,263 1999 5,342409 Office For The Responsible Conduct Of Research 1998 1998 5,260 1,670,892 17,832 2017 191,084
409.01 Student Affairs Systems Group 1998 1998 6,415 2,092,304 22,329 2017 0413 Santa Rita House 1944 1944 1,860 540,172 14,052 0
414.02 TBA 1949 1949 1,334 425,674 11,073 0418 Mabel Storage 1957 1957 1,587 657,424 17,102 2001 29,395420 Esquire Apartments 1967 1969 24,089 8,740,826 227,375 2016 1,304,499
422.01 Storage 1917 1917 1,104 183,079 4,762 0425 AZ Area Health Education Center 1928 1928 2,496 772,891 20,105 2000 5,500428 Confucius Institute 1944 1944 2,467 711,615 18,511 1999 0429 Writing Skills Improvement Program Annex 1944 1944 1,193 310,307 8,072 1999 24,881
429.01 UA Bookstores-TFOB 1989 1989 1,150 312,288 4,999 2002 16,034437 Water Resources Research Center 1959 1959 8,221 2,693,359 70,062 1,302438 Women's Studies / SIROW 1966 1966 16,291 5,191,286 145,429 2016 309,798444 Education North 1966 1966 11,301 3,730,141 104,496 2017 48,846451 Arizona Mining & Mineral Museum 1921 1921 32,000 12,000,059 312,158454 TBA 1930 1930 760 265,754 6,913 2002 36,126
454.01 TBA 1919 1921 646 225,891 5,876 2000 3,164455 Facilities Management Administration 1983 1983 1,646 468,547 8,751 0
455.01 Facilities Management Administration 2001 2001 2,589 736,463 6,877 0456 Faculty Center 1936 1936 1,515 445,253 11,582 0457 Physiology 1935 1935 1,731 492,393 12,809 0460 Facilities Management 1988 1988 5,149 1,655,418 26,500 2000 21,187
460.01 Facilities Management Small Engine Shop 1955 1955 4,385 1,392,224 36,216 0461 Facilities Management Grounds Trailer 1998 1998 460 125,009 1,334 0
461.01 Facilities Management Grounds Building 2003 2003 603 203,574 1,765 0461.02 Facilities Management Grounds Storage 1991 1991 277 42,411 622 0
465 Facilities Management Grounds North 1975 1975 2,624 644,434 15,044 #N/A #N/A466 TBA 1929 1929 1,553 502,635 13,075 0470 Facilities Management Renovation Services 1955 1955 4,364 1,365,383 35,518 2017 11,513471 ARL Annex 1946 1946 889 252,874 6,578 1999 18,852
471.01 Law Annex II - Programs 1942 1942 1,505 443,427 11,535 2002 23,966
Page 18 of 67
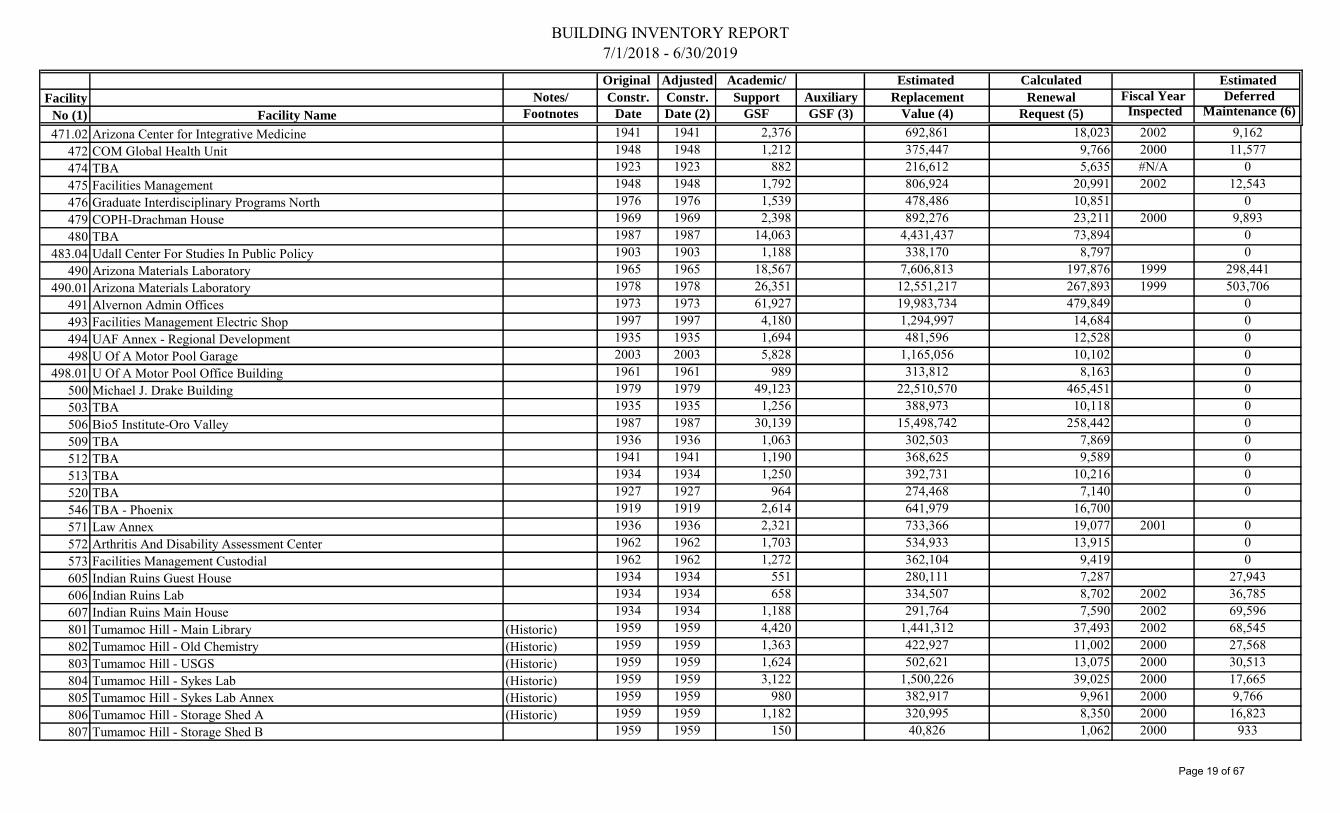
BUILDING INVENTORY REPORT7/1/2018 - 6/30/2019Original Adjusted Academic/ Estimated Calculated Estimated
Facility Notes/ Constr. Constr. Support Auxiliary Replacement Renewal Fiscal Year Deferred
No (1) Facility Name Footnotes Date Date (2) GSF GSF (3) Value (4) Request (5) Inspected Maintenance (6)
471.02 Arizona Center for Integrative Medicine 1941 1941 2,376 692,861 18,023 2002 9,162472 COM Global Health Unit 1948 1948 1,212 375,447 9,766 2000 11,577474 TBA 1923 1923 882 216,612 5,635 #N/A 0475 Facilities Management 1948 1948 1,792 806,924 20,991 2002 12,543476 Graduate Interdisciplinary Programs North 1976 1976 1,539 478,486 10,851 0479 COPH-Drachman House 1969 1969 2,398 892,276 23,211 2000 9,893480 TBA 1987 1987 14,063 4,431,437 73,894 0
483.04 Udall Center For Studies In Public Policy 1903 1903 1,188 338,170 8,797 0490 Arizona Materials Laboratory 1965 1965 18,567 7,606,813 197,876 1999 298,441
490.01 Arizona Materials Laboratory 1978 1978 26,351 12,551,217 267,893 1999 503,706491 Alvernon Admin Offices 1973 1973 61,927 19,983,734 479,849 0493 Facilities Management Electric Shop 1997 1997 4,180 1,294,997 14,684 0494 UAF Annex - Regional Development 1935 1935 1,694 481,596 12,528 0498 U Of A Motor Pool Garage 2003 2003 5,828 1,165,056 10,102 0
498.01 U Of A Motor Pool Office Building 1961 1961 989 313,812 8,163 0500 Michael J. Drake Building 1979 1979 49,123 22,510,570 465,451 0503 TBA 1935 1935 1,256 388,973 10,118 0506 Bio5 Institute-Oro Valley 1987 1987 30,139 15,498,742 258,442 0509 TBA 1936 1936 1,063 302,503 7,869 0512 TBA 1941 1941 1,190 368,625 9,589 0513 TBA 1934 1934 1,250 392,731 10,216 0520 TBA 1927 1927 964 274,468 7,140 0546 TBA - Phoenix 1919 1919 2,614 641,979 16,700571 Law Annex 1936 1936 2,321 733,366 19,077 2001 0572 Arthritis And Disability Assessment Center 1962 1962 1,703 534,933 13,915 0573 Facilities Management Custodial 1962 1962 1,272 362,104 9,419 0605 Indian Ruins Guest House 1934 1934 551 280,111 7,287 27,943606 Indian Ruins Lab 1934 1934 658 334,507 8,702 2002 36,785607 Indian Ruins Main House 1934 1934 1,188 291,764 7,590 2002 69,596801 Tumamoc Hill - Main Library (Historic) 1959 1959 4,420 1,441,312 37,493 2002 68,545802 Tumamoc Hill - Old Chemistry (Historic) 1959 1959 1,363 422,927 11,002 2000 27,568803 Tumamoc Hill - USGS (Historic) 1959 1959 1,624 502,621 13,075 2000 30,513804 Tumamoc Hill - Sykes Lab (Historic) 1959 1959 3,122 1,500,226 39,025 2000 17,665805 Tumamoc Hill - Sykes Lab Annex (Historic) 1959 1959 980 382,917 9,961 2000 9,766806 Tumamoc Hill - Storage Shed A (Historic) 1959 1959 1,182 320,995 8,350 2000 16,823807 Tumamoc Hill - Storage Shed B 1959 1959 150 40,826 1,062 2000 933
Page 19 of 67

BUILDING INVENTORY REPORT7/1/2018 - 6/30/2019Original Adjusted Academic/ Estimated Calculated Estimated
Facility Notes/ Constr. Constr. Support Auxiliary Replacement Renewal Fiscal Year Deferred
No (1) Facility Name Footnotes Date Date (2) GSF GSF (3) Value (4) Request (5) Inspected Maintenance (6)
808 Tumamoc Hill - Storage Shed C 1959 1959 100 27,217 708 2000 1,936810 Tumamoc Hill - Inactive 1959 1959 192 71,976 1,872 2000 1,978811 Tumamoc Hill - Boathouse 1959 1959 800 247,596 6,441 2000 9,427812 Tumamoc Hill - Boathouse Annex 1959 1959 144 44,654 1,162 2000 964813 Tumamoc Hill - Residence 1948 1948 1,338 328,642 8,549 2000 0814 Tumamoc Hill - Residence 1950 1950 1,840 451,890 11,755 0851 Tumamoc Hill - 14" Telescope 1977 1977 196 110,756 2,438 2000 649852 Tumamoc Hill - 21" Telescope 1977 1977 322 171,850 3,783 2000 951854 KUAT Transmitting Station 2002 2002 699 260,813 2,262 0901 Kitt Peak Observatory 1963 1968 3,410 2,244,956 59,895 1999 78,075902 Kitt Peak Observatory 1963 1968 2,788 695,914 18,567 1999 30,632903 Kitt Peak Observatory 1968 1968 7,159 4,685,800 125,017 1999 2,883904 Kitt Peak Observatory 1968 1968 254 135,527 3,616 1999 0905 Kitt Peak Observatory 1987 1987 754 402,312 6,709 1999 935907 Kitt Peak Observatory 1988 1988 108 57,626 922 1999 631908 Kitt Peak Maintenance Supervisor Residence 1968 1968 864 212,192 5,661 1999 2,413909 Kitt Peak Dorm 1987 1987 1,344 330,076 5,504 1999 7,015910 Spacewatch Telescope 1997 1997 1,675 893,939 10,136 0911 Kitt Peak 12-mm Wave Telescope 1933 1933 7,088 4,666,349 121,386 0912 Kitt Peak Radio Telescope Dormitory 1966 1966 1,414 350,243 9,812 0913 Kitt Peak Radio Telescope Recreation Building 1957 1957 569 192,095 4,997 0914 Kitt Peak Radio Telescope Electronics Bldg 1957 1957 2,456 877,032 22,814 0915 Kitt Peak Radio Telescope Operator Residence 1977 1977 710 156,229 3,439 0
1013 U Of A South Academic Technology Building 2002 2002 23,388 7,863,132 68,181 01015 UA South Arizona Folklore Facility 1989 1989 4,000 1,639,186 26,240 01015 UA South-Moffett House 1989 1989 861 356,674 5,710 01050 San Xavier Mine 1971 1981 1,253 668,563 13,378 2002 13,3921051 San Xavier Mine Classroom Building 2010 2010 4,801 1,897,942 8,861 01052 San Xavier Mine - Garage 2013 2013 1,800 503,885 1,680 01101 Catalina Observatory Site 1 - 16'' Schmidt Tel 1971 1971 314 167,541 4,246 2002 1,1481102 Catalina Observatory Site 1 - 61" Telescope 1971 1971 2,957 1,373,777 34,820 2002 6,6821103 Catalina Observatory Site 1 - Dormitory 1971 1971 2,422 594,825 15,076 2002 13,0211104 Catalina Observatory Site 1 - Garage/Storage 1971 1971 487 54,373 1,378 2002 11,9301106 Catalina Observatory Site 1 - Water Pump House 1971 1971 105 52,043 1,319 2002 10,7231200 KUAT Radio-TV Transmitter 1971 1971 1,150 429,092 10,876 2002 5,1761201 KUAT Radio-TV Transmitter 2002 2002 838 312,677 2,711 0
Page 20 of 67
BUILDING INVENTORY REPORT7/1/2018 - 6/30/2019Original Adjusted Academic/ Estimated Calculated Estimated
Facility Notes/ Constr. Constr. Support Auxiliary Replacement Renewal Fiscal Year Deferred
No (1) Facility Name Footnotes Date Date (2) GSF GSF (3) Value (4) Request (5) Inspected Maintenance (6)
1350 High Altitude Laboratory 1971 1971 2,427 1,202,927 30,489 2002 28,6371351 High Altitude Laboratory 1971 1989 100 49,564 793 2002 2,1971415 Mt Lemmon Observatories - Radar Tower 1990 1990 3,180 1,672,076 25,651 01416 Mt Lemmon Observatories - 24 in Telescope 2003 2003 254 135,527 1,175 02001 Campus Farm West - Maintenance HQ 1909 1909 3,885 742,163 19,306 24,2992004 Campus Farm West - Pavilion and Archives 1956 1956 1,583 302,405 7,866 2002 5,6072005 Campus Farm West 1933 1933 3,669 1,149,568 29,904 2002 82,0612006 Campus Farm West - SNR Complex 1933 1933 2,170 670,854 17,451 2002 48,4112007 Campus Farm West - Equine Center 1933 1933 6,225 1,462,139 38,035 2002 42,9912008 Campus Farm West - Ag Education Center 1933 1933 4,672 2,640,068 68,676 2002 02010 Campus Farm West - Irrigation Lab 1966 1966 2,041 1,011,609 28,339 2002 02011 Campus Farm West - Animal Pathology 1957 1957 672 102,888 2,676 2002 02012 Campus Farm West - Animal Pathology 1957 1957 2,599 1,287,160 33,483 2002 02013 Campus Farm West - Storage 1977 1977 1,149 321,647 7,080 2002 02015 Campus Farm West - ABE Machine Shop 1976 1976 3,224 493,617 11,194 2002 02017 Food Product and Safety Lab 1980 1980 16,864 10,011,908 207,016 2002 24,6732018 Campus Farm West - Covered Arena 1989 1989 14,800 3,831,261 61,331 2002 02019 William J. Parker Agricultural Research Complex 2002 2002 42,556 20,422,835 177,086 02023 Campus Farm West - Maintenance Offices 1933 1933 1,367 423,236 11,010 2002 27,7342026 Campus Farm West - Old Water Tower 1933 1933 196 60,779 1,581 2002 02027 Campus Farm West - Modular Classroom (Trailer) 1977 1977 1,145 280,572 6,176 2002 12,0712031 Campus Farm West 1909 1909 1,160 284,887 7,411 2002 35,5142032 Campus Farm West - Residence Garage 1909 1909 327 50,500 1,314 2002 6,5422042 Campus Farm West - Beef/Sheep HQ 1965 1965 1,578 785,501 20,433 2002 02048 Campus Farm West - Animal Nutrition Lab 1989 1989 1,890 1,008,447 16,143 2002 02061 Campus Farm East - Wildlife Storage 1977 1977 600 91,864 2,022 02065 Campus Farm East - Storage 1977 1977 918 140,552 3,094 2001 2,1072068 Campus Farm East 1992 1992 886 186,922 2,618 2001 02069 Campus Farm East - CAC Garage 1988 1988 2,560 391,954 6,274 2001 02069 Campus Farm East 2006 2006 2,680 410,327 2,737 02070 Campus Farm East 1940 1940 1,768 434,207 11,295 2001 4,2242071 Campus Farm East - Residence 1948 1948 1,420 348,741 9,072 2001 02072 Campus Farm East - Residence Garage 1948 1948 489 54,596 1,420 2001 9352074 Campus Farm East - CEAC Annex 1936 1936 2,218 859,785 22,366 2001 17,5302075 Campus Farm East - Fertilizer Building 1936 1936 968 516,496 13,436 2001 02076 Campus Farm East 1936 1936 529 59,062 1,536 2001 3,738
Page 21 of 67
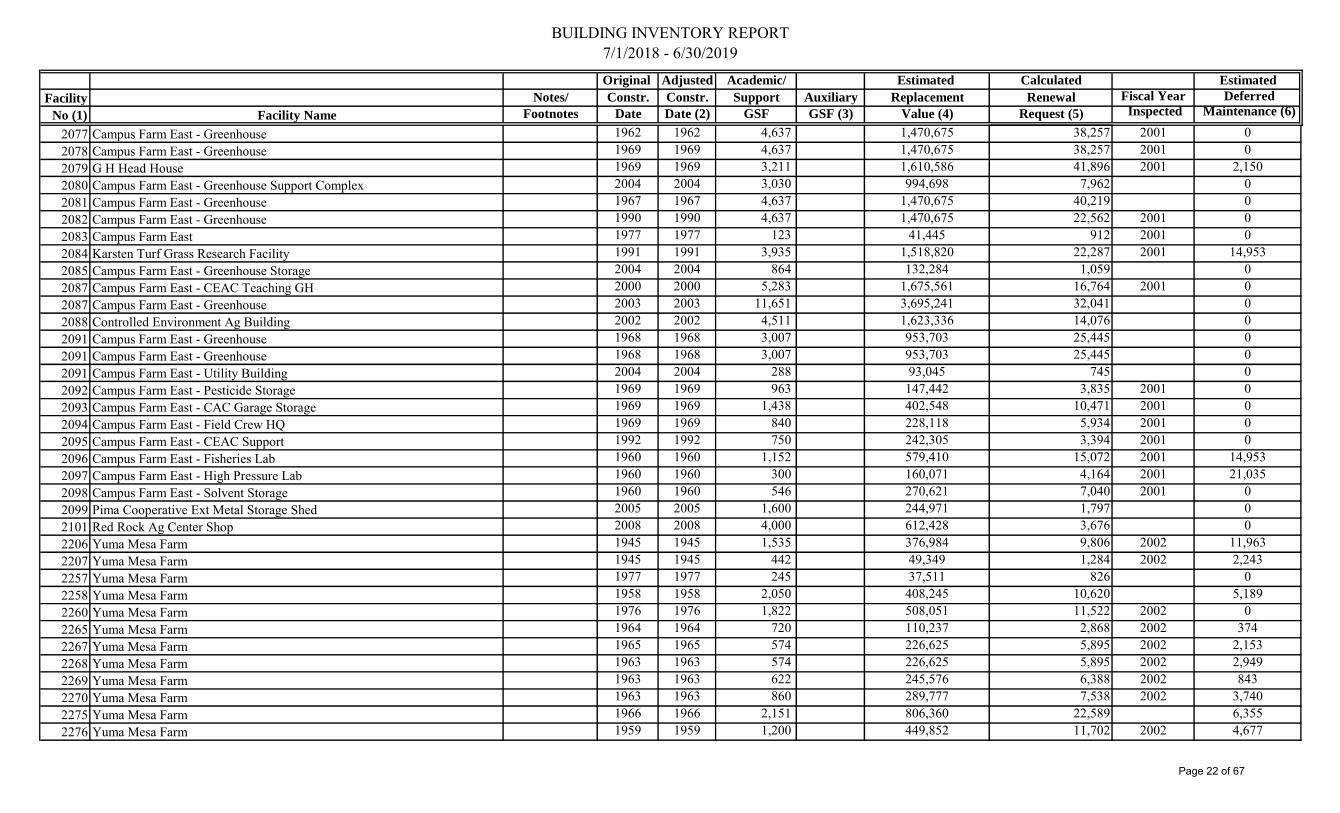
BUILDING INVENTORY REPORT7/1/2018 - 6/30/2019Original Adjusted Academic/ Estimated Calculated Estimated
Facility Notes/ Constr. Constr. Support Auxiliary Replacement Renewal Fiscal Year Deferred
No (1) Facility Name Footnotes Date Date (2) GSF GSF (3) Value (4) Request (5) Inspected Maintenance (6)
2077 Campus Farm East - Greenhouse 1962 1962 4,637 1,470,675 38,257 2001 02078 Campus Farm East - Greenhouse 1969 1969 4,637 1,470,675 38,257 2001 02079 G H Head House 1969 1969 3,211 1,610,586 41,896 2001 2,1502080 Campus Farm East - Greenhouse Support Complex 2004 2004 3,030 994,698 7,962 02081 Campus Farm East - Greenhouse 1967 1967 4,637 1,470,675 40,219 02082 Campus Farm East - Greenhouse 1990 1990 4,637 1,470,675 22,562 2001 02083 Campus Farm East 1977 1977 123 41,445 912 2001 02084 Karsten Turf Grass Research Facility 1991 1991 3,935 1,518,820 22,287 2001 14,9532085 Campus Farm East - Greenhouse Storage 2004 2004 864 132,284 1,059 02087 Campus Farm East - CEAC Teaching GH 2000 2000 5,283 1,675,561 16,764 2001 02087 Campus Farm East - Greenhouse 2003 2003 11,651 3,695,241 32,041 02088 Controlled Environment Ag Building 2002 2002 4,511 1,623,336 14,076 02091 Campus Farm East - Greenhouse 1968 1968 3,007 953,703 25,445 02091 Campus Farm East - Greenhouse 1968 1968 3,007 953,703 25,445 02091 Campus Farm East - Utility Building 2004 2004 288 93,045 745 02092 Campus Farm East - Pesticide Storage 1969 1969 963 147,442 3,835 2001 02093 Campus Farm East - CAC Garage Storage 1969 1969 1,438 402,548 10,471 2001 02094 Campus Farm East - Field Crew HQ 1969 1969 840 228,118 5,934 2001 02095 Campus Farm East - CEAC Support 1992 1992 750 242,305 3,394 2001 02096 Campus Farm East - Fisheries Lab 1960 1960 1,152 579,410 15,072 2001 14,9532097 Campus Farm East - High Pressure Lab 1960 1960 300 160,071 4,164 2001 21,0352098 Campus Farm East - Solvent Storage 1960 1960 546 270,621 7,040 2001 02099 Pima Cooperative Ext Metal Storage Shed 2005 2005 1,600 244,971 1,797 02101 Red Rock Ag Center Shop 2008 2008 4,000 612,428 3,676 02206 Yuma Mesa Farm 1945 1945 1,535 376,984 9,806 2002 11,9632207 Yuma Mesa Farm 1945 1945 442 49,349 1,284 2002 2,2432257 Yuma Mesa Farm 1977 1977 245 37,511 826 02258 Yuma Mesa Farm 1958 1958 2,050 408,245 10,620 5,1892260 Yuma Mesa Farm 1976 1976 1,822 508,051 11,522 2002 02265 Yuma Mesa Farm 1964 1964 720 110,237 2,868 2002 3742267 Yuma Mesa Farm 1965 1965 574 226,625 5,895 2002 2,1532268 Yuma Mesa Farm 1963 1963 574 226,625 5,895 2002 2,9492269 Yuma Mesa Farm 1963 1963 622 245,576 6,388 2002 8432270 Yuma Mesa Farm 1963 1963 860 289,777 7,538 2002 3,7402275 Yuma Mesa Farm 1966 1966 2,151 806,360 22,589 6,3552276 Yuma Mesa Farm 1959 1959 1,200 449,852 11,702 2002 4,677
Page 22 of 67

BUILDING INVENTORY REPORT7/1/2018 - 6/30/2019Original Adjusted Academic/ Estimated Calculated Estimated
Facility Notes/ Constr. Constr. Support Auxiliary Replacement Renewal Fiscal Year Deferred
No (1) Facility Name Footnotes Date Date (2) GSF GSF (3) Value (4) Request (5) Inspected Maintenance (6)
2281 Yuma Mesa Farm 1998 1998 1,022 339,192 3,620 2002 02286 Yuma Mesa Farm 1996 1996 1,050 414,557 4,977 2002 3862287 Yuma Mesa Farm 1998 1998 2,400 1,321,149 14,099 02305 WCAC - Residence 1957 1957 1,569 385,334 10,024 1999 71,3692309 WCAC - Feed Mill Shop 1959 1959 1,174 328,645 8,549 1999 19,3482310 WCAC - Feed Mill 1959 1959 3,071 1,507,561 39,216 1999 61,7312321 WCAC - Residence 1956 1956 1,428 350,706 9,123 1999 19,9582323 WCAC - Necropsy Laboratory 1991 1991 2,093 1,063,456 15,605 1999 12,1502324 WCAC-AZ Vet. Diagnostic Lab 1995 1995 12,396 5,701,037 72,249 1999 74,7662325 West Campus Agricultural Ctr 1998 1998 1,024 156,782 1,673 02327 WCAC-Shrimp Virus Bldg. 1956 1956 1,896 820,765 21,351 1999 02328 Shrimp Pathology Facility 2002 2002 3,830 1,802,974 15,634 02328 Shrimp Pathology Facility 2002 2002 1,218 486,818 4,221 02333 WCAC-AVDI Shop And Storage 1968 1968 1,120 260,768 6,957 1999 16,8222334 WCAC-Aqua. Pth. Support 1968 1968 1,024 399,111 10,648 1999 7,5952335 WCAC-Old Poultry Bldg 1968 1968 1,024 507,539 13,541 1999 5,2342336 WCAC-Aqua. Pth. Support 1968 1968 1,024 399,111 10,648 1999 8,0372337 WCAC - Pumphouse 1975 1975 145 22,201 518 1999 1,9632340 WCAC-Old Aqua. Pth. Lab 1960 1960 1,320 704,312 18,321 1999 17,4792341 WCAC - Quonset Hut 1958 1958 1,409 269,166 7,002 1999 30,5162342 WCAC - Storage 1975 1975 1,545 774,356 18,077 1999 5,3762343 West Campus Agricultural Ctr 1976 1976 576 285,491 6,474 1999 02350 West Campus Agricultural Ctr 1965 1965 756 374,707 9,747 1999 4,1142351 West Campus Agricultural Ctr 1965 1965 600 297,386 7,736 1999 02501 Maricopa Agricultural Center 1983 1983 2,354 390,370 7,291 02504 Maricopa Agricultural Center 1987 1987 3,755 983,437 16,399 2000 02510 Maricopa Agricultural Center 1987 1987 34,402 14,010,657 233,628 2000 123,4972511 Maricopa Agricultural Center 1987 1987 6,007 919,714 15,336 2000 2,9102512 Maricopa Agricultural Center 1987 1987 1,004 300,875 5,017 2000 02513 Maricopa Agricultural Center 1988 1988 200 38,207 612 2000 1,0362514 Maricopa Agricultural Center 1988 1988 168 25,722 412 2000 02515 Maricopa Agricultural Center 1985 1985 5,885 1,638,039 29,499 2000 1,0362516 Maricopa Agricultural Center 1985 1985 1,250 191,384 3,447 2000 4752516 Maricopa Agricultural Center 1993 1993 800 152,826 2,039 2000 02516 Maricopa Agricultural Center 1993 1993 64 12,226 163 2000 02516 Maricopa Agricultural Center 1993 1993 64 12,226 163 2000 0
Page 23 of 67
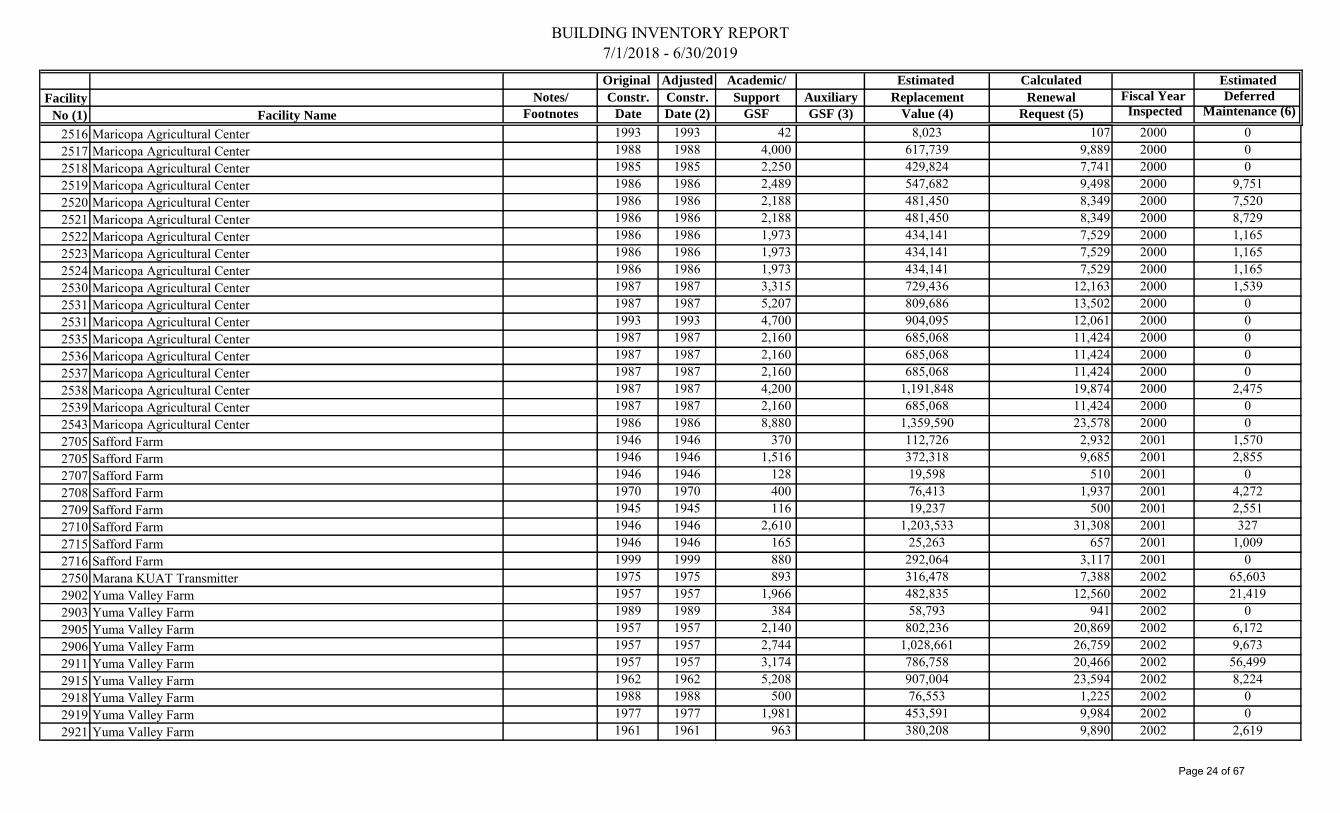
BUILDING INVENTORY REPORT7/1/2018 - 6/30/2019Original Adjusted Academic/ Estimated Calculated Estimated
Facility Notes/ Constr. Constr. Support Auxiliary Replacement Renewal Fiscal Year Deferred
No (1) Facility Name Footnotes Date Date (2) GSF GSF (3) Value (4) Request (5) Inspected Maintenance (6)
2516 Maricopa Agricultural Center 1993 1993 42 8,023 107 2000 02517 Maricopa Agricultural Center 1988 1988 4,000 617,739 9,889 2000 02518 Maricopa Agricultural Center 1985 1985 2,250 429,824 7,741 2000 02519 Maricopa Agricultural Center 1986 1986 2,489 547,682 9,498 2000 9,7512520 Maricopa Agricultural Center 1986 1986 2,188 481,450 8,349 2000 7,5202521 Maricopa Agricultural Center 1986 1986 2,188 481,450 8,349 2000 8,7292522 Maricopa Agricultural Center 1986 1986 1,973 434,141 7,529 2000 1,1652523 Maricopa Agricultural Center 1986 1986 1,973 434,141 7,529 2000 1,1652524 Maricopa Agricultural Center 1986 1986 1,973 434,141 7,529 2000 1,1652530 Maricopa Agricultural Center 1987 1987 3,315 729,436 12,163 2000 1,5392531 Maricopa Agricultural Center 1987 1987 5,207 809,686 13,502 2000 02531 Maricopa Agricultural Center 1993 1993 4,700 904,095 12,061 2000 02535 Maricopa Agricultural Center 1987 1987 2,160 685,068 11,424 2000 02536 Maricopa Agricultural Center 1987 1987 2,160 685,068 11,424 2000 02537 Maricopa Agricultural Center 1987 1987 2,160 685,068 11,424 2000 02538 Maricopa Agricultural Center 1987 1987 4,200 1,191,848 19,874 2000 2,4752539 Maricopa Agricultural Center 1987 1987 2,160 685,068 11,424 2000 02543 Maricopa Agricultural Center 1986 1986 8,880 1,359,590 23,578 2000 02705 Safford Farm 1946 1946 370 112,726 2,932 2001 1,5702705 Safford Farm 1946 1946 1,516 372,318 9,685 2001 2,8552707 Safford Farm 1946 1946 128 19,598 510 2001 02708 Safford Farm 1970 1970 400 76,413 1,937 2001 4,2722709 Safford Farm 1945 1945 116 19,237 500 2001 2,5512710 Safford Farm 1946 1946 2,610 1,203,533 31,308 2001 3272715 Safford Farm 1946 1946 165 25,263 657 2001 1,0092716 Safford Farm 1999 1999 880 292,064 3,117 2001 02750 Marana KUAT Transmitter 1975 1975 893 316,478 7,388 2002 65,6032902 Yuma Valley Farm 1957 1957 1,966 482,835 12,560 2002 21,4192903 Yuma Valley Farm 1989 1989 384 58,793 941 2002 02905 Yuma Valley Farm 1957 1957 2,140 802,236 20,869 2002 6,1722906 Yuma Valley Farm 1957 1957 2,744 1,028,661 26,759 2002 9,6732911 Yuma Valley Farm 1957 1957 3,174 786,758 20,466 2002 56,4992915 Yuma Valley Farm 1962 1962 5,208 907,004 23,594 2002 8,2242918 Yuma Valley Farm 1988 1988 500 76,553 1,225 2002 02919 Yuma Valley Farm 1977 1977 1,981 453,591 9,984 2002 02921 Yuma Valley Farm 1961 1961 963 380,208 9,890 2002 2,619
Page 24 of 67

BUILDING INVENTORY REPORT7/1/2018 - 6/30/2019Original Adjusted Academic/ Estimated Calculated Estimated
Facility Notes/ Constr. Constr. Support Auxiliary Replacement Renewal Fiscal Year Deferred
No (1) Facility Name Footnotes Date Date (2) GSF GSF (3) Value (4) Request (5) Inspected Maintenance (6)
2925 Yuma Valley Farm 1957 1957 231 74,873 1,948 2002 2,5862929 Yuma Valley Farm 1993 1993 118 39,163 522 2002 02930 Yuma Valley Farm 1993 1993 118 39,163 522 2002 1,7192931 Yuma Valley Farm 1993 1993 136 45,137 602 2002 2,0602933 Glen G Curtis Bldg 1987 1987 19,631 9,596,666 160,024 02934 Yuma Valley Farm Machine Shop 2009 2009 3,200 894,666 4,774 02935 Yuma Valley Farm Greenhouse 2009 2009 2,988 947,677 5,057 02936 Yuma Valley Farm Greenhouse 2009 2009 2,988 947,677 5,057 02937 Yuma Ag Center Shop 2010 2010 3,200 895,796 4,182 02985 Yuma Valley Farm 1960 1960 815 124,782 3,246 2002 2,5233001 Arizona Biomedical Collaborative (ABC Building) 2007 2007 37,966 22,098,621 132,658 03004 Health Sciences Education Building 2012 2012 297,220 166,169,191 554,174 03004 Phoenix Vivarium 2013 2013 24,454 12,629,357 42,119 03005 Arizona Cancer Center - Phoenix (Aux. Ent.) 2015 2015 227,580 120,592,945 0 03006 Biomedical Sciences Partnership Building - Phoenix 2017 2017 255,967 143,975,458 192,063 03007 UA Phoenix Plaza 1989 1989 33,057 11,463,149 183,502 0 03103 Campus Farm South - Greenhouse 1978 1978 6,572 2,089,549 44,599 1999 4,0373104 Crop Improvement 1987 1987 8,461 3,595,302 59,952 1999 48,4913105 Dairy Supervisor Residence 1957 1957 1,438 353,162 9,187 1999 26,9213118 Campus Farm South 1957 1957 2,234 1,203,635 31,310 1999 17,3333120 Campus Farm South - North Seed House 1966 1966 7,254 3,496,380 97,948 1999 19,2523138 Campus Farm South - South Seed House 1957 1957 6,791 3,365,917 87,558 1999 35,4403139 Entomology 1977 1977 982 456,492 10,048 1999 24,3093139 Entomology 1977 1977 112 37,172 818 1999 03139 Campus Farm South 1977 1977 112 37,172 818 1999 03139 Campus Farm South 1977 1977 112 37,172 818 1999 03139 Campus Farm South 1977 1977 112 37,172 818 1999 0
3139.1 Entomology 1977 1977 112 37,172 818 1999 03139.1 Entomology 1977 1977 112 37,172 818 1999 1,7723139.1 Entomology 1977 1977 112 37,172 818 1999 03139.1 Entomology 1977 1977 112 37,172 818 1999 0
3140 Earml South Entomology 1987 1987 1,878 889,752 14,837 1999 35,6443142 Entomology 1992 1992 713 236,638 3,315 1999 7303175 Dairy 1987 1987 585 111,754 1,864 1999 12,5733183 Campus Farm South - Greenhouse 1989 1989 1,606 509,360 8,154 1999 2,5053184 Campus Farm South - Greenhouse 1978 1978 2,223 705,049 15,049 1999 3,433
Page 25 of 67

BUILDING INVENTORY REPORT7/1/2018 - 6/30/2019Original Adjusted Academic/ Estimated Calculated Estimated
Facility Notes/ Constr. Constr. Support Auxiliary Replacement Renewal Fiscal Year Deferred
No (1) Facility Name Footnotes Date Date (2) GSF GSF (3) Value (4) Request (5) Inspected Maintenance (6)
3186 Campus Farm South - Greenhouse 1987 1987 1,900 602,606 10,048 1999 7,2103188 Campus Farm South - Greenhouse 1987 1987 542 179,885 3,000 1999 03190 Campus Farm South - Dairy Shop 1966 1966 1,938 296,721 8,312 1999 14,3933191 Campus Farm South - Warehouse 1978 1978 2,017 639,713 13,654 1999 1,7763192 Campus Farm South - Greenhouse 1989 1989 1,606 509,360 8,154 1999 1,7763193 Campus Farm South - Greenhouse 1989 1989 1,606 509,360 8,154 1999 2,5053196 Campus Farm South - Greenhouse HQ 1966 1966 528 175,238 4,909 1999 41,0373197 Campus Farm South - Shadehouse 1982 1982 1,606 533,016 10,310 1999 2,5053198 Campus Farm South - Greenhouse 1966 1966 1,900 602,606 16,881 1999 2,3863290 Boyce Thompson Arboretum 1989 1989 3,947 1,052,102 16,842 2001 84,0933291 Boyce Thompson Arboretum 2000 2000 448 104,324 1,044 03301 Sunnyside - Shop/Records Mgmt 1948 1948 19,041 4,522,949 117,655 2001 131,7283302 Sunnyside - Storage 1948 1948 1,848 353,029 9,183 2001 25,0463302 Sunnyside - Records Mgmt 2000 2000 4,774 911,992 9,124 2001 03303 Sunnyside - Storage 1948 1948 3,825 730,701 19,008 2001 37,4693304 Sunnyside - Storage 1948 1948 3,672 731,218 19,021 2001 55,2133305 Sunnyside - Storage 1948 1948 3,672 701,473 18,247 2001 34,6183306 Sunnyside - Arid Lands 1948 1948 16,214 4,449,805 115,753 2001 112,3843307 Sunnyside - Storage 1948 1948 616 117,676 3,061 2001 25,2773308 Sunnyside - Storage 1948 1948 616 117,676 3,061 2001 7,6053309 Sunnyside - Arid Lands 1948 1948 12,711 5,824,253 151,506 2001 197,7243309 Sunnyside - Greenhouse 1948 1948 3,588 1,137,973 29,602 2001 18,1103309 Sunnyside - Headhouse 1948 1948 638 218,842 5,693 2001 12,1513309 Sunnyside - Storage 1948 1948 50 13,701 356 03309 Sunnyside - Storage 1948 1948 162 86,438 2,249 03310 Sunnyside - Arid Lands 1948 1948 4,046 1,646,986 42,843 2001 63,9953310 Sunnyside - Greenhouse Service 1948 1948 302 97,568 2,538 03310 Sunnyside - Storage 1948 1948 77 24,475 637 03311 Sunnyside - Storage 1948 1948 4,046 772,920 20,106 2001 44,1593312 Sunnyside - Storage 1948 1948 1,848 353,029 9,183 2001 17,5273313 Sunnyside - Storage 1948 1948 1,848 353,029 9,183 2001 24,0843314 Sunnyside - Storage 1968 1968 11,568 2,209,870 58,959 2001 92,2913315 Sunnyside - Garage 1981 1981 576 64,310 1,287 20013400 Mt Graham Telescope 1990 1990 11,953 7,279,260 111,671 2001 9,3173401 Mt Graham Utility Building 1993 1993 1,520 811,026 10,819 2001 4,2983401 Mt Graham Utility Building 2000 2000 1,315 723,879 7,242 0
Page 26 of 67

BUILDING INVENTORY REPORT7/1/2018 - 6/30/2019Original Adjusted Academic/ Estimated Calculated Estimated
Facility Notes/ Constr. Constr. Support Auxiliary Replacement Renewal Fiscal Year Deferred
No (1) Facility Name Footnotes Date Date (2) GSF GSF (3) Value (4) Request (5) Inspected Maintenance (6)
3401 Mt Graham UAPD Guardhouse 2000 2000 140 43,414 434 03402 Mt Graham Shop Building 2002 2002 1,500 419,904 3,641 03403 Mt Graham Cable Reel Building 2001 2001 900 446,079 4,165 03404 Mt Graham Obs-Laundry Bldg 1998 1998 576 285,491 3,047 03405 Mt Graham Obs-Conference Bldg 1997 1997 384 120,549 1,367 03406 Mt Graham Obs-UAPD Bldg 2000 2000 288 78,212 783 03551 V BAR V - Office Trailer (Trailer) 1996 1996 787 243,746 2,926 1998 03552 V BAR V - Lab Trailer 1996 1996 446 238,048 2,858 03553 V BAR V - Multi-Use 1997 1997 4,091 781,353 8,860 03554 V BAR V - Residence A 1995 1995 1,369 336,234 4,261 03555 V BAR V - Residence B 1995 1995 1,324 325,148 4,121 03556 V BAR V - Ranch House 1996 1996 1,145 310,019 3,722 03557 V BAR V - Cabin 1996 1996 601 162,810 1,955 03558 V BAR V - Barn 1996 1996 948 181,125 2,175 03559 V BAR V - Shop 1996 1996 900 137,796 1,654 03560 Mingus 4-H Camp - Rec Hall 1950 1950 1,127 454,729 11,829 03561 Mingus 4-H Camp - Navajo Bunk House 1950 1950 400 161,374 4,198 03562 Mingus 4-H Camp - Apache Bunk House 1950 1950 400 161,374 4,198 03563 Mingus 4-H Camp - Zuni Bunk House 1950 1950 400 161,374 4,198 03564 Mingus 4-H Camp - Hohokam Office 1979 1979 152 61,338 1,268 03565 Mingus 4-H Camp - Dining Hall 1971 1971 2,290 923,754 23,413 03566 Mingus 4-H Camp - Anasazi Hlth Cottage 1950 1950 610 246,068 6,401 03567 Mingus 4-H Camp - Restrooms/Showers 1971 1971 850 342,836 8,690 03568 Mingus 4-H Camp - Storage 1950 1950 189 76,142 1,981 03569 Mingus 4-H Camp - Havasu Bunk House 1950 1950 907 365,920 9,519 03570 Mingus 4-H Camp - Large Bunk House 1951 1951 2,537 1,023,552 26,626 03571 Mingus 4-H Camp - Pump House 1974 1974 129 17,482 408 03572 Mingus 4-H Camp - Power House 1981 1981 192 26,020 521 03573 Mingus 4-H Camp - Cook's Cabin 1971 1971 865 349,072 8,848 03601 Al-Marah - Office 1978 1978 3,376 959,780 20,486 03602 Al-Marah - Customer Barn 1975 1975 3,201 1,369,012 31,960 03603 Al-Marah - Pasture Residence 1979 1979 3,352 823,226 17,022 03604 Al-Marah - Main Residence 1980 1980 3,432 842,873 17,428 03604 Al-Marah - Kennel 1993 1993 605 258,748 3,452 03604 Al-Marah - Storage 1983 1983 594 113,474 2,119 03604 Al-Marah - Restroom 1989 1989 39 7,450 119 0
Page 27 of 67

BUILDING INVENTORY REPORT7/1/2018 - 6/30/2019Original Adjusted Academic/ Estimated Calculated Estimated
Facility Notes/ Constr. Constr. Support Auxiliary Replacement Renewal Fiscal Year Deferred
No (1) Facility Name Footnotes Date Date (2) GSF GSF (3) Value (4) Request (5) Inspected Maintenance (6)
3605 Al-Marah - Indoor Arena 1995 1995 22,965 3,516,101 44,560 03606 Al-Marah - NE Residence 1980 1980 4,267 1,047,943 21,668 03607 Al-Marah - Stud Barn 1978 1978 10,500 4,146,986 88,513 03608 Al-Marah - Hay Barn 1989 1989 3,289 503,569 8,061 03609 Al-Marah - Show Barn 14 Stall 1988 1988 5,819 2,488,684 39,839 03610 Al-Marah - Outdoor Arena 1989 1989 14,257 2,182,846 34,943 03611 Al-Marah - Show Barn 16 Stall 1981 1981 6,865 2,754,594 55,119 03612 Al-Marah - Caretaker Residence 1984 1984 1,354 332,532 5,989 03613 Al-Marah - South Residence 1988 1988 1,084 266,222 4,262 03651 Cracchiolo DK Ranch - Livestock Barn 1973 1973 3,666 1,455,981 34,961 03652 Cracchiolo DK Ranch - Horse Barn 1973 1973 6,631 2,835,834 68,094 03653 Cracchiolo DK Ranch - Meeting/Tack Room 2005 2005 1,711 731,853 5,370 03654 Cracchiolo DK Ranch - Caretaker House 1969 1969 1,088 267,268 6,952 03655 Cracchiolo DK Ranch - Guest House 1961 1961 333 81,790 2,128 03656 Cracchiolo DK Ranch - Main House 1973 1973 4,297 1,055,361 25,341 03657 Cracchiolo DK Ranch - Pump House 1961 1961 190 25,749 670 04000 Biosphere 2 1986 1986 178,189 121,523,543 2,107,461 04000 Biosphere 2 Ocean Viewing Gallery 1986 1986 8,403 3,933,979 68,223 04001 Biosphere 2 Planning Center 1986 1986 9,302 3,335,974 57,852 04001 Biosphere 2 Planning Center Annex 1986 1986 501 67,800 1,176 04002 Biosphere 2 Faculty Building A 1986 1986 1,440 412,603 7,155 04003 Biosphere 2 Faculty Building B 1986 1986 1,520 470,932 8,167 04004 Biosphere 2 Faculty Building C 1986 1986 1,417 439,251 7,617 04005 Biosphere 2 Faculty Building D 1986 1986 1,475 381,204 6,611 04006 Biosphere 2 South Lung 1986 1986 26,254 14,452,267 250,631 04007 Biosphere 2 West Lung 1986 1986 26,254 14,452,267 250,631 04008 Biosphere 2 Energy Center 1986 1986 23,881 11,165,659 193,635 04009 Biosphere 2 Cooling Towers 1986 1986 7,384 1,125,618 19,520 04010 Biosphere 2 Analytical Lab 1986 1986 5,603 2,654,614 46,036 04030 Biosphere 2 Visitor Center 1986 1986 4,901 1,900,651 32,961 04031 Biosphere 2 Food Court 1986 1986 1,970 1,053,156 18,264 04032 Biosphere 2 Theater 1986 1986 2,623 929,932 16,127 04033 Biosphere 2 Residential A 1986 1986 4,107 1,008,648 17,492 04034 Biosphere 2 Residential B 1986 1986 4,107 1,008,648 17,492 04035 Biosphere 2 Residential C 1986 1986 3,602 884,624 15,341 04036 Biosphere 2 Residential D 1986 1986 2,065 507,148 8,795 0
Page 28 of 67

BUILDING INVENTORY REPORT7/1/2018 - 6/30/2019Original Adjusted Academic/ Estimated Calculated Estimated
Facility Notes/ Constr. Constr. Support Auxiliary Replacement Renewal Fiscal Year Deferred
No (1) Facility Name Footnotes Date Date (2) GSF GSF (3) Value (4) Request (5) Inspected Maintenance (6)
4037 Biosphere 2 Residential E 1986 1986 4,160 1,021,664 17,718 04038 Biosphere 2 Residential F 1986 1986 3,599 883,887 15,328 04040 Biosphere 2 Residential G 1986 1986 3,599 883,887 15,328 04041 Biosphere 2 Residential H 1986 1986 4,061 997,351 17,296 04042 Biosphere 2 Residential J 1986 1986 3,599 883,887 15,328 04043 Biosphere 2 Residential K 1986 1986 3,542 869,888 15,086 04044 Biosphere 2 Residential L 1986 1986 1,856 455,819 7,905 04045 Biosphere 2 Residential M 1986 1986 4,066 998,579 17,317 04046 Biosphere 2 Residential N 1986 1986 4,162 1,022,156 17,726 04047 Biosphere 2 Residential P 1986 1986 3,799 933,005 16,180 04048 Biosphere 2 Residential Q 1986 1986 4,107 1,008,648 17,492 0623 11,774,938 6,454,754 6,892,244,245 93,560,647 #N/A
TOTAL GSF:
TOTAL ACADEMIC REP VALUE:
1)2)3)4)5)6)7)8)9)
Renewal request is calculated using the Sherman-Dergis formula with direction from ABOR.Building Inspections for Academic / Support facilities are completed by Facilities Management within a four year cycle.Student Union, Bldg. 17, is prorated to capture both auxiliary enterprise (99.5%) and academic support space (0.5%).Bookstore, Bldg. 19, is prorated to capture both auxiliary enterprise (74%) and academic support space (26%).Scholarship Suites, Bldg. 58b calculated renewal allocations is based on 50 percent of the estimated replacement value.
Estimated replacement values are calculated using the ABOR's Construction Cost Control and Professional Fee Guidelines, and are based upon the University's FY 2019 Space Inventory.
18,229,693
$5,456,462,210.14
List of all facilities owned or being acquired by the University of Arizona.As adjusted for applicable projects using the Sherman-Dergis formula.Auxiliary enterprises do not generate building renewal allocation amounts.
Page 29 of 67

University of Arizona
FY 2021-2022 Capital Improvement Plan
Lease Report

THE UNIVERSITY OF ARIZONAFY 2021-2023 CAPITAL IMPROVEMENT PLAN
SUMMARY OF LEASES IN EFFECT DURING FY 2019
Gross Lease $/Year Number Number NumberNumber of Square Receipts (R) Of Leases Of Leases Of Leases
Leases Feet Acres Expenditures (E) Continued Renewed Terminated
UA as Lessor 45 428,922 1,716 $4,742,721 40 1 4
UA as Lessee 80 827,554 60,866 $5,161,298 51 22 7
Notes:1) The Board has delegated to the universities the responsibility to establish leases (including amendments and renewals) without specific Board approval unless: As lessor (university leasing to others) - the lease including all renewals run longer than 10 years, or the annual base lease amount exceeds $1,000,000, or the rental rate is less than the fair market value of the property. As lessee (university leases from others) - the original lease is limited to 5 years with a maximum 5 year renewal option or the total annual lease amount exceeds $1,000,000.2) Any leases requiring Board approval will be brought forward as separate agenda items.
Page 30 of 67

THE UNIVERSITY OF ARIZONAFY 2021-2023 CAPITAL IMPROVEMENT PLAN
PROPERTY LEASES IN EFFECT DURING FY 2019
UNIVERSITY AS LESSEE
CONTINUE (C) GSF CURRENT COMMENTS OR LATESTRENEW (R) PROPERTY COST/GSF TERM AND TYPE OF SOURCE USE OF BOARD APPROVAL,
LESSOR TERMINATE (T) LOCATION USER FY EXP. COST OPTION LEASE* OF FUNDS SPACE IF APPLICABLE
1 1301 One & 1301 Two, LLC C 1301 Connecticut Ave., NW National Institute for 1,928 01/20/15- TN Restricted Office #690 Washington, DC Civil Discourse $51.94 01/31/20
$100,134
2 AMARG #705 C 2720 S. Craycroft College of Science N/A 09/23/19- TN N/A N/A DM Airforce Base Steward Observatory N/A 09/22/20
Tucson, AZ $0
3 Arizona State Land Dept. C Marana Farm, Pinal County College of Agriculture 5,019 AC 01/01/18- TN State Field#240 Red Rock, AZ Marana Farm N/A 12/31/22ASL #23-99491-05 $1,093
4 Arizona State Land Dept. C Santa Rita Experimental College of Agriculture 50,691 AC 09/09/14- TN N/A Field#264 Range Santa Rita Experimental N/A 09/08/24ASL #03-99671 Tucson, AZ Range N/A
5 Arizona State Land Dept. C Marana Livestock Facility College of Agriculture 4,638 AC 09/11/19- TN N/A Field#266 Pinal County, Red Rock, AZ Marana Farm N/A 09/10/29ASL #89-23963 N/A
6 Arizona State Land Dept. C Tumamoc Hill College of Science 200 AC 03/31/11- TN N/A Field#290.1 Tucson, AZ Geosciences N/A 03/30/21ASL #89-98103 N/A
7 Arizona State Land Dept. C Page Ranch College of Agriculture N/A 03/08/11- TN Designated Field#461 Pinal County, AZ Page Ranch N/A 03/07/21ASL #18-105911 $3,911
8 Arizona State Land Dept. C Red Rock Agricultural Center College of Agriculture 0.52 AC 08/26/10- TN State Field#637 Red Rock, AZ Red Rock Ag Center N/A 08/25/20ASL #18-114734 $285
Page 31 of 67

THE UNIVERSITY OF ARIZONAFY 2021-2023 CAPITAL IMPROVEMENT PLAN
PROPERTY LEASES IN EFFECT DURING FY 2019
UNIVERSITY AS LESSEE
CONTINUE (C) GSF CURRENT COMMENTS OR LATESTRENEW (R) PROPERTY COST/GSF TERM AND TYPE OF SOURCE USE OF BOARD APPROVAL,
LESSOR TERMINATE (T) LOCATION USER FY EXP. COST OPTION LEASE* OF FUNDS SPACE IF APPLICABLE
9 Arizona State Land Dept. C Red Rock Agricultural Center College of Agriculture 318 AC 02/15/14- TN State Field#654 Red Rock, AZ Red Rock Ag Center N/A 02/14/24ASL #23-115797-01 N/A
10 Ash Tucson Properties, C 315 S. Plumer Ave. Business Affairs 16,280 08/16/03- TN Auxiliary Ground ABOR approval: 08/03LLC #502 Tucson, AZ Parking & Transportation $5.34 08/15/23
Services $87,012
11 Banner Health C 1441 N. 12th Street College of Medicine 4,101 10/23/18- TN N/A Clinical#729 Phoenix, AZ All of Us Program $1.00 10/22/23
$17,304
12 Broadmoor Center, LLC C 151-181 S. Tucson Blvd. SBS, Southwest Institute 1,574 04/01/15- DN Sponsored Office#697 #101, 106, 107 for Research on Women $11.00 03/31/20 Projects
Tucson, AZ $17,321
13 Bureau of Prisons #201 C Route 366 College of Science N/A 02/11/00- TN N/A FieldSafford, AZ Steward Observatory N/A 02/10/21
N/A
14 Campus Christian Center C 715 N. Park Ave. Provost Office 5,500 01/01/16- DN State Office#703 Tucson, AZ Life & Work Connections $16.07 12/31/20
$88,403
15 Children's Clinic for Rehab. R 2600 N. Wyatt Drive College of Medicine 812 01/01/19- N Sponsored ClinicalServices #678 Tucson, AZ Ophthalmology $15.14 12/31/23 Projects
$12,294
16 City of Chandler, Economic C 125 E. Commonwealth Ave. Student Affairs 8,965 05/01/17- TN State Office/Development #658 Chandler, AZ Academic Initiatives $3.23 04/30/22 Classroom
$28,928
Page 32 of 67

THE UNIVERSITY OF ARIZONAFY 2021-2023 CAPITAL IMPROVEMENT PLAN
PROPERTY LEASES IN EFFECT DURING FY 2019
UNIVERSITY AS LESSEE
CONTINUE (C) GSF CURRENT COMMENTS OR LATESTRENEW (R) PROPERTY COST/GSF TERM AND TYPE OF SOURCE USE OF BOARD APPROVAL,
LESSOR TERMINATE (T) LOCATION USER FY EXP. COST OPTION LEASE* OF FUNDS SPACE IF APPLICABLE
17 City of Page #277 R Page, AZ College of Agriculture N/A 05/01/94- TN N/A Field4-H Extension N/A 06/30/19
$1 RenewsAnnually
18 City of Phoenix #559.02 C 550 E. Van Buren College of Medicine N/A 09/27/05- N N/A Mixed UsePhoenix, AZ Phoenix Biomedical N/A 09/24/38
Campus $1
19 City of Tucson Parks & C 3400 E. Camino Campestre Intercollegiate Athletics 37,665 07/01/17- DN Auxiliary Office/ ABOR approval: 04/17Recreation #655 Tucson, AZ N/A 06/30/42 Field
$10 Two 5-YearOptions
20 Cochise County Community R 4190 W. Highway 80 UA South 1,825 07/01/18- N State Office/College #631 Douglas, AZ $9.95 06/30/19 Classroom
$18,159
21 Cochise County Community R 901 N. Colombo Ave., Rm 217 UA South 135 07/01/18- N State Office/College #632 Sierra Vista, AZ $13.99 06/30/19 Classroom
$1,889
22 Flowing Wells Unified C 1556 W. Prince Rd. College of Education N/A 08/21/17- TN N/A ClassroomSchool District #725 Tucson, AZ Teach Arizona Program N/A 08/20/22
$0
23 GGP Park Mall, LLC #685 C Park Place Mall Space 266 Student Affairs 1,406 01/01/19- DN Auxiliary Retail 5871 E. Broadway Blvd. UA Bookstore $76.89 12/31/21Tucson, AZ $108,101
24 Gonzalez, Francisco & C 1037 E. 24th St. SBS, Southwest Institute 1,781 04/01/19- DN Sponsored ClinicalAntonia #742 Tucson, AZ for Research on Women $2.20 11/30/23 Projects
$3,919
Page 33 of 67

THE UNIVERSITY OF ARIZONAFY 2021-2023 CAPITAL IMPROVEMENT PLAN
PROPERTY LEASES IN EFFECT DURING FY 2019
UNIVERSITY AS LESSEE
CONTINUE (C) GSF CURRENT COMMENTS OR LATESTRENEW (R) PROPERTY COST/GSF TERM AND TYPE OF SOURCE USE OF BOARD APPROVAL,
LESSOR TERMINATE (T) LOCATION USER FY EXP. COST OPTION LEASE* OF FUNDS SPACE IF APPLICABLE
25 Hazen Enterprises, Inc. #704 C 1430 E. Ft. Lowell #301 College of Medicine 5,247 10/01/17- TN Designated ClinicalTucson, AZ Arizona Cancer Center $21.13 09/30/19
$110,844
26 Hazen Enterprises, Inc. #664 C 1430 E. Fort Lowell #304 College of Medicine 4,464 10/01/17- TN Designated ClinicalTucson, AZ Arizona Cancer Center $20.60 09/30/19
$91,956
27 Kai Harber, Trustee #743 R 1955 E. 6th St. AZ Geological Survey/ 17,894 04/01/19- TN Designated OfficeTucson, AZ Student Affairs $13.40 03/31/24
$239,833
28 Lindemann, LLC #724 R 1504 W. First Ave. Ste. 219, National Institute for Civil 433 04/01/19- TN Restricted Office1207 Grandview Ave. Ste. 212 Discourse $19 03/31/20Grandview Height, OH $8,160
29 Little Chapel of All Nations C 1052 N. Highland Ave. SBS 1,444 02/01/16- DN State Office#712 Tucson, AZ Southwest Center $19.06 01/31/21
$27,528
30 Little Chapel of All Nations R 1052 N. Highland Ave. SBS 297 08/15/18- N State Office#737 Tucson, AZ Southwest Center $20.19 08/14/23
$5,996
31 Marshall Foundation #615 C 935,939,943 N. Tyndall Ave. VP for Research 3,458 01/01/17- DN State OfficeTucson, AZ Udall Center/International $18.77 12/31/19
Affairs $64,899
32 Marshall Foundation #620 C 915 N. Tyndall Ave. UA Global Initiatives 2,866 01/01/17- DN State Office ABOR approval: 11/89Tucson, AZ International Students $18.48 12/31/19
$52,950
Page 34 of 67

THE UNIVERSITY OF ARIZONAFY 2021-2023 CAPITAL IMPROVEMENT PLAN
PROPERTY LEASES IN EFFECT DURING FY 2019
UNIVERSITY AS LESSEE
CONTINUE (C) GSF CURRENT COMMENTS OR LATESTRENEW (R) PROPERTY COST/GSF TERM AND TYPE OF SOURCE USE OF BOARD APPROVAL,
LESSOR TERMINATE (T) LOCATION USER FY EXP. COST OPTION LEASE* OF FUNDS SPACE IF APPLICABLE
33 Marshall Foundation #638 C 803,811,819 E. First St. VP for Research 6,858 11/10/15- DN State Office ABOR approval: 11/89Tucson, AZ Udall Center/Drachman $18.96 11/09/20 $130,050
34 Marshall Foundation #660 T 845 N. Park Ave., Ste. 155 Development Office 1,502 08/01/18- DN Auxiliary Office Terminated 06/30/19 Tucson, AZ $34.98 07/31/19 $52,537
35 Marshall Foundation #661 C 800 E. University Blvd. SBS 12,367 05/01/17- DN Designated OfficeTucson, AZ Bureau of Applied $21.46 04/30/22
Research in Anthropology $265,378
36 Mastick Family Trust #710 T 1710 N. Mastick Way College of Public Health 5,000 01/01/16- N Restricted Office/ Terminated 07/30/18Nogales, AZ Border Health $1.55 12/31/18 Clinical $7,727 Two 1-Year
Options
37 Milton Silverman Revocable T 2801 E. Broadway Blvd. SBS 1,724 10/01/17- DN Sponsored Office Terminated 05/01/19Trust #694 Tucson, AZ Southwest Institute for $10.17 10/31/19 Projects
Research on Women $17,537
38 Mission Manor Assoc., LLC R 2033 E. Speedway, Suite 203 College of Medicine 3,690 05/15/19- N Restricted Office/#714 Tucson, AZ Center for Sleep & $18.50 05/14/21 Laboratory
Circadian Sciences $68,252
39 Mission Manor Assoc., LLC C 2033 E. Speedway, Suite 202 National Institute for 1,830 07/01/16- N Restricted Office#716 Tucson, AZ Civil Discourse $17.01 06/30/19
$31,131
40 Our Saviour's Lutheran R 1949 E. Helen St. Business Affairs N/A 07/01/18- TN Auxiliary Ground 142 parking spacesChurch #669 Tucson, AZ Parking & Transportation N/A 06/30/19
Services $40,407
Page 35 of 67

THE UNIVERSITY OF ARIZONAFY 2021-2023 CAPITAL IMPROVEMENT PLAN
PROPERTY LEASES IN EFFECT DURING FY 2019
UNIVERSITY AS LESSEE
CONTINUE (C) GSF CURRENT COMMENTS OR LATESTRENEW (R) PROPERTY COST/GSF TERM AND TYPE OF SOURCE USE OF BOARD APPROVAL,
LESSOR TERMINATE (T) LOCATION USER FY EXP. COST OPTION LEASE* OF FUNDS SPACE IF APPLICABLE
41 Panthera Pavilions, LLC R 1030 N. Alvernon College of Medicine 9,043 10/01/18- DN Designated Clinical#618 Tucson, AZ Health Promotion & $15.85 09/30/19
Wellness Center $143,346
42 Park/University C 845 N. Park Ave. SBS 83,000 12/01/03- TN Plant Funds/ Office ABOR approval: 02/02Redevelopment, LLC Tucson, AZ Engineering $11.37 11/30/42 State #507 $943,854
43 Pascoe Investment-Arizona, C 325 S. Euclid Ave. College of Science 7,500 07/01/15- DN Designated Office/LLC #627 #117,119,121, & 123 Steward Observatory $13.68 06/30/20 Laboratory
Tucson, AZ $102,572
44 Pascoe Investment-Arizona, C 325 S. Euclid Ave. College of Science 4,615 07/01/15- DN Designated Office/LLC #628 #113 & 115 Steward Observatory $11.39 06/30/20 Laboratory
Tucson, AZ $52,568
45 Pascoe Investment-Arizona, C 355 S. Euclid Ave. #101 Student Affairs 3,294 07/01/16- DN Auxiliary Office
LLC #651 Tucson, AZ UA Bookstore $8.14 06/30/19$26,806
46 Pelican Management, LLC R 2302 E. Speedway, Ste. 202 College of Medicine 2,334 10/01/18- N Designated Office#706 & 204 Family and Community $20.14 09/30/19
Tucson, AZ Medicine $47,014
47 Pima County Community C 8184 E. Irvington Rd. UA South 1,797 05/15/18- TN State Office/College District #733 Tucson, AZ $20.00 06/30/19 Classroom
$35,940
48 Pima County Community C 5901 S. Calle Santa Cruz UA South 1,396 05/15/18- TN State Office/College District #734 Tucson, AZ $19.55 06/30/19 Classroom
$27,290
Page 36 of 67
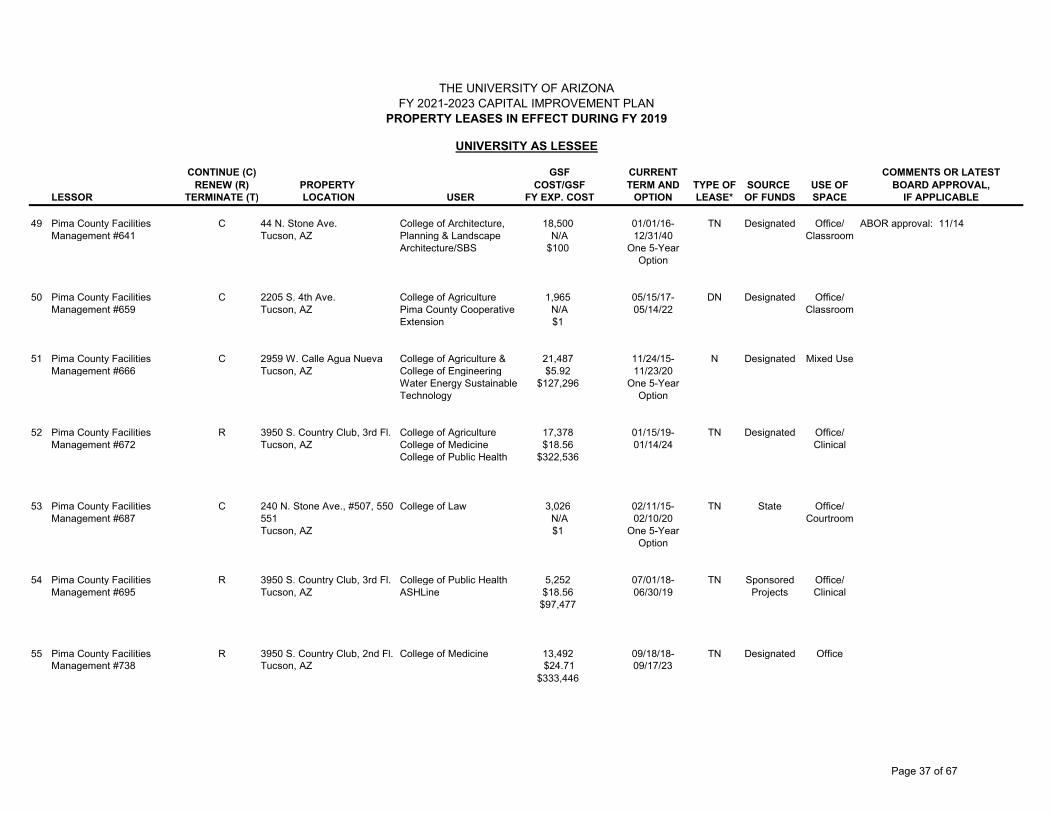
THE UNIVERSITY OF ARIZONAFY 2021-2023 CAPITAL IMPROVEMENT PLAN
PROPERTY LEASES IN EFFECT DURING FY 2019
UNIVERSITY AS LESSEE
CONTINUE (C) GSF CURRENT COMMENTS OR LATESTRENEW (R) PROPERTY COST/GSF TERM AND TYPE OF SOURCE USE OF BOARD APPROVAL,
LESSOR TERMINATE (T) LOCATION USER FY EXP. COST OPTION LEASE* OF FUNDS SPACE IF APPLICABLE
49 Pima County Facilities C 44 N. Stone Ave. College of Architecture, 18,500 01/01/16- TN Designated Office/ ABOR approval: 11/14Management #641 Tucson, AZ Planning & Landscape N/A 12/31/40 Classroom
Architecture/SBS $100 One 5-YearOption
50 Pima County Facilities C 2205 S. 4th Ave. College of Agriculture 1,965 05/15/17- DN Designated Office/Management #659 Tucson, AZ Pima County Cooperative N/A 05/14/22 Classroom
Extension $1
51 Pima County Facilities C 2959 W. Calle Agua Nueva College of Agriculture & 21,487 11/24/15- N Designated Mixed UseManagement #666 Tucson, AZ College of Engineering $5.92 11/23/20
Water Energy Sustainable $127,296 One 5-YearTechnology Option
52 Pima County Facilities R 3950 S. Country Club, 3rd Fl. College of Agriculture 17,378 01/15/19- TN Designated Office/Management #672 Tucson, AZ College of Medicine $18.56 01/14/24 Clinical
College of Public Health $322,536
53 Pima County Facilities C 240 N. Stone Ave., #507, 550 College of Law 3,026 02/11/15- TN State Office/Management #687 551 N/A 02/10/20 Courtroom
Tucson, AZ $1 One 5-YearOption
54 Pima County Facilities R 3950 S. Country Club, 3rd Fl. College of Public Health 5,252 07/01/18- TN Sponsored Office/Management #695 Tucson, AZ ASHLine $18.56 06/30/19 Projects Clinical
$97,477
55 Pima County Facilities R 3950 S. Country Club, 2nd Fl. College of Medicine 13,492 09/18/18- TN Designated OfficeManagement #738 Tucson, AZ $24.71 09/17/23
$333,446
Page 37 of 67

THE UNIVERSITY OF ARIZONAFY 2021-2023 CAPITAL IMPROVEMENT PLAN
PROPERTY LEASES IN EFFECT DURING FY 2019
UNIVERSITY AS LESSEE
CONTINUE (C) GSF CURRENT COMMENTS OR LATESTRENEW (R) PROPERTY COST/GSF TERM AND TYPE OF SOURCE USE OF BOARD APPROVAL,
LESSOR TERMINATE (T) LOCATION USER FY EXP. COST OPTION LEASE* OF FUNDS SPACE IF APPLICABLE
56 Pima County Parks and C 530 E. Whitehouse Canyon College of Agriculture N/A 07/01/17- DN State Office/Recreation #683 Continental, AZ Pima County Cooperative N/A 06/30/20 Classroom
Extension $1,200
57 Pinal County #736 R 820 Cottonwood Lane-Bldg. E Pinal County Cooperative 3,950 08/01/18- TN Sponsored OfficeCasa Grande, AZ Extension, First Things $3.34 07/31/19 Projects
First Program $13,200
58 Rail Yard, LLC #726 R 610 S. Park Ave., Room B1 College of Agriculture N/A 12/01/18- N Sponsored OfficeTucson, AZ N/A 11/30/19 Projects
$10,800
59 Ralph's Transfer, Inc. #611 R 4051 S. Longfellow Ave. College of Science 1,300 07/01/18- DN Auxiliary WarehouseTucson, AZ Optical Sciences $5.57 06/30/19
$7,238
60 Ralph's Transfer, Inc. #680 R 4051 S. Longfellow Ave. College of Science 8,100 01/18/19- DN Sponsored WarehouseTucson, AZ Steward Observatory $4.95 01/17/20 Projects
$40,085 Four 1-YearOptions
61 RASR Properties, Inc. #718 R 525 W. State St., Suite 3 College of Agriculture 500 07/01/18- N Sponsored OfficeHurricane, UT School of Natural Resources $12 06/30/19 Projects
and Environment $6,000
62 Rincon Research Corp. #715 T 101 N. Wilmot, Rm 428 VP for Research 123 06/01/18- N Designated Office Terminated 05/31/19Tucson, AZ DSRI $42.37 05/31/19
$5,211
63 RN Properties The Park, LLC C 4455 E. Camelback #E125 College of Medicine 2,310 03/01/18- N Restricted Office/#679 Phoenix, AZ Pediatrics $23.24 02/28/21 Clinical
$53,688
Page 38 of 67
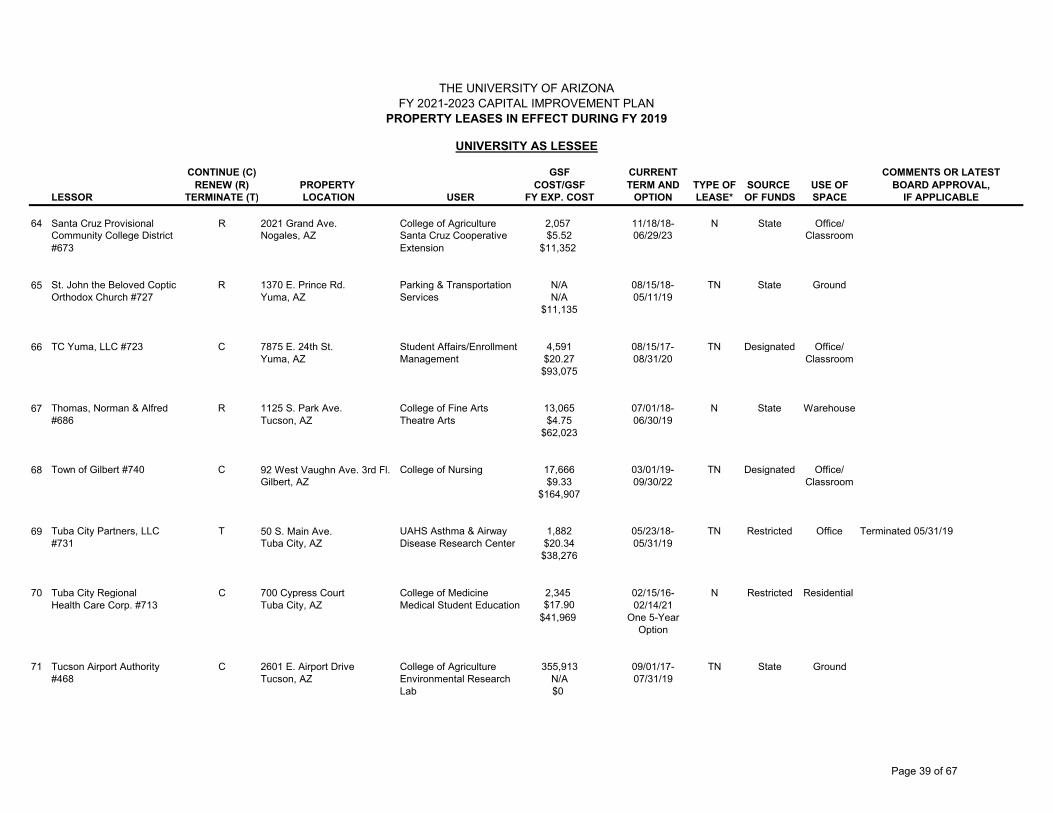
THE UNIVERSITY OF ARIZONAFY 2021-2023 CAPITAL IMPROVEMENT PLAN
PROPERTY LEASES IN EFFECT DURING FY 2019
UNIVERSITY AS LESSEE
CONTINUE (C) GSF CURRENT COMMENTS OR LATESTRENEW (R) PROPERTY COST/GSF TERM AND TYPE OF SOURCE USE OF BOARD APPROVAL,
LESSOR TERMINATE (T) LOCATION USER FY EXP. COST OPTION LEASE* OF FUNDS SPACE IF APPLICABLE
64 Santa Cruz Provisional R 2021 Grand Ave. College of Agriculture 2,057 11/18/18- N State Office/Community College District Nogales, AZ Santa Cruz Cooperative $5.52 06/29/23 Classroom #673 Extension $11,352
65 St. John the Beloved Coptic R 1370 E. Prince Rd. Parking & Transportation N/A 08/15/18- TN State GroundOrthodox Church #727 Yuma, AZ Services N/A 05/11/19
$11,135
66 TC Yuma, LLC #723 C 7875 E. 24th St. Student Affairs/Enrollment 4,591 08/15/17- TN Designated Office/Yuma, AZ Management $20.27 08/31/20 Classroom
$93,075
67 Thomas, Norman & Alfred R 1125 S. Park Ave. College of Fine Arts 13,065 07/01/18- N State Warehouse#686 Tucson, AZ Theatre Arts $4.75 06/30/19
$62,023
68 Town of Gilbert #740 C 92 West Vaughn Ave. 3rd Fl. College of Nursing 17,666 03/01/19- TN Designated Office/Gilbert, AZ $9.33 09/30/22 Classroom
$164,907
69 Tuba City Partners, LLC T 50 S. Main Ave. UAHS Asthma & Airway 1,882 05/23/18- TN Restricted Office Terminated 05/31/19#731 Tuba City, AZ Disease Research Center $20.34 05/31/19
$38,276
70 Tuba City Regional C 700 Cypress Court College of Medicine 2,345 02/15/16- N Restricted Residential Health Care Corp. #713 Tuba City, AZ Medical Student Education $17.90 02/14/21
$41,969 One 5-YearOption
71 Tucson Airport Authority C 2601 E. Airport Drive College of Agriculture 355,913 09/01/17- TN State Ground#468 Tucson, AZ Environmental Research N/A 07/31/19
Lab $0
Page 39 of 67

THE UNIVERSITY OF ARIZONAFY 2021-2023 CAPITAL IMPROVEMENT PLAN
PROPERTY LEASES IN EFFECT DURING FY 2019
UNIVERSITY AS LESSEE
CONTINUE (C) GSF CURRENT COMMENTS OR LATESTRENEW (R) PROPERTY COST/GSF TERM AND TYPE OF SOURCE USE OF BOARD APPROVAL,
LESSOR TERMINATE (T) LOCATION USER FY EXP. COST OPTION LEASE* OF FUNDS SPACE IF APPLICABLE
72 Tucson Scottish Rite #220 C 202 E. Speedway College of Science 4,500 07/01/17 N Designated Office ABOR approval: 08/89Tucson, AZ Speech, Language & N/A 06/30/19
Hearing Sciences $1 AutomaticTwo-Year Options
73 UA Foundation #674 T 44 E. Broadway Blvd. SBS 1,800 07/17/13- TN Plant Funds Mixed Use Terminated 7/17/18Tucson, AZ $0.95 07/17/18
$1,701
74 UA Foundation #698 C 3591 N. Bear Canyon SBS N/A 03/23/15- TN N/A Residential Tucson, AZ Southwest Center N/A 03/22/20
$0 One 5-YearOption
75 UA Foundation #717 C 429 W. Crawford St. SBS N/A 07/11/16- TN N/A ResidentialNogales, AZ N/A 07/10/21
$0 One 5-Year Option
76 University & Euclid, LLC C 811 N. Euclid Ave. University Relations 4,800 07/01/05- DN State Office ABOR approval: 03/05#542 Tucson, AZ Visitor Center $47.31 06/30/25
$227,109 One 10-YearOption
77 University South Foundation, C 1140 N. Colombo Ave. UA South 3,600 07/01/17- DN State Office/Inc. #639 Sierra Vista, AZ $4.58 06/30/19 Classroom
$16,500
78 University South Foundation, C 1140 N. Colombo Ave. UA South 12,600 07/01/17- DN State Office/Inc. #640 Sierra Vista, AZ $10.15 06/30/19 Classroom
$127,891
79 Upsilon Alpha Bldg. Corp. T 1801 E. First St. Residence Life 26,000 07/01/18- DN Auxiliary Residential Terminated 06/30/19#689 Tucson, AZ $7.58 06/30/19
$197,155
Page 40 of 67
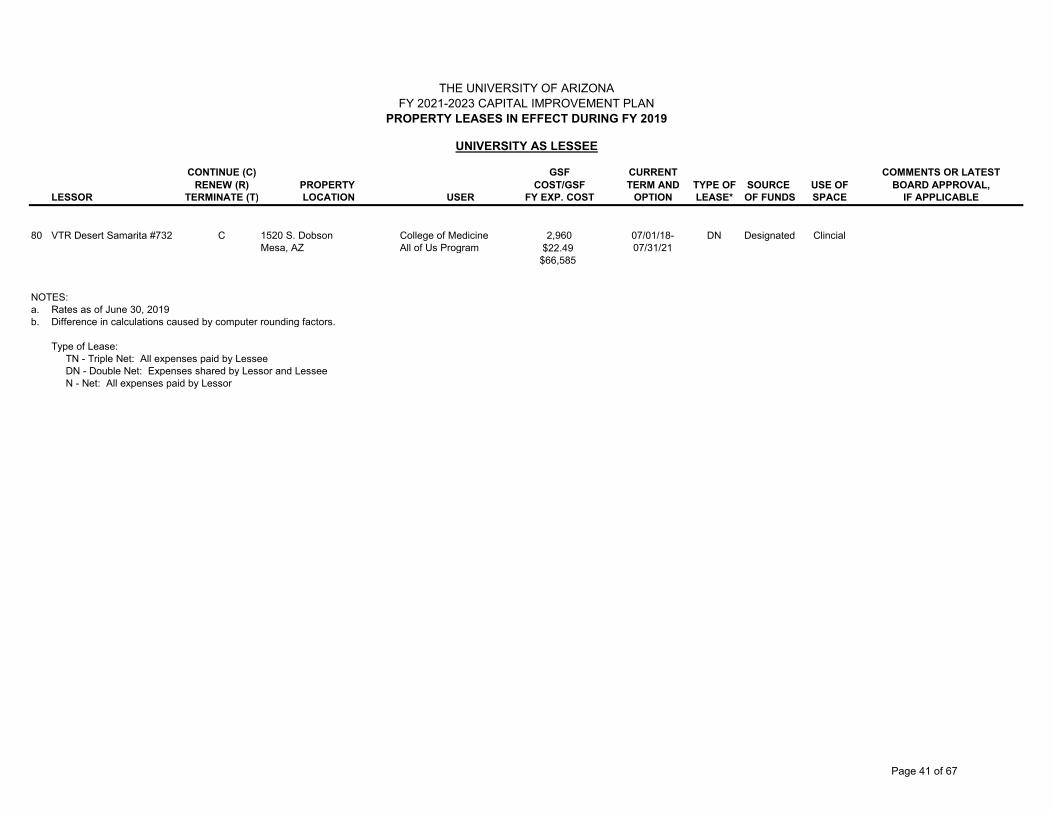
THE UNIVERSITY OF ARIZONAFY 2021-2023 CAPITAL IMPROVEMENT PLAN
PROPERTY LEASES IN EFFECT DURING FY 2019
UNIVERSITY AS LESSEE
CONTINUE (C) GSF CURRENT COMMENTS OR LATESTRENEW (R) PROPERTY COST/GSF TERM AND TYPE OF SOURCE USE OF BOARD APPROVAL,
LESSOR TERMINATE (T) LOCATION USER FY EXP. COST OPTION LEASE* OF FUNDS SPACE IF APPLICABLE
80 VTR Desert Samarita #732 C 1520 S. Dobson College of Medicine 2,960 07/01/18- DN Designated Clincial Mesa, AZ All of Us Program $22.49 07/31/21
$66,585
NOTES:a. Rates as of June 30, 2019b. Difference in calculations caused by computer rounding factors.
Type of Lease: TN - Triple Net: All expenses paid by Lessee DN - Double Net: Expenses shared by Lessor and Lessee N - Net: All expenses paid by Lessor
Page 41 of 67
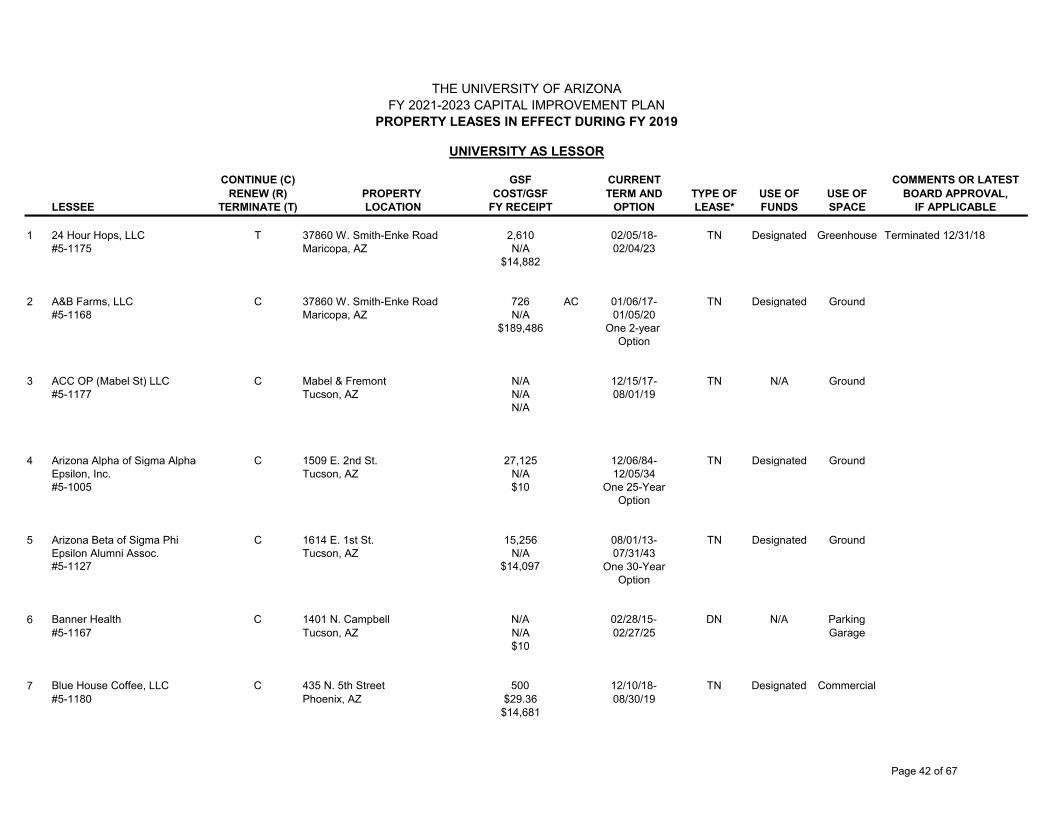
THE UNIVERSITY OF ARIZONAFY 2021-2023 CAPITAL IMPROVEMENT PLAN
PROPERTY LEASES IN EFFECT DURING FY 2019
UNIVERSITY AS LESSOR
CONTINUE (C) GSF CURRENT COMMENTS OR LATESTRENEW (R) PROPERTY COST/GSF TERM AND TYPE OF USE OF USE OF BOARD APPROVAL,
LESSEE TERMINATE (T) LOCATION FY RECEIPT OPTION LEASE* FUNDS SPACE IF APPLICABLE
1 24 Hour Hops, LLC T 37860 W. Smith-Enke Road 2,610 02/05/18- TN Designated Greenhouse Terminated 12/31/18#5-1175 Maricopa, AZ N/A 02/04/23
$14,882
2 A&B Farms, LLC C 37860 W. Smith-Enke Road 726 AC 01/06/17- TN Designated Ground #5-1168 Maricopa, AZ N/A 01/05/20
$189,486 One 2-year Option
3 ACC OP (Mabel St) LLC C Mabel & Fremont N/A 12/15/17- TN N/A Ground#5-1177 Tucson, AZ N/A 08/01/19
N/A
4 Arizona Alpha of Sigma Alpha C 1509 E. 2nd St. 27,125 12/06/84- TN Designated GroundEpsilon, Inc. Tucson, AZ N/A 12/05/34#5-1005 $10 One 25-Year
Option
5 Arizona Beta of Sigma Phi C 1614 E. 1st St. 15,256 08/01/13- TN Designated GroundEpsilon Alumni Assoc. Tucson, AZ N/A 07/31/43#5-1127 $14,097 One 30-Year
Option
6 Banner Health C 1401 N. Campbell N/A 02/28/15- DN N/A Parking#5-1167 Tucson, AZ N/A 02/27/25 Garage
$10
7 Blue House Coffee, LLC C 435 N. 5th Street 500 12/10/18- TN Designated Commercial#5-1180 Phoenix, AZ $29.36 08/30/19
$14,681
Page 42 of 67
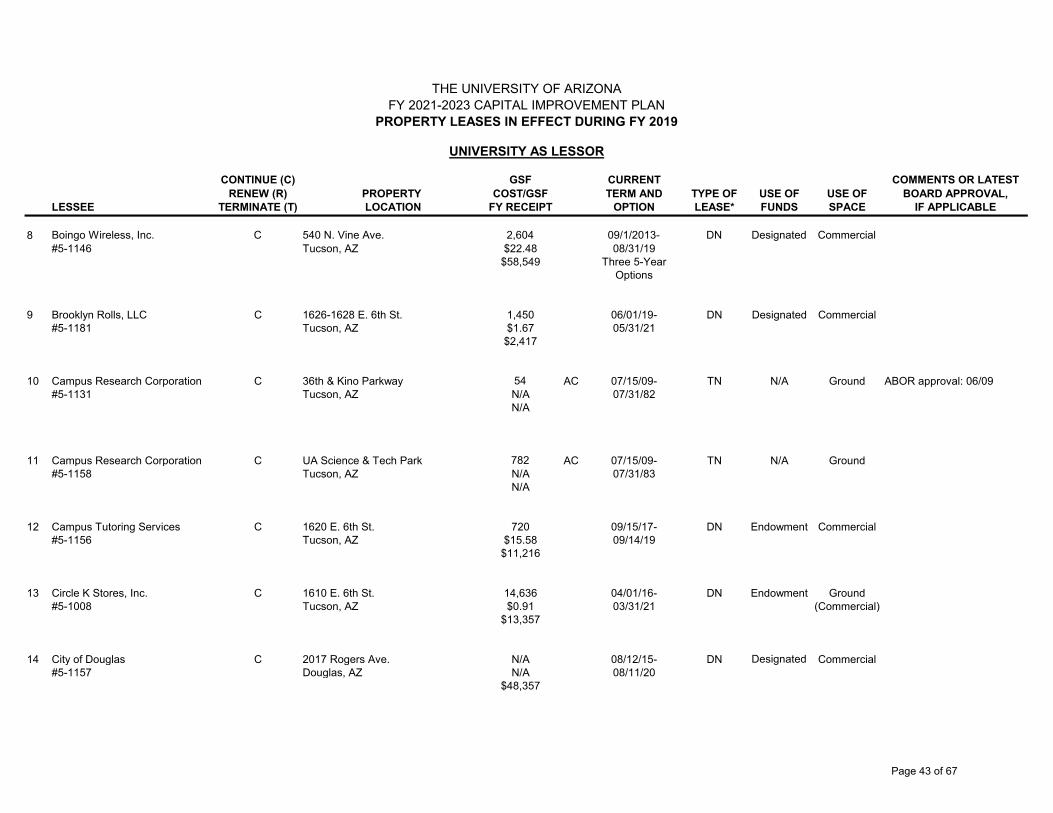
THE UNIVERSITY OF ARIZONAFY 2021-2023 CAPITAL IMPROVEMENT PLAN
PROPERTY LEASES IN EFFECT DURING FY 2019
UNIVERSITY AS LESSOR
CONTINUE (C) GSF CURRENT COMMENTS OR LATESTRENEW (R) PROPERTY COST/GSF TERM AND TYPE OF USE OF USE OF BOARD APPROVAL,
LESSEE TERMINATE (T) LOCATION FY RECEIPT OPTION LEASE* FUNDS SPACE IF APPLICABLE
8 Boingo Wireless, Inc. C 540 N. Vine Ave. 2,604 09/1/2013- DN Designated Commercial#5-1146 Tucson, AZ $22.48 08/31/19
$58,549 Three 5-YearOptions
9 Brooklyn Rolls, LLC C 1626-1628 E. 6th St. 1,450 06/01/19- DN Designated Commercial#5-1181 Tucson, AZ $1.67 05/31/21
$2,417
10 Campus Research Corporation C 36th & Kino Parkway 54 AC 07/15/09- TN N/A Ground ABOR approval: 06/09#5-1131 Tucson, AZ N/A 07/31/82
N/A
11 Campus Research Corporation C UA Science & Tech Park 782 AC 07/15/09- TN N/A Ground#5-1158 Tucson, AZ N/A 07/31/83
N/A
12 Campus Tutoring Services C 1620 E. 6th St. 720 09/15/17- DN Endowment Commercial#5-1156 Tucson, AZ $15.58 09/14/19
$11,216
13 Circle K Stores, Inc. C 1610 E. 6th St. 14,636 04/01/16- DN Endowment Ground#5-1008 Tucson, AZ $0.91 03/31/21 (Commercial)
$13,357
14 City of Douglas C 2017 Rogers Ave. N/A 08/12/15- DN Designated Commercial#5-1157 Douglas, AZ N/A 08/11/20
$48,357
Page 43 of 67
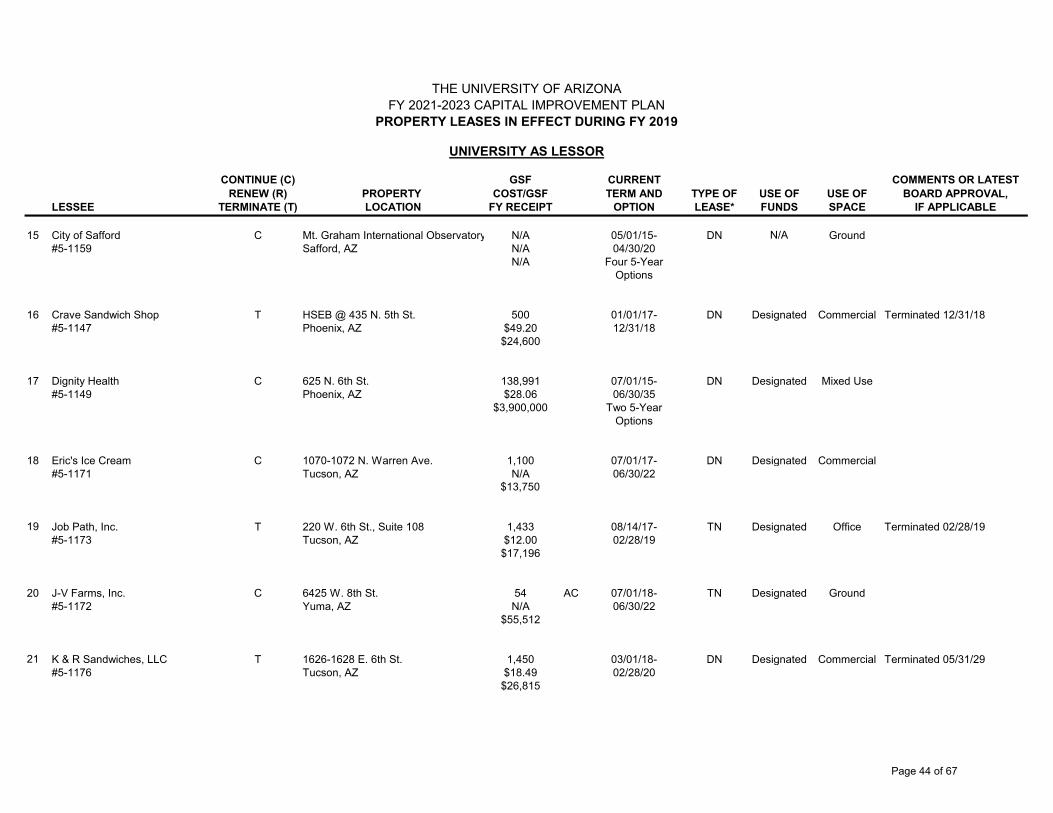
THE UNIVERSITY OF ARIZONAFY 2021-2023 CAPITAL IMPROVEMENT PLAN
PROPERTY LEASES IN EFFECT DURING FY 2019
UNIVERSITY AS LESSOR
CONTINUE (C) GSF CURRENT COMMENTS OR LATESTRENEW (R) PROPERTY COST/GSF TERM AND TYPE OF USE OF USE OF BOARD APPROVAL,
LESSEE TERMINATE (T) LOCATION FY RECEIPT OPTION LEASE* FUNDS SPACE IF APPLICABLE
15 City of Safford C Mt. Graham International Observatory N/A 05/01/15- DN N/A Ground#5-1159 Safford, AZ N/A 04/30/20
N/A Four 5-YearOptions
16 Crave Sandwich Shop T HSEB @ 435 N. 5th St. 500 01/01/17- DN Designated Commercial Terminated 12/31/18#5-1147 Phoenix, AZ $49.20 12/31/18
$24,600
17 Dignity Health C 625 N. 6th St. 138,991 07/01/15- DN Designated Mixed Use#5-1149 Phoenix, AZ $28.06 06/30/35
$3,900,000 Two 5-YearOptions
18 Eric's Ice Cream C 1070-1072 N. Warren Ave. 1,100 07/01/17- DN Designated Commercial#5-1171 Tucson, AZ N/A 06/30/22
$13,750
19 Job Path, Inc. T 220 W. 6th St., Suite 108 1,433 08/14/17- TN Designated Office Terminated 02/28/19#5-1173 Tucson, AZ $12.00 02/28/19
$17,196
20 J-V Farms, Inc. C 6425 W. 8th St. 54 AC 07/01/18- TN Designated Ground#5-1172 Yuma, AZ N/A 06/30/22
$55,512
21 K & R Sandwiches, LLC T 1626-1628 E. 6th St. 1,450 03/01/18- DN Designated Commercial Terminated 05/31/29#5-1176 Tucson, AZ $18.49 02/28/20
$26,815
Page 44 of 67
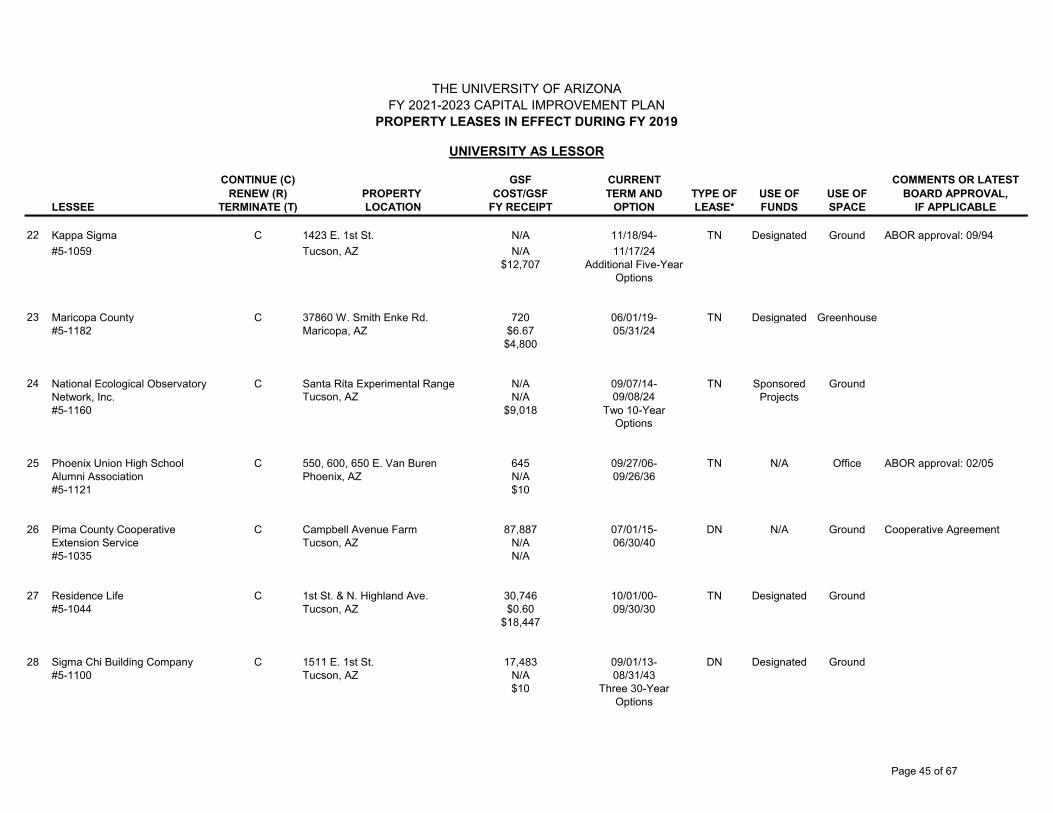
THE UNIVERSITY OF ARIZONAFY 2021-2023 CAPITAL IMPROVEMENT PLAN
PROPERTY LEASES IN EFFECT DURING FY 2019
UNIVERSITY AS LESSOR
CONTINUE (C) GSF CURRENT COMMENTS OR LATESTRENEW (R) PROPERTY COST/GSF TERM AND TYPE OF USE OF USE OF BOARD APPROVAL,
LESSEE TERMINATE (T) LOCATION FY RECEIPT OPTION LEASE* FUNDS SPACE IF APPLICABLE
22 Kappa Sigma C 1423 E. 1st St. N/A 11/18/94- TN Designated Ground ABOR approval: 09/94#5-1059 Tucson, AZ N/A 11/17/24
$12,707 Additional Five-YearOptions
23 Maricopa County C 37860 W. Smith Enke Rd. 720 06/01/19- TN Designated Greenhouse#5-1182 Maricopa, AZ $6.67 05/31/24
$4,800
24 National Ecological Observatory C Santa Rita Experimental Range N/A 09/07/14- TN Sponsored GroundNetwork, Inc. Tucson, AZ N/A 09/08/24 Projects#5-1160 $9,018 Two 10-Year
Options
25 Phoenix Union High School C 550, 600, 650 E. Van Buren 645 09/27/06- TN N/A Office ABOR approval: 02/05Alumni Association Phoenix, AZ N/A 09/26/36#5-1121 $10
26 Pima County Cooperative C Campbell Avenue Farm 87,887 07/01/15- DN N/A Ground Cooperative AgreementExtension Service Tucson, AZ N/A 06/30/40#5-1035 N/A
27 Residence Life C 1st St. & N. Highland Ave. 30,746 10/01/00- TN Designated Ground
#5-1044 Tucson, AZ $0.60 09/30/30$18,447
28 Sigma Chi Building Company C 1511 E. 1st St. 17,483 09/01/13- DN Designated Ground#5-1100 Tucson, AZ N/A 08/31/43
$10 Three 30-YearOptions
Page 45 of 67

THE UNIVERSITY OF ARIZONAFY 2021-2023 CAPITAL IMPROVEMENT PLAN
PROPERTY LEASES IN EFFECT DURING FY 2019
UNIVERSITY AS LESSOR
CONTINUE (C) GSF CURRENT COMMENTS OR LATESTRENEW (R) PROPERTY COST/GSF TERM AND TYPE OF USE OF USE OF BOARD APPROVAL,
LESSEE TERMINATE (T) LOCATION FY RECEIPT OPTION LEASE* FUNDS SPACE IF APPLICABLE
29 Sigma Kappa/Zeta Omicron C 1588 E. 1st St. 17,875 07/01/03- TN Designated Ground#5-1097 Tucson, AZ N/A 07/30/33
$11,825 5-yearOptions
Tumamoc Hill Leases, Tucson, AZ
30 Journal Broadcast Group, Inc. R Tumamoc Hill 625 07/01/18- N Designated GroundKGUN Tucson, AZ $43.93 06/30/21 #5-1026 $27,459
31 KVOA Communications, Inc. C Tumamoc Hill 640 07/01/16- N Designated Ground#5-1028 Tucson, AZ $29.67 06/30/19
$18,987
32 SFPP, Limited Partnership C Tumamoc Hill 1.92 AC 07/01/16- N Designated Ground#5-1042 Tucson, AZ N/A 06/30/19
$949
33 Southwest Gas Corporation C Tumamoc Hill 0.35 AC 07/01/16- N Designated Ground#5-1043 Tucson, AZ N/A 06/30/19
$949
34 Tucson Electric Power Company C Tumamoc Hill 0.12 AC 07/01/16- N Designated Ground#5-1047 Tucson, AZ N/A 06/30/19
$949
35 Arizona Department of Public C Tumamoc Hill N/A 07/01/16- N N/A GroundSafety Tucson, AZ N/A 06/30/19#5-1051 N/A
36 University of Arizona Foundation C 714 E. Van Buren 397 01/01/17- N Designated Office#5-1169 Phoenix, AZ $25.19 12/31/19
$10,000
Page 46 of 67
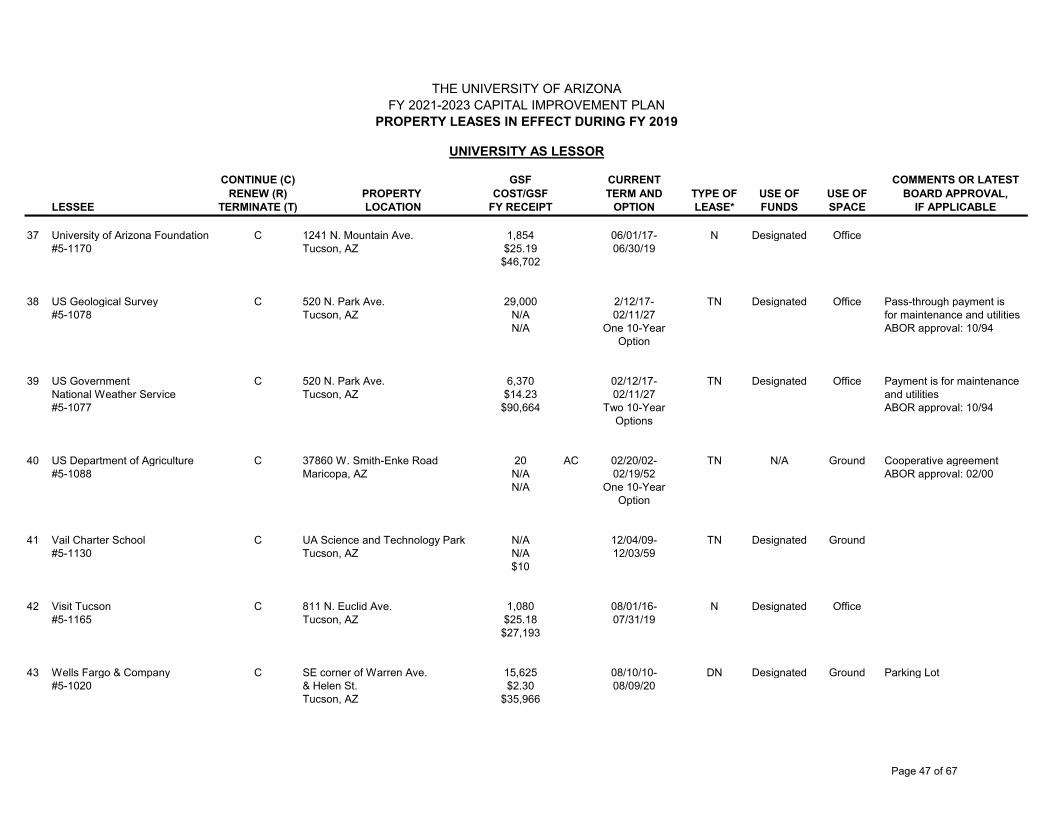
THE UNIVERSITY OF ARIZONAFY 2021-2023 CAPITAL IMPROVEMENT PLAN
PROPERTY LEASES IN EFFECT DURING FY 2019
UNIVERSITY AS LESSOR
CONTINUE (C) GSF CURRENT COMMENTS OR LATESTRENEW (R) PROPERTY COST/GSF TERM AND TYPE OF USE OF USE OF BOARD APPROVAL,
LESSEE TERMINATE (T) LOCATION FY RECEIPT OPTION LEASE* FUNDS SPACE IF APPLICABLE
37 University of Arizona Foundation C 1241 N. Mountain Ave. 1,854 06/01/17- N Designated Office#5-1170 Tucson, AZ $25.19 06/30/19
$46,702
38 US Geological Survey C 520 N. Park Ave. 29,000 2/12/17- TN Designated Office Pass-through payment is#5-1078 Tucson, AZ N/A 02/11/27 for maintenance and utilities
N/A One 10-Year ABOR approval: 10/94Option
39 US Government C 520 N. Park Ave. 6,370 02/12/17- TN Designated Office Payment is for maintenanceNational Weather Service Tucson, AZ $14.23 02/11/27 and utilities #5-1077 $90,664 Two 10-Year ABOR approval: 10/94
Options
40 US Department of Agriculture C 37860 W. Smith-Enke Road 20 AC 02/20/02- TN N/A Ground Cooperative agreement#5-1088 Maricopa, AZ N/A 02/19/52 ABOR approval: 02/00
N/A One 10-YearOption
41 Vail Charter School C UA Science and Technology Park N/A 12/04/09- TN Designated Ground#5-1130 Tucson, AZ N/A 12/03/59
$10
42 Visit Tucson C 811 N. Euclid Ave. 1,080 08/01/16- N Designated Office#5-1165 Tucson, AZ $25.18 07/31/19
$27,193
43 Wells Fargo & Company C SE corner of Warren Ave. 15,625 08/10/10- DN Designated Ground Parking Lot#5-1020 & Helen St. $2.30 08/09/20
Tucson, AZ $35,966
Page 47 of 67

THE UNIVERSITY OF ARIZONAFY 2021-2023 CAPITAL IMPROVEMENT PLAN
PROPERTY LEASES IN EFFECT DURING FY 2019
UNIVERSITY AS LESSOR
CONTINUE (C) GSF CURRENT COMMENTS OR LATESTRENEW (R) PROPERTY COST/GSF TERM AND TYPE OF USE OF USE OF BOARD APPROVAL,
LESSEE TERMINATE (T) LOCATION FY RECEIPT OPTION LEASE* FUNDS SPACE IF APPLICABLE
44 Whitfill Nurseries, Inc. C 37860 W. Smith-Enke Road 78 AC 06/01/17- TN Designated Ground#5-1174 Maricopa, AZ $261.00 08/09/20
$20,358
45 Yuma County Pest Abatement C Yuma Agriculture Center 9,600 12/01/18- TN Designated Ground #5-1150 Yuma, AZ N/A 11/30/23
$781
NOTES:a. Rates as of June 30, 2019b. Differences in calculations caused by computer rounding factor.
Type of Lease: TN - Triple Net: All expenses paid by Lessee DN - Double Net: Expenses shared by Lessor and Lessee N - Net: All expenses paid by Lessor
Page 48 of 67

University of Arizona
FY 2021-2022 Capital Improvement Plan
Land Report

THE UNIVERSITY OF ARIZONAFY 2021-2023 CAPITAL IMPROVEMENT PLAN
REPORT ON ACQUISITIONS AND SALES OF LAND AND IMPROVEMENTS*FY 2019
Location/ Land Building BoardReference Transaction Description/ Transaction Dollars/ Size Size ApprovedNumber Date Intended Use Funding Accounts (Acres) (GSF) (MM/YY)
ACQUISITIONSA1 07/09/18 2141 E. Third Street $1,297,500 15,820 sq.ft. 3,756 06/18
A2 07/18/18 1518 E. Seventh Street $290,000 8,000 sq.ft. 1,706 N/A
A3 08/20/18 44 E. Broadway Boulevard Gift N/A 1,803 N/A
A4 10/12/18 1516 E. Drachman Street $625,000 5,700 sq.ft. 2,230 09/18
A5 11/15/18 1051-1055 N. Warren Avenue $1,700,000 13,310 sq.ft. 3,633 09/18
A6 12/13/18 1010-1012 E. Sixth Street $270,000 4,888 sq.ft. 3,135 N/A
A7 12/21/18 310 N. Vine Street $195,000 7,169 sq.ft. 750 N/A
SALESS1 01/10/19 1700 E. Broadway Boulevard $27,100 1,241 sq.ft. N/A 09/18
Portion of Right of WayS2
NET (COST)/INCOME ($4,350,400.00)
* This report includes all transactions formally consummated by The University of Arizona between July 1, 2018 and June 30, 2019.
Page 49 of 67

University of Arizona
FY 2021-2022 Capital Improvement Plan
Capital Project Status Report
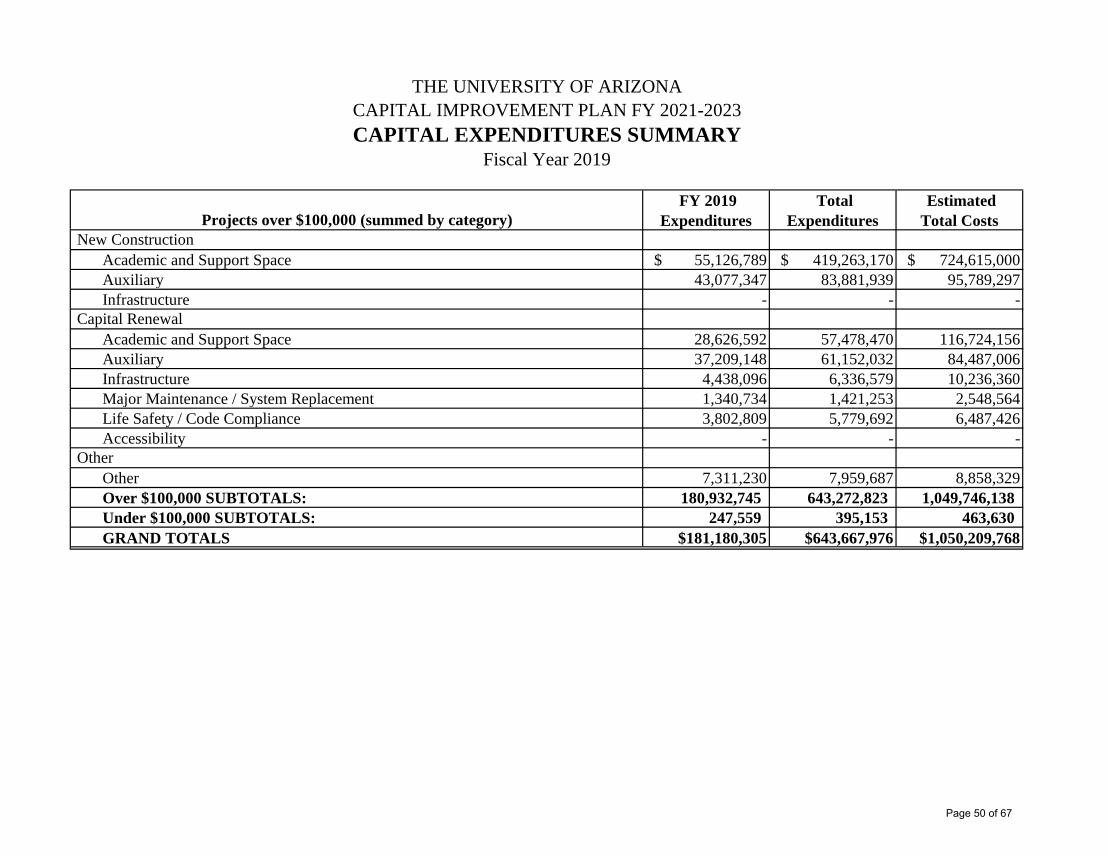
FY 2019 Expenditures
Total Expenditures
Estimated Total Costs
Academic and Support Space $ 55,126,789 $ 419,263,170 $ 724,615,000 Auxiliary 43,077,347 83,881,939 95,789,297Infrastructure - - -
Academic and Support Space 28,626,592 57,478,470 116,724,156Auxiliary 37,209,148 61,152,032 84,487,006Infrastructure 4,438,096 6,336,579 10,236,360Major Maintenance / System Replacement 1,340,734 1,421,253 2,548,564Life Safety / Code Compliance 3,802,809 5,779,692 6,487,426Accessibility - - -
Other 7,311,230 7,959,687 8,858,329Over $100,000 SUBTOTALS: 180,932,745 643,272,823 1,049,746,138 Under $100,000 SUBTOTALS: 247,559 395,153 463,630 GRAND TOTALS $181,180,305 $643,667,976 $1,050,209,768
Capital Renewal
Other
THE UNIVERSITY OF ARIZONACAPITAL IMPROVEMENT PLAN FY 2021-2023CAPITAL EXPENDITURES SUMMARY
Fiscal Year 2019
Projects over $100,000 (summed by category) New Construction
Page 50 of 67

Project NameProject Number
Project Category
Funding Source
FY 19 Expenditures
Total Expenditures to
Date % ExpendedEstimated
Total CostsCompletion
Date (mm/yy)BioSciences Research Lab FY 13 CIP 12-9134 NAS/NIN BOND 3,126,972$ 103,780,753$ 97% 107,500,000$ Dec-17Health Sciences Innovation Building 13-9193 NAS BOND 29,731,383 153,801,966 93% 165,000,000 Jun-18BioSciences Partnership Bldg, PHX Biomed Campus 14-9230 NAS BOND 479,521 132,378,575 97% 136,100,000 Jan-17Arizona Stadium Renovations 16-9330 CAX BOND 15,691,401 24,621,501 97% 25,463,000 TBD655 N. Alvernon, Building Renovations 16-9340 CAS BOND 364,330 7,475,097 99% 7,570,000 Dec-17Oro Valley Veterinarian Medical Program Improvement 17-9349 CAS SAP 3,092,756 3,116,701 39% 8,000,000 Mar-19Blg 90 Deferred Maintenance 17-9380 CAS BOND 11,574,475 17,079,367 95% 18,000,000 Jan-19Student Success District 17-9381 NAS MIXED 9,527,086 12,164,410 15% 81,000,000 Jan-21Hillenbrand Stadium Renovations 17-9382 CAX MIXED 7,548,482 7,824,714 98% 8,000,000 Feb-19Grand Challenges Research Building 18-9384 NAS BOND 7,543 7,543 0% 134,000,000 Nov-23McKale Memorial Center, Locker Room Suite 170 Remodel 18-9385 CAX MIXED 936,267 1,782,187 94% 1,900,000 Aug-18Applied Research Building 18-9386 NAS BOND 29,246 29,246 0% 50,000,000 Jul-21Hillenbrand Aquatic Center Renovation 18-9388 CAX MIXED 9,051,451 11,723,412 88% 13,250,000 Dec-18655 N Alvernon Building 491 FFE Procurement and Installation 18-9389 CAS BOND 42,623 961,775 96% 1,005,000 May-18Cole and Jeannie Davis Sports Center 18-9390 NAX MIXED 13,726,727 15,717,913 96% 16,300,000 Jan-19UA Honors Village 18-9395 NAS/NAX BOND 29,134,183 38,623,963 78% 49,724,297 Aug-19Hillenbrand Softball Stadium Enhancements 18-9412 CAX MIXED 1,768,430 1,919,750 97% 1,975,000 Feb-19Phx Biomed Sci Bldg 3rd and 4th Floor Finish Shell Space 19-9449 CAS MIXED 301,019 301,019 1% 34,000,000 Oct-20Steward Observatory Deferred Maintenance 19-9471 CAS SAP 114,520 114,520 1% 11,000,000 May-20
Project NameProject Number
Project Category
Funding Source
Estimated Total Costs % Completed
Completion Date (mm/yy)
UA Honors Village* 18-9395 NAS/NAX Private 100,325,100$ 85% Aug-19
*Project total includes subprojects for Dining $9.3M and Academic Spaces $6.8M which will be reimbursed to the third-party partner by the UA.
STATUS OF JCCR PROJECTSFY 2019 as of June 30, 2019
University Projects
Third-Party and Commercial Projects
Page 51 of 67
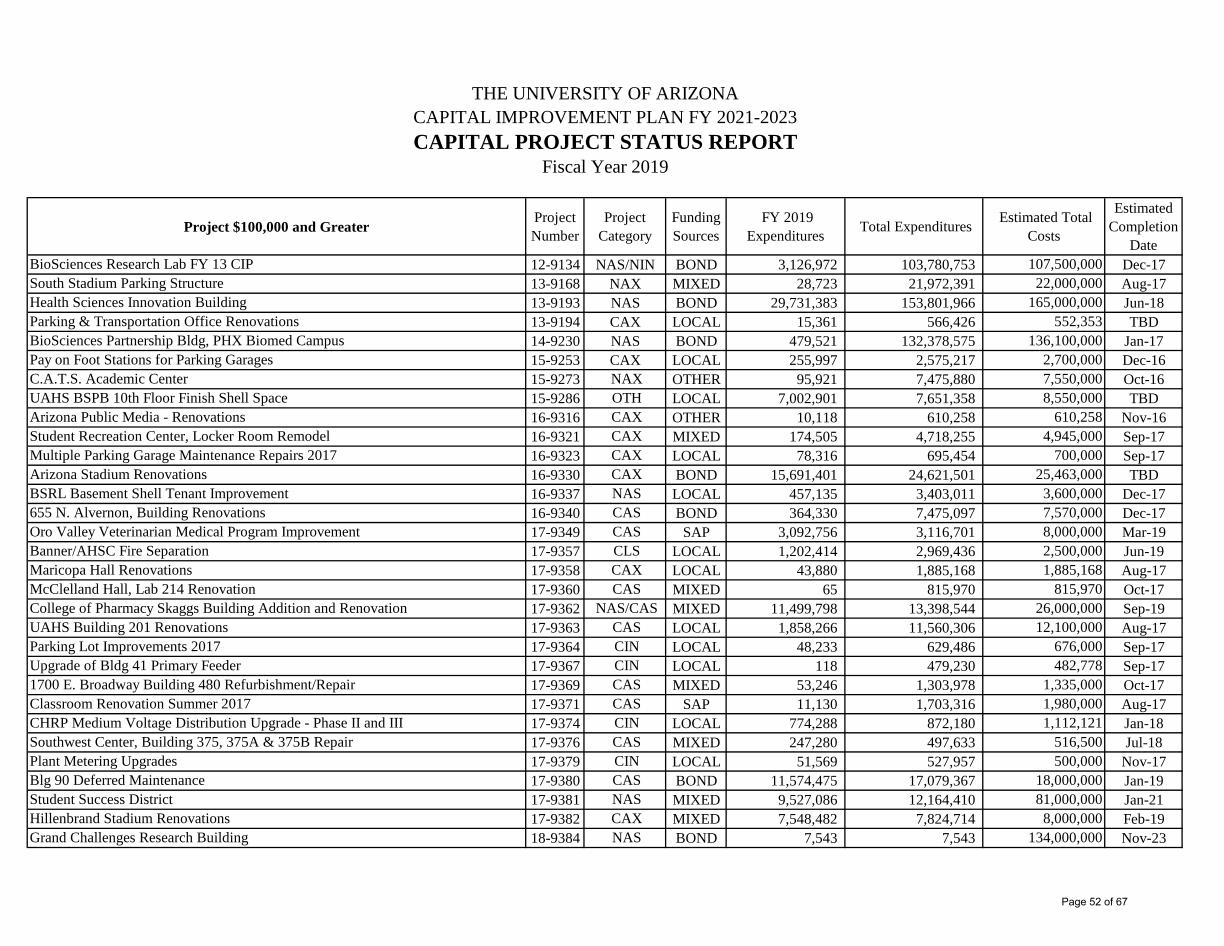
Project $100,000 and Greater Project Number
Project Category
Funding Sources
FY 2019 Expenditures Total Expenditures Estimated Total
Costs
Estimated Completion
DateBioSciences Research Lab FY 13 CIP 12-9134 NAS/NIN BOND 3,126,972 103,780,753 107,500,000 Dec-17South Stadium Parking Structure 13-9168 NAX MIXED 28,723 21,972,391 22,000,000 Aug-17Health Sciences Innovation Building 13-9193 NAS BOND 29,731,383 153,801,966 165,000,000 Jun-18Parking & Transportation Office Renovations 13-9194 CAX LOCAL 15,361 566,426 552,353 TBDBioSciences Partnership Bldg, PHX Biomed Campus 14-9230 NAS BOND 479,521 132,378,575 136,100,000 Jan-17Pay on Foot Stations for Parking Garages 15-9253 CAX LOCAL 255,997 2,575,217 2,700,000 Dec-16C.A.T.S. Academic Center 15-9273 NAX OTHER 95,921 7,475,880 7,550,000 Oct-16UAHS BSPB 10th Floor Finish Shell Space 15-9286 OTH LOCAL 7,002,901 7,651,358 8,550,000 TBDArizona Public Media - Renovations 16-9316 CAX OTHER 10,118 610,258 610,258 Nov-16Student Recreation Center, Locker Room Remodel 16-9321 CAX MIXED 174,505 4,718,255 4,945,000 Sep-17Multiple Parking Garage Maintenance Repairs 2017 16-9323 CAX LOCAL 78,316 695,454 700,000 Sep-17Arizona Stadium Renovations 16-9330 CAX BOND 15,691,401 24,621,501 25,463,000 TBDBSRL Basement Shell Tenant Improvement 16-9337 NAS LOCAL 457,135 3,403,011 3,600,000 Dec-17655 N. Alvernon, Building Renovations 16-9340 CAS BOND 364,330 7,475,097 7,570,000 Dec-17Oro Valley Veterinarian Medical Program Improvement 17-9349 CAS SAP 3,092,756 3,116,701 8,000,000 Mar-19Banner/AHSC Fire Separation 17-9357 CLS LOCAL 1,202,414 2,969,436 2,500,000 Jun-19Maricopa Hall Renovations 17-9358 CAX LOCAL 43,880 1,885,168 1,885,168 Aug-17McClelland Hall, Lab 214 Renovation 17-9360 CAS MIXED 65 815,970 815,970 Oct-17College of Pharmacy Skaggs Building Addition and Renovation 17-9362 NAS/CAS MIXED 11,499,798 13,398,544 26,000,000 Sep-19UAHS Building 201 Renovations 17-9363 CAS LOCAL 1,858,266 11,560,306 12,100,000 Aug-17Parking Lot Improvements 2017 17-9364 CIN LOCAL 48,233 629,486 676,000 Sep-17Upgrade of Bldg 41 Primary Feeder 17-9367 CIN LOCAL 118 479,230 482,778 Sep-171700 E. Broadway Building 480 Refurbishment/Repair 17-9369 CAS MIXED 53,246 1,303,978 1,335,000 Oct-17Classroom Renovation Summer 2017 17-9371 CAS SAP 11,130 1,703,316 1,980,000 Aug-17CHRP Medium Voltage Distribution Upgrade - Phase II and III 17-9374 CIN LOCAL 774,288 872,180 1,112,121 Jan-18Southwest Center, Building 375, 375A & 375B Repair 17-9376 CAS MIXED 247,280 497,633 516,500 Jul-18Plant Metering Upgrades 17-9379 CIN LOCAL 51,569 527,957 500,000 Nov-17Blg 90 Deferred Maintenance 17-9380 CAS BOND 11,574,475 17,079,367 18,000,000 Jan-19Student Success District 17-9381 NAS MIXED 9,527,086 12,164,410 81,000,000 Jan-21Hillenbrand Stadium Renovations 17-9382 CAX MIXED 7,548,482 7,824,714 8,000,000 Feb-19Grand Challenges Research Building 18-9384 NAS BOND 7,543 7,543 134,000,000 Nov-23
THE UNIVERSITY OF ARIZONACAPITAL IMPROVEMENT PLAN FY 2021-2023CAPITAL PROJECT STATUS REPORT
Fiscal Year 2019
Page 52 of 67
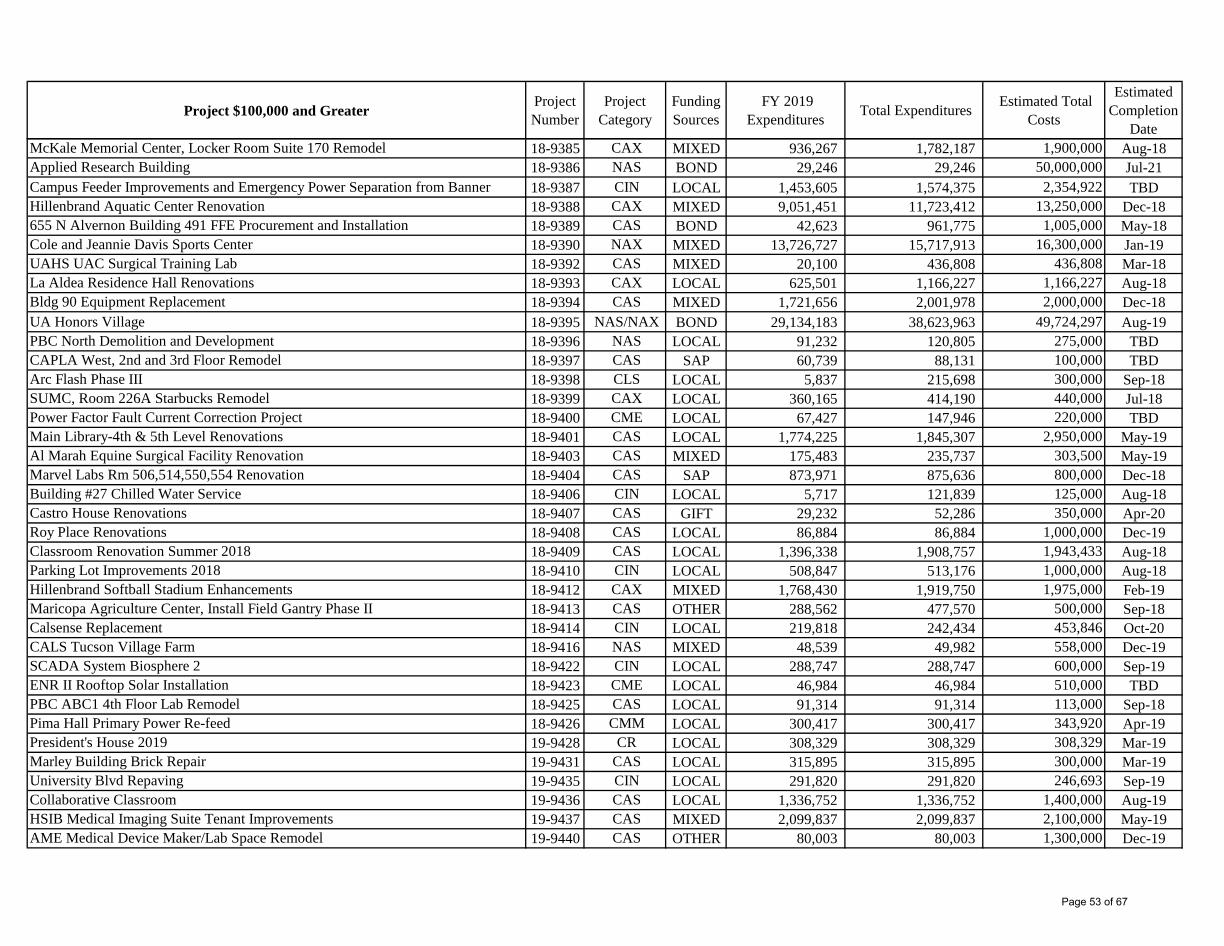
Project $100,000 and Greater Project Number
Project Category
Funding Sources
FY 2019 Expenditures Total Expenditures Estimated Total
Costs
Estimated Completion
DateMcKale Memorial Center, Locker Room Suite 170 Remodel 18-9385 CAX MIXED 936,267 1,782,187 1,900,000 Aug-18Applied Research Building 18-9386 NAS BOND 29,246 29,246 50,000,000 Jul-21Campus Feeder Improvements and Emergency Power Separation from Banner 18-9387 CIN LOCAL 1,453,605 1,574,375 2,354,922 TBDHillenbrand Aquatic Center Renovation 18-9388 CAX MIXED 9,051,451 11,723,412 13,250,000 Dec-18655 N Alvernon Building 491 FFE Procurement and Installation 18-9389 CAS BOND 42,623 961,775 1,005,000 May-18Cole and Jeannie Davis Sports Center 18-9390 NAX MIXED 13,726,727 15,717,913 16,300,000 Jan-19UAHS UAC Surgical Training Lab 18-9392 CAS MIXED 20,100 436,808 436,808 Mar-18La Aldea Residence Hall Renovations 18-9393 CAX LOCAL 625,501 1,166,227 1,166,227 Aug-18Bldg 90 Equipment Replacement 18-9394 CAS MIXED 1,721,656 2,001,978 2,000,000 Dec-18UA Honors Village 18-9395 NAS/NAX BOND 29,134,183 38,623,963 49,724,297 Aug-19PBC North Demolition and Development 18-9396 NAS LOCAL 91,232 120,805 275,000 TBDCAPLA West, 2nd and 3rd Floor Remodel 18-9397 CAS SAP 60,739 88,131 100,000 TBDArc Flash Phase III 18-9398 CLS LOCAL 5,837 215,698 300,000 Sep-18SUMC, Room 226A Starbucks Remodel 18-9399 CAX LOCAL 360,165 414,190 440,000 Jul-18Power Factor Fault Current Correction Project 18-9400 CME LOCAL 67,427 147,946 220,000 TBDMain Library-4th & 5th Level Renovations 18-9401 CAS LOCAL 1,774,225 1,845,307 2,950,000 May-19Al Marah Equine Surgical Facility Renovation 18-9403 CAS MIXED 175,483 235,737 303,500 May-19Marvel Labs Rm 506,514,550,554 Renovation 18-9404 CAS SAP 873,971 875,636 800,000 Dec-18Building #27 Chilled Water Service 18-9406 CIN LOCAL 5,717 121,839 125,000 Aug-18Castro House Renovations 18-9407 CAS GIFT 29,232 52,286 350,000 Apr-20Roy Place Renovations 18-9408 CAS LOCAL 86,884 86,884 1,000,000 Dec-19Classroom Renovation Summer 2018 18-9409 CAS LOCAL 1,396,338 1,908,757 1,943,433 Aug-18Parking Lot Improvements 2018 18-9410 CIN LOCAL 508,847 513,176 1,000,000 Aug-18Hillenbrand Softball Stadium Enhancements 18-9412 CAX MIXED 1,768,430 1,919,750 1,975,000 Feb-19Maricopa Agriculture Center, Install Field Gantry Phase II 18-9413 CAS OTHER 288,562 477,570 500,000 Sep-18Calsense Replacement 18-9414 CIN LOCAL 219,818 242,434 453,846 Oct-20CALS Tucson Village Farm 18-9416 NAS MIXED 48,539 49,982 558,000 Dec-19SCADA System Biosphere 2 18-9422 CIN LOCAL 288,747 288,747 600,000 Sep-19ENR II Rooftop Solar Installation 18-9423 CME LOCAL 46,984 46,984 510,000 TBDPBC ABC1 4th Floor Lab Remodel 18-9425 CAS LOCAL 91,314 91,314 113,000 Sep-18Pima Hall Primary Power Re-feed 18-9426 CMM LOCAL 300,417 300,417 343,920 Apr-19President's House 2019 19-9428 CR LOCAL 308,329 308,329 308,329 Mar-19Marley Building Brick Repair 19-9431 CAS LOCAL 315,895 315,895 300,000 Mar-19University Blvd Repaving 19-9435 CIN LOCAL 291,820 291,820 246,693 Sep-19Collaborative Classroom 19-9436 CAS LOCAL 1,336,752 1,336,752 1,400,000 Aug-19HSIB Medical Imaging Suite Tenant Improvements 19-9437 CAS MIXED 2,099,837 2,099,837 2,100,000 May-19AME Medical Device Maker/Lab Space Remodel 19-9440 CAS OTHER 80,003 80,003 1,300,000 Dec-19
Page 53 of 67

Project $100,000 and Greater Project Number
Project Category
Funding Sources
FY 2019 Expenditures Total Expenditures Estimated Total
Costs
Estimated Completion
DateFire Alarm-Sprinkler Upgrades 19-9441 CLS LOCAL 1,280,255 1,280,255 2,087,426 Jun-19Electrical Code Compliance 19-9442 CLS LOCAL 1,314,302 1,314,302 1,600,000 Jun-19Roof Replacement 19-9443 CMM LOCAL 3,407 3,407 315,150 Aug-19Plumbing 19-9444 CMM LOCAL 335,291 335,291 390,000 Jun-19Keyless Access (Phases 4-6) 19-9445 CMM LOCAL 283,120 283,120 328,378 Jun-19Building Automation Upgrades 19-9446 CMM LOCAL 304,089 304,089 441,116 Aug-19AME Room N229 Supersonic Wind Tunnel Installation 19-9447 CAS SAP 19,294 19,294 495,000 Nov-19Phx Biomed Sci Bldg 3rd and 4th Floor Finish Shell Space 19-9449 CAS MIXED 301,019 301,019 34,000,000 Oct-20South Stadium Rowhouses 19-9450 NAS/NAX LOCAL 91,793 91,793 215,000 Dec-19Ina Gittings Tunnel Improvements 19-9451 CIN LOCAL 165,601 165,601 170,000 Jun-19Bear Down Gym Tunnel Repair 19-9456 CIN LOCAL 111,752 111,752 115,000 Jun-19Center for Creative Photography, 2019 Remodeling and Renovations 19-9458 CAS LOCAL 8,952 8,952 2,600,000 Jun-20Tumamoc Hill Repaving 19-9459 CIN MIXED 205,919 205,919 200,000 Mar-19UA Global Center, Park Student Union Renovations 19-9463 CAX LOCAL 97,243 97,243 8,500,000 Jul-21Arizona Stadium, Scholarship Suites Renovations 19-9464 CAX LOCAL 541,320 541,320 2,900,000 Aug-19Bldg. 2 Art and Art Museum Upgrades 19-9465 CAS SAP 112,599 112,599 299,945 Dec-19HSIB, Levels 1, 2, and 6 Remodeling 19-9466 CAS SAP 109,685 109,685 150,000 Nov-19CAPLA Addition and Renovation 19-9468 NAS/CAS SAP 18,917 18,917 450,000 TBDUA Central Date Palm Laboratory (Oman) 19-9469 NAS OTHER 95,934 95,934 132,000 TBDSteward Observatory Deferred Maintenance 19-9471 CAS SAP 114,520 114,520 11,000,000 May-20Center for Integrative Medicine 19-9472 NAS OTHER 13,483 13,483 20,000,000 Dec-21Yavapai Building Renewal 19-9475 CAX LOCAL 10,710 10,710 9,500,000 Jul-20Keating Building BSL Level 3 Safety Labs 19-9478 CAS LOCAL 212,348 212,348 130,000 Aug-19Coconino Tunnel Improvements 19-9480 CIN LOCAL 150,908 150,908 1,900,000 Sep-19Anthropology Tunnel Improvements 19-9481 CIN LOCAL 161,154 161,154 300,000 Jun-19Summer Classroom Renovations 19-9483 CAS LOCAL 153,015 153,015 1,130,000 Aug-19
$ 180,932,745 $ 643,272,823 $ 1,049,746,138 SUBTOTALS: Projects $100,000 and Greater
Page 54 of 67
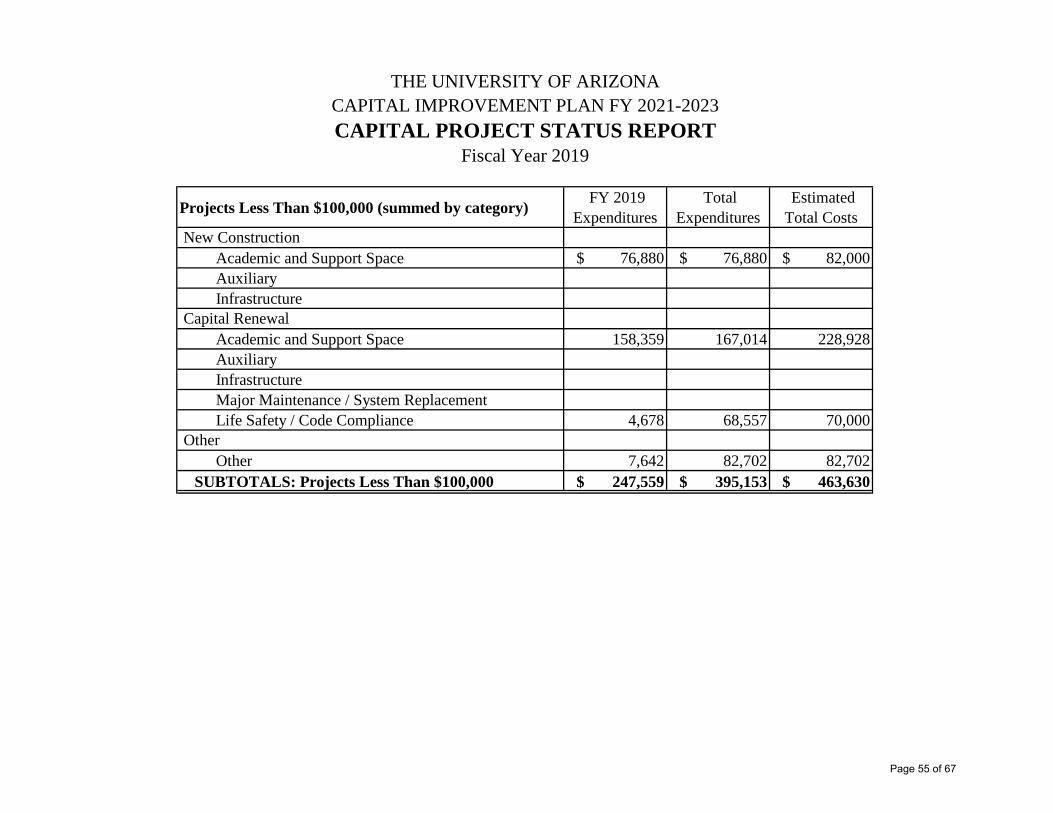
Projects Less Than $100,000 (summed by category) FY 2019 Expenditures
Total Expenditures
Estimated Total Costs
Academic and Support Space $ 76,880 $ 76,880 $ 82,000 AuxiliaryInfrastructure
Academic and Support Space 158,359 167,014 228,928AuxiliaryInfrastructureMajor Maintenance / System ReplacementLife Safety / Code Compliance 4,678 68,557 70,000
Other 7,642 82,702 82,702SUBTOTALS: Projects Less Than $100,000 $ 247,559 $ 395,153 $ 463,630
Other
THE UNIVERSITY OF ARIZONACAPITAL IMPROVEMENT PLAN FY 2021-2023CAPITAL PROJECT STATUS REPORT
Fiscal Year 2019
New Construction
Capital Renewal
Page 55 of 67
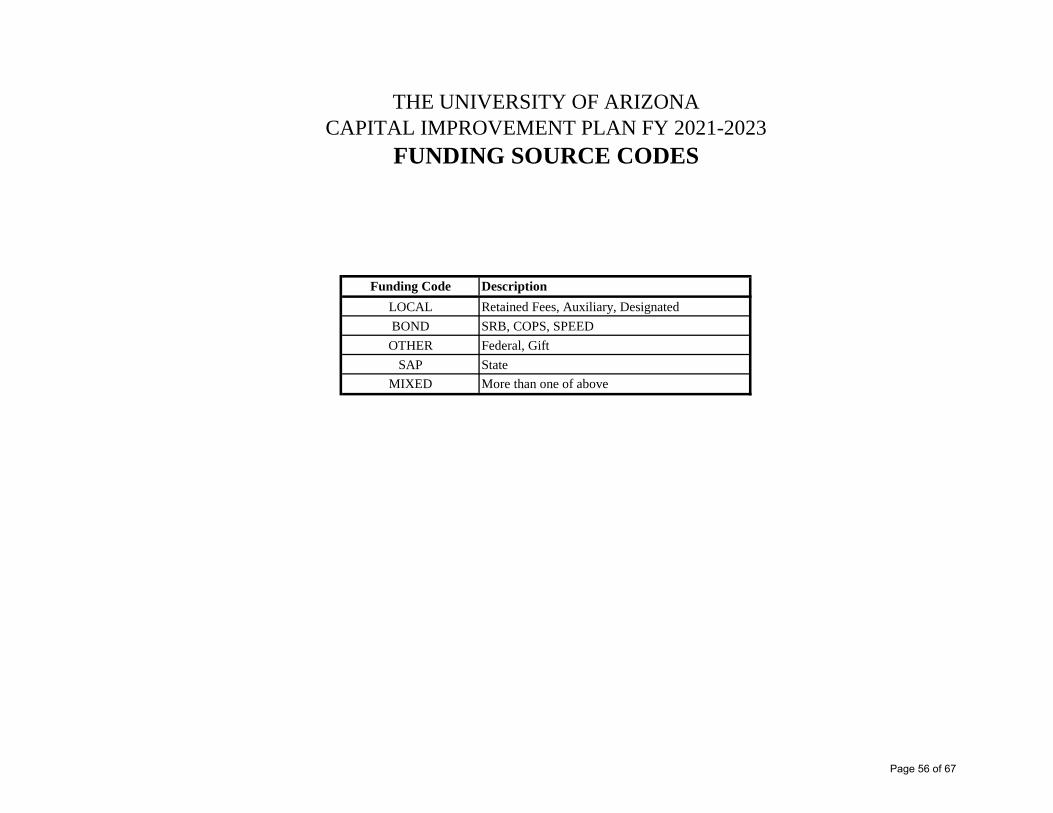
Funding Code DescriptionLOCAL Retained Fees, Auxiliary, DesignatedBOND SRB, COPS, SPEED
OTHER Federal, GiftSAP State
MIXED More than one of above
THE UNIVERSITY OF ARIZONACAPITAL IMPROVEMENT PLAN FY 2021-2023
FUNDING SOURCE CODES
Page 56 of 67

Major Category Project Category UA Code DefinitionNew Construction --- NC The creation of a new facility or the addition, expansion, or extension of an existing facility that adds to the building's
overall Gross Square Footage.New Construction Academic and Support Space NAS The creation of a new academic, research or other support facility or the addition, expansion, or extension of an existing
academic or support facility that adds to the building's overall Gross Square Footage. Includes building demolition where such demolition is necessary for the construction of a new building or facility.
New Construction Auxiliary NAX The creation of a new auxiliary facility or the addition, expansion, or extension of an existing auxiliary facility that adds to the building's overall Gross Square Footage. Includes building demolitions where such demolition is necessary for the construction of a new building or facility.
New Construction Infrastructure NIN Construction or expansion of new basic support systems and components that deliver to buildings such common utility services as heating/cooling, water and sewer, electricity, gas, telecommunications etc. Also includes support systems and components such as roadways, sidewalks, parking lots, external lighting, landscaping and irrigation systems where such systems and components are not part of another New Construction project.
Capital Renewal --- CR Renovation, replacement, and improvement made to the existing facilities and infrastructure.Capital Renewal Academic and Support Space CAS The reconfiguration of existing academic, research or other support space which includes alteration or upgrading of major
systems, components, and fixed equipment which extends the useful life of the building or a portion of the building that is necessitated by facility obsolescence, change in use, code requirements, physical plant wear-out etc.
Capital Renewal Auxiliary CAX The reconfiguration of existing auxiliary space which includes alteration or upgrading of major systems, components, and fixed equipment which extends the useful life of the building or a portion of the building that is necessitated by facility obsolescence, change in use, code requirements, physical plant wear-out etc.
Capital Renewal Infrastructure CIN Renewal or replacement of existing basic support systems and components that deliver to buildings such common utility services as heating/cooling, water and sewer, electricity, gas, telecommunications etc. Also includes support systems and components such as roadways, sidewalks, parking lots, external lighting, landscaping and irrigation systems, where such systems and components are not part of another Capital Renewal project.
Capital Renewal Accessibility CAD Necessary for compliance with the American with Disabilities Act and other measures to make facilities accessible for individuals with disabilities that substantially limits one or more life activity, e.g., exterior building access, doorway widths, toilet facilities, drinking fountains, special signage, telecommunication, assistive listening systems, path of travel issues, etc.
Capital Renewal Life Safety / Code Compliance CLS Necessary to eliminate a hazardous condition that threatens life or property, or is necessary to comply with state and federal regulations, e.g., fire safety, code compliance, environmental regulations, etc.
Capital Renewal Major Maintenance / System Replacement
CMM Renewal and replacement of capitalized buildings systems and components due to the end of their useful life, physical plant wear out or obsolescence, e.g. renewal of fixed equipment, roof replacements, HVAC systems, plumbing systems, electrical systems, window systems, flooring, elevators, etc.
Capital Renewal Major Maintenance - Energy Conservation/Cost Savings
CME Projects that will achieve savings in current energy consumption or provide substantial savings in operating costs, e.g., upgrading HVAC systems, retrofitting lighting fixtures, installing variable drive motors, installing soft start motors, installing energy management systems etc.
Capital Renewal Other COT Other improvements and expenses related to existing facilities and infrastructure which are not included under other Capital Renewal categories.
Other Other OTH Other improvements to facilities and infrastructure which are not included under New Construction or Capital Renewal categories. Examples include completion of shell space, and facilities related studies.
THE UNIVERSITY OF ARIZONACAPITAL IMPROVEMENT PLAN FY 2021-2023
CAPITAL PROJECT CATEGORIES
Page 57 of 67

This page intentionally left blank

University of Arizona
FY 2021-2022 Capital Improvement Plan
Three-Year Capital Plan

THE UNIVERSITY OF ARIZONA CAPITAL IMPROVEMETN PLAN FY 2021-2023
ONE-YEAR CAPITAL PLAN (FY 2021)
PROJECT NAME PROJECT DESCRIPTION FUND METHOD
ESTIMATED PROJECT
COST
Chemistry Building Renovation
This Strategic Initiative project is a high-visibility renovation of the centrally located, historic Chemistry building to convert it into an innovative-teaching hub. Primary program elements include centrally-scheduled collaborative classrooms and informal learning spaces on the first two levels, offices on the 3rd floor for the new Office of General Education and the Department of Chemistry & Biochemistry, along with some remaining core chemistry functions that also serve several adjoining buildings. The $42 million total project cost will be bond-funded, with supplemental funds from the State allocation for deferred maintenance.
System Revenue
Bonds $42,000,000
Center for Integrative Medicine
A new 34,000gsf facility for the Andrew Weil Center for Integrative Medicine (AWCIM) to be located North East of Building 190 Highland Parking Garage at Mabel Street and Vine Avenue, on the campus of The University of Arizona, Tucson, Arizona. The facility and its exterior spaces will house three critical functions: clinical, educational and administrative. The Center will facilitate the fundamental goal of creating a physical environment that supports the evidence based philosophy of integrative medicine. The proposed Center will support a distinctive life-enhancing environment that will attract the local community, national and international visitors. In order to support wellness and healing, the physical space will need to be an effective combination of sensory stimuli that results in a meaningful experience enhancing the wellbeing for staff and visitors.
Gift Funding $20,000,000
System Revenue Bonds (SRB) $42,000,000 Gift Funding (GIF) $20,000,000
TOTAL $62,000,000
Page 58 of 67

THE UNIVERSITY OF ARIZONA CAPITAL IMPROVEMENT PLAN FY 2021-2023 TWO-YEAR CAPITAL PLAN (FY 2022-2023)
PROJECT NAME PROJECT DESCRIPTION
Graduate Housing (P3 Project) The University is exploring the potential to facilitate additional graduate student housing on campus
Hotel Conference Center (P3 Project) The University is exploring the potential to facilitate a hotel and conference center campus use
Phoenix Center for Collaboration and Outreach
(P3 Project) The University is exploring the potential to facilitate a collaboration center at or near the downtown Phoenix campus
College of Architecture, Planning and Landscape
Architecture (CAPLA) Reconfiguration of CAPLA’s current space to improve space utilization and provide facilities that will enhance learning.
Facilities Management Relocation and Consolidation New facility to relocate and consolidate Facilities Management operation
University Office Building The University is exploring the potential to provide a new office facility to facilitate growth and consolidation
Deferred Maintenance Deferred maintenance to highest priority buildings and building systems across campus.
AZPM/SBS New Facility A multi-disciplinary facility to house Arizona Public Media (AZPM), and three related Social Behavioral Sciences department programs, Information School, Communication and Journalism. Consideration will be given to the possibility of co-locating partner organizations
Page 59 of 67

THE UNIVERSITY OF ARIZONA CAPITAL IMPROVEMENT PLAN FY 2021-2023 TWO-YEAR CAPITAL PLAN (FY 2022-2023)
PROJECT NAME PROJECT DESCRIPTION
Engineering Design Center New building to include hands-on Makerspace for the Engineering Senior Design Capstone course, offices and conference rooms for faculty and staff who will operate the Engineering Senior Design Capstone course.
Laboratory Modernization and Renovations
Renovations will facilitate the increased utilization of existing, inefficient research lab space and reduce the new building needs
Centennial Hall Renovations
This renovation and expansion will address the most critical needs of patrons, performance and support. The renovations include improving seating and sight lines, acoustics/sound, adding restrooms, and improving point of sale opportunities. This project will also prioritize future improvement opportunities for potential donors including amenities such as additional rehearsal, lecture and lounge space, and will investigate improved loading dock, lighting and parking opportunities.
Campus Infrastructure-Central
Core campus infrastructure improvements to support increased utility loads from new and planned facilities, increase efficiencies and ensure reliability.
The University of Arizona Chilled Water Central Plant – Phoenix Downtown Campus
A central chilled water plant for the University of Arizona downtown Phoenix campus. This plant would efficiently accommodate existing facilities as current services contracts expire and will create much needed capacity for new growth.
Land Acquisition Real Estate within the designated University planning area is limited and rapidly increasing in cost. The University will seek to acquire strategic properties as they become available to accommodate critical planned growth.
Arizona Stadium Improvements Additional upgrades and repairs to Arizona Stadium.
Page 60 of 67

University of Arizona
FY 2021-2022 Capital Improvement Plan
FY 2021 Project Description, Scope and Cost

THE UNIVERSITY OF ARIZONA
CAPITAL IMPROVEMENT PLAN FY 2021-2023
ONE-YEAR CAPITAL PLAN (FY 2021)
PROJECT DESCRIPTION
PROJECT NAME: Chemistry Building Renovation
DESCRIPTIONThis Strategic Initiative project is a high-visibility renovation of the centrally located, historic Chemistry building to convert it into an innovative-teaching hub. Primary program elements include centrally-scheduled collaborative classrooms and informal learning spaces on the first two levels, offices on the 3rd floor for the new Office of General Education and the Department of Chemistry & Biochemistry, along with some remaining core chemistry functions that also serve several adjoining buildings. The $42 million total project cost will be bond-funded, with supplemental funds from the State allocation for deferred maintenance.
JUSTIFICATIONAs a component of Pillar 1 under the University of Arizona Strategic Plan, this project will provide additional general classrooms that support evidence-based teaching strategies, including collaboration, inclusive practices, and active learning. The primary goals for these active and collaborative learning strategies are in increased student learning, engagement, and development of workplace-relevant skills. The Chemistry Building has also been identified for much needed life-cycle renovations, including deferred maintenance, life safety improvements, providing universal accessibility, code upgrades, and meeting university sustainability guidelines and commitments.
Page 61 of 67

THE UNIVERSITY OF ARIZONA
CAPITAL IMPROVEMENT PLAN FY 2021-2023
ONE-YEAR CAPITAL PLAN (FY 2021)
Project Scope: 76,000 GSF 51,000 NASF
Category (1) Cost Funding Source Amount Category Total Costs
Land Acquisition $0 SAP $9,000,000 Utilities $167,600Construction $28,180,000 Ret. Tuition $33,000,000 Personnel* $254,400
A&E Fees $4,175,000 Other $125,500FF&E $4,230,000 Total $547,500
Other $5,415,000Total $42,000,000 Total $42,000,000
Total Cost FY 2020 FY 2021 FY 2022 FY 2023 Phase Start Date
$42 million $7.2 million $30.8 million $4 million $0 Planning Spring 2019Design Fall 2019
Construction Fall 2020Occupancy Spring 2022
Notes:(1) Land Acquisition - land purchase price; Construction - site development, construction, fixed equipment, utility extension, parking & landscaping, etc.; A&E Fees - architect and engineering, and other professional services; FF&E - furniture, fixtures and equipment; Other - construction administration, construction surveying, insurance, and start-up testing/commissioning.
Proposed Work Schedule
Estimated Change in Annual Facility
Fund Source: Local and/or Indirect Cost
Operation & Maintenance
Proposed Funding Schedule
Proposed Financing
Construction Cost: $371 / GSF Total Project Cost: $553 / GSF
PROJECT SCOPE & COST
* FTE = 5.53
Capital Cost Estimate
PROJECT NAME: Chemistry Building Renovation
Page 62 of 67

THE UNIVERSITY OF ARIZONA
CAPITAL IMPROVEMENT PLAN FY 2021-2023
ONE-YEAR CAPITAL PLAN (FY 2021)
PROJECT DESCRIPTION
PROJECT NAME: Center for Integrative Medicine
DESCRIPTIONA new 34,000gsf facility for the Andrew Weil Center for Integrative Medicine (AWCIM) to be located North East of Building 190 Highland Parking Garage at Mabel Street and Vine Avenue, on the campus of The University of Arizona, Tucson, Arizona. The facility and its exterior spaces will house three critical functions: clinical, educational and administrative. The Center will facilitate the fundamental goal of creating a physical environment that supports the evidence based philosophy of integrative medicine. The proposed Center will support a distinctive life-enhancing environment that will attract the local community, national and international visitors. In order to support wellness and healing, the physical space will need to be an effective combination of sensory stimuli that results in a meaningful experience enhancing the wellbeing for staff and visitors.
JUSTIFICATIONLocating the Center for Integrative Medicine (CIM) on the campus of the University of Arizona and adjacent to the Health Sciences is critical to the programs' vision, goals and future growth and supports the University's program offerings goals.
Page 63 of 67

THE UNIVERSITY OF ARIZONA
CAPITAL IMPROVEMENT PLAN FY 2021-2023
ONE-YEAR CAPITAL PLAN (FY 2021)
Project Scope: 34,000 GSF 20,500 NASF
Category (1) Cost Funding Source Amount Category Total Costs
Land Acquisition $0 Gift $20,000,000 Utilities $75,000Construction $14,115,000 Personnel* $113,800
A&E Fees $1,850,000 Other $56,100FF&E $705,000 Total $244,900
Other $3,330,000Total $20,000,000 Total $20,000,000
Total Cost FY 2019 FY 2020 FY 2021 FY 2022 Phase Start Date
$20,000,000 $3,000,000 $15,000,000 $2,000,000 $0 Planning July, 2019Design October, 2019
Construction September, 2020Occupancy December, 2021
Notes:(1) Land Acquisition - land purchase price; Construction - site development, construction, fixed equipment, utility extension, parking & landscaping, etc.; A&E Fees - architect and engineering, and other professional services; FF&E - furniture, fixtures and equipment; Other - construction administration, construction surveying, insurance, and start-up testing/commissioning.
Proposed Work Schedule
Estimated Change in Annual Facility
Fund Source: Local and/or Indirect Cost
Operation & Maintenance
Proposed Funding Schedule
Proposed Financing
Construction Cost: $415 / GSF Total Project Cost: $588 / GSF
PROJECT SCOPE & COST
* FTE = 2.48
Capital Cost Estimate
PROJECT NAME: Center for Integrative Medicine
Page 64 of 67

This page intentionally left blank
University of Arizona
FY 2021-2022 Capital Improvement Plan
Debt Report

THE UNIVERSITY OF ARIZONA
FY 2021-2023 CAPITAL IMPROVEMENT PLAN ANNUAL ASSESSMENT OF DEBT CAPACITY
This summary Annual Assessment of Debt Capacity demonstrates The University of Arizona’s ability to finance additional capital constructions through debt instruments. A complete debt capacity report is available from the Board of Regents Central Office. BACKGROUND: Through the debt capacity report, for projects proposed to be funded by debt, The University must demonstrate its ability to service
debt (principal and interest) and comply with the debt ratio limit (8%) established by ABOR policy and state statute (A.R.S. 15-1683). The University Financial Services Office estimates revenues and expenditures through FY2028 using historical data from the audited financial statements and information from various internal sources. Notable revenue projections include an increase of 5.6 percent in State Appropriations for FY2020 followed by an average increase of 2.4 percent for the subsequent fiscal years. Tuition and Fees revenue is projected to rise by 3.4 percent in FY2020 and an average growth of 2.0 percent for the subsequent fiscal years due to anticipated growth in enrollment, enrollment mix, and tuition rates. If state appropriations are made available to offset tuition increases, the tuition revenue growth related to rate increases will be adjusted accordingly.
The outstanding debt for The University at the end of FY2019 is estimated to be $1.62 billion, which is $20.1 million more than
FY2018. This is the result of the University retiring $76.3 million in outstanding principal and incurring $96.4 million of new debt. Annual debt service on System Revenue Bonds (SRBs) and Certificates of Participation (COPs) was approximately $107.3 million in FY2019, or about 5.0 percent of total expenses. This ratio is below the ABOR policy and State Statute maximum limit of 8 percent.
This debt ratio analysis is based on the University’s current outstanding debt, projects in the approved FY2019 Capital Development
Plan (CDP), and the projects in the first year of the FY 2021-2023 Capital Improvement Plan (CIP). The projected highest debt ratio is 5.3 percent in FY 2022 with the annual debt service of $120.0 million of total expenses excluding SPEED Bonds, 6.5 percent or $147.5 million including SPEED Bonds. The outstanding debt in that year would be approximately $1.63 billion.
Existing Debt Service on SRBs and
COPs as a Percentage of Total Expenses
(Estimated as of FY2019 year-end)
Projected Debt Service 1 on SRBs
and COPs as a Percentage of Total Expenses, excluding / including SPEED 3 projects
financings 5.0% 2,4 5.3% 2 / 6.5% 2
Debt analysis notes are on the next page
Page 65 of 67
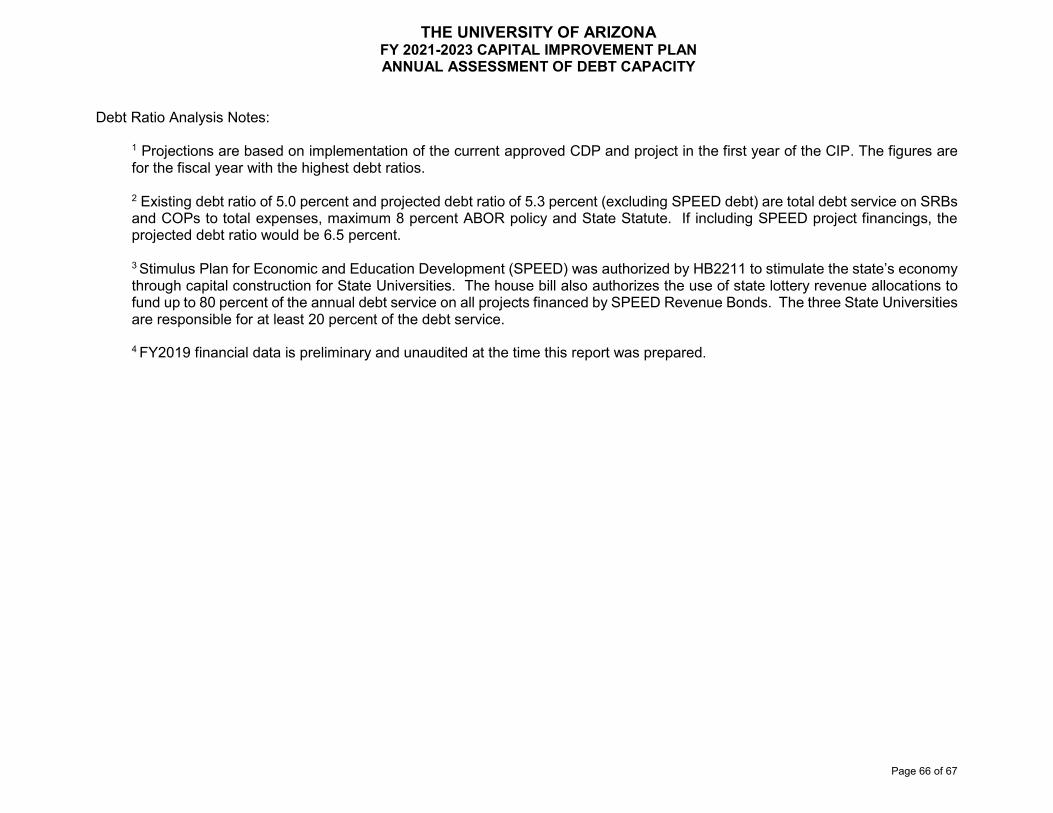
THE UNIVERSITY OF ARIZONA FY 2021-2023 CAPITAL IMPROVEMENT PLAN ANNUAL ASSESSMENT OF DEBT CAPACITY
Debt Ratio Analysis Notes: 1 Projections are based on implementation of the current approved CDP and project in the first year of the CIP. The figures are
for the fiscal year with the highest debt ratios. 2 Existing debt ratio of 5.0 percent and projected debt ratio of 5.3 percent (excluding SPEED debt) are total debt service on SRBs
and COPs to total expenses, maximum 8 percent ABOR policy and State Statute. If including SPEED project financings, the projected debt ratio would be 6.5 percent.
3 Stimulus Plan for Economic and Education Development (SPEED) was authorized by HB2211 to stimulate the state’s economy
through capital construction for State Universities. The house bill also authorizes the use of state lottery revenue allocations to fund up to 80 percent of the annual debt service on all projects financed by SPEED Revenue Bonds. The three State Universities are responsible for at least 20 percent of the debt service.
4 FY2019 financial data is preliminary and unaudited at the time this report was prepared.
Page 66 of 67

THE UNIVERSITY OF ARIZONASUPPLEMENTAL DEBT INFORMATION
As of June 30, 2019Interest Year of Original Outstanding at
Issue Rates Maturity Issue June 30, 2019 2020 2021 2022 2023 2024 Thereafter Total System Revenue Bonds:2009A-System Revenue Bonds 4.00-5.00% 2020 202,370 5,685 5,968 5,9682012A-System Revenue Bonds 4.00-5.00% 2042 74,050 56,845 5,001 5,008 5,005 5,005 3,260 73,756 97,0352012B-System Revenue Refunding Bonds 2.94-3.29% 2022 21,860 7,495 2,659 2,657 2,660 0 0 0 7,9762012C-System Revenue Refunding Bonds 2.386-3.912% 2034 43,920 27,315 3,214 3,227 3,228 6,010 6,014 11,339 33,0332013A-System Revenue Bonds 3.25-5.00% 2048 69,175 65,015 3,898 3,898 3,896 3,898 3,900 95,097 114,5872013B-System Revenue Refunding Bonds 3.375-5.00% 2048 34,985 27,855 3,955 2,510 2,515 2,516 2,515 25,883 39,8942014-System Revenue Refunding Bonds 4.00-5.00% 2029 16,025 10,505 1,742 1,141 1,142 1,141 1,138 7,436 13,7402015A-System Revenue Refunding Bonds 4.00-5.00% 2045 103,950 103,950 6,017 9,010 9,001 7,672 9,049 129,645 170,3942015B-System Revenue Refunding Bonds 1.93% 2020 14,660 3,675 3,746 3,7462016 - System Revenue Refunding Bonds 3.00-5.00% 2039 175,385 174,455 9,174 13,945 13,944 15,223 13,888 200,002 266,1762016A - System Revenue Refunding Bonds 3.00-5.00% 2040 44,175 39,340 3,094 3,097 3,092 3,089 4,843 36,754 53,9692016B - System Revenue Bonds 4.00-5.00% 2046 142,390 142,390 9,257 9,256 9,255 9,255 9,258 203,627 249,9062018A - System Revenue Bonds 3.25-5.00% 2043 93,995 93,240 6,558 6,564 6,568 6,571 6,569 124,819 157,6492018B - System Revenue Bonds 3.00-5.00% 2043 16,840 16,665 1,098 1,093 1,097 1,096 1,098 20,814 26,2962019A- System Revenue Bonds 4:00-5:00% 2044 55,405 55,405 3,827 3,833 3,831 3,831 3,833 76,646 95,8012019B- System Revenue Bonds 2.70-3.90% 2044 15,950 15,950 605 569 1,044 1,046 1,042 20,874 25,180Total System Revenue Bonds 1,125,135 845,785 69,813 65,807 66,277 66,354 66,406 1,026,692 1,361,350
2010-SPEED Revenue Bonds 5.208-6.643% 2045 147,475 135,805 12,710 12,629 12,540 12,432 12,327 196,078 258,7152011-SPEED Revenue Bonds 4.25-5.00% 2030 39,595 33,230 3,914 3,910 3,909 3,901 3,903 23,338 42,8752013-SPEED Revenue Bonds 3.75-5.00% 2049 70,125 66,665 4,331 4,330 4,327 4,325 4,330 97,006 118,6492014-SPEED Revenue Bonds 3.00-5.00% 2045 129,185 121,860 8,532 8,503 8,513 8,496 8,498 170,554 213,0962019-SPEED Revenue Bonds 2.54-3.94% 2045 15400 15,400 389 843 958 957 960 19,986 24,092
Total SPEED Revenue Bonds 401,780 372,960 29,875 30,215 30,247 30,111 30,017 506,962 657,427
Total Bonds Payable $1,526,915 $1,218,745 $99,689 $96,022 $96,524 $96,465 $96,423 $1,533,654 $2,018,777
Certificates of Participation and Capitalized Lease Obligations:1999A COPS (Student Union) 5.125% 2020 21,607 266 279 - - - - 279 2006 COPS (ABC Project) 4.30-5.00% 2031 18,240 11,415 1,250 1,248 1,250 1,250 1,253 8,751 15,002 2012A-2 COPS (Refi COPS 2003A) 3.02-3.42% 2022 10,190 3,740 1,331 1,329 1,329 - - 3,989 2012B COPS (Refi COPS 2002B) 4.00-5.00% 2023 20,600 10,095 2,843 2,843 2,840 2,861 - 11,387 2012C COPS (Refi COPS 2003B & 2004A) 3.00-5.00% 2031 124,940 100,470 13,049 13,040 11,041 11,040 11,047 74,156 133,373 2015A COPS (Refi COPS 2005A-2005D, 2005F-2005I, 2006A-2006C & 2006E) 5.000% 2025 89,470 52,305 15,310 11,901 11,879 9,410 9,483 2,005 59,988 2015B COP (Refi 2006C, 2006D & 2007A) 1.92-3.09% 2025 13,810 9,230 1,171 373 375 2,851 2,856 2,856 10,482 2018A COPS (Ref 2007B) 5.000% 2022 27,135 16,740 6,147 6,146 6,148 - - 18,441 2018B COPS (Ref 2007D) 5.000% 2031 32,430 28,555 3,218 3,228 3,224 3,225 3,221 22,543 38,659
Total Certificates of Participation 358,422 232,816 44,598 40,108 38,086 30,637 27,860 110,311 291,600
Other Capitalized Leases 3.255-5.00% Various 19,556 14,916 989 986 888 939 943 13,612 18,357
Total Certificates of Participation and Capitalized Leases $377,978 $247,732 $45,587 $41,094 $38,974 $31,576 $28,803 $123,923 $309,957
Total Bond & COPS Premium & Discount 154,537
Total UA Bonds, COPs, Capitalized Leases, Premium and Discount $1,904,893 $1,621,014 $145,276 $137,116 $135,498 $128,041 $125,226 $1,657,577 $2,328,734
UA Component Units Bonds and Note Payables:Campus Research Corporation:
Series A Bonds 5.08% 2022 8,250 2,245 715 752 778 2,245AAA TI Loan 3.75% 2023 832 628 130 135 140 145 78 628Ascensus TI Loan 3.99% 2026 2,000 1,729 201 209 217 226 240 636 1,7299052 Demo and Expansion Loan* 4.15% 2024 1,500 1,357 0
Total Campus Research Corporation 12,582 5,959 1,046 1,096 1,135 371 318 636 4,602
Alumni Association: 0Capitalized Leases 5.00% 2023 24 17 5 5 5 2 17Total Alumni Association 24 17 5 5 5 2 0 0 17
Total Component Units Bonds and Note Payables $12,606 $5,976 $1,051 $1,101 $1,140 $373 $318 $636 $4,619
Total UA and Component Units Outanding Debt $1,917,499 $1,626,990 $146,327 $138,217 $136,638 $128,414 $125,544 $1,658,213 $2,333,353
Note: * 9052 Demo and Expansion Loan has not been completely drawn down and amortization for payment has not yet been established.Note: Other component units of the University of Arizona (UA Foundation, Eller Executive Education and the Law College Association) do not have capital debt outstanding at June 30, 2019.
Page 67 of 67