boeing bump article additioinal methodologies recommended€¦ · boeing bump index – additional...
TRANSCRIPT
Boeing Bump Index – Additional Methodologies Recommended
Copyright 2015 Page 1 of 7 www.aprconsultants.com
The Boeing Bump Index – Additional Methodologies Recommended
By Michael Gerardi
The Boeing Bump Index (BBI) is a tool frequently used to evaluate pavement roughness on an
in-service runway. This tool is commonly associated with the FAA Advisory Circular FAA AC-
5380-9. This article was written to help readers understand the limitations of the BBI and to
demonstrate that relying exclusively on this tool could result in misdiagnosing a potentially
serious runway roughness problem. This article will illustrate two examples where the BBI
failed to accurately characterize roughness. The first is in a single roughness event that
consistently produced pilot and passenger complaints. The second example demonstrates the
BBI’s inability to accurately characterize multiple-event roughness. While this article illustrates
some critical flaws in the BBI, we do appreciate the FAA’s attempt to provide the industry with
some relevant guidance on runway roughness. However, we believe that the results of the BBI
are being accepted without further consideration, and as demonstrated in the following article
could lead to additional concerns. When evaluating ride quality issues, the BBI should not be
the only method or technology considered.
The basics of the BBI is that it simply compares a roughness event’s wavelength verses its
amplitude and categorizes that combination as either “Acceptable”, “Excessive” or
“Unacceptable”. This technique was originally used by the Boeing Commercial Airplane
Company to help its customers with ride quality issues. In 2009 it was adopted by the FAA as
an initial attempt at providing the airport pavement community with guidance on how to
characterize airfield pavement roughness.
Due to its nature, the BBI is only effective at characterizing some single-event roughness; single
event being a single bump or dip of any wavelength or amplitude. The BBI methodology can be
used to categorize that single event in one of the three categories (Figure 1). While this
method can be effective in some cases, due of its relative simplicity, it can also misdiagnose
roughness events.
Boeing Bump Index – Additional Methodologies Recommended
Copyright 2015 Page 2 of 7 www.aprconsultants.com
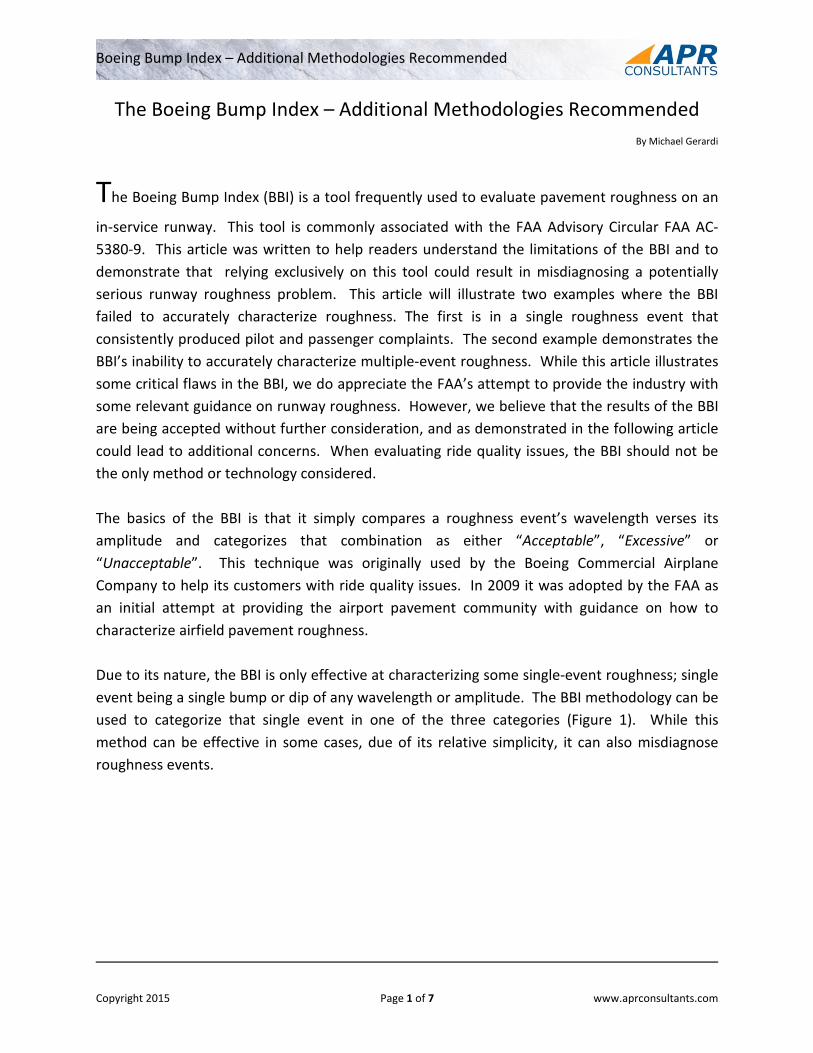
Figure 1. The criteria established by the Boeing Bump Index plotting bump height vs wavelength.
In over 20 years of analysis, we at APR have found that a large number of variables must come
together to determine whether or not a runway profile shape can have an adverse impact on
aircraft ride quality. For example, let’s look at the single bump/dip event that the BBI is capable
of categorizing. We have found that the aircraft’s response will largely be determined by the
location of that event on the runway, and the speed of the aircraft when the event is
encountered.
Single Event Roughness
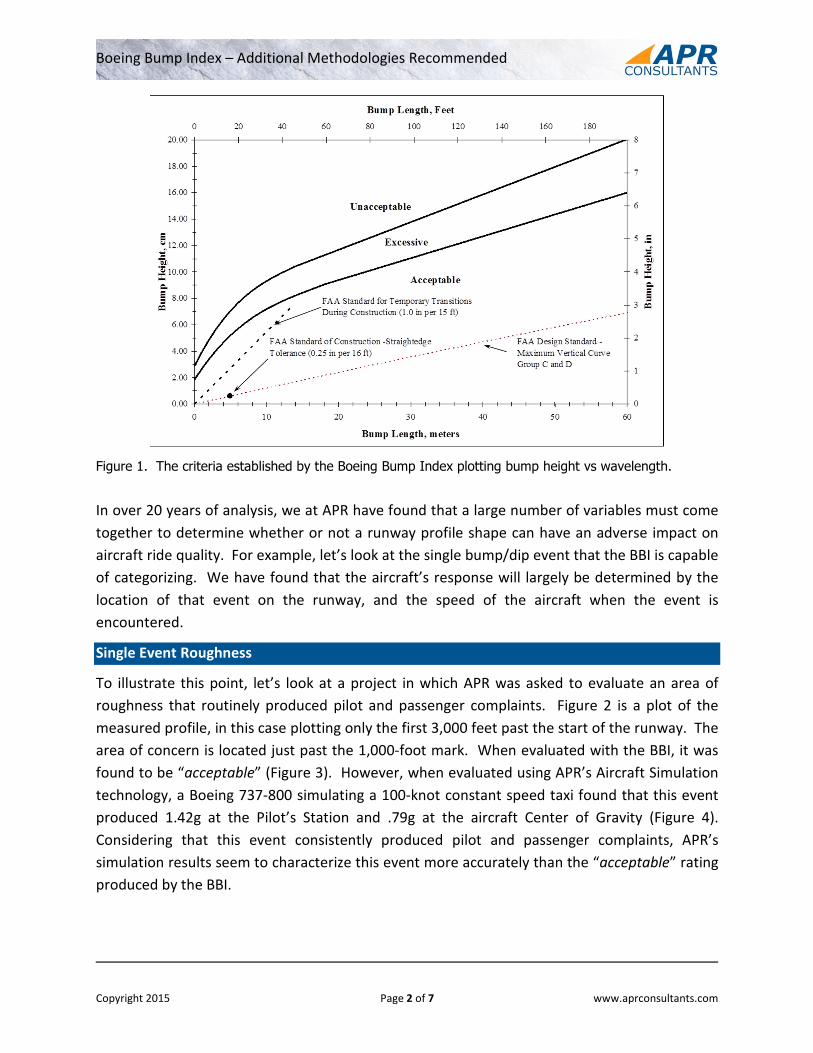
To illustrate this point, let’s look at a project in which APR was asked to evaluate an area of
roughness that routinely produced pilot and passenger complaints. Figure 2 is a plot of the
measured profile, in this case plotting only the first 3,000 feet past the start of the runway. The
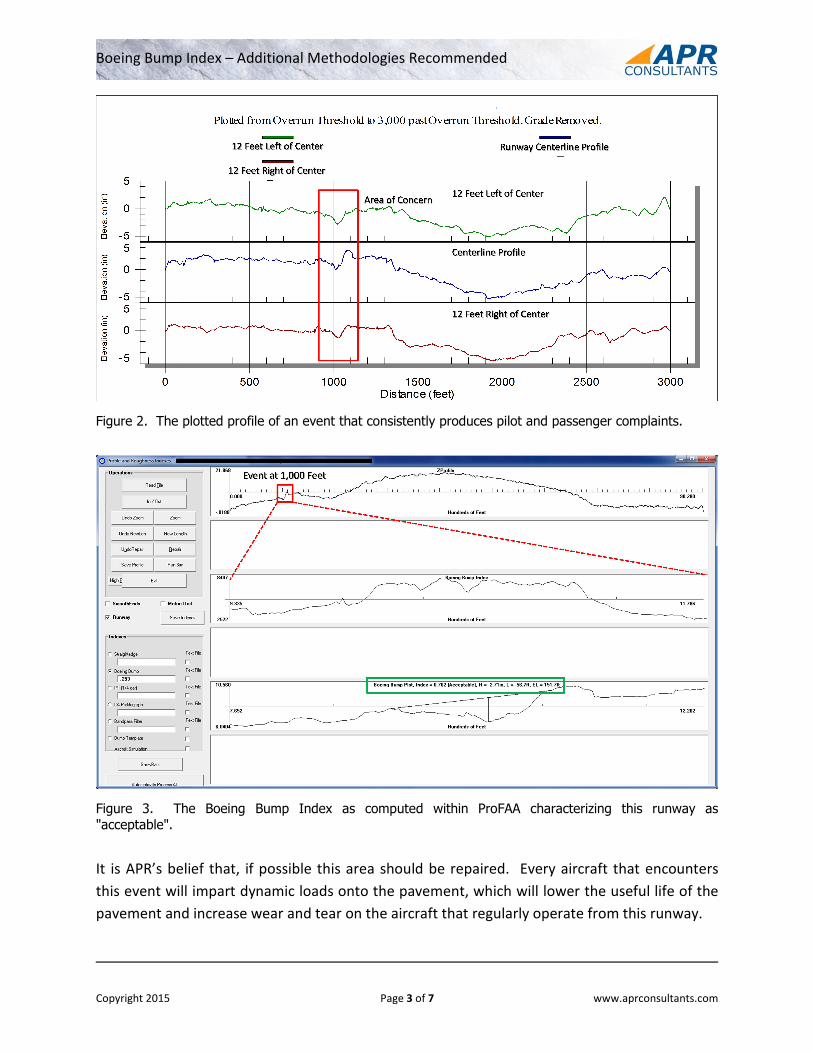
area of concern is located just past the 1,000-foot mark. When evaluated with the BBI, it was
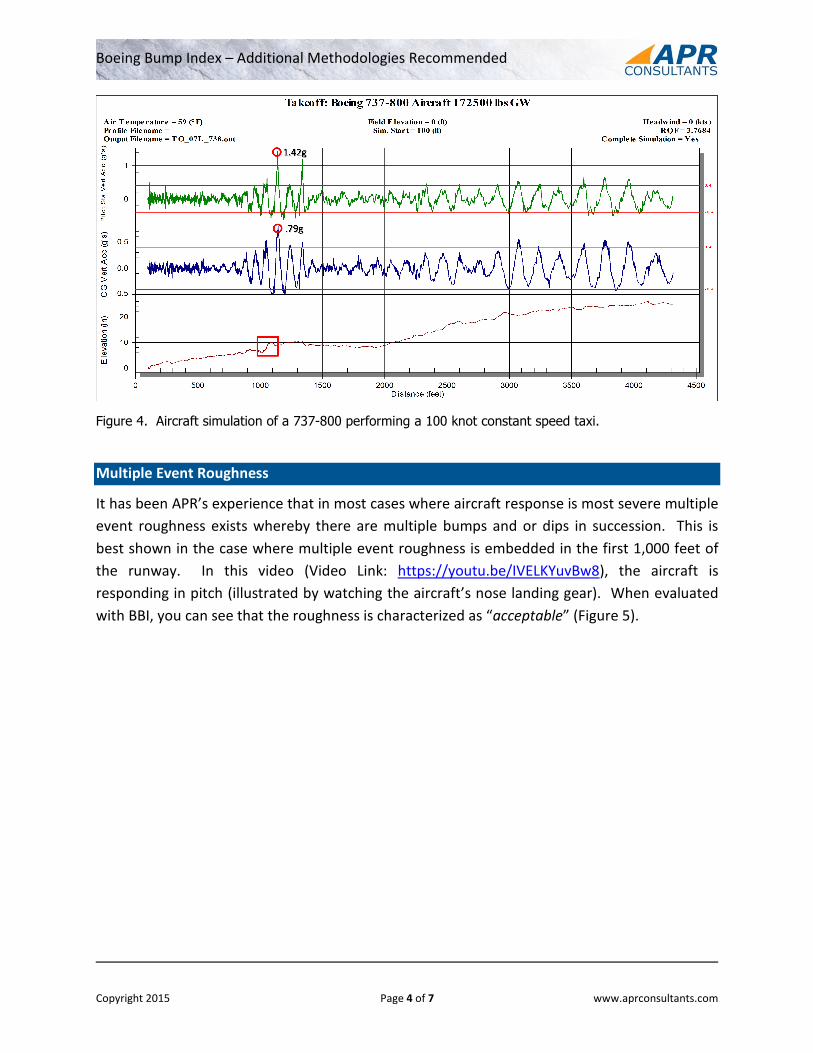
found to be “acceptable” (Figure 3). However, when evaluated using APR’s Aircraft Simulation
technology, a Boeing 737-800 simulating a 100-knot constant speed taxi found that this event
produced 1.42g at the Pilot’s Station and .79g at the aircraft Center of Gravity (Figure 4).
Considering that this event consistently produced pilot and passenger complaints, APR’s
simulation results seem to characterize this event more accurately than the “acceptable” rating
produced by the BBI.
Boeing Bump Index – Additional Methodologies Recommended
Copyright 2015 Page 3 of 7 www.aprconsultants.com
Figure 2. The plotted profile of an event that consistently produces pilot and passenger complaints.
Figure 3. The Boeing Bump Index as computed within ProFAA characterizing this runway as
"acceptable".
It is APR’s belief that, if possible this area should be repaired. Every aircraft that encounters
this event will impart dynamic loads onto the pavement, which will lower the useful life of the
pavement and increase wear and tear on the aircraft that regularly operate from this runway.
Boeing Bump Index – Additional Methodologies Recommended
Copyright 2015 Page 4 of 7 www.aprconsultants.com
Figure 4. Aircraft simulation of a 737-800 performing a 100 knot constant speed taxi.
Multiple Event Roughness
It has been APR’s experience that in most cases where aircraft response is most severe multiple
event roughness exists whereby there are multiple bumps and or dips in succession. This is
best shown in the case where multiple event roughness is embedded in the first 1,000 feet of
the runway. In this video (Video Link: https://youtu.be/IVELKYuvBw8), the aircraft is
responding in pitch (illustrated by watching the aircraft’s nose landing gear). When evaluated
with BBI, you can see that the roughness is characterized as “acceptable” (Figure 5).
Boeing Bump Index – Additional Methodologies Recommended
Copyright 2015 Page 5 of 7 www.aprconsultants.com
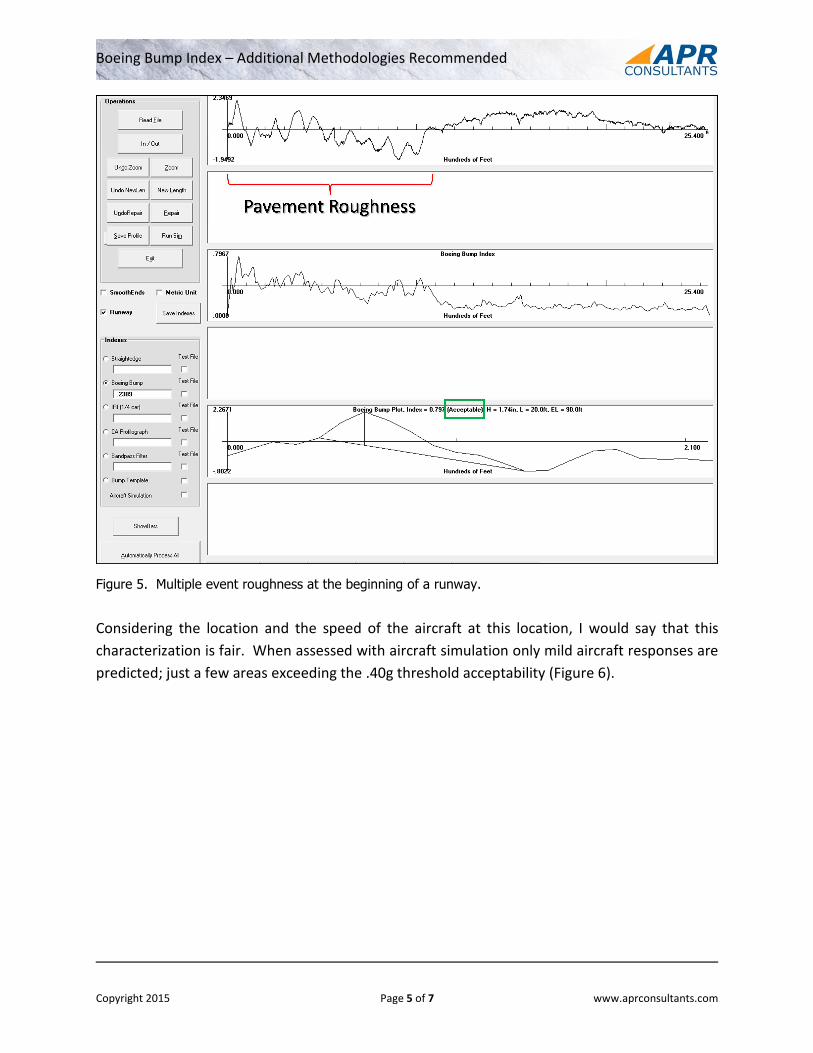
Figure 5. Multiple event roughness at the beginning of a runway.
Considering the location and the speed of the aircraft at this location, I would say that this
characterization is fair. When assessed with aircraft simulation only mild aircraft responses are
predicted; just a few areas exceeding the .40g threshold acceptability (Figure 6).
Boeing Bump Index – Additional Methodologies Recommended
Copyright 2015 Page 6 of 7 www.aprconsultants.com
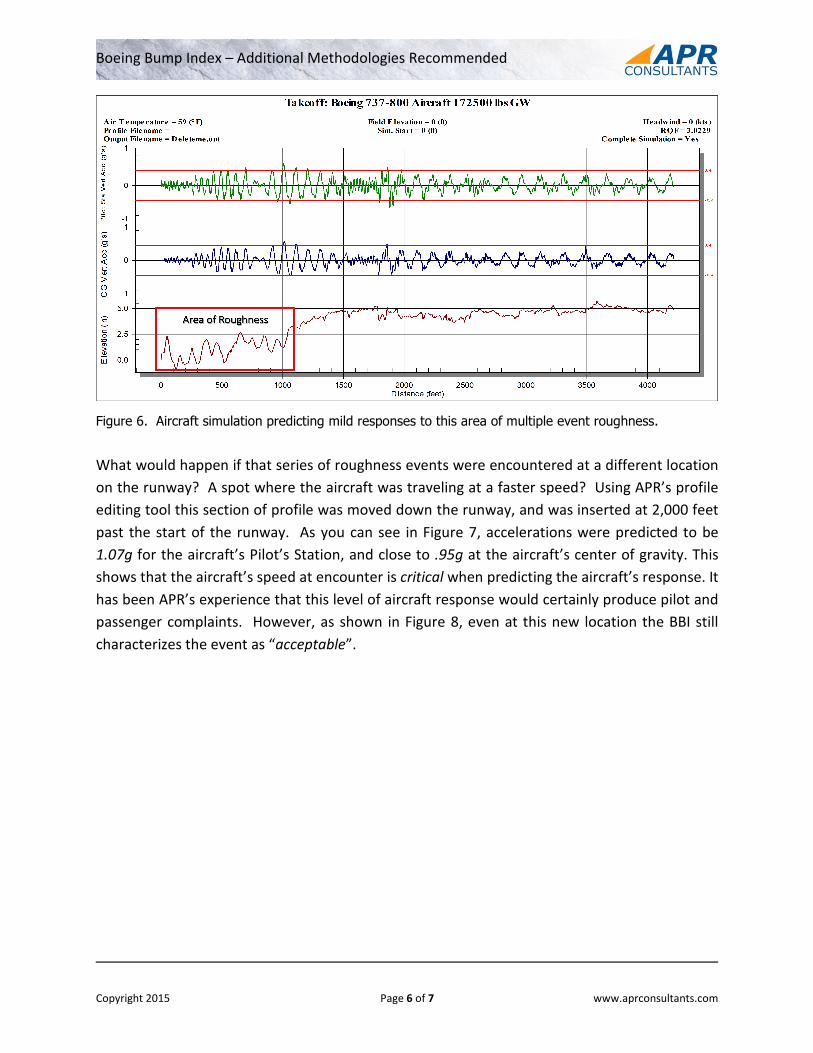
Figure 6. Aircraft simulation predicting mild responses to this area of multiple event roughness.
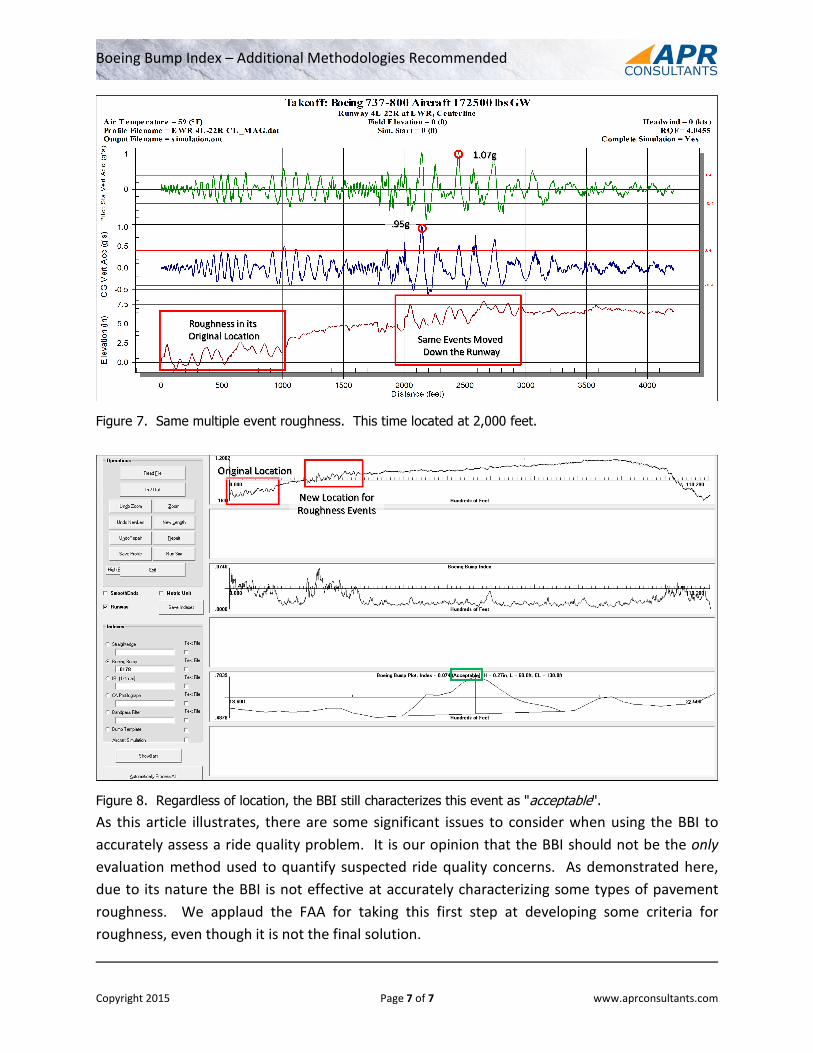
What would happen if that series of roughness events were encountered at a different location
on the runway? A spot where the aircraft was traveling at a faster speed? Using APR’s profile
editing tool this section of profile was moved down the runway, and was inserted at 2,000 feet
past the start of the runway. As you can see in Figure 7, accelerations were predicted to be
1.07g for the aircraft’s Pilot’s Station, and close to .95g at the aircraft’s center of gravity. This
shows that the aircraft’s speed at encounter is critical when predicting the aircraft’s response. It
has been APR’s experience that this level of aircraft response would certainly produce pilot and
passenger complaints. However, as shown in Figure 8, even at this new location the BBI still
characterizes the event as “acceptable”.
Boeing Bump Index – Additional Methodologies Recommended
Copyright 2015 Page 7 of 7 www.aprconsultants.com
Figure 7. Same multiple event roughness. This time located at 2,000 feet.
Figure 8. Regardless of location, the BBI still characterizes this event as "acceptable".
As this article illustrates, there are some significant issues to consider when using the BBI to
accurately assess a ride quality problem. It is our opinion that the BBI should not be the only
evaluation method used to quantify suspected ride quality concerns. As demonstrated here,
due to its nature the BBI is not effective at accurately characterizing some types of pavement
roughness. We applaud the FAA for taking this first step at developing some criteria for
roughness, even though it is not the final solution.