bofaml 2018 global metals, mining and steel conferencev3.1... · cautionary statement...
TRANSCRIPT

NASDAQ: RGLD
BofAML2018 Global Metals, Mining and Steel Conference
Tony Jensen, President and CEOMay 2018

NASDAQ: RGLD
| 2
Cautionary StatementForward-Looking Statements: This presentation contains certain forward-looking statements within the meaning of the Private Securities LitigationReform Act of 1995. Such forward-looking statements involve known and unknown risks, uncertainties, and other factors that could cause actual results todiffer materially from the projections and estimates contained herein and include, but are not limited to: expected and actual production at Rainy River,Wassa and Prestea and Mount Milligan; near-term growth from potential increased production at Rainy River and new production from Cortez Crossroadsand Peñasquito Leach expected in calendar 2018; throughput, recovery and grade improvement at Rainy River; revenue generation at Rainy River organicgrowth from a diverse portfolio, including recent development and permitting activity, production start-up activity and reserve and production updates atcertain properties; the preliminary resource estimate, planned exploration investment and the metallurgical testing and preliminary economic assessmentwork underway at the Peak Gold JV; long-term optionality associated with potential resource to reserve conversion at Pueblo Viejo, potentialdevelopment of La Fortuna and successful resolution of Voisey’s Bay royalty litigation; continued delevering through use of cash flow to reduce debt,repayment of the Company’s revolver before June 30, 2018, repayment of convertible bonds maturing in June 2019 using the revolver and cash, liquidity,and positioning for new opportunities; expected stream sales and inventory levels for the fiscal fourth quarter; effective tax rate and depreciation,depletion and amortization forecasts; and statements concerning strong cash flow generation, solid balance sheet, organic growth, robust liquidity,amount and payment of dividends, financial performance and efficient capital structure, and mine life and reserves estimates and forecasts ofthroughput, recoveries and production from the operators of our stream and royalty interests. Factors that could cause actual results to differ materiallyfrom these forward-looking statements include, among others: the risks inherent in the operation of mining properties; a decreased price environment forgold and other metals on which our stream and royalty interests are determined; performance of and production at properties, and variation of actualproduction from the production estimates and forecasts made by the operators of those stream and royalty properties; decisions and activities of theCompany’s management affecting margins, use of capital and changes in strategy; unexpected operating costs, decisions and activities of the operators ofthe Company’s stream and royalty properties; changes in operators’ mining and processing techniques or stream or royalty calculation methodologies;resolution of regulatory and legal proceedings; unanticipated grade, geological, metallurgical, environmental, processing or other problems at theproperties; operators’ inability to access sufficient raw materials, water or power; inability of operators to bring projects into production as expected,including development stage mining properties, mine and mill expansion projects and other development and construction projects; revisions orinaccuracies in technical reports, reserve, resources and production estimates; changes in project parameters as plans of the operators are refined; theresults of current or planned exploration activities; errors or disputes in calculating stream deliveries and royalty payments, or deliveries or paymentsunder stream or royalty agreements; the liquidity and future financial needs of the Company; economic and market conditions; the impact of futureacquisitions and stream and royalty financing transactions; the impact of issuances of additional common stock; and risks associated with conductingbusiness in foreign countries, including application of foreign laws to contract and other disputes, environmental laws, enforcement and uncertainpolitical and economic environments. These risks and other factors are discussed in more detail in the Company’s public filings with the Securities andExchange Commission. Statements made herein are as of the date hereof and should not be relied upon as of any subsequent date. The Company’s pastperformance is not necessarily indicative of its future performance. The Company disclaims any obligation to update any forward-looking statements.
Third-party information: Certain information provided in this presentation has been provided to the Company by the operators of properties subject toour stream and royalty interests, or is publicly available information filed by these operators with applicable securities regulatory bodies, including theSecurities and Exchange Commission. The Company has not verified, and is not in a position to verify, and expressly disclaims any responsibility for theaccuracy, completeness or fairness of such third-party information and refers readers to the public reports filed by the operators for informationregarding those properties.

NASDAQ: RGLD
|
DisciplineEfficiency
20+ Year Track Record
Cash flow generationQuickly deleveringEmbedded growthDiverse portfolio
Strong marginsLean structure
Strategic capital allocation Equity stewardshipDividend returns
3
Performance

NASDAQ: RGLD
|
Cash Flow Generation
4
Steady performance with another step-up in cash flow over last 12 months
Performance
$0
$200
$400
$600
$800
$1,000
$1,200
$1,400
$1,600
$0
$50
$100
$150
$200
$250
$300
$350
12 monthsJun-30-2013
12 monthsJun-30-2014
12 monthsJun-30-2015
12 monthsJun-30-2016
12 monthsJun-30-2017
LTM 3-31-18
Cash from Operations Average Gold Price (Kitco)
$317m
$266m
$170m$192m
$147m$172m
Positive impact of tax refund on reported cash from operations. Absent this impact, cash from operations would have been $296m, an increase of 11% over the 12 months ended 6-30-17.
NASDAQ: RGLD
|
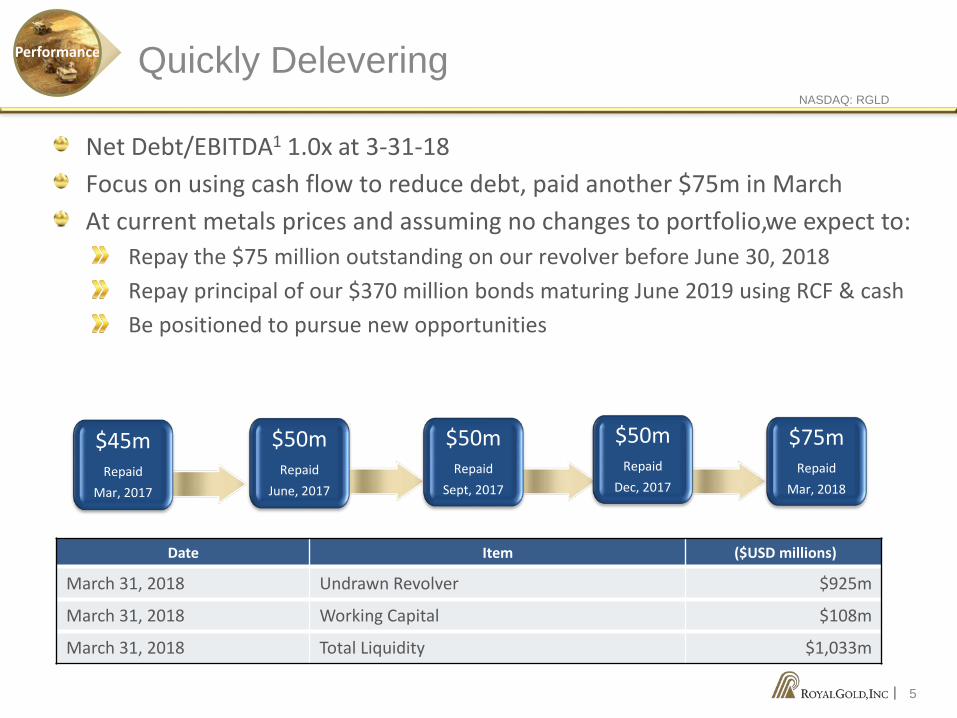
$75mRepaid
Mar, 2018
5
Net Debt/EBITDA1 1.0x at 3-31-18Focus on using cash flow to reduce debt, paid another $75m in MarchAt current metals prices and assuming no changes to portfolio,we expect to:
Repay the $75 million outstanding on our revolver before June 30, 2018Repay principal of our $370 million bonds maturing June 2019 using RCF & cashBe positioned to pursue new opportunities
Date Item ($USD millions)
March 31, 2018 Undrawn Revolver $925m
March 31, 2018 Working Capital $108m
March 31, 2018 Total Liquidity $1,033m
$45mRepaid
Mar, 2017
$50mRepaid
June, 2017
$50mRepaid
Dec, 2017
$50mRepaid
Sept, 2017
Quickly DeleveringPerformance

NASDAQ: RGLD
| 6
Cortez Crossroads
Stripping continues, production expected to build in CY192
4.5% NVR & 5% GSR royalty3.2Moz gold in reserves2,3
Mount MilliganPeñasquito Leach
Commissioning carbon pre-flotation has begun2
Progress at 4/25/18: 86% complete2
Expected to add 1Moz gold, 44Moz silver to mine life2
Peñasquito Leach
Focused on increasing and stabilizing process availability2
Study to increase throughput to 24ktpd from 21kptd2
Expected to become a Top 10 revenue generator for RGLD2
Rainy River
Embedded GrowthPerformance
Rainy River, Cortez Crossroads and Peñasquito Leach

NASDAQ: RGLD
|
Rainy River, Wassa & Prestea, Mount Milligan
7
Wassa UG inferred resource more than doubled to 5.2Moz2,4
Wassa UG grade of 4.5 grams per tonne, up 12% in CQ12
Reiterated: 230koz-255koz 2018 gold production expected2
Mount Milligan
17.5kptd average throughput in second quarter of operation2
87% average gold recovery achieved April 1-232
Throughput, grade and recovery expected to increase2
Rainy River
Currently operating at 40ktpd2
Production resumed at both ball mills in March2
2018 guidance: 195-215koz gold, 47-52lbs copper2
Mount Milligan
Wassa and Prestea
Embedded GrowthPerformance

NASDAQ: RGLD
|
Development/permitting activity at:Back River (1.95% and 2.35% NSR after threshold production achieved)
Production startup activity at:LaRonde Zone 5 (2% NSR) to begin CQ3 2018
Reserve & production updates include:Wharf (0-2% NSR) reserves up 36%South Laverton (1.5% NSR) reserves up 39%Marigold (2% NSR) reserves up 3.6% on our area of interestDolores (3.25% NSR gold, 2% NSR silver) CY18 gold production guidance up 35%, silver up 6%Gwalia (1.5% NSR) reserves up 24% Leeville (1.8% NSR) reserves up 23% on our area of interestTwin Creeks (2% GPR5- gold) reserves up 45% on our area of interest
8
Updates from our portfolio2 of 192 total assets (39 operating & 22 development)
Diverse PortfolioPerformance

NASDAQ: RGLD
| 9
Long-Term Optionality
Diverse Portfolio
Pre-oxidation heap leach & flotation concentratePotential ~7Moz resource to reserve conversion (100%)2017 scoping study followed by 2018 PFS
Pueblo Viejo
NuevaUnión
1.4% NSR on gold and copper on ~30% of La FortunaPFS recently completed, feasibility expected in H2 2019La Fortuna expected to produce in years 4-18
2.7% NSR on all metalsReported 2017 production of 52kt Ni, 34kt Cu, 1.8kt CoTrial set to begin in September 2018 in St. John’s
Voisey’s Bay
Performance

NASDAQ: RGLD
|
Our gross margin is within the top 6% of S&P 500 constituents6
Strong Margins
10
0%
20%
40%
60%
80%
100%
NYS
E:FL
RN
YSE:
ADM
Nas
daqG
S:ES
RXN
YSE:
LLL
NYS
E:SL
BN
asda
qGS:
EXPD
Nas
daqG
S:PC
ARN
YSE:
FTI
NYS
E:TX
TN
YSE:
CNC
NYS
E:LY
BN
YSE:
UPS
NYS
E:G
DN
YSE:
DLP
HN
YSE:
ADS
NYS
E:H
RLN
YSE:
ALL
Nas
daqG
S:PD
CON
YSE:
CSRA
NYS
E:PH
NYS
E:CM
IN
YSE:
DTE
NYS
E:D
VAN
asda
qGS:
HSI
CN
YSE:
HPE
NYS
E:D
ALN
YSE:
TRV
NYS
E:IP
NYS
E:CA
GN
YSE:
CBN
asda
qGS:
AAL
NYS
E:AC
NN
YSE:
PRU
NYS
E:CI
NYS
E:AP
HN
asda
qGS:
DISH
NYS
E:H
DN
asda
qGS:
MU
NYS
E:LN
TN
YSE:
FCX
Nas
daqG
S:U
LTA
NYS
E:W
ECN
YSE:
LUV
Nas
daqG
S:Q
RVO
NYS
E:AL
BN
YSE:
WM
NYS
E:CM
SN
YSE:
EIX
NYS
E:SI
GN
YSE:
DG
XN
YSE:
MN
YSE:
AEP
NYS
E:G
LWN
YSE:
AON
NYS
E:CC
LN
YSE:
UHS
NYS
E:RO
KN
asda
qGS:
ADP
NYS
E:YU
MN
YSE:
FLN
YSE:
ALLE
Nas
daqG
S:AM
ATN
YSE:
NKE
Nas
daqG
S:VI
ABN
YSE:
DIS
NYS
E:CH
DN
YSE:
PNW
NYS
E:IB
MN
YSE:
DU
KN
YSE:
MSI
NYS
E:VF
CN
YSE:
STZ
NYS
E:LV
LTN
YSE:
SNA
NYS
E:AZ
ON
YSE:
MO
NN
asda
qGS:
XRAY
Nas
daqG
S:RE
GN
NYS
E:N
EEN
asda
qGS:
GRM
NN
YSE:
CTL
NYS
E:RM
DN
YSE:
ORC
LN
YSE:
KORS
NYS
E:D
PSN
YSE:
CLN
asda
qGS:
INFO
Nas
daqG
S:N
TAP
Nas
daqG
S:IN
TCN
YSE:
TIF
Nas
daqG
S:CS
CON
asda
qGS:
VRSK
Nas
daqG
S:H
OLX
Nas
daqG
S:M
NST
Nas
daqG
S:AK
AMN
YSE:
EQR
NYS
E:AM
TN
asda
qGS:
CMCS
.AN
asda
qGS:
WYN
NN
YSE:
EQT
NYS
E:AR
EN
YSE:
MCO
NYS
E:ZB
HN
YSE:
LLY
NYS
E:PL
DN
YSE:
ABBV
NYS
E:PF
EN
YSE:
SPG
Nas
daqG
S:FF
IVN
asda
qGS:
CTXS
Nas
daqG
S:CD
NS
NYS
E:G
SN
asda
qGS:
CELG
NYS
E:D
FS
Gross margin, last 12 months
S&P 500 Constituent
RGLD, 80% margin
Gros
s Mar
gin
Efficiency

NASDAQ: RGLD
|
$0 $10,000,000 $20,000,000NasdaqGS:MAR
NYSE:APHNYSE:UHS
NYSE:MNYSE:LEG
NYSE:OMCNasdaqGS:FAST
NYSE:KSSNYSE:AJG
NasdaqGS:FISVNasdaqGS:IDXXNasdaqGS:INFONasdaqGS:NAVI
NYSE:UTXNYSE:SEE
NYSE:ITNYSE:WFCNYSE:DPS
NYSE:KNYSE:TMO
NYSE:ALKNYSE:JPMNYSE:BACNYSE:CATNYSE:ADSNYSE:UAANYSE:GPNNYSE:TAP
NYSE:AMGNasdaqCM:AMD
NYSE:NINYSE:VNONYSE:BF.BNYSE:PEG
NasdaqGS:PDCONYSE:CHDNYSE:UNHNYSE:AIGNYSE:TRV
NasdaqGS:SNINYSE:HPQ
NasdaqGS:VRSNNYSE:CF
NYSE:PXDNYSE:NRGNYSE:NBLNYSE:DHI
NasdaqGS:CBOENasdaqGS:GILD
NYSE:VTR
$25m(REIT)
$1m
$1.3m
$3m
$2m
$19m$11m (REIT)
S&P
500
Cons
titue
nt
Revenue per employee
Our revenue per employee is higher than 497 of the S&P 5007
Lean Structure
11
Efficiency

NASDAQ: RGLD
|
-$2,000
-$1,500
-$1,000
-$500
$0
$500
$1,000
$1,500
$2,000
$2,500
$3,000
2015-Q3FY18
Net revenue10 on capital 2015-2017
Capital Deployed
Net Revenue
Current Weighted Avg Remaining Mine Life
8,10
Rem
aini
ng Ye
ars o
f Min
e Li
fe
20
15
10
5
0
9
17 years
$USD
Mill
ions
-$2,000
-$1,500
-$1,000
-$500
$0
$500
$1,000
$1,500
$2,000
$2,500
$3,000
1991-2014
Net revenue8 on capital 1991-2014
Capital Deployed
Net Revenue
Current Weighted Avg Remaining Mine Life
8
9
12 years
20
15
10
5
0 Rem
aini
ng Ye
ars o
f Min
e Li
fe
Strong net revenue on capital deployed, with significant mine life remaining8
Strategic Capital Allocation
12
Discipline

NASDAQ: RGLD
|
Peak Gold Joint Venture is an example of success-based investing
Strategic Capital Allocation
13
Discipline
Royal Gold holds a 3.0% net smelter return (“NSR”) royalty over the area of the Tetlinlease and certain State of Alaska mining claims and a 2.0% NSR royalty over certainother State of Alaska mining claims held by Peak Gold.
Peak Gold JV holds a 675,000 acre lease with the Native Village of Tetlin andapproximately 174,900 acres of state mining claims.
Gold-silver-copper skarn deposit with a strong grade profile, near surface and near existing infrastructureRoyal Gold holds 2% and 3% NSR royalties over certain areas and is managing partner of the JVPreliminary M&I resource estimate4,11
of 11.3 million tonnes grading 3.46 g/t~$9.1m JV exploration investment planned for calendar 2018Metallurgical testing underwayPEA in process

NASDAQ: RGLD
|
RGLD has 14 million outstanding shares less than the next-highest GDX member
0
200
400
600
800
1,000
1,200
1,400
1,600
1,800 GDX constituents sorted by shares outstanding12
Mill
ions
of S
hare
s Out
stan
ding
at D
ecem
ber 3
1, 2
01712
Equity Stewardship
14
Discipline

NASDAQ: RGLD
|
Rainy River
Cortez Crossroads
$1.00/share, a 1.1% annual yield, and an average 22% OCF yield13
19% CAGR in dividends per share since 2001
Dividend Returns
15
27% 29%
12%
21%19%
25% 26% 23%
34%30%
15% 18%25%
36%29%
35%
22% 20%
$0
$200
$400
$600
$800
$1,000
$1,200
$1,400
$1,600
$1,800
$0.00
$0.10
$0.20
$0.30
$0.40
$0.50
$0.60
$0.70
$0.80
$0.90
$1.00
Dividend Per Share Operating Cash Flow Yield Average Gold Price (source: Kitco)
Annu
al D
ivid
ends
Per
Sha
re
Gold
Pric
e in
US
Dolla
rs
Discipline

NASDAQ: RGLD
Strong cash flow generationSolid balance sheetOrganic growthRobust liquidity

NASDAQ: RGLD
|
Streams (at April 30, 2018)
Operator Mine Metal RGLD interest until RGLD interest until RGLD
interest until RGLD pays (per unit) until RGLD pays
(per ounce) until
ReserveRemaining Mine Life
(Years)
CY2018Operator
Production Guidance (oz/lbs)2
Centerra Gold Mount Milligan Gold 35% LOM (life of
mine) - - - - $435 LOM - - 20 195,000-215,000
Centerra Gold Mount Milligan Copper 18.75% LOM - - - - 15% of spot LOM - - 20 47,000-52,000
Barrick Pueblo Viejo Gold 7.50% 990koz 3.75% remaining LOM - - 30% of spot 550koz 60% of spot remaining
LOM 25+ 585,000-615,000
Barrick Pueblo Viejo Silver 75% at fixed 70% recovery 50Moz 37.50% remaining
LOM - - 30% of spot 23.1Moz 60% of spot - 25+ Not provided
New Gold5 Rainy River Gold 6.50% 230koz 3.25% remaining LOM - - 25% of spot - - - 14 310,000-350.000
New Gold Rainy River Silver 60% 3.1Moz 30% remaining LOM - - 25% of spot - - - 14 Not provided
Teck Andacollo Gold 100% 900koz 50% remaining LOM - - 15% of spot - - - 17 Not provided
Golden Star Wassa/Prestea Gold 10.5% 240koz 5.50% Remaining
LOM - - 20% of spot 240koz 30% of spot thereafter 10 230,000-255,000
Key Royalties1 (at January 1, 2018) RGLD interest Until
Goldcorp Peñasquito Gold Silver Lead Zinc 2.00% LOM 10 310,000 (gold)
Barrick Cortez Gold Various LOM 12 TBA
Agnico-Eagle & Yamana Malartic Gold 1-1.5% LOM 10 650,000
Newmont Leeville Gold 1.80% LOM 11 Not available
KGHM Robinson Gold Copper 3.00% LOM 5 Not available
Kirkland Lake Holt Gold 0.00013 x the gold price LOM 8 Not available
Alamos Gold Mulatos Gold 1-5%
capped; expect to reach in ~2019
2 150,000-160,000
Portfolio of AssetsDiverse, Long Lived Properties
1 Includes largest royalties by revenue. An additional 28 royalties from producing mines in Royal Gold’s portfolio not shown.2 Production estimates are received from our operators and there can be no assurance that production estimates received from
our operators will be achieved. Please refer to our cautionary language regarding forward-looking statements on slide 2, as wellas the Risk Factors identified in Part I, Item 1A, of our Fiscal 2017 10-K for information regarding factors that could affect actualresults.
17

NASDAQ: RGLD
|
We provide capital in exchange for a life-of-mine percentage of the production• via a streaming or royalty interest• we do not operate any mines
Diverse portfolio of 39 producing mines & 192 total interests2; operators include:
Inherent growth in portfolio• no additional funding commitments• $1 billion of liquidity at 3-31-18
24 employees, $5.7B market cap80% gross margin 17 consecutive years of dividend increases• $1.00/share current annual dividend
Longevity – in business since 1981 in Denver
About Royal Gold
18Risk
Ret
urn
ETF
Physical Gold
Index FundsMajor Operators
Intermediate Operators
Exploration
Junior Operators
Gold Investment Opportunity with a Dividend and Reserve Optionality
NASDAQ: RGLD
|
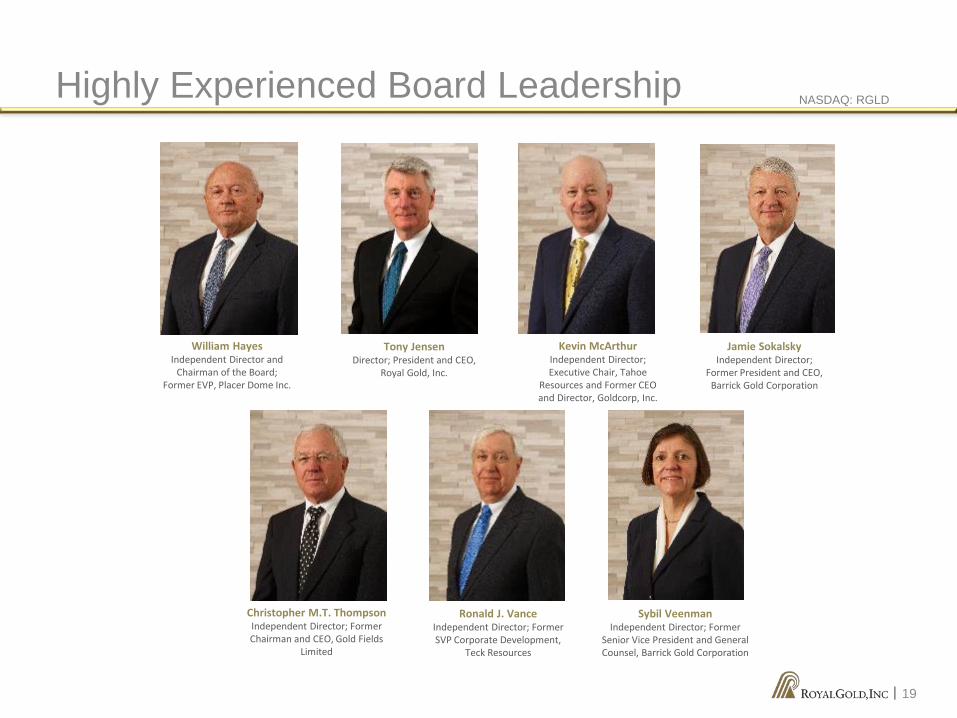
Highly Experienced Board Leadership
Jamie SokalskyIndependent Director;
Former President and CEO, Barrick Gold Corporation
Kevin McArthur Independent Director; Executive Chair, Tahoe
Resources and Former CEO and Director, Goldcorp, Inc.
Tony JensenDirector; President and CEO,
Royal Gold, Inc.
William HayesIndependent Director and
Chairman of the Board; Former EVP, Placer Dome Inc.
Ronald J. Vance Independent Director; Former SVP Corporate Development,
Teck Resources
Christopher M.T. ThompsonIndependent Director; Former Chairman and CEO, Gold Fields
Limited
Sybil VeenmanIndependent Director; Former
Senior Vice President and General Counsel, Barrick Gold Corporation
19

NASDAQ: RGLD
|
1. Adjusted EBITDA is a non-GAAP measure. See page 21 for reconciliation.
2. Information has been provided to the Company by the operators of those properties or is publicly available information filed by those operators.Reserves information shown is as of December 31, 2017. References to portfolio reflect total property interests at May 2, 2018. Please see slide 2.
3. Cautionary Note to U.S. Investors Concerning Estimates of Proven and Probable Mineral Reserves and Measured and Indicated Mineral Resources:The mineral reserve and resource estimates reported by Barrick were prepared in accordance with Canadian Institute of Mining, Metallurgy andPetroleum Definition Standards for Mineral Resources and Mineral Reserves. Royal Gold has not reconciled the reserve and resource estimatesprovided by Barrick with definitions of reserves used by the U.S. Securities and Exchange Commission.
4. The U.S. Securities and Exchange Commission does not recognize the term “resource.” “Resources” are not reserves under the SEC’s regulations,but are categorized under the securities law regulations of certain foreign jurisdictions in order of increasing geological confidence into “inferredresources,” “indicated resources” and “measured resources.” Investors are cautioned that resources cannot be classified as reserves unless and untilit is demonstrated that they may be legally and economically extracted and produced and, as a result, they should not assume that all or any part ofmineralized material in any of these categories will ever be converted into reserves.
5. GPR is a gross proceeds royalty, which is a royalty paid on contained ounces, rather than recovered ounces.
6. Source: S&P CapitaliQ as of December 31, 2017. Gross margin calculated as total revenue less cost of goods sold, divided by total revenue. A total of456 of the S&P 500 constituents reported positive gross margin in the trailing 12 months.
7. Source: S&P CapitaliQ as of December 31, 2017. Revenue per employee calculated as total reported revenue for the trailing 12 months, divided bytotal reported employees. 498 of the S&P 500 companies report total employees.
8. Net revenue calculated as gross revenue less cost of goods sold (COGS) for streaming payments.
9. Weighted average remaining mine life calculated by weighting each property’s current remaining mine life in years by the proven and probablereserves for the year ended 2016, based on data provided by the operators of those mines.
10. Net Revenue includes Andacollo, Pueblo Viejo, Wassa and Prestea, Rainy River only through March 31,2018.
11. Peak Gold resource of 1.3Moz was calculated at $1,400/oz. Please see Royal Gold’s press release dated June 2, 2017.
12. Indicates company with an incorporation date that pre-dates Royal Gold, which was incorporated in 1981. Source for data is S&P CapitaliQ.
13. Calculated as reported cash from operations divided by common dividends paid during the same period.
Endnotes
20

NASDAQ: RGLD
|
Adjusted EBITDA Reconciliation
21
Adjusted EBITDA is defined by the Company as net income (loss) plus depreciation, depletion and amortization, non-cash charges, income tax expense, interest and other expense, and any impairment of mining assets, less non-controlling interests in operating loss (income) of consolidated subsidiaries, interest and other income, and any royalty portfolio restructuring gains or losses. Othercompanies may define and calculate this measure differently. Adjusted EBITDA identifies the cash generated in a given period that will be available to fund the Company's future operations, growth opportunities, shareholder dividends and to service the Company's debt obligations. This information differs from measures of performance determined in accordance with U.S. GAAP and should not be considered in isolation or as a substitute for measures of performance determined in accordance with U.S. GAAP. See the table below for a reconciliation of net income to Adjusted EBITDA.
Three Months Ended Nine Months EndedMarch 31, March 31,
(Unaudited, in thousands) (Unaudited, in thousands)2018 2017 2018 2017
Net (loss) income (154,118)$ 21,531$ (143,359)$ 75,588$ Depreciation, depletion and amortization 39,679 40,164 121,380 119,785 Non-cash employee stock compensation 1,563 314 5,958 6,758 Impairments of royalty interests 239,364 — 239,364 — Interest and other, net 6,513 7,928 22,530 17,012 Income tax (benefit) expense (45,859) 6,492 10,044 18,724 Non-controlling interests in operating loss of consolidated subsidiaries 468 2,130 3,573 7,205
Adjusted EBITDA 87,610$ 78,559$ 259,490$ 245,072$
