bofaml banking & insurance conference rsa insurance …€¦ · bofaml banking & insurance...
TRANSCRIPT

BofAML BANKING & INSURANCE CONFERENCE
30 September 2014
Stephen Hester
Group Chief Executive
RSA Insurance Group: Path to Performance

This presentation may contain ‘forward-looking statements’ with respect to certain of the Group’s plans and its current
goals and expectations relating to its future financial condition, performance, results, strategic initiatives and objectives.
Generally, words such as “may”, “could”, “will”, “expect”, “intend”, “estimate”, “anticipate”, “aim”, “outlook”, “believe”,
“plan”, “seek”, “continue” or similar expressions identify forward-looking statements. These forward-looking statements
are not guarantees of future performance. By their nature, all forward-looking statements involve risk and uncertainty
because they relate to future events and circumstances which are beyond the Group’s control, including amongst other
things, UK domestic and global economic business conditions, market-related risks such as fluctuations in interest rates
and exchange rates, the policies and actions of regulatory authorities (including changes related to capital and solvency
requirements), the impact of competition, inflation, deflation, the timing impact and other uncertainties of future
acquisitions or combinations within relevant industries, as well as the impact of tax and other legislation or regulations in
the jurisdictions in which the Group and its affiliates operate. As a result, the Group’s actual future financial condition,
performance and results may differ materially from the plans, goals and expectations set forth in the Group’s forward-
looking statements. Forward-looking statements in this presentation are current only as of the date on which such
statements are made. The Group undertakes no obligation to update any forward-looking statements, save in respect of
any requirement under applicable law or regulation. Nothing in this presentation should be construed as a profit forecast.

TODAY’S PRESENTATION UPDATES ON…
3
Design slide
s s 0
What RSA will
look like as we
complete the
‘turnaround’
plan
How we have
thought through
what needs to
be done
What we are
doing and
planning to do
to drive
performance
1 2 3

FOCUSED; STRONGER; BETTER
4
A leading international general insurer focused on Northern developed
markets, plus a growth business in Latin America
Aiming to compete only where we can win. And to win where we compete
Well capitalised, targeting sustainable attractive returns
Strong operational delivery; transparent and easy to understand
Enduring customer appeal
1
2
3
4
5
Our ambition for RSA:

WHAT WILL MAKE RSA ATTRACTIVE
5
Leading market positions
in stable markets
Well balanced business
by geography, customer,
channel and product
Capital efficiency from
diversification
Cash generative
business model
Group synergies of
expertise, cost and
revenues
Disciplined and
focused execution
Strong brands and market
reputation

RSA’S CORE MARKETS – BUILT AROUND LEADERSHIP POSITIONS
6
Canada
Market size2: £27bn
Top 3 market position
overall
67% Personal,
33% Commercial lines
Broker and affinity
distribution
Latin America
Market size2: £62bn
No.1 Chile, No.2 Uruguay,
No. 6 Argentina, Leading
niche position in Brazil.
Operations in Mexico and
Colombia
UK
Market size2: £42bn
Top 4 market position
overall
45% Personal,
55% Commercial lines
Direct, broker and affinity
distribution
Scandinavia
Market size2: £21bn
Top 4 market position
overall
Only multi-national insurer in
the region
51% Personal,
49% Commercial lines
Principally direct distribution
Scandinavia30%
Canada20%
Latin America
10%
UK1
35%
Ireland5%
Indicative
future shape
of the core
Group (share
of NWP)
1 Includes European commercial lines2 Approximate size of non-life market premiums. Source: Swiss Re Sigma 3/2014

Household22%
Personal Motor20%
Personal Other10%
Commercial Property
20%
Liability10%
Commercial Motor
9%
Marine & other9%
RSA’S BUSINESS MIX - WELL BALANCED
7
By customer and product…
Commercial48%
Personal
52%
Pro-forma
for core
business
based on H1
2014 NWP
Pro-forma
for core
business
based on H1
2014 NWP0% 25% 50% 75% 100%
UK Personal
UK Commercial
ScandinaviaPersonal
ScandinaviaCommercial
Canada Personal
Canada Commercial
Direct Broker Agent/affinity
… and by distribution channel

P&C MARKET CHARACTERISTICS INFORMING RSA’S STRATEGY
8
Large, enduring
and stable markets
Proactive mainstream
players holding their
own vs specialists /
disruptors
Business models
need to cope with
market cycles and
underwriting volatility
Important evolutions in
customer expectations,
regulation and technology,
as in other industries
Scale important, but
principally at a market
level, not globally
Competitive and
challenging markets,
consolidated structure, no
patents, so most players
doing similar things
Few existential
threats or
transformative
opportunities
General
insurance
markets
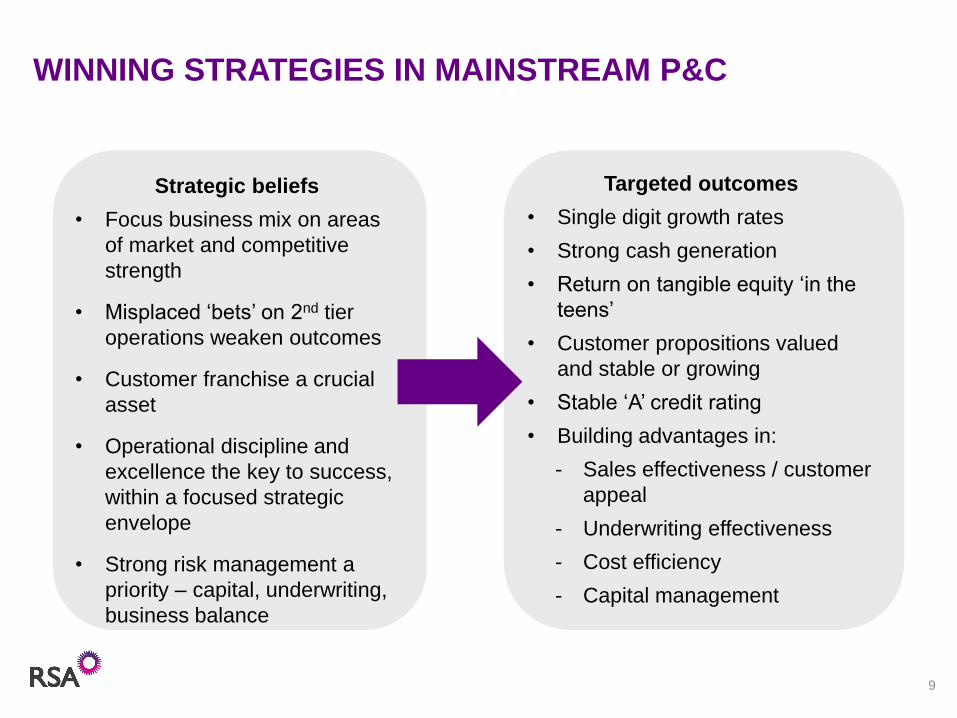
WINNING STRATEGIES IN MAINSTREAM P&C
9
Strategic beliefs
• Focus business mix on areas
of market and competitive
strength
• Misplaced ‘bets’ on 2nd tier
operations weaken outcomes
• Customer franchise a crucial
asset
• Operational discipline and
excellence the key to success,
within a focused strategic
envelope
• Strong risk management a
priority – capital, underwriting,
business balance
Targeted outcomes
• Single digit growth rates
• Strong cash generation
• Return on tangible equity ‘in the
teens’
• Customer propositions valued
and stable or growing
• Stable ‘A’ credit rating
• Building advantages in:
- Sales effectiveness / customer
appeal
- Underwriting effectiveness
- Cost efficiency
- Capital management

CHALLENGES FOR RSA AT THE START OF 2014
10
Capital Erosion Reliance on Prior Year
Expenses Industry issues
• Weather trends
• Technology spend and effectiveness
• Underwriting discipline and competition
• Low yield environment
0
20
40
60
80
100
120
2008 2009 2010 2011 2012 2013
Key capital metrics 2008 – 2013(2008 = 100)
TNAV: Premiums IGD Surplus ECA Surplus
6.46.0
5.24.7 4.8 5.0
0
2
4
6
8
-100
0
100
200
300
400
2008 2009 2010 2011 2012 2013Normalised
Group Underwriting Profits and Reserve Margin2008 - 2012
PYD CY Margin as % reserves
£m %
1 2
43
30
20
25
35
28.6
G
27.5
FED
28.2
CPeer
average
29.0
B
31.1
RSA
31.2
29.6
1.6
A
33.8
28.1 28.0
RSA headline ratioAdjustment due to central costs not included
in RSA’s headline expense ratio that are
generally included in peers’ expense ratios
Total expense ratio1 vs. peer group2, 2012, %
1 Includes commissions2 Peer group includes: Ace, Allianz, Aviva, AXA, Generali, QBE, Zurich

BENCHMARKING PERFORMANCE –THOUGH BUSINESS MIX ALSO A DRIVER
11
UK
Scandinavia
Canada
Source: As reported in published financial statements.
*Peer group consist of:
1) UK: Aviva, DLG, AXA (UK&I), Allianz and Zurich
2) Scandinavia: Top, Tryg, Gjensidige and If. Expense ratio for Top and Tryg reported on a GEP basis and has been recalculated to be on a NWP basis.
3) Canada: Intact, Aviva, Cooperators and Economical.
Note that there may be slight differences in accounting treatment for COR and ER between local peers and RSA.
Peer* Combined Ratio 2013 Peer* Expense Ratio 2013
99.2%95.2% 96.9% 35.1%29.0% 32.4% 34.1%
91.5%87.7% 88.9% 19.1%15.3% 16.9%
104.1%94.6% 100.6%99.5% 32.9%28.9% 31.4%
HighestLowest
RSA
HighestLowest
RSA
RSA RSA
RSA
(ex. Noraxis)RSA
(ex. Noraxis)
Mean Mean
Mean Mean
Mean Mean
88.1%

STRATEGY AND ACTION PLAN FOR RSA
12
1. Tighten strategic focus of the Group
• Disposals and portfolio action
• Concentrate resources and management effort on a coherent core
2. Reset the quality and quantity of capital strength
• The bar is higher for financial institutions than before
• Trust in risk profile and quality of financial statements a must
• RSA was undercapitalised at the end of 2013
3. Improve business performance and capability to sustain it
• Actions, where needed, on underwriting, portfolios, expense and distribution
• Invest in technology to drive competitive advantage
• High performance, disciplined culture. Build track record of delivery
Serve customers well. Operate with capital strength.
Focus on driving shareholder value
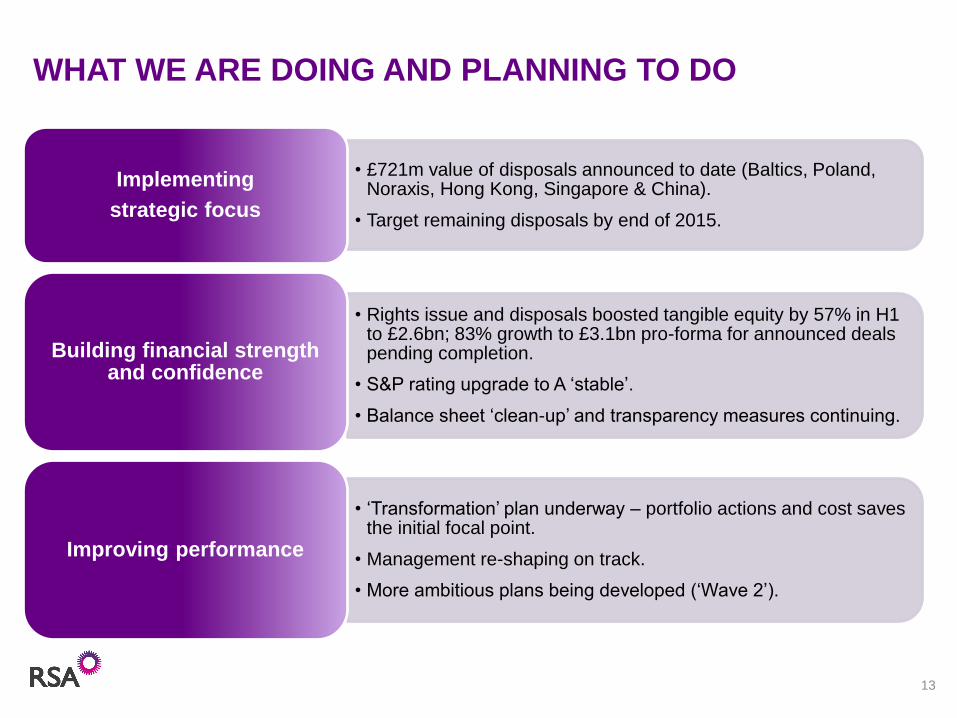
WHAT WE ARE DOING AND PLANNING TO DO
13
• £721m value of disposals announced to date (Baltics, Poland, Noraxis, Hong Kong, Singapore & China).
• Target remaining disposals by end of 2015.
Implementing
strategic focus
• Rights issue and disposals boosted tangible equity by 57% in H1 to £2.6bn; 83% growth to £3.1bn pro-forma for announced deals pending completion.
• S&P rating upgrade to A ‘stable’.
• Balance sheet ‘clean-up’ and transparency measures continuing.
Building financial strength and confidence
• ‘Transformation’ plan underway – portfolio actions and cost saves the initial focal point.
• Management re-shaping on track.
• More ambitious plans being developed (‘Wave 2’).
Improving performance

ACTION PLAN – TARGET TIMELINE
14
2014 2015 2016
Strategic focus
Capital & balance sheet strengthening
Operational improvement
2017
• Core / review portfolio
• First wave of
disposals
• Complete disposal
programme
• Proceeds from rights
issue, disposals & earnings
• Balance sheet ‘clean up’
• Sub-debt opportunity
• Further disposals &
earnings
• Target restart of
dividends
• Preparation for
Solvency II
• Transformation plan
• Management team
• Implementation starts:
- Cost base
- Portfolio actions
• Assess scope to go
Further (‘Wave 2’)
• Implementation:
- Cost base
- Underwriting / sales
effectiveness
- Systems investment
• ‘Wave 2’ initiatives
commencing
• Benefits building
• Implementation:
- Cost base
- Underwriting / sales
effectiveness
• Benefits building
• ‘Wave 2’ initiatives
continue
• Systems Investment
Cleaner
benefits
‘run rate’
‘Wave 2’
initiatives
continue

P&C peer group growth H1
2014
-1%
2%
-2%
-4% -2% 0% 2% 4%
MARKET DYNAMICS FORCING EVEN MORE EMPHASIS ON OPERATIONAL IMPROVEMENT
15
Market conditions:
• Most markets highly competitive
• Softening wholesale insurance rates putting pressure down the value chain
• Low interest rates pressuring investment income
High volume/price
sensitivity
RSA H1 2014 underlying trend:
% change in
NWPRate Volume
Scandinavia 3% (1)%
Canada 2% (4)%
UK 2% (10)%
Ireland 5% (21)%
Emerging
Markets2% 5%
Total Group 2% (5)%
Source: Company results
Note: UK peer group includes Aviva, AXA, Zurich, Allianz, DLG; Scandinavia peer group includes If, Tryg, Gjensidige, Lansforsakringar, Topdanmark;
Canada peer group includes Intact, Aviva, Co-operators, Desjardins, Economica
UK
Scandinavia
Canada
5 year government bond
yields 2014 YTD
0
0.5
1
1.5
2
2.5
%
UK
Canada
Sweden
Euro
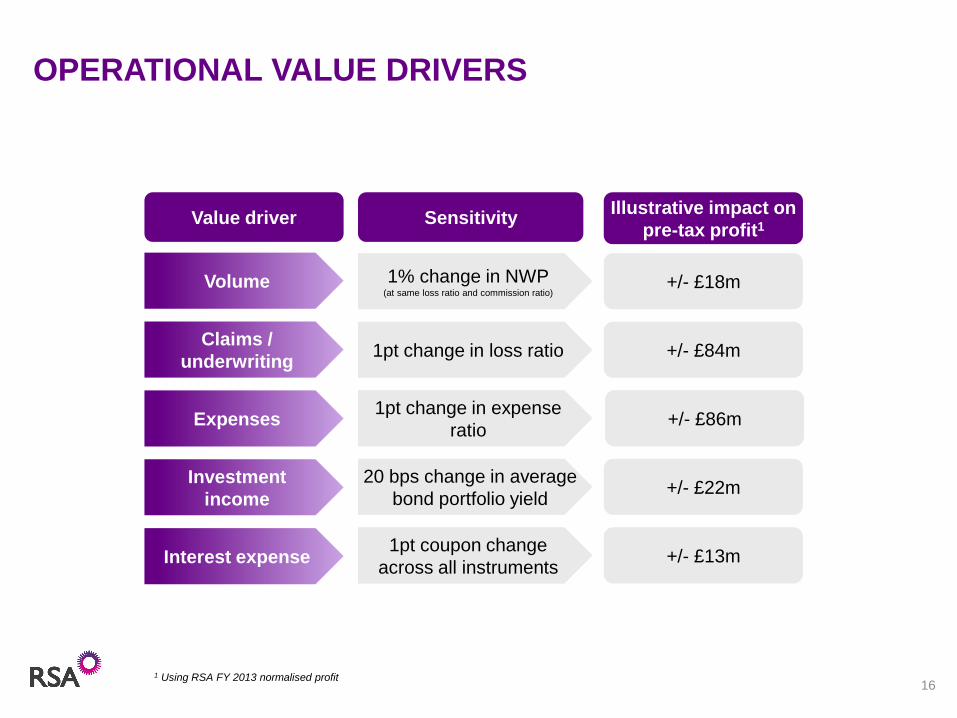
OPERATIONAL VALUE DRIVERS
16
Volume
Claims /
underwriting
Expenses
Investment
income
Interest expense
1% change in NWP(at same loss ratio and commission ratio)
1pt change in loss ratio
1pt change in expense
ratio
20 bps change in average
bond portfolio yield
1pt coupon change
across all instruments
+/- £18m
+/- £84m
+/- £86m
+/- £22m
+/- £13m
Value driver SensitivityIllustrative impact on
pre-tax profit1
1 Using RSA FY 2013 normalised profit

17
1
OPERATIONAL ACTIONS – SALES EFFECTIVENESS / CUSTOMER APPEAL
Customer Actions
• Distribution Retain direct/ broker/ affinity choice for clients. Affinity growth
in focus particularly
• Speed, convenience
and flexibility
Digital trends at the forefront of customer evolution
• Proposition Drive to sharpen targeted customer propositions
• Service Differentiate on service standards and delivery
• Satisfaction Target strong positive NPS and effective brand promise
Sales Actions
• Salesforce effectiveness Multiple disciplines to improve delivery to customers
• Trading capabilities Greater market responsiveness in pricing and policy make up
• Pricing expertise Richer risk segmentation
• E-trading / SME
competencies
Drive “industrialisation” of SME delivery for price
competitiveness and growth
1
2

UK Personal Household
UK Personal Motor
UK Pet
UK Commercial Motor
UK Commercial Property
UK Commercial Liability
UK Marine
Scandi Household
Scandi Motor
Scandi Personal Other
Scandi Commercial Motor
Scandi Commercial Property
Scandi Commercial Liability
Scandi Marine
Canada Household
Canada Personal Motor
Canada Commercial Property
Canada Liability Canada Marine
50
60
70
80
90
100
110
120
130
-15-10-50510
Th
ree y
ear
Ave
rag
e C
OR
% (
201
1-1
3)
Change in current year underlying loss ratio - H1 2014 vs H1 2013
OPERATIONAL ACTIONS – UNDERWRITING EFFECTIVENESS
18
Lower loss ratioHigher loss ratio
Enhancing RSA’s
underwriting effectiveness
• Improve sophistication,
agility and flexibility of rating
platforms
• Reduce the number of
products and simplify
processes that support them
• Improve robustness and
consistency of process to
move from technical rates to
‘trading’ price
• Improve frequency of
updating claims cost models
• Improve MI / data
warehousing
Driving pricing discipline / portfolio action

OPERATIONAL ACTIONS – COSTS; WITH MORE TO DO….
19
2013 ownexpense base
Foreignexchange
Inflation Disposals Costreductions
2016 indicativecost base
£2.2bn
In excess of
£180m gross cost
reductions by end
of 2016
1 Cost reduction range as a percentage of each region’s 2013 controllable expense base less foreign exchange and disposals impact.2 Includes Emerging Markets head office costs.
RegionUnderlying cost
reduction range1
UK 18% - 19%
Ireland 11% - 13%
Scandinavia 2% - 3%
Canada 2% - 3%
Emerging Markets (ex
review businesses) 2 12% - 14%
Head office 13% - 15%
Cost Initiatives
- Simplification of end-to-end processes through redesign and automation of processes, e.g.
avoiding waste in re-keying of data via simpler, fewer systems
- Transformation of our information systems through rationalisation of complex architecture,
decommissioning of obsolete systems and renegotiation of unfavourable contract conditions
- Optimisation of procurement, renegotiating main contracts to bring them in line with market
best practice and improving adherence to quality standards
- Streamlining of spans, layers and support functions, reducing the number of managers
and the number of management layers
- Simplification of our product offering
- Optimisation of footprint, consolidating offices and branches where beneficial
Indicative movement in cost base 2013-16

‘BELOW THE LINE LEAKAGE’ ALSO IN FOCUS
20
£m
FY 2013
normalised
results
Underwriting profit 309
Investment result 365
Insurance result 674
Central expenses (73)
Operating result 601
Interest expense (117)
Amortisation (42)
Other (incl. Solvency II) (15)
Profit before tax 427
Major improvements targeted:
1. Restructure of Group Head Office
functions
2. Opportunity to refinance sub-debt
at lower coupon
3. Amortisation is non-cash / capital
item
4. Solvency II to be in ‘business as
usual’ in 2016
‘Leakage rate’: 37% of Insurance Result
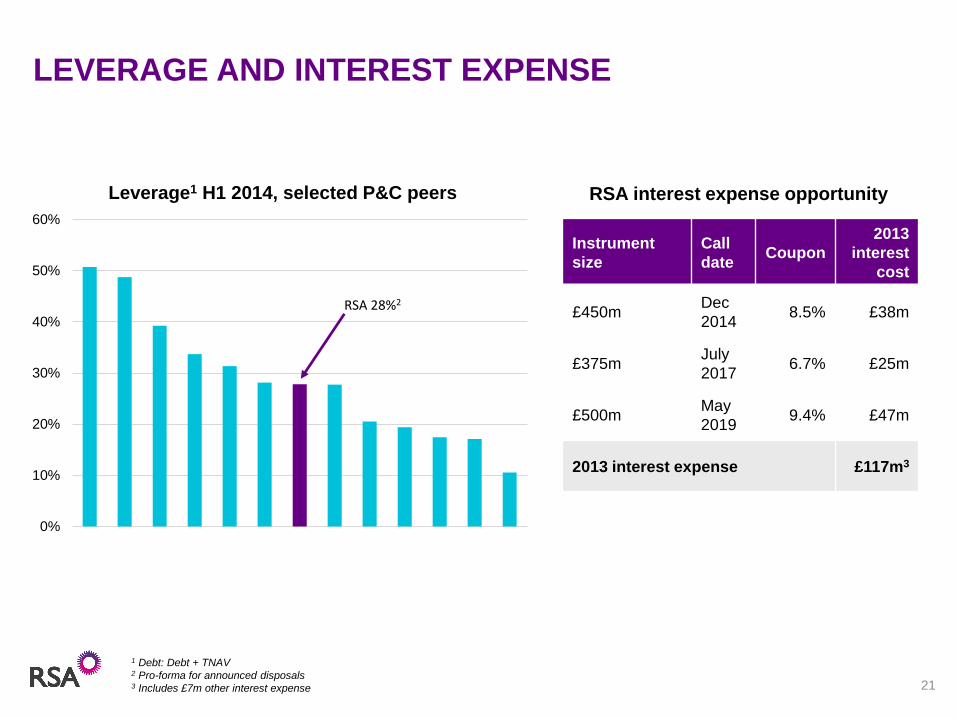
LEVERAGE AND INTEREST EXPENSE
21
Instrument
size
Call
dateCoupon
2013
interest
cost
£450mDec
20148.5% £38m
£375mJuly
20176.7% £25m
£500mMay
20199.4% £47m
2013 interest expense £117m3
RSA interest expense opportunity
0%
10%
20%
30%
40%
50%
60%
Leverage1 H1 2014, selected P&C peers
RSA 28%2
1 Debt: Debt + TNAV2 Pro-forma for announced disposals3 Includes £7m other interest expense

19.2%
33.3%
38.8%2.0%
9.5%
2.6%
5.5%
RSA TNAV:Premium development
0%
10%
20%
30%
40%
50%
60%
70%
80%
90%
100%
P&C TNAV:Premium ratios (H1 2014)
RESTORING CAPITAL STRENGTH, RETAINING
BENEFITS OF BUSINESS BREADTH
22
Target range 35-45%Outlook:
Further
disposals
Future
retained
earnings
‘Clean up’ /
restructuring
charges
Note: TNAV:NWP ratios calculated using two times H1 2014 NWP
Generally niche /
specialty or monoline
insurers
Generally
international
multi-line players
Upper end of RSA’s
35-45% target
Source: Company financials
Note: For composite insurers, reported economic capital allocation is used
to determine TNAV allocated to P&C business.

Focused:
• Market leading businesses in Northern developed markets
• Growth business in Latin America
Stronger:
• Well capitalised, targeting sustainable attractive returns
• Business balance; strong risk management
Better:
• Strong customer appeal
• Operational improvements the focus: underwriting and costs especially
• Transparent and easy to understand
SUMMARY
23