- bogotá - colombia - bogotá - colombia - bogotá - colombia - bogotá - colombia ... ·...
TRANSCRIPT

- Bogotá - Colombia - Bogotá - Colombia - Bogotá - Colombia - Bogotá - Colombia - Bogotá - Colombia - Bogotá - Colombia - Bogotá - Colombia - Bogotá - Colombia - Bogotá -
Are wages rigid in Colombia?: Empirical evidence based on a sample of
wages at the firm level
Ana María Iregui B.
Ligia Alba Melo B.
María Teresa Ramírez G.
Abstract
This paper uses Colombian data at the firm level for the period 1999 to 2006 to provide microeconomic evidence on the existence and extent of downward nominal wage rigidity. To conduct the analysis, we use a rich panel of firms for white and blue collar workers, consisting of 1517 firms for the former and 781 firms for the latter. The presence of wage rigidity is determined by means of three statistic techniques used in recent literature, such as the analysis of the histograms of the distribution of wage changes, the LSW statistic and the Kahn test. The results suggest the existence of downward nominal wage rigidities; it is worth mentioning that rigidity is higher for blue collar workers than white collar workers, since the increase in the wages of the blue workers is generally done by taking into account the change in the minimum wage, which is why a higher rigidity would be expected.
Key words: Wage rigidity, Kahn test, LSW Statistic, Colombia.
JEL Classification: J31, E24, C23
The authors are researchers from the Research Unit, Deputy Governor´s office Banco de la República. We
thank Luis Eduardo Arango, Juan David Barón, Jesús Otero, Hernando Vargas, and Héctor Zárate for helpful comments and suggestions. We also thank participants in the Banco de la República workshop on price and wage formation. We would also like to thank Derly Gómez and Jorge Tamayo for their research assistance. The views expressed are those of the authors, and should not be interpreted as reflecting those of the Board of Directors of the Banco de la República, or other members of its staff. The usual disclaimer applies to any remaining errors or omissions.
1
I. Introduction
During the past two decades, the reduction of inflation and the adoption of an
inflation targeting regime have revived the interest in the study of wage rigidities,
due to the impact they may have on employment. However, this subject continues
to create controversy in the economics literature. On the one hand, the traditional
literature (Tobin, 1972, Akerlof, et al 1996; Fortin, 1996) states that when nominal
wages are downwardly rigid, a certain level of inflation allows for a greater flexibility
of real wages, since these may be reduced through increases in nominal wages
that are lower than inflation, thus facilitating adjustments in the labor market. On
the other hand, Elsby (2009) maintains that the macro-economic effects of the
nominal rigidities of wages are probably small, suggesting that nominal rigidity is
not a strong argument against the adoption of a low inflation target.
A recent contribution to this debate, which makes use of the greater availability of
information on a micro-economic level, has been the considerable increase in
empirical studies of wage rigidities. These studies have employed information
based on surveys and dataset at both the firm and worker levels. Blinder and Choi
(1990), Campbell and Kamlani (1997), Bewley (1999) and Agell and Lundborg
(1995, 2003) are some of the authors that use survey data. They find that the
reason why firms do not reduce wages is that they do not want to affect the
motivation, effort and morale of workers, which thus leads to downward nominal
wage rigidity.
Among the studies that utilize datasets on both firms and workers, it is worth
singling out the International Wage Flexibility Project, which analyzes changes in
individual labor incomes by using 31 data bases from 16 European countries over
the past three decades. This research project finds evidence of downward rigidities
both in nominal and real wages, although the degrees and the causes of rigidity
2
vary across different countries that were analyzed.1 Others examples can be found
in the November, 2007 issue of the Economic Journal (vol 117, no. 524), whose
main subject of interest was that of wages rigidity. The articles in this special issue
journal use a common methodology to estimate the occurrence and scope of both
real and nominal wage rigidities at the individual level in Germany, Italy and the
United Kingdom. The studies find that real rigidities are important in these three
countries, although they have declined over time. They also suggest that rigidities
are associated with unfavorable results in the labor market, particularly on
employment.2
Other studies that have used micro-economic information at the level of individuals
and/or firms in Europe and the United States are those by McLaughlin (1994),
Kahn (1997), Stiglbauer (2002), Lebow et al (2003), Schweitzer (2007), Brzoza-
Brzezina and Socha (2007), Messina et al (2008) and Knoppik and Beissinger
(2009), among others. These studies offer mixed evidence regarding wage rigidity,
as they vary in accordance with their respective methodology and source of
information. In the Latin American context, the study of wage rigidities does not
appear to have received a great deal of attention. Two exceptions are Castellanos
et al (2004) and Cobb and Opazo (2008). The former study analyzes wage rigidity
in Mexico, utilizing workers data from the Mexican Institute of Social Security for
the period 1985-2001. These authors find evidence of nominal rigidity, though
there also appears to be evidence that it has lessened over time. The latter study
presents micro-economic evidence about the degree of downward wage rigidity in
Chile, on the basis of the information provided by the wage history of 440,000
workers during the period from 2001 to 2007.
Recently, the European Central Bank (ECB) and the central banks of the European
Union formed a research group known as the Eurosystem Wage Dynamic Network
1 A summary of the main results of the Project is found in Dickens et al (2007). 2 See Goette et al (2007), Bauer et al (2007), Devicienti et al (2007) and Barwell and Schweitzer (2007).
3
whose aim is to study the dynamics of the wages of the region and their policy
implications.3 The research team is divided into three areas: a macro group which
is exploring the dynamics of wages at an aggregate level, a micro group which
uses information on the level of the individual and/or firm, and a group which is
conducting an ad hoc survey of the setting of prices and wages at the firm level.4
Given the scarcity of studies of wage rigidities for developing countries, and
following the lines of the recent research by the European central banks on the
formation of prices and wages, this paper aims to determine whether nominal
wages in Colombia are downwardly rigid. To the best of our knowledge, this is the
first study that provides micro-economic evidence about the existence and the
degree of nominal wage rigidity in Colombia. To conduct the analysis, we used a
dataset at the firm level for white and blue collar workers, taken from the
companies which submitted their financial statements to the Superintendencia de
Sociedades (Superintendency of Corporations) during the period from 1999 to
2006.
In particular, the degree of nominal rigidity is determined through the use of some
statistical techniques employed in the recent literature, such as the analysis of the
histogram of the distribution of wage changes, the LSW statistic and the Kahn test.
The results of these alternative approaches suggest the existence of downward
nominal wage rigidities in Colombia.
This article is divided into three parts, besides this introduction. In the second one
the data base is described and the main statistics for the variables used in the
3 The preliminary results of the research of these groups which make up this network were presented at the “Wage Dynamics in Europe: Findings from the Wage Dynamics Network” conference, held in Frankfurt, Germany, on June 24th and 25th, 2008. The presentations and the papers are available on: http://www.ecb.europa.eu/events/conferences/html/wage_dynamics_network.en.html. 4 The surveys were carried out by 17 central banks (Austria, Belgium, Czech Republic, Estonia, France, Germany, Greece, Hungary, Italy, Ireland, Lithuania, Luxembourg, Holland, Poland, Portugal, Slovenia and Spain) between the end of 2007 and the first semester of 2008 and included interviews with more than 17,000 firms of different sizes and economic sectors.
4
empirical analysis are presented. The third section explains the tests for wage
rigidities and discusses the results that were obtained. The final section presents
the main conclusions.
II. Dataset and descriptive statistics
This paper analyzes data at the firm level which come from the firms that submitted
financial statements to the Superintendencia de Sociedades (Supersociedades)
during the period from 1999 to 2006. The Supersociedades does provide complete
information about the number of workers and their wages in an important number
of companies from different sectors of the economy. The study excludes public
servants and government employees, the self-employed and those who work for
small-scale companies.
Particularly, this study used the information on number of employees and the
average wage by gender and type of occupation (white collar and blue collar
workers). Given that the methodology used to determine wage rigidities requires a
balanced panel, it was decided to include only those firms that reported the
payment of wages to workers with permanent contracts throughout the period
under consideration. The empirical analysis was undertaken with two independent
samples, one for white collar workers and the other one for blue collar workers,
which do not necessarily include the same companies.
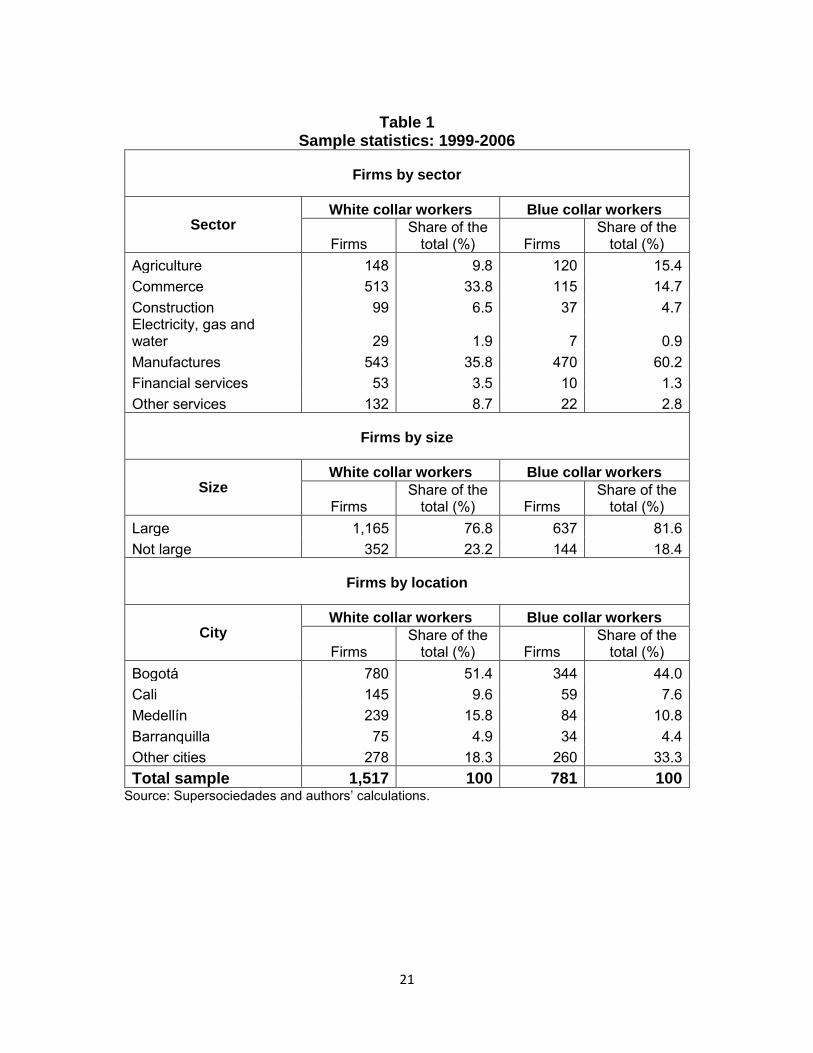
The sample for white collar workers includes 1,517 firms that reported complete
information for all the years of the period under analysis. The firms were grouped
into 7 sectors: agriculture, commerce, construction, electricity, gas and water,
manufacturing, financial and other services. As can be seen in Table 1, the number
of white collar workers is concentrated in the sectors of manufacturing (35.8%) and
commerce (33.8%). With regard to firm size, 76.8% of the companies are classified
5
as large while the remaining 23.2% are not large.5 In addition, 81.7% of the firms
are located in the main four cities of the country; namely 51.4% in Bogotá, 15.8%
in Medellín, 9.6% in Cali and 4.9% in Barranquilla. The remaining 18.3% is located
in other cities of the country. Regarding blue collar workers, there are 781 firms, of
which 81.6% are classified as large. These firms are concentrated in the sectors of
manufacturing (60.2%), agriculture (15.4%) and commerce (14.7%). Also, about
44% of the firms are located in Bogotá.
In the 1,517 companies included in the sample of white collar workers, males
accounted for approximately 54.3% of the work force. This share is higher in the
sector of electricity, gas and water (80.6%) and lower in that of financial services
(37.1%). In the case of blue collar workers, the share of males reaches 66.8%,
surpassing 50% in all of the sectors.
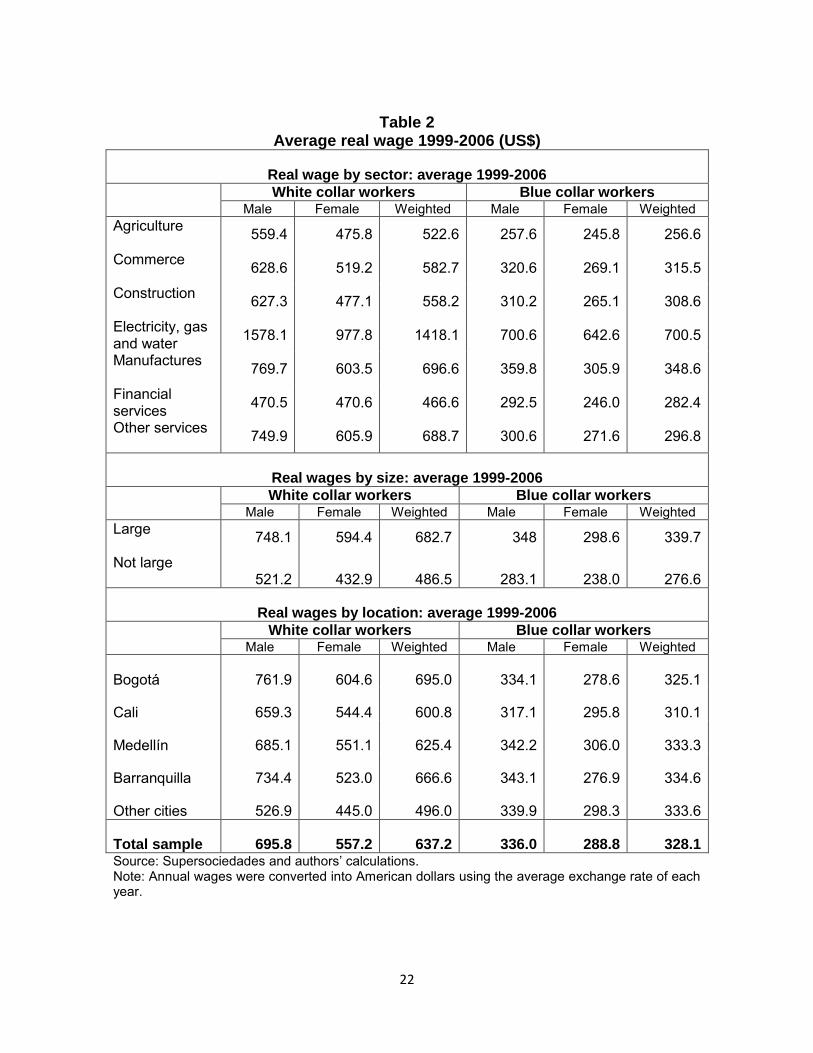
Table 2 shows the average real salaries for the period 1999-2006 by sector, size,
location and gender, for both white and blue collar workers. The average monthly
wage of the white collar workers included the sample was US$637. With the
exception of the salaries observed in financial services, men´s wages were
significantly higher than those of women. In the case of blue collar workers, the
average real wage is approximately US$328. In general, it is seen that, on
average, the wage of men is higher than that of women by about 16%. These
differences are larger in the sectors of commerce, construction and manufacturing
and smaller in agriculture and services. These gender differences in wages confirm
findings widely documented in the literature on the subject, and although they have
been reduced on an international level since the 1980´s, they are still present; see,
e.g., Croson and Gneezy (2009), and the references therein.
5 The classification of the firms by size was made by using the criteria established in the Law 590 of 2000. Small (not large) firms are those whose total assets are less than 15,000 current legal minimum monthly wages (SMMLV, in Spanish initials) while the large firms are those which have total assets higher than 15,000 SMMLV.
6
It can also be seen that, on average, the wage of white collar workers is twice that
of blue collar workers. In addition, the electricity, gas and water sector pays, on
average, the highest wages, followed by the manufacturing sector, while the lowest
ones are, on average, paid in the agricultural and financial services sectors. In
terms of company size, the large firms pay, on average, higher wages, than those
paid by firms that are not large. For white collar workers this amounts to a
difference of 41% on average, while it is 23% for blue collar workers. It is worth
noting that, in both cases, on average, men receive higher wages than women.
With regard to the geographical location of the companies in the sample of white
collar workers, it is seen that the firms located in Bogotá pay, on average, higher
wages than those in the rest of the country. According to the results of the
statistical significance tests, the wage difference is significant in the case of firms
located in Cali and Medellin, but not for those in Barranquilla. Furthermore, in all of
the cities the wages of men significantly surpass those of women. In the case of
blue collar workers, no statistically significant differences between the average
wages in the different cities are observed, suggesting that such wages are
homogeneous on a national level. This might be explained by the fact that these
wages closely follow the level of the national minimum wage. By contrast, gender
differences are statistically significant in most of the cities in the sample.6
Finally, it is worth noting to the wide dispersion seen in real wages in the sample of
white and blue collar workers. In fact, the standard deviation in the wages of white
collar workers reaches US$426 while that for blue collar workers is US$130, for the
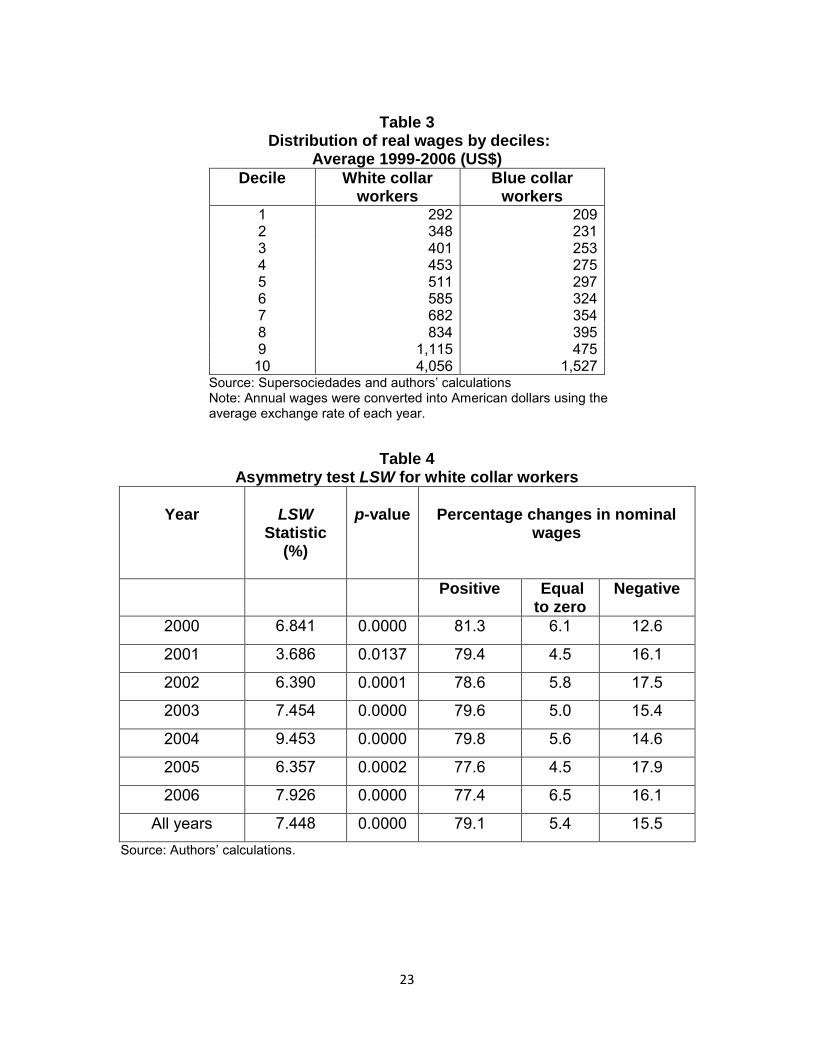
period being analyzed.7 In addition, the distribution of the wages by deciles, shown
in Table 3, indicates that 50% of white collar workers received, on average, a wage
lower than US$511, and 50% of the blue collar workers, one lower than US$297.
6 The annual information on wages and the statistical significance tests of the annual difference in wages by gender, sector and size, both for white and blue collar workers, were not included for reasons of space, but they are available from the authors upon request. 7 The annual standard deviations of wages by sector, size and location, both for white and blue collar workers, are available from the authors upon request.
7
By contrast, in the highest decile, the wages of white and blue collar workers
reached, on average, a figure of US$4,056 and US$1,527 respectively.
III. Wage rigidities
This section presents an empirical analysis of downward wage rigidities for a
sample of Colombian firms. This subject is important, given its possible impact on
the persistence and volatility of inflation, since wages are one of the main
components of the marginal cost.
To evaluate wage rigidities, both nominal and real, the recent literature has used
several statistical tools, including the analysis of the histograms of the distribution
of wage changes in a given period of time.8 In the presence of rigidities, the
distribution is asymmetrical and the data cluster around a reference point. In the
case of nominal rigidity, the observations are clustered at zero and show
asymmetry around this point, which is why negative observations near zero are
less frequent than positive ones. In turn, real rigidity shows increases located to the
right of the inflation reference. In general, the studies for Europe and the United
States have found that nominal rigidities are more common when inflation is low,
whereas real rigidities are more frequent with high inflations.9
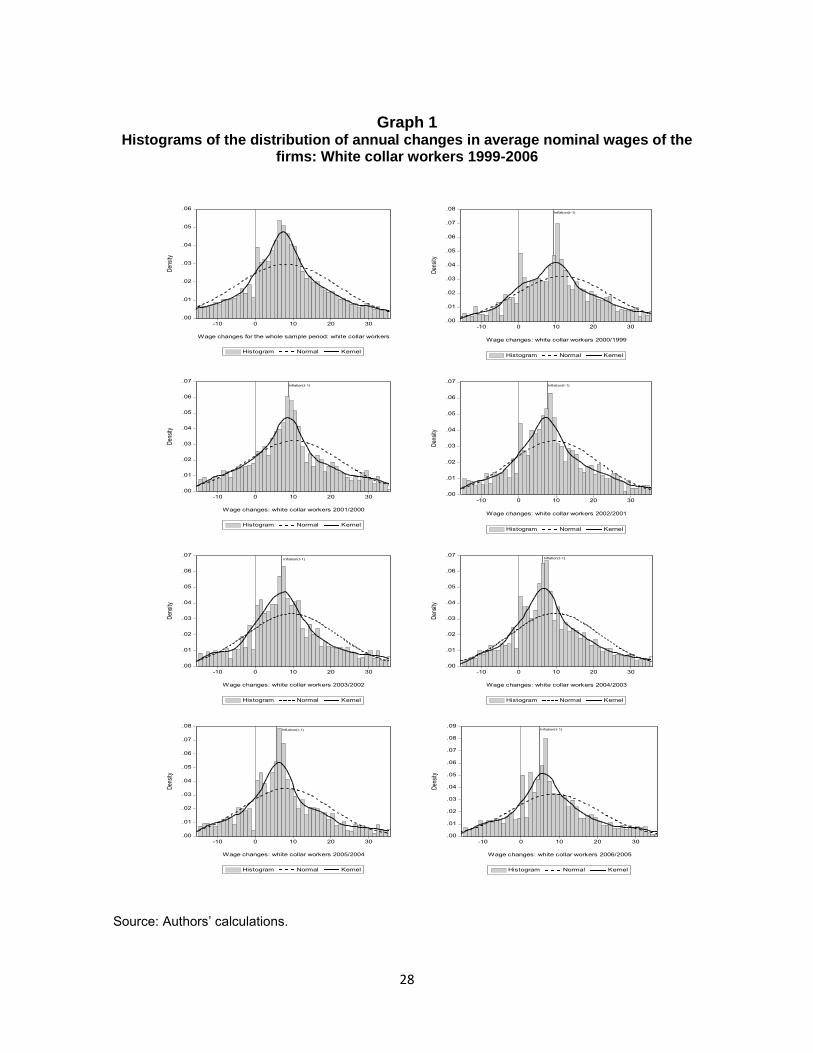
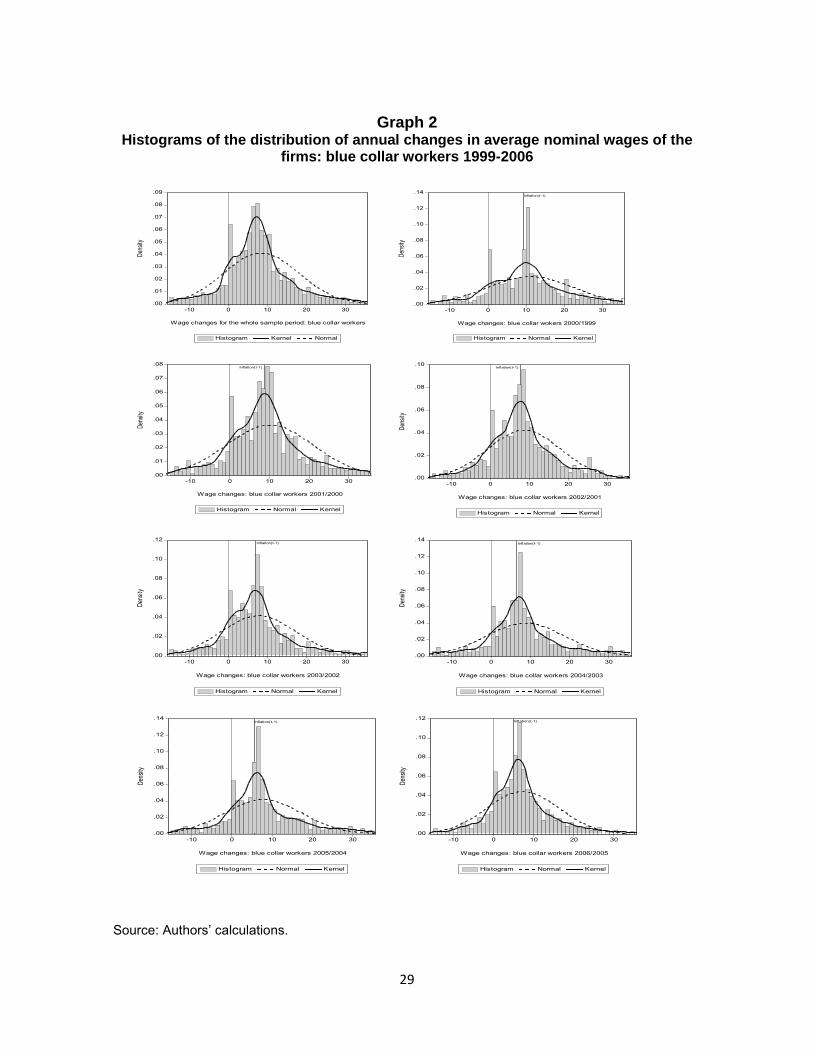
In the case of Colombia, Graphs 1 and 2 show the distribution of the annual
changes in nominal wages for white and blue collar workers, respectively, during
the period 1999-2006.10 In the histograms the bars were given a width of one
percentage point. The first vertical line on the left shows the point where the
8 See Kahn (1997), Dickens et al (2007), Goette et al (2007), Bauer et al (2007), Devicienti et al (2007), Barwell and Schweitzer (2007), Schweitzer (2007), Brzoza-Brzezina and Socha (2007), Knoppik and Beissinger (2009), Stiglbauer (2002), Lebow et al (2003), Castellanos et al (2004) and Messina et al (2008). 9 For example, Schweitzer (2007), Brzoza-Brzezina and Socha (2007), Holden and Wulfsberg (2007 and 2008) and Lebow et al (2003). 10 Extreme salary changes (less than -15% and more than 35%) were excluded from the construction of the histograms, since these changes probably reflect mistakes in reporting or measurement errors.
8
change of the nominal wage is zero and the second line shows the observed rate
of inflation lagged one year. It is worth noting that the histograms show the
percentage of firms whose average change in wages was negative. This does not
necessarily imply that the workers have wage cuts, since the information used in
this study corresponds to the average wage of the firm and not to the wages of
individuals. Thus, the average wage of a firm may be affected by changes in the
composition of the work force, job rotation and the flexibility of labor contracts,
which may lead to modifications in the company´s wage structure. Additionally, as
Akerlof et al (1996) point out, some of the negative changes may be due to
mistakes in the way wages are reported, which may increase the frequency of such
changes.11
In general, what stands out in the case both of white and blue collar workers is the
high variation in the magnitude of wage changes in the same year. It is worth
noting that most of the wage changes lie in the vicinity of zero and that there is a
relative small amount of negative wage changes compared to positive increases
around this point, which would suggest the presence of downward nominal wage
rigidities. Viewed from another angle, the high cluster of data found around the
observed level of inflation might be evidence of real rigidity, which may be
explained by the Colombian practice of adjusting wages, either in line with the
inflation of the previous year or with the increase in the minimum wage.12
Notwithstanding the above, visual inspection of the histograms does not amount in
itself to a conclusive proof of the existence of downward wage rigidities. For
example, Stiglbauer (2002) points out that the analysis of the histograms may be
11 Akerlof et al (1996) point out that some studies present data corrected for measurement errors which affect the true distribution of the wage changes, For example, they mention that McLaughlin (1994) shows corrected measurements of the standard deviation of the wage changes, which may be inappropriate if the true distribution is asymmetrical. 12 During the period under analysis the increase in the minimum wage in Colombia has been higher than the observed inflation in the previous year. Sentence C-815 of the Constitutional Court (1999) rules that the setting of the minimum wage must take into account the observed level of inflation.
9
sensitive to the choice of the intervals and/or the width of the bars. This author also
states that it is difficult to determine if a high cluster of observations around zero is
due to a high proportion of constant nominal wages or small changes in them. For
these reasons, it is necessary to statistically test the significance of the results
derived from a visual inspection of the histograms. Towards this end, we employ
two tests that are frequently applied in the literature.13 The first is the LSW statistic
due to Lebow, Stockton and Wascher (1995), and the second one is the Kahn
(1997) test, also known as the Histogram-Location Approach.
The LSW statistic measures the asymmetry generated by the rigidity of wages by
comparing the size of the two tails of the distribution: it takes, as a reference,
points equidistant from the median. Thus, a symmetrical distribution will tend to
have an equal number of observations both to the right and the left of the median
and the LSW statistic will be zero, indicating that there are no rigidities. On the
other hand, the statistic will be positive if there is a scarcity of negative increments,
which suggests the presence of nominal wage rigidities. Also, since it is a measure
of order, the statistic will not be affected by extreme observations.14
In line with Lebow et al (2003), this statistic is defined as the accumulated
frequency of the distribution of the change in wages which is higher than twice the
median minus the accumulated frequency of the distribution that is less than zero.
That is, LSW ≡ [1-F(2*median)]-F(0).15
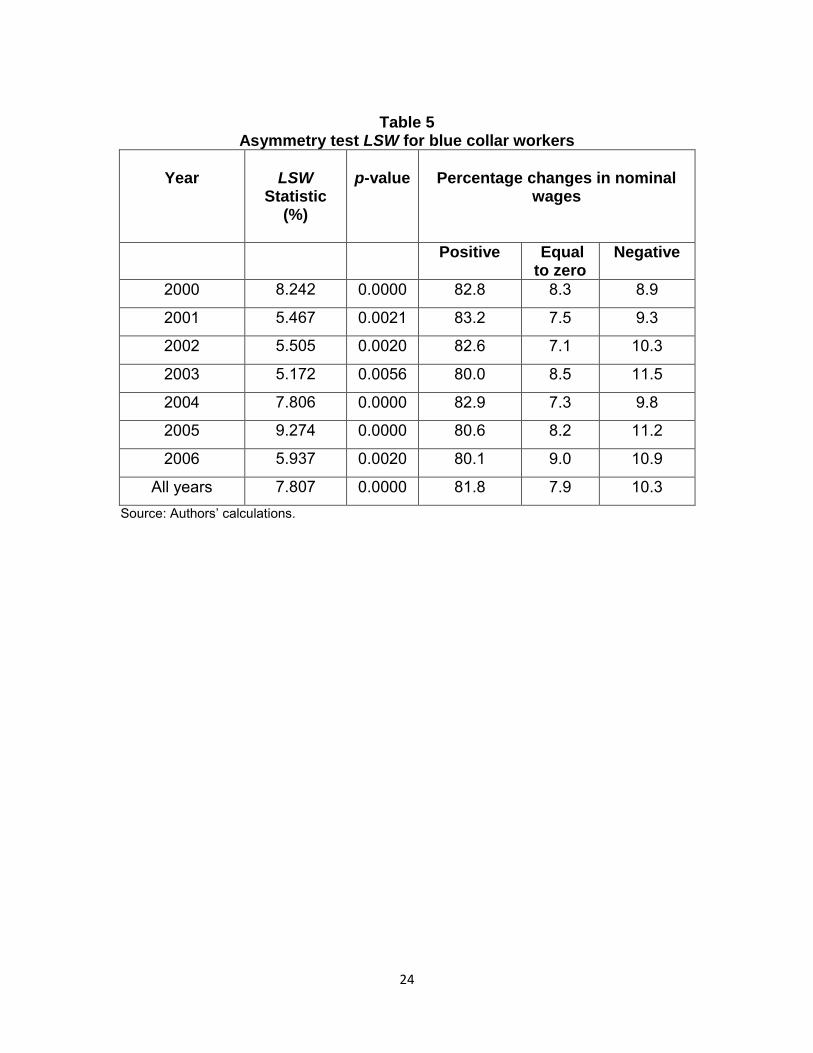
The results of the LSW test of asymmetry for white and blue collar workers, along
with the probability that the null hypothesis would be rejected, are shown in Tables
13 For a presentation of other tests used in the literature, see Lebow et al (2003), Kuroda and Yamamoto (2003) and McLaughlin (1994 and 2000). 14 For more details about the LSW statistic, see Lebow et al (2003) and Castellanos et al (2004). 15 To calculate the statistical significance of the LSW statistic, we use the normal approximation to the binomial distribution suggested by Kuroda and Yamamoto (2003). The statistic follows a normal distribution, and under the null hypothesis of symmetry , where F is the cumulative distribution function, is the change in the nominal wage, is the median of. , and n is the number of observations.
10
4 and 5, respectively. As can be seen, when the calculation of the statistic includes
information from the whole period, the distribution in the change of the average
wages is positive and significantly asymmetrical, with 7.5% and 7.8% more
observations on the right tail of the distribution than on the left for white and blue
collar workers, respectively, which would suggest the presence of downward
nominal wage rigidities.16 These results are robust when the statistic is calculated
for both white and blue collar workers using information for the different years.
The above results fit within the framework of those reported in the international
literature. For example, in the case of Australia, Dwyer and Leong (2000) the
estimated LSW is 15.8% for the distribution of the wages from a sample of jobs
between March 1987 and December 1999. Beissinger and Knoppick (2001) find an
LSW statistic of 4.8% on the basis of the distribution of changes in labor incomes
from a sample of employees in West Germany for the period 1975-1995. Kuroda
and Yamamoto find an LSW statistic of 11% for the distribution of the monthly
wages of full-time employees in Japan between 1993 and 1998. Lebow et al (2003)
estimate an LSW of 13.2% for the United States, using information about changes
in salaries and wages by position in the industry during the period from 1981 to
1999.
Furthermore, Table 4 shows that 79.1% of companies, on average, carry out
positive changes in nominal wages of white collar workers, while 5.4% of firms do
not make any changes and 15.5% effect negative changes. In the case of blue
collar workers these percentages are 81.8%, 7.9% and 10.3%, respectively (Table
5). These results support the presence of downward nominal wage rigidities.
16 Lebow et al (2003) point out that a more robust test about the existence of nominal rigidities should take into account the existing relationship between the distribution of wages and inflation. To do this, these authors econometrically estimate the relationship between the LSW statistic and inflation, obtaining a negative and significant coefficient. In our case, since the analyzed period is short, we calculate the correlation coefficient between these two variables, instead of estimating a regression, as Lebow et al (2003) do. In the case of the samples of white collar workers, the correlation coefficient is -0.51 and -0.15 for the blue collar workers, which supports the evidence for the presence of downward nominal wage rigidities.
11
Nevertheless, it is important to point out that the LSW statistic could not be robust
to the underlying asymmetry in the distribution of wage changes. In fact, according
to Lebow et al (2003), if, independently of the downward wage rigidity, the
distribution is skewed to the right, then as inflation falls and the distribution moves
to the left, the statistic may change, even if the shape of the distribution does not.
For the above reason, the Kahn (1997) test was used, which in addition to being
robust to the presence of extreme observations, has the advantage of not
assuming that the underlying distribution is symmetrical. This test also assumes
that the shape of the distribution does not change with inflation in the absence of
downward nominal wage rigidities.17
This test is based on the histograms of the distribution of the annual changes of
nominal wages and compares, for each year, the height of the histogram bars
which are below zero with those which include changes that are equal to and
higher than zero, up to the median of the annual change of wages. To carry out the
test a histogram is constructed for each year, with the width of the bars set at one
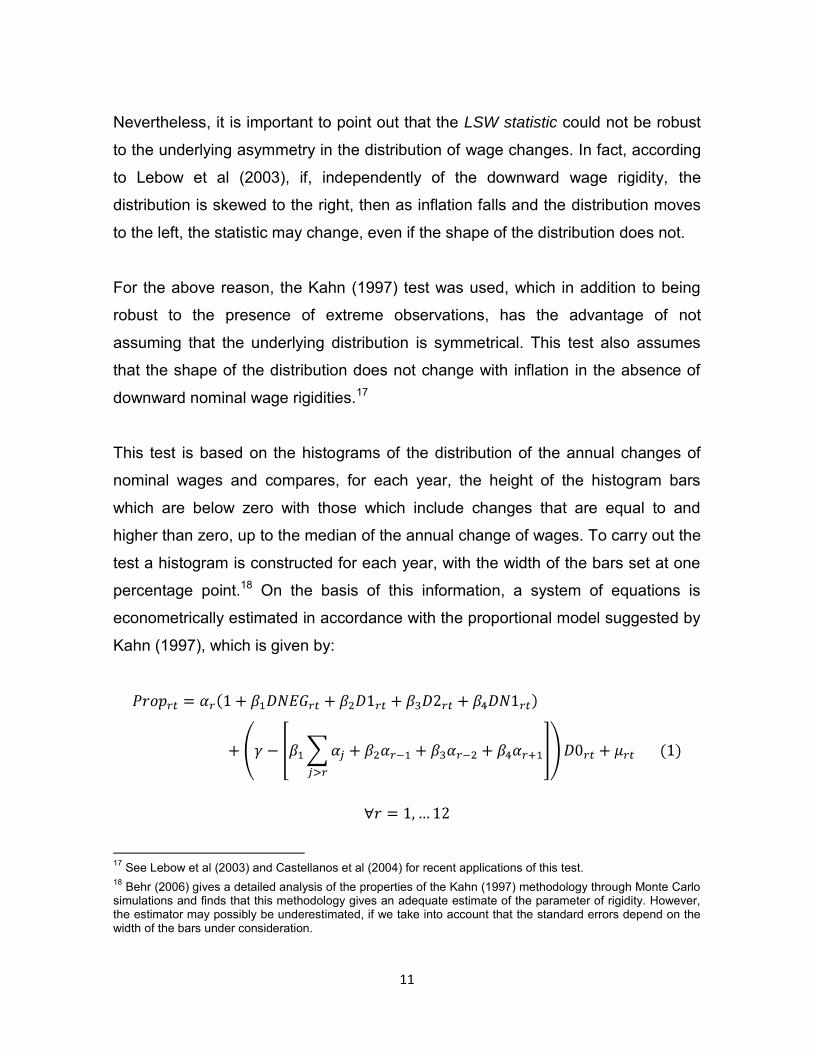
percentage point.18 On the basis of this information, a system of equations is
econometrically estimated in accordance with the proportional model suggested by
Kahn (1997), which is given by:
17 See Lebow et al (2003) and Castellanos et al (2004) for recent applications of this test. 18 Behr (2006) gives a detailed analysis of the properties of the Kahn (1997) methodology through Monte Carlo simulations and finds that this methodology gives an adequate estimate of the parameter of rigidity. However, the estimator may possibly be underestimated, if we take into account that the standard errors depend on the width of the bars under consideration.

12
where:
r indicates a bar of the histogram;
Proprt denotes the proportion of the companies whose average annual wage
changes in the year t fall within the range given by: (i) the median of the changes
minus r percentage points and (ii) the median of the changes minus r+1
percentage points;
DNEGrt is a dummy variable which takes the value of 1 when the change in the
average nominal wages is less than 0;
D0rt is a dummy variable which takes the value of 1 in the bar which has the 0;
D1rt is a dummy variable which takes the value of 1 in the bar immediately above
that which has the 0;
D2rt is a dummy variable which takes the value of 1 two bars above that which has
the 0; and
DN1rt is a dummy variable which takes the value of 1 in the bar immediately below
the one which has the 0.
The parameters to be estimated are r, s, . The model imposes the restriction
that s are equal across equations. Specifically, 1, is the parameter which
measures the rigidity and detects when the histogram bar varies only when it
contains negative observations. If 1=0, the bar will have the same height in every
year and there will be no nominal rigidity. If, by contrast, 1 is negative there will be
evidence of nominal rigidity. The model also imposes the restriction that is the
13
same in all the equations. The parameter detects the concentration of
observations at zero and 2, 3 and 4 measure the existence of menu costs,
ensuring that 1 and detect the nominal rigidity independently of those costs.
In this exercise twelve equations were estimated, which correspond to the same
number of histogram bars, since, as in Kahn (1997) the average changes in the
wages 12% below the median are always negative. This system is estimated by
using iterative weighted least squares, since the number of years included in the
sample (7 years) prevents the SUR estimation done by Kahn (1997).19 In addition,
in line with Lebow et al (2003) and Brzoza-Brzezina and Socha (2007), a logistic
transformation is used in each equation, since the estimated dependent variable
(the height of the histogram bar) cannot be negative.20.
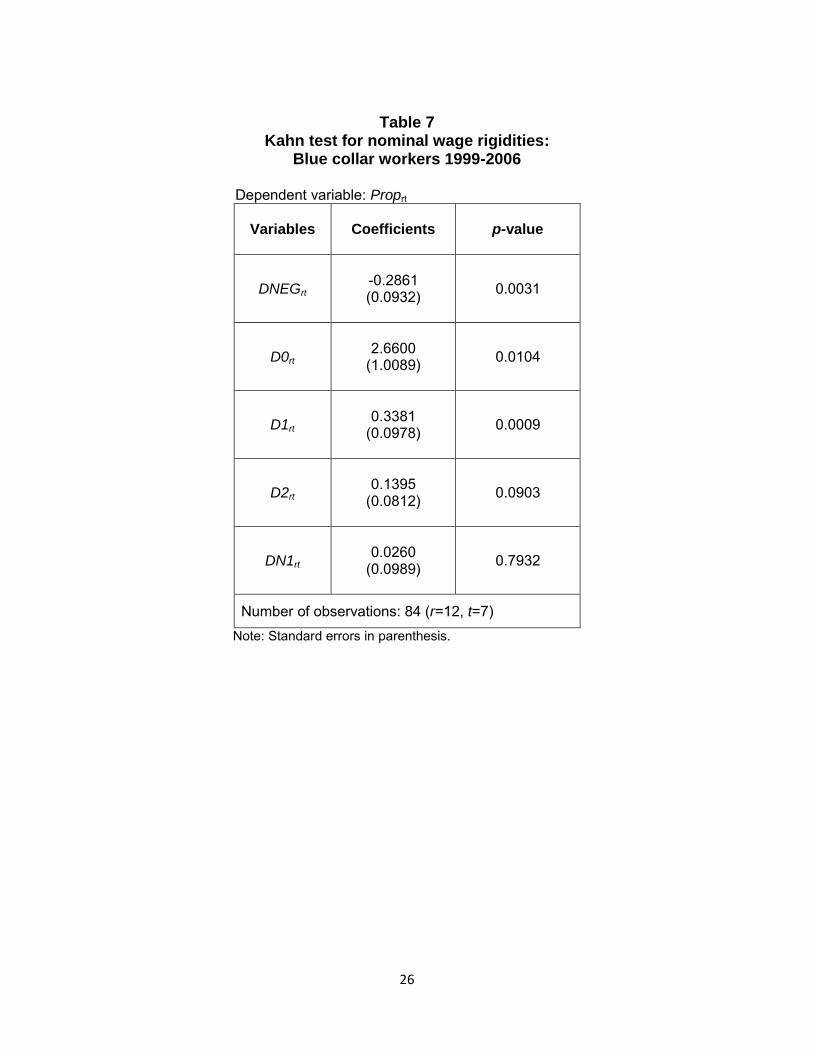
The results of the Kahn test are shown in Tables 6 and 7 for the sample of white
and blue collar workers, respectively. The coefficient of the DNEG variable, which,
as was said, indicates the presence of downward nominal wage rigidities is
negative and significant in both cases. Specifically, in the sample of white collar
workers, this coefficient ( 1) would imply that the negative changes in the wages
are close to 17.5% less than what would be expected in the absence of wage
rigidities.21 In the case of the workers this coefficient is higher than that of the white
collar workers ( 1=29%), which is consistent with the fact that the wage of the
workers is closely linked to the performance of the minimum wage, which is why
one would expect a greater nominal downward wage rigidity.
It is worth noting that the magnitude of these results might be affected by reporting
errors in the wages and by the fact that in this exercise the unit of analysis is the 19 Beissinger and Knoppik (2001) and Knoppik and Beissinger (2009) also use iteratively reweighted least squares to avoid unstable results resulting from the relatively short period of their sample. 20 This is: . 21 That is, the height of the histogram bars which contain negative changes would fall by 17.5% with respect to a scenario without wage rigidities.
14
average wage of the firms and not the individual wage. A similar result was found
by Brzoza-Brzezina and Socha (2007) who estimate downward nominal wage
rigidities at the firm level in Poland. These authors argue that such rigidity is less
than the one calculated on the basis of individual worker data, since in the first
case information about the average wage is used. As a consequence, it is not clear
whether the indicator for rigidity obtained at the firm level is the result of a greater
flexibility of wages or changes in the composition of the work force within each firm.
Thus, as in the Polish case, the coefficient of rigidity that is obtained must be
regarded as a lower limit of the true downward nominal rigidity.
The estimated coefficient on the variable D0 indicates that the bars of the
histograms which include changes in wages equal to zero are larger than they
would be in the absence of long-term contracts or reasons other than the rigidity of
wages or menu costs. The estimated coefficients of the dummy variables that were
included to detect the presence of menu costs, namely D1, D2 and DN1, are
positive but only D1 and D2 are statistically significant. This suggests that the
menu costs are not important in the case of the sample under analysis and for that
reason the average increases of the wages of the firms, although positive, may be
less than 1 and 2%, respectively. These results are different from those estimated
by Kahn (1997) and Lebow et al (2003), who find that the coefficients of these
variables are negative. The difference may be due to the fact that, in this case,
changes in the average nominal wage of the companies are analyzed instead of
that of individuals, which might increase the number of changes in wages close to
zero.
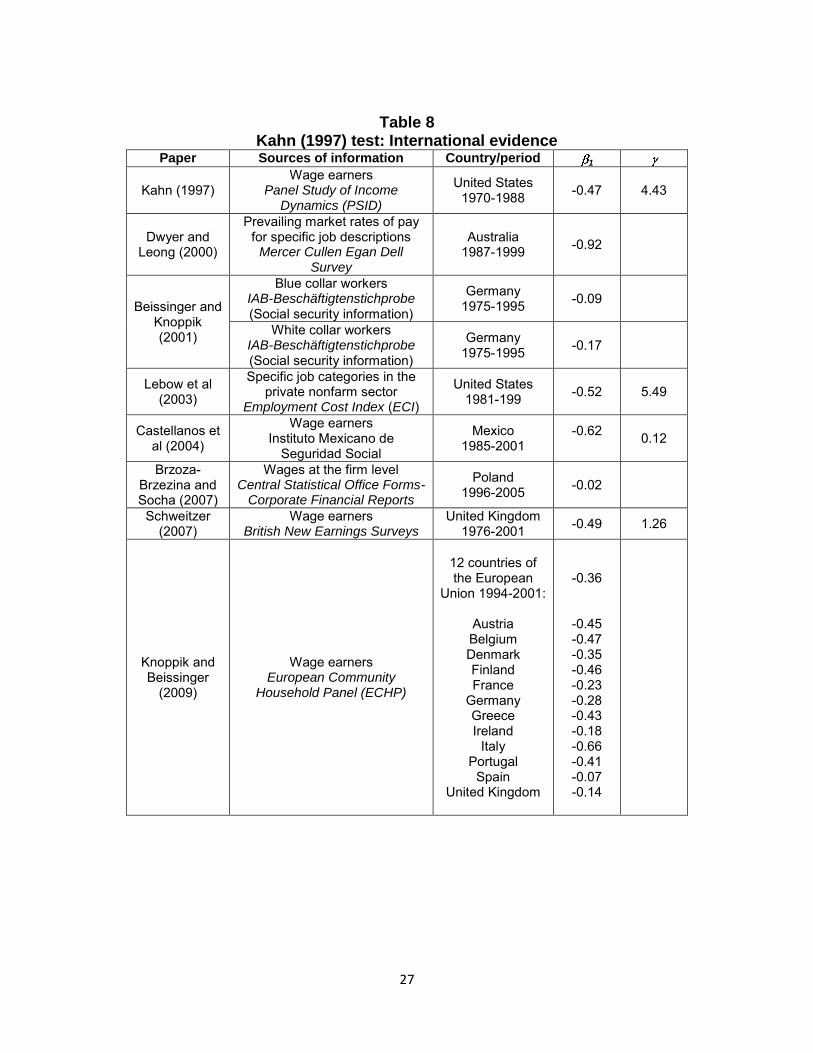
It should be mentioned that the coefficient of rigidity ( 1) estimated in this study lies
in the lower range of those reported by the international studies (Table 8).
However, these comparisons must be interpreted with caution, since the unit of
analysis (that is individual, job or firm), the measurement of remuneration, the
15
period under consideration and the labor legislation widely differ from one country
to another.
IV. Conclusions
This study provides micro-economic evidence about the existence and degree of
downward nominal wage rigidity for a sample of Colombian firms during the period
1999- 2006. In particular, from the analysis of the histograms of the distribution of
the annual changes in nominal wages it is found that there is a high variation in its
magnitude, both for white and blue collar workers.
It is worth emphasizing the cluster of wage variations around zero as well as the
existence of more positive than negative wage changes, suggesting the presence
of downward nominal wage rigidities. Furthermore, the higher cluster of data found
around the observed inflation, could be the consequence of the common
Colombian practice of adjusting wages on the basis of inflation or the increase of
the minimum wage.
To statistically test the significance of the results derived from the visual inspection
of the histograms, two tests frequently applied in the literature on wage rigidities
were used: the LSW statistic and the Kahn test. The results of these tests confirm
the existence of downward nominal wage rigidities in the analyzed samples.
It is worth noting, in addition, that on the basis of the results of the Kahn tests, we
find that the coefficient of rigidity is higher for blue collar workers than white collar
workers, since the increase in the wages of the blue collar workers is generally
done by taking into account the change in the minimum wage, which is why a
higher rigidity would be expected.

16
The coefficients of rigidity estimated in this paper lie in the lower range of those
reported by international studies, which may be due to the fact that the analysis
was made on the level of the firm and not the individual. As a consequence, the
indicator for rigidity may be affected by changes in the composition of the
workforce within each firm.
17
References
Agell, J. and P. Lundborg “Survey evidence on wage rigidity and unemployment:
Sweden in the 1990s”, Scandinavian Journal of Economics, vol. 105, num.
1, pp. 15 29, 2003.
Agell, J. and P. Lundborg. “Theories of pay and unemployment: survey evidence
from Swedish manufacturing firms”, Scandinavian Journal of Economics,
vol. 97, num. 2, pp. 295-307, 1995.
Akerlof, G.; W. Dickens; and G. L. Perry. “The macroeconomic of low inflation”,
Brookings Papers on Economic Activity. vol. 27, num. 1, pp.1-76, 1996.
Barwell, R. and M. E. Schweitzer. “The incidence of nominal and real wage
rigidities in Great Britain: 1978-98”, The Economic Journal, vol. 117, num.
524, pp. 553-569, 2007
Bauer, T.; H. Bonin; L. Goette and U. Sunde. “Real and nominal wage rigidities and
the rate of inflation: Evidence from West German micro data”, The Economic
Journal, vol. 117, num. 524, pp. 508-529, 2007.
Behr, A. “Properties of the histogram location approach and the extent and change
of downward nominal wage rigidity in the EU”, The European Journal of
Comparative Economics, vol. 3, num.1, pp. 15-29, 2006.
Beissinger, T. and C. Knoppik. “Downward nominal rigidity in the West German
earnings, 1975-1995”, German Economic Review, vol. 2, num.4, pp. 385-
417, 2001.
Bewly, T. Why wages don’t fall during a recession, Harvard University Press,
Cambridge, M.A. 1999.
Blinder, A. and D. Choi. “A shred of evidence on theories of wage stickiness”,
Quarterly Journal of Economics, vol. 105, num. 4, pp.1003-1015, 1990.
18
Brzoza-Brzezina, M and J. Socha. “Downward nominal wage rigidity in Poland and
its implications for monetary policy”, MPRA Paper, num. 843, Available from
http://mpra.ub.uni-muenchen.de/843/1/MPRA_paper_843.pdf, 2007.
Campbell, C. M. and K. S. Kamlani. “The reasons for wage rigidity: Evidence from
a survey of firms”, Quarterly Journal of Economics, vol. 112, num. 3, pp.
759-789, 1997.
Castellanos, S. G.; R. García-Verdú and D. S. Kaplan. “Nominal wage rigidities in
Mexico: evidence from social security records”, Journal of Development
Economics, vol. 75, num. 2, pp. 507-533, 2004.
Croson, R. and U. Gneezy. “Gender Differences in Preferences”, Journal of
Economic Literature, vol. 47, num. 2, pp. 448-474, 2009.
Devicienti, F.; A. Maida and P. Sestito. “Downward wage rigidity in Italy: Micro-
Based measures and implications”, The Economic Journal, vol. 117, num.
524, pp. 530-552, 2007.
Dickens, W. T.; L. Goette; E. L. Groshen; S. Holden; J. Messina; M.E. Schweitzer;
J. Turunen and M. E. Ward. “How wages change: Micro evidence from the
International Wage Flexibility Project”, The Journal of Economic
Perspectives, vol. 21, num. 2, pp. 195-214, 2007.
Dwyer J. and K. Leong. “Nominal wage rigidity in Australia”, Research Discussion
Paper, num. 2000-08, Economic Research Department, Research Bank of
Australia, 2000.
Elsby, M.W.L. “Evaluating the economic significance of downward nominal wage
rigidity”, Journal of Monetary Economics, vol. 56, num. 2, pp.154-169, 2009.
Fortin, P. “The Great Canadian Slump”, Canadian Journal of Economics, vol.29,
num. 4, pp. 761-87, 1996.
19
Goette, L.; U. Sunde and T. Bauer. “Wage rigidity: Measurement, causes and
consequences”, The Economic Journal, vol. 117, num. 524, pp. 499-507,
2007.
Holden S. and F. Wulfsberg. “How strong is the macroeconomic case for
downward real wage rigidity?”, Working Paper, num 07-6, Federal Reserve
Bank of Boston, 2007.
Holden S. and F. Wulfsberg. “Downward nominal wage rigidity in the OECD”, The
B.E. Journal of Macroeconomics, vol. 8, num 1(advances), art. 15, 2008.
Kahn, S. “Evidence of nominal wage stickiness from microdata”, The American
Economic Review, vol. 87, num 5, pp. 993-1008, 1997.
Knoppik, C. and T. Beissinger. “Downward nominal wage rigidity in Europe: an
analysis of European micro data from the ECHP 1994-2001”, Empirical
Economics, vol. 36, num 2, pp. 321-338, 2009.
Kuroda, S. and I. Yamamoto. “Are Japanese nominal wages downwardly rigid?
(Part I): Examinations of nominal wage change distributions”, IMES
Discussion Paper, num 2003-E-3, Institute for monetary and economic
studies, Bank of Japan, Tokyo, Japan, 2003.
Lebow, D.; S. Raven and A.W. Beth. “Downward nominal wage rigidity: Evidence
from the employment cost index”, Advances in Macroeconomics, vol. 3,
num. 3, art. 2, Available from
http://www.bepress.com/bejm/advances/vol3/iss1/art2, 2003.
Lebow, D.; D. J. Stockton and W. L. Wascher. “Inflation, nominal wage rigidity and
the efficiency of labor markets”, Finance and Economics Discussion Series,
num. 94-45, Board of Governors of the Federal Reserve System, 1995.
McLaughlin, K. “Rigid wages?”, Journal of Monetary Economics, vol. 34, num.3,
pp. 383-414, 1994.
20
McLaughlin, K. “Asymmetric wage changes and downward nominal wage rigidity”,
unpublished paper, mimeo, Hunter College and the Graduate Center, City
University of New York, 2000.
Messina, J.; P. Du Caju; C.F.Duarte; M. Izquierdo; and N. L. Hansen. “The causes
and consequences of nominal and real wage rigidity: a sectoral approach”,
http://www.ecb.int/events/pdf/conferences/wage_dynamics_europe/messina
_et_al.pdf?7a98b045f4a02c7924a2e4d4e15177fd, 2008.
Schweitzer, M. “Wage flexibility in Britain: some micro and macro evidence”,
Working Paper, num.331, Bank of England, 2007.
Stiglbauer, A. “Identification of wage rigidities in microdata – a critical literature
review”. Focus on Austria, Oesterreichische Nationalbank, vol., 3 pp. 110-
126, 2002.
Tobin, J. “Inflation and Unemployment”, American Economic Review, vol.62,
num.1, pp.1-18, 1972.
21
Table 1 Sample statistics: 1999-2006
Firms by sector
Sector White collar workers Blue collar workers
Firms Share of the
total (%) Firms Share of the
total (%) Agriculture 148 9.8 120 15.4 Commerce 513 33.8 115 14.7 Construction 99 6.5 37 4.7 Electricity, gas and water 29 1.9 7 0.9 Manufactures 543 35.8 470 60.2 Financial services 53 3.5 10 1.3 Other services 132 8.7 22 2.8
Firms by size
Size White collar workers Blue collar workers
Firms Share of the
total (%) Firms Share of the
total (%) Large 1,165 76.8 637 81.6 Not large 352 23.2 144 18.4
Firms by location
City White collar workers Blue collar workers
Firms Share of the
total (%) Firms Share of the
total (%) Bogotá 780 51.4 344 44.0 Cali 145 9.6 59 7.6 Medellín 239 15.8 84 10.8 Barranquilla 75 4.9 34 4.4 Other cities 278 18.3 260 33.3 Total sample 1,517 100 781 100
Source: Supersociedades and authors’ calculations.
22
Table 2 Average real wage 1999-2006 (US$)
Real wage by sector: average 1999-2006
White collar workers Blue collar workers Male Female Weighted Male Female Weighted
Agriculture 559.4 475.8 522.6 257.6 245.8 256.6
Commerce 628.6 519.2 582.7 320.6 269.1 315.5
Construction 627.3 477.1 558.2 310.2 265.1 308.6
Electricity, gas and water 1578.1 977.8 1418.1 700.6 642.6 700.5
Manufactures 769.7 603.5 696.6 359.8 305.9 348.6
Financial services 470.5 470.6 466.6 292.5 246.0 282.4
Other services 749.9 605.9 688.7 300.6 271.6 296.8
Real wages by size: average 1999-2006
White collar workers Blue collar workers Male Female Weighted Male Female Weighted
Large 748.1 594.4 682.7 348 298.6 339.7
Not large 521.2 432.9 486.5 283.1 238.0 276.6
Real wages by location: average 1999-2006
White collar workers Blue collar workers Male Female Weighted Male Female Weighted
Bogotá 761.9 604.6 695.0 334.1 278.6 325.1
Cali 659.3 544.4 600.8 317.1 295.8 310.1
Medellín 685.1 551.1 625.4 342.2 306.0 333.3
Barranquilla 734.4 523.0 666.6 343.1 276.9 334.6
Other cities 526.9 445.0 496.0 339.9 298.3 333.6
Total sample 695.8 557.2 637.2 336.0 288.8 328.1 Source: Supersociedades and authors’ calculations. Note: Annual wages were converted into American dollars using the average exchange rate of each year.
23
Table 3 Distribution of real wages by deciles:
Average 1999-2006 (US$)
Decile White collar workers
Blue collar workers
1 292 209 2 348 231 3 401 253 4 453 275 5 511 297 6 585 324 7 682 354 8 834 395 9 1,115 475 10 4,056 1,527
Source: Supersociedades and authors’ calculations Note: Annual wages were converted into American dollars using the average exchange rate of each year.
Table 4 Asymmetry test LSW for white collar workers
Year
LSW
Statistic (%)
p-value
Percentage changes in nominal
wages
Positive Equal to zero
Negative
2000 6.841 0.0000 81.3 6.1 12.6
2001 3.686 0.0137 79.4 4.5 16.1
2002 6.390 0.0001 78.6 5.8 17.5
2003 7.454 0.0000 79.6 5.0 15.4
2004 9.453 0.0000 79.8 5.6 14.6
2005 6.357 0.0002 77.6 4.5 17.9
2006 7.926 0.0000 77.4 6.5 16.1
All years 7.448 0.0000 79.1 5.4 15.5 Source: Authors’ calculations.
24
Table 5 Asymmetry test LSW for blue collar workers
Year
LSW
Statistic (%)
p-value
Percentage changes in nominal
wages
Positive Equal to zero
Negative
2000 8.242 0.0000 82.8 8.3 8.9
2001 5.467 0.0021 83.2 7.5 9.3
2002 5.505 0.0020 82.6 7.1 10.3
2003 5.172 0.0056 80.0 8.5 11.5
2004 7.806 0.0000 82.9 7.3 9.8
2005 9.274 0.0000 80.6 8.2 11.2
2006 5.937 0.0020 80.1 9.0 10.9
All years 7.807 0.0000 81.8 7.9 10.3 Source: Authors’ calculations.

25
Table 6 Kahn test for nominal wage rigidities:
White collar workers 1999-2006
Dependent variable: Proprt
Variables
Coefficients
p-value
DNEGrt
-0.1746 (0.0791)
0.0307
D0rt
1.6645
(0.9070)
0.0700
D1rt
0.0856
(0.1108)
0.4426
D2rt
0.2418
(0.1042)
0.0234
DN1rt
0.0323
(0.0588)
0.5841
Number of observations: 84 (r=12, t=7) Note: Standard errors in parenthesis.
26
Table 7 Kahn test for nominal wage rigidities:
Blue collar workers 1999-2006
Dependent variable: Proprt
Variables
Coefficients
p-value
DNEGrt
-0.2861 (0.0932)
0.0031
D0rt
2.6600
(1.0089)
0.0104
D1rt
0.3381
(0.0978)
0.0009
D2rt
0.1395
(0.0812)
0.0903
DN1rt
0.0260
(0.0989)
0.7932
Number of observations: 84 (r=12, t=7) Note: Standard errors in parenthesis.
27
Table 8 Kahn (1997) test: International evidence
Paper Sources of information Country/period 1
Kahn (1997) Wage earners
Panel Study of Income Dynamics (PSID)
United States 1970-1988 -0.47 4.43
Dwyer and Leong (2000)
Prevailing market rates of pay for specific job descriptions
Mercer Cullen Egan Dell Survey
Australia 1987-1999 -0.92
Beissinger and Knoppik (2001)
Blue collar workers IAB-Beschäftigtenstichprobe (Social security information)
Germany 1975-1995 -0.09
White collar workers IAB-Beschäftigtenstichprobe (Social security information)
Germany 1975-1995 -0.17
Lebow et al (2003)
Specific job categories in the private nonfarm sector
Employment Cost Index (ECI)
United States 1981-199 -0.52 5.49
Castellanos et al (2004)
Wage earners Instituto Mexicano de
Seguridad Social
Mexico 1985-2001
-0.62 0.12
Brzoza-Brzezina and Socha (2007)
Wages at the firm level Central Statistical Office Forms-
Corporate Financial Reports
Poland 1996-2005 -0.02
Schweitzer (2007)
Wage earners British New Earnings Surveys
United Kingdom 1976-2001 -0.49 1.26
Knoppik and Beissinger
(2009)
Wage earners European Community
Household Panel (ECHP)
12 countries of the European
Union 1994-2001:
Austria Belgium Denmark Finland France
Germany Greece Ireland
Italy Portugal
Spain United Kingdom
-0.36
-0.45 -0.47 -0.35 -0.46 -0.23 -0.28 -0.43 -0.18 -0.66 -0.41 -0.07 -0.14
28
Graph 1 Histograms of the distribution of annual changes in average nominal wages of the
firms: White collar workers 1999-2006
Source: Authors’ calculations.
.00
.01
.02
.03
.04
.05
.06
-10 0 10 20 30
Histogram Normal Kernel
Dens
ity
Wage changes for the whole sample period: white collar workers
.00
.01
.02
.03
.04
.05
.06
.07
.08
-10 0 10 20 30
Histogram Normal Kernel
Dens
ity
Wage changes: white collar workers 2000/1999
Inflation(t-1)
.00
.01
.02
.03
.04
.05
.06
.07
-10 0 10 20 30
Histogram Normal Kernel
Dens
ity
Wage changes: white collar workers 2001/2000
Inflation(t-1)
.00
.01
.02
.03
.04
.05
.06
.07
-10 0 10 20 30
Histogram Normal Kernel
Dens
ity
Wage changes: white collar workers 2002/2001
Inflation(t-1)
.00
.01
.02
.03
.04
.05
.06
.07
-10 0 10 20 30
Histogram Normal Kernel
Dens
ity
Wage changes: white collar workers 2003/2002
Inflation(t-1)
.00
.01
.02
.03
.04
.05
.06
.07
-10 0 10 20 30
Histogram Normal Kernel
Dens
ity
Wage changes: white collar workers 2004/2003
Inflation(t-1)
.00
.01
.02
.03
.04
.05
.06
.07
.08
-10 0 10 20 30
Histogram Normal Kernel
Dens
ity
Wage changes: white collar workers 2005/2004
Inflation(t-1)
.00
.01
.02
.03
.04
.05
.06
.07
.08
.09
-10 0 10 20 30
Histogram Normal Kernel
Dens
ity
Wage changes: white collar workers 2006/2005
Inflation(t-1)
29
Graph 2 Histograms of the distribution of annual changes in average nominal wages of the
firms: blue collar workers 1999-2006
Source: Authors’ calculations.
.00
.01
.02
.03
.04
.05
.06
.07
.08
.09
-10 0 10 20 30
Histogram Kernel Normal
Dens
ity
Wage changes for the whole sample period: blue collar workers
.00
.02
.04
.06
.08
.10
.12
.14
-10 0 10 20 30
Histogram Normal Kernel
Dens
ity
Wage changes: blue collar wokers 2000/1999
Inflation(t-1)
.00
.01
.02
.03
.04
.05
.06
.07
.08
-10 0 10 20 30
Histogram Normal Kernel
Dens
ity
Wage changes: blue collar workers 2001/2000
Inflation(t-1)
.00
.02
.04
.06
.08
.10
-10 0 10 20 30
Histogram Normal Kernel
Dens
ity
Wage changes: blue collar workers 2002/2001
Inflation(t-1)
.00
.02
.04
.06
.08
.10
.12
-10 0 10 20 30
Histogram Normal Kernel
Dens
ity
Wage changes: blue collar workers 2003/2002
Inflation(t-1)
.00
.02
.04
.06
.08
.10
.12
.14
-10 0 10 20 30
Histogram Normal Kernel
Dens
ity
Wage changes: blue collar workers 2004/2003
Inflation(t-1)
.00
.02
.04
.06
.08
.10
.12
.14
-10 0 10 20 30
Histogram Normal Kernel
Dens
ity
Wage changes: blue collar workers 2005/2004
Inflation(t-1)
.00
.02
.04
.06
.08
.10
.12
-10 0 10 20 30
Histogram Normal Kernel
Dens
ity
Wage changes: blue collar workers 2006/2005
Inflation(t-1)