boise incboise inc. - ppsa design... · 300300 eco dab e ju es recordable injuries 3,000 first aid...
TRANSCRIPT

Boise IncBoise Inc.The Design, Implementation & Impact of Leading Indicatorsof Leading IndicatorsJune 13, 2012

Introduction
Company Background Company Background• Paper & Packaging• Pursuit of leading indicatorsPursuit of leading indicators
Since 2007
00/00/00 Identifier| Page 1
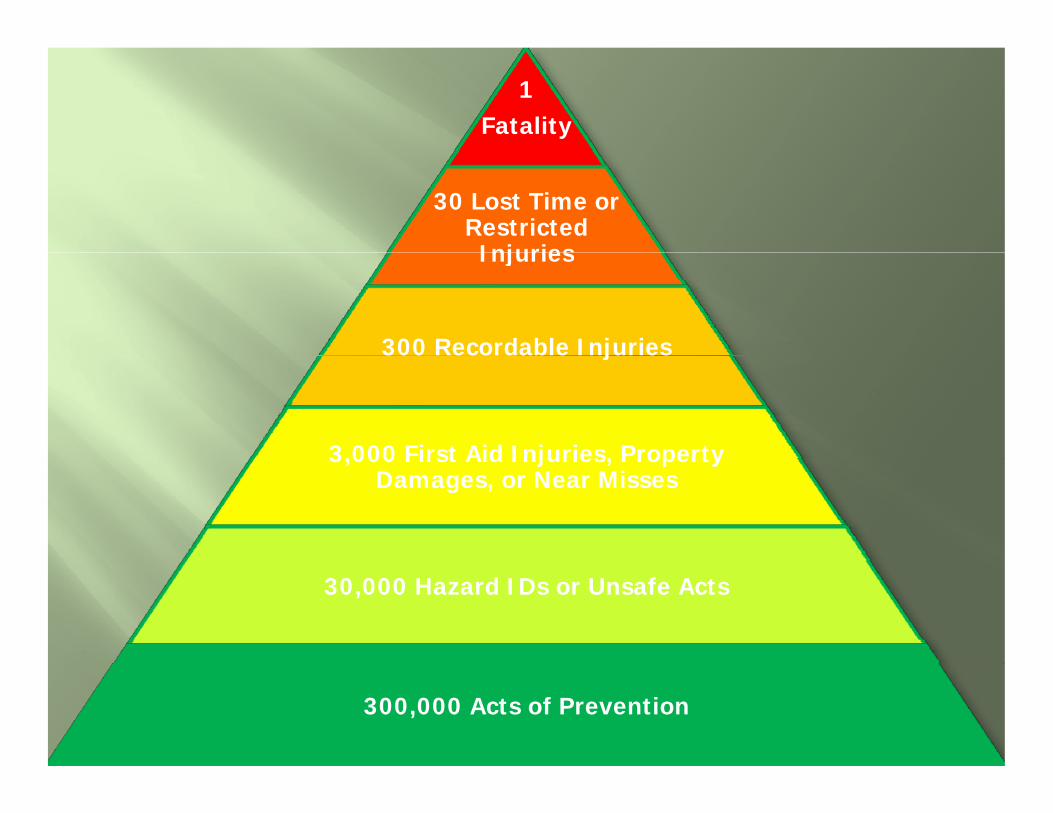
1 Fatality
30 Lost Time or Restricted
InjuriesInjuries
300 Recordable Injuries300 eco dab e ju es
3,000 First Aid Injuries, Property3,000 First Aid Injuries, Property Damages, or Near Misses
30,000 Hazard IDs or Unsafe Acts
300,000 Acts of Prevention

1 Fatality
Employee slips on a piece of paper and strikes his head on the corner of a machine.
30 Lost Time or Restricted
Injuries
E l li i f
Employee slips on a piece of paper striking his side on the corner of a machine and breaks his rib.
300 Recordable Injuries
Employee slips on a piece of paper and hits his chin on the machine and cuts chin.
3,000 First Aid Injuries, Property Damages, or Near
MissesEmployee pulls a piece of
Employee slips on a piece of paper and nearly falls?
30,000 Hazard IDs or Unsafe Acts
Employee pulls a piece of paper off the machine and drops it on the floor?

Leading Indicator
What is a leading indicator? What is a leading indicator? What is the leading indicator in the previous
slide? What can we do to address leading indicators
and how will that affect the pyramid?py
00/00/00 Identifier| Page 4

Audience Activity
Each team will come up with as many Each team will come up with as many participation activities as possible• Before listing the next activity the team must g y
determine the activity’s effect on the pyramid
00/00/00 Identifier| Page 5

Leading Indicators
Visible LeadershipE l
Preventive Maintenance Employee
ParticipationT i i
Maintenance Accountability
G l & Pl i Training Incident Reporting &
Investigation
Goals & Planning Operational Discipline
Investigation Hazard Analysis &
CorrectionCorrection Safety
Communication
00/00/00
Communication
Identifier| Page 6

Barriers to Implementation
L d hi & P lit f Leadership & Management commitment
• Poor quality of participation Observationscommitment
Sustainability Complacency
Observations Audits Committee meetings
Complacency Employee resistance
• Pencil whipping• Pencil whipping• Non-participation
00/00/00 Identifier| Page 7

Participation @ Boise Inc.
Measurement Measurement Definition of Participation
• QualityQuality Hurdle rate (5 points)
• QuantityQuantity Commitment
• CEO to Location ManagementCEO to Location Management
00/00/00 Identifier| Page 8

Tracking Participation
MTD YTD
Safety Participation %: 99.9% 99.8%
Safety Achievement %: 95.7% 97.9%y
Hazard IDs: 335 2071
Near Misses: 5 46
Property Damages: 7 40
First Aid Incidents: 6 49
# of Recordable Incidents: 1 3
00/00/00 Identifier| Page 9
# of Recordable Incidents: 1 3

Monthly Points Distribution
80%
90%
100%
80%
90%
100%
% Participation/Achievement% of category participation
50%
60%
70%
80%
50%
60%
70%
80%
10%
20%
30%
40%
10%
20%
30%
40%
0%0%Jan‐12 Feb‐12 Mar‐12 Apr‐12 May‐12 Jun‐12 Jul‐12 Aug‐12 Sep‐12 Oct‐12 Nov‐12 Dec‐12
Other External Safety Training Safety SloganParticipation in Safety Meeting Safety Work Order Valid Hazard IDSAIL, STOP SafeStart or SafeTrack Observation Safety Conversation Safety Moment, y ySafeStart Story Near Miss Report Safety SuggestionLead a Tool Box Meeting Present Safety News Flash Lockout AuditSafety Audit Incident Investigation Safety DemonstrationEnvironmental Audit Housekeeping Audit Safety PosterMonthly Area Safety Inspection Conducting a JSA Review CPR‐AED‐ First Aid Training`Writing a JSA Safety Audit Leader Safety Committee or Sub‐Committee LeaderM t E l S f St t T i I id t I ti ti T L d
00/00/00 Identifier| Page 10
Mentor new Employees Safe Start Trainer Incident Investigation Team LeaderParticipation % Achievement %

Participation Activities vs. Incident Rate60000
1.8
2
40000
50000
1.4
1.6
30000
0.8
1
1.2
Poin
ts
Inci
dent
Rat
e
IR
Participation
10000
20000
0.4
0.6
0
10000
0
0.2
2008 2009 2010 2011Y
00/00/00 Identifier| Page 11
Year

Examples of Participation Activities Safety Audit Housekeeping
Safety News Flash P t ti
Inspections Safety Posters
Audit BBS
Ob ti
Presentation SafeStart
Trainer
Writing a JSA Reviewing a
Observation Safety Team
Trainer Investigation
Team
JSA CPR/AED
Safety CommitteeS f
Team Near Miss
Safety
Training Community
A i i i Safety ConversationH d ID
Safety Moment
SafeStart
Activities
00/00/00
Hazard ID SafeStart Story
Identifier| Page 12

More than Participation
Housekeeping Audits• Observation
Incident Investigation• RCA• Observation
• Feedback• Track improvement
• RCA• Corrective Action
Track improvement BBS Observation
• Observation• Observation• Feedback• Track improvementTrack improvement• Data use
00/00/00 Identifier| Page 13

More than Participation
Safety Committee Safety Committee• Active Involvement
Employeesp y Management
• Communication of activities JSA Reviews SafeStart
00/00/00 Identifier| Page 14

The Path Forward
Safety As A Value Safety As A Value Zero Incidents Lagging Indicators vs Leading Indicators Lagging Indicators vs. Leading Indicators Participation & Ownership Participation & Leadership Participation & Leadership
00/00/00 Identifier| Page 15

Wrap Up
QUESTIONS? QUESTIONS?
00/00/00 Identifier| Page 16