boletín estadístico - bdebanco de espaÑa 8 boletÍn estadÍstico, february 2013 credit...
TRANSCRIPT

02/2013
English version

BOLETÍN ESTADÍSTICO FEBRUARY 2013

The closing date for the receipt of the statistical data used in this publication was
4 March 2013.
The Banco de España disseminates all its reports
and periodical publications via the Internet at
http://www.bde.es.
Reproduction for educational and non-commercial purposes is permitted
provided that the source is acknowledged.
© Banco de España, Madrid, 2013
ISSN: 1579 - 8631 (online)

ABBREVIATIONS
AIAF
BCBS
BE
BIS
CBSO
CCR
CEMLA
CEPR
CNE
CNMV
CPI
DGS
ECB
ECCO
ECOFIN
EDP
EMU
EONIA
EPA
ESA 79
ESA 95
ESCB
EU
EU-15
EU-25
EU-27
Eurostat
FAFA
FASE
FDI
FIAMM
FIM
FISIM
GDI
GDP
GFCF
GNP
Association of Securities Dealers
Basel Committee on Banking Supervision
Banco de España
Bank for International Settlements
Central Balance Sheet Data Office
Central Credit Register
Center for Latin American Monetary Studies
Centre for Economic Policy Research
Spanish National Accounts
National Securities Market Commission
Consumer Price Index
Directorate General of Insurance and Pension Funds
European Central Bank
ECB External Communications Committee
Council of the European Communities (Economic and
Financial Affairs)
Excessive Deficit Procedure
Economic and Monetary Union
Euro overnight index average
Official Spanish Labour Force Survey
European System of Integrated Economic Accounts
European System of National and Regional Accounts
European System of Central Banks
European Union
Countries making up the European Union as at 31/04/04
Countries making up the European Union as from 1/05/04
Countries making up the European Union as from 1/01/07
Statistical Office of the European Communities
Fund for the Acquisition of Financial Assets
Financial Accounts of the Spanish Economy
Foreign direct investment
Money market funds
Securities funds
Financial intermediation services indirectly measured
Gross disposable income
Gross domestic product
Gross fixed capital formation
Gross national product
GVA
HICP
IADB
ICT
IGAE
IMF
INE
INEM
INVERCO
LIFFE
MEFF
MFIs
MiFID
MMFs
MROs
MTBE
NAIRU
NCBs
NPISHs
OECD
OPEC
PFs
PPP
QNA
RoW
SCLV
SDRs
SICAV
SMEs
TARGET
TFP
ULCs
VAT
WTO
XBRL
Gross value added
Harmonized Index of Consumer Prices
Inter-American Development Bank
Information and communications technology
National Audit Office
International Monetary Fund
National Statistics Institute
National Public Employment Service
Association of Collective Investment Institutions and Pension
Funds
London International Financial Futures Exchange
Financial Futures and Options Market
Monetary financial institutions
Markets in Financial Instruments Directive
Money market funds
Main refinancing operations
Banco de España quarterly macroeconomic model
Non-accelerating-inflation rate of unemployment
National central banks
Non-profit institutions serving households
Organization for Economic Co-operation
and Development
Organization of Petroleum Exporting Countries
Pension funds
Purchasing power parity
Quarterly National Accounts
Rest of the World
Securities Clearing and Settlement Service
Special Drawing Rights
Open-end Investment Companies
Small and medium-sized enterprises
Trans-European Automated Real-time Gross settlement
Express Transfer system
Total factor productivity
Unit labour costs
Value Added Tax
World Trade Organization
Extensible Business Reporting Language
COUNTRIES Y CURRENCIES CONVENTIONS USED In accordance with Community practice, the EU countries are listed using the
alphabetical order of the country names in the national languages.
BE
BG
CZ
DK
DE
EE
IE
GR
ES
FR
IT
CY
LV
LT
LU
HU
MT
NL
AT
PL
PT
RO
SI
SK
FI
SE
UK
JP
US
Belgium
Bulgaria
Czech Republic
Denmark
Germany
Estonia
Ireland
Greece
Spain
France
Italy
Cyprus
Latvia
Lithuania
Luxembourg
Hungary
Malta
Netherlands
Austria
Poland
Portugal
Romania
Slovenia
Slovakia
Finland
Sweden
United Kingdom
Japan
United States
EUR (euro)
BGN (Bulgarian lev)
CZK (Czech koruna)
DKK (Danish krone)
EUR (euro)
EEK (Estonia kroon)
EUR (euro)
EUR (euro)
EUR (euro)
EUR (euro)
EUR (euro)
EUR (euro)
LVL (Latvian lats)
LTL (Lithuanian litas)
EUR (euro)
HUF (Hungarian forint)
EUR (euro)
EUR (euro)
EUR (euro)
PLN (Polish zloty)
EUR (euro)
RON (New Romanian leu)
EUR (euro)
SKK (Slovakian koruna)
EUR (euro)
SEK (Swedish krona)
GBP (Pound sterling)
JPY (Japanese yen)
USD (US dollar)
M1
M2
M3
Q1, Q4
H1, H2
Bn
M
Bp
Pp
...
—
0.0
Notes and coins held by the public + sight deposits.
M1 + deposits redeemable at notice of up to three months +
deposits with an agreed maturity of up to two years.
M2 + repos + shares in money market funds and money
market instruments + debt securities issued with an agreed
maturity of up to two years.
Calendar quarters.
Calendar half-years.
Billions (109).
Millions.
Basis points.
Percentage points.
Not available.
Nil, non-existence of the event considered or insignificance
of changes when expressed as rates of growth.
Less than half the final digit shown in the series.

ADDITIONS AND NOTICE
Calendar for IMF SDDS
statistics
The Banco de España publishes on its website under Statistics
(http://www.bde.es/bde/en/areas/estadis), a release calendar for statistics which
includes the dates relating to the information required by the IMF Special Data
Dissemination Standards (SDDS). From the calendar, it is possible to access those
Banco de España indicators and statistics which meet SDDS requirements.
Website version of the
Boletín Estadístico
As from the January 2008 edition, the official publication Boletín Estadístico will be
disseminated only on the Internet at www.bde.es.
BANCO DE ESPAÑA 5 BOLETÍN ESTADÍSTICO, FEBRUARY 2013

SCHEMATIC CONTENTS
GROUPINGS CHAPTERS / PAGES
Additions and notice 5
Index of tables 7
EURO AREA STATISTICS
1. Main economic indicators of the euro area 27
SPANISH STATISTICS
General tables 2. Main economic indicators 45
3. Financial accounts 59
Tables for institutional groupins FINANCIAL INSTITUTIONS
Data from supervisory returns
4. Credit institutions 67Data from euro-area, CNMV and DGS returns
5. Financial institutions 115
6. Monetary financial institutions 123
7. Banco de España 139
8. Other monetary financial institutions 1599. Non-monetary financial institutions, except insurance corporations and pension funds
203
10. Insurance corporations and pension funds 229GENERAL GOVERNMENT
11. General government 237
12. Central government and Social security funds 249
13. Regional autonomous governments 261
14. Local governments 271NON-FINANCIAL CORPORATIONS
15. Non financial Corporations: Summary information compiled by the Central Balance
Sheet Data Office 279HOUSEHOLDS AND NPISH
16. Households and NPISH 299REST OF THE WORLD
17. Balance of payments and international investment position vis-à-vis other euro area
countries and the rest of the world 301
18. Customs statistics 335
Interest rates 19. Interest rates (excluding those published in financial markets chapters) 341
20. Exchange rates and competitiveness indices 355
Financial markets 21. Primary market for securities 363
22. Domestic secondary markets for securities 377
General economic statistics 23. Output and demand 393
24. Employment and wages 405
25. Prices 421
INTERNATIONAL STATISTICS
26. International economy 427
APPENDIX
A1. Banco de España. Official balance sheet 433
A2. Sectorisation schemes 439
A3. Methodological notes 445
BANCO DE ESPAÑA 6 BOLETÍN ESTADÍSTICO, FEBRUARY 2013

INDEX OF TABLES
CHAPTER 1 MAIN ECONOMIC INDICATORS OF
THE EURO AREA
1.1 Activity, prices and labour market 28
1.2 Saving, investment and financing. All residents sectors. Total 29
1.3 Financial transactions. Non-financial corporations 30
1.4 Financial transactions. Households and NPISH 30
1.5 Prices 31
1.6 General government deficit 32
1.7 General government nominal gross consolidated debt 33
1.8 Aggregated and consolidated balance sheet and transactions (adjusted flows)of the euro area MFIs, including the Eurosystem 34
1.9 Euro area monetary aggregates and counterparts of M3. Summary 36
1.10 Euro area monetary aggregates and counterparts of M3. Consolidatedbalances. Original series 38
1.11 Euro area monetary aggregates and counterparts of M3. Transactions(adjusted flows). Original series 38
1.12 Euro area monetary aggregates and counterparts of M3. Consolidatedbalance-sheet and transactions (adjusted flows). Seasonally adjusted series39
1.13 Contribution of the MFIs resident in Spain to the euro area monetaryaggregates and counterparts of M3 39
1.14 Euro area monetary aggregates and the contribution of MFIs resident in Spainto the aggregates 40
1.15 Interest rates 41
1.16 Exchange rates 42
Notes to the tables of chapter 1 43
CHAPTER 2 MAIN ECONOMIC INDICATORS 2.1 National Accounts of Spain 46
2.2 Total economy (consolidated). Non-financial transactions accounts 48
2.3 Total economy. Current and capital accounts by institutional sector 49
2.4 Financial transactions accounts. Detail by institutional sector 51
2.5 Financial balance sheets. Detail by institutional sector 52
2.6 Balance of payments and International Investment Position 53
2.7 Financial accounts. Net financial transactions and net financial assets ofinstitutional sectors 54
2.8 Prices and interest rates (former convergence criteria) 55
2.9 General government deficit and debt (EDP/SGP indicators) 56
2.10 Interest rates 57
2.11 Indices of Spanish competitiveness 58
CHAPTER 3 FINANCIAL ACCOUNTS 3.1 Total economy. Financial balance sheet 60
3.2 Total economy. Financial transactions account 60
3.3 Non-financial corporations. Financial balance sheet 61
3.4 Non-financial corporations. Financial transactions account 61
3.5 Financial institutions. Financial balance sheet 62
3.6 Financial institutions. Financial transactions account 62
3.7 General government. Financial balance sheet 63
3.8 General government. Financial transactions account 63
3.9 Households and non-profit institutions. Financial balance sheet 64
3.10 Households and non-profit institutions. Financial transactions account 64
3.11 Rest of the World. Financial balance sheet 65
3.12 Rest of the World. Financial transactions account 65
BANCO DE ESPAÑA 7 BOLETÍN ESTADÍSTICO, FEBRUARY 2013

CHAPTER 4 CREDIT INSTITUTIONSA) Aggregated balance sheets (data from supervisory returns)
4. Reconciliation between the credit institutions balance sheets in Chapters 4and 8 68
CREDIT INSTITUTIONS
4.A Assets=Liabilities of credit institutions by institution 72
4.1 Assets 72
4.2 Liabilities 73
4.3 Lending. Other resident sectors 73
4.4 Assets. Securities 74
4.5 Liabilities. Other resident sectors 74
4.6 Other unsectorised assets 75
4.7 Equity, valuation adjustments and impairment allowances 75
4.8 Unsectorised liabilities 76
4.9 Other assets and liabilities 76
4.10 Impairment allowances of lending to other resident sectors 77
B) Breakdown of lending and deposits of credit institutions
Lending by credit institutions, by institutional grouping
4.11 To General Government and Other resident sectors 77
4.99 Assets classified as doubtful 78
Lending and doubtful lending by credit institutions to other resident sectors, by type
a) Lending and doubtful lending to finance the productive activity of the corporations
and individual entrepreneurs that receive the credit and breakdown by type of
spending of other financing to households and NPISHs
4.13 Total 79
4.14 Deposit-taking institutions 80
4.17 Specialised credit institutions 81
b) Lending and doubtful lending to finance the productive activity of the corporations
and individual entrepreneurs that receive the credit. Breakdown by main activity
4.18 Total 82
4.19 Deposit-taking institutions 83
4.22 Specialised credit institutions 84
c) Lending and doubtful lending to finance the productive activity of the corporations
and individual entrepreneurs that receive the credit. Breakdown of industry and
construction
4.23 Total 85
4.24 Deposit-taking institutions 86
4.27 Specialised credit institutions 87
Deposit-taking institutions lending and deposits to general government and other
resident sectors
4.28 Breakdown by province. Summary 88
4.29 Breakdown by regional (autonomous) government. Summary 89
4.30 Credit breakdown by regional (autonomous) government 90
4.31 Deposits breakdown by regional (autonomous) government 91
BANCO DE ESPAÑA 8 BOLETÍN ESTADÍSTICO, FEBRUARY 2013

Credit institutions liabilities, by group of institutions
4.32 Vis-à-vis general government and other resident sectors 93
C) Profit and loss account
4.B Deposit-taking institutions. Summary 94
4.36 Profit and loss account structure 95
4.37 Interest income 95
4.38 Interest expenses 96
4.39 Income from securities portfolio and financial cost of issues and othermarketable securities and subordinated financing 96
4.40 Non-interest income 97
4.41 Structure of the profit and loss account of resident deposit-taking institutionsand branches abroad 97
D) Supplementary tables
CREDIT INSTITUTIONS
4.45 Number of institutions 98
4.46 Number of employees 98
4.47 Number of branches and representative offices of resident credit institutionsand Banco de España 99
4.48 Number of branches by regional (autonomous) government 100
4.49 Number of branches by province 101
E) Balance sheets of the institutional groupings of credit institutions
DEPOSIT-TAKING INSTITUTIONS
4.51 Assets 102
4.52 Liabilities 102
4.53 Lending. Other resident sectors 103
4.54 Assets. Securities 103
4.55 Liabilities. Other resident sectors 104
4.56 Unsectorised assets 104
4.57 Equity, valuation adjustments and impairment allowances 105
4.58 Unsectorised liabilities 105
SPECIALISED CREDIT INSTITUTIONS
4.81 Assets 106
4.82 Liabilities 106
4.83 Lending. Other resident sectors 107
4.84 Unsectorised assets 107
4.85 Equity, valuation adjustments and impairment allowances 108
4.86 Unsectorised liabilities 108
Notes to the tables of chapter 4 109
CHAPTER 5 FINANCIAL INSTITUTIONSA) Reconciliation between the financial balance sheet according to the FASE and
according to the euro area returns (in case of MFIs) and official balance sheets (in case
of non MFIs)
5.A Assets 116
5.B Liabilities 118
BANCO DE ESPAÑA 9 BOLETÍN ESTADÍSTICO, FEBRUARY 2013

B) Aggregated balance sheet
5.1 Financial assets=liabilities plus net financial assets. Absolute values 120
5.2 Financial assets=liabilities plus net financial assets. Structure 121
CHAPTER 6 MONETARY FINANCIAL
INSTITUTIONSA) Reconciliation between the financial balance sheet according to the FASE and
according to euro area returns
6.A Assets 124
6.B Liabilities 126
B) Balance sheet according to the euro area returns
6.C Balance sheet by institutional grouping 128
6.1 Assets. Summary 132
6.2 Liabilities. Summary 132
6.3 Assets. Domestic 133
6.4 Assets. Domestic. Debt securities 133
6.5 Assets. Other euro area countries 134
6.6 Assets. Other euro area countries. Debt securities 134
6.7 Liabilities. Domestic. Deposits by sector, with deposits of other generalgovernment by instrument 135
6.8 Liabilities. Domestic deposits: other resident sectors 135
6.9 Liabilities. Deposits of other euro area countries by sector, with deposits ofother general government by instrument 136
6.10 Liabilities. Deposits of other euro area countries. Other resident sectors 136
6.11 Assets. Rest of the world 137
6.12 Liabilities. Rest of the world and not allocated 137
Notes to the tables of chapter 6 138
CHAPTER 7 BANCO DE ESPAÑAA) Reconciliation between the financial balance sheet according to the FASE and
according to euro area returns
7.A Assets 140
7.B Liabilities 142
B) Balance sheet according to the euro area returns
7.C Balance 144
7.1 Assets. Summary 147
7.2 Liabilities. Summary 147
7.3 Assets. Domestic 148
7.4 Assets. Domestic. Securities other than shares 148
7.5 Assets. Other euro area countries 149
7.6 Assets. Other euro area countries. Securities other than shares 149
7.7 Liabilities. Domestic deposits by sector with deposits of other generalgovernment by instrument 150
7.8 Liabilities. Domestic deposits. Other resident sectors 150
7.9 Liabilities. Deposits of other euro area countries by sector, with deposits ofother general government by instrument 151
7.10 Liabilities. Deposits of other euro area countries. Other resident sectors 151
7.11 Assets. Rest of the world and remaining assets 152
7.12 Liabilities. Rest of the world and not classified by residence of holder 152
7.13 Balance sheet. Summary by sector 153
7.14 Peseta banknotes in circulation. Breakdown by denomination 153
BANCO DE ESPAÑA 10 BOLETÍN ESTADÍSTICO, FEBRUARY 2013

7.15 Peseta coins in circulation. Breakdown by coin denomination 154
7.16 Banknotes distributed less banknotes withdrawn by the Banco de España andunreturned peseta banknotes. Breakdown of euro banknotes by denomination154
7.17 Euro coins placed in circulation by the Banco de España and unreturnedpeseta coins. Breakdown of euro coins by denomination 155
Notes to the tables of chapter 7 156
CHAPTER 8 OTHER MONETARY FINANCIAL
INSTITUTIONS
Contents of the tables of Chapter 8 and other credit institutions statistics 160
A) Reconciliation between the financial balance sheet according to the FASE and
according to euro area returns
8.A Assets 162
8.B Liabilities 166
B) Aggregated balance sheet according to the euro area returns
8.C Balance sheet by institutional grouping 170
8.1 Assets=Liabilities of other MFIs by institution 174
8.2 Assets. Summary 174
8.3 Liabilities. Summary 175
8.4 Assets. Domestic 175
8.5 Assets. Domestic. Debt securities 176
8.6 Assets. Other euro area countries 176
8.7 Assets. Other euro area countries: Debt securities 177
8.8 Liabilities. Domestic deposits by sector, with deposits of other generalgovernment by instrument 177
8.9 Liabilities: domestic deposits. Other resident sectors 178
8.10 Liabilities. Deposits of other euro area countries by sector, with deposits ofother general government by instrument 178
8.11 Liabilities. Deposits of other euro area countries. Other resident sectors 179
8.12 Assets. Rest of the world 179
8.13 Liabilities. Rest of the world and not allocated 180
C) Breakdown of assets and liabilities of other MFIs
8.21 Loans to/deposits held by general government from/with other MFIs, byinstitutional grouping 180
8.22 Loans to/deposits held by other resident sectors from/whit other MFIs, biinstitutional grouping 181
8.25 Loans to / deposits held by general government from / with other MFIs, bysub-sector 181
8.26 Other MFIs loans to other resident in Spain sectors, by sub-sector 182
8.27 Other MFIs loans and credits to households 182
8.28 Deposits held by other residents and other general government in the euroarea with other MFIs, by sub-sectors 183
8.29 Deposits held by non-financial corporations, households and NPISH residentin Spain, by type 183
8.30 Breakdown of deposits held by non-financial corporations, households andNPISH resident in Spain, by type 184
8.31 Main assets and liabilities of other MFIS, by country 185
8.32 Main assets and liabilities of other MFIs, by currency 186
D) Balance sheet of the institutional groupings of other MFIs
BANCO DE ESPAÑA 11 BOLETÍN ESTADÍSTICO, FEBRUARY 2013

CREDIT INSTITUTIONS
8.D Balance sheet of credit institutions by institutional grouping 187
8.41 Assets. Summary 190
8.42 Liabilities. Summary 190
8.43 Assets. Domestic 191
8.44 Liabilities. Domestic deposits by sector and deposits of other resident sectorsby instrument 191
Minimum reserves to be held by credit institutions
8.E Appendix to the balance sheet. Determination of credit institutions' liabilitiessubject to minimum reserves (reserve base) 192
8.45 Reserve base for the ESCB's minimum reserve system 193
DEPOSIT-TAKING INSTITUTIONS
8.51 Assets. Summary 193
8.52 Liabilities. Summary 194
8.53 Assets. Domestic 194
8.54 Liabilities. Domestic deposits by sector and deposits of other resident sectorsby instrument 195
SPECIALISED CREDIT INSTITUTIONS
8.81 Assets. Summary 195
8.82 Liabilities. Summary 196
8.83 Assets. Domestic 196
8.84 Liabilities. Domestic deposits by sector and deposits of other resident sectorsby instrument 197
MONEY MARKET FUNDS
8.F Balance sheet 198
8.91 Balance sheet. Summary 200
8.92 Assets. Domestic 200
Notes to the tables of chapter 8 201
CHAPTER 9 NON-MONETARY FINANCIAL
INSTITUTIONS, EXCEPT INSURANCE
CORPORATIONS AND PENSION FUNDS
A) Total sector
Reconciliation between the financial balance sheets according to the fase and the
official balance sheets
9.A Assets 204
9.B Liabilities 205
Balance sheets
9.1 Assets and liabilities. Valuation of financial assets and liabilities in accordancewith the ESA 95 206
B) Sub-sector other financial intermediaries
Reconciliation between the financial balance sheets according to the FASE and the
official balance sheets
9.C Assets 207
9.D Liabilities 208
BANCO DE ESPAÑA 12 BOLETÍN ESTADÍSTICO, FEBRUARY 2013

Balance sheets
9.11 Official balance sheets. Total assets and liabilities by institutional groupings209
9.12 Assets and liabilities. Valuation of financial assets and liabilities in accordancewith the ESA 95 209
SUB-SECTOR OTHER FINANCIAL INTERMEDIARIES: AGENT PORTFOLIO
INVESTMENT INSTITUTIONS (EXCEPT MONEY MARKET FUNDS)
Reconciliation between the financial balance sheets according to the FASE and the
official balance sheets
9.E Assets and liabilities 210
Balance sheets
9.21 Assets and liabilities. Valuation of financial assets and liabilities in accordancewith the ESA 95 211
9.22 Financial assets. Non-financial corporations and General Government 211
9.23 Financial assets. Financial institutions and Rest of the world 212
9.24 Liabilities by sector. Valuation of liabilities in accordance with the ESA 95212
SUB-SECTOR OTHER FINANCIAL INTERMEDIARIES: AGENT SECURITIES-DEALER
COMPANIES
Balance sheets
9.31 Assets and liabilities. Valuation of financial assets and liabilities in accordancewith ESA 95 213
9.32 Financial assets. Breakdown by institutional sectors 213
C) Sub-sector financial auxiliaries
Reconciliation between the financial balance sheets according to the fase and the
official balance sheets
9.F Assets 214
9.G Liabilities 215
Balance sheets
9.41 Official balance sheets. Total assets and liabilities by institutional grouping216
9.42 Assets and liabilities. Valuation of financial assets and liabilities in accordancewith the ESA 95 216
SUB-SECTOR FINANCIAL AUXILIARIES: AGENT APPRAISAL COMPANIES
Appraisal activity information
9.50 Breakdown of appraisals: number of appraisals 217
9.51 Breakdown of appraisals: amount of appraisals 218
9.52 Breakdown of appraisals: usable area. Property appraisals 219
9.53 Breakdown of property appraisals: average value of m2 220
9.54 Breakdown of customers and appraisal purpose: number of appraisals 220
9.55 Breakdown of customers and appraisal purpose: amount of appraisals 221
BANCO DE ESPAÑA 13 BOLETÍN ESTADÍSTICO, FEBRUARY 2013

9.56 Geographic distribution of property appraisals: number of appraisals andamount 221
9.57 Geographic breakdown of housing appraisals: number of appraisals andamount 222
9.58 Geographic breakdown of property appraisals by Regional (Autonomous)Government: number of appraisals 222
9.59 Geographic breakdown of property appraisals by Regional (Autonomous)Government: amount 223
9.60 Geographic breakdown of housing appraisals by Regional (Autonomous)Government: number of appraisals 223
9.61 Geographic breakdown of housing appraisals by Regional (Autonomous)Government: amount 224
Account information
9.62 Balance sheet and supplementary information 224
9.63 Profit and loss account 225
Notes to the tables of appraisal companies 226
CHAPTER 10 INSURANCE CORPORATIONS
AND PENSION FUNDSA) Reconciliation between the financial balance sheets according to the FASE and the
official balance sheets
10.A Assets 230
10.B Liabilities 232
B) Balance sheets
10.1 Balance sheet and technical provisions detailed by agents making up thesector 234
10.2 Breakdown of assets and of liabilities 234
10.3 Private insurance corporations. Breakdown of assets and of liabilities 235
10.4 Non-profit insurance entities. Breakdown of assets and of liabilities 235
10.5 Insurance Compensation Consortium. Breakdown of assets and of liabilities236
10.6 External pension funds (Law 8/1987). Breakdown of assets and of liabilities236
CHAPTER 11 GENERAL GOVERNMENTA) GENERAL GOVERNMENT
11.1 Net lending (+) or net borrowing (-), liabilities outstanding and debt accordingto the excessive deficit procedure (EDP). Amounts 238
11.2 Net lending (+) or net borrowing (-), liabilities outstanding and debt accordingto the excessive deficit procedure (EDP). As a percentage of GDP mp 238
11.3 Net lending (+) or net borrowing (-). Amounts 239
11.4 Net lending (+) or net borrowing (-). As a percentage of GDP mp 239
11.5 Liabilities outstanding and debt according to the excessive deficit procedure(EDP). Amounts 240
11.6 Liabilities outstanding and debt according to the excessive deficit procedure(EDP). As a percentage of GDP mp 240
11.7 Debt according to the excessive deficit procedure (EDP) and financial assetsheld by general government. Amounts 241
11.8 Debt according to the excessive deficit procedure (EDP) and financial assetsheld by general government. As a percentage of GDP mp 241
11.9 Reconciliation between net borrowing and the change in debt according to theexcessive deficit procedure (EDP). Amounts 242
11.10 Reconciliation between net borrowing and the change in debt according to theexcessive deficit procedure (EDP). As a percentage of GDP mp 242
11.11 Net acquisition of financial assets 243
BANCO DE ESPAÑA 14 BOLETÍN ESTADÍSTICO, FEBRUARY 2013

11.12 Debt according to the excessive deficit procedure (EDP) by instrument 243
11.13 Debt according to the excessive deficit procedure (EDP) by counterpart sectorand currency 244
B) PUBLIC ENTERPRISES
11.14 Debt of public enterprises not included in the general government sector, bygeneral government owner unit 244
C) OTHER INFORMATION
11.15 Flows between Spain and the EU 245
Notes to the tables of chapter 11 246
CHAPTER 12 CENTRAL GOVERNMENT AND
SOCIAL SECURITY FUNDS
CENTRAL GOVERNMENT
12.1 Net lending (+) or net borrowing (-), liabilities outstanding and debt accordingto the excessive deficit procedure (EDP). Amounts 250
12.2 Net lending (+) or net borrowing (-), liabilities outstanding and debt accordingto the excessive deficit procedure (EDP). As a percentage of GDP mp 250
12.3 Reconciliation between net borrowing and the change in debt according to theexcessive deficit procedure (EDP). Amounts 251
12.4 Reconciliation between net borrowing and the change in debt according to theexcessive deficit procedure (EDP). As a percentage of GDP mp 251
12.5 Net acquisition of financial assets 252
12.6 Central government. Debt according to the excessive deficit procedure (EDP)by instrument 252
12.7 Central government. Debt according to the excessive deficit procedure (EDP)by unit 253
12.8 State. Debt according to the excessive deficit procedure (EDP) by instrument253
12.9 Other units classified as central government. Debt according to the excessivedeficit procedure (EDP) by instrument 254
A) CENTRAL GOVERNMENT PUBLIC ENTERPRISES
12.10 Debt by public enterprises not included in the general government sector254
SOCIAL SECURITY FUNDS
12.11 Net lending (+) or net borrowing (-), liabilities outstanding and debt accordingto the excessive deficit procedure (EDP). Amounts 255
12.12 Net lending (+) or net borrowing (-), liabilities outstanding and debt accordingto the excessive deficit procedure (EDP). As a percentage of GDP mp 255
12.13 Reconciliation between net borrowing and the change in debt according to theexcessive deficit procedure (EDP). Amounts 256
12.14 Reconciliation between net borrowing and the change in debt according to theexcessive deficit procedure (EDP). As a percentage of GDP mp 256
12.15 Net acquisition of financial assets 257
12.16 Debt according to the excessive deficit procedure (EDP) by instrument 257
Notes to the tables of chapter 12 258
CHAPTER 13 REGIONAL AUTONOMOUS
GOVERNMENTSA) REGIONAL (AUTONOMOUS) GOVERNMENTS
13.1 Net lending (+) or net borrowing (-), liabilities outstanding and debt accordingto the excessive deficit procedure (EDP). Amounts 262
13.2 Net lending (+) or net borrowing (-), liabilities outstanding and debt accordingto the excessive deficit procedure (EDP). As a percentage of GDP mp 262
13.3 Reconciliation between net borrowing and the change in debt according to theexcessive deficit procedure (EDP). Amounts 263
BANCO DE ESPAÑA 15 BOLETÍN ESTADÍSTICO, FEBRUARY 2013

13.4 Reconciliation between net borrowing and the change in debt according to theexcessive deficit procedure (EDP). As a percentage of GDP mp 263
13.5 Net acquisition of financial assets 264
13.6 Debt according to the excessive deficit procedure (EDP). General summary265
13.7 Debt according to the excessive deficit procedure (EDP) by instrument 266
13.8 Debt according to the excessive deficit procedure (EDP) by institutionalgrouping 266
13.9 Debt according to the excessive deficit procedure (EDP) by regional(autonomous) government. Amounts 267
13.10 Debt according to the Excessive Deficit Procedure (EDP) by regional(autonomous) government. As a percentage of GDP mp 267
B) REGIONAL (AUTONOMOUS) GOVERNMENTS PUBLIC ENTERPRISES
13.11 Debt of public enterprises not included in the general government sector, byregional (autonomous) government owner. Amounts 268
13.12 Debt of public enterprises not included in the general government sector, byregional (autonomous) government owner. As a percentage of GDP mp 268
Notes to the tables of chapter 13 269
CHAPTER 14 LOCAL GOVERNMENTSA) LOCAL GOVERNMENTS
14.1 Net lending (+) or net borrowing (-), liabilities outstanding and debt accordingto the excessive deficit procedure (EDP). Amounts 272
14.2 Net lending (+) or net borrowing (-), liabilities outstanding and debt accordingto the excessive deficit procedure (EDP). As a percentage of GDP mp 272
14.3 Reconciliation between net borrowing and the change in debt according to theexcessive deficit procedure (EDP). Amounts 273
14.4 Reconciliation between net borrowing and the change in debt according to theexcessive deficit procedure (EDP). As a percentage of GDP mp 273
14.5 Net acquisition of financial assets 274
14.6 Debt according to the excessive deficit procedure (EDP). General summary275
14.7 Debt according to the excessive deficit procedure (EDP) by instrument 276
14.8 Debt according to the excessive deficit procedure (EDP) by type of localgovernment 276
Notes to the tables of chapter 14 277
CHAPTER 15 NON FINANCIAL
CORPORATIONS: SUMMARY INFORMATION
COMPILED BY THE CENTRAL BALANCE SHEET
DATA OFFICE
A) Summary
15.A Spanish non-financial corporations and non-financial corporations available inthe database of the Central Balance Sheet Data Office (CB) 280
15.B Employees in Spanish non-financial corporations and employees in non-financial corporations available in the database of the Central Balance SheetData Office (CB) 281
15.C Balance sheet, profit and loss account and ratios 282
B) Profit and loss account
Main items. total non-financial corporations
15.1 Annual database (CBA) 283
15.2 Quarterly database (CBQ) 283
15.3 Quarterly database (CBQ.) Cumulative quarter year-on-year rates 284
Main items. industry corporations
15.4 Annual database (CBA) 284
BANCO DE ESPAÑA 16 BOLETÍN ESTADÍSTICO, FEBRUARY 2013

15.5 Quarterly database (CBQ) 285
15.6 Quarterly database (CBQ.) Cumulative quarter year-on-year rates 285
C) Profitability ratios
R.1. Ordinary return on net assets
15.7 Annual database (CBA) 286
15.8 Quarterly database (CBQ) 286
15.9 Quarterly database (CBQ.) Cumulative quarter year-on-year rates 287
R.2. Interest on borrowed funds (outstanding operations) / Interest-bearing borrowing
15.10 Annual database (CBA) 287
15.11 Quarterly database (CBQ) 288
15.12 Quarterly database (CBQ.) Cumulative quarter year-on-year rates 288
R.3. Ordinary return on equity
15.13 Annual database (CBA) 289
15.14 Quarterly database (CBQ) 289
15.15 Quarterly database (CBQ.) Cumulative quarter year-on-year rates 290
R.4. Spread return on investment - cost debt (R.1-R.2)
15.16 Annual database (CBA) 290
15.17 Quarterly database (CBQ) 291
15.18 Quarterly database (CBQ.) Cumulative quarter year-on-year rates 291
R.5. Operating margin (Gross operating profit / Output)
15.19 Annual database (CBA) 292
15.20 Quarterly database (CBQ) 292
15.21 Quarterly database (CBQ.) Cumulative quarter year-on-year rates 293
E.1. Debt ratio (Current prices; end-of-year balance)
15.22 Annual database (CBA) 293
15.23 Quarterly database (CBQ) 294
Profitability ratios FSI
15.24 Total debt to equity. Integrated database (CBI) 294
15.25 Return on equity. Integrated database (CBI) 295
Notes to the tables of chapter 15 296
CHAPTER 16 HOUSEHOLDS AND NPISH Under preparation
CHAPTER 17 BALANCE OF PAYMENTS AND
INTERNATIONAL INVESTMENT POSITION VIS-à-
VIS OTHER EURO AREA COUNTRIES AND THE
REST OF THE WORLD
A) Balance of payments
17.A Summary of sources (receipts and net change in liabilities) and uses(payments and net change in financial assets). Monthly 302
17.B Reconciliation between resident's financial transactions vis-à-vis other euroarea residents and the rest of the world and the Balance of payments 304
17.1 Summary. Balances. Monthly 308
17.2 Summary of financial account. Net change in liabilities less net change inassets. Monthly 308
BANCO DE ESPAÑA 17 BOLETÍN ESTADÍSTICO, FEBRUARY 2013

CURRENT ACCOUNT AND CAPITAL ACCOUNT
17.3 Current account and capital account. Breakdown. Monthly 309
17.4 Current account. Income. Quarterly 309
17.5 Current account. Current transfers. Quarterly 310
17.6 Capital account. Summary by component and institutional sector. Quarterly 310
FINANCIAL ACCOUNT
17.7 Financial account. Breakdown by component. Monthly 311
17.8 Spanish investment abroad. Breakdown by institutional sector. Monthly 311
17.9 Spanish direct and portfolio investment abroad, including Banco de España.Monetary financial institutions. Quarterly 312
17.10 Spanish direct and portfolio investment abroad. General government andother resident sectors. Quarterly 312
17.11 Other Spanish investment abroad, including Banco de España. Breakdown byinstitutional sector. Quarterly 313
17.12 Foreign investment in Spain. Breakdown by institutional sector. Monthly 313
17.13 Foreign direct and portfolio investment in Spain. Monetary financialinstitutions. Quarterly 314
17.14 Foreign direct and portfolio investment in Spain. General government andother resident sectors. Quarterly 314
17.15 Other foreign investment in Spain, including Banco de España. Breakdown byinstitutional sector. Quarterly 315
SERVICES. FURTHER BREAKDOWNS
17.16 Transactions in services. By type of service. Quarterly 316
17.17 Transactions in services. Geographical breakdown. Quarterly 318
B) International Investment Position
17.C Reconciliation between financial assets and liabilities vis-á-vis other euro arearesidents and the rest of the world 322
17.21 Summary 326
FINANCIAL ASSETS
17.22 Spanish investment abroad 326
17.23 Spanish investment abroad. Portfolio investment, including Banco de España.Breakdown by institutional sector 327
17.24 Spanish investment abroad. Other investment, including Banco de España.Breakdown by institutional sector 327
17.25 Spanish investment abroad. International reserves and foreign currencyliquidity 328
17.26 Spanish investment abroad. International reserves 328
LIABILITIES
17.27 Foreign investment in Spain 329
17.28 Foreign investment in Spain. Portfolio investment. Breakdown by institutionalsector 329
17.29 Foreign investment in Spain. Other investment, including Banco de España.Breakdown by institutional sector 330
17.30 Foreign investment in Spain. Other investment. Loans received by generalgovernment and other resident sectors. Breakdown by borrower 330
17.31 Foreign investment in Spain. Other investment. Loans received by generalgovernment and other resident sectors. Breakdown by lender 331
BANCO DE ESPAÑA 18 BOLETÍN ESTADÍSTICO, FEBRUARY 2013

Notes to the tables of chapter 17 332
CHAPTER 18 CUSTOMS STATISTICS 18.1 Imports/arrivals and exports/dispatches 336
A) Imports/arrivals
18.2 By product 336
18.3 Geographical breakdown 337
B) Exports/dispatches
18.4 By product 337
18.5 Geographical breakdown 338
C) Unit value indices
18.6 Imports/arrivals 338
18.7 Exports/dispatches 339
CHAPTER 19 INTEREST RATES (EXCLUDING
THOSE PUBLISHED IN FINANCIAL MARKETS
CHAPTERS)
A) Legal interest rates
19.1 Legal interest rates, EURIBOR, MIBOR and other official reference rates 342
19.2 Unofficial mortgage market and other interest rates 343
B) Interest rates applied by MFIs to euro area residents (CBE 4/2002). As from January
2003
INTEREST RATES (APCR AND NDER) ON NEW BUSINESS
Loans to households and NPISHs
19.3 Total 343
19.4 Deposit-taking institutions 344
Loans to non-financial corporations
19.6 Total 344
19.7 Deposit-taking institutions 345
Deposits from households and non-financial corporations
19.9 Total 345
19.10 Deposit-taking institutions 346
INTEREST RATES (NDER) ON OUTSTANDING AMOUNTS
Loans to households and non-financial corporations
19.12 Total 346
19.13 Deposit-taking institutions 347
Deposits from households and non-financial corporations
19.15 Total 347
19.16 Deposit-taking institutions 348
VOLUMES OF NEW BUSINESS
BANCO DE ESPAÑA 19 BOLETÍN ESTADÍSTICO, FEBRUARY 2013

Loans to households and NPISHs
19.18 Total 348
19.19 Deposit-taking institutions 349
Loans to non-financial corporations
19.21 Total 349
19.22 Deposit-taking institutions 350
Deposits from households and non-financial corporations
19.24 Total 350
19.25 Deposit-taking institutions 351
VOLUMES OF OUTSTANDING AMOUNT
Loans to households and non-financial corporations
19.27 Total 351
19.28 Deposit-taking institutions 352
Deposits from households and non-financial corporations
19.30 Total 352
19.31 Deposit-taking institutions 353
CHAPTER 20 EXCHANGE RATES AND
COMPETITIVENESS INDICESA) Exchange rates
20.1 Exchange rates for the euro 356
20.2 Exchange rates for the euro (cont'd 1) 356
20.3 Exchange rates for the euro (cont'd 2) 357
20.4 Exchange rates for the euro (cont'd 3) 357
20.5 US dollar exchange rates 358
B) Competitiveness indices
20.6 Spain's competitiveness indices vis-à-vis the euro area and the EU 27 358
20.7 Spain's competitiveness indices vis-à-vis the developed countries,industrialised countries and newly industrialised Asian countries 359
20.8 Effective exchange rates of the main currencies vis-à-vis developed countries359
Notes to the tables of chapter 20 360
CHAPTER 21 PRIMARY MARKET FOR
SECURITIESA) Total economy
Securities other than shares, except financial derivatives. Shares and mutual fund
shares. Breakdown by issuing sector and subsector
21.1 Net issues and public offerings 364
21.2 Outstanding amounts 364
Securities other than shares, except financial derivatives. Breakdown by issuing
sector and term
21.3 Net issues 365
21.4 Outstanding amounts 365
21.5 Long-term issues by kind of coupon. Outstanding amounts 366
BANCO DE ESPAÑA 20 BOLETÍN ESTADÍSTICO, FEBRUARY 2013

B) Financial corporations
Securities other than shares, except financial derivatives. Breakdown by issuing
subsector and term
21.6 Net issues 366
21.7 Outstanding amounts 367
Securities other than shares in euro, except financial derivatives. Monetary financial
institutions. Breakdown by instruments of issues in euro
21.8 Net issues, gross issues and redemptions 367
21.9 Outstanding amounts 368
Shares and mutual fund shares. Breakdown by issuing sector
21.10 Net issues, public offerings and outstanding amounts 368
C) General Government
CENTRAL GOVERNMENT
Securities other than shares, except financial derivatives. Breakdown by instrument
21.11 Net issues 369
21.12 Outstanding amounts 369
21.13 Outstanding amounts by term to maturity 370
21.14 Average outstanding term 370
21.15 Breakdown by instrument of issues in euro. Net issues, gross issues andredemptions 371
21.16 Interest rates on new issues: auctions 371
REGIONAL (AUTONOMOUS) GOVERNMENTS AND LOCAL GOVERNMENTS
Securities other than shares, except financial derivatives. Breakdown by instrument
21.17 Net issues 372
21.18 Outstanding amounts 372
21.19 Breakdown of issues in euro. Net issues, gross issues and redemptions 373
D) Non-financial corporations
Securities other than shares, except financial derivatives. Breakdown by instrument
21.20 Net issues and outstanding amounts 373
E) Rest of the world
Securities other than shares, except financial derivatives. Breakdown by issuing
sector
21.21 Net issues, gross issues and redemptions and outstanding amounts 374
F) Euro area
BANCO DE ESPAÑA 21 BOLETÍN ESTADÍSTICO, FEBRUARY 2013

Securities other than shares, except financial derivatives. Breakdown by issuing
sector and subsector
21.22 Net issues 374
21.23 Outstanding amounts 375
CHAPTER 22 DOMESTIC SECONDARY
MARKETS FOR SECURITIESA) Book-entry debt market
22.1 Nominal outstanding amounts recorded in the book-entry system 378
22.2 Nominal outstanding amounts recorded in customer accounts in the book-entry system 378
STATE DEBT. AMOUNTS OUTSTANDING BY HOLDER
Treasury bills
22.3 Nominal outstanding amounts. Registered portfolio 379
22.4 Nominal outstanding amounts. Portfolio to maturity 379
22.5 Sell/buy back transactions and repurchase agreements 380
Unstripped bonds and the principal components of stripped debt:
22.6 Nominal outstanding amounts. Registered portfolio 380
22.7 Nominal outstanding amounts. Portfolio to maturity 381
22.8 Sell/buy back transactions and repurchase agreements 381
SHORT-TERM STATE DEBT: TREASURY BILLS
22.9 Turnover 382
22.10 Outright spot transactions. Turnover and interest rates 382
22.11 Spot sell/buy-back transactions. Turnover and interest rates 383
22.12 Repurchase agreements. Turnover and interest rates 383
MEDIUM AND LONG-TERM STATE DEBT: UNSTRIPPED STATE BONDS
22.13 Turnover 384
22.14 Outright spot transactions. Turnover and interest rates 384
22.15 Spot sell/buy-back transactions. Turnover and interest rates 385
22.16 Repurchase agreements. Turnover and interest rates 385
22.17 Yield indices and supplementary statistics 386
MEDIUM AND LONG-TERM STATE DEBT: PRINCIPAL AND INTEREST
COMPONENTS OF STRIPPED STATE DEBT
22.18 Turnover 386
22.19 Outright spot transactions. Turnover and interest rates 387
22.20 Spot sell/buy-back transactions. Turnover and interest rates 387
22.21 Repurchase agreements. Turnover and interest rates 388
TURNOVER RATIOS
22.22 Turnover ratios 388
B) Stock exchanges
Shares
22.23 Madrid Stock Exchange market capitalisation 389
BANCO DE ESPAÑA 22 BOLETÍN ESTADÍSTICO, FEBRUARY 2013

22.24 Turnover 389
22.25 Share price index 390
22.26 PER. Madrid stock exchange 390
Bonds
22.27 Turnover 391
C) Other securities markets
ASSOCIATION OF SECURITIES DEALERS (AIAF) FIXED-INCOME MARKET
22.28 Commercial paper 391
22.29 Bonds 392
OFFICIAL OPTIONS AND FUTURES MARKETS
22.30 Equities and fixed-income. Traded volume and open interest 392
CHAPTER 23 OUTPUT AND DEMANDA) Industrial production index
23.1 Summary table 394
Breakdown by industry (NACE 2009)
23.2 Mining and quarrying and manufacturing 394
23.3 Manufacturing (continued I) 395
23.4 Manufacturing (continued II) and others 395
B) Energy indicators
23.5 Gross domestic production and consumption of primary energy 396
23.6 Electricity: production and consumption 396
C) Construction, steel and cement indicators
23.7 Building and housing. Official construction permits 397
23.8 Ongoing building work 397
23.9 Public works procurement by type of work 398
23.10 Construction industry production indices 398
23.11 Production and apparent consumption of steel and cement 399
D) Motor-vehicle indicators
Supplies and uses of
23.12 Commercial vehicles and buses 399
23.13 Passengers cars and motorcycles 400
E) Services indicators
23.14 Retail trade and hotels 400
23.15 Transport and tourism 401
F) Business sentimens
23.16 Total industry and investment goods (NACE 2009) 401
23.17 Consumer goods, intermediate goods and other sectors (NACE 2009) 402
23.18 Construction industry (NACE 2009) 402
BANCO DE ESPAÑA 23 BOLETÍN ESTADÍSTICO, FEBRUARY 2013

23.19 Capacity utilisation and factors limiting production. Total industry (excludingconstruction) (NACE 2009) 403
CHAPTER 24 EMPLOYMENT AND WAGESA) Labour force survey
POPULATION AGED 16 YEARS AND OVER
24.1 Summary 406
24.2 Breakdown by age and sex 406
24.3 Labour force and employment by age and sex 407
EMPLOYMENT
24.4 Employment by branch of activity, according to NACE 2009 sections 407
24.5 By professional category 408
24.6 Wage-earners by branch of activity, according to NACE 2009 sections 408
24.7 Wage-earners by full-time and part-time employment, type of contract andsex 409
UNEMPLOYMENT
24.8 By industry (NACE 2009) and sex 409
24.9 By level of education and sex, family situation and duration of unemployment410
24.10 Unemployed by type of working day in the job sought and sex 410
PARTICIPATION AND UNEMPLOYMENT RATES
24.11 Participation rate by age group and sex 411
24.12 Unemployment rate by age group and sex 411
24.13 Unemployment rate by region 412
B) Labour situation survey
24.14 Employees and working hours by branch of activity 412
C) Registered labour market statistics
24.15 Job-seekers and unemployment by branch of activity 413
24.16 Vacancies and job-seekers, and placements 413
24.17 Employment contracts 414
24.18 Unemployment benefit recipients 414
D) Social Security System: registered workers and pensions paid
24.19 Registrations, deregistrations and total registered workers by regime 415
24.20 Current pensions 415
24.21 Average current pensions 416
E) Collective agreements, labour disputes and other labour statistics
24.22 Agreements as per month of effectiveness 416
24.23 Agreements as per month registered and year of effectiveness 417
24.24 Labour disputes and workforce reductions 417
F) Quarterly labour costs survey
24.25 Labour cost. Summary 418
24.26 Monthly labour cost per worker. By branch of activity (NACE 2009) 418
BANCO DE ESPAÑA 24 BOLETÍN ESTADÍSTICO, FEBRUARY 2013

24.27 Wage costs per hour worked by branch of activity (NACE 2009) 419
24.28 Actual hours worked per employee per month, by branch of activity (NACE2009) and type of working day 419
CHAPTER 25 PRICESA) Consumer price index
25.1 Total index with breakdown by type of expenditure 422
25.2 Total index and sub-indices 422
B) Producer price index
25.3 Summary table 423
Breakdown by industry (NACE 2009)
25.4 Mining and quarrying and manufacturing 423
25.5 Manufacturing (continued I) 424
25.6 Manufacturing (continued II) and others 424
C) Construction prices
25.7 Construction cost index and average price per square metre of open-marketappraised housing 425
D) Price indices of farmers' inputs and output
25.8 Total and breakdown 425
CHAPTER 26 INTERNATIONAL ECONOMYA) Macroeconomic aggregates
26.1 Gross domestic product (at current prices) 428
26.2 Gross domestic product (at constant prices) 428
B) Prices and labour market
26.11 Consumer price index 429
26.12 Producer price index 429
26.13 Manufacturing unit labour cost index 430
26.14 Unit value indices of exports 430
26.15 Harmonised indices of consumer prices 431
C) Interest rates and yield
26.21 3-month interbank rates in national markets 431
26.22 3-year government debt yields in national markets 432
26.23 Long-term government debt yields 432
APPENDIX 1 BANCO DE ESPAÑA. OFFICIAL
BALANCE SHEET
A1.1 Official balance sheet 434
APPENDIX 2 SECTORISATION SCHEMES A2.1 Institutional groupings used in euro area monetary analysis tables (chapters 6to 8 of the Boletín Estadístico) 440
A2.2 Institutional groupings used in supervisory returns (chapter 4 of the BoletínEstadístico) 442
A2.3 Institutional groupings used in National Accounts (including the FinancialAccounts of the Spanish Economy) (chapters 2 and 3 of the BoletínEstadístico) 443
APPENDIX 3 METHODOLOGICAL NOTES Chapter 10 - Methodological note 446
BANCO DE ESPAÑA 25 BOLETÍN ESTADÍSTICO, FEBRUARY 2013

Methodological note "General Government debt compiled according to the methodologyof the excessive deficit procedure (EDP)" 449
BANCO DE ESPAÑA 26 BOLETÍN ESTADÍSTICO, FEBRUARY 2013

CHAPTER 1 MAIN ECONOMIC INDICATORS OF THE EURO AREA

A
. G
DP
AN
D D
EM
AN
D A
GG
RE
GA
TE
S (
a)
(R
ate
of c
hang
e in
rea
l ter
ms)
B
. P
RIC
ES
AN
D L
AB
OU
R C
OS
TS
5.
Lab
our
prod
uctiv
ity
C
. E
MP
LO
YM
EN
T A
ND
UN
EM
PL
OY
ME
NT
(c)
1.
Em
ploy
men
t
D
. B
AL
AN
CE
OF
PA
YM
EN
TS
____
____
____
____
____
____
____
____
____
____
____
____
____
____
____
____
____
____
____
____
____
____
____
____
____
____
____
____
____
____
____
____
____
____
____
____
____
____
____
____
____
____
____
____
____
____
Véa
nse
nota
s al
fina
l del
cap
ítulo
. / S
ee n
ote
s a
t th
e e
nd o
f th
e c
hapte
r.
1. P
RIN
CIP
AL
ES
IND
ICA
DO
RE
S E
CO
NÓ
MIC
OS
DE
LA
ZO
NA
DE
L E
UR
O1.
1 A
ctiv
idad
, pre
cio
s y
mer
cad
o d
e tr
abaj
o
Tasas d
e v
ariació
n inte
ranual
2011
201
2
2
010
201
1
II
III
IV
I
II
III
A
. P
IB Y
AG
RE
GA
DO
S D
E L
A D
EM
AN
DA
(a)
(T
asa
de v
aria
ción
en
volu
men
)
1.
C
onsu
mo
priv
ado
..
..
..
..
..
..
..
..
..
..
.0,
1 ...
0,
2 0,
2 -0
,8
-1,1
-1
,1
-1,4
1.
Priv
ate
cons
umpt
ion
2.
C
onsu
mo
públ
ico
..
..
..
..
..
..
..
..
..
..
.-0
,1
...
0,1
-0,4
-0
,4
-0,1
-0
,2
-0,1
2.
Gov
ernm
ent c
onsu
mpt
ion
3.
F
orm
ació
n br
uta
de c
apita
l fijo
..
..
..
..
..
..
..
.1,
6 ...
1,
4 0,
7 0,
8 -2
,5
-3,9
-4
,2
3
. G
ross
fixe
d ca
pita
l for
mat
ion
4.
D
EM
AN
DA
INT
ER
IOR
..
..
..
..
..
..
..
..
..
.0,
6 ...
0,
9 0,
4 -0
,7
-1,6
-2
,3
-2,3
4.
DO
ME
ST
IC D
EM
AN
D
5.
Exp
orta
cion
es (
b).
..
..
..
..
..
..
..
..
..
..
6,5
...
6,3
5,7
3,6
2,4
3,5
3,0
5.
Exp
orts
(b)
6.
Im
port
acio
nes
(b)
..
..
..
..
..
..
..
..
..
..
.4,
4 ...
4,
6 3,
6 0,
5 -1
,1
-0,6
-0
,7
6
. Im
port
s (b
)
7.
Sal
do n
eto
exte
rior
de b
iene
s y
serv
icio
s (%
sob
re P
IB)
..
..
27,6
...
2,
5 2,
9 3,
4 3,
8 4,
2 4,
5
7
. N
et e
xter
nal b
alan
ce o
f goo
ds a
nd s
ervi
ces
(as
% o
f GD
P)
8.
P
IB A
PR
EC
IOS
DE
ME
RC
AD
O.
..
..
..
..
..
..
.1,
5 ...
1,
6 1,
3 0,
6 -0
,1
-0,5
-0
,6
8
. G
DP
AT
MA
RK
ET
PR
ICE
S
B.
PR
EC
IOS
Y C
OS
TE
S L
AB
OR
AL
ES
1.
D
efla
ctor
con
sum
o pr
ivad
o.
..
..
..
..
..
..
..
..
2,5
...
2,5
2,4
2,5
2,4
2,0
2,0
1.
Priv
ate
cons
umpt
ion
defla
tor
2.
D
efla
ctor
con
sum
o pú
blic
o.
..
..
..
..
..
..
..
..
0,8
...
0,6
0,9
1,1
1,1
0,9
0,9
2.
Gov
ernm
ent c
onsu
mpt
ion
defla
tor
3.
D
efla
ctor
PIB
..
..
..
..
..
..
..
..
..
..
..
.1,
2 ...
1,
2 1,
2 1,
3 1,
2 1,
2 1,
3
3
. G
DP
def
lato
r
4.
Rem
uner
ació
n po
r as
alar
iado
..
..
..
..
..
..
..
..
2,1
...
2,1
2,2
2,2
2,0
1,6
1,8
4.
Com
pens
atio
n pe
r em
ploy
ee
5.
Pro
duct
ivid
ad la
bora
l
5.1.
T
otal
eco
nom
ía.
..
..
..
..
..
..
..
..
..
.1,
2 ...
1,
1 1,
0 0,
7 0,
4 0,
3 0,
1
5
.1.
Who
le e
cono
my
6.
C
oste
labo
ral u
nita
rio. T
otal
eco
nom
ía.
..
..
..
..
..
.0,
9 ...
1,
0 1,
1 1,
6 1,
5 1,
3 1,
7
6
. U
nit l
abou
r co
st. W
hole
eco
nom
y
C.
EM
PL
EO
Y P
AR
O (
c)
1
. P
obla
ción
ocu
pada
1.
1.
Tot
al e
cono
mía
..
..
..
..
..
..
..
..
..
..
0,3
...
0,5
0,3
-0,1
-0
,5
-0,7
-0
,7
1
.1
Who
le e
cono
my
1.
2.
Indu
stria
, exc
luid
a co
nstr
ucci
on.
..
..
..
..
..
.0,
3 ...
0,
3 0,
7 0,
2 -0
,5
-1,1
-1
,4
1
.2.
Indu
stry
, exc
ludi
ng c
onst
ruct
ion
2.
P
aro:
por
cent
aje
sobr
e la
pob
laci
ón a
ctiv
a.
..
..
..
..
.10
,2
...
9,9
10,2
10
,6
10,9
11
,3
11,5
2.
Une
mpl
oym
ent a
s %
of l
abou
r fo
rce
2.
1.
Mill
ones
de
pers
onas
..
..
..
..
..
..
..
..
.16
,034
...
15
,636
16
,115
16
,750
17
,285
17
,927
18
,305
2.1
. M
illio
ns
D.
BA
LA
NZ
A D
E P
AG
OS
1.
C
uent
a co
rrie
nte.
Sal
do (
mm
de
euro
s) (
d).
..
..
..
..
.12
,5
...
-12,
9 6,
5 36
,6
-4,6
14
,9
41,0
1.
Cur
rent
acc
ount
. Bal
ance
(eu
ro b
illio
ns)
Annual perc
enta
ge c
hanges
1.1
Act
ivit
y, p
rice
s an
d la
bo
ur
mar
ket
1. M
AIN
EC
ON
OM
IC IN
DIC
AT
OR
S O
F T
HE
EU
RO
AR
EA
BANCO DE ESPAÑA 28 BOLETÍN ESTADÍSTICO, FEBRUARY 2013

1 2 3 4 5 6 7 8 9 10 11 12
1. MAIN ECONOMIC INDICATORS OF THE EURO AREA 1.2 Saving, investment and financing (a)All residents sectors. Total
___________________________________________________________________________________________________________________________
EUR billions
Net acquisitions of Changes in net Net Net financial transactions GDP non-financial assets worth lending or of the euro area of the
net euro borrowing area
Total Gross Changes Total Saving Net = Non- Financial General Households fixed in inven- capital Net financial institu- government and capital tories trans- financial corpora- tions NPISH formation and fers transac- tions others recei- tions (b) vable
07 2 065 1 990 76 2 097 2 082 15 32 -176 111 -63 159 9 033 08 2 073 2 009 64 1 929 1 921 8 -144 -313 93 -197 274 9 235 09 1 705 1 750 -45 1 679 1 670 9 -26 4 128 -566 409 8 920 10 1 787 1 763 23 1 762 1 751 11 -25 61 166 -569 317 9 169 11 1 869 1 830 40 1 837 1 826 11 -32 -27 127 -388 257 9 417
08 III 522 498 24 488 487 1 -33 -30 48 -55 4 2 314 IV 494 500 -6 465 462 3 -28 -79 4 -57 103 2 285
09 I 441 426 15 403 403 1 -37 -14 34 -151 93 2 226 II 420 445 -25 418 416 2 -2 -66 38 -118 144 2 220 III 420 429 -9 422 421 1 2 53 35 -161 75 2 231 IV 424 450 -26 436 430 5 12 31 20 -136 96 2 243
10 I 424 406 18 399 397 2 -25 41 45 -182 72 2 260 II 460 454 6 449 447 2 -11 -77 27 -102 141 2 289 III 453 440 13 448 446 2 -5 68 67 -171 31 2 305 IV 450 463 -13 466 461 5 15 29 27 -114 73 2 316
11 I 469 433 36 430 428 2 -39 20 33 -130 38 2 340 II 482 470 12 464 464 1 -18 -68 30 -77 97 2 354 III 469 453 15 453 451 2 -16 2 35 -104 52 2 363 IV 449 474 -24 490 484 6 41 19 28 -77 71 2 360
12 I 451 432 19 441 439 2 -10 14 35 -121 62 2 368 II 449 457 -9 464 462 2 16 -80 53 -68 110 2 372
13 14 15 16 17 18 19 20 21 22 23 24 25 26 27 28
1. MAIN ECONOMIC INDICATORS OF THE EURO AREA 1.2 (Cont) Saving, investment and financing (a)All residents sectors. Total
See notes at the end of the chapter.
___________________________________________________________________________________________________________________________
EUR billions
Net Net adquisition of financial assets Net incurrence of liabilities Financial balance sheet lending of the euro area vis-à-vis rest of the world of the euro area vis-à-vis rest of the world or net
borrowing = Total Curren- Securi- Loans Shares Other Total Curren- Securi- Loans Shares Other Net Finan- Liabi- Net cy and ties and cy and ties and cial lities financial depo- other other depo- other other assets vis-à-vis transac- sits than equity sits than equity vis-à-vis rest of tions shares shares rest of the world the world
07 32 1 767 477 443 372 430 45 1 735 710 405 161 466 -7 -1 759 13 656 15 415 08 -144 393 -126 210 206 84 19 537 97 364 65 -24 34 -1 923 13 044 14 967 09 -26 -48 -358 22 -7 311 -16 -22 -563 255 -69 368 -13 -2 050 13 385 15 435 10 -25 677 65 49 209 312 42 702 8 133 79 405 77 -1 927 14 755 16 682 11 -32 491 36 9 121 276 49 523 -201 139 108 379 98 -1 993 15 348 17 342
08 III -33 118 44 -13 46 36 5 151 88 95 23 -51 -4 -1 708 13 874 15 582 IV -28 -348 -197 -76 -47 -32 3 -320 -309 46 3 -63 3 -1 923 13 044 14 967
09 I -37 -145 -195 -2 24 22 6 -108 -195 97 1 -10 -1 -1 995 12 843 14 838 II -2 -65 -86 3 -36 60 -6 -63 -151 82 -85 104 -12 -1 929 12 926 14 855 III 2 32 -78 22 1 102 -15 30 -123 42 1 125 -14 -2 066 13 048 15 115 IV 12 130 2 -2 4 127 -1 118 -93 34 14 148 15 -2 050 13 385 15 435
10 I -25 215 22 20 62 83 28 240 89 60 -34 96 28 -1 997 14 051 16 049 II -11 161 13 3 65 67 12 172 -14 72 5 97 12 -1 836 14 708 16 544 III -5 167 10 43 7 100 7 172 18 1 27 105 21 -1 961 14 603 16 565 IV 15 134 19 -17 75 62 -5 119 -85 1 81 106 16 -1 927 14 755 16 682
11 I -39 227 20 - 70 119 18 266 -70 78 31 192 36 -2 031 14 660 16 691 II -18 189 57 8 42 70 13 207 -11 179 2 36 - -2 102 14 770 16 872 III -16 148 76 -9 44 - 36 164 28 -26 41 55 66 -2 069 14 929 16 998 IV 41 -73 -118 10 -36 87 -17 -114 -148 -92 34 96 -3 -1 993 15 348 17 342
12 I -10 297 47 108 26 87 29 306 121 17 37 105 26 -2 058 15 642 17 699 II 16 64 12 -18 31 22 18 48 -64 24 30 50 9 -1 891 15 942 17 832
BANCO DE ESPAÑA 29 BOLETÍN ESTADÍSTICO, FEBRUARY 2013

1 2 3 4 5 6 7 8 9 10 11 12 13 14 15
1. MAIN ECONOMIC INDICATORS OF THE EURO AREA 1.3 Financial transactions. Non-financial corporations
EUR billions
Net Net acquisition of financial assets Net incurrence of liabilities Financial balance sheet finan- cial
transac- Total Curren- Securi- Loans Shares Other Total Securi- Loans Shares Other Net Financial Liabili- tions cy and ties and ties and assets ties depo- other other other other sits than equity than equity shares shares
07 -176 1 201 146 89 300 385 281 1 377 -19 889 415 92 -10 163 16 314 26 477 08 -313 566 54 -16 273 385 -130 879 41 578 311 -51 -8 949 14 990 23 939 09 4 134 87 -14 68 137 -145 130 95 -69 241 -138 -9 317 15 740 25 057 10 61 635 88 13 156 246 131 574 30 91 263 189 -9 668 16 328 25 996 11 -27 530 73 1 126 208 121 557 43 192 176 147 -9 106 16 249 25 355
08 III -30 150 22 -3 61 103 -34 179 18 127 61 -26 -9 296 15 492 24 787 IV -79 158 15 11 39 123 -31 237 23 92 121 1 -8 949 14 990 23 939
09 I -14 -16 -35 - 33 86 -100 -2 27 2 50 -81 -8 609 14 583 23 192 II -66 31 44 -17 3 38 -38 97 31 8 77 -19 -8 890 14 977 23 866 III 53 26 34 8 5 25 -46 -27 27 -75 67 -46 -9 259 15 571 24 830 IV 31 93 44 -5 27 -12 39 61 11 -5 46 8 -9 317 15 740 25 057
10 I 41 151 -31 17 56 34 74 111 28 16 51 15 -9 279 16 051 25 330 II -77 107 15 -22 43 48 23 184 11 28 60 85 -9 043 15 882 24 925 III 68 196 43 18 51 96 -12 128 8 53 85 -18 -9 310 16 211 25 521 IV 29 181 60 1 6 68 46 152 -17 -5 66 107 -9 668 16 328 25 996
11 I 20 109 -6 10 21 27 58 89 6 67 40 -24 -9 779 16 493 26 273 II -68 183 19 -11 49 79 47 251 7 90 65 89 -9 840 16 615 26 455 III 2 171 33 3 38 83 12 169 20 29 79 41 -9 114 15 944 25 058 IV 19 67 27 -1 19 19 4 48 10 6 -9 41 -9 106 16 249 25 355
12 I 14 110 -18 6 44 67 11 96 34 33 73 -44 -9 189 16 747 25 936 II -80 47 4 1 41 30 -29 126 22 30 50 24 -9 081 16 581 25 662
1 2 3 4 5 6 7 8 9 10 11 12 13
1. MAIN ECONOMIC INDICATORS OF THE EURO AREA 1.4 Financial transactions. Households and NPISH
EUR billions
Net Net acquisition of financial assets Net incurrence of liabilities Financial balance sheet finan- cial
transac- Total Curren- Securi- Shares Insu- Other Total Loans Other Net Financial Liabili- tions cy and ties and rance accounts assets ties depo- other other techni- recei- sits than equity cal re- vable shares serves
07 159 568 320 118 -63 235 -41 409 383 27 12 163 18 263 6 100 08 274 530 412 42 -77 136 8 256 258 -2 11 032 17 357 6 325 09 409 518 192 -78 111 229 65 110 110 -1 11 725 18 184 6 459 10 317 474 175 -42 36 242 63 157 128 29 12 122 18 800 6 677 11 257 376 168 79 -42 126 46 119 94 26 12 023 18 768 6 745
08 III 4 49 38 10 -37 27 9 45 57 -12 11 456 17 736 6 280 IV 103 149 218 -22 -3 20 -65 45 39 6 11 032 17 357 6 325
09 I 93 90 25 -34 29 64 4 -4 -3 - 10 746 17 081 6 334 II 144 178 75 -15 27 56 36 34 46 -12 11 145 17 522 6 376 III 75 114 -1 -6 48 49 26 39 31 8 11 612 18 024 6 412 IV 96 136 92 -22 6 61 -1 40 37 3 11 725 18 184 6 459
10 I 72 104 -3 -28 34 92 11 33 15 18 11 890 18 390 6 500 II 141 190 64 2 8 54 63 50 33 17 11 734 18 330 6 596 III 31 58 2 -27 -4 50 36 27 32 -6 11 967 18 588 6 620 IV 73 121 113 11 -1 45 -47 48 49 - 12 122 18 800 6 677
11 I 38 57 1 19 -39 58 18 19 10 9 12 217 18 911 6 695 II 97 155 72 22 -3 29 35 58 48 10 12 255 18 971 6 717 III 52 71 12 -7 8 26 31 19 17 2 11 813 18 550 6 737 IV 71 94 83 45 -8 13 -38 24 19 5 12 023 18 768 6 745
12 I 62 91 37 -18 8 36 30 30 -7 37 12 319 19 093 6 774 II 110 114 74 -22 29 25 9 3 17 -14 12 234 19 015 6 781
BANCO DE ESPAÑA 30 BOLETÍN ESTADÍSTICO, FEBRUARY 2013

2008 2009 2010 2011 2012-2
-1
0
1
2
3
4
5
6
7
-2
-1
0
1
2
3
4
5
6
7% %
TOTAL HICPFOODUNPROCESSED FOODSERVICES
HARMONISED INDEX OF CONSUMER PRICES
M M M
1 2 3 4 5 6 7 8 9 10 11 12 13 14
1. MAIN ECONOMIC INDICATORS 1.5 PricesOF THE EURO AREA
___________________________________________________________________________________________________________________________
Eurostat Annual percentage changes
Harmonised index of consumer prices (HICP) (a) Industrial producer prices Goods Goods
Total Food (b) Industrial goods Total Services Total Consumer Capital Interme- Energy excluding goods goods diate Total Processed Unprocessed Total Non-energy Energy construction non- food food energy goods
(c)(100%) (59.2%) (19.3%) (11.8 %) (7.4 %) (39.9%) (30.7%) (9.2 %) (40.8%)
09 0.3 -0.9 0.7 1.1 0.2 -1.7 0.6 -8.1 2.0 -5.1 -2.1 0.5 -5.2 -11.5 10 1.6 1.8 1.1 0.9 1.3 2.2 0.5 7.4 1.4 2.9 0.4 0.3 3.5 6.5 11 2.7 3.3 2.7 3.3 1.8 3.7 0.8 11.9 1.8 5.9 3.1 1.4 5.9 11.9
P
See notes at the end of the chapter.
11 Dec 2.7 3.3 3.1 4.1 1.6 3.4 1.2 9.7 1.9 4.3 3.1 1.4 2.7 9.5
12 Jan 2.7 3.2 3.1 4.1 1.6 3.2 0.9 9.2 1.9 3.9 3.0 1.2 1.6 9.8 Feb 2.7 3.4 3.3 4.1 2.2 3.4 1.0 9.5 1.8 3.8 2.9 1.1 1.1 9.9 Mar 2.7 3.3 3.3 3.9 2.2 3.4 1.4 8.5 1.8 3.5 2.8 1.2 0.9 9.1 Apr 2.6 3.2 3.1 3.7 2.1 3.2 1.3 8.1 1.7 2.6 2.3 1.2 0.6 6.7 May 2.4 2.9 2.8 3.4 1.8 3.0 1.3 7.3 1.8 2.3 1.9 1.2 0.5 6.3 Jun 2.4 2.8 3.2 3.2 3.1 2.6 1.3 6.1 1.7 1.8 1.9 1.1 0.1 4.7 Jul 2.4 2.8 2.9 2.9 2.9 2.8 1.5 6.1 1.8 1.7 1.9 1.0 -0.2 4.5 Aug 2.6 3.2 3.0 2.7 3.5 3.3 1.1 8.9 1.8 2.7 2.2 0.8 0.2 8.1 Sep 2.6 3.2 2.9 2.5 3.7 3.4 1.2 9.1 1.7 2.7 2.2 0.8 0.7 7.0 Oct 2.5 3.0 3.1 2.4 4.3 3.0 1.1 8.0 1.7 2.6 2.3 0.8 1.2 5.9 Nov 2.2 2.6 3.0 2.4 4.1 2.4 1.1 5.7 1.6 2.1 2.1 0.8 1.4 4.1 Dec 2.2 2.5 3.2 2.4 4.4 2.2 1.0 5.2 1.8 2.1 2.2 0.9 1.6 3.7
BANCO DE ESPAÑA 31 BOLETÍN ESTADÍSTICO, FEBRUARY 2013

-7
-6
-5
-4
-3
-2
-1
0
1
2
3
4
-7
-6
-5
-4
-3
-2
-1
0
1
2
3
4% of GDP% of GDP
19951996
19971998
19992000
20012002
20032004
20052006
20072008
20092010
2011
DEFICIT(-) / SURPLUS(+)PRIMARY DEFICIT(-) / SURPLUS(+)
GENERAL GOVERNMNET IN THE EURO AREA
DE BE SK ES FI GR IE LU PTAT CY SI EE FR NL IT MT
-14
-13
-12
-11
-10
-9
-8
-7
-6
-5
-4
-3
-2
-1
0
1
2
-14
-13
-12
-11
-10
-9
-8
-7
-6
-5
-4
-3
-2
-1
0
1
2% of GDP% of GDP
2011
DEFICIT (-) O SURPLUS (+): COUNTRIES IN THE EURO AREA
1 2 3 4 5 6 7 8 9 10 11 12 13 14 15 16 17 18 19 20
1. MAIN ECONOMIC INDICATORS OF THE EURO AREA 1.6 General government deficit (a)
See notes at the end of this chapter.
___________________________________________________________________________________________________________________________
Sources:Eurostat and ECB (Monthly Bulletin,Euro area statistics). As a percentage of GDP Deficit (-) / surplus (+) Euro area Countries in the euro area Primary Deficit deficit debt/ (-)/sur- adjust-
Total plus (+) ment Germany Aus- Belgi- Cyprus Slova- Slove- Spain Esto- Fin- France Greece Nether- Ireland Italy Luxem- Malta Portu- (b) (c) tria um kia nia nia land lands bourg gal
96 -4.2 1.3 -0.4 -3.3 -4.0 -4.0 -3.2 -9.9 -1.1 -5.5 -0.3 -3.5 -4.0 ... -1.9 -0.1 -7.0 1.2 -8.0 -4.5 97 -2.6 2.4 -0.7 -2.6 -1.8 -2.3 -5.0 -6.3 -2.4 -4.0 2.2 -1.4 -3.3 ... -1.2 1.1 -2.7 3.7 -7.7 -3.5 98 -2.3 2.3 -0.5 -2.2 -2.4 -0.9 -4.1 -5.3 -2.4 -3.0 -0.7 1.5 -2.6 ... -0.9 2.4 -2.8 3.4 -9.9 -3.4 99 -1.4 2.6 0.6 -1.5 -2.3 -0.6 -4.3 -7.4 -3.0 -1.2 -3.5 1.6 -1.8 ... 0.4 2.7 -1.7 3.4 -7.7 -2.8 00 -0.1 3.8 1.0 1.3 -1.7 - -2.3 -12.3 -3.7 -0.9 -0.2 6.8 -1.5 -3.7 2.0 4.8 -0.8 6.0 -6.2 -2.9 01 -1.9 1.9 - -2.8 - 0.4 -2.2 -6.5 -4.0 -0.5 -0.1 5.0 -1.5 -4.5 -0.2 0.9 -3.1 6.1 -6.4 -4.3 02 -2.7 0.8 -0.6 -3.7 -0.7 -0.1 -4.4 -8.2 -2.5 -0.2 0.3 4.0 -3.1 -4.8 -2.1 -0.3 -2.9 2.1 -5.5 -2.8 03 -3.2 0.2 - -4.0 -1.4 -0.1 -6.5 -2.8 -2.7 -0.3 1.7 2.4 -4.1 -5.6 -3.1 0.4 -3.5 0.5 -9.8 -2.9 04 -2.9 0.2 0.2 -3.8 -4.4 -0.3 -4.1 -2.4 -2.2 -0.1 1.6 2.3 -3.6 -7.5 -1.7 1.4 -3.5 -1.1 -4.7 -3.4 05 -2.5 0.5 0.8 -3.3 -1.7 -2.7 -2.4 -2.8 -1.4 1.3 1.6 2.7 -2.9 -5.2 -0.3 1.6 -4.3 - -2.9 -6.1 06 -1.4 1.5 0.2 -1.6 -1.5 0.2 -1.2 -3.2 -1.3 2.4 2.4 4.0 -2.3 -5.7 0.5 2.9 -3.4 1.4 -2.7 -4.1 07 -0.7 2.3 0.5 0.2 -0.9 -0.3 3.5 -1.8 - 1.9 2.4 5.3 -2.7 -6.5 0.2 0.1 -1.6 3.7 -2.4 -3.1 08 -2.1 0.9 3.2 -0.1 -0.9 -1.0 0.9 -2.1 -1.9 -4.5 -2.9 4.4 -3.3 -9.8 0.5 -7.4 -2.7 3.2 -4.6 -3.6 09 -6.3 -3.5 0.9 -3.1 -4.1 -5.5 -6.1 -8.0 -6.0 -11.2 -2.0 -2.5 -7.5 -15.6 -5.6 -13.9 -5.4 -0.8 -3.9 -10.2 10 -6.2 -3.4 1.4 -4.1 -4.5 -3.8 -5.3 -7.7 -5.7 -9.7 0.2 -2.5 -7.1 -10.7 -5.1 -30.9 -4.5 -0.8 -3.6 -9.8 11 -4.1 -1.1 0.1 -0.8 -2.5 -3.7 -6.3 -4.9 -6.4 -9.4 1.1 -0.6 -5.2 -9.4 -4.5 -13.4 -3.9 -0.3 -2.7 -4.4
BANCO DE ESPAÑA 32 BOLETÍN ESTADÍSTICO, FEBRUARY 2013

64
66
68
70
72
74
76
78
80
82
84
86
88
64
66
68
70
72
74
76
78
80
82
84
86
88% of GDP% of GDP
19951996199719981999200020012002200320042005200620072008200920102011
TOTAL
GROSS NOMINAL CONSOLIDATED DEBT OF GENERAL GOVERNMENT IN THE EURO AREA
DE BE SK ES FI GR IE LU PTAT CY SI EE FR NL IT MT
0
20
40
60
80
100
120
140
160
180
0
20
40
60
80
100
120
140
160
180% of GDP% of GDP 2011
GROSS NOMINAL CONSOLIDATED DEBT BY COUNTRIES IN THE EURO AREA
1 2 3 4 5 6 7 8 9 10 11 12 13 14 15 16 17 18
1. MAIN ECONOMIC INDICATORS OF THE EURO AREA 1.7 General government nominal gross consolidateddebt (Excessive deficit procedure) (a)
See notes at the end of this chapter.
___________________________________________________________________________________________________________________________
Sources:Eurostat and ECB (Monthly Bulletin,Euro area statistics). As a percentaje of GDP Countries in the euro area
Total (b) Germany Austria Belgium Cyprus Slova- Slove- Spain Estonia Finland France Greece Nether- Ireland Italy Luxem- Malta Portugal kia nia lands bourg
96 75.2 58.4 68.3 127.3 42.8 31.1 ... 67.4 7.4 57.0 58.0 99.4 74.1 73.5 120.9 7.4 40.1 59.9 97 74.1 59.7 64.4 122.7 46.7 33.8 ... 66.1 6.2 53.9 59.2 96.6 68.2 64.3 118.1 7.4 48.4 56.1 98 72.9 60.3 64.8 117.4 51.2 34.5 ... 64.1 5.5 48.4 59.4 94.5 65.7 53.6 114.9 7.1 53.4 52.1 99 72.0 60.9 67.2 113.7 51.8 47.9 ... 62.4 6.0 45.7 58.9 94.0 61.1 48.5 113.7 6.4 57.1 51.4 00 69.2 59.7 66.5 107.9 48.7 50.3 ... 59.4 5.1 43.8 57.3 103.4 53.8 37.8 109.2 6.2 55.9 50.5 01 68.2 58.8 67.1 106.6 52.1 48.9 26.8 55.6 4.8 42.5 56.9 103.7 50.7 35.6 108.8 6.3 62.1 52.9 02 68.0 60.4 66.5 103.5 64.6 43.4 28.0 52.6 5.7 41.5 58.8 101.7 50.5 32.2 105.7 6.3 60.1 55.6 03 69.2 63.9 65.5 98.5 68.9 42.4 27.5 48.8 5.6 44.5 62.9 97.4 52.0 31.0 104.4 6.1 69.3 56.9 04 69.6 65.8 64.8 94.2 70.2 41.5 27.2 46.3 5.0 44.4 64.9 98.6 52.4 29.7 103.8 6.3 72.3 58.3 05 70.5 68.0 63.9 92.1 69.1 34.2 27.0 43.2 4.6 41.7 66.4 100.0 51.8 27.4 105.8 6.1 70.1 63.6 06 68.7 67.6 62.1 88.1 64.6 30.5 26.7 39.7 4.4 39.7 63.7 106.1 47.4 24.8 106.6 6.7 63.4 63.9 07 66.4 65.2 60.2 84.1 58.8 29.6 23.1 36.3 3.7 35.2 64.2 107.4 45.3 24.8 103.1 6.7 62.1 68.3 08 70.2 66.8 63.8 89.2 48.9 27.9 22.0 40.2 4.5 33.9 68.2 112.9 58.5 44.5 106.1 14.4 62.0 71.7 09 80.0 74.5 69.2 95.7 58.5 35.6 35.0 53.9 7.2 43.5 79.2 129.7 60.8 64.9 116.4 15.3 67.6 83.2 10 85.4 82.5 72.0 95.5 61.3 41.0 38.6 61.5 6.7 48.6 82.3 148.3 63.1 92.2 119.2 19.2 68.3 93.5 11 87.3 80.5 72.4 97.8 71.1 43.3 46.9 69.3 6.1 49.0 86.0 170.6 65.5 106.4 120.7 18.3 70.9 108.1
BANCO DE ESPAÑA 33 BOLETÍN ESTADÍSTICO, FEBRUARY 2013

by
euro
are
a re
sid
ents
iss
ued
by
euro
are
a re
sid
ents
____
____
____
____
____
____
____
____
____
____
____
____
____
____
____
____
____
____
____
____
____
____
____
____
____
____
____
____
____
____
____
____
____
____
____
____
____
____
____
____
____
____
____
____
____
____
Véa
nse
nota
s al
fina
l del
cap
ítulo
./ S
ee n
ote
s a
t th
e e
nd o
f th
e c
hapte
r.
1. P
RIN
CIP
AL
ES
IND
ICA
DO
RE
S E
CO
NÓ
MIC
OS
DE
LA
ZO
NA
DE
L E
UR
O1.
8 B
alan
ces
agre
gad
o y
co
nso
lidad
o y
op
erac
ion
es (
flu
jos
aju
stad
os)
de
las
IFM
res
iden
tes
en la
zo
na
del
eu
ro, i
ncl
uye
nd
o e
l Eu
rosi
stem
a
mm
de e
uro
s
B
alan
ce a
greg
a-
S
aldo
s
C
ontr
apar
tida
B
alan
ce c
onso
li- D
ife-
A
jus-
O
pera
-
do d
e la
s IF
M
e
ntre
las
de
las
tran
sac-
dad
o de
las
IFM
r
enci
a
tes
cio
nes
re
side
ntes
en
IF
M
ci
ones
mon
e-
res
iden
tes
en la
de
Adju
st-
(flu
jos
la z
ona
del e
uro,
re
side
ntes
en
taria
s de
la
zo
na d
el e
uro,
s
aldo
s
m
ents
a
just
a- i
nclu
yend
o el
l
a zo
na e
uro
del
A
dmin
istr
a-
incl
uyen
do e
l M
onth
ly
d
os)
Eur
osis
tem
a /
In
tern
al
ci
ón C
entr
al
E
uros
iste
ma
diffe
-
Tra
n-
Aggre
gate
d b
a-
positio
n
C
ounte
rpart
C
onsolid
ate
d
re
nces
sac-
la
nce s
heet
of M
FIs
of
o
f m
oneta
ry
b
ala
nce s
heet
in
t
ions
of euro
are
a
the e
uro
tra
nsactions
o
f euro
are
a
le
ve
l
(
adju
s-
M
FIs
, in
clu
-
a
rea
o
f C
entr
al
M
FIs
, in
clu
-
ted
din
g the
G
overm
ent
d
ing the E
uro
-
f
low
s)
E
uro
syste
m
s
yste
m (
a)
1
2
3
4
5
6 7
=1-
3+5
8=
2-4+
6
9=
8-7
10
=9-
11
11
d
ic 1
2 e
ne 1
3
dic
12
ene
13
dic
12
ene
13
dic
12
ene
13
en
e 13
e
ne 1
3
ene
13
1
AC
TIV
O.
..
..
..
..
..
..
..
..
..
..
..
..
.37
463
37
243
11
746
11
312
12
0 11
2 25
838
26
043
20
6 30
8 -1
02
1
AS
SE
TS
2
Pré
stam
os
y cr
édit
os
a re
sid
ente
s en
la z
on
a d
el e
uro
..
..
.21
344
20
918
9
129
8 69
7 -
- 12
214
12
221
7
-21
28
2
Lo
ans
to t
he
euro
are
a re
sid
ents
3
I
FM
..
..
..
..
..
..
..
..
..
..
..
..
..
..
9 12
9 8
697
9 12
9 8
697
- -
- -
- -
-
3
M
FIs
4
A
dmin
istr
acio
nes
Púb
licas
..
..
..
..
..
..
..
..
..
1 17
0 1
173
- -
- -
1 17
0 1
173
4 -0
4
4
Gen
eral
Gov
ernm
ent
5
O
tros
sec
tore
s re
side
ntes
..
..
..
..
..
..
..
..
..
11 0
44
11 0
48
- -
- -
11 0
44
11 0
48
3 -2
1 24
5
Oth
er e
uro
area
res
iden
ts
6
Val
ore
s d
isti
nto
s d
e ac
cio
nes
y p
arti
cip
acio
nes
..
..
..
..
5 63
0 5
663
2 00
4 2
017
- -
3 62
6 3
646
20
2 18
6
H
old
ing
s o
f se
curi
ties
oth
er t
han
sh
ares
issu
ed
e
mit
ido
s p
or
resi
den
tes
en la
zo
na
del
eu
ro 7
IF
M.
..
..
..
..
..
..
..
..
..
..
..
..
..
.2
004
2 01
7 2
004
2 01
7 -
- -
- -
- -
7
MF
Is 8
Adm
inis
trac
ione
s P
úblic
as.
..
..
..
..
..
..
..
..
.2
197
2 22
9 -
- -
- 2
197
2 22
9 32
3
29
8
G
ener
al G
over
nmen
t 9
Otr
os s
ecto
res
resi
dent
es.
..
..
..
..
..
..
..
..
.1
429
1 41
6 -
- -
- 1
429
1 41
6 -1
2 -1
-1
1
9
O
ther
eur
o ar
ea r
esid
ents
10
P
arti
cip
acio
nes
em
itid
as p
or
fon
do
s d
el m
erca
do
..
..
..
67
60
67
60
- -
- -
- -
-
10
M
on
ey m
arke
t fu
nd
s sh
ares
un
its
m
on
etar
io 1
1
IF
M.
..
..
..
..
..
..
..
..
..
..
..
..
..
67
60
67
60
- -
- -
- -
-
11
MF
Is
12
A
ccio
nes
y p
arti
cip
acio
nes
..
..
..
..
..
..
..
..
.1
251
1 26
8 48
4 48
7 -
- 76
7 78
1 14
1
12
12
H
old
ing
s o
f sh
ares
/oth
er e
qu
ity
e
mit
idas
po
r re
sid
ente
s en
la z
on
a d
el e
uro
13
IFM
..
..
..
..
..
..
..
..
..
..
..
..
..
.48
4 48
7 48
4 48
7 -
- -
- -
- -
1
3
M
FIs
14
Otr
os s
ecto
res
resi
dent
es.
..
..
..
..
..
..
..
..
767
781
- -
- -
767
781
14
1 12
1
4
O
ther
eur
o ar
ea r
esid
ents
15
A
ctiv
os
fren
te a
no
res
iden
tes
en la
zo
na
del
eu
ro.
..
..
.4
321
4 28
6 -
- -
- 4
321
4 28
6 -3
5 -9
3 58
1
5
Ext
ern
al a
sset
s
16
A
ctiv
o f
ijo.
..
..
..
..
..
..
..
..
..
..
..
..
223
222
- -
- -
223
222
-1
-0
-1
16
F
ixed
ass
ets
17
R
esto
de
acti
vos
..
..
..
..
..
..
..
..
..
..
..
4 62
8 4
826
61
51
120
112
4 68
6 4
887
201
419
-218
1
7
Rem
ain
ing
ass
ets
18
Del
cua
l: ef
ectiv
o en
circ
ulac
ión
en e
uros
..
..
..
..
..
.61
51
61
51
-
- -
- -
- -
1
8
O
f whi
ch:c
urre
ncy
in c
ircul
atio
n in
eur
o
EU
R b
illio
ns
1.8
Ag
gre
gat
ed a
nd
co
nso
lidat
ed b
alan
ce s
hee
t an
d t
ran
sact
ion
s1.
MA
IN E
CO
NO
MIC
IND
ICA
TO
RS
OF
TH
E E
UR
O A
RE
A
(a
dju
sted
flo
ws)
of
the
euro
are
a M
FIs
, in
clu
din
g t
he
Eu
rosy
stem
BANCO DE ESPAÑA 34 BOLETÍN ESTADÍSTICO, FEBRUARY 2013

ar
ea r
esid
ents
____
____
____
____
____
____
____
____
____
____
____
____
____
____
____
____
____
____
____
____
____
____
____
____
____
____
____
____
____
____
____
____
____
____
____
____
____
____
____
____
____
____
____
____
____
____
1. P
RIN
CIP
AL
ES
IND
ICA
DO
RE
S E
CO
NÓ
MIC
OS
DE
LA
ZO
NA
DE
L E
UR
O1.
8 B
alan
ces
agre
gad
o y
co
nso
lidad
o y
op
erac
ion
es (
flu
jos
aju
stad
os)
de
las
IFM
res
iden
tes
en la
zo
na
del
eu
ro, i
ncl
uye
nd
o e
l Eu
rosi
stem
a (c
on
t.)
mm
de e
uro
s
B
alan
ce a
greg
a-
S
aldo
s
Con
trap
artid
a
Bal
ance
con
soli-
Dife
-
Aju
s-
Ope
ra-
do
de la
s IF
M
en
tre
las
de
las
tran
sac-
dad
o de
las
IFM
r
enci
a
tes
cio
nes
res
iden
tes
en
I
FM
cio
nes
mon
e-
res
iden
tes
en
de
Adju
st-
(flu
jos
la z
ona
del e
uro,
re
side
ntes
en
ta
rias
de la
la
zon
a de
l eur
o, s
aldo
s
me
nts
a
just
a- i
nclu
yend
o el
la
zon
a de
l eur
o A
dmin
istr
a-
i
nclu
yend
o el
M
onth
ly
dos
)
Eur
osis
tem
a /
Inte
rnal
ció
n C
entr
al
Eur
osis
tem
a/
diffe
-
T
ran-
Aggre
gate
d b
a-
p
ositio
n
Counte
rpart
Consolid
ate
d
re
nces
s
ac-
la
nce s
heet
o
f M
FIs
of
of m
oneta
ry
bala
nce s
heet
in
tio
ns
of euro
are
a
th
e e
uro
tra
nsactions
of euro
are
a
le
vel
(
adju
s-
M
FIs
, in
clu
-
are
a
of C
entr
al
M
FIs
, in
clu
-
t
ed
din
g the
Goverm
ent
din
g the E
uro
-
flo
ws)
E
uro
syste
m
syste
m (
a)
1
2
3
4
5
6 7
=1-
3+5
8=
2-4+
6
9=
8-7
10=
9-11
11
d
ic 1
2
ene
13
d
ic 1
2 e
ne 1
3 d
ic 1
2 e
ne 1
3 d
ic 1
2 e
ne 1
3
ene
13
ene
13
ene
13
1
P
AS
IVO
..
..
..
..
..
..
..
..
..
..
..
..
..
..
37 9
86
37 7
55
11 7
46
11 3
12
120
112
26 3
61
26 5
54
194
296
-102
1
L
IAB
ILIT
IES
2
Efe
ctiv
o en
circ
ulac
ión
..
..
..
..
..
..
..
..
..
..
..
938
908
61
51
- -
877
857
-20
- -2
0
2
Cur
renc
y in
circ
ulat
ion
3
D
el c
ual:
tfebn
cias
en
euro
s de
las
IFM
y e
l Eur
osis
tem
a.
..
..
.61
51
61
51
-
- -
- -
- -
3
Of w
hich
: hol
ding
of c
urre
ncy
in c
ircul
atio
n in
eur
o
4
Dep
ósi
tos
de
resi
den
tes
en la
zo
na
del
eu
ro.
..
..
..
..
..
20 2
66
19 8
67
9 07
9 8
656
120
112
11 3
08
11 3
22
15
-9
24
4
Dep
osi
ts o
f eu
ro a
rea
resi
den
ts 5
IF
M.
..
..
..
..
..
..
..
..
..
..
..
..
..
..
.9
079
8 65
6 9
079
8 65
6 -
- -
- -
- -
5
MF
Is 6
Adm
inis
trac
ión
Cen
tral
..
..
..
..
..
..
..
..
..
..
.25
3 28
7 -
- -
- 25
3 28
7 34
-0
34
6
Cen
tral
Gov
ernm
ent
7
O
tras
Adm
inis
trac
ione
s P
úblic
as y
otr
os s
ecto
res
..
..
..
..
..
10 9
35
10 9
24
- -
120
112
11 0
55
11 0
35
-19
-9
-10
7
Oth
er G
febr
al G
over
men
t/oth
er e
uro
res
iden
tes
en la
zon
a de
l eur
o 8
A
la v
ista
..
..
..
..
..
..
..
..
..
..
..
..
..
.4 2
01
4 1
71
- -
96
87
4 2
97
4 2
59
-39
-5
-34 8
O
vern
ight
9 A
pla
zo.
..
..
..
..
..
..
..
..
..
..
..
..
..
.4 2
00
4 1
86
- -
2
3
4 2
03
4 1
88
-15
-4
-11 9
W
ith a
gre
ed m
atu
rity
10 H
ast
a d
os
años
..
..
..
..
..
..
..
..
..
..
..
..
1 8
00
1 7
91
- -
2
3
1 8
02
1 7
94
-9
-3
-6 1
0 U
p t
o 2
yea
rs
11 A
más
de
dos
años
..
..
..
..
..
..
..
..
..
..
..
.2 4
00
2 3
94
- -
- -
2 4
00
2 3
94
-6
-1
-5 1
1 O
ver
2 y
ears
12 C
on p
reavi
so.
..
..
..
..
..
..
..
..
..
..
..
..
.2 1
60
2 1
83
- -
22
22
2 1
82
2 2
05
23
-0
23 1
2 R
edee
mable
at
noti
ce
13 H
ast
a t
res
mes
es.
..
..
..
..
..
..
..
..
..
..
..
2 0
54
2 0
78
- -
22
22
2 0
76
2 1
00
24
-0
24 1
3 U
p t
o 3
month
s
14 A
más
de
tres
mes
es.
..
..
..
..
..
..
..
..
..
..
.106
105
- -
- -
106
105
-1
-0
-1 1
4 O
ver
3 m
onth
s
15 C
esio
nes
tem
pora
les.
..
..
..
..
..
..
..
..
..
..
..
372
384
- -
- -
372
384
11
-0
12 1
5 R
epurc
hase
agre
emen
ts
16
P
arti
cip
acio
nes
em
itid
as p
or
fon
do
s d
el m
erca
do
mo
net
ario
..
.52
3 51
9 67
60
-
- 45
6 45
9 3
-5
7
16
M
on
ey m
arke
t fu
nd
s sh
ares
/un
its
19
V
alo
res
dis
tin
tos
de
acci
on
es y
par
tici
pac
ion
es.
..
..
..
..
4 85
4 4
826
2 00
4 2
017
- -
2 85
0 2
809
-40
-33
-8
19
D
ebt
secu
riti
es is
sued
20
Has
ta d
os a
ños
..
..
..
..
..
..
..
..
..
..
..
..
693
688
513
525
- -
180
163
-17
-12
-5
20
Up
to 2
yea
rs 2
1
A
más
de
dos
años
..
..
..
..
..
..
..
..
..
..
..
4 16
1 4
138
1 49
1 1
492
- -
2 67
0 2
646
-23
-20
-3
21
Ove
r 2
year
s
22
C
apit
al y
res
erva
s.
..
..
..
..
..
..
..
..
..
..
..
2 88
8 2
884
484
487
- -
2 40
4 2
396
-8
-10
3
22
C
apit
al a
nd
res
erve
s
23
O
tro
s p
asiv
os
fren
te a
no
res
iden
tes
en la
zo
na
del
eu
ro.
..
..
3 79
7 3
770
- -
- -
3 79
7 3
770
-28
-57
29
23
E
xter
nal
liab
iliti
es
24
R
esto
de
pas
ivo
s.
..
..
..
..
..
..
..
..
..
..
..
4 72
0 4
982
- -
- -
4 72
0 4
982
262
415
-153
2
4
Rem
ain
ing
liab
iliti
es
25
P
osi
ció
n n
eta
de
las
IFM
..
..
..
..
..
..
..
..
..
..
- -
51
41
- -
-51
-41
10
-5
15
25
E
xces
s o
f in
ter-
MF
Is li
abilt
ies
EU
R b
illio
ns
1.8
Ag
gre
gat
ed a
nd
co
nso
lidat
ed b
alan
ce s
hee
t an
d t
ran
sact
ion
s1.
MA
IN E
CO
NO
MIC
IND
ICA
TO
RS
OF
TH
E E
UR
O A
RE
A
(a
dju
sted
flo
ws)
of
the
euro
are
a M
FIs
, in
clu
din
g t
he
Eu
rosy
stem
(co
nti
nu
atio
n)
BANCO DE ESPAÑA 35 BOLETÍN ESTADÍSTICO, FEBRUARY 2013

MO
NE
TA
RY
AG
GR
EG
AT
ES
by
MF
Is in
the
euro
are
a up
to 2
yea
rs
M3
CO
UN
TE
RP
AR
TS
(7
= A
- B
)
A
MF
Is A
SS
ET
S
____
____
____
____
____
____
____
____
____
____
____
____
____
____
____
____
____
____
____
____
____
____
____
____
____
____
____
____
____
____
____
____
____
____
____
____
____
____
____
____
____
____
____
____
____
____
Véa
nse
nota
s al
fina
l del
cap
ítulo
. See n
ote
s a
t th
e e
nd o
f th
e c
hapte
r.
1. P
RIN
CIP
AL
ES
IND
ICA
DO
RE
S E
CO
NÓ
MIC
OS
DE
LA
ZO
NA
DE
L E
UR
O1.
9 A
gre
gad
os
mo
net
ario
s d
e la
zo
na
del
eu
ro y
co
ntr
apar
tid
as d
e M
3. R
esu
men
mm
de e
uro
s
S
aldo
s co
nsol
idad
os fi
nal
Ser
ie e
n cu
a-
Ope
raci
ones
S
erie
en
cua-
d
el p
erío
do C
onsolid
ate
d
dro
y c
olum
na
(flu
jos
ajus
- d
ro y
col
umna
\ b
ala
nces e
nd-o
f-period
T
ime s
eries
tado
s) T
rans-
Tim
e s
erie
s
in table
and
actions (
ad-
in
ta
ble
an
d
colu
mn
juste
d flo
ws)
colu
mn
d
ic 1
2
ene
13
en
e 13
AG
RE
GA
DO
S M
ON
ET
AR
IOS
1
M1
= 2
+ 3
..
..
..
..
..
..
..
..
..
..
..
..
..
..
..
5 17
4 5
116
1.10
/1-5
4 1.
11/1
1
M
1 =
2 +
3 2
Efe
ctiv
o en
circ
ulac
ión
..
..
..
..
..
..
..
..
..
..
..
..
877
857
1.10
/4-2
0 1.
11/4
2
Cur
renc
y in
circ
ulat
ion
3
D
epós
itos
a la
vis
ta.
..
..
..
..
..
..
..
..
..
..
..
..
.4
297
4 25
9 1.
10/5
-34
1.11
/5
3
O
vern
ight
dep
osits
4
M2
= M
1 +
(5
+ 6
).
..
..
..
..
..
..
..
..
..
..
..
..
..
9 05
3 9
010
1.10
/2-3
6 1.
11/2
4
M
2 =
M1
+ (
5 +
6)
5
D
epós
itos
a pl
azo
hast
a do
s añ
os.
..
..
..
..
..
..
..
..
..
1 80
2 1
794
1.10
/6-6
1.
11/6
5
Dep
osits
with
agr
eed
mat
urity
up
to 2
yea
rs 6
Dep
ósito
s co
n pr
eavi
so h
asta
tres
mes
es.
..
..
..
..
..
..
..
.2
076
2 10
0 1.
10/7
24
1.11
/7
6
D
epos
its r
edee
mab
le a
t not
ice
up to
3 m
onth
s
7
M3
= M
2 +
(8
+ 9
+ 1
0 +
11)
..
..
..
..
..
..
..
..
..
..
..
.9
804
9 75
9 1.
10/3
-20
1.11
/3
7
M3
= M
2 +
(8
+ 9
+ 1
0 +
11)
8
C
esio
nes
tem
pora
les
..
..
..
..
..
..
..
..
..
..
..
..
.11
6 12
7 1.
10/8
13
1.11
/8
8
R
epur
chas
e ag
reem
ents
9
V
alor
es d
istin
tos
de a
ccio
nes
y pa
rtic
ipac
ione
s.
..
..
..
..
..
..
.18
0 16
3 1.
10/9
-4
1.11
/9
9
H
oldi
ngs
of s
ecur
ities
oth
er th
an s
hare
s is
sued
h
asta
dos
año
s, e
miti
dos
por
IFM
de
la z
ona
del e
uro
10
P
artic
ipac
ione
s en
fond
os d
el m
erca
do m
onet
ario
..
..
..
..
..
..
456
459
1.10
/10
7 1.
11/1
0
10
M
oney
mar
ket f
unds
sha
res
/ uni
ts
C
ON
TR
AP
AR
TID
AS
DE
M3
(7 =
A -
B)
A
A
CT
IVO
S D
E L
AS
IFM
11
C
réd
ito
a r
esid
ente
s en
la z
on
a d
el e
uro
..
..
..
..
..
..
..
..
16 4
11
16 4
24
31
11
L
oan
s to
eu
ro a
rea
resi
den
ts 1
2
A
las
Adm
inis
trac
ione
s P
úblic
as.
..
..
..
..
..
..
..
..
..
.3
367
3 40
3 1.
10/1
133
1.
11/1
1
12
G
ener
al G
over
men
t 1
3 C
rédit
os
y pré
stam
os
..
..
..
..
..
..
..
..
..
..
..
..
.1 1
70
1 1
73
4
13 L
oans
14 V
alo
res
dis
tinto
s de
acc
iones
y p
art
icip
aci
ones
..
..
..
..
..
..
..
.2 1
97
2 2
29
29
14 S
ecuri
ties
oth
er t
han s
hare
s
15
A o
tros
res
iden
tes
en la
zon
a de
l eur
o.
..
..
..
..
..
..
..
..
13 0
44
13 0
21
1.10
/12
-2
1.11
/12
15
Oth
er e
uro
area
res
iden
ts 1
6 C
rédit
os
y pré
stam
os
..
..
..
..
..
..
..
..
..
..
..
..
.10 8
48
10 8
24
-3
16 L
oans
17 V
alo
res
dis
tinto
s de
acc
iones
y p
art
icip
aci
ones
..
..
..
..
..
..
..
.1 4
29
1 4
16
-1
1
17 S
ecuri
ties
oth
er t
han s
hare
s
18 A
ccio
nes
y p
art
icip
aci
ones
..
..
..
..
..
..
..
..
..
..
..
.767
781
12
18 S
hare
s and o
ther
equit
y
19
A
ctiv
os
fren
te a
no
res
iden
tes
en la
zo
na
del
eu
ro.
..
..
..
..
..
4 84
5 4
798
58
19
E
xter
nal
ass
ets
EU
R b
illio
ns
1.9
Eu
ro a
rea
mo
net
ary
agg
reg
ates
an
d c
ou
nte
rpar
ts t
o M
3. S
um
mar
y1.
MA
IN E
CO
NO
MIC
IND
ICA
TO
RS
OF
TH
E E
UR
O A
RE
A
BANCO DE ESPAÑA 36 BOLETÍN ESTADÍSTICO, FEBRUARY 2013

B
MF
Is L
IAB
ILIT
IES
to
oth
er e
uro
are
a re
sid
ents
O
f wic
h
M
EM
OR
AN
DU
M IT
EM
: M3
coun
terp
arts
diff
eren
t fro
m lo
ans
to
euro
are
a re
side
nts
____
____
____
____
____
____
____
____
____
____
____
____
____
____
____
____
____
____
____
____
____
____
____
____
____
____
____
____
____
____
____
____
____
____
____
____
____
____
____
____
____
____
____
____
____
____
Véa
nse
nota
s al
fina
l del
cap
ítulo
. See n
ote
s a
t th
e e
nd o
f th
e c
hapte
r.
1. P
RIN
CIP
AL
ES
IND
ICA
DO
RE
S E
CO
NÓ
MIC
OS
DE
LA
ZO
NA
DE
L E
UR
O1.
9 A
gre
gad
os
mo
net
ario
s d
e la
zo
na
del
eu
ro y
co
ntr
apar
tid
as d
e M
3. R
esu
men
mm
de e
uro
s
S
aldo
s co
nsol
idad
os fi
nal
Ser
ie e
n cu
a-
Ope
raci
ones
S
erie
en
cua-
d
el p
erío
do C
onsolid
ate
d
dro
y c
olum
na
(flu
jos
ajus
- d
ro y
col
umna
b
ala
nces e
nd-o
f-period
T
ime s
eries
tado
s) T
rans-
Tim
e s
eries
in table
and
actions (
ad-
in table
and
colu
mn
juste
d flo
ws)
colu
mn
d
ic 1
2
ene
13
ene
13
B
PA
SIV
OS
DE
LA
S IF
M
20
D
epó
sito
s d
e la
Ad
min
istr
ació
n C
entr
al.
..
..
..
..
..
..
..
..
..
253
287
34
20
D
epo
sits
of
Cen
tral
Go
verm
ent
21
P
asiv
os
fin
anci
ero
s a
más
larg
o p
lazo
fre
nte
..
..
..
..
..
..
..
..
5 17
6 5
146
-9
21
L
on
ger
-ter
m f
inan
cial
liab
iliti
es
a o
tro
s re
sid
ente
s en
la z
on
a d
el e
uro
22
Dep
ósito
s a
plaz
o a
más
de
dos
años
..
..
..
..
..
..
..
..
..
..
2 40
0 2
394
-5
22
Dep
osits
with
agr
eed
mat
urity
ove
r 2
year
s 2
3
D
epós
itos
con
prea
viso
sup
erio
r a
tres
mes
es.
..
..
..
..
..
..
..
.10
6 10
5
-1
23
D
epos
its r
edee
mab
le a
t not
ice
over
3 m
onth
s 2
4
V
alor
es d
istin
tos
de a
ccio
nes
a m
ás d
e do
s añ
os.
..
..
..
..
..
..
..
2 67
0 2
646
-3
24
Sec
uriti
es o
ther
than
sha
res
with
mat
urity
ove
r 2
year
s
25
C
apit
al y
res
erva
s.
..
..
..
..
..
..
..
..
..
..
..
..
..
..
2 40
4 2
396
3
25
Cap
ital
an
d r
eser
ves
26
P
asiv
os
fren
te a
no
res
iden
tes
en la
zo
na
del
eu
ro.
..
..
..
..
..
..
.3
797
3 77
0
29
26
Ext
ern
al li
abili
ties
27
O
tro
s p
asiv
os
net
os
..
..
..
..
..
..
..
..
..
..
..
..
..
..
-179
-1
35
52
27
O
ther
net
liab
iliti
es
Del
cua
l 2
8
C
esio
nes
tem
pora
les
con
Ent
idad
es d
e co
ntra
part
ida
cent
ral
..
..
..
..
..
257
256
-1
28
Cen
tral
Con
unte
rpar
ties
repo
s 2
9
A
dqui
sici
ones
tem
pora
les
con
Ent
idad
es d
e co
ntra
part
ida
cent
ral
..
..
..
..
196
224
28
29
Cen
tral
Cou
nter
part
ies
reve
rse
repo
s
PR
O M
EM
OR
IA: c
ontr
apar
tidas
de
M3
dist
inta
s de
l cré
dito
a r
esid
ente
s en
la z
ona
del e
uro
30
A
ctiv
os -
pas
ivos
fren
te a
no
resi
dent
es e
n la
zon
a de
l eur
o (1
9 -
26)
..
..
..
.1
048
1 02
8 1.
10/1
329
1.
11/1
3
30
Net
ext
erna
l ass
ets
(19
- 26
)
31
R
esto
de
activ
os n
etos
(20
+ 2
1 +
25
+ 2
7).
..
..
..
..
..
..
..
..
..
-7 6
55
-7 6
94
1.10
/14
-79
1.11
/14
31
R
emai
ning
net
ass
ets
(20
+ 2
1 +
25
+ 2
7)
EU
R b
illio
ns
1.9
Eu
ro a
rea
mo
net
ary
agg
reg
ates
an
d c
ou
nte
rpar
ts t
o M
3. S
um
mar
y1.
MA
IN E
CO
NO
MIC
IND
ICA
TO
RS
OF
TH
E E
UR
O A
RE
A
BANCO DE ESPAÑA 37 BOLETÍN ESTADÍSTICO, FEBRUARY 2013

P
1=4+5 2=1+6+7 3=2+8a10 4 5 6 7 8 9 10 11 12 13 14
1. MAIN ECONOMIC INDICATORS OF THE EURO AREA 1.10 Euro area monetary aggregates and counterparts to M3Consolidated balances. Outstanding amounts (a)
See notes at the end of the chapter.
Eur billions
M1 M2 M3 Curren- Deposits in all currencies vis-a Other instruments Counterparts to M3 cy in vis other general government and issued by MFIs circu- other residents in EMU (net) (b) lation (net) Over- With Redeema- Repur- Debt Money Total Loans (c) Net Net night agreed ble at chase securi- market exter- remai- deposits maturi- notice agree- ties fund nal ning ty up up to ments issued shares/ General Other assets (net) to two three up to units govern- resi- years months two ment re- dents years sident in EMU in EMU
11 4 863.0 8 671.7 9 535.8 857.5 4 005.5 1 849.5 1 959.1 137.1 206.6 520.4 3 130.4 13 275.6 945.0 -7 815.2 12 5 174.0 9 052.7 9 804.4 876.8 4 297.2 1 802.5 2 076.3 115.7 180.0 456.0 3 367.0 13 044.0 1 048.0 -7 654.6
11 Oct 4 762.4 8 555.9 9 436.9 837.5 3 924.9 1 853.0 1 940.5 169.4 170.9 540.8 3 071.9 13 337.9 904.5 -7 877.3 Nov 4 778.9 8 565.2 9 448.4 841.4 3 937.5 1 840.1 1 946.2 163.0 173.2 547.0 3 085.2 13 354.5 915.5 -7 906.8 Dec 4 863.0 8 671.7 9 535.8 857.5 4 005.5 1 849.5 1 959.1 137.1 206.6 520.4 3 130.4 13 275.6 945.0 -7 815.2
12 Jan 4 812.2 8 641.3 9 485.8 843.0 3 969.2 1 853.6 1 975.5 143.8 203.8 496.8 3 197.5 13 298.3 932.4 -7 942.5 Feb 4 781.9 8 649.3 9 496.0 842.5 3 939.3 1 885.3 1 982.1 141.9 217.4 487.4 3 237.4 13 267.6 937.6 -7 946.7 Mar 4 831.8 8 719.6 9 596.2 844.9 3 986.9 1 895.5 1 992.3 137.7 240.9 498.0 3 261.8 13 261.8 884.2 -7 811.7 Apr 4 837.2 8 726.0 9 602.1 847.6 3 989.6 1 892.0 1 996.8 139.1 229.4 507.6 3 259.2 13 268.6 867.3 -7 793.1 May 4 883.1 8 757.3 9 639.3 856.3 4 026.8 1 870.5 2 003.6 138.9 223.5 519.7 3 274.8 13 266.2 909.0 -7 810.6 Jun 4 958.3 8 815.4 9 677.3 867.7 4 090.5 1 847.0 2 010.1 133.1 232.0 496.8 3 345.3 13 209.1 921.0 -7 798.1 Jul 4 982.8 8 839.3 9 706.8 871.5 4 111.3 1 840.9 2 015.7 138.4 233.5 495.5 3 330.8 13 159.9 971.5 -7 755.4 Aug 4 979.1 8 832.4 9 683.0 870.2 4 108.9 1 827.4 2 025.9 131.1 219.2 500.3 3 324.2 13 103.5 978.7 -7 723.4 Sep 5 022.9 8 873.1 9 696.5 866.7 4 156.3 1 822.2 2 028.0 130.5 213.0 479.9 3 372.0 13 101.8 989.2 -7 766.6 Oct 5 056.5 8 935.0 9 751.3 864.3 4 192.2 1 837.7 2 040.8 123.6 207.8 485.0 3 396.9 13 073.7 983.7 -7 703.1 Nov 5 091.7 8 958.4 9 749.5 864.1 4 227.6 1 819.3 2 047.5 122.1 185.8 483.2 3 427.4 13 068.8 1 048.3 -7 795.0 Dec 5 174.0 9 052.7 9 804.4 876.8 4 297.2 1 802.5 2 076.3 115.7 180.0 456.0 3 367.0 13 044.0 1 048.0 -7 654.6
13 Jan 5 115.5 9 009.5 9 758.7 857.0 4 258.5 1 794.0 2 100.0 127.2 163.4 458.5 3 402.8 13 021.2 1 028.5 -7 693.8
P
1=4+5 2=1+6+7 3=2+8a10 4 5 6 7 8 9 10 11 12 13 14
1. MAIN ECONOMIC INDICATORS OR THE EURO AREA 1.11 Euro area monetary aggregates and counterparts to M3.Consolidated balances. Transactions (adjusted flows) (a)
See notes at the end of the chapter.
Eur billions
M1 M2 M3 Curren- Deposits in all currencies vis-a Other instruments Counterparts to M3 cy in vis other general government and issued by MFIs (net) circu- other residents in EMU (b) lation (net) Over- With Redeema- Repur- Debt Money Total Loans (c) Net Net night agreed ble at chase securi- market exter- remai- deposits maturi- notice agree- ties fund nal ning ty up up to ments issued shares/ General Other assets (net) to two three up to units govern- resi- years months two ment re- dents years sident in EMU in EMU
11 80.0 99.1 90.6 16.2 63.8 6.4 12.8 -23.0 19.1 -4.6 17.1 -80.2 17.2 136.5 12 85.5 99.4 59.6 12.7 72.8 -11.3 25.2 -7.6 -5.6 -26.6 -65.9 17.2 34.8 73.5
11 Oct 11.2 -4.4 -20.7 6.3 4.9 -13.3 -2.3 -8.6 0.6 -8.3 -0.2 3.4 -50.7 26.8 Nov 15.1 1.4 3.2 3.9 11.3 -15.0 1.2 -6.6 2.0 6.5 40.3 13.4 -24.3 -26.2 Dec 80.0 99.1 90.6 16.2 63.8 6.4 12.8 -23.0 19.1 -4.6 17.1 -80.2 17.2 136.5
12 Jan -49.1 -27.7 -23.5 -14.4 -34.7 4.6 16.8 7.3 -10.0 6.9 66.4 35.4 -43.7 -81.6 Feb -27.8 11.5 25.2 -0.4 -27.4 31.6 7.7 -1.9 13.4 2.2 31.8 -19.8 20.6 -7.3 Mar 49.2 69.4 101.2 2.4 46.9 10.0 10.1 -4.2 25.4 10.7 33.7 0.7 -27.0 93.9 Apr 3.7 0.9 5.3 2.7 1.1 -7.3 4.5 1.3 -6.6 9.7 4.8 18.7 -29.7 11.5 May 39.1 19.9 24.9 8.7 30.4 -25.8 6.6 -0.5 -6.8 12.3 30.3 -12.4 13.8 -6.7 Jun 74.3 59.1 36.5 11.4 62.9 -21.8 6.6 -6.4 6.7 -22.8 44.3 -30.6 21.1 1.7 Jul 22.7 20.5 26.3 3.8 19.0 -7.9 5.7 5.2 2.0 -1.3 -16.9 -51.5 9.8 84.9 Aug 1.8 -3.3 -10.9 -1.3 3.1 -13.4 8.3 -1.6 -10.7 4.7 -17.1 -51.1 22.1 35.2 Sep 47.2 43.1 18.1 -3.5 50.7 -6.3 2.2 -0.4 -4.2 -20.4 32.8 10.4 -5.9 -19.2 Oct 34.1 63.2 56.6 -2.4 36.4 16.3 12.8 -6.8 -5.3 5.6 15.9 -25.5 21.9 44.4 Nov 35.4 27.3 2.7 -0.2 35.6 -16.2 8.1 -1.5 -22.0 -1.1 17.9 -1.0 64.6 -78.8 Dec 85.5 99.4 59.6 12.7 72.8 -11.3 25.2 -7.6 -5.6 -26.6 -65.9 17.2 34.8 73.5
13 Jan -53.9 -35.6 -19.9 -19.8 -34.0 -5.6 23.9 12.7 -4.5 7.4 33.2 -2.1 28.4 -79.4
BANCO DE ESPAÑA 38 BOLETÍN ESTADÍSTICO, FEBRUARY 2013

P
1=4+5 2=1+6 3=2+7 4 5 6 7 8 +13 +14 +15 12 13 14 15 16
1. MAIN ECONOMIC INDICATORS OF THE EURO AREA 1.12 Euro area monetary aggregates and counterparts to M3Consolidated balances. Outstanding amountsand transactions (flows). (a) (b)
See notes at the end of the chapter.
Eur billions
Consolidated balances Transactions (flows)
M1 M2 M3 Curren- Over- Other Repur- Loans M1 M2 M3 Curren- Over- Other Repur- Loans cy in night short- chase to re- cy in night short- chase to re- circu- deposits term agree- sident circu- depo- term agree- sident (c) lation depo- ments in EMU (c) lation sits depo- ments in EMU (net) sits and (net) sits and except other except other repur- instru- repur- instru- chase ments chase ments agree- issued agree- issued ments by MFIs ments by MFIs (net) (net) 9=12+ 10=9+ 11=10+
11 4 792.3 8 592.0 9 478.6 843.2 3 949.1 3 799.7 886.6 11 022.5 -6.4 -8.1 0.7 -1.3 -5.1 -1.7 8.8 -35.4 12 5 089.0 8 969.9 9 742.0 864.3 4 224.7 3 880.9 772.1 10 863.2 -26.0 -14.8 -38.9 1.8 -27.7 11.2 -24.1 -23.3
11 Oct 4 782.4 8 576.8 9 465.9 840.5 3 941.9 3 794.4 889.1 11 059.6 -1.2 -7.5 -7.8 8.5 -9.7 -6.3 -0.3 -12.5 Nov 4 794.6 8 592.8 9 481.4 844.5 3 950.1 3 798.2 888.6 11 051.4 10.7 8.0 7.2 4.0 6.8 -2.7 -0.8 -13.4 Dec 4 792.3 8 592.0 9 478.6 843.2 3 949.1 3 799.7 886.6 11 022.5 -6.4 -8.1 0.7 -1.3 -5.1 -1.7 8.8 -35.4
12 Jan 4 800.6 8 628.2 9 491.7 849.9 3 950.8 3 827.5 863.5 11 028.6 10.1 38.8 40.2 6.8 3.2 28.7 1.4 14.2 Feb 4 824.9 8 686.4 9 541.1 852.7 3 972.3 3 861.5 854.6 11 010.0 26.9 61.8 64.6 2.8 24.1 34.9 2.8 -7.7 Mar 4 856.9 8 727.8 9 597.5 847.8 4 009.0 3 870.9 869.7 10 994.1 31.2 40.4 57.5 -4.8 36.0 9.2 17.1 -12.6 Apr 4 803.2 8 696.2 9 553.4 850.1 3 953.1 3 893.0 857.2 10 986.6 -55.3 -37.1 -44.8 2.2 -57.5 18.2 -7.8 -6.1 May 4 883.8 8 759.1 9 623.2 856.7 4 027.1 3 875.4 864.1 10 993.7 73.8 51.6 57.5 6.6 67.2 -22.2 5.9 -9.4 Jun 4 905.8 8 783.3 9 642.7 861.0 4 044.7 3 877.5 859.5 10 982.9 21.1 25.1 18.1 4.3 16.8 4.0 -6.9 -1.5 Jul 4 969.2 8 845.2 9 712.3 866.5 4 102.7 3 876.0 867.1 10 984.7 61.7 58.5 66.3 5.4 56.2 -3.2 7.9 -0.8 Aug 5 048.2 8 881.2 9 723.9 868.2 4 180.0 3 833.0 842.7 10 976.4 84.6 39.8 24.5 1.7 82.9 -44.9 -15.3 -0.6 Sep 5 025.7 8 870.3 9 686.0 867.2 4 158.5 3 844.6 815.7 10 950.6 -19.2 -8.5 -33.3 -1.0 -18.2 10.6 -24.8 -13.3 Oct 5 096.0 8 972.2 9 796.4 869.9 4 226.1 3 876.2 824.2 10 944.8 70.8 103.2 112.2 2.7 68.1 32.5 9.0 0.5 Nov 5 118.2 8 989.7 9 785.6 862.5 4 255.6 3 871.5 795.9 10 928.2 22.4 21.3 -6.3 -7.3 29.7 -1.1 -27.6 -12.4 Dec 5 089.0 8 969.9 9 742.0 864.3 4 224.7 3 880.9 772.1 10 863.2 -26.0 -14.8 -38.9 1.8 -27.7 11.2 -24.1 -23.3
13 Jan 5 113.3 9 003.2 9 768.9 862.1 4 251.1 3 890.0 765.7 10 835.0 28.8 40.9 53.2 -2.2 31.0 12.1 12.3 -7.0
P
1 2 3 4 5 6 7 8 9 10 11 12 13 14 15 16
1. MAIN ECONOMIC INDICATORS OF THE EURO AREA 1.13 Contribution of the MFIs resident in Spain to the euroarea’s monetary aggregates and M3 counterparts (a)
See notes at the end of the chapter.
SDDS (b) Eur billions
Consolidated balances Transactions (adjusted flows)
Contri- Contri- Contri- Contribution to the M3 counterparts Contri- Contri- Contri- Contribution to the M3 counter- bution bution bution bution bution bution parties to M1 to M2 to M3 to M1 to M2 to M3 (e) (e) (e) (e) (e) (e) Contribution to Contri- Contri- Contribution to Contri- Contri- (c) total lending (d) bution to bution (c) total lending (d) bution to bution assets to re- assets to re- less lia- maining less lia- maining General Other bilities (net) Curren- General Other bilities (net) Curren- govern- resident vis-a-vis cy govern- resident vis-a-vis cy ment sectors non-EMU ment sectors non-EMU resident in EMU residents resident in EMU residents in EMU in EMU
11 505.9 977.1 1 121.3 380.1 2 251.4 -4.6 -1 505.7 -93.4 -1.7 -4.5 1.3 25.0 -1.1 15.4 -38.0 -1.8 12 499.9 979.1 1 099.0 445.9 2 075.2 75.4 -1 497.5 -96.1 0.7 14.7 11.4 -10.7 22.2 1.8 -1.8 -1.7
11 Oct 494.2 976.7 1 115.5 346.4 2 252.3 -29.7 -1 453.5 -91.2 -2.1 -12.1 -6.8 0.7 -14.3 13.8 -6.9 -0.5 Nov 507.4 981.1 1 119.6 349.5 2 254.0 -20.5 -1 463.3 -91.6 12.9 3.9 3.5 6.5 2.6 8.5 -14.2 -0.4 Dec 505.9 977.1 1 121.3 380.1 2 251.4 -4.6 -1 505.7 -93.4 -1.7 -4.5 1.3 25.0 -1.1 15.4 -38.0 -1.8
12 Jan 493.3 963.2 1 119.0 406.3 2 229.8 0.3 -1 517.5 -91.6 -12.5 -13.7 -2.0 24.6 -20.8 5.0 -10.8 1.8 Feb 493.7 972.6 1 132.2 422.1 2 222.4 19.5 -1 531.8 -91.7 0.5 9.7 13.6 15.0 -5.8 19.7 -15.3 -0.1 Mar 500.6 977.0 1 139.3 438.7 2 231.0 41.6 -1 571.9 -92.0 6.8 4.3 3.2 13.9 9.4 22.0 -42.1 -0.2 Apr 494.6 964.4 1 121.7 433.2 2 209.5 49.3 -1 570.3 -92.4 -6.1 -12.8 -17.9 -2.6 -18.2 7.5 -4.7 -0.5 May 500.3 956.0 1 097.1 439.3 2 192.6 58.8 -1 593.6 -93.5 5.4 -9.1 -6.0 11.6 -15.6 7.9 -9.8 -1.0 Jun 520.7 965.7 1 107.6 457.9 2 193.5 71.2 -1 615.1 -94.6 20.5 9.9 10.6 17.8 2.8 12.5 -22.5 -1.1 Jul 499.5 934.0 1 063.8 448.4 2 138.9 77.3 -1 600.8 -94.8 -21.4 -32.0 -44.1 -7.8 -51.7 5.3 10.0 -0.2 Aug 495.6 926.5 1 047.1 443.2 2 114.1 80.6 -1 590.9 -94.9 -3.8 -7.2 -14.4 -5.3 -24.5 4.1 11.2 -0.1 Sep 494.0 931.7 1 061.6 454.8 2 113.1 71.7 -1 577.9 -94.7 -1.5 5.4 18.8 8.0 1.4 -10.1 19.5 0.2 Oct 494.6 945.3 1 071.1 450.6 2 094.7 71.1 -1 545.4 -94.4 0.7 13.6 10.0 -7.2 -17.4 -0.6 35.1 0.3 Nov 499.3 964.6 1 088.3 455.3 2 084.0 73.8 -1 524.7 -94.3 4.7 19.4 17.8 3.1 -9.0 2.5 21.1 0.1 Dec 499.9 979.1 1 099.0 445.9 2 075.2 75.4 -1 497.5 -96.1 0.7 14.7 11.4 -10.7 22.2 1.8 -1.8 -1.7
13 Jan 496.9 983.0 1 098.0 450.9 2 055.4 72.2 -1 480.4 -93.6 -2.8 4.3 -0.4 3.1 -17.5 -2.7 16.7 2.4
BANCO DE ESPAÑA 39 BOLETÍN ESTADÍSTICO, FEBRUARY 2013

2010 2011 2012 2013-2
-1
0
1
2
3
4
-2
-1
0
1
2
3
4%%
M3. (AVERAGE OF THE LAST THREE MONTHS). NON S.A. LENDING TO OTHER RESIDENTS SECTORS.
ANNUAL GROWTH RATES EMU’s AGGREGATES
2010 2011 2012 2013-1
0
1
2
3
4
5
-1
0
1
2
3
4
5%%
REFERENCE VALUE FOR M3. M3. (AVERAGE OF THE LAST THREE MONTHS). EMU. NON S.A. M3. (AVERAGE OF THE LAST THREE MONTHS). EMU. S.A.
ANNUAL GROWTH RATES M3 AND REFERENCE VALUE FOR M3
P
1 2 3 4 5 6 7 8 9 10 11 12 13 14 15 16 17
1. MAIN ECONOMIC INDICATORS OF THE EURO AREA 1.14 Euro area monetary aggregates and contribution ofMFIs resident in Spain to the aggregates (a)
See notes at the end of the chapter.
___________________________________________________________________________________________________________________________
Percentages
Annual growth rate of EMU’s monetary aggregates Average of (b) the last three months
of the annual
M1 M2 M3 Lending to residents (d) growth rate M1 M2 M3 Lending (d) (e) (e) (e)
EMU EMU EMU G.Gov. ORS M3 General ORS Govern-
Non s.a. Non s.a. Non. s.a. EMU EMU of which EMU ment s.a. s.a. s.a. Loans Loans Non Non sa s.a. s.a. s.a.
11 2.20 1.80 2.00 1.80 1.70 1.50 3.18 0.37 0.90 1.00 1.47 1.47 -1.86 -5.24 -1.63 17.64 -2.33 12 6.50 6.30 4.40 4.40 3.40 3.40 5.70 -0.83 -0.70 -0.70 3.67 3.70 -1.16 0.22 0.13 15.90 -5.66
11 Oct 1.90 1.90 1.90 1.90 1.30 1.40 -0.43 1.55 2.10 2.10 1.57 1.63 -2.51 -4.41 0.24 10.36 -1.29 Nov 2.00 2.30 1.90 2.10 1.40 1.50 0.35 0.85 1.60 1.60 1.47 1.53 -0.61 -4.49 -0.44 10.46 -1.69 Dec 2.20 1.80 2.00 1.80 1.70 1.50 3.18 0.37 0.90 1.00 1.47 1.47 -1.86 -5.24 -1.63 17.64 -2.33
12 Jan 2.10 2.20 2.20 2.30 1.90 2.00 4.61 0.43 0.90 0.90 1.67 1.67 -2.32 -5.14 0.64 26.22 -2.66 Feb 2.30 2.70 2.60 2.80 2.30 2.50 5.86 0.22 0.60 0.60 1.97 2.00 -2.81 -4.75 0.20 27.76 -2.08 Mar 2.90 2.90 3.10 3.00 3.00 2.90 7.75 0.12 0.20 0.20 2.40 2.47 -2.52 -5.28 -0.91 28.65 -2.31 Apr 2.20 1.90 2.50 2.50 2.30 2.30 7.84 -0.27 - - 2.53 2.57 -3.80 -5.34 -1.10 29.04 -3.61 May 3.30 3.50 2.80 2.90 2.90 2.90 9.32 -0.38 -0.20 -0.20 2.73 2.70 -1.55 -5.89 -1.88 31.31 -3.76 Jun 3.70 3.70 3.10 3.00 3.10 3.00 9.88 -0.56 -0.40 -0.40 2.77 2.73 0.04 -5.84 -2.56 31.18 -3.92 Jul 4.60 4.70 3.30 3.50 3.40 3.60 9.70 -0.95 -0.40 -0.40 3.13 3.17 -1.94 -6.92 -4.13 29.02 -5.32 Aug 5.00 5.20 3.20 3.20 2.80 2.90 8.49 -1.14 -0.60 -0.70 3.10 3.17 -1.61 -7.49 -5.45 28.67 -5.87 Sep 5.60 5.00 3.40 3.10 2.90 2.60 8.70 -1.23 -0.90 -0.90 3.03 3.03 -0.57 -5.88 -3.61 31.04 -6.01 Oct 6.10 6.50 4.20 4.30 3.80 3.90 9.22 -1.45 -0.80 -0.80 3.17 3.13 -0.00 -3.33 -2.11 28.69 -6.19 Nov 6.50 6.70 4.50 4.50 3.80 3.80 8.37 -1.55 -0.80 -0.80 3.50 3.43 -1.62 -1.73 -0.79 27.20 -6.70 Dec 6.50 6.30 4.40 4.40 3.40 3.40 5.70 -0.83 -0.70 -0.70 3.67 3.70 -1.16 0.22 0.13 15.90 -5.66
13 Jan 6.50 6.70 4.30 4.40 3.40 3.50 4.53 -1.11 -0.90 -0.90 3.53 3.57 0.78 2.10 0.27 9.61 -5.59
BANCO DE ESPAÑA 40 BOLETÍN ESTADÍSTICO, FEBRUARY 2013

2009 2010 2011 20120
1
2
3
4
5
0
1
2
3
4
5%%
MAIN REFINANCING OPERATIONSMARGINAL LENDING FACILITYDEPOSIT FACILITY3-MONTH euríbor12-MONTH euríbor10-YEAR BOND
EUROSYSTEM MONETARY POLICY OPERATIONS, MONEY MARKET AND GOVERNMENT BOND
2009 2010 2011 20120
1
2
3
4
5
6
7
8
9
0
1
2
3
4
5
6
7
8
9%%
HOUSEHOLDS: OVERNIGHT DEPOSITSHOUSEHOLDS: UP TO 1 YEAR DEPOSITSNON-FINANCIAL CORPORATIONS: OVERNIGHT DEPOSITSHOUSEHOLDS: CONSUMER CREDITHOUSEHOLDS: LENDING FOR HOUSE PURCHASENON-FINANCIAL CORPORATIONS: LOANS UP TO 1 YEAR
RETAIL BANK INTEREST RATES
M M M
1 2 3 4 5 6 7 8 9 10 11 12 13 14 15 16 17
1. MAIN ECONOMIC INDICATORS OF THE EURO AREA 1.15 Interest rates
___________________________________________________________________________________________________________________________
Percentages
Interest rates on Eurosystem Money market Monetary Financial Institutions interest rates on Government monetary policy operations interest rates (a) euro-denominated deposits and loans by euro area bond yields
residents (new business) (b)
Tenders: Refinancing Standing Deposits (c) (d) Deposits Loans operations facilities Three Ten years years To households: To
Weekly. Monthly Marginal Deposit Overnight euríbor From households From non-financial Annual percentage non-financial Main Longer lending facility (EONIA) corporations rate of charge(e) corporations term facility Three Twelve Overnight Up to Over 2 Overnight Up to Consumer House Floating rate months months 1 year years 1 year credit purchase and up to 1 year (f)
10 1.00 1.00 1.75 0.25 0.437 0.81 1.35 0.42 2.11 2.42 0.46 0.95 7.40 3.66 3.33 2.16 3.78 11 1.00 1.00 1.75 0.25 0.871 1.39 2.01 0.50 2.61 3.00 0.63 1.58 7.39 4.01 3.98 4.89 4.31 12 0.75 0.75 1.50 - 0.229 0.57 1.11 0.46 2.78 2.68 0.51 1.15 7.33 3.64 4.07 2.85 3.05
See notes at the end of the chapter
12 Feb 1.00 1.00 1.75 0.25 0.366 1.05 1.68 0.52 2.90 3.16 0.59 1.26 7.63 3.92 4.28 7.62 3.75 Mar 1.00 1.00 1.75 0.25 0.357 0.86 1.50 0.51 2.88 3.03 0.58 1.31 7.45 3.83 4.20 3.77 3.29 Apr 1.00 1.00 1.75 0.25 0.345 0.74 1.37 0.49 2.82 2.84 0.55 1.16 7.35 3.79 4.19 2.20 3.39 May 1.00 1.00 1.75 0.25 0.337 0.68 1.27 0.48 2.65 2.68 0.54 1.07 7.48 3.72 4.14 2.26 3.53 Jun 1.00 1.00 1.75 0.25 0.332 0.66 1.22 0.47 2.72 2.63 0.52 1.11 7.27 3.66 4.08 2.45 3.41 Jul 0.75 0.75 1.50 - 0.184 0.50 1.06 0.45 2.80 2.61 0.48 1.14 7.37 3.58 4.12 2.26 3.25 Aug 0.75 0.75 1.50 - 0.110 0.33 0.88 0.44 2.66 2.51 0.46 1.10 7.37 3.48 3.94 2.07 3.01 Sep 0.75 0.75 1.50 - 0.099 0.25 0.74 0.42 2.80 2.42 0.46 1.13 7.24 3.45 3.87 1.51 2.43 Oct 0.75 0.75 1.50 - 0.091 0.21 0.65 0.41 2.75 2.49 0.45 1.05 7.15 3.42 3.93 1.49 2.31 Nov 0.75 0.75 1.50 - 0.079 0.19 0.59 0.40 2.73 2.35 0.43 1.04 7.12 3.35 3.90 1.49 2.25 Dec 0.75 0.75 1.50 - 0.073 0.19 0.55 0.39 2.71 2.25 0.42 1.08 6.93 3.41 3.79 1.33 2.10
13 Jan 0.75 0.75 1.50 - 0.069 0.20 0.58 ... ... ... ... ... ... ... ... 1.31 2.40 Feb 0.75 0.75 1.50 - 0.068 0.22 0.59 ... ... ... ... ... ... ... ... 1.41 2.86
BANCO DE ESPAÑA 41 BOLETÍN ESTADÍSTICO, FEBRUARY 2013

1 2 3 4 5 6 7 8 9 10
1. MAIN ECONOMIC INDICATORS 1.16 Exchange rates (a)OF THE EURO AREA
___________________________________________________________________________________________________________________________
Period averages; Units of national currency per ecu or euro (bilateral); Index 1999 QI=100 (effective) Effective exchange rate
US Japanese Swiss Pound Swedish Danish Norwegian Canadian of the euro (EER) dollar yen franc sterling krona krone krone dollar (b) Nominal Real
07 1.371 161.3 1.643 0.684 9.25 7.45 8.02 1.469 106.2 106.5 08 1.471 152.3 1.587 0.797 9.62 7.46 8.23 1.560 109.4 108.6 09 1.394 130.3 1.510 0.891 10.62 7.45 8.73 1.585 110.6 109.2 10 1.326 116.4 1.381 0.858 9.54 7.45 8.00 1.365 103.7 101.6 11 1.392 111.0 1.233 0.868 9.03 7.45 7.79 1.376 103.4 100.7 12 1.285 102.6 1.205 0.811 8.71 7.44 7.48 1.285 97.9 95.6
See notes at the end of the chapter
11 Sep 1.377 105.8 1.201 0.872 9.13 7.45 7.72 1.379 102.8 99.9 Oct 1.371 105.1 1.230 0.870 9.11 7.44 7.75 1.398 103.0 100.2 Nov 1.356 105.0 1.231 0.857 9.14 7.44 7.79 1.390 102.6 99.9 Dec 1.318 102.5 1.228 0.844 9.02 7.43 7.75 1.348 100.8 98.1
12 Jan 1.290 99.3 1.211 0.832 8.85 7.44 7.68 1.307 98.9 96.3 Feb 1.322 103.8 1.207 0.837 8.82 7.43 7.55 1.319 99.6 97.2 Mar 1.320 108.9 1.206 0.834 8.89 7.44 7.53 1.312 99.8 97.3 Apr 1.316 107.0 1.202 0.822 8.86 7.44 7.57 1.307 99.5 97.2 May 1.279 102.0 1.201 0.804 8.99 7.43 7.57 1.292 98.0 95.7 Jun 1.253 99.3 1.201 0.806 8.87 7.43 7.54 1.287 97.2 94.9 Jul 1.229 97.1 1.201 0.788 8.55 7.44 7.46 1.246 95.3 93.2 Aug 1.240 97.6 1.201 0.789 8.28 7.45 7.32 1.231 95.2 93.2 Sep 1.286 100.5 1.209 0.798 8.49 7.45 7.39 1.258 97.2 94.9 Oct 1.297 102.5 1.210 0.807 8.61 7.46 7.41 1.280 97.8 95.5 Nov 1.283 103.9 1.205 0.804 8.61 7.46 7.34 1.279 97.2 95.3 Dec 1.312 109.7 1.209 0.812 8.65 7.46 7.35 1.298 98.7 96.6
13 Jan 1.329 118.3 1.229 0.833 8.62 7.46 7.38 1.319 100.4 98.2 Feb 1.336 124.4 1.230 0.862 8.51 7.46 7.42 1.348 101.6 ...
BANCO DE ESPAÑA 42 BOLETÍN ESTADÍSTICO, FEBRUARY 2013

BANCO DE ESPAÑA / BOLETÍN ESTADÍSTICO
NOTES TO THE TABLES OF CHAPTER 1
Table 1.1. Activity, prices and labour market
Sources: Eurostat and ECB (Monthly Bulletin, "Euro area statistics"). a. Components exclude changes in inventories. Based mainly on the ESA 95. b. Exports and imports cover goods and services and include internal cross-border trade in the euro area. c. Employment data are based on the ESA 95. Due to sample differences, the sum of quarterly data does not coincide with the annual data. Unemployment data follow the recommendations of ILO. d.ECU billion to end-1998. Table 1.2. Saving, investment and financing
Source: ECB, Monthly Bulletin, "Euro area statistics". a. Non-consolidated data. b. Including net acquisition of valuables and non produced assets. Table 1.5. Prices
Source: Eurostat. a. The year 2001 has been revised as a result of the inclusion of sales prices in the Spanish and Italian indices and of a new basket of goods and services in the Spanish index. Incorporating since January 2011 the rules of Commission Regulation (EC) Nº330/2009 on the treatment of seasonal products. b. Including alcoholic beverages and tobacco. c. Refers to the index for the period 2006. Table 1.6. General government deficit
Sources: Eurostat and ECB (Monthly Bulletin, "Euro area statistics"). a. The data correspond to ESA 95. b. Data for Estonia are not included. c. Difference between the annual change in nominal gross consolidated debt and the deficit as a percentage of GDP. Table 1.7. General government nominal gross consolidated debt
Sources: Eurostat and ECB (Monthly Bulletin, "Euro area statistics"). a. The data correspond to ESA 95. b. Data for Estonia are not included. Table 1.8. Aggregated and consolidated balance sheet and transactions (adjusted flows) of the euro area MFIs,
including the Eurosystem
Sources: ECB and in-house calculations. a. Also includes the counterpart of Central Government monetary transactions. Table 1.9. Euro area monetary aggregates and counterparts of M3. Summary
Sources: ECB and in-house calculations.
Table 1.10. Euro area monetary aggregates and counterparts of M3. Consolidated balances. Original series
Source: ECB. a. Data refer to the changing composition of the euro area. b. Incorporates the adjustments made to certain instruments (shares in money market funds, money market instruments and securities other than shares issued with a maturity of up to two years), issued by MFIs resident in the euro area, in order to deduct that part of such issues which should not be included in M3 as it is held by non-residents. These adjustments, which it was not possible to make until 2001 owing to the limitations of the statistical sources, have been introduced in two stages and have entailed modification of the time series from January 1999, inclusive, onwards. In the first stage (May 2001), that part of the series corresponding to shares in money market funds was revised and in the second stage (October 2001), the part corresponding to all other instruments. For further details see Box 1 in the November 2001 issue of the ECB Monthly Bulletin. For data as from the reference period June 2010, and henceforth, repo operations conducted through central counterparties (CCPs) are excluded from the M3 component “repurchase agreements”, and reverse repo operations conducted through CCPs are excluded from the M3 counterpart position “loans to other euro area residents”. These items are instead now included in the residual category “Net remaining”.c. Includes loans and securities.
Table 1.11. Euro area monetary aggregates and counterparts of M3.Transactions (adjusted flows). Original series
Source: ECB. a. Data refer to the changing composition of the euro area. b. See note (b) to the table 1.10.
BANCO DE ESPAÑA 43 BOLETÍN ESTADÍSTICO, FEBRUARY 2013

BANCO DE ESPAÑA / BOLETÍN ESTADÍSTICO
c. Includes loans and securities.
Table 1.12. Euro area monetary aggregates and counterparts of M3. Consolidated balance-sheet and transactions
(adjusted flows). Seasonally adjusted series
Source: ECB. a. Data refer to the changing composition of the euro area. b. For the details of the method used to calculate the seasonally adjusted series, see the ECB publication "Seasonal adjustment of monetary aggregates and HICP for the euro area", August 2000. c. See note (b) to the table 1.10.
Table 1.13. Contribution of the MFIs resident in Spain to the euro area monetary aggregates and counterparts of M3
Source: BE. a. Data refer to the changing composition of the euro area. b. This table is a requirement of the IMF in connection with the Special Data Dissemination Standard (SDDS). c. See note (b) to the table 1.10. d. Includes loans and securities. e. These aggregates exclude cash held by the public, which is included under the counterparts. Since January 2002, cash held by the public has been calculated by applying to the euro banknotes in circulation the percentage assigned by the Banco de España in accordance with Eurosystem accounting arrangements (see the footnote to the summary balance sheet at the end of this bulletin), plus coins in euro and banknotes and coins in pesetas not converted into euro, minus MFIs’ holdings of cash. Since January 2003, banknotes and coins in pesetas not converted into euro have been excluded.
Table 1.14. Euro area monetary aggregates and the contribution of MFIs resident in Spain to the aggregates
Sources: ECB and BE. a. Data refer to the changing composition of the euro area. b. Rates computed using transactions (adjusted flows). c. The contribution of MFIs resident in Spain refers to the original unadjusted series. d. Includes loans and securities. e. Rates calculated on the basis of contributions which exclude cash (see note (e) to Table 1.13).
Table 1.15. Interest rates
Source: ECB, Monthly Bulletin, "Euro area statistics", tables 1.2, 1.3, 4.5, 4.6 and 4.7. a. With the exception of the overnight rate to December 1998, monthly and yearly values are period averages. b. To December 1998, 3-year euro area yields are end-of-period values and 10-year yields are period averages. Thereafter, all yields are period averages. c. Before January 1999 synthetic euro area rates were calculated on the basis of national rates weighted by GDP. d. From January 1999, column 5 shows the euro overnight index average (EONIA); other euro area money market rates from January 1999 are euro interbank offered rates (EURIBOR). e. The annual percentage rate of charge is the weighted average rate across all maturities and equals the total cost of the loans. These total costs comprise an interest rate component and a component of other charges. f. Interest rates on loans up to EUR 1 million.
Table 1.16. Exchange rates
Source: ECB, Monthly Bulletin, "Euro area statistics", tables 8.1 and 8.2. a. To December 1998, rates for the ECU (source BIS); from January 1999, rates for the euro. b. The effective exchange rates of the euro are ECB calculated indices based on weighted averages of bilateral euro exchange rates. A positive change denotes an appreciation of the euro. Weights are based on manufactured goods trade with the main trading partners and capture third-market effects. Real rate are calculated using consumer prices (CPI). For more detailed information on the calculation of effective exchange rates, see the section 8.1 general notes in the ECB's Monthly Bulletin, which can be downloaded from the ECB’s website (www.ecb.europa.eu).
BANCO DE ESPAÑA 44 BOLETÍN ESTADÍSTICO, FEBRUARY 2013

CHAPTER 2 MAIN ECONOMIC INDICATORS

A
. G
DP
AN
D D
EM
AN
D A
GG
RE
GA
TE
S
1.1.
F
inal
con
sum
ptio
n ex
pend
iture
of h
ouse
hold
s
B
. P
RIC
ES
AN
D C
OS
TS
C
. L
AB
OU
R M
AR
KE
T
1.
Ful
l-tim
e eq
uiva
lent
jobs
____
____
____
____
____
____
____
____
____
____
____
____
____
____
____
____
____
____
____
____
____
____
____
____
____
____
____
____
____
____
____
____
____
____
____
____
____
____
____
____
____
____
____
____
____
____
2. P
RIN
CIP
AL
ES
IND
ICA
DO
RE
S E
CO
NÓ
MIC
OS
2.1
Co
nta
bili
dad
Nac
ion
al d
e E
spañ
a (a
)
B
ase
2008
(Últim
a info
rmació
n d
isponib
le p
ublic
ada p
or
el IN
E e
l 28/0
2/1
3)
Tasas d
e v
ariació
n inte
ranual
2
011
201
2
2
011
201
2
I
II
I
V
I
II
III
IV
A
. P
IB Y
AG
RE
GA
DO
S D
E L
A D
EM
AN
DA
1
. G
asto
en
cons
umo
final
(b)
..
..
..
..
..
..
..
..
..
..
.-0
,8
-2,5
-1
,0
-2,1
-2
,0
-2,3
-2
,6
-3,3
1.
Fin
al c
onsu
mpt
ion
expe
nditu
re (
b)
1.1
. G
asto
en
cons
umo
final
de
los
hoga
res
y
d
e la
s IS
FLS
H.
..
..
..
..
..
..
..
..
..
..
..
.-1
,0
-2,1
-0
,4
-2,5
-1
,3
-2,2
-2
,1
-3,0
a
nd N
PIS
Hs
1
.2.
Gas
to e
n co
nsum
o fin
al d
e la
s A
AP
P.
..
..
..
..
..
..
.-0
,5
-3,7
-2
,7
-1,1
-3
,8
-2,8
-4
,0
-4,1
1.2
. F
inal
con
sum
ptio
n ex
pend
iture
of g
ener
al g
over
nmen
t
2.
For
mac
ión
brut
a de
cap
ital f
ijo.
..
..
..
..
..
..
..
..
..
-5,3
-9
,1
-4,2
-6
,0
-7,4
-9
,2
-9,7
-1
0,3
2.
Gro
ss fi
xed
capi
tal f
orm
atio
n
2.1
. A
ctiv
os fi
jos
mat
eria
les
..
..
..
..
..
..
..
..
..
..
-5,8
-1
0,0
-4,7
-6
,6
-8,1
-1
0,0
-10,
7 -1
1,0
2.1
. T
angi
bles
fixe
d as
stes
2.1
.1.
Con
stru
cció
n.
..
..
..
..
..
..
..
..
..
..
-9,0
-1
1,5
-8,0
-8
,6
-9,5
-1
1,6
-12,
4 -1
2,3
2.
1.1.
C
onst
ruct
ion
2.1
.2.
Bie
nes
de e
quip
o y
activ
os c
ultiv
ados
..
..
..
..
..
2,3
-6,6
3,
5 -1
,7
-5,1
-6
,4
-7,0
-7
,9
2.1
.2.
Equ
ipm
ent a
nd c
ultiv
ated
ass
ets
2
.2.
Act
ivos
fijo
s in
mat
eria
les
..
..
..
..
..
..
..
..
..
.3,
1 2,
6 4,
9 2,
0 3,
4 2,
7 4,
8 -0
,5
2
.2.
Inta
ngib
le fi
xed
asse
ts
3.
Var
iaci
ón d
e ex
iste
ncia
s (c
).
..
..
..
..
..
..
..
..
..
.-0
,1
0,1
-0,1
-0
,1
0,0
0,0
0,1
0,1
3.
Cha
nge
in in
vent
orie
s (c
)
4.
DE
MA
ND
A N
AC
ION
AL
(1 +
2 +
3)
(d)
..
..
..
..
..
..
..
..
-1,9
-3
,9
-1,8
-3
,1
-3,1
-3
,7
-4,0
-4
,7
4
. D
OM
ES
TIC
DE
MA
ND
(1
+ 2
+ 3
) (d
)
5.
Exp
orta
cion
es d
e bi
enes
y s
ervi
cios
..
..
..
..
..
..
..
..
.7,
6 3,
1 7,
6 5,
8 2,
1 2,
7 4,
2 3,
2
5
. E
xpor
ts o
f goo
ds a
nd s
ervi
ces
5
.1.
Exp
orta
cion
es d
e bi
enes
..
..
..
..
..
..
..
..
..
.8,
5 2,
9 8,
4 4,
2 2,
1 2,
9 3,
6 3,
0
5
.1.
Exp
orts
of g
oods
5
.2.
Exp
orta
cion
es d
e se
rvic
ios
..
..
..
..
..
..
..
..
..
5,8
3,4
5,9
9,4
1,9
2,2
5,6
3,6
5.2
. E
xpor
ts o
f ser
vice
s
D
el c
ual:
Con
sum
o de
no
resi
dent
es e
n el
terr
itorio
eco
nóm
ico
..
.6,
4 -1
,1
5,9
5,8
-0,7
-1
,9
1,1
-2,9
O
f whi
ch: C
onsu
mpt
ion
of n
on-r
esid
ents
in th
e ec
onom
ic te
rrito
ry
6.
Impo
rtac
ione
s de
bie
nes
y se
rvic
ios
..
..
..
..
..
..
..
..
.-0
,9
-5,0
-1
,2
-4,9
-5
,9
-5,2
-3
,4
-5,4
6.
Impo
rts
of g
oods
and
ser
vice
s
6.1
. Im
port
acio
nes
de b
iene
s.
..
..
..
..
..
..
..
..
..
-0,7
-5
,5
-1,9
-5
,8
-6,0
-6
,3
-3,7
-6
,1
6
.1.
Impo
rts
of g
oods
6
.2.
Impo
rtac
ione
s de
ser
vici
os.
..
..
..
..
..
..
..
..
.-1
,4
-3,0
1,
3 -2
,0
-5,5
-1
,2
-2,3
-3
,1
6
.2.
Impo
rts
of s
ervi
ces
Del
cua
l: C
onsu
mo
de r
esid
ente
s en
el r
esto
del
mun
do.
..
..
.-4
,5
-7,4
-5
,1
-4,3
-8
,7
-2,5
-8
,7
-9,7
O
f whi
ch: C
onsu
mpt
ion
of r
esid
ents
in th
e re
st o
f the
wor
ld
7
. P
IB A
PR
EC
IOS
DE
ME
RC
AD
O (
4 +
5 -
6)
..
..
..
..
..
..
.0,
4 -1
,4
0,6
-0,0
-0
,7
-1,4
-1
,6
-1,9
7.
GD
P A
T M
AR
KE
T P
RIC
ES
(4
+ 5
- 6
)
B
. P
RE
CIO
S Y
CO
ST
ES
1
. D
efla
ctor
del
con
sum
o fin
al d
e lo
s ho
gare
s y
de la
s IS
FLS
H.
..
..
.2,
9 2,
6 2,
6 2,
6 2,
4 2,
5 2,
6 3,
1
1
. D
efla
tor
of fi
nal c
onsu
mpt
ion
of h
ouse
hold
s an
d N
PIS
Hs
2
. D
efla
ctor
del
PIB
..
..
..
..
..
..
..
..
..
..
..
..
.1,
0 0,
3 0,
8 0,
8 0,
3 0,
1 0,
6 0,
1
2
. G
DP
def
lato
r
3.
Rem
uner
ació
n po
r as
alar
iado
..
..
..
..
..
..
..
..
..
..
0,7
-0,3
0,
7 1,
4 1,
4 0,
2 0,
1 -3
,0
3
. C
ompe
nsat
ion
per
empl
oyee
4
. C
oste
s la
bora
les
unita
rios
..
..
..
..
..
..
..
..
..
..
.-1
,4
-3,4
-1
,6
-1,5
-1
,6
-3,1
-2
,9
-5,8
4.
Uni
t lab
our
cost
s
C
. M
ER
CA
DO
DE
TR
AB
AJO
1
. P
uest
os d
e tr
abaj
o eq
uiva
lent
es a
tiem
po c
ompl
eto
1
.1.
Ocu
pado
s.
..
..
..
..
..
..
..
..
..
..
..
..
.-1
,7
-4,4
-1
,6
-2,9
-3
,7
-4,7
-4
,6
-4,7
1.1
. E
mpl
oym
ent
1.1
.1. A
sala
riado
s.
..
..
..
..
..
..
..
..
..
..
.-1
,5
-5,1
-1
,4
-2,6
-4
,2
-5,2
-5
,6
-5,6
1
.1.1
. E
mpl
oyee
s
1
.1.2
. Aut
ónom
os.
..
..
..
..
..
..
..
..
..
..
.-3
,0
0,1
-3,0
-4
,2
-0,9
-1
,1
1,4
1,0
1
.1.2
. S
elf-
empl
oyed
(Late
st re
leased IN
E info
rmation a
s a
t 2
8/0
2/1
3)
Annual perc
enta
ge c
hanges
2.1
Nat
ion
al A
cco
un
ts o
f S
pai
n (
a)2.
MA
IN E
CO
NO
MIC
IND
ICA
TO
RS
Bas
e ye
ar 2
008
BANCO DE ESPAÑA 46 BOLETÍN ESTADÍSTICO, FEBRUARY 2013

M
emo
ran
du
m it
ems:
A. G
DP
at
curr
ent
mar
ket
pri
ces
(e)
____
____
____
____
____
____
____
____
____
____
____
____
____
____
____
____
____
____
____
____
____
____
____
____
____
____
____
____
____
____
____
____
____
____
____
____
____
____
____
____
____
____
____
____
____
____
and its
com
ponents
, obta
ined b
y a
pply
ing c
ert
ain
sta
tistical filters
to the o
rigin
al series. S
easonally
- and w
ork
ing-d
ay-a
dju
ste
d s
eries.
na
les
y de
cal
enda
rio, e
n la
que
que
se
ha e
limin
ado
el c
ompo
nent
e es
taci
onal
y s
e ha
aju
stad
o el
núm
ero
de d
ías
labo
rabl
es. /
IN
E p
ublis
hes, in
the fra
mew
ork
of
ES
A 9
5, and in b
ase y
ear
2008 t
erm
s,
not
only
its
origin
al data
, but
als
o a
quart
erly s
eries o
f G
DP
(
e) E
l IN
E p
ublic
a en
el m
arco
del
SE
C 9
5, e
n la
Bas
e 20
08, a
dem
ás d
e la
ser
ie d
e da
tos
brut
os, u
na s
erie
trim
estr
al d
el P
IB y
sus
com
pone
ntes
, res
ulta
do d
e la
apl
icac
ión
a lo
s da
tos
brut
os d
e de
term
inad
os fi
ltros
est
adís
ticos
, Ser
ie c
orre
gida
de
efec
tos
esta
cio-
(
d) D
eman
da d
e lo
s re
side
ntes
den
tro
y fu
era
del t
errit
orio
eco
nóm
ico.
/ R
esid
ents
’ de
mand w
ithin
and o
uts
ide the e
conom
ic terr
itory
.
(
c) A
port
ació
n al
cre
cim
ient
o de
l PIB
. / C
ontr
ibution to G
DP
gro
wth
rate
.
/ F
inal con
sum
ption e
xpenditure
may take p
lace o
n the d
om
estic terr
itory
or
abro
ad
(E
SA
95, 3.7
5),
It th
ere
fore
inclu
des r
esid
ents
’ consum
ption a
bro
ad, w
hic
h is s
ub
seq
ue
ntly d
educte
d in I
mport
s o
f goods a
nd s
erv
ices.
(
b) E
l gas
to e
n co
nsum
o fin
al p
uede
rea
lizar
se e
n el
terr
itorio
eco
nóm
ico
o en
el r
esto
del
mun
do (
SE
C 9
5, 3
.75)
. Lue
go in
cluy
e el
con
sum
o de
los
resi
dent
es e
n el
res
to d
el m
undo
, que
, pos
terio
rmen
te, s
e de
duce
en
la r
úbric
a Im
port
acio
nes
de b
iene
s y
serv
icio
s.
o
therw
ise, th
e s
eries a
re s
easonally
- and w
ork
ing-d
ay-a
dju
ste
d d
ata
(see N
ote
e).
(
a) S
erie
s of
icia
les
de la
CN
E e
labo
rada
s se
gún
el S
EC
95.
Sal
vo in
dica
ción
en
cont
rario
, ser
ies
corr
egid
as d
e ef
ecto
s es
taci
onal
es y
de
cale
ndar
io (
véas
e no
ta e
). /
Off
icia
l N
ational A
ccounts
of
Spain
(C
NE
) series,
com
pile
d a
ccord
ing t
o E
SA
95.
Unle
ss indic
ate
d
Fue
nte:
INE
./ S
ourc
e: IN
E.
2. P
RIN
CIP
AL
ES
IND
ICA
DO
RE
S E
CO
NÓ
MIC
OS
2.1
Co
nta
bili
dad
Nac
ion
al d
e E
spañ
a (c
on
t.)
(a)
Bas
e 20
08
(Últim
a info
rmació
n d
isponib
le p
ublic
ada p
or
el IN
E e
l 28/0
2/1
3)
Mill
ones d
e e
uro
s
201
1
2
012
201
1
2
012
III
IV
I
II
I
II
I
V
Pro
mem
ori
a:
A. P
IB p
m a
pre
cio
s co
rrie
nte
s (e
)
A
.1
Ser
ie c
orre
gida
de
efec
tos
esta
cion
ales
y c
alen
dario
..
..
..
1 06
3 35
5 1
051
204
266
282
265
782
263
846
262
979
263
421
260
958
A.1
S
easo
nally
- an
d w
orki
ng-d
ay-a
djus
ted
serie
s
A
.2
Ser
ie d
e da
tos
brut
os.
..
..
..
..
..
..
..
..
..
1 06
3 35
5 1
051
204
255
367
275
032
258
806
269
857
252
884
269
657
A.2
O
rigin
al d
ata
serie
s
(Late
st re
leased IN
E info
rmation a
s a
t 28/0
2/1
3)
EU
R m
illio
ns
2.1
Nat
ion
al A
cco
un
ts o
f S
pai
n (
con
t’d
) (a
)2.
MA
IN E
CO
NO
MIC
IND
ICA
TO
RS
Bas
e ye
ar 2
008
BANCO DE ESPAÑA 47 BOLETÍN ESTADÍSTICO, FEBRUARY 2013

3
. T
axes
on
pro
du
ctio
n a
nd
imp
ort
s to
th
e re
st
1
1.
Acq
uis
itio
ns
less
sal
es o
f n
on
-fin
anci
al
1
3.
Net
len
din
g (
+)
or
net
bo
rro
win
g (
-) o
f th
e
1
4.
Net
len
din
g (
+)
or
net
bo
rro
win
g (
-) o
f th
e
G
DP
for
the four
quart
ers
of th
e y
ear
in q
uestion is n
ot availa
ble
, usin
g the a
nnual G
DP
obta
ined b
y a
ggre
gating the q
uart
erly G
DP
fig
ure
s for
the last fo
ur
quart
ers
.
ref
eren
cia
el P
IB a
nual
que
res
ulta
de
agre
gar
el P
IB tr
imes
tral
de
los
últim
os c
uatr
o tr
imes
tres
. / T
he q
uart
erly p
erc
enta
ges a
re c
alc
ule
d: 1)
When the G
DP
for
the four
qu
art
ers
of
the y
ear
in q
uestion is a
vaila
ble
, usin
g t
he G
DP
for
the y
ear;
2)
when t
he
(c)
Los
por
cent
ajes
de
los
trim
estr
es s
e ca
lcul
an: 1
) C
uand
o se
dis
pone
del
PIB
de
los
cuat
ro tr
imes
tres
del
año
en
cues
tión
se to
ma
com
o re
fere
ncia
el P
IB d
el a
ño; 2
) C
uand
o no
se
disp
one
del P
IB d
e lo
s cu
atro
trim
estr
es d
el a
ño e
n cu
estió
n se
tom
a co
mo
/ Fin
al consum
ption e
xpenditure
may take p
lace o
n the d
om
estic terr
itory
or
abro
ad (
ES
A 9
5, 3.7
5),
It th
ere
fore
inclu
des r
esid
ents
’ consum
ption a
bro
ad, w
hic
h is s
ubse
qu
en
tly d
educte
d in I
mport
s o
f goods a
nd s
erv
ices.
(b)
El g
asto
en
cons
umo
final
pue
de r
ealiz
arse
en
el te
rrito
rio e
conó
mic
o o
en e
l res
to d
el m
undo
(S
EC
95,
3.7
5). L
uego
incl
uye
el c
onsu
mo
de lo
s re
side
ntes
en
el r
esto
del
mun
do, q
ue, p
oste
riorm
ente
, se
dedu
ce e
n la
rúb
rica
Impo
rtac
ione
s de
bie
nes
y se
rvic
ios.
m
acro
ecom
ic a
ggre
gate
s O
rigin
al data
series.
(a)
Ser
ies
ofic
iale
s se
gún
SE
C 9
5 (B
ase
2008
), C
uent
a de
l Res
to d
el m
undo
y a
greg
ados
mac
roec
onóm
icos
. Ser
ies
de d
atos
bru
tos.
/ O
ffic
ial N
ational A
ccounts
of S
pain
series c
om
pile
d a
ccord
ing t
o E
SA
95 (
Base 2
008),
rest
of
the w
orld a
ccount
and
Fue
nte:
INE
. / S
ourc
e: IN
E
____
____
____
____
____
____
____
____
____
____
____
____
____
____
____
____
____
____
____
____
____
____
____
____
____
____
____
____
____
____
____
____
____
____
____
____
____
____
____
____
____
____
____
____
____
____
2. P
RIN
CIP
AL
ES
IND
ICA
DO
RE
S E
CO
NO
MIC
OS
2.2
Eco
no
mía
nac
ion
al (
con
solid
ada)
. Cu
enta
de
op
erac
ion
es n
o f
inan
cier
as (
a)
Bas
e 20
08
(Últim
a info
rmació
n d
isponib
le p
ublic
ada p
or
el IN
E e
l 28/0
2/1
3)
Mill
ones d
e e
uro
s
2010
2011
2011
III
2011
IV
20
12 I
2012
II
20
12 II
I
20
12 IV
1
. P
IB a
pre
cio
s d
e m
erca
do
..
..
..
..
..
1 04
8 88
31
063
355
255
367
275
032
258
806
269
857
252
884
269
657
1.
GD
P a
t m
arke
t p
rice
s
2
. R
emu
ner
ació
n d
e as
alar
iad
os
..
..
..
..
-39
-135
-4-2
6-
-10
14-4
2.
Co
mp
ensa
tio
n o
f em
plo
yees
Del
res
to d
el m
undo
..
..
..
..
..
..
.1
496
1 40
334
234
339
039
841
735
9
F
rom
the
rest
of t
he w
orld
Al r
esto
del
mun
do (
-).
..
..
..
..
..
.-1
535
-1 5
38-3
46-3
69-3
90-4
08-4
03-3
63
T
o th
e re
st o
f the
wor
ld (
-)
3
. Im
pu
esto
s so
bre
la p
rod
ucc
ión
y la
s im
po
rta-
c
ion
es a
l res
to d
el m
un
do
(-)
..
..
..
..
.-2
304
-3 5
25-6
38-1
496
-1 0
45-6
68-6
63-3
88
o
f th
e w
orl
d (
-)
4
. S
ub
ven
cio
nes
del
res
to d
el m
un
do
..
..
..
6 13
86
124
201
4 81
947
549
724
14
941
4.
Su
bsi
die
s fr
om
th
e re
st o
f th
e w
orl
d
5
. R
enta
s d
e la
pro
pie
dad
..
..
..
..
..
.-1
7 12
0-2
3 91
9-7
143
-6 3
72-6
017
-3 6
05-3
345
-1 9
80
5.
P
rop
erty
inco
me
D
el r
esto
del
mun
do.
..
..
..
..
..
..
45 6
8542
785
9 69
212
348
8 38
910
665
8 28
410
014
Fro
m th
e re
st o
f the
wor
ld
Al r
esto
del
mun
do (
-).
..
..
..
..
..
..
-62
805
-66
704
-16
835
-18
720
-14
406
-14
270
-11
629
-11
994
To
the
rest
of t
he w
orld
(-)
6
. T
ran
sfer
enci
as c
orr
ien
tes
..
..
..
..
..
-9 7
06-9
471
-2 2
81-1
833
-3 9
22-1
658
-1 6
57-8
32
6.
C
urr
ent
tran
sfer
s
Del
res
to d
el m
undo
..
..
..
..
..
..
.12
587
13 4
503
301
4 18
72
714
3 05
23
355
3 87
4
F
rom
the
rest
of t
he w
orld
A
l res
to d
el m
undo
(-)
..
..
..
..
..
..
.-2
2 29
3-2
2 92
1-5
582
-6 0
20-6
636
-4 7
10-5
012
-4 7
06
T
o th
e re
st o
f the
wor
ld (
-)
7
. R
enta
nac
ion
al d
isp
on
ible
(1
a 6)
..
..
..
.1
025
852
1 03
2 42
924
5 50
227
0 12
424
8 29
726
4 41
324
7 47
427
1 39
4
7.
N
atio
nal
dis
po
sab
le in
com
e (1
to
6)
8
. G
asto
en
co
nsu
mo
fin
al (
-)(b
).
..
..
..
.-8
32 6
16-8
42 7
33-1
99 4
60-2
22 3
98-2
10 9
61-2
09 1
21-1
97 8
30-2
16 1
78
8.
F
inal
co
nsu
mp
tio
n e
xpen
dit
ure
(-)
(b)
9
. A
ho
rro
nac
ion
al b
ruto
(7
+ 8
)..
..
..
..
.19
3 23
618
9 69
646
042
47 7
2637
336
55 2
9249
644
55 2
16
9.
G
ross
nat
ion
al s
avin
g (
7 +
8)
1
0.
Tra
nsf
eren
cias
de
cap
ital
..
..
..
..
..
6 25
55
781
1 40
71
696
641
1 71
61
465
2 82
6
10.
C
apit
al t
ran
sfer
s
D
el r
esto
del
mun
do.
..
..
..
..
..
..
6 97
56
502
1 56
31
971
778
1 88
21
637
2 99
3
F
rom
the
rest
of t
he w
orld
Al r
esto
del
mun
do (
-).
..
..
..
..
..
.-7
20-7
21-1
56-2
75-1
37-1
66-1
72-1
67
T
o th
e re
st o
f the
wor
ld (
-)
1
1.
Ad
qu
isic
ion
es m
eno
s ce
sio
nes
de
acti
vos
no
fin
anci
ero
s n
o p
rod
uci
do
s.
..
..
..
..
133
-366
-166
-315
-73
-51
-24
61
n
on
-pro
du
ced
ass
ets
1
2.
Fo
rmac
ión
bru
ta d
e ca
pit
al (
-).
..
..
..
.-2
39 2
66-2
29 0
54-5
3 35
8-5
5 27
8-5
2 31
8-5
8 24
3-4
7 25
0-4
8 60
3
12.
G
ross
cap
ital
fo
rmat
ion
(-)
1
3.
Cap
acid
ad (
+)
o n
eces
idad
(-)
de
fin
anci
ació
n
d
e la
nac
ión
(9
a 12
)..
..
..
..
..
..
.-3
9 64
2-3
3 94
3-6
075
-6 1
71-1
4 41
4-1
286
3 83
59
500
nat
ion
(9
to 1
2)
1
4.
Cap
acid
ad (
+)
o n
eces
idad
(-)
de
fin
anci
ació
n
d
e la
nac
ión
en
% d
el P
IBp
m (
13/1
)*10
0 (c
).
.-3
,78
-3,1
9-0
,57
-0,5
8-1
,37
-0,1
20,
360,
90
n
atio
n a
s %
of
GD
Pm
p (
13/1
)*10
0 (c
)
(Late
st re
leased IN
E Info
rmation a
s a
t 28/0
2/1
3)
EU
R m
illio
ns
2.2
To
tal e
con
om
y (c
on
solid
ated
). N
on
-fin
anci
al t
ran
sact
ion
s ac
cou
nt
(a)
2. M
AIN
EC
ON
OM
IC IN
DIC
AT
OR
S
B
ase
year
200
8
BANCO DE ESPAÑA 48 BOLETÍN ESTADÍSTICO, FEBRUARY 2013

I.
NE
T L
EN
DIN
G (
+)
OR
NE
T B
OR
RO
WIN
G (
-)
4.
Tax
es n
et o
f sub
sidi
es o
n pr
oduc
tion
8.
Adj
ustm
ent f
or th
e ch
ange
in n
et e
quity
4.
Tax
es n
et o
f sub
sidi
es o
n pr
oduc
tion
8.
Fin
al c
onsu
mpt
ion
expe
nditu
re/A
ctua
l
9.
Adj
ustm
ent f
or th
e ch
ange
in n
et e
quity
11.
Acq
uisi
tions
less
sal
es o
f non
-fin
anci
al
____
____
____
____
____
____
____
____
____
____
____
____
____
____
____
____
____
____
____
____
____
____
____
____
____
____
____
____
____
____
____
____
____
____
____
____
____
____
____
____
____
____
____
____
____
____
2. P
RIN
CIP
AL
ES
IND
ICA
DO
RE
S E
CO
NÓ
MIC
OS
2.3
Eco
no
mía
nac
ion
al. C
uen
tas
corr
ien
tes
y d
e ca
pit
al
Det
alle
po
r se
cto
res
inst
itu
cio
nal
es. (
Pri
mer
a p
arte
)
Bas
e 20
08
Perí
odo d
e r
efe
rencia
: 2011 (
Últim
a info
rmació
n d
isponib
le p
ublic
ada p
or
el IN
E e
l 2/1
0/1
2)
Mill
ones d
e e
uro
s
Eco
nom
ía
Ins
tituc
io-
A
dmin
is-
S
ocie
dade
s
Hog
ares
e
Ope
ra-
Ope
raci
ones
E
cono
mía
Res
to
n
acio
nal
nes
fina
n-
tr
acio
nes
n
o fin
an-
ins
titu-
cio
nes
en
tre
naci
onal
del
Tot
al
(n
o co
n-
ci
eras
/
públ
icas
/ c
iera
s/N
on
c
ione
s
n
o
sec
tore
s
(c
onso
-
m
undo
/
solid
ada)
/ F
inancia
l G
enera
l
fin
ancia
l
sin
fine
s
sect
o-
res
iden
tes/
lid
ada)
/ R
est of
N
ational
institu
-
g
overn
ment
c
orp
ora
-
d
e lu
cro/
riz
adas
/
Tra
nsac-
N
ation
al
the
(S
.1+
S.2
) econom
y
tions
(
S.1
3)
tions
Household
s U
nsecto
- tions
e
co
no
my
w
orld
(
non-c
on-
(S
.12)
(S
.11)
a
nd n
on-
rised
betw
een
(
consoli-
(S
.2)
solid
ate
d)
p
rofit
tr
ansac-
re
sid
ent
d
ate
d)
(
S.1
)
in
stitu
- tions
secto
rs
(
S.1
*)
tio
ns
S
.14,1
5)
1
2
3
4
5
6
7
8
9
10
I.
CA
PA
CID
AD
(+
) /N
EC
ES
IDA
D (
-) D
E
FIN
AN
CIA
CIÓ
N (
II -
III)
..
..
..
..
..
..
..
..
.-3
3 94
3 21
636
-1
00 4
40
18 8
51
26 0
10
-
-
-33
943
33 9
43
-
II
. R
EC
UR
SO
S.
..
..
..
..
..
..
..
..
..
..
.3
744
404
222
043
546
045
1 53
7 19
8 1
352
074
87 0
44
841
246
2 90
3 15
8 41
3 03
4 4
157
438
II.
RE
SO
UR
CE
S
1.
Pro
ducc
ión
de b
iene
s y
serv
icio
s.
..
..
..
..
..
2 23
9 52
1 63
680
20
7 03
0 1
477
034
404
732
87 0
44
-
2 23
9 52
1 -
2
239
521
1.
Pro
duct
ion
of g
oods
and
ser
vice
s
2.
Im
port
acio
nes
de b
iene
s y
serv
icio
s..
..
..
..
..
-
-
-
-
-
-
-
-
330
251
330
251
2.
Impo
rts
of g
oods
and
ser
vice
s
3.
R
emun
erac
ión
de a
sala
riado
s.
..
..
..
..
..
.50
8 48
5 -
-
-
50
8 48
5 -
-
50
8 48
5 1
538
510
023
3.
Com
pens
atio
n of
em
ploy
ees
4.
Impu
esto
s ne
tos
de s
ubve
ncio
nes
sobr
e pr
oduc
ción
e im
port
acio
nes
..
..
..
..
..
93 1
36
-
93 1
36
-
-
-
-
93 1
36
-2 5
99
90 5
37
and
impo
rts
5.
Ren
tas
de la
pro
pied
ad.
..
..
..
..
..
..
..
224
103
125
484
10 5
82
35 1
81
52 8
56
-
181
318
42 7
85
66 7
04
290
807
5.
Pro
pert
y in
com
e
6.
T
rans
fere
ncia
s co
rrie
ntes
..
..
..
..
..
..
..
534
244
28 3
29
250
524
13 4
50
241
941
-
520
794
13 4
50
22 9
21
557
165
6.
Cur
rent
tran
sfer
s
7.
T
rans
fere
ncia
s so
cial
es e
n es
peci
e.
..
..
..
..
.13
8 99
9 -
-
-
13
8 99
9 -
13
8 99
9 -
-
13
8 99
9
7
. S
ocia
l tra
nsfe
rs in
kin
d
8.
A
just
e po
r la
var
iaci
ón d
e la
par
ticip
ació
n ne
ta
de
los
hoga
res
en lo
s fo
ndos
de
pens
ione
s.
..
..
.13
6 -
-
-
13
6 -
13
6 -
-
13
6
o
f hou
seho
lds
in p
ensi
on fu
nd r
eser
ves
9.
Tra
nsfe
renc
ias
de c
apita
l a c
obra
r.
..
..
..
..
.24
798
12
431
-6
52
7 22
5 5
794
-
18 2
96
6 50
2 72
1 25
519
9.
C
apita
l tra
nsfe
rs r
ecei
vabl
e
10.
T
rans
fere
ncia
s de
cap
ital a
pag
ar (
-).
..
..
..
..
-19
017
-7 8
81
-14
575
4 30
8 -8
69
-
-18
296
-721
-6
502
-2
5 51
9
10
. C
apita
l tra
nsfe
rs p
ayab
le (
-)
III
. E
MP
LE
OS
..
..
..
..
..
..
..
..
..
..
..
.3
778
347
200
407
646
485
1 51
8 34
7 1
326
064
87 0
44
841
246
2 93
7 10
1 37
9 09
1 4
157
438
I
II.
US
ES
1.
Con
sum
os in
term
edio
s.
..
..
..
..
..
..
..
1 17
6 16
6 24
254
62
216
93
9 91
2 14
9 78
3 -
-
1
176
166
-
1 17
6 16
6
1
. In
term
edia
te c
onsu
mpt
ion
2.
Exp
orta
cion
es d
e bi
enes
y s
ervi
cios
..
..
..
..
.-
-
-
-
-
-
-
-
32
1 81
9 32
1 81
9
2
. E
xpor
ts o
f goo
ds a
nd s
ervi
ces
3.
Rem
uner
ació
n de
asa
laria
dos
..
..
..
..
..
..
508
620
21 8
31
123
550
311
896
51 3
43
-
-
508
620
1 40
3 51
0 02
3
3
. C
ompe
nsat
ion
of e
mpl
oyee
s
4.
Im
pues
tos
neto
s de
sub
venc
ione
s so
bre
prod
ucci
ón e
impo
rtac
ione
s.
..
..
..
..
..
..
90 5
37
414
280
2 87
6 -7
7 87
044
-
90
537
-
90
537
an
d im
port
s
5.
R
enta
s de
la p
ropi
edad
..
..
..
..
..
..
..
.24
8 02
2 11
1 91
7 26
130
88
944
21
031
-
18
1 31
8 66
704
42
785
29
0 80
7
5
. P
rope
rty
inco
me
6.
Tra
nsfe
renc
ias
corr
ient
es.
..
..
..
..
..
..
.54
3 71
5 32
655
18
1 56
6 40
152
28
9 34
2 -
52
0 79
4 22
921
13
450
55
7 16
5
6
. C
urre
nt tr
ansf
ers
7.
Tra
nsfe
renc
ias
soci
ales
en
espe
cie
..
..
..
..
..
138
999
-
128
933
-
10 0
66
-
138
999
-
-
138
999
7.
Soc
ial t
rans
fers
in k
ind
8.
Gas
to e
n co
nsum
o fin
al/C
onsu
mo
final
efec
tivo
..
..
..
..
..
..
..
..
..
..
..
842
733
-
93 7
88
-
748
945
-
-
842
733
-
842
733
fin
al c
onsu
mpt
ion
9
. A
just
e po
r la
var
iaci
ón d
e la
par
ticip
ació
n ne
ta
d
e lo
s ho
gare
s en
los
fond
os d
e pe
nsio
nes
..
..
..
136
136
-
-
-
-
136
-
-
136
of h
ouse
hold
s in
pen
sion
fund
res
erve
s
10.
F
orm
ació
n br
uta
de c
apita
l fijo
..
..
..
..
..
..
223
963
9 20
0 30
696
12
9 24
6 54
821
-
-
22
3 96
3 -
22
3 96
3
10
. G
ross
fixe
d ca
pita
l for
mat
ion
1
1.
Adq
uisi
cion
es m
enos
ces
ione
s de
act
ivos
no
fin
anci
eros
no
prod
ucid
os.
..
..
..
..
..
..
366
-
-674
46
4 57
6 -
-
36
6 -3
66
-
non-
prod
uced
ass
ets
1
2.
Var
.exi
sten
cias
y a
dq. n
etas
de
obje
tos
valio
sos
..
..
5 09
1 -
-
4
857
234
-
-
5 09
1 -
5
091
12.
Cha
nges
in in
vent
orie
s an
d ne
t acq
. of v
alua
bles
Refe
rence p
erio
d: 2011 (
Info
rmation o
f th
e IN
E a
s a
t 2/1
0/1
2)
EU
R m
illio
ns
2.3
To
tal E
con
om
y. C
urr
ent
and
cap
ital
acc
ou
nts
2. M
AIN
EC
ON
OM
IC IN
DIC
AT
OR
S
b
y in
stit
uti
on
al s
ecto
r
B
ase
year
200
8
BANCO DE ESPAÑA 49 BOLETÍN ESTADÍSTICO, FEBRUARY 2013

I
V.
BA
LA
NC
ING
ITE
MS
2.
G
ener
atio
n of
inco
me
acco
unt:
Gro
ss
3.
A
lloca
tion
of p
rimar
y in
com
e ac
coun
t:
GN
I/Gro
ss b
alan
ce o
f prim
ary
inco
me
4.
S
econ
dary
dis
trib
utio
n of
inco
me
acco
unt:
5.
R
edis
trib
utio
n of
inco
me
in k
ind
acco
unt:
6.
A
ccou
nts
of g
oods
and
ser
vice
s, a
nd c
urre
nt
tran
sact
ions
of t
he r
est o
f the
wor
ld:
6.
1.
Ext
erna
l bal
ance
of g
oods
6.
2.
Cur
rent
ext
erna
l bal
ance
7.
U
se o
f inc
ome
acco
unt:
GN
S/G
ross
8.
A
cqui
sitio
n of
non
-fin
anci
al a
sset
s ac
coun
t:
Net
lend
ing
(+)
or n
et b
orro
win
g (-
)
____
____
____
____
____
____
____
____
____
____
____
____
____
____
____
____
____
____
____
____
____
____
____
____
____
____
____
____
____
____
____
____
____
____
____
____
____
____
____
____
____
____
____
____
____
____
Fue
nte:
INE
, IG
AE
y e
stim
ació
n B
E. /
Sou
rce:
INE
, IG
AE
and
BE
est
imat
es.
2. P
RIN
CIP
AL
ES
IND
ICA
DO
RE
S E
CO
NÓ
MIC
OS
2.3
Eco
no
mía
nac
ion
al. C
uen
tas
corr
ien
tes
y d
e ca
pit
al
Det
alle
po
r se
cto
res
inst
itu
cio
nal
es. (
Co
nti
nu
ació
n)
B
ase
2008
Perí
odo d
e r
efe
rencia
: 2011 (
Últim
a info
rmació
n d
isponib
le p
ublic
ada p
or
el IN
E e
l 2/1
0/1
2)
Mill
ones d
e e
uro
s
Eco
nom
ía
Ins
tituc
io-
A
dmin
is-
S
ocie
dade
s
Hog
ares
e
Ope
ra-
Ope
raci
ones
E
cono
mía
Res
to
n
acio
nal
nes
fina
n-
tr
acio
nes
n
o fin
an-
ins
titu-
cio
nes
en
tre
naci
onal
del
Tot
al
(n
o co
n-
ci
eras
/
Púb
licas
/ c
iera
s/N
on
c
ione
s
n
o
sec
tore
s
(c
onso
-
m
undo
/
solid
ada)
/ F
inancia
l G
enera
l
fin
ancia
l
sin
fine
s
sect
o-
res
iden
tes/
lid
ada)
/ R
est o
f
National
in
stitu
-
g
overn
ment
c
orp
ora
-
d
e lu
cro/
riz
adas
/
Tra
nsac-
N
ational
the
(S
.1+
S.2
) econom
y
tions
(
S.1
3)
tions
Household
s U
nsecto
- tions
e
conom
y
w
orld
(
non-c
on-
(S
.12)
(S
.11)
a
nd n
on-
rised
betw
een
(
consoli-
(S
.2)
solid
ate
d)
p
rofit
tr
ansac-
re
sid
ent
d
ate
d)
(
S.1
)
in
stitu
- tions
secto
rs
(
S.1
*)
tio
ns
S
.14,1
5)
1
2
3
4
5
6
7
8
9
10
IV.
SA
LD
OS
CO
NT
AB
LE
S
1.
Cue
nta
de p
rodu
cció
n: P
IB/V
alor
aña
dido
bru
to.
..
.1
063
355
39 4
26
144
814
537
122
254
949
87 0
44
-
1 06
3 35
5 -
-
1
. P
rodu
ctio
n ac
coun
t: G
DP
/Gro
ss v
alue
add
ed
2
. C
uent
a de
exp
lota
ción
: Exc
eden
te b
ruto
de
expl
otac
ión
y r
enta
mix
ta b
ruta
..
..
..
..
..
464
198
17 1
81
20 9
84
222
350
203
683
-
-
464
198
-
-
ope
ratin
g su
rplu
s an
d m
ixed
inco
me
3.
Cue
nta
de a
sign
ació
n de
la r
enta
prim
aria
: Ren
ta
N
acio
nal B
ruta
(R
NB
)/sa
ldo
de r
enta
s pr
imar
ias
bru
to.
..
..
..
..
..
..
..
..
..
..
..
1 04
1 90
0 30
748
98
572
16
8 58
7 74
3 99
3 -
-
1
041
900
-
-
4.
Cue
nta
de d
istr
ibuc
ión
secu
ndar
ia d
e la
Ren
ta:
RN
DB
/Ren
ta d
ispo
nibl
e br
uta
..
..
..
..
..
..
1 03
2 42
9 26
422
16
7 53
0 14
1 88
5 69
6 59
2 -
-
1
032
429
-
-
GN
DI/G
ross
dis
posa
ble
inco
me
5.
Cue
nta
de r
edis
trib
ució
n de
la r
enta
en
espe
cie:
RN
DA
B/R
enta
dis
poni
ble
ajus
tada
bru
ta.
..
..
..
1 03
2 42
9 26
422
38
597
14
1 88
5 82
5 52
5 -
-
1
032
429
-
-
GN
AD
I/Gro
ss a
djus
ted
disp
osab
le in
com
e
6
. C
uent
a de
bie
nes
y se
rvic
ios,
y d
e op
erac
ione
s
c
orrie
ntes
del
res
to d
el m
undo
:
6
.1. S
aldo
de
inte
rcam
bios
ext
erio
res
de
bie
nes
y se
rvic
ios
..
..
..
..
..
..
..
.-
-
-
-
-
-
-
-
8
432
-
a
nd s
ervi
ces
6.2
. Sal
do d
e op
erac
ione
s co
rrie
ntes
con
e
l ext
erio
r.
..
..
..
..
..
..
..
..
.-
-
-
-
-
-
-
-
39
358
-
7
. C
uent
a de
util
izac
ión
de la
ren
ta d
ispo
nibl
e:
A
NB
/Aho
rro
brut
o.
..
..
..
..
..
..
..
..
189
696
26 2
86
-55
191
141
885
76 7
16
-
-
189
696
-
-
sav
ing
8.
Cue
nta
de a
dqui
sici
ones
de
activ
os n
o fin
an-
cie
ros:
cap
acid
ad (
+)/
nece
sida
d (-
) de
fina
n-
c
iaci
ón
..
..
..
..
..
..
..
..
..
.-3
3 94
3 21
636
-1
00 4
40
18 8
51
26 0
10
-
-
-33
943
33 9
43
-
Refe
rence p
erio
d: 2011 (
Info
rmation o
f th
e IN
E a
s a
t 2/1
0/1
2)
EU
R m
illio
ns
2.3
To
tal E
con
om
y. C
urr
ent
and
cap
ital
acc
ou
nts
2. M
AIN
EC
ON
OM
IC IN
DIC
AT
OR
S
b
y in
stit
uti
on
al s
ecto
r (C
on
tin
ued
)
B
ase
year
200
8
BANCO DE ESPAÑA 50 BOLETÍN ESTADÍSTICO, FEBRUARY 2013

____
____
____
____
____
____
____
____
____
____
____
____
____
____
____
____
____
____
____
____
____
____
____
____
____
____
____
____
____
____
____
____
____
____
____
____
____
____
____
____
____
____
____
____
____
____
2. P
RIN
CIP
AL
ES
IND
ICA
DO
RE
S E
CO
NÓ
MIC
OS
2.4
Cu
enta
s d
e o
per
acio
nes
fin
anci
eras
. Det
alle
po
r se
cto
res
inst
itu
cio
nal
es
Perí
odo d
e r
efe
rencia
: 2012-I
II (
Últim
a info
rmació
n d
isponib
le p
ublic
ada e
n 2
1/0
1/2
013)
Mill
ones d
e e
uro
s
T
OT
AL
In
stitu
cion
es A
dmin
istr
acio
-
Soc
ieda
des
Hog
ares
e in
s- O
pera
cion
es
T
OT
AL
R
ES
TO
DE
L
EC
ON
OM
ÍA
fin
anci
eras
n
es p
úblic
as
no
finan
cie-
titu
cion
es s
in e
ntre
sec
tore
s
EC
ON
OM
ÍA
MU
ND
O
Tot
al/
(
no c
onso
li-
(
S.1
2)/
(S
.13)
/
ras
(S
.11)
/ fi
nes
de lu
cro
res
iden
tes/
(
cons
olid
ada)
(S
.2)/
T
ota
l
dad
a) (
S.1
)/
Fin
ancia
l
Genera
l go-
N
on-f
inancia
l
(S.1
4/5)
/ T
ransactions
(
S.1
*)/
R
ES
T O
F
T
OT
AL
institu
tions
v
ern
ment
corp
ora
tions
H
ousehold
s
betw
een r
esi-
T
OT
AL
T
HE
WO
RLD
E
CO
NO
MY
(S
.12)
(S
.13)
(S
.11)
a
nd n
on-p
rofit
dents
secto
rs E
CO
NO
MY
(S
.2)
(non-c
onsoli-
in
stitu
tions
(
consolid
ate
d)
date
d)
(S.1
)
(
S.1
4/5
)
(S
.1*)
1=
2a5
2
3
4
5
6
7
=1-
6
8
9
=1+
8
I.A
DQ
UIS
ICIO
NE
S N
ET
AS
DE
AC
TIV
OS
FIN
AN
CIE
RO
S (
F)
-178
110
-1
45 9
20
-6 0
90
-5 0
13
-21
087
-138
536
-3
9 57
4 -4
2 82
0 -2
20 9
30
I. N
ET
AC
QU
ISIT
ION
OF
FIN
AN
CIA
L A
SS
ET
S (
F)
1. O
ro m
onet
ario
y D
EG
(F
.1).
..
..
..
..
..
..
3 3
- -
- -
3 -3
-
1. M
onet
ary
gold
and
SD
Rs
(F.1
)
2.
Efe
ctiv
o y
depó
sito
s (F
.2)
..
..
..
..
..
..
.-8
8 82
5 -6
7 37
8 -1
152
-7
278
-1
3 01
7 -7
6 69
8 -1
2 12
7 -5
0 98
3 -1
39 8
08
2
. Cur
renc
y an
d de
posi
ts (
F.2
)
2.1.
Efe
ctiv
o (F
.21)
..
..
..
..
..
..
..
..
-1 9
29
-231
-
-262
-1
437
-1
10
-1 8
20
- -1
929
2
.1. C
urre
ncy
(F.2
1)
2.2.
Dep
ósito
s tr
ansf
erib
les
(F.2
2).
..
..
..
..
.-2
8 38
6 -2
867
-8
506
-7
222
-9
791
-2
8 38
6 -
-510
-2
8 89
6
2.2.
Tra
nsfe
rabl
e de
posi
ts (
F.2
2)
2.3.
Otr
os d
epós
itos
(F.2
9).
..
..
..
..
..
..
-58
510
-64
280
7 35
3 20
6 -1
790
-4
8 20
3 -1
0 30
8 -5
0 47
3 -1
08 9
83
2.3
. Oth
er d
epos
its (
F.2
9)
3.
Val
ores
dis
tinto
s de
acc
ione
s (F
.3)
..
..
..
..
.-2
7 08
2 -2
3 27
8 -2
62
5 77
5 -9
316
-1
5 33
0 -1
1 75
2 2
915
-24
167
3. S
ecur
ities
oth
er th
an s
hare
s (F
.3)
3.
1. V
alor
es a
cor
to p
lazo
(F
.331
).
..
..
..
..
.1
082
-918
44
1 56
7 99
2 1
082
- 4
348
5 43
0
3.1.
Sho
rt te
rm (
F.3
31)
3.
2. V
alor
es a
larg
o pl
azo
(F.3
32)
..
..
..
..
..
-29
706
-21
397
-696
2
695
-10
308
-16
691
-13
015
-5 6
50
-35
356
3.
2. L
ong
term
(F
.332
)
3.3.
Der
ivad
os fi
nanc
iero
s (F
.32)
..
..
..
..
..
1 54
3 -9
63
-7
2 51
3 -
279
1 26
3 4
217
5 75
9
3.3.
Fin
anci
al d
eriv
ativ
es (
F.3
4)
4.
Pré
stam
os (
F.4
).
..
..
..
..
..
..
..
..
-40
183
-50
665
548
9 93
4 -
-30
635
-9 5
48
-2 1
92
-42
375
4. L
oans
(F
.4)
5. A
ccio
nes
y ot
ras
part
icip
acio
nes
(F.5
).
..
..
..
.-6
574
67
3 33
-4
488
-2
792
-5
833
-7
41
8 71
0 2
137
5. S
hare
s an
d ot
her
equi
ty (
F.5
)
5.1.
Acc
ione
s (F
.511
/2).
..
..
..
..
..
..
..
-2 3
23
2 23
4 7
-4 2
59
-305
-1
363
-9
60
4 34
3 2
020
5.
1. S
hare
s (F
.511
/2)
5.
2. O
tras
par
ticip
acio
nes
(exc
. fon
dos)
(F
.513
).
..
.-1
022
-1
245
9
212
1 -1
242
21
9 4
370
3 34
7
5.2.
Oth
er e
quity
(ex
clud
ing
mut
ual f
unds
) (F
.513
)
5.3.
Par
ticip
ac. e
n fo
ndos
de
inve
rsió
n (F
.52)
..
..
.-3
228
-3
16
- -4
41
-2 4
88
-3 2
28
- -3
-3
230
5
.3. M
utua
l fun
ds s
hare
s (F
.52)
6. R
eser
vas
técn
icas
de
segu
ros
(F.6
).
..
..
..
..
161
-18
- -9
88
1 16
7 70
91
-2
40
-79
6. In
sura
nce
tech
nica
l res
erve
s (F
.6)
7. O
tras
cue
ntas
pen
dien
tes
de c
obro
(F
.7).
..
..
..
-15
611
-5 2
57
-5 2
57
-7 9
68
2 87
2 -1
0 11
0 -5
501
-1
028
-1
6 63
9
7.
Oth
er a
ccou
nts
rece
ivab
le (
F.7
)
TO
TA
L (
=I=
II+III
).
..
..
..
..
..
..
..
..
..
-178
110
-1
45 9
20
-6 0
90
-5 0
13
-21
087
-138
536
-3
9 57
4 -4
2 82
0 -2
20 9
30
TO
TA
L (
=I=
II+III
)
II.
OP
ER
AC
ION
ES
FIN
AN
CIE
RA
S N
ET
AS
(=
I-III
) (B
.9)
..
3 24
3 13
177
-2
0 16
9 17
500
-7
265
-
3 24
3 -3
243
-
II.
NE
T F
INA
NC
IAL
TR
AN
SA
CT
ION
S (
=I-
III)
(B.9
)
III.
PA
SIV
OS
NE
TO
S C
ON
TR
AÍD
OS
(F
)..
..
..
..
.-1
81 3
53
-159
097
14
079
-2
2 51
3 -1
3 82
2 -1
38 5
36
-42
817
-39
577
-220
930
II
I.NE
T IN
CU
RR
EN
CE
OF
LIA
BIL
ITIE
S (
F)
1. E
fect
ivo
y de
pósi
tos
(F.2
).
..
..
..
..
..
..
-127
681
-1
27 7
07
26
- -
-76
698
-50
983
-12
127
-139
808
1. C
urre
ncy
and
depo
sits
(F
.2)
1.
1. E
fect
ivo
(F.2
1).
..
..
..
..
..
..
..
.-1
10
-136
26
-
- -1
10
- -1
820
-1
929
1
.1. C
urre
ncy
(F.2
1)
1.2.
Dep
ósito
s tr
ansf
erib
les
(F.2
2).
..
..
..
..
.-2
8 89
6 -2
8 89
6 -
- -
-28
386
-510
-
-28
896
1.
2. T
rans
fera
ble
depo
sits
(F
.22)
1.
3. O
tros
dep
ósito
s (F
.29)
..
..
..
..
..
..
.-9
8 67
5 -9
8 67
5 -
- -
-48
203
-50
473
-10
308
-108
983
1
.3. O
ther
dep
osits
(F
.29)
2. V
alor
es d
istin
tos
de a
ccio
nes
(F.3
).
..
..
..
..
-12
415
-27
426
15 4
26
-415
-
-15
330
2 91
5 -1
1 75
2 -2
4 16
7
2.
Sec
uriti
es o
ther
than
sha
res
(F.3
)
2.1.
Val
ores
a c
orto
pla
zo (
F.3
31)
..
..
..
..
..
5 43
0 -1
994
7
709
-286
-
1 08
2 4
348
- 5
430
2.
1. S
hort
term
(F
.331
)
2.2.
Val
ores
a la
rgo
plaz
o (F
.332
).
..
..
..
..
.-2
2 34
1 -2
9 95
7 7
717
-101
-
-16
691
-5 6
50
-13
015
-35
356
2.
2. L
ong
term
(F
.332
)
2.3.
Der
ivad
os fi
nanc
iero
s (F
.32)
..
..
..
..
..
4 49
6 4
525
- -2
9 -
279
4 21
7 1
263
5 75
9
2.3.
Fin
anci
al d
eriv
ativ
es (
F.3
4)
3.
Pré
stam
os (
F.4
).
..
..
..
..
..
..
..
..
-32
827
-3 3
28
-2 0
91
-13
715
-13
694
-30
635
-2 1
92
-9 5
48
-42
375
3. L
oans
(F
.4)
4. A
ccio
nes
y ot
ras
part
icip
acio
nes
(F.5
).
..
..
..
.2
877
-1 3
82
- 4
259
- -5
833
8
710
-741
2
137
4. S
hare
s an
d ot
her
equi
ty (
F.5
)
4.1.
Acc
ione
s (F
.511
/2).
..
..
..
..
..
..
..
2 98
0 3
170
- -1
90
- -1
363
4
343
-960
2
020
4.
1. S
hare
s (F
.511
/2)
4.
2. O
tras
par
ticip
acio
nes
(exc
. fon
dos)
(F
.513
).
..
.3
128
-1 3
21
- 4
449
- -1
242
4
370
219
3 34
7
4.2.
Oth
er e
quity
(ex
clud
ing
mut
ual f
unds
) (F
.513
)
4.3.
Par
ticip
ac. e
n fo
ndos
de
inve
rsió
n (F
.52)
..
..
.-3
230
-3
230
-
- -
-3 2
28
-3
- -3
230
4
.3. M
utua
l fun
ds s
hare
s (F
.52)
5. R
eser
vas
técn
icas
de
segu
ros
(F.6
).
..
..
..
..
-169
-1
69
- -
- 70
-
91
-79
5. In
sura
nce
tech
nica
l res
erve
s (F
.6)
6. O
tras
cue
ntas
pen
dien
tes
de p
ago
(F.7
).
..
..
..
-11
138
915
717
-12
642
-128
-1
0 11
0 -1
028
-5
501
-1
6 63
9
6.
Oth
er a
ccou
nts
paya
ble
(F.7
)
Re
fere
nce p
eriod: 20
12 Q
3 (
Info
rmation
made a
vaila
ble
on 2
1/0
1/2
013)
EU
R m
illio
ns
2.4
Fin
anci
al t
ran
sact
ion
s ac
cou
nt.
Det
ail b
y in
stit
uti
on
al s
ecto
r2.
MA
IN E
CO
NO
MIC
IND
ICA
TO
RS
BANCO DE ESPAÑA 51 BOLETÍN ESTADÍSTICO, FEBRUARY 2013

____
____
____
____
____
____
____
____
____
____
____
____
____
____
____
____
____
____
____
____
____
____
____
____
____
____
____
____
____
____
____
____
____
____
____
____
____
____
____
____
____
____
____
____
____
____
2. P
RIN
CIP
AL
ES
IND
ICA
DO
RE
S E
CO
NÓ
MIC
OS
2.5
Bal
ance
s fi
nan
cier
os.
Det
alle
po
r se
cto
res
inst
itu
cio
nal
es
Perí
odo d
e r
efe
rencia
: 2012-I
II (
Últim
a info
rmació
n d
isponib
le p
ublic
ada e
n 2
1/0
1/2
013)
Mill
ones d
e e
uro
s
T
OT
AL
In
stitu
cion
es A
dmin
istr
acio
-
Soc
ieda
des
Hog
ares
e in
s- O
pera
cion
es
T
OT
AL
R
ES
TO
DE
L
EC
ON
OM
ÍA
fin
anci
eras
n
es p
úblic
as
no
finan
cie-
titu
cion
es s
in e
ntre
sec
tore
s
EC
ON
OM
ÍA
MU
ND
O
Tot
al/
(
no c
onso
li-
(
S.1
2)/
(S
.13)
/
ras
(S
.11)
/ fi
nes
de lu
cro
res
iden
tes/
(
cons
olid
ada)
(S
.2)/
T
ota
l
dad
a) (
S.1
)/
Fin
ancia
l
Genera
l go-
N
on-f
inancia
l
(S.1
4/5)
/ T
ransactions
(
S.1
*)/
RE
ST
OF
TO
TA
L
institu
tions
v
ern
ment
corp
ora
tions
H
ousehold
s
betw
een r
esi-
T
OT
AL
T
HE
WO
RLD
E
CO
NO
MY
(S
.12)
(S
.13)
(S
.11)
a
nd n
on-p
rofit
dents
secto
rs E
CO
NO
MY
(S
.2)
(non
-consoli-
in
stitu
tions
(
consolid
ate
d)
date
d)
(S.1
)
(
S.1
4/5
)
(S
.1*)
1=
2a5
2
3
4
5
6
7
=1-
6
8
9
=1+
8
I.
AC
TIV
OS
FIN
AN
CIE
RO
S (
AF
).
..
..
..
..
..
..
9 15
2 69
5 5
125
751
441
789
1 94
2 13
4 1
643
022
7 79
2 81
2 1
359
884
2 29
1 43
0 11
444
125
I.
OU
TS
TA
ND
ING
FIN
AN
CIA
L A
SS
ET
S (
AF
)
1. O
ro m
onet
ario
y D
EG
(A
F.1
).
..
..
..
..
..
..
15 6
65
15 6
65
- -
- -
15 6
65
-15
665
-
1.
Mon
etar
y go
ld a
nd S
DR
s (A
F.1
)
2.
Efe
ctiv
o y
depó
sito
s (A
F.2
)..
..
..
..
..
..
..
2 55
3 07
3 1
403
203
81 9
81
229
726
838
163
2 28
0 93
7 27
2 13
5 73
9 77
0 3
292
842
2. C
urre
ncy
and
depo
sits
(A
F.2
)
2.1.
Efe
ctiv
o (A
F.2
1).
..
..
..
..
..
..
..
..
104
186
6 62
3 -
5 59
3 91
969
10
1 13
7 3
048
- 10
4 18
6
2.1.
Cur
renc
y (A
F.2
1)
2.2.
Dep
ósito
s tr
ansf
erib
les
(AF
.22)
..
..
..
..
..
506
462
68 6
14
30 7
33
101
341
305
775
506
462
- 11
341
51
7 80
4
2.2.
Tra
nsfe
rabl
e de
posi
ts (
AF
.22)
2.
3. O
tros
dep
ósito
s (A
F.2
9).
..
..
..
..
..
..
1 94
2 42
5 1
327
966
51 2
48
122
793
440
418
1 67
3 33
8 26
9 08
7 72
8 42
8 2
670
853
2.
3. O
ther
dep
osits
(A
F.2
9)
3.
Val
ores
dis
tinto
s de
acc
ione
s (A
F.3
)..
..
..
..
..
1 45
2 64
4 1
243
810
76 1
33
72 0
30
60 6
70
1 19
6 77
0 25
5 87
3 57
8 51
3 2
031
156
3. S
ecur
ities
oth
er th
an s
hare
s (A
F.3
)
3.1.
Val
ores
a c
orto
pla
zo (
AF
.331
).
..
..
..
..
.11
0 85
2 62
660
7
379
23 2
49
17 5
64
110
852
- 26
542
13
7 39
4
3.1.
Sho
rt te
rm (
AF
.331
)
3.2.
Val
ores
a la
rgo
plaz
o (A
F.3
32)
..
..
..
..
..
1 31
0 63
0 1
149
444
68 7
54
49 3
25
43 1
06
1 07
5 60
0 23
5 02
9 52
6 14
3 1
836
773
3.
2. L
ong
term
(A
F.3
32)
3.
3. D
eriv
ados
fina
ncie
ros
(AF
.32)
..
..
..
..
..
.31
162
31
706
-
-544
-
10 3
18
20 8
44
25 8
28
56 9
90
3.3
. Fin
anci
al d
eriv
ativ
es (
AF
.34)
4. P
rést
amos
(A
F.4
).
..
..
..
..
..
..
..
..
.2
343
423
1 97
6 10
3 98
193
26
9 12
6 -
2 13
8 04
0 20
5 38
3 39
6 11
0 2
739
532
4. L
oans
(A
F.4
)
5.
Acc
ione
s y
otra
s pa
rtic
ipac
ione
s (A
F.5
).
..
..
..
.1
736
859
379
323
106
127
834
519
416
891
1 18
5 58
4 55
1 27
5 53
9 89
1 2
276
751
5. S
hare
s an
d ot
her
equi
ty (
AF
.5)
5.
1. A
ccio
nes
(AF
.511
/2)
..
..
..
..
..
..
..
.1
067
095
353
692
11 8
98
463
675
237
830
652
975
414
120
300
493
1 36
7 58
8
5.1.
Sha
res
(AF
.511
/2)
5.
2. O
tras
par
ticip
acio
nes
(exc
. fon
dos)
(A
F.5
13)
..
..
517
069
10 0
12
93 9
48
347
104
66 0
05
379
914
137
155
237
301
754
371
5.
2. O
ther
equ
ity (
excl
udin
g m
utua
l fun
ds)
(AF
.513
)
5.3.
Par
ticip
ac. e
n fo
ndos
de
inve
rsió
n (A
F.5
2).
..
..
152
695
15 6
19
- 23
740
11
3 05
5 15
2 69
5 -
2 09
7 15
4 79
2
5.3.
Mut
ual f
unds
sha
res
(AF
.52)
6. R
eser
vas
técn
icas
de
segu
ros
(AF
.6)
..
..
..
..
.31
1 00
5 16
906
-
31 0
63
263
037
305
791
5 21
5 4
560
315
566
6. In
sura
nce
tech
nica
l res
erve
s (A
F.6
)
7.
Otr
as c
uent
as p
endi
ente
s de
cob
ro (
AF
.7)
..
..
..
.74
0 02
7 90
740
79
355
50
5 66
9 64
262
68
5 68
9 54
337
48
251
78
8 27
8
7.
Oth
er a
ccou
nts
rece
ivab
le (
AF
.7)
TO
TA
L (
=I=
II+III
).
..
..
..
..
..
..
..
..
..
.9
152
695
5 12
5 75
1 44
1 78
9 1
942
134
1 64
3 02
2 7
792
812
1 35
9 88
4 2
291
430
11 4
44 1
25
TO
TA
L (
=I=
II+III
)
II.
AC
TIV
OS
FIN
AN
CIE
RO
S N
ET
OS
(=
I-III
) (B
F.9
0).
..
..
-947
212
15
4 50
3 -5
73 7
03
-1 2
61 2
53
733
241
- -9
47 2
12
947
212
-
II. N
ET
FIN
AN
CIA
L A
SS
ET
S (
=I-
III)
(BF
.90)
III.
PA
SIV
OS
(A
F)
..
..
..
..
..
..
..
..
..
..
10 0
99 9
07
4 97
1 24
7 1
015
492
3 20
3 38
6 90
9 78
1 7
792
812
2 30
7 09
5 1
344
218
11 4
44 1
25
III.O
UT
ST
AN
DIN
G L
IAB
ILIT
IES
(A
F)
1. E
fect
ivo
y de
pósi
tos
(AF
.2).
..
..
..
..
..
..
.3
020
707
3 01
7 01
7 3
690
- -
2 28
0 93
7 73
9 77
0 27
2 13
5 3
292
842
1. C
urre
ncy
and
depo
sits
(A
F.2
)
1.1.
Efe
ctiv
o (A
F.2
1).
..
..
..
..
..
..
..
..
101
137
97 4
47
3 69
0 -
- 10
1 13
7 -
3 04
8 10
4 18
6
1.1.
Cur
renc
y (A
F.2
1)
1.2.
Dep
ósito
s tr
ansf
erib
les
(AF
.22)
..
..
..
..
..
517
804
517
804
- -
- 50
6 46
2 11
341
-
517
804
1.
2. T
rans
fera
ble
depo
sits
(A
F.2
2)
1.3.
Otr
os d
epós
itos
(AF
.29)
..
..
..
..
..
..
.2
401
766
2 40
1 76
6 -
- -
1 67
3 33
8 72
8 42
8 26
9 08
7 2
670
853
1.
3. O
ther
dep
osits
(A
F.2
9)
2.
Val
ores
dis
tinto
s de
acc
ione
s (A
F.3
)..
..
..
..
..
1 77
5 28
3 1
056
106
696
167
23 0
10
- 1
196
770
578
513
255
873
2 03
1 15
6
2.
Sec
uriti
es o
ther
than
sha
res
(AF
.3)
2.
1. V
alor
es a
cor
to p
lazo
(A
F.3
31)
..
..
..
..
..
137
394
50 1
28
86 2
60
1 00
6 -
110
852
26 5
42
- 13
7 39
4
2.1.
Sho
rt te
rm (
AF
.331
)
2.2.
Val
ores
a la
rgo
plaz
o (A
F.3
32)
..
..
..
..
..
1 60
1 74
3 97
7 86
9 60
9 90
7 13
967
-
1 07
5 60
0 52
6 14
3 23
5 02
9 1
836
773
2.
2. L
ong
term
(A
F.3
32)
2.
3. D
eriv
ados
fina
ncie
ros
(AF
.32)
..
..
..
..
..
.36
146
28
109
-
8 03
7 -
10 3
18
25 8
28
20 8
44
56 9
90
2.3
. Fin
anci
al d
eriv
ativ
es (
AF
.34)
3. P
rést
amos
(A
F.4
).
..
..
..
..
..
..
..
..
.2
534
150
104
729
210
011
1 37
5 46
5 84
3 94
6 2
138
040
396
110
205
383
2 73
9 53
2
3.
Loa
ns (
AF
.4)
4. A
ccio
nes
y ot
ras
part
icip
acio
nes
(AF
.5)
..
..
..
..
1 72
5 47
5 42
9 02
6 -
1 29
6 45
0 -
1 18
5 58
4 53
9 89
1 55
1 27
5 2
276
751
4. S
hare
s an
d ot
her
equi
ty (
AF
.5)
4.
1. A
ccio
nes
(AF
.511
/2)
..
..
..
..
..
..
..
.95
3 46
8 22
8 13
3 -
725
335
- 65
2 97
5 30
0 49
3 41
4 12
0 1
367
588
4.
1. S
hare
s (A
F.5
11/2
)
4.2.
Otr
as p
artic
ipac
ione
s (e
xc. f
ondo
s) (
AF
.513
).
..
.61
7 21
6 46
101
-
571
115
- 37
9 91
4 23
7 30
1 13
7 15
5 75
4 37
1
4.2.
Oth
er e
quity
(ex
clud
ing
mut
ual f
unds
) (A
F.5
13)
4.
3. P
artic
ipac
. en
fond
os d
e in
vers
ión
(AF
.52)
..
..
.15
4 79
2 15
4 79
2 -
- -
152
695
2 09
7 -
154
792
4.
3. M
utua
l fun
ds s
hare
s (A
F.5
2)
5.
Res
erva
s té
cnic
as d
e se
guro
s (A
F.6
).
..
..
..
..
310
351
310
351
- -
- 30
5 79
1 -
5 21
5 31
5 56
6
5.
Insu
ranc
e te
chni
cal r
eser
ves
(AF
.6)
6. O
tras
cue
ntas
pen
dien
tes
de p
ago
(AF
.7)
..
..
..
.73
3 94
1 54
019
10
5 62
5 50
8 46
1 65
836
68
5 68
9 48
251
54
337
78
8 27
8
6.
Oth
er a
ccou
nts
paya
ble
(AF
.7)
Re
fere
nce p
eriod: 20
12 Q
3 (
Info
rmation
made a
vaila
ble
on 2
1/0
1/2
013)
EU
R m
illio
ns
2.5
Fin
anci
al b
alan
ce s
hee
ts. D
etai
l by
inst
itu
tio
nal
sec
tor
2. M
AIN
EC
ON
OM
IC IN
DIC
AT
OR
S
BANCO DE ESPAÑA 52 BOLETÍN ESTADÍSTICO, FEBRUARY 2013

A. B
AL
AN
CE
OF
PA
YM
EN
TS
(net
cha
nge
in li
abili
ties-
net c
hang
e in
ass
ets)
B. I
NT
ER
NA
TIO
NA
L IN
VE
ST
ME
NT
PO
SIT
ION
____
____
____
____
____
____
____
____
____
____
____
____
____
____
____
____
____
____
____
____
____
____
____
____
____
____
____
____
____
____
____
____
____
____
____
____
____
____
____
____
____
____
____
____
____
____
2. P
RIN
CIP
AL
ES
IND
ICA
DO
RE
S E
CO
NÓ
MIC
OS
2
.6
Bal
anza
de
Pag
os
y P
osi
ció
n d
e In
vers
ión
Inte
rnac
ion
al
Mill
ones d
e e
uro
s
Ser
ie e
ncu
adro
yco
lum
na/
Tim
e S
erie
sin
Tab
le
20
10
20
11
20
11 II
I
20
11 IV
2012
I
20
12 II
2012
III
and
Col
umn
A. B
AL
AN
ZA
DE
PA
GO
S
A
.1. C
uen
ta c
orr
ien
te (
I - P
) .
..
..
..
..
..
.17
.1/1
-47
427
-37
497
-5 7
25-7
201
-15
027
-2 6
821
934
A.1
. Cu
rren
t ac
cou
nt
(Rec
eip
ts-P
aym
ents
)
1
.1. B
alan
za c
omer
cial
.
..
..
..
..
..
.17
.1/2
-47
779
-39
727
-10
055
-8 7
29-9
111
-6 6
34-6
508
1.1
. Tra
de b
alan
ce
1.2
. Ser
vici
os
..
..
..
..
..
..
..
17.1
/327
514
34 2
4013
098
7 39
35
268
9 95
815
167
1.2
. Ser
vice
s
1
.3. R
enta
s
.
..
..
..
..
..
..
.17
.1/4
-19
849
-26
106
-7 4
87-6
801
-6 7
03-4
646
-4 3
22
1
.3. I
ncom
e
1
.4. T
rans
fere
ncia
s
..
..
..
..
..
..
.17
.1/5
-7 3
13-5
904
-1 2
8093
5-4
481
-1 3
61-2
404
1.4
. Tra
nsfe
rs
A
.2. C
uen
ta d
e ca
pit
al (
I - P
).
..
..
..
..
..
.17
.1/6
6 28
95
488
1 26
71
314
684
1 72
71
508
A.2
. Cap
ital
acc
ou
nt
(Rec
eip
ts-P
aym
ents
)
CU
EN
TA
CO
RR
IEN
TE
MÁ
S C
UE
NT
A D
E C
AP
ITA
L .
..
17.1
/7-4
1 13
8-3
2 00
9-4
457
-5 8
87-1
4 34
2-9
553
442
C
UR
RE
NT
AN
D C
AP
ITA
L A
CC
OU
NT
A
.3. C
uen
ta f
inan
cier
a (V
NP
- V
NA
) .
..
..
..
.17
.1/8
43 1
7435
760
8 25
810
212
10 6
583
879
-4 1
78
A
.3. F
inan
cial
acc
ou
nt
3.1
. Tot
al, e
xcep
to B
anco
de
Esp
aña
.
..
..
.17
.1/1
027
478
-73
393
-30
764
-65
087
-94
915
-127
339
-911
3.1
. Tot
al e
xclu
ding
Ban
co d
e E
spañ
a
3.1.
1. In
vers
ione
s di
rect
as
..
..
..
..
17.2
/71
827
-5 5
962
163
3 27
37
708
-3 2
171
325
3
.1.1
. Dire
ct in
vest
men
t
3.1.
2. In
vers
ione
s de
car
tera
..
..
..
..
17.2
/827
671
-23
076
-14
603
-11
420
-37
179
-45
499
6 61
4
3.1
.2. P
ortfo
lio in
vest
men
t
3.1.
3. O
tras
inve
rsio
nes
.
..
..
..
..
17.2
/9-1
0 61
0-4
4 88
0-1
7 35
2-5
7 36
9-6
8 19
0-7
8 49
3-1
2 42
3
3.1
.3. O
ther
inve
stm
ent
3.1.
4. D
eriv
ados
fina
ncie
ros
..
..
..
..
17.2
/10
8 58
915
9-9
7143
02
747
-130
3 57
3
3.1
.4. F
inan
cial
der
ivat
ives
3.2
. Ban
co d
e E
spañ
a
.
..
..
..
.17
.1/9
15 6
9610
9 15
339
022
75 2
9910
5 57
213
1 21
8-3
268
3.2
. Ban
co d
e E
spañ
a
3.
2.1.
Res
erva
s
.
..
..
..
..
.17
.2/1
1-8
14-1
0 01
0-1
598
-7 7
84-2
12-3
896
1 89
0
3.2
.1. R
eser
ves
3.
2.2.
Act
ivos
fren
te a
l Eur
osis
tem
a .
..
..
17.2
/12
9 78
812
4 05
643
260
86 3
5810
1 05
513
2 38
6-8
279
3
.2.2
. Cla
ims
with
the
Eur
osys
tem
3.2.
3. O
tros
act
ivos
net
os
..
..
..
..
17.2
/13
6 72
2-4
893
-2 6
40-3
275
4 73
02
727
3 12
2
3.2
.3. O
ther
net
ass
ets
A
.4. E
rro
res
y o
mis
ion
es n
eto
s .
..
..
..
..
..
17.1
/11
-2 0
36-3
751
-3 8
01-4
326
3 68
5-2
923
737
A
.4. N
et e
rro
rs a
nd
om
issi
on
s
CU
EN
TA
FIN
AN
CIE
RA
MÁ
S E
RR
OR
ES
Y O
MIS
ION
ES
.
-41
138
32 0
094
457
5 88
714
343
955
-3 4
42 F
INA
NC
IAL
AC
CO
UN
T A
ND
ER
RO
RS
AN
D O
MIS
SIO
NS
P
RO
ME
MO
RIA
: % P
IB d
e A
.1 +
A.2
..
..
..
..
.-
-3,9
-3,0
-1,7
-2,1
-5,5
-0,4
1,4
M
EM
OR
AN
DU
M IT
EM
: % o
f GD
P o
f A
.1 +
A.2
B. P
OS
ICIÓ
N D
E IN
VE
RS
IÓN
INT
ER
NA
CIO
NA
L
B
.1. P
osi
ció
n t
ota
l net
a
..
..
..
..
..
.17
.21/
1-9
32 0
06-9
76 5
51-9
79 3
32-9
76 5
51-9
67 3
65-9
57 6
23-9
55 6
67
B
.1. T
ota
l net
po
siti
on
1
.1. B
anco
de
Esp
aña
.
..
..
..
..
..
.17
.21/
1330
312
-80
960
-5 1
76-8
0 96
0-1
84 8
16-3
14 8
89-3
09 2
99
1.1.
Ban
co d
e E
spañ
a
1
.2. R
esto
sec
tore
s
.
..
..
..
..
..
.17
.21/
2-9
62 3
18-8
95 5
92-9
74 1
57-8
95 5
92-7
82 5
49-6
42 7
34-6
46 3
68
1.2.
Oth
er s
ecto
rs
EU
R m
illio
ns
2.6
Bal
ance
of
Pay
men
ts a
nd
Inte
rnat
ion
al In
vest
men
t P
osi
tio
n2.
MA
IN E
CO
NO
MIC
IND
ICA
TO
RS
BANCO DE ESPAÑA 53 BOLETÍN ESTADÍSTICO, FEBRUARY 2013

2004 2005 2006 2007 2008 2009 2010 2011 2012-15
-10
-5
0
5
10
-15
-10
-5
0
5
10%%
Non-financial corporationsFinancial institutionsGeneral governmentHouseholds and non-profit institutionsTotal economy
FINANCIAL ACCOUNTS Net financial transactions (a)
2004 2005 2006 2007 2008 2009 2010 2011 2012-200
-150
-100
-50
0
50
100
150
-200
-150
-100
-50
0
50
100
150%%
Non-financial corporationsFinancial institutionsGeneral governmentHouseholds and non-profit institutionsTotal economy
FINANCIAL ACCOUNTS Net financial assets
A
1 2 3 4 5 6 7 8 9 10 11 12 13 14 15 16
2. MAIN ECONOMIC INDICATORS 2.7 Financial accountsNet financial transactions and net financialassets of institutional sectors
(a) Quarterly ratios are calculated by using accumulated flows of the last four quarters for both net financial transactions and GDP.
___________________________________________________________________________________________________________________________
% of GDP
Net financial transactions (a) Net financial assets
Total economy Rest Total economy Rest of the of the World World
Total Non- Financial General House- (=-1) Total Non- Financial General House- (=-1) finan- institutions govern- holds finan- institutions govern- holds cial ment and cial ment and corpora- non- corpora- non- tions Total Mone- Non- profit tions Total Mone- Non- profit tary mone- institu- tary mone- institu tary tions tary tions
08 -9.18 -6.72 1.78 1.33 0.45 -4.49 0.24 9.18 -79.43 -134.84 11.12 9.62 1.50 -22.59 66.89 79.43 09 -4.34 -0.40 1.33 1.03 0.30 -11.17 5.90 4.34 -92.00 -143.82 8.55 6.46 2.09 -34.00 77.27 92.00 10 -3.78 1.62 0.92 0.62 0.30 -9.67 3.36 3.78 -86.98 -136.63 14.65 10.65 4.00 -40.22 75.23 86.98 11 -3.19 1.10 2.03 1.72 0.31 -9.45 3.12 3.19 -90.15 -124.80 13.25 10.22 3.03 -49.47 70.87 90.15 12 -1.85 2.74 4.14 4.00 0.15 -9.91 1.18 1.85 -89.75 -119.50 14.64 11.01 3.63 -54.36 69.47 89.75
08 Q4 -9.18 -6.72 1.78 1.33 0.45 -4.49 0.24 9.18 -79.43 -134.84 11.12 9.62 1.50 -22.59 66.89 79.43
09 Q1 -8.15 -5.74 1.78 1.30 0.48 -6.22 2.02 8.15 -81.13 -130.26 12.52 9.90 2.61 -24.04 60.65 81.13 Q2 -6.65 -4.19 1.65 1.25 0.40 -8.40 4.28 6.65 -87.52 -137.08 10.70 8.09 2.61 -27.41 66.27 87.52 Q3 -5.47 -2.03 1.37 1.08 0.29 -10.25 5.43 5.47 -90.10 -144.32 10.39 7.32 3.06 -30.29 74.12 90.10 Q4 -4.34 -0.40 1.33 1.03 0.30 -11.17 5.90 4.34 -92.00 -143.82 8.55 6.46 2.09 -34.00 77.27 92.00
10 Q1 -3.89 0.95 1.09 0.86 0.23 -11.49 5.56 3.89 -90.80 -141.94 11.24 8.78 2.46 -35.75 75.65 90.80 Q2 -4.09 1.39 1.03 0.82 0.21 -10.73 4.22 4.09 -86.32 -131.37 12.57 9.58 2.99 -36.23 68.71 86.32 Q3 -4.06 1.67 0.87 0.67 0.20 -10.18 3.58 4.06 -90.59 -138.24 12.76 9.26 3.50 -39.42 74.31 90.59 Q4 -3.78 1.62 0.92 0.62 0.30 -9.67 3.36 3.78 -86.98 -136.63 14.65 10.65 4.00 -40.22 75.23 86.98
11 Q1 -3.92 1.92 0.97 0.47 0.50 -9.45 2.64 3.92 -91.02 -143.52 15.38 11.46 3.92 -42.44 79.56 91.02 Q2 -3.42 2.50 0.99 0.32 0.67 -9.18 2.28 3.42 -91.13 -138.39 12.34 8.64 3.70 -44.36 79.28 91.13 Q3 -3.22 1.71 1.04 0.23 0.82 -9.04 3.07 3.22 -90.28 -125.90 11.80 8.28 3.52 -46.27 70.09 90.28 Q4 -3.19 1.10 2.03 1.72 0.31 -9.45 3.12 3.19 -90.15 -124.80 13.25 10.22 3.03 -49.47 70.87 90.15
12 Q1 -3.12 0.72 2.05 1.81 0.25 -9.29 3.39 3.12 -89.18 -122.92 14.17 11.06 3.12 -51.11 70.67 89.18 Q2 -2.72 0.86 3.16 2.95 0.22 -9.69 2.94 2.72 -87.53 -118.35 15.87 10.78 5.09 -50.68 65.63 87.53 Q3 -1.85 2.74 4.14 4.00 0.15 -9.91 1.18 1.85 -89.75 -119.50 14.64 11.01 3.63 -54.36 69.47 89.75
BANCO DE ESPAÑA 54 BOLETÍN ESTADÍSTICO, FEBRUARY 2013

2006 2007 2008 2009 2010 2011 2012 2013-1
0
1
2
3
4
5
-1
0
1
2
3
4
5%%
EURO AREASPAIN
PRICES
2006 2007 2008 2009 2010 2011 2012 20132.6
2.8
3.0
3.2
3.4
3.6
3.8
4.0
4.2
4.4
4.6
4.8
5.0
5.2
5.4
5.6
5.8
6.0
2.6
2.8
3.0
3.2
3.4
3.6
3.8
4.0
4.2
4.4
4.6
4.8
5.0
5.2
5.4
5.6
5.8
6.0%%
EURO AREASPAIN
INTEREST RATES
1 2 3 = 2-1 4 5 6 = 5-4
2. MAIN ECONOMIC INDICATORS 2.8 Prices and interest rates
___________________________________________________________________________________________________________________________
Eurostat, INE, BCE, Banco de España
Prices (a) Interest rates (b)
Euro area Spain Difference Euro area Spain Difference T12,12 T12,12 (c) (c)
06 2.2 3.6 1.4 3.9 3.8 -0.1 07 2.1 2.8 0.7 4.3 4.3 -0.0 08 3.3 4.1 0.9 4.4 4.4 0.0 09 0.3 -0.2 -0.5 4.0 4.0 -0.0 10 1.6 2.0 0.4 3.8 4.3 0.5 11 2.7 3.1 0.3 4.3 5.4 1.1 12 2.5 2.4 -0.1 3.1 5.8 2.8
(a) CPIs used in columns 1 and 2 are: before December 1995, national CPIs, from December 1995 to November 1996, interim indices of consumer, prices. From December 1996, harmonised indices of consumer prices. (b) Long-term interest rate used to assess convergence. See also column 11 in table 2.10 of this bulletin for Spain. Data on CPIs and interest rates by country are in tables 26.15 and 26.23 respectively. (c) Average of the last twelve months.
11 Nov 2.7 3.1 0.4 4.3 5.4 1.1 Dec 2.7 3.1 0.3 4.3 5.4 1.1
12 Jan 2.7 3.0 0.2 4.3 5.4 1.1 Feb 2.8 2.8 0.1 4.2 5.4 1.2 Mar 2.8 2.7 -0.1 4.2 5.4 1.3 Apr 2.7 2.6 -0.2 4.0 5.5 1.4 May 2.7 2.5 -0.3 4.0 5.5 1.6 Jun 2.7 2.4 -0.3 3.9 5.6 1.7 Jul 2.7 2.3 -0.4 3.8 5.7 1.9 Aug 2.7 2.3 -0.4 3.7 5.8 2.1 Sep 2.7 2.3 -0.3 3.5 5.9 2.3 Oct 2.6 2.4 -0.2 3.4 5.9 2.5 Nov 2.5 2.4 -0.2 3.2 5.9 2.6 Dec 2.5 2.4 -0.1 3.1 5.8 2.8
13 Jan 2.4 2.5 0.1 2.9 5.8 2.9 Feb 2.4 2.6 0.2 ... 5.8 5.8
BANCO DE ESPAÑA 55 BOLETÍN ESTADÍSTICO, FEBRUARY 2013
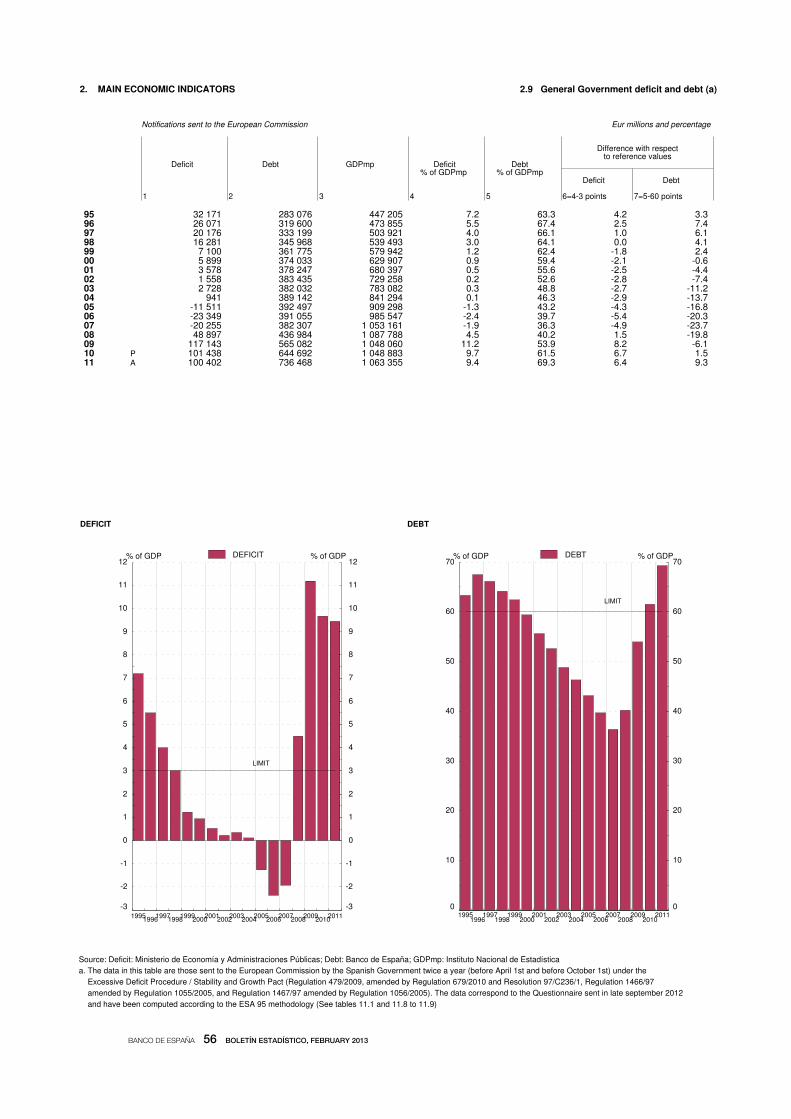
-3
-2
-1
0
1
2
3
4
5
6
7
8
9
10
11
12
-3
-2
-1
0
1
2
3
4
5
6
7
8
9
10
11
12% of GDP% of GDP
19951996199719981999200020012002200320042005200620072008200920102011
LIMIT
DEFICIT
DEFICIT
0
10
20
30
40
50
60
70
0
10
20
30
40
50
60
70% of GDP% of GDP
19951996
19971998
19992000
20012002
20032004
20052006
20072008
20092010
2011
LIMIT
DEBT
DEBT
P A
1 2 3 4 5 6=4-3 points 7=5-60 points
2. MAIN ECONOMIC INDICATORS 2.9 General Government deficit and debt (a)
Source: Deficit: Ministerio de Economía y Administraciones Públicas; Debt: Banco de España; GDPmp: Instituto Nacional de Estadística a. The data in this table are those sent to the European Commission by the Spanish Government twice a year (before April 1st and before October 1st) under the Excessive Deficit Procedure / Stability and Growth Pact (Regulation 479/2009, amended by Regulation 679/2010 and Resolution 97/C236/1, Regulation 1466/97 amended by Regulation 1055/2005, and Regulation 1467/97 amended by Regulation 1056/2005). The data correspond to the Questionnaire sent in late september 2012 and have been computed according to the ESA 95 methodology (See tables 11.1 and 11.8 to 11.9)
___________________________________________________________________________________________________________________________
Notifications sent to the European Commission Eur millions and percentage Difference with respect to reference values
Deficit Debt GDPmp Deficit Debt % of GDPmp % of GDPmp Deficit Debt
95 32 171 283 076 447 205 7.2 63.3 4.2 3.3 96 26 071 319 600 473 855 5.5 67.4 2.5 7.4 97 20 176 333 199 503 921 4.0 66.1 1.0 6.1 98 16 281 345 968 539 493 3.0 64.1 0.0 4.1 99 7 100 361 775 579 942 1.2 62.4 -1.8 2.4 00 5 899 374 033 629 907 0.9 59.4 -2.1 -0.6 01 3 578 378 247 680 397 0.5 55.6 -2.5 -4.4 02 1 558 383 435 729 258 0.2 52.6 -2.8 -7.4 03 2 728 382 032 783 082 0.3 48.8 -2.7 -11.2 04 941 389 142 841 294 0.1 46.3 -2.9 -13.7 05 -11 511 392 497 909 298 -1.3 43.2 -4.3 -16.8 06 -23 349 391 055 985 547 -2.4 39.7 -5.4 -20.3 07 -20 255 382 307 1 053 161 -1.9 36.3 -4.9 -23.7 08 48 897 436 984 1 087 788 4.5 40.2 1.5 -19.8 09 117 143 565 082 1 048 060 11.2 53.9 8.2 -6.1 10 101 438 644 692 1 048 883 9.7 61.5 6.7 1.5 11 100 402 736 468 1 063 355 9.4 69.3 6.4 9.3
BANCO DE ESPAÑA 56 BOLETÍN ESTADÍSTICO, FEBRUARY 2013

2009 2010 2011 20120.5
0.6
0.7
0.8
0.9
1.0
1.1
1.2
1.3
1.4
1.5
1.6
1.7
1.8
1.9
2.0
0.5
0.6
0.7
0.8
0.9
1.0
1.1
1.2
1.3
1.4
1.5
1.6
1.7
1.8
1.9
2.0%%
3-MONTH DEPOSITMAIN REFINANCING OPERATIONS
INTERBANK MARKET
2009 2010 2011 20120
1
2
3
4
5
6
7
8
9
0
1
2
3
4
5
6
7
8
9%%
3-YEAR CENTRAL GOVERNMENT BONDS10-YEAR CENTRAL GOVERNMENT BONDSAIAF
SECURITIES MARKET
1 2 3 4 5 6 7 8 9 10 11 12
2. MAIN ECONOMIC INDICATORS 2.10 Interest rates
___________________________________________________________________________________________________________________________
Percentages
Monetary Interbank Credit institutions. New business (CBE 4/2002) Securities secondary market policy market
operations: 3-month Main non-
refinancing transferable Loans Deposits 1-year Govermment bonds Private bonds operations deposits Treasury traded through
(a) bills AIAF maturing Synthetic Synthetic Synthetic Synthetic Synthetic Synthetic at over rate rate rate rate rate rate 3 years 10 years two years Households Non-financial Households Non-financial convergency and NPISH corporations and NPISH corporations criteria
09 1.00 1.23 3.84 4.48 3.24 1.53 1.64 1.18 0.99 2.23 3.98 3.47 10 1.00 0.87 3.29 3.64 2.97 1.44 1.52 1.14 1.70 2.64 4.25 3.74 11 1.00 1.34 4.09 4.34 3.83 1.64 1.72 1.36 3.04 3.97 5.44 5.00 12 0.75 1.06 4.06 4.32 3.78 1.50 1.60 1.12 2.67 3.98 5.85 5.80
(a) As of May 1990 the series shows the marginal auction rate of 10-day repo purchases of Banco de España certificates. From that date to December 1998 it shows the average auction rate of monetary regulation loans. From January 1999 it shows the rate of Eurosystem main refinancing operations.
12 Feb 1.00 1.07 4.30 4.72 3.88 1.57 1.66 1.23 1.63 2.95 5.11 4.79 Mar 1.00 0.94 4.17 4.59 3.75 1.49 1.58 1.16 1.43 2.76 5.17 4.43 Apr 1.00 ... 4.25 4.43 4.06 1.40 1.49 1.07 2.42 3.62 5.79 5.26 May 1.00 ... 4.27 4.39 4.15 1.33 1.41 1.02 3.27 4.52 6.12 5.36 Jun 1.00 ... 4.08 4.26 3.91 1.34 1.41 1.06 4.18 5.39 6.59 6.24 Jul 0.75 ... 4.03 4.26 3.80 1.40 1.48 1.04 4.05 5.61 6.79 7.92 Aug 0.75 ... 4.01 4.33 3.68 1.41 1.50 1.04 3.09 4.82 6.58 8.30 Sep 0.75 ... 3.87 4.17 3.56 1.59 1.72 1.09 2.63 3.88 5.91 7.06 Oct 0.75 ... 3.89 4.14 3.64 1.61 1.70 1.23 2.54 3.66 5.64 5.12 Nov 0.75 ... 3.83 3.99 3.67 1.64 1.76 1.14 2.42 3.73 5.69 4.86 Dec 0.75 ... 3.76 3.86 3.66 1.60 1.72 1.13 2.26 3.44 5.34 4.25
13 Jan 0.75 ... 4.00 4.14 3.83 1.41 1.48 1.12 1.43 2.92 5.05 4.14 Feb 0.75 ... ... ... ... ... ... ... 1.47 3.07 5.22 ...
BANCO DE ESPAÑA 57 BOLETÍN ESTADÍSTICO, FEBRUARY 2013

2009 2010 2011 2012 201396
98
100
102
104
106
108
110
112
114
116
96
98
100
102
104
106
108
110
112
114
116Base 1999 QI=100Base 1999 QI=100
NOMINAL VIS À VIS THE EUROPEAN UNION (EU 27)NOMINAL VIS À VIS THE DEVELOPED COUNTRIESTOTAL VIS À VIS THE EUROPEAN UNION (EU 27)TOTAL VIS À VIS THE DEVELOPED COUNTRIES
INDICES OF SPANISH COMPETITIVENESS
. Series depicted in chart.
1 . 2 . 3 . 4 . 5
2. MAIN ECONOMIC INDICATORS 2.11 Indices of Spanish competitiveness
(a) Outcome of multiplying price component (relative prices of Spain: relationship between the price indices of Spain and of the group) and nominal component. A decline in the index denotes an improvement in the competitiveness of Spanish products. (b) Geometric mean calculated using a double weighting system based on (1995-1997), (1998-2000), (2001-2003),and (2004-2006) manufacturing foreign trade figures.
___________________________________________________________________________________________________________________________
Base 1999 QI=100
Total (a) with consumer prices vis-à-vis : Nominal component (b) vis-à-vis :
Euro area European Union Developed European Union Developed (EU-27) countries (EU-27) countries
09 109.4 110.5 114.0 102.6 103.4 10 110.0 110.0 112.9 101.9 101.9 11 110.4 110.2 113.1 101.9 101.7 12 110.4 109.6 111.7 101.4 100.3
11 Sep 110.4 110.5 112.9 102.1 101.5 Oct 110.5 110.7 113.1 102.2 101.5 Nov 110.7 110.8 113.1 102.2 101.4 Dec 110.4 110.3 112.3 102.0 100.9
12 Jan 109.2 108.8 110.5 101.8 100.5 Feb 108.4 107.9 110.1 101.7 100.8 Mar 109.7 109.2 111.7 101.6 100.9 Apr 110.5 109.9 112.3 101.6 100.7 May 110.4 109.7 111.7 101.5 100.3 Jun 110.3 109.6 111.4 101.5 100.0 Jul 109.7 108.7 110.2 101.2 99.6 Aug 109.8 108.6 110.3 101.0 99.6 Sep 111.5 110.4 112.6 101.2 100.1 Oct 111.7 110.8 113.1 101.3 100.3 Nov 111.7 110.7 113.0 101.3 100.2 Dec 111.3 110.4 113.1 101.4 100.7
13 Jan 110.2 109.5 112.4 101.6 101.2 Feb ... ... ... 101.9 101.6
BANCO DE ESPAÑA 58 BOLETÍN ESTADÍSTICO, FEBRUARY 2013

CHAPTER 3 FINANCIAL ACCOUNTS

A
1 2 3 4 5 6 7 8 9 10 11 12 13 14 15 16
3. FINANCIAL ACCOUNTS 3.1 Total economyFinancial balance sheet
EUR billions Financial assets Liabilities
Net financial assets Total Mone- Curren- Securi- Loans Shares Insur- Other Total Curren- Securi- Loans Shares Insur- Other
tary cy ties and ance cy ties and ance gold and other other tech- and other other tech- and depo- than equity nical depo- than equity nical SDRs sits shares reserves sits shares reserves
08 -864 8 818 6 2 431 1 055 2 329 1 899 297 801 9 682 2 679 1 465 2 514 1 929 293 803 09 -964 8 969 10 2 431 1 203 2 323 1 982 311 708 9 933 2 706 1 656 2 518 2 039 308 706 10 -912 8 967 13 2 391 1 204 2 370 1 925 310 754 9 879 2 684 1 661 2 575 1 898 309 752 11 -959 9 002 14 2 437 1 347 2 338 1 773 311 780 9 960 2 820 1 754 2 538 1 761 311 776 12 -947 9 153 16 2 553 1 453 2 343 1 737 311 740 10 100 3 021 1 775 2 534 1 725 310 734
08 IV -864 8 818 6 2 431 1 055 2 329 1 899 297 801 9 682 2 679 1 465 2 514 1 929 293 803
09 I -877 8 616 6 2 392 1 109 2 329 1 700 299 781 9 492 2 661 1 532 2 517 1 706 295 781 II -935 8 847 6 2 461 1 172 2 342 1 817 303 746 9 782 2 741 1 601 2 540 1 854 299 746 III -952 8 906 9 2 378 1 201 2 328 1 967 309 713 9 858 2 654 1 625 2 527 2 033 306 713 IV -964 8 969 10 2 431 1 203 2 323 1 982 311 708 9 933 2 706 1 656 2 518 2 039 308 706
10 I -949 8 889 11 2 384 1 215 2 323 1 948 315 693 9 838 2 678 1 669 2 523 1 965 312 691 II -903 8 852 13 2 454 1 197 2 356 1 804 308 719 9 755 2 778 1 622 2 555 1 776 306 717 III -948 8 923 12 2 374 1 213 2 359 1 916 312 736 9 872 2 681 1 673 2 561 1 912 310 734 IV -912 8 967 13 2 391 1 204 2 370 1 925 310 754 9 879 2 684 1 661 2 575 1 898 309 752
11 I -958 9 065 12 2 381 1 223 2 359 2 027 313 749 10 023 2 653 1 711 2 563 2 037 312 747 II -964 9 101 12 2 402 1 235 2 366 2 034 310 743 10 066 2 718 1 705 2 563 2 031 310 739 III -959 8 810 14 2 361 1 260 2 347 1 779 308 741 9 769 2 703 1 710 2 545 1 766 307 738 IV -959 9 002 14 2 437 1 347 2 338 1 773 311 780 9 960 2 820 1 754 2 538 1 761 311 776
12 I -947 9 306 14 2 648 1 466 2 333 1 744 318 783 10 253 3 066 1 833 2 536 1 722 318 778 II -926 9 217 15 2 645 1 462 2 387 1 643 309 756 10 143 3 152 1 742 2 571 1 619 309 750 III -947 9 153 16 2 553 1 453 2 343 1 737 311 740 10 100 3 021 1 775 2 534 1 725 310 734
A
1 2 3 4 5 6 7 8 9 10 11 12 13 14 15 16
3. FINANCIAL ACCOUNTS 3.2 Total economyFinancial transactions account
EUR billions Net acquisition of financial assets Net incurrence of liabilities
Net financial
transactions Total Mone- Curren Securi- Loans Shares Insur- Other Total Curren- Securi- Loans Shares Insur- Other tary cy ties and ance cy ties and ance gold and other other techni- and other other techni- and depo- than equity cal depo- than equity cal SDRs sits shares re- sits shares re- serves serves
08 -100 446 - 247 173 130 -40 8 -71 546 348 129 154 -24 7 -68 09 -46 113 - -2 167 -1 34 8 -94 158 27 204 -3 28 9 -106 10 -40 135 - -48 41 60 33 3 46 174 -38 89 65 23 5 29 11 -34 249 - 48 157 -10 23 4 27 283 139 100 -16 38 5 18 12 -13 216 - 121 117 15 3 - -40 229 205 35 6 19 - -37
08 IV -22 205 - 96 86 28 - 2 -8 226 143 53 39 -2 2 -10
09 I -19 14 - -44 60 - 13 6 -21 32 -26 70 3 4 6 -25 II -9 129 - 71 75 18 -1 1 -35 138 84 74 17 2 1 -40 III -8 -97 - -80 24 -14 6 - -33 -89 -80 27 -14 12 - -35 IV -9 68 - 52 8 -5 17 1 -5 77 49 33 -10 10 1 -7
10 I -14 -61 - -50 -1 -2 4 2 -15 -47 -37 5 -4 4 3 -18 II -11 120 - 61 -6 28 13 -2 26 132 81 -5 30 6 -2 21 III -8 -13 - -75 19 19 7 1 17 -5 -83 44 19 2 1 13 IV -6 89 - 16 30 15 8 2 18 95 1 45 21 12 3 13
11 I -15 21 - -6 26 -4 7 2 -5 36 -24 50 -5 16 3 -3 II -6 69 - 23 30 18 7 -2 -6 76 68 7 11 - -2 -8 III -6 -40 - -45 16 -18 7 1 -1 -34 -21 -8 -18 15 1 -4 IV -6 199 - 76 86 -6 2 3 39 205 116 51 -4 7 3 33
12 I -15 326 - 214 105 -2 3 4 2 341 250 71 2 8 4 5 II -2 68 - -4 39 57 7 -4 -27 70 83 -23 37 8 -4 -31 III 3 -178 - -89 -27 -40 -7 - -16 -181 -128 -12 -33 3 - -11
BANCO DE ESPAÑA 60 BOLETÍN ESTADÍSTICO, FEBRUARY 2013

A
1 2 3 4 5 6 7 8 9 10 11 12 13 14 15 16 17 18
3. FINANCIAL ACCOUNTS 3.3 Non-financial corporationsFinancial balance sheet
EUR billions
Net financial assets Financial assets Liabilities
Total vis-à-vis: Total Cur- Secu- Loans Shares Insur- Other Total Secu- Loans Shares Insur- Other rency rities and ance rities and ance and other other tech- other other tech- Finan- General House- Rest depo- than equity nical than equity nical cial govern- holds of sits shares re- shares re- insti- ment and the serves serves tutions non- World profit insti- tutions
08 -1 467 -816 -41 -351 -258 2 128 252 40 242 933 26 636 3 595 24 1 462 1 487 - 622 09 -1 507 -825 -49 -355 -278 2 025 247 31 236 932 26 552 3 532 24 1 447 1 523 - 538 10 -1 433 -805 -46 -332 -250 2 071 253 42 243 950 24 559 3 504 23 1 460 1 469 - 553 11 -1 327 -736 -54 -271 -266 1 986 242 59 253 858 31 544 3 313 25 1 420 1 331 - 538 12 -1 261 -686 -55 -253 -266 1 942 230 72 269 835 31 506 3 203 23 1 375 1 296 - 508
08 IV -1 467 -816 -41 -351 -258 2 128 252 40 242 933 26 636 3 595 24 1 462 1 487 - 622
09 I -1 407 -815 -48 -290 -255 2 001 242 36 238 842 27 617 3 408 26 1 466 1 307 - 609 II -1 464 -827 -49 -306 -282 2 017 241 33 242 882 26 592 3 481 24 1 474 1 402 - 582 III -1 525 -831 -53 -352 -289 2 039 244 34 237 934 26 565 3 564 24 1 458 1 524 - 557 IV -1 507 -825 -49 -355 -278 2 025 247 31 236 932 26 552 3 532 24 1 447 1 523 - 538
10 I -1 484 -823 -54 -342 -266 2 009 239 35 237 929 26 543 3 493 24 1 451 1 481 - 536 II -1 374 -800 -51 -284 -239 1 984 252 36 240 880 25 551 3 358 26 1 460 1 328 - 545 III -1 447 -808 -51 -328 -260 2 039 246 40 242 932 25 555 3 486 26 1 459 1 450 - 551 IV -1 433 -805 -46 -332 -250 2 071 253 42 243 950 24 559 3 504 23 1 460 1 469 - 553
11 I -1 511 -802 -53 -375 -281 2 097 254 46 243 977 26 551 3 608 21 1 445 1 593 - 549 II -1 464 -777 -52 -366 -269 2 088 257 44 252 959 28 548 3 552 22 1 435 1 555 - 540 III -1 338 -747 -50 -277 -263 1 987 248 46 259 858 29 547 3 324 24 1 433 1 332 - 535 IV -1 327 -736 -54 -271 -266 1 986 242 59 253 858 31 544 3 313 25 1 420 1 331 - 538
12 I -1 305 -729 -54 -259 -264 1 960 235 60 252 845 33 536 3 266 27 1 410 1 295 - 533 II -1 252 -702 -62 -227 -262 1 910 237 64 259 804 32 514 3 162 27 1 392 1 217 - 526 III -1 261 -686 -55 -253 -266 1 942 230 72 269 835 31 506 3 203 23 1 375 1 296 - 508
A
1 2 3 4 5 6 7 8 9 10 11 12 13 14 15 16 17 18 19
3. FINANCIAL ACCOUNTS 3.4 Non-financial corporationsFinancial transactions account
EUR billions
Net financial accounts Net acquisition of financial assets Net incurrence of liabilities
Total vis-à-vis: Unsec- Total Cur Secu- Loans Shares Insur- Other Total Secu- Loans Shares Insur- Other tor- rency rities and ance rities and ance ised: and other other tech- other other tech- Finan- General House- Rest Other depo- than equity nical than equity nical tial govern- holds of (part) sits shares re- shares re- insti- ment and the serves serves tu- non- World tions profit insti- tutions
08 -73 -61 5 1 -15 -3 -14 7 6 2 40 1 -69 59 1 95 26 - -62 09 -4 - -5 -6 -6 13 -101 -6 -6 -12 6 - -83 -97 -1 -25 26 - -98 10 17 13 4 -3 -2 6 75 3 19 9 40 -2 7 58 -1 16 34 - 9 11 12 31 -5 - -17 4 3 -12 17 10 -4 7 -15 -9 2 -24 32 - -18 12 26 30 -1 -2 1 -2 -22 -12 19 16 -7 - -38 -48 - -38 17 - -27
08 IV -8 -13 6 -2 1 - - 1 5 -1 15 - -20 8 1 19 6 - -19
09 I -21 -19 -4 -2 - 3 -26 -12 - -5 10 1 -19 -5 -1 3 9 - -17 II 4 7 -1 3 -10 7 -23 - -1 7 -3 - -25 -27 -3 4 6 - -34 III 3 10 -4 -3 -4 4 -37 4 -3 -9 -1 -1 -28 -40 1 -18 5 - -28 IV 9 1 4 -4 9 -1 -16 3 -3 -5 1 - -13 -25 1 -14 6 - -19
10 I -7 -3 -5 - -3 4 -14 -10 3 -1 3 - -9 -7 -1 -5 5 - -7 II 9 3 3 -4 2 4 30 11 3 -1 11 -1 7 21 - 6 11 - 5 III 6 7 - 1 -1 - 29 -5 7 10 13 -1 4 23 - 10 6 - 7 IV 9 5 6 - - -2 29 6 6 1 12 -1 4 20 -1 5 13 - 3
11 I -4 18 -7 -1 -11 -2 1 3 2 - 1 3 -8 5 - -9 15 - -1 II 15 6 1 3 5 - 8 4 2 8 -4 1 -3 -7 2 - 1 - -9 III -2 -4 2 - -3 3 -4 -11 1 7 -1 1 -2 -2 - -3 9 - -8 IV 2 11 -2 -2 -8 3 -3 -8 12 -6 - 2 -3 -5 - -11 7 - -
12 I -8 3 - -2 -9 - -11 -6 3 -2 -1 2 -7 -4 - -6 6 - -4 II 17 14 -6 -1 7 3 -5 1 11 8 -1 -1 -23 -22 - -18 7 - -10 III 18 13 6 1 3 -5 -5 -7 6 10 -4 -1 -8 -23 - -14 4 - -13
BANCO DE ESPAÑA 61 BOLETÍN ESTADÍSTICO, FEBRUARY 2013

A
1 2 3 4 5 6 7 8 9 10 11 12 13 14 15 16 17 18 19 20 21
3. FINANCIAL ACCOUNTS 3.5 Financial institutionsFinancial balance sheet
(*) Unsectorised: monetary gold and SDRs
EUR billions
Net financial assets Financial assets Liabilities
Total vis-à-vis: (*) Total Mone- Curren- Securi- Loans Shares Insur- Other Total Curren- Securi- Loans Shares Insur- Other tary cy ties and ance cy ties and ance gold and other other tech- and other other tech- Non- Gene- House- Rest and depo- than equity nical depo- than equity nical finan- ral holds of SDRs sits shares re- sits shares re- cial govern- and the serves serves corpo- ment non- World ra- profit tions insti- tutions
08 121 816 93 -284 -511 6 4 654 6 1 274 906 2 046 338 17 67 4 533 2 676 1 026 43 441 293 54 09 90 825 139 -364 -521 10 4 796 10 1 232 1 051 2 040 387 17 60 4 707 2 703 1 084 58 514 308 41 10 154 805 186 -366 -484 13 4 756 13 1 186 1 019 2 073 370 17 78 4 602 2 681 1 050 89 427 309 46 11 141 736 289 -389 -509 14 4 911 14 1 263 1 132 2 021 384 17 80 4 770 2 817 1 057 104 428 311 54 12 155 686 376 -398 -525 16 5 126 16 1 403 1 244 1 976 379 17 91 4 971 3 017 1 056 105 429 310 54
08 IV 121 816 93 -284 -511 6 4 654 6 1 274 906 2 046 338 17 67 4 533 2 676 1 026 43 441 293 54
09 I 135 815 95 -284 -497 6 4 646 6 1 230 969 2 049 300 17 75 4 510 2 658 1 058 48 399 295 54 II 114 827 114 -322 -511 6 4 794 6 1 277 1 027 2 054 343 17 70 4 680 2 738 1 089 51 452 299 50 III 110 831 126 -345 -511 9 4 761 9 1 199 1 046 2 045 378 17 68 4 651 2 650 1 086 56 508 306 45 IV 90 825 139 -364 -521 10 4 796 10 1 232 1 051 2 040 387 17 60 4 707 2 703 1 084 58 514 308 41
10 I 117 823 149 -359 -506 11 4 763 11 1 205 1 052 2 037 377 16 65 4 645 2 674 1 078 58 481 312 41 II 132 800 161 -342 -500 13 4 793 13 1 247 1 029 2 064 350 16 75 4 662 2 775 1 031 63 446 306 41 III 134 808 182 -360 -509 12 4 765 12 1 183 1 038 2 064 370 16 82 4 631 2 677 1 059 80 460 310 45 IV 154 805 186 -366 -484 13 4 756 13 1 186 1 019 2 073 370 17 78 4 602 2 681 1 050 89 427 309 46
11 I 162 802 209 -375 -486 12 4 770 12 1 166 1 028 2 058 406 17 82 4 608 2 649 1 061 96 442 312 48 II 131 777 229 -382 -505 12 4 818 12 1 176 1 037 2 055 443 16 77 4 687 2 714 1 042 100 473 310 49 III 125 747 239 -378 -497 14 4 743 14 1 170 1 061 2 027 381 17 73 4 618 2 699 1 036 95 432 307 49 IV 141 736 289 -389 -509 14 4 911 14 1 263 1 132 2 021 384 17 80 4 770 2 817 1 057 104 428 311 54
12 I 151 729 336 -398 -531 14 5 223 14 1 460 1 250 2 015 377 17 89 5 073 3 062 1 099 114 427 318 52 II 168 702 369 -385 -533 15 5 239 15 1 473 1 256 2 031 352 17 96 5 071 3 148 1 056 108 401 309 48 III 155 686 376 -398 -525 16 5 126 16 1 403 1 244 1 976 379 17 91 4 971 3 017 1 056 105 429 310 54
A
1 2 3 4 5 6 7 8 9 10 11 12 13 14 15 16 17 18 19 20 21
3. FINANCIAL ACCOUNTS 3.6 Financial institutionsFinancial transactions account
EUR billions
Net financial transactions Net acquisition of financial assets Net incurrence of liabilities
Total vis-à-vis: (*) Total Mone- Curren- Securi- Loans Shares Insur- Other Total Curren- Securi- Loans Shares Insur- Other tary cy ties and ance cy ties and ance gold and other other tech- and other Other tech- Non- General House- Rest and depo- than equity nical depo- than equity nical- finan- govern- holds of SDRs sits shares re- sits shares re- cial ment and the serves serves corpo- non- World rations profit corpo- rations
08 19 61 30 5 -68 -8 413 - 164 160 126 -44 1 6 393 348 76 8 -50 7 3 09 14 - 53 -59 26 -7 131 - -42 160 3 17 - -7 117 27 72 15 -1 9 -6 10 10 -13 60 -24 -17 3 13 - -51 -3 46 2 - 19 4 -38 15 31 -11 5 2 11 22 -31 102 -44 -14 9 207 - 79 126 -31 31 - 2 185 138 22 15 6 5 -1 12 31 -30 93 -6 -23 -3 242 - 145 115 -35 4 - 12 210 205 -6 1 2 - 8
(*) Unsectorised: monetary gold,SDRs and a part of ’Other’
08 IV 2 13 22 -5 -28 1 161 - 66 75 28 -10 1 1 159 143 21 7 -8 2 -7
09 I 6 19 4 -18 4 -3 26 - -46 61 3 - - 8 20 -26 38 4 -5 6 2 II 3 -7 21 -20 12 -3 122 - 48 65 8 6 - -6 119 84 36 4 -4 1 -1 III 4 -10 14 -3 8 -5 -60 - -76 22 -6 2 - -2 -64 -80 4 5 6 - - IV 1 -1 15 -17 2 3 43 - 32 12 -2 8 - -8 42 49 -6 2 3 1 -7
10 I 3 3 11 -1 -6 -4 -37 - -29 -8 -2 -2 -1 5 -40 -37 -9 - -2 3 4 II 2 -3 23 1 -18 - 56 - 35 -17 26 1 - 10 54 81 -26 5 -4 -2 - III 2 -7 12 -6 3 1 -32 - -60 10 8 3 - 7 -35 -83 32 17 -4 1 3 IV 2 -5 14 -18 5 6 26 - 2 11 14 - 1 -3 24 1 17 9 -1 3 -6
11 I 4 -18 13 -7 12 4 2 - -18 18 -9 8 - 4 -2 -24 14 6 - 3 -1 II 2 -6 29 -11 -12 3 56 - 13 23 8 19 - -6 54 68 -12 4 -1 -2 -3 III 3 4 12 -10 -2 -1 -22 - -8 15 -27 1 - -4 -25 -21 -7 -5 6 1 1 IV 12 -11 48 -15 -12 3 170 - 94 70 -3 3 - 7 157 116 27 9 1 3 2
12 I 4 -3 42 -5 -26 -4 316 - 200 105 -2 3 - 10 311 250 37 10 3 4 8 II 14 -14 56 -2 -23 -3 72 - 13 33 18 1 - 7 58 83 -15 -6 1 -4 -1 III 13 -13 -5 - 26 5 -146 - -67 -23 -51 1 - -5 -159 -128 -27 -3 -1 - 1
BANCO DE ESPAÑA 62 BOLETÍN ESTADÍSTICO, FEBRUARY 2013

A
1 2 3 4 5 6 7 8 9 10 11 12 13 14 15 16 17
3. FINANCIAL ACCOUNTS 3.7 General governmentFinancial balance sheet
EUR billions
Net financial assets Financial assets Liabilities
Total vis-à-vis: Total Cur- Securi- Loans Shares Other Total Cur- Secu- Loans Shares Other rency ties and rency rities and and other other and other other Non- Finan- House- Rest depo- than equity depo- than equity finan- cial holds of sits shares sits shares cial insti- and the corpo- tu- non- World ra- tions profit tions insti- tu- tions
08 -245,8 41,3 -93,2 -15,1 -178,8 342,5 101,9 71,7 40,6 88,3 39,9 588,2 3,4 415,5 95,2 - 74,1 09 -356,3 49,1 -139,4 -17,3 -248,8 383,6 119,7 77,8 48,0 95,0 43,0 739,9 3,5 547,8 107,0 2,3 79,4 10 -421,9 46,3 -186,0 -25,2 -257,0 389,2 95,1 92,1 53,7 97,5 50,7 811,1 3,6 587,4 124,9 2,3 92,9 11 -526,0 54,0 -289,2 -38,4 -252,4 416,1 77,5 87,0 64,6 102,0 85,0 942,1 3,7 672,0 140,1 2,3 124,0 12 -573,7 55,4 -375,9 -27,9 -225,2 441,8 82,0 76,1 98,2 106,1 79,4 1 015,5 3,7 696,2 210,0 - 105,6
08 IV -245,8 41,3 -93,2 -15,1 -178,8 342,5 101,9 71,7 40,6 88,3 39,9 588,2 3,4 415,5 95,2 - 74,1
09 I -259,7 47,7 -95,1 -16,8 -195,5 355,8 116,2 72,1 42,4 92,5 32,6 615,6 3,4 448,1 97,4 - 66,7 II -292,8 49,1 -114,1 -16,0 -211,8 367,8 121,2 76,7 45,5 92,4 32,0 660,5 3,4 487,7 103,2 - 66,2 III -320,0 53,3 -126,4 -16,9 -230,0 368,8 117,1 78,8 46,8 95,5 30,6 688,8 3,5 515,3 106,1 0,8 63,2 IV -356,3 49,1 -139,4 -17,3 -248,8 383,6 119,7 77,8 48,0 95,0 43,0 739,9 3,5 547,8 107,0 2,3 79,4
10 I -373,7 53,9 -148,8 -15,6 -263,3 375,2 113,9 80,8 49,1 96,3 35,0 748,9 3,5 566,1 111,3 2,3 65,8 II -378,9 50,8 -161,0 -15,8 -253,0 384,5 113,3 80,2 52,5 99,9 38,5 763,4 3,5 565,7 118,3 2,3 73,6 III -412,6 50,6 -182,3 -19,9 -260,9 380,9 102,1 86,6 53,5 98,8 39,9 793,5 3,6 589,1 121,0 2,3 77,6 IV -421,9 46,3 -186,0 -25,2 -257,0 389,2 95,1 92,1 53,7 97,5 50,7 811,1 3,6 587,4 124,9 2,3 92,9
11 I -446,8 52,5 -208,8 -25,2 -265,3 407,7 104,3 96,5 57,9 96,1 52,9 854,5 3,6 629,4 132,4 2,3 86,8 II -469,3 51,6 -228,5 -30,6 -261,8 404,9 99,7 97,0 59,0 96,9 52,3 874,2 3,6 641,4 135,8 2,3 91,1 III -491,5 50,0 -238,9 -35,2 -267,4 397,7 84,4 96,4 61,4 101,4 54,0 889,3 3,7 649,4 137,2 2,3 96,7 IV -526,0 54,0 -289,2 -38,4 -252,4 416,1 77,5 87,0 64,6 102,0 85,0 942,1 3,7 672,0 140,1 2,3 124,0
12 I -542,8 53,7 -335,6 -36,6 -224,2 443,5 105,5 84,6 66,3 102,4 84,6 986,3 3,7 707,3 149,2 - 126,1 II -536,3 61,6 -369,1 -24,8 -204,0 443,7 83,1 74,8 97,6 103,5 84,6 980,0 3,7 659,4 212,1 - 104,8 III -573,7 55,4 -375,9 -27,9 -225,2 441,8 82,0 76,1 98,2 106,1 79,4 1 015,5 3,7 696,2 210,0 - 105,6
A
1 2 3 4 5 6 7 8 9 10 11 12 13 14 15 16 17 18
3. FINANCIAL ACCOUNTS 3.8 General governmentFinancial transactions account
EUR billions
Net financial transactions Net acquisition of financial assets Net incurrence of liabilities
Total vis-à-vis: Unsec- Total Cur- Secu- Loans Shares Other Total Cur- Secu- Loans Shares Other torised: rency rities and rency rities and Other and other other and other other Non- Finan- House- Rest (part) depo- than equity depo- than equity finan- cial holds of sits shares sits shares cial insti- and the corpo- tu- non- World ra- tions profit tions insti- tutions
08 -48,9 -4,5 -29,6 -3,4 -11,2 -0,2 22,2 0,8 19,2 2,0 0,8 -0,6 71,0 0,1 52,1 12,4 - 6,5 09 -117,1 5,1 -53,5 -2,5 -66,6 0,3 34,9 17,8 6,3 7,4 0,3 3,1 152,0 0,0 133,0 11,8 2,3 5,0 10 -101,5 -3,8 -59,6 -8,8 -29,1 -0,1 5,9 -24,6 18,2 5,1 -0,4 7,7 107,4 0,1 75,7 18,0 - 13,6 11 -100,4 5,5 -101,6 -15,1 9,7 1,1 20,4 -17,6 -6,1 10,7 -1,0 34,3 120,8 0,1 75,4 15,2 - 30,1 12 -65,3 0,5 -93,0 8,4 17,3 1,6 20,9 4,4 -10,7 33,6 0,2 -6,6 86,3 0,0 41,1 69,9 - -24,8
08 IV -31,1 -5,7 -21,6 -1,1 -2,1 -0,5 23,2 4,7 8,3 0,6 -0,2 9,8 54,3 -0,0 30,9 8,7 14,6
09 I -14,7 3,5 -3,7 -1,8 -15,0 2,3 9,9 14,3 0,9 1,8 0,2 -7,4 24,7 -0,0 32,1 2,2 -9,6 II -37,5 1,5 -20,8 0,7 -15,7 -3,2 11,9 4,9 4,4 3,1 0,1 -0,6 49,4 0,0 40,8 5,8 2,7 III -24,9 4,4 -14,4 -0,9 -14,9 0,9 -2,6 -4,1 1,4 1,3 0,2 -1,4 22,3 0,1 22,5 2,9 -3,9 IV -39,9 -4,3 -14,6 -0,5 -20,9 0,4 15,8 2,6 -0,4 1,2 -0,1 12,4 55,7 0,0 37,5 0,8 15,8
10 I -17,8 5,0 -10,7 1,6 -11,6 -2,1 -10,4 -5,8 2,2 1,2 0,1 -8,0 7,4 -0,0 14,6 4,3 -11,5 II -29,7 -3,3 -23,0 -0,3 -0,5 -2,5 9,3 -0,6 2,1 3,4 0,9 3,5 38,9 0,0 21,5 7,1 10,3 III -19,2 0,2 -11,7 -4,3 -5,9 2,5 -3,8 -11,2 5,0 0,9 0,2 1,4 15,4 0,1 11,2 2,6 1,5 IV -34,8 -5,7 -14,3 -5,8 -11,0 1,9 10,8 -7,0 9,0 -0,4 -1,6 10,8 45,6 0,0 28,4 3,9 13,3
11 I -15,8 6,5 -13,2 -0,4 -10,3 1,6 19,2 9,2 3,6 4,2 0,0 2,2 35,0 0,0 35,1 7,5 -7,6 II -27,3 -1,3 -28,6 -5,7 7,3 0,9 -2,8 -4,6 1,2 1,1 0,2 -0,6 24,6 0,0 17,6 3,5 3,4 III -18,1 -1,8 -11,6 -5,1 0,7 -0,2 -11,8 -15,3 -1,7 2,5 1,0 1,7 6,3 0,1 -0,9 1,4 5,8 IV -39,3 2,1 -48,1 -3,9 11,9 -1,2 15,7 -6,9 -9,2 3,0 -2,1 31,0 55,0 -0,0 23,5 2,9 28,6
12 I -14,0 -0,3 -42,4 1,5 25,6 1,7 24,8 28,0 -3,6 1,8 0,0 -1,4 38,8 -0,0 34,2 9,1 -4,5 II -31,2 6,3 -55,7 9,3 9,1 -0,3 2,2 -22,4 -6,9 31,3 0,2 -0,0 33,4 -0,0 -8,5 62,9 -21,0 III -20,2 -5,5 5,1 -2,5 -17,4 0,1 -6,1 -1,2 -0,3 0,5 0,0 -5,3 14,1 0,0 15,4 -2,1 0,7
BANCO DE ESPAÑA 63 BOLETÍN ESTADÍSTICO, FEBRUARY 2013

A
1 2 3 4 5 6 7 8 9 10 11 12 13 14
3. FINANCIAL ACCOUNTS 3.9 Households and non-profit institutionsFinancial balance sheet
EUR billions
Net financial assets Financial assets Liabilities
Total vis-à-vis: Total Currency Securi- Shares Insur- Other Total Loans Other and ties and ance deposits other other techni- Non- Finan- General Rest than equity cal finan- cial govern- of shares reserves cial insti- ment the corpo- tu- World ra- tions tions
08 727,6 351,1 283,5 15,1 77,9 1 693,1 803,4 37,1 539,4 254,3 58,8 965,4 913,4 52,1 09 809,8 355,4 363,6 17,3 73,5 1 763,9 831,5 43,3 567,8 268,5 52,9 954,1 906,2 47,9 10 789,0 332,3 365,6 25,2 65,9 1 750,8 856,6 51,1 507,9 269,5 65,6 961,7 901,2 60,5 11 753,6 270,6 389,3 38,4 55,2 1 688,2 855,2 69,3 428,6 263,5 71,6 934,7 874,1 60,6 12 733,2 253,4 398,1 27,9 53,8 1 643,0 838,2 60,7 416,9 263,0 64,3 909,8 843,9 65,8
08 IV 727,6 351,1 283,5 15,1 77,9 1 693,1 803,4 37,1 539,4 254,3 58,8 965,4 913,4 52,1
09 I 655,3 290,3 284,3 16,8 63,9 1 613,7 803,8 32,3 466,3 255,5 55,7 958,4 906,4 52,0 II 707,9 305,9 321,8 16,0 64,2 1 668,4 822,1 35,7 499,0 259,9 51,7 960,5 911,9 48,7 III 783,0 351,6 344,7 16,9 69,8 1 737,1 817,8 42,7 559,7 267,1 49,7 954,0 906,4 47,6 IV 809,8 355,4 363,6 17,3 73,5 1 763,9 831,5 43,3 567,8 268,5 52,9 954,1 906,2 47,9
10 I 790,9 341,6 358,7 15,6 75,0 1 741,4 826,2 46,8 545,7 272,9 49,8 950,5 902,1 48,4 II 718,7 284,0 341,7 15,8 77,2 1 690,2 842,0 52,4 473,0 267,0 55,8 971,5 913,7 57,8 III 777,8 328,0 359,8 19,9 70,1 1 738,3 842,4 48,6 515,5 272,0 59,9 960,6 900,8 59,7 IV 789,0 332,3 365,6 25,2 65,9 1 750,8 856,6 51,1 507,9 269,5 65,6 961,7 901,2 60,5
11 I 837,6 374,9 374,9 25,2 62,6 1 790,2 857,1 52,8 548,2 269,4 62,7 952,6 890,6 62,0 II 838,9 366,4 382,4 30,6 59,5 1 791,0 869,0 56,3 534,7 266,1 65,0 952,2 892,4 59,8 III 744,6 277,3 377,8 35,2 54,3 1 682,7 858,0 56,5 438,6 262,2 67,3 938,1 880,6 57,5 IV 753,6 270,6 389,3 38,4 55,2 1 688,2 855,2 69,3 428,6 263,5 71,6 934,7 874,1 60,6
12 I 750,6 258,6 397,7 36,6 57,6 1 678,8 846,4 71,3 419,8 268,3 73,1 928,3 862,1 66,1 II 694,5 226,8 385,3 24,8 57,6 1 624,4 851,2 67,6 384,1 260,1 61,4 929,9 858,9 71,0 III 733,2 253,4 398,1 27,9 53,8 1 643,0 838,2 60,7 416,9 263,0 64,3 909,8 843,9 65,8
A
1 2 3 4 5 6 7 8 9 10 11 12 13 14 15
3. FINANCIAL ACCOUNTS 3.10 Households and non-profit institutionsFinancial transactions account
EUR billions Net incurrence
Net financial transactions Net acquisition of financial assets of liabilities
Total vis-à-vis: Unsec- Total Currency Securi- Shares Insur- Other Total Loans Other tor- and ties and ance ised: deposits other other techni- Non- Finan- General Rest Other than equity cal finan- cial govern- of (part) shares reserves cial insti- ment the corpo- tu- World ra- tions tions
08 2,7 -1,1 -5,1 3,4 -2,3 7,8 25,2 76,1 -12,4 -36,7 5,7 -7,5 22,6 38,2 -15,6 09 61,8 6,5 58,7 2,5 -9,9 4,0 48,7 28,3 7,1 10,9 8,3 -5,9 -13,1 -5,0 -8,1 10 35,2 2,7 23,9 8,8 -7,6 7,4 41,1 25,1 6,9 -8,7 5,0 12,7 5,9 0,7 5,2 11 33,2 -0,5 44,1 15,1 -18,4 -7,2 18,8 -1,4 20,4 -3,3 -3,0 6,0 -14,4 -21,7 7,3 12 -5,8 2,2 6,2 -8,4 -3,7 -2,1 -25,4 -17,1 -6,8 5,8 0,1 -7,4 -19,6 -26,9 7,3
08 IV 15,5 1,8 5,3 1,1 4,8 2,5 20,9 24,4 -2,4 -3,9 1,7 1,0 5,4 3,8 1,6
09 I 11,1 1,5 18,2 1,8 -11,0 0,6 4,0 0,2 -0,8 2,3 5,3 -3,1 -7,2 -6,5 -0,7 II 21,2 -2,6 20,3 -0,7 -0,1 4,4 17,8 18,6 5,8 -3,9 1,3 -4,0 -3,5 4,3 -7,8 III 9,5 3,3 3,3 0,9 0,2 1,9 2,5 -4,1 3,2 4,6 0,8 -2,0 -7,0 -4,1 -2,9 IV 19,9 4,3 16,9 0,5 1,1 -2,9 24,5 13,7 -1,0 7,9 0,8 3,2 4,6 1,4 3,2
10 I 7,5 0,2 0,5 -1,6 3,6 4,7 -0,1 -5,3 2,2 3,2 2,9 -3,1 -7,6 -3,3 -4,3 II 7,2 3,6 -0,9 0,3 0,2 4,0 24,6 15,5 4,9 -0,7 -1,0 6,0 17,4 12,0 5,4 III 2,9 -1,1 6,3 4,3 -6,7 0,2 -6,0 0,8 -3,0 -9,3 1,3 4,1 -8,9 -10,7 1,8 IV 17,6 0,1 18,0 5,8 -4,7 -1,5 22,6 14,2 2,8 -1,9 1,8 5,7 5,0 2,7 2,3
11 I 0,0 1,3 7,2 0,4 -3,8 -5,1 -2,4 0,5 2,1 -1,8 -0,4 -2,9 -2,5 -9,1 6,6 II 3,5 -3,3 11,1 5,7 -7,0 -3,0 7,4 11,8 3,8 -7,7 -2,9 2,3 3,9 3,2 0,7 III 11,4 -0,1 10,4 5,1 -4,2 0,2 -2,3 -10,9 1,1 5,8 -0,6 2,3 -13,7 -11,2 -2,5 IV 18,2 1,6 15,5 3,9 -3,4 0,6 16,2 -2,8 13,4 0,4 0,9 4,3 -2,0 -4,6 2,5
12 I 2,9 2,0 4,6 -1,5 -1,9 -0,3 -2,8 -8,9 0,8 1,7 2,1 1,4 -5,7 -11,5 5,9 II -1,4 0,9 1,6 -9,3 2,3 3,3 -1,5 4,8 1,7 6,9 -3,2 -11,7 -0,1 -1,7 1,6 III -7,3 -0,7 0,0 2,5 -4,1 -5,0 -21,1 -13,0 -9,3 -2,8 1,2 2,9 -13,8 -13,7 -0,1
BANCO DE ESPAÑA 64 BOLETÍN ESTADÍSTICO, FEBRUARY 2013

A
1 2 3 4 5 6 7 8 9 10 11 12 13 14 15 16 17 18 19 20 21
3. FINANCIAL ACCOUNTS 3.11 Rest of the WorldFinancial balance sheet
(*) Unsectorised: monetary gold and SDRs
EUR billions
Net financial assets Financial assets Liabilities
Total vis-à-vis: (*) Total Mone- Cur- Secu- Loans Shares Insur- Other Total Cur- Secu- Loans Shares Insur- Other tary rency rities and ance rency rities and ance gold and other other tech. and other other tech- Non- Finan- General House- and depo- than equity nical depo- than equity nical finan- cial govern- holds SDRs sits shares re- sits shares re- cial insti- ment and serves serves corpo- tu- non- ra- tions profit tions insti- tu- tions
08 864 258 511 179 -78 -6 2 224 -6 547 790 341 499 2 50 1 360 299 380 156 470 7 49 09 964 278 521 249 -73 -10 2 324 -10 541 833 359 553 3 45 1 360 266 380 165 497 6 47 10 912 250 484 257 -66 -13 2 260 -13 548 761 380 530 4 49 1 347 254 304 175 558 6 51 11 959 266 509 252 -55 -14 2 290 -14 642 689 389 529 5 51 1 331 259 282 190 540 5 55 12 947 266 525 225 -54 -16 2 291 -16 740 579 396 540 5 48 1 344 272 256 205 551 5 54
08 IV 864 258 511 179 -78 -6 2 224 -6 547 790 341 499 2 50 1 360 299 380 156 470 7 49
09 I 877 255 497 195 -64 -6 2 195 -6 550 798 347 455 2 49 1 318 281 375 158 449 7 48 II 935 282 511 212 -64 -6 2 267 -6 552 807 363 501 2 47 1 333 272 379 164 464 6 47 III 952 289 511 230 -70 -9 2 302 -9 540 809 365 549 2 46 1 350 264 386 166 483 6 46 IV 964 278 521 249 -73 -10 2 324 -10 541 833 359 553 3 45 1 360 266 380 165 497 6 47
10 I 949 266 506 263 -75 -11 2 323 -11 552 833 368 531 3 46 1 374 258 379 168 515 5 48 II 903 239 500 253 -77 -13 2 280 -13 585 782 373 502 3 47 1 377 262 357 174 530 6 49 III 948 260 509 261 -70 -12 2 288 -12 550 793 375 531 3 48 1 340 243 332 174 535 6 50 IV 912 250 484 257 -66 -13 2 260 -13 548 761 380 530 4 49 1 347 254 304 175 558 6 51
11 I 958 281 486 265 -63 -12 2 300 -12 538 776 380 564 5 49 1 342 266 288 176 554 6 52 II 964 269 505 262 -59 -12 2 303 -12 579 750 382 551 5 50 1 339 263 279 184 554 5 53 III 959 263 497 267 -54 -14 2 284 -14 603 736 388 517 5 50 1 325 260 286 190 529 5 54 IV 959 266 509 252 -55 -14 2 290 -14 642 689 389 529 5 51 1 331 259 282 190 540 5 55
12 I 947 264 531 224 -58 -14 2 308 -14 696 650 397 524 5 50 1 361 277 283 194 547 5 55 II 926 262 533 204 -58 -15 2 302 -15 792 555 399 517 5 49 1 376 285 275 215 541 5 55 III 947 266 525 225 -54 -16 2 291 -16 740 579 396 540 5 48 1 344 272 256 205 551 5 54
A
1 2 3 4 5 6 7 8 9 10 11 12 13 14 15 16 17 18 19 20 21
3. FINANCIAL ACCOUNTS 3.12 Rest of the WorldFinancial transactions account
EUR billions
Net financial transactions Net acquisition of financial assets Net incurrence of liabilities
Total vis-à-vis: (*) Total Mone- Cur- Securi- Loans Shares Insur- Other Total Cur- Secu- Loans Shares Insur- Other tary rency ties and ance rency rities and ance gold and other other tech- and other other tech- Non- Finan- General House- and depo- than equity nical depo- than equity nical finan- cial govern- holds SDRs sits shares re- sits shares re- cial insti- ment and serves serves insti- tu- non- tu- tions profit tions insti- tutions
08 100 15 68 11 2 3 119 - 87 -30 32 35 - -6 19 -14 14 8 19 1 -8 09 46 6 -26 67 10 -10 39 - -5 37 2 11 - -5 -7 -34 - 3 17 -1 8 10 40 2 17 29 8 -16 14 - -5 -26 15 24 2 4 -25 -15 -74 10 33 - 21 11 34 17 14 -10 18 -6 60 - 94 -70 8 27 - 2 26 3 -13 14 12 - 10 12 13 -1 23 -17 4 5 17 - 97 -104 7 20 - -2 4 12 -23 16 4 - -6
(*) Unsectorised: monetary gold,SDRs and a part of ’Other’
08 IV 22 -1 28 2 -5 -3 -8 - 6 -31 10 9 - -2 -29 -41 2 -1 11 - -
09 I 19 - -4 15 11 -3 2 - -3 5 4 -3 - -1 -17 -21 -4 - 5 - 3 II 9 10 -12 16 - -5 20 - 5 6 9 2 - -2 11 -8 7 9 -1 - 3 III 8 4 -8 15 - -2 8 - -6 4 -1 13 - -1 - -7 1 -1 6 -1 1 IV 9 -9 -2 21 -1 - 8 - -1 21 -10 -1 - -1 -1 2 -4 -6 6 - 1
10 I 14 3 6 12 -4 -3 5 - 3 -2 -2 4 - 1 -9 -9 -8 - 5 -1 4 II 11 -2 18 1 - -5 -6 - 20 -29 1 -1 - 1 -17 - -30 - 6 - 6 III 8 1 -3 6 7 -3 2 - -25 6 9 10 - 1 -6 -16 -19 9 15 - 5 IV 6 - -5 11 5 -4 13 - -4 -1 6 10 1 1 7 11 -17 1 7 - 5
11 I 15 11 -12 10 4 2 31 - -6 14 2 20 - - 16 13 -10 2 12 - -1 II 6 -5 12 -7 7 -1 11 - 42 -26 1 -7 - - 4 -3 -3 8 - - 2 III 6 3 2 -1 4 -2 9 - 20 -21 5 5 - - 3 -5 3 5 -3 - 3 IV 6 8 12 -12 3 -6 10 - 37 -37 - 9 - - 3 -2 -3 -1 3 - 7
12 I 15 9 26 -26 2 3 33 - 55 -37 9 7 - -1 19 19 -4 5 2 - -3 II 2 -7 23 -9 -2 -3 26 - 92 -70 - 5 - -1 25 6 -8 21 3 - 3 III -3 -3 -26 17 4 5 -43 - -51 3 -2 9 - -1 -40 -12 -12 -10 -1 - -6
BANCO DE ESPAÑA 65 BOLETÍN ESTADÍSTICO, FEBRUARY 2013


CHAPTER 4 CREDIT INSTITUTIONS

Conceptos del Capítulo 8
Conceptos del Capítulo 4
1 2=1-3 3=4+9+14+17 4=5a8 5 6 7 8
(*) Véase nota al final del capítulo/See note at the end of the chapter
___________________________________________________________________________________________________________________________
4. ENTIDADES DE CRÉDITO Balance agregado según los estados de supervisión
Datos referidos a Diciembre de 2012 DATOS DEL CAPITULO 8 / CHAPTER 8 DATA
TOTAL Conciliación TOTAL PRÉSTAMOS Y CRÉDITOS / LOANS CAPÍTULO 4/ Capítulo 8 Capítulo 8
TOTAL con en concep- CHAPTER 4 Capítulo 4/ tos del TOTAL RESIDENTES EN ESPAÑA/ NO RESID
Reconcilia- Capítulo 4/ DOMESTIC EN ESPAÑA/ tion of TOTAL NON Chapter 8 Chapter 8 RESIDENT with in terms of Chapter 4 Chapter 4 IFM/ AAPP/ OSR/ MFI GG ORS
1. Créditos . . . . . . . . . . . . . . . . . . . 2 228 813 489 2 228 324 2 228 324 279 744 114 221 1 603 261 231 098
Residentes en España . . . . . . . . . . . . . 1 997 272 47 1 997 225 1 997 225 279 744 114 221 1 603 261 Sistema crediticio . . . . . . . . . . . . . . . 278 857 -886 279 744 279 744 279 744 Administraciones Públicas . . . . . . . . . . . . 114 275 54 114 221 114 221 114 221 Otros sectores residentes . . . . . . . . . . . . 1 604 140 878 1 603 261 1 603 261 1 603 261
Residentes en el exterior . . . . . . . . . . . . 231 541 443 231 098 231 098 231 098
2. Valores distintos de acciones . . . . . . . . . 508 982 0 508 982
Residentes en España . . . . . . . . . . . . . 426 154 378 425 777
Sistema crediticio . . . . . . . . . . . . . . . 75 561 -3 75 564 Administraciones Públicas . . . . . . . . . . . . 240 728 0 240 728 Otros sectores residentes . . . . . . . . . . . . 109 866 381 109 485
Residentes en el exterior . . . . . . . . . . . . 82 828 -377 83 205
3. Acciones y participaciones . . . . . . . . . . 258 645 0 258 644
Residentes en España . . . . . . . . . . . . . 168 436 0 168 436
Sistema crediticio . . . . . . . . . . . . . . . 55 846 -18 55 864 Otros sectores residentes . . . . . . . . . . . . 112 589 18 112 571
Residentes en el exterior . . . . . . . . . . . . 90 209 90 209
4. Operaciones no sectorizadas . . . . . . . . . 426 905 341 426 564
TOTAL . . . . . . . . . . . . . . . . . . . . . 3 423 344 831 3 422 514 2 228 324 279 744 114 221 1 603 261 231 098
December 2012 data
4. Reconciliation between the credit institutions‘ balancesheets in chapters 4 and 8. Assets (*)
BANCO DE ESPAÑA 68 BOLETÍN ESTADÍSTICO, FEBRUARY 2013

Chapter 8 headings
Chapter 4 headings
9 10 11 12 13 14=15+16 15 16 17
___________________________________________________________________________________________________________________________
4. Conciliación entre los balances de las Entidades de Crédito que se presentan en los capítulos 4 y 8 de este Boletín (*) Activo
Millones de euros
DATOS DEL CAPITULO 8 / CHAPTER 8 DATA DATOS DEL CAPÍTULO 8/CHAPTER 8 DATA VALORES DISTINTOS DE ACCIONES / ACCIONES Y PARTICIPACIONES / SIN SEC- SECURITIES OTHER THAN SHARES SHARES AND OTHER EQUITY TORIZAR/ UNCLASSI- FIED TOTAL RESIDENTES EN ESPAÑA / NO RESIDEN TOTAL RESIDENTES NO RESIDEN DOMESTIC TES EN EN ESPAÑA/ TES EN ESPAÑA/ DOMESTIC ESPAÑA/ . NON NON RESIDENT RESIDENT IFM/ AAPP/ OSR/ MFI GG ORS
1. Loans
Domestic Credit system General Government Other resident sectors
Non resident
508 982 75 564 240 728 109 485 83 205 2. Securities other than shares
425 777 75 564 240 728 109 485 Domestic
75 564 75 564 Credit system 240 728 240 728 General Government 109 485 109 485 Other resident sectors
83 205 83 205 Non resident
258 644 55 864 202 780 3. Shares and other equity
168 436 55 864 112 571 Domestic
55 864 55 864 Credit system 112 571 112 571 Other resident sector
90 209 90 209 Non resident
426 564 4. Unclassified
508 982 75 564 240 728 109 485 83 205 258 644 55 864 202 780 426 564 TOTAL
EUR millions
4. CREDIT INSTITUTIONS Aggregated balance sheets data from supervisory returns
BANCO DE ESPAÑA 69 BOLETÍN ESTADÍSTICO, FEBRUARY 2013

Conceptos del Capítulo 8
Conceptos del Capítulo 4
1 2=1-3 3=4+10+11 4=5 + 9 5=6 A 8 6
(*) Véase nota al final del capítulo/See note at the end of the chapter
___________________________________________________________________________________________________________________________
4. ENTIDADES DE CRÉDITO Balance agregado según los estados de supervisión
Datos referidos a Diciembre de 2012 DATOS DEL CAPÍTULO 8
TOTAL Conciliación TOTAL DEPÓSITOS / CAPITULO 4/ con Capítulo 8
TOTAL Capítulo 4/ en concep- CHAPTER 4 Reconcilia- tos del ca- RESIDENTES EN ESPAÑA
tion with pítulo 4/ Chapter 4 TOTAL Chapter 8 TOTAL TOTAL IFM/ in terms MFI of Chapter 4
1. Depósitos . . . . . . . . . . . . . . . . . . . 2 297 496 -496 2 297 992 2 297 992 1 958 967 574 762
Residentes en España . . . . . . . . . . . . . . 1 958 471 -496 1 958 967 1 958 967 1 958 967 574 762 Sistema crediticio . . . . . . . . . . . . . . . . 572 846 -449 573 295 573 295 573 295 573 295 Administraciones Públicas . . . . . . . . . . . . 69 183 -0 69 183 69 183 69 183 Otros sectores residentes . . . . . . . . . . . . . 1 316 443 -46 1 316 490 1 316 490 1 316 490 1 467
Residentes en el exterior . . . . . . . . . . . . . 339 025 0 339 025 339 025
2. Valores distintos de acciones y participaciones . . 394 300 0 394 300
3. Operaciones no sectorizadas . . . . . . . . . . 731 548 1 326 730 222
TOTAL . . . . . . . . . . . . . . . . . . . . . . 3 423 344 831 3 422 514 2 297 992 1 958 967 574 762
December 2012 data
4. Reconciliation between the credit institutions’ balancesheets in chapters 4 and 8 (*). Liabilities
BANCO DE ESPAÑA 70 BOLETÍN ESTADÍSTICO, FEBRUARY 2013

Chapter 8 headings
Chapter 4 headings
7 8 9 10 11
___________________________________________________________________________________________________________________________
4. Conciliación entre los balances de las Entidades de Crédito que se presentan en los capítulos 4 y 8 de este Boletín (*) Pasivo
Millones de euros
/CHAPTER 8 DATA DATOS DEL CAPÍTULO 8/CHAPTER 8 DATA DEPOSITS Sin sectorizar/Unclassified / DOMESTIC Valores Resto/ Residentes distintos Other AAPP/ OSR/ en el de accs.y General ORS resto del participac/ Government mundo/ Securities Rest of other than the world shares
69 183 1 315 022 339 025 1. Deposits
69 183 1 315 022 Domestic Credit system 69 183 General Government 1 315 022 Other resident sectors
339 025 Non resident
394 300 2. Securities other than shares
730 222 3. Unsectorised transactions
69 183 1 315 022 339 025 394 300 730 222 TOTAL
EUR millions
4. CREDIT INSTITUTIONS Aggregated balance sheets data from supervisory returns
BANCO DE ESPAÑA 71 BOLETÍN ESTADÍSTICO, FEBRUARY 2013

P
1=2+5+6 2=3+4 3 4 5 6
4. CREDIT INSTITUTIONS 4.A Assets=Liabilities of credit institutions,A) Aggregated balance sheet from by institutionssupervisory returns
See notes at the end of the chapter
EUR millions
Total Deposit-taking institutions Specialised Official credit credit Credit
institutions institutions Institute Total Spanish Branches (a) (b) companies foreing (c) companies
06 2 517 121 2 420 500 2 231 487 189 012 63 874 32 747 07 2 946 499 2 836 830 2 607 492 229 338 69 315 40 354 08 3 223 716 3 096 256 2 859 446 236 810 73 842 53 617 09 3 238 236 3 122 834 2 899 965 222 868 54 200 61 201 10 3 251 535 3 119 257 2 914 435 204 822 53 540 78 734
11 Aug 3 325 964 3 186 789 2 976 630 210 159 50 621 88 554 Sep 3 345 551 3 205 627 2 997 467 208 160 50 515 89 409 Oct 3 333 455 3 192 371 2 982 834 209 537 50 188 90 897 Nov 3 330 053 3 187 031 2 978 081 208 950 49 603 93 418 Dec 3 400 435 3 250 226 3 041 656 208 569 54 637 95 573
12 Jan 3 426 761 3 270 911 3 060 720 210 191 53 477 102 373 Feb 3 445 027 3 286 306 3 074 676 211 630 53 246 105 475 Mar 3 523 509 3 342 422 3 123 771 218 651 53 772 127 316 Apr 3 470 732 3 294 567 3 075 045 219 522 53 636 122 530 May 3 526 692 3 354 196 3 135 935 218 262 52 355 120 140 Jun 3 534 727 3 360 482 3 140 851 219 632 52 106 122 139 Jul 3 502 743 3 330 367 3 109 873 220 494 51 642 120 734 Aug 3 459 572 3 288 459 3 068 004 220 455 51 078 120 034 Sep 3 467 923 3 301 138 3 084 039 217 099 50 190 116 595 Oct 3 435 968 3 269 903 3 052 873 217 030 49 171 116 894 Nov 3 427 170 3 263 723 3 065 339 198 384 48 547 114 900 Dec 3 423 344 3 257 009 3 061 761 195 248 49 555 116 781
P
1 =2a11 2 3 4 5 6 7 8 9 10 11 12 13
4. CREDIT INSTITUTIONS 4.1 AssetsA) Aggregated balance sheet fromsupervisory returns
See notes at the end of the chapter
EUR millions Securities Shares and
Total Loans other than other equity Unsectorised Memo items shares assets Of which: Domestic Rest Domestic Rest Domestic Rest Cash Other Doubtful of the (c) of the (c) of the (d) assets Arrears world world world (e) (f) Credit General Other (c) system govern- resident ment sector (a) (b)
06 2 517 121 224 052 41 278 1 508 626 208 267 134 699 85 055 103 700 48 189 8 352 154 904 11 626 8 996 07 2 946 499 246 129 42 841 1 760 213 254 491 187 027 80 882 101 817 81 801 8 542 182 757 17 147 14 063 08 3 223 716 263 091 52 919 1 869 882 253 311 243 416 82 291 92 206 79 686 9 007 277 908 65 617 52 102 09 3 238 236 246 806 64 662 1 837 037 236 621 321 847 93 599 99 414 84 637 8 517 245 096 96 846 79 463 10 3 251 535 234 095 78 971 1 843 950 229 627 319 711 64 050 103 150 77 327 7 883 292 769 111 014 87 079
11 Aug 3 325 964 254 589 86 692 1 787 965 230 224 320 308 61 729 155 301 88 820 7 165 333 170 131 498 ... Sep 3 345 551 238 608 87 792 1 788 857 232 405 316 245 60 325 162 983 88 631 6 863 362 841 131 843 108 677 Oct 3 333 455 243 869 87 691 1 778 730 231 002 315 380 60 366 165 652 88 737 7 082 354 946 135 758 ... Nov 3 330 053 233 568 88 081 1 785 073 229 453 315 304 58 646 161 583 89 068 7 018 362 260 137 974 ... Dec 3 400 435 250 867 89 687 1 782 554 234 059 347 216 58 366 160 679 90 152 7 486 379 368 143 470 110 074
12 Jan 3 426 761 243 627 90 796 1 769 819 229 870 377 236 61 014 166 649 91 295 7 072 389 383 147 837 ... Feb 3 445 027 240 682 91 328 1 763 378 239 365 394 054 65 808 167 835 91 513 6 803 384 260 150 517 ... Mar 3 523 509 288 791 92 466 1 768 454 252 000 412 421 67 010 166 496 91 169 6 853 377 850 151 741 119 777 Apr 3 470 732 248 205 93 104 1 751 076 249 577 406 058 65 287 166 906 91 958 6 829 391 733 156 942 ... May 3 526 692 256 078 104 712 1 740 731 254 081 396 793 63 205 166 789 91 483 6 790 446 028 160 148 ... Jun 3 534 727 253 014 123 522 1 744 215 266 948 395 942 61 152 165 967 90 909 6 837 426 222 172 920 127 983 Jul 3 502 743 254 464 123 887 1 716 969 256 404 386 034 59 028 166 486 91 236 7 083 441 153 177 807 ... Aug 3 459 572 252 830 122 013 1 698 775 245 493 377 009 59 054 167 669 92 020 6 843 437 867 183 357 ... Sep 3 467 923 257 391 121 021 1 701 789 238 959 385 988 59 940 168 084 91 219 6 606 436 925 186 753 143 083 Oct 3 435 968 259 519 120 906 1 688 634 240 445 384 490 54 590 167 070 91 054 6 778 422 483 194 546 ... Nov 3 427 170 266 387 119 324 1 683 622 237 135 383 114 45 406 164 488 91 033 6 644 430 017 196 568 ... Dec 3 423 344 278 857 114 275 1 604 140 231 541 426 154 82 828 168 436 90 209 7 434 419 471 172 183 ...
BANCO DE ESPAÑA 72 BOLETÍN ESTADÍSTICO, FEBRUARY 2013

P
1=3 a10 2=3a6 3 4 5 6 7 8 9 10
4. CREDIT INSTITUTIONS 4.2 LiabilitiesA) Aggregated balance sheet fromsupervisory returns
See notes at the end of the chapter
EUR millions
Total Deposits Unsectorised liabilities Total Domestic Rest Securities Equity, Welfare Accrual of the other adjustments fund and world than and liabilities sundry Credit General Other shares impairment (d) accounts system govern- resid. allowances (d) ment sector (c) (a) (b)
06 2 517 121 1 820 081 228 281 66 715 1 144 526 380 560 352 634 180 970 2 529 161 290 07 2 946 499 2 108 131 268 638 75 220 1 322 583 441 690 426 416 206 284 2 994 203 056 08 3 223 716 2 328 336 314 964 76 054 1 432 573 504 745 395 204 242 426 3 136 255 378 09 3 238 236 2 320 191 304 979 81 805 1 426 888 506 518 434 134 269 798 3 314 212 005 10 3 251 535 2 300 219 269 668 79 080 1 440 425 511 046 432 892 282 515 3 217 234 019
11 Aug 3 325 964 2 290 638 300 327 60 661 1 395 413 534 238 429 580 342 098 3 403 260 245 Sep 3 345 551 2 284 427 290 122 70 743 1 392 640 530 922 424 836 350 060 3 329 282 898 Oct 3 333 455 2 270 044 313 376 66 764 1 370 645 519 259 428 982 353 019 3 274 278 137 Nov 3 330 053 2 269 058 319 630 75 355 1 365 472 508 601 429 585 349 902 3 171 278 337 Dec 3 400 435 2 307 138 372 668 69 717 1 373 079 491 675 434 512 363 348 3 022 292 414
12 Jan 3 426 761 2 292 911 373 411 75 499 1 354 684 489 318 445 194 375 809 2 982 309 866 Feb 3 445 027 2 326 574 418 554 75 519 1 356 829 475 673 444 527 377 861 2 896 293 169 Mar 3 523 509 2 415 974 529 189 74 253 1 367 763 444 770 441 952 377 182 2 915 285 487 Apr 3 470 732 2 365 023 521 461 67 638 1 334 340 441 584 432 161 375 800 2 878 294 870 May 3 526 692 2 391 468 554 903 80 083 1 326 957 429 524 423 924 371 721 3 299 336 281 Jun 3 534 727 2 422 180 614 666 68 590 1 331 824 407 101 410 702 383 831 3 276 314 737 Jul 3 502 743 2 370 173 635 623 61 976 1 287 248 385 326 410 443 385 166 3 208 333 754 Aug 3 459 572 2 330 761 640 605 55 460 1 273 698 360 998 408 326 388 293 3 165 329 027 Sep 3 467 923 2 337 979 606 890 74 069 1 291 019 366 001 401 167 398 121 3 102 327 553 Oct 3 435 968 2 319 316 596 032 68 915 1 291 653 362 717 395 576 398 459 3 051 319 566 Nov 3 427 170 2 312 584 592 193 75 442 1 303 268 341 681 389 590 397 670 2 936 324 390 Dec 3 423 344 2 297 496 572 846 69 183 1 316 443 339 025 394 300 405 173 2 085 324 290
P
1=4+5+7 2 3 4 5 6 7 8 9 10 11 12 13
4. CREDIT INSTITUTIONS 4.3 Lending. Other resident sectorsA) Aggregated balance sheet fromsupervisory returns
See notes at the end of the chapter
EUR millions
of which: Secured loans Other fixed- Debts Finance Doubtful Loans Trade term loans repay- leases debtors assu- credit able med
Total At a va- In of which: of which: on (c) by the riable foreign demand State (a) interest curren- Total Total rate cy Mortgage Repur- Hybrid loans chase finan- agree- cial ments assets
+10+11+12 (b)
06 1 508 626 1 016 519 11 440 85 376 922 976 883 841 414 589 3 524 14 34 113 40 713 10 859 - 07 1 760 213 1 197 991 15 910 90 842 1 068 372 1 018 785 497 883 6 537 - 40 572 46 293 16 251 - 08 1 869 882 1 248 392 24 896 74 215 1 108 796 1 064 549 529 457 16 070 5 49 128 45 229 63 057 - 09 1 837 037 1 249 050 17 877 55 263 1 115 828 1 074 976 493 839 23 364 13 40 946 37 833 93 327 - 10 1 843 950 1 256 445 20 144 54 219 1 101 064 1 059 395 509 396 39 219 14 39 825 32 246 107 199 -
11 Aug 1 787 965 1 230 931 18 582 47 019 1 056 759 1 017 386 488 774 38 336 13 38 629 28 999 127 785 - Sep 1 788 857 1 234 717 19 614 46 835 1 054 258 1 015 217 491 183 42 325 13 39 954 28 546 128 080 - Oct 1 778 730 1 200 909 18 716 46 298 1 046 051 1 007 016 484 600 36 236 12 41 720 28 094 131 967 - Nov 1 785 073 1 255 228 19 022 46 659 1 041 554 1 002 038 491 131 38 013 11 43 831 27 671 134 227 - Dec 1 782 554 1 250 187 19 659 49 937 1 032 823 995 825 490 485 43 880 10 42 438 27 111 139 760 -
12 Jan 1 769 819 1 245 879 19 073 46 050 1 023 016 985 977 486 940 42 110 9 43 499 26 460 143 855 - Feb 1 763 378 1 240 208 18 250 44 703 1 017 288 979 840 486 736 45 302 6 42 303 25 959 146 390 - Mar 1 768 454 1 240 208 18 357 44 666 1 012 782 975 144 493 767 51 207 1 43 612 25 658 147 968 - Apr 1 751 076 1 193 763 18 754 43 500 1 003 535 966 147 481 842 39 921 1 44 116 25 284 152 800 - May 1 740 731 1 231 482 19 780 42 592 995 593 959 694 481 413 41 624 1 40 259 24 901 155 973 - Jun 1 744 215 1 227 715 18 845 43 087 981 312 945 776 479 159 48 783 1 47 782 24 504 168 370 - Jul 1 716 969 1 217 702 19 240 40 769 973 178 938 306 464 301 39 351 7 41 201 24 198 173 323 - Aug 1 698 775 1 214 632 18 649 39 082 966 133 931 171 452 860 36 474 7 38 185 23 739 178 776 - Sep 1 701 789 1 217 340 18 315 39 007 958 243 924 058 461 067 45 812 7 37 946 23 299 182 226 - Oct 1 688 634 1 189 432 17 457 37 950 947 241 913 144 451 892 45 771 7 39 049 22 904 189 598 - Nov 1 683 622 1 203 488 16 785 37 950 939 025 905 375 449 351 47 166 6 43 138 22 571 191 588 - Dec 1 604 140 1 132 649 16 095 40 550 900 884 868 203 434 658 44 812 6 38 759 21 842 167 447 -
BANCO DE ESPAÑA 73 BOLETÍN ESTADÍSTICO, FEBRUARY 2013

P
1 2 3 4 5 6 7 8 9 10 11 12 13 14 15
4. CREDIT INSTITUTIONS 4.4 Assets. SecuritiesA) Aggregated balance sheet fromsupervisory returns
See notes at the end of the chapter
EUR millions
Securities other than shares Shares and other equity
Total Domestic Rest of the world Total Domestic Rest of the world Total Credit General government Other Net Total Short Total Credit Other system resi- positions system resi- dent (a) dent Net Total Short sector sector positions (a)
06 219 754 134 699 24 911 70 477 76 439 5 962 39 310 85 055 87 146 2 091 151 889 103 700 16 268 87 432 48 189 07 267 909 187 027 37 154 76 499 79 423 2 924 73 374 80 882 83 250 2 369 183 617 101 817 16 015 85 801 81 801 08 325 706 243 416 45 810 96 702 100 316 3 615 100 904 82 291 83 737 1 447 171 892 92 206 13 659 78 547 79 686 09 415 445 321 847 64 951 148 998 154 689 5 691 107 898 93 599 96 190 2 591 184 051 99 414 13 409 86 006 84 637 10 383 761 319 711 61 757 156 698 164 721 8 023 101 255 64 050 70 663 6 612 180 477 103 150 14 944 88 206 77 327
11 Aug 382 037 320 308 61 570 165 804 174 852 9 048 92 933 61 729 69 063 7 334 244 122 155 301 55 308 99 994 88 820 Sep 376 570 316 245 59 914 163 469 172 256 8 787 92 862 60 325 67 324 7 000 251 614 162 983 58 228 104 756 88 631 Oct 375 747 315 380 60 416 162 143 168 962 6 819 92 822 60 366 67 264 6 898 254 388 165 652 59 181 106 470 88 737 Nov 373 950 315 304 58 778 162 692 170 509 7 817 93 834 58 646 65 521 6 874 250 650 161 583 58 311 103 272 89 068 Dec 405 582 347 216 66 026 190 198 198 017 7 820 90 993 58 366 64 131 5 765 250 830 160 679 59 547 101 131 90 152
12 Jan 438 250 377 236 73 794 212 833 221 807 8 974 90 609 61 014 67 205 6 191 257 944 166 649 64 468 102 181 91 295 Feb 459 862 394 054 74 956 229 004 238 177 9 172 90 094 65 808 72 467 6 659 259 348 167 835 65 030 102 805 91 513 Mar 479 432 412 421 73 495 246 704 255 442 8 738 92 222 67 010 72 970 5 960 257 664 166 496 64 017 102 478 91 169 Apr 471 344 406 058 70 795 244 081 252 159 8 078 91 182 65 287 71 643 6 356 258 864 166 906 64 083 102 823 91 958 May 459 999 396 793 66 911 239 066 245 630 6 564 90 817 63 205 69 221 6 016 258 272 166 789 62 705 104 085 91 483 Jun 457 094 395 942 64 392 240 067 246 188 6 121 91 483 61 152 67 164 6 012 256 875 165 967 60 982 104 985 90 909 Jul 445 062 386 034 65 761 231 595 238 070 6 475 88 678 59 028 65 022 5 994 257 722 166 486 61 163 105 323 91 236 Aug 436 062 377 009 66 969 226 447 232 541 6 094 83 592 59 054 65 055 6 001 259 688 167 669 61 584 106 085 92 020 Sep 445 928 385 988 65 277 237 608 242 446 4 838 83 103 59 940 66 232 6 292 259 303 168 084 61 851 106 233 91 219 Oct 439 079 384 490 65 607 233 888 241 541 7 653 84 995 54 590 61 463 6 874 258 124 167 070 61 523 105 548 91 054 Nov 428 520 383 114 64 928 242 277 248 428 6 151 75 909 45 406 52 195 6 790 255 521 164 488 56 038 108 450 91 033 Dec 508 982 426 154 75 561 240 728 246 843 6 115 109 866 82 828 90 283 7 455 258 645 168 436 55 846 112 589 90 209
P
1=3+7+8+ 2 3=4 a 6 4 5 6 7 8 9 10 11 12 13
4. CREDIT INSTITUTIONS 4.5 Liabilities. Other resident sectors.A) Aggregated balance sheet fromsupervisory returns
See notes at the end of the chapter
EUR millions
Of which: Overnight, saving and agreed mat. dep. Funds Hybrid Repur- Subor- Other By from finan- chase dinate liabi- Provin- financial cial agree- depo- lities ces
Total In In euro asset liabi- ments sits (e) foreign In transfers lities (d) (a) curren- foreign (b) (c) cy Total Over- Savings With curren- night accoun. agreed cy
+12 maturi. 9+10+11
06 1 144 526 32 717 884 995 261 928 186 408 436 659 29 208 96 561 23 519 83 851 26 392 - 929 017 07 1 322 583 43 844 1 010 827 258 643 179 395 572 789 35 644 116 957 29 196 85 626 44 333 - 1 042 400 08 1 432 573 36 740 1 153 861 244 812 179 777 729 272 29 318 91 761 27 463 84 976 45 194 - 1 143 674 09 1 426 888 33 064 1 190 538 262 735 207 791 720 012 22 015 68 139 24 095 69 388 52 713 - 1 142 013 10 1 440 425 30 737 1 216 702 261 766 211 287 743 649 19 383 55 614 25 664 71 137 51 926 - 1 148 253
11 Aug 1 395 413 27 878 1 191 968 263 004 202 760 726 205 18 356 51 476 27 082 57 942 48 588 - ... Sep 1 392 640 28 366 1 185 362 262 154 199 648 723 559 18 403 51 086 27 376 60 891 49 521 - 1 125 504 Oct 1 370 645 25 996 1 171 487 258 737 197 144 715 605 16 261 51 547 27 077 55 879 48 395 - ... Nov 1 365 472 26 918 1 169 150 263 932 198 708 706 510 16 882 49 484 27 012 54 266 48 678 - ... Dec 1 373 079 28 062 1 170 396 269 711 202 949 697 736 17 719 53 510 27 180 60 212 44 062 - 1 109 656
12 Jan 1 354 684 27 892 1 155 783 261 864 197 452 696 467 17 631 52 377 26 899 58 130 43 864 - ... Feb 1 356 829 27 371 1 156 698 261 613 196 345 698 740 17 279 51 326 26 956 63 877 40 691 - ... Mar 1 367 763 26 153 1 164 745 269 236 197 542 697 967 15 913 49 835 26 959 69 448 40 864 - 1 103 113 Apr 1 334 340 26 533 1 147 041 262 713 195 471 688 857 16 166 48 635 26 632 56 213 39 653 - ... May 1 326 957 27 587 1 142 345 267 269 196 783 678 293 16 793 46 925 25 752 56 214 38 929 - ... Jun 1 331 824 27 161 1 147 410 275 881 205 806 665 724 16 488 45 490 24 450 61 371 36 615 - 1 088 677 Jul 1 287 248 27 718 1 117 591 261 375 201 566 654 649 16 775 43 839 23 583 52 162 33 298 - ... Aug 1 273 698 27 227 1 113 081 261 148 201 384 650 549 16 494 43 821 22 552 47 255 30 495 - ... Sep 1 291 019 27 634 1 119 736 261 544 200 291 657 901 17 081 43 594 21 755 58 902 29 952 - 1 058 119 Oct 1 291 653 30 272 1 121 919 254 977 198 725 668 216 20 067 42 260 20 400 60 025 26 982 - ... Nov 1 303 268 30 353 1 134 099 256 936 201 912 675 252 20 469 41 971 20 636 59 704 26 389 - ... Dec 1 316 443 30 200 1 147 398 265 027 199 073 683 298 20 486 42 855 19 610 60 111 25 984 - ...
BANCO DE ESPAÑA 74 BOLETÍN ESTADÍSTICO, FEBRUARY 2013

P
1 2 3 4 5 6 7 8=9+10 9 10 11=12+15 12=13+ 13 14 15
4. CREDIT INSTITUTIONS 4.6 Other unsectorisedA) Aggregated balance sheet from assetssupervisory returns
See notes at the end of the chapter
EUR millions
Fixed assets Welfare fund assets Accrual and sundry accounts Rights Assets Non-cu- Intan- Accrual
Total Furni- Real on leased rrent gible Total Real Furni- Sundry shings estate assets out assets assets estate shings accounts held under held Total Accrued Other under opera- for Total inte- accrual (a) finance ting sale rest lease leases 14
06 27 297 6 241 17 902 556 804 503 1 290 1 474 1 167 307 126 133 11 031 8 454 2 578 115 102 07 29 025 6 787 18 338 540 910 829 1 621 1 679 1 245 434 152 053 14 018 11 526 2 493 138 035 08 35 184 7 318 19 821 594 881 4 193 2 378 1 767 1 285 483 240 957 16 174 13 347 2 827 224 783 09 43 275 6 990 20 969 594 831 11 317 2 573 1 815 1 305 510 200 006 10 934 8 681 2 253 189 072 10 47 886 6 343 21 933 600 765 15 599 2 646 1 868 1 398 470 243 014 12 071 8 766 3 306 230 943
11 Aug 52 851 5 882 22 166 577 725 20 473 3 027 1 828 1 402 426 278 491 13 689 9 727 3 962 264 802 Sep 53 414 5 827 22 082 571 709 21 126 3 099 1 798 1 373 425 307 629 13 811 9 461 4 350 293 818 Oct 54 065 5 765 22 072 568 699 21 836 3 126 1 794 1 354 440 299 087 14 115 9 756 4 359 284 972 Nov 54 523 5 724 19 824 563 715 24 523 3 174 1 789 1 347 442 305 947 15 421 10 494 4 927 290 526 Dec 55 436 5 692 19 601 573 735 25 373 3 463 1 738 1 309 429 322 194 13 127 9 608 3 519 309 067
12 Jan 55 945 5 654 19 583 584 727 25 962 3 434 1 733 1 313 420 331 706 12 591 9 241 3 350 319 115 Feb 56 615 5 636 19 534 572 712 26 727 3 434 1 728 1 311 417 325 917 15 012 9 883 5 129 310 905 Mar 57 197 5 554 19 364 572 703 27 559 3 445 1 723 1 311 412 318 929 15 316 9 881 5 435 303 613 Apr 57 680 5 549 19 255 570 692 28 136 3 477 1 718 1 309 409 332 335 15 284 9 433 5 851 317 051 May 58 132 5 490 19 219 568 684 28 534 3 637 1 719 1 314 406 386 177 16 314 9 971 6 344 369 863 Jun 58 179 5 446 18 912 566 679 28 057 4 520 1 720 1 317 403 366 323 15 590 9 067 6 523 350 733 Jul 58 190 5 414 18 375 562 672 28 528 4 639 1 714 1 314 399 381 250 15 438 8 763 6 675 365 811 Aug 59 313 5 422 18 527 558 660 28 480 5 667 1 708 1 312 396 376 845 16 888 9 739 7 149 359 957 Sep 59 848 5 356 18 687 585 649 28 745 5 825 1 704 1 310 393 375 374 16 554 10 225 6 329 358 820 Oct 60 291 5 281 18 646 580 632 29 172 5 980 1 698 1 307 391 360 494 16 067 10 046 6 021 344 426 Nov 60 597 5 262 18 526 547 624 29 699 5 940 1 662 1 279 383 367 758 16 400 10 588 5 812 351 358 Dec 51 919 5 204 16 876 539 619 21 488 7 193 1 086 831 255 366 466 13 237 8 285 4 952 353 229
P
1=2+9+ 2=3+8 3=4a7 4 5 6 7 8 9 10 11 12 13
4. CREDIT INSTITUTIONS 4.7 Equity, valuation adjustments and impairment allowancesA) Aggregated balance sheet fromsupervisory returns
See notes at the end of the chapter
EUR millions Equity Financial Impairment assets and allowances (c) Memo items liabili-
Total Total Own funds Valua- ties tion valuation Total Of which: Investment adjust- adjust- impairments Total Capital Reser- Net Other ments ments losses and en- ves profits accounts (a) (b) Total Loans (f) dowment Loans especific
10 fund (d) ORS (e)
06 180 970 148 787 137 606 15 930 106 311 19 694 -4 329 11 181 1 184 30 999 29 565 4 734 100 07 206 284 174 922 164 931 17 745 119 811 25 676 1 698 9 990 -6 209 37 572 34 873 6 372 1 168 08 242 426 180 567 180 913 21 099 140 470 18 556 788 -346 13 326 48 532 44 619 18 850 611 09 269 798 190 369 188 204 23 667 148 316 12 517 3 704 2 165 14 637 64 793 54 733 35 188 4 873 10 282 515 178 166 181 401 30 423 136 931 9 244 4 802 -3 236 13 647 90 703 71 696 42 489 2 652
11 Aug 342 098 230 832 233 829 44 388 177 423 3 590 8 427 -2 996 15 932 95 334 72 293 ... ... Sep 350 060 236 519 240 487 46 957 181 429 3 738 8 363 -3 968 17 692 95 849 72 355 46 634 2 916 Oct 353 019 240 182 245 074 48 191 186 358 2 393 8 132 -4 892 16 461 96 376 72 686 ... ... Nov 349 902 236 717 244 564 48 328 185 732 2 600 7 905 -7 848 15 695 97 490 73 659 ... ... Dec 363 348 220 161 224 286 51 646 180 319 -14 609 6 929 -4 124 17 928 125 258 83 265 51 903 17 406
12 Jan 375 809 244 009 246 315 53 651 185 257 101 7 307 -2 307 19 361 112 439 82 455 ... ... Feb 377 861 246 959 248 823 53 835 185 493 752 8 742 -1 863 17 954 112 948 83 486 ... ... Mar 377 182 247 007 250 840 55 382 183 020 1 150 11 287 -3 833 17 079 113 096 83 387 53 645 276 Apr 375 800 242 301 249 424 55 525 183 644 -637 10 892 -7 123 18 079 115 420 84 284 ... ... May 371 721 223 407 237 103 55 733 170 375 -94 11 090 -13 696 21 250 127 065 87 294 ... ... Jun 383 831 216 958 228 831 59 237 170 624 -10 746 9 716 -11 873 18 253 148 620 101 187 61 435 5 942 Jul 385 166 214 600 228 407 59 616 174 291 -12 065 6 566 -13 807 20 396 150 170 102 544 ... ... Aug 388 293 216 291 227 747 59 418 172 680 -10 703 6 351 -11 455 17 790 154 211 106 797 ... ... Sep 398 121 219 438 228 266 63 962 171 904 -13 659 6 059 -8 828 16 910 161 773 112 263 70 071 6 433 Oct 398 459 216 106 222 992 64 464 172 974 -17 366 2 920 -6 886 14 953 167 401 117 333 ... ... Nov 397 670 207 829 213 273 65 374 173 269 -28 172 2 802 -5 444 15 751 174 090 127 240 ... ... Dec 405 173 198 504 203 227 77 377 188 150 -63 777 1 478 -4 723 15 103 191 566 124 415 ... ...
BANCO DE ESPAÑA 75 BOLETÍN ESTADÍSTICO, FEBRUARY 2013

P
1 2 3 4 5 6 7 8 9 10 11 12 13
4. CREDIT INSTITUTIONS 4.8 UnsectorisedA) Aggregated balance sheet from liabilitiessupervisory returns
See notes at the end of the chapter
EUR millions
Welfare fund and liabilities Other liabilities
Total Fund Reser- Other Total Provisions Accruals Sundry ves accounts (a) Total For For Other Total Accrued Other pensions taxes interest
06 2 529 2 020 122 387 161 290 28 101 21 776 488 5 837 22 643 16 116 6 527 110 547 07 2 994 2 360 120 514 203 056 28 897 20 616 420 7 860 28 623 21 575 7 047 145 536 08 3 136 2 492 109 535 255 378 30 279 20 993 735 8 551 30 464 24 590 5 874 194 635 09 3 314 2 625 109 580 212 005 30 371 20 110 845 9 416 24 740 18 544 6 197 156 894 10 3 217 2 581 130 507 234 019 32 864 20 906 722 11 236 25 156 19 202 5 954 175 998
11 Aug 3 403 2 856 124 423 260 245 28 596 18 861 719 9 016 26 288 20 442 5 845 205 361 Sep 3 329 2 777 124 429 282 898 28 564 18 706 725 9 133 26 804 20 998 5 806 227 530 Oct 3 274 2 717 138 418 278 137 28 314 18 523 708 9 084 27 280 21 045 6 234 222 543 Nov 3 171 2 633 138 400 278 337 28 040 18 435 682 8 923 28 460 21 765 6 695 221 837 Dec 3 022 2 423 138 461 292 414 28 328 18 340 626 9 363 26 872 21 233 5 639 237 214
12 Jan 2 982 2 386 138 457 309 866 27 678 17 946 632 9 101 26 997 21 001 5 996 255 191 Feb 2 896 2 339 138 419 293 169 27 794 17 927 684 9 183 26 278 20 796 5 482 239 098 Mar 2 915 2 408 138 368 285 487 28 143 17 711 683 9 749 25 105 19 873 5 233 232 239 Apr 2 878 2 385 138 355 294 870 28 220 17 746 674 9 801 24 998 19 483 5 515 241 652 May 3 299 2 822 138 338 336 281 28 157 17 690 722 9 744 25 665 19 940 5 725 282 459 Jun 3 276 2 850 138 288 314 737 30 133 17 753 762 11 618 24 364 19 136 5 228 260 240 Jul 3 208 2 693 138 377 333 754 30 018 17 310 739 11 968 24 283 19 024 5 259 279 453 Aug 3 165 2 779 138 248 329 027 30 409 17 106 799 12 504 26 658 20 944 5 713 271 961 Sep 3 102 2 743 138 221 327 553 31 447 16 698 825 13 924 27 310 21 545 5 765 268 796 Oct 3 051 2 681 138 232 319 566 31 615 16 622 699 14 295 27 210 21 124 6 086 260 740 Nov 2 936 2 607 130 199 324 390 31 287 16 397 753 14 137 28 160 21 815 6 346 264 942 Dec 2 085 1 703 55 328 324 290 35 640 16 666 697 18 276 27 715 22 023 5 692 260 935
P
1 2 3 4 5 6 7 8 9 10 11 12 13 14
4. CREDIT INSTITUTIONS 4.9 Other assets and liabilitiesA) Aggregated balance sheet fromsupervisory returns
See notes at the end of the chapter
EUR millions
Assets Liabilities
Total Derivatives Insuran- Tax Other Total Derivatives Tax Tax Other ce assets assets collec- liabi- liabi- contract (d) tion lities lities Total Tra- Hed- linked to Total Trading Hedging accounts (h) ding ging pensions (e) (f) (g) (a) (b) (c)
06 115 102 57 973 43 502 14 471 10 252 16 549 30 328 110 547 64 210 46 766 17 444 7 447 9 372 29 518 07 138 035 77 592 63 990 13 603 9 965 18 935 31 543 145 536 94 883 69 485 25 398 7 904 9 315 33 434 08 224 783 157 894 127 595 30 299 9 991 20 587 36 312 194 635 149 610 125 232 24 378 7 151 5 402 32 472 09 189 072 122 436 90 040 32 397 9 684 19 587 37 366 156 894 112 125 91 618 20 507 6 746 5 915 32 108 10 230 943 145 958 107 351 38 608 9 187 31 231 44 567 175 998 131 262 109 362 21 900 6 734 6 460 31 543
11 Aug 264 802 175 198 133 434 41 764 9 112 34 288 46 204 205 361 157 087 131 619 25 468 7 310 7 380 33 583 Sep 293 818 201 470 156 596 44 873 9 094 34 580 48 675 227 530 179 272 152 438 26 834 7 201 7 236 33 821 Oct 284 972 188 182 145 502 42 680 9 089 35 591 52 109 222 543 168 941 142 273 26 667 7 499 7 369 38 734 Nov 290 526 189 611 146 859 42 751 9 077 35 743 56 096 221 837 170 945 144 330 26 615 7 447 7 369 36 076 Dec 309 067 209 286 162 773 46 514 9 085 37 389 53 306 237 214 188 544 160 699 27 845 6 317 7 087 35 265
12 Jan 319 115 216 704 166 911 49 793 9 071 38 831 54 509 255 191 196 367 165 607 30 760 14 914 7 406 36 503 Feb 310 905 208 526 160 806 47 720 9 061 38 815 54 503 239 098 190 103 160 057 30 046 6 611 7 465 34 920 Mar 303 613 201 281 155 876 45 405 9 023 39 639 53 670 232 239 182 284 153 663 28 621 6 448 7 569 35 937 Apr 317 051 211 500 164 309 47 190 9 032 41 032 55 488 241 652 190 629 160 659 29 970 7 152 7 304 36 567 May 369 863 257 769 218 354 39 415 7 498 41 983 62 613 282 459 233 741 212 188 21 553 7 948 7 030 33 738 Jun 350 733 230 462 191 048 39 413 7 095 46 020 67 157 260 240 205 105 185 536 19 569 7 731 7 787 39 617 Jul 365 811 247 939 205 675 42 263 7 139 46 785 63 949 279 453 222 441 201 792 20 649 10 488 7 434 39 090 Aug 359 957 246 163 203 830 42 334 7 133 46 975 59 687 271 961 220 963 200 581 20 381 7 077 8 050 35 871 Sep 358 820 238 517 197 930 40 586 7 117 48 176 65 011 268 796 214 256 195 131 19 125 6 743 8 055 39 743 Oct 344 426 229 570 191 997 37 573 7 121 48 164 59 571 260 740 207 237 188 653 18 584 7 497 7 460 38 547 Nov 351 358 234 774 196 820 37 955 6 943 48 421 61 220 264 942 211 885 193 339 18 546 7 953 7 504 37 600 Dec 353 229 229 177 191 220 37 957 6 965 59 715 57 372 260 935 206 534 188 170 18 364 6 244 7 612 40 544
BANCO DE ESPAÑA 76 BOLETÍN ESTADÍSTICO, FEBRUARY 2013

1 2 3 4 5 6 7 8 9 10 11 12 13
4. CREDIT INSTITUTIONS 4.10 Impairment allowances of lending to otherA) Aggregated balance sheet from resident sectorssupervisory returns
See notes at the end of the chapter
EUR millions Financing of productive activities Other financing to households and NPISHs
Total Total Agricul- Industry Constru- Servi- Total House Of wich: House Consumer NPISHs Other (a) ture, (exclu- tion ces purchase renova- durables hunting, ding tion forestry constru- Mortgage and ction) loans fishing
06 4 734 2 682 156 882 319 1 326 2 051 393 368 53 562 30 1 013 07 6 372 3 279 156 698 528 1 898 3 093 900 866 66 734 32 1 362 08 18 850 11 979 244 1 204 2 198 8 334 6 870 2 746 2 658 140 1 237 25 2 722 09 35 188 25 646 314 2 611 5 122 17 599 9 542 2 760 2 588 210 2 231 28 4 313 10 42 489 32 314 440 3 289 5 773 22 813 10 175 3 163 2 913 238 2 258 33 4 482
09 Q1 23 938 15 496 265 1 478 3 026 10 727 8 442 3 275 3 167 187 1 547 26 3 407 Q2 27 178 17 922 318 1 821 3 638 12 146 9 256 3 321 3 184 227 1 863 26 3 818 Q3 30 080 20 730 309 2 111 4 128 14 182 9 351 2 927 2 748 216 2 098 27 4 083 Q4 35 188 25 646 314 2 611 5 122 17 599 9 542 2 760 2 588 210 2 231 28 4 313
10 Q1 37 584 28 180 359 2 952 5 553 19 316 9 404 2 784 2 578 221 2 251 35 4 114 Q2 37 021 27 775 346 3 212 5 367 18 850 9 247 2 720 2 514 197 1 995 27 4 308 Q3 39 824 29 024 440 3 497 5 468 19 619 10 800 3 318 3 088 257 2 200 32 4 992 Q4 42 489 32 314 440 3 289 5 773 22 813 10 175 3 163 2 913 238 2 258 33 4 482
11 Q1 43 480 33 639 404 3 251 5 825 24 159 9 841 3 183 2 910 219 2 241 35 4 162 Q2 45 981 36 984 439 3 216 5 896 27 435 8 997 2 805 2 489 220 1 993 54 3 925 Q3 46 634 37 664 505 3 396 5 963 27 800 8 971 2 854 2 541 212 1 964 67 3 874 Q4 51 903 42 691 577 3 546 6 701 31 867 9 212 3 383 3 057 209 1 793 75 3 751
12 Q1 53 645 44 247 619 3 730 7 306 32 592 9 398 3 327 2 998 210 1 648 70 4 143 Q2 61 435 52 362 664 4 189 8 314 39 195 9 072 3 321 3 005 207 1 552 78 3 914 Q3 69 950 60 594 706 4 759 9 271 45 858 9 355 3 575 3 255 226 1 370 93 4 092
P
1=2+3+4 2 3 4 5=6+7+8 6 7 8
4. CREDIT INSTITUTIONS 4.11 Lending by credit institutions to residentB) Breakdown of lending and deposits general government and to other resident sectors, by institutional groupingof credit institutions
See notes at the end of the chapter
EUR millions
Lending to resident general goverment Lending to other resident sectors
Total Deposit- Specialised Official Total Deposit- Specialised Official credit taking credit Credit credit taking credit Credit
institutions institutions institutions Institute institutions institutions institutions Institute (a) (b) (c) (b)
06 41 278 37 981 2 069 1 228 1 508 626 1 445 298 55 577 7 751 07 42 841 38 755 3 000 1 086 1 760 213 1 691 933 57 427 10 852 08 52 919 47 688 3 899 1 332 1 869 882 1 795 109 59 573 15 200 09 64 662 61 228 1 760 1 674 1 837 037 1 776 533 44 422 16 083 10 78 971 74 492 2 180 2 300 1 843 950 1 782 291 42 125 19 533
11 Aug 86 692 82 511 1 764 2 417 1 787 965 1 728 171 39 566 20 228 Sep 87 792 83 513 1 882 2 397 1 788 857 1 728 701 39 495 20 661 Oct 87 691 82 826 1 897 2 968 1 778 730 1 718 755 39 064 20 911 Nov 88 081 82 618 1 853 3 610 1 785 073 1 722 588 38 705 23 780 Dec 89 687 82 989 1 919 4 780 1 782 554 1 715 037 43 064 24 453
12 Jan 90 796 84 405 1 609 4 781 1 769 819 1 698 997 42 055 28 766 Feb 91 328 84 456 1 563 5 309 1 763 378 1 695 379 41 532 26 467 Mar 92 466 85 535 1 569 5 361 1 768 454 1 695 547 41 416 31 491 Apr 93 104 84 888 1 818 6 398 1 751 076 1 678 073 41 073 31 930 May 104 712 91 886 1 826 11 000 1 740 731 1 671 320 40 398 29 014 Jun 123 522 106 259 1 617 15 645 1 744 215 1 674 931 40 377 28 908 Jul 123 887 106 263 1 423 16 200 1 716 969 1 648 327 40 161 28 481 Aug 122 013 104 432 1 370 16 211 1 698 775 1 630 157 39 515 29 104 Sep 121 021 103 474 1 349 16 198 1 701 789 1 633 489 39 050 29 250 Oct 120 906 103 392 1 342 16 172 1 688 634 1 618 514 38 574 31 547 Nov 119 324 101 786 1 307 16 231 1 683 622 1 618 121 37 980 27 522 Dec 114 275 96 890 1 312 16 072 1 604 140 1 536 953 38 996 28 190
BANCO DE ESPAÑA 77 BOLETÍN ESTADÍSTICO, FEBRUARY 2013

P
1=2+11+ 2=3+7 3=4a6 4 5 6 7=8+9 8 9 10 11 12 13 14 15 16
4. CREDIT INSTITUTIONS 4.99 Breakdown of doubtful assetsB) Breakdown of lending and depositsof credit institutions
See notes at the end of the chapter
___________________________________________________________________________________________________________________________
EUR millions
Total By instrument By nature (a) (operations in Spain) (total operations) Loans Domestic Non-Resident Debt Specia- Customer risk Coun- securi- lised try Total ties credit risk Total Credit General Other Total Credit General Other insti- Total Arrears Other insti- Govern- non-res- insti- Govern- resident tutions (d) (e) tutions ment ident tutions ment sectors (c) sectors (b)
12
06 11 626 11 588 11 065 0 205 10 859 523 48 35 440 38 ... 11 744 8 996 2 572 176 07 17 147 17 030 16 439 1 187 16 251 591 35 29 526 118 ... 17 283 14 063 3 141 79 08 65 617 64 670 63 190 0 133 63 057 1 481 330 3 1 148 947 ... 65 966 52 102 13 800 64 09 96 846 95 637 93 495 1 167 93 327 2 142 348 13 1 782 1 209 ... 97 339 79 463 17 800 76 10 111 014 110 022 107 777 0 578 107 199 2 244 282 11 1 952 993 ... 111 822 87 079 24 682 61
11 Ago 131 498 130 392 128 252 1 466 127 785 2 139 278 10 1 851 1 107 ... ... ... ... ... Sep 131 843 130 739 128 551 0 471 128 080 2 188 244 10 1 933 1 105 ... 132 430 108 677 23 700 52 Oct 135 758 134 658 132 486 3 516 131 967 2 173 201 10 1 962 1 100 ... ... ... ... ... Nov 137 974 136 859 134 684 3 454 134 227 2 175 196 11 1 968 1 115 ... ... ... ... ... Dic 143 470 142 416 140 232 3 469 139 760 2 184 167 23 1 994 1 054 ... 144 069 110 074 33 941 54
12 Ene 147 837 146 641 144 451 3 593 143 855 2 190 167 22 2 001 1 196 ... ... ... ... ... Feb 150 517 149 388 146 998 0 607 146 390 2 390 165 22 2 203 1 129 ... ... ... ... ... Mar 151 741 151 113 148 694 1 725 147 968 2 420 166 22 2 232 628 ... 152 316 119 777 32 486 54 Abr 156 942 156 335 153 906 1 1 105 152 800 2 430 170 22 2 237 607 ... ... ... ... ... May 160 148 159 531 157 035 1 1 061 155 973 2 495 167 23 2 306 617 ... ... ... ... ... Jun 172 920 172 292 169 235 1 864 168 370 3 057 193 17 2 847 628 ... 173 501 127 983 45 471 47 Jul 177 807 177 185 174 180 1 856 173 323 3 005 192 17 2 797 622 ... ... ... ... ... Ago 183 357 182 765 179 609 1 832 178 776 3 156 190 17 2 949 592 ... ... ... ... ... Sep 186 753 186 157 183 045 1 817 182 226 3 112 190 47 2 875 596 ... 187 602 143 083 44 475 45 Oct 194 546 193 952 190 516 29 889 189 598 3 436 189 41 3 206 594 ... ... ... ... ... Nov 196 568 195 963 192 472 28 855 191 588 3 491 189 41 3 261 605 ... ... ... ... ... Dic 172 183 171 590 168 052 21 584 167 447 3 539 160 4 3 374 593 ... ... ... ... ...
BANCO DE ESPAÑA 78 BOLETÍN ESTADÍSTICO, FEBRUARY 2013

1=2+3+ 2 3=4+9+10 4=5+8 5=6+7 6 7 8 9 10 11 12 13
4. CREDIT INSTITUTIONS 4.13 (1st Part) Total lending and total doubtful loans to other resident sectors by type.B) Breakdown of lending and deposits Total to finance productive activity (a) and breakdown byby credit institutions type of spending (b)
See notes at the end of chapter.
EUR millions
Total Financing Other financing to households by type of spending of NPISHs Unclas- Memo items productive sified activity Total House purchase and renovation Consumer Other Non-resi- durables dential (c) (d) mortgage Total House purchase Renova- loans tion (e) Total Mortgage Other loans
11+12
04 945 697 482 984 441 443 333 826 317 268 307 766 9 503 16 557 38 379 69 238 3 677 17 594 ... 05 1 202 628 604 061 576 253 448 688 426 954 415 265 11 689 21 734 45 928 81 638 4 666 17 648 25 834 06 1 508 626 781 644 700 294 548 740 523 595 509 144 14 451 25 144 51 461 100 094 5 704 20 983 35 392 07 1 760 213 943 086 789 250 623 540 595 929 580 722 15 207 27 611 56 576 109 133 6 089 21 788 40 739 08 1 869 882 1 016 948 819 412 655 145 626 620 611 483 15 137 28 525 54 176 110 092 6 091 27 431 44 205
09 Q1 1 861 734 1 018 902 808 715 651 495 621 811 608 487 13 324 29 684 50 560 106 660 5 125 28 991 46 681 Q2 1 861 005 1 007 492 815 068 651 564 620 920 607 830 13 090 30 643 49 583 113 922 5 382 33 063 47 907 Q3 1 846 010 996 650 810 149 652 434 622 122 609 395 12 728 30 312 49 840 107 875 5 457 33 754 47 618 Q4 1 837 038 991 363 813 939 654 566 624 755 611 813 12 942 29 811 49 273 110 101 5 523 26 213 48 566
10 Q1 1 827 087 985 197 811 242 655 474 625 856 612 985 12 872 29 617 47 716 108 053 5 372 25 276 48 076 Q2 1 847 066 994 441 821 460 660 436 630 104 618 055 12 049 30 332 44 712 116 312 5 840 25 326 50 378 Q3 1 837 278 991 374 810 717 659 232 628 696 616 401 12 295 30 537 40 259 111 225 5 743 29 444 54 621 Q4 1 843 952 985 157 812 781 662 798 632 449 620 433 12 016 30 348 42 068 107 916 6 096 39 918 51 493
11 Q1 1 824 256 971 962 804 029 658 133 628 138 614 447 13 692 29 995 41 073 104 823 5 710 42 554 50 570 Q2 1 817 801 963 039 805 058 658 999 628 377 615 907 12 470 30 622 40 201 105 858 5 898 43 806 48 789 Q3 1 788 847 951 096 794 554 655 726 625 101 612 810 12 291 30 625 38 478 100 350 6 557 36 639 48 638 Q4 1 782 555 944 058 793 430 656 452 626 550 612 657 13 893 29 902 37 686 99 292 7 000 38 067 48 364
12 Q1 1 768 488 935 176 782 441 649 716 620 182 608 763 11 419 29 534 35 835 96 890 6 643 44 228 52 202 Q2 1 744 215 912 949 779 915 644 201 614 707 603 717 10 991 29 493 34 726 100 988 7 013 44 338 51 389 Q3 1 701 789 886 962 767 855 639 522 610 943 597 181 13 762 28 579 31 953 96 381 6 910 40 061 51 460
14=15+16+ 15 16=17+22+ 17=18+21 18=19+20 19 20 21 22 23 24 25 26
4. CREDIT INSTITUTIONS 4.13 (Cont.) Total lending and total doubtful loans to other resident sectors by type.B) Breakdown of lending and deposits Total to finance productive activity (a) and breakdown byby credit institutions type of spending (b)
See notes at the end of chapter.
EUR millions
Total Financing Other financing to households by type of spending doubtful of NPISHs Unclas- Memo items loans productive sified activity Total House purchase and renovation Consumer Other Non-resi- durables dential (f) (g) mortgage Total House purchase Renova- loans tion (h) Total Mortgage Other loans
24+25 23
04 7 587 4 397 2 830 1 013 939 900 39 74 756 1 061 40 319 ... 05 9 635 5 215 4 073 1 751 1 619 1 547 71 133 877 1 445 44 303 180 06 10 860 5 269 5 167 2 333 2 164 2 074 90 169 1 145 1 689 49 375 273 07 16 251 6 979 8 797 4 495 4 243 4 154 89 252 1 694 2 608 47 427 445 08 63 083 37 293 24 346 15 580 14 836 14 307 529 744 2 873 5 893 49 1 395 1 151
09 Q1 79 397 48 695 29 129 18 624 17 649 17 033 615 975 3 699 6 806 70 1 503 1 683 Q2 85 597 53 232 30 680 19 659 18 653 18 052 601 1 007 3 759 7 262 104 1 580 1 746 Q3 89 735 56 669 31 198 19 931 18 918 18 209 710 1 012 3 867 7 400 53 1 815 1 758 Q4 93 329 61 913 29 931 18 879 17 929 17 360 569 950 3 755 7 297 54 1 431 1 766
10 Q1 97 469 67 266 29 218 18 091 17 141 16 579 561 950 3 651 7 476 56 929 2 046 Q2 98 906 69 312 28 261 17 157 16 271 15 815 456 886 3 513 7 591 79 1 254 2 166 Q3 101 263 72 334 27 700 17 267 16 368 15 880 488 899 2 890 7 543 74 1 155 2 286 Q4 107 199 79 719 25 982 16 038 15 217 14 790 428 821 2 844 7 100 109 1 389 2 467
11 Q1 111 511 84 480 25 894 16 228 15 414 14 877 537 814 2 851 6 814 105 1 033 2 503 Q2 121 608 94 345 26 077 16 527 15 679 15 122 558 847 2 540 7 011 172 1 014 2 558 Q3 128 070 99 562 27 229 17 579 16 688 16 108 580 891 2 373 7 277 182 1 097 2 808 Q4 139 761 109 899 28 650 19 101 18 177 17 564 614 923 2 183 7 366 191 1 021 2 935
12 Q1 147 970 116 963 29 804 19 938 18 971 18 326 645 967 2 105 7 761 166 1 037 3 542 Q2 168 370 136 067 31 206 20 846 19 795 19 094 700 1 051 2 014 8 346 187 909 4 765 Q3 182 226 146 866 34 155 23 227 22 040 20 818 1 222 1 187 1 847 9 081 213 993 5 225
BANCO DE ESPAÑA 79 BOLETÍN ESTADÍSTICO, FEBRUARY 2013

1=2+3+ 2 3=4+9+10 4=5+8 5=6+7 6 7 8 9 10 11 12 13
4. CREDIT INSTITUTIONS 4.14 (1st Part) Total lending and total doubtful loans to other resident sectors by type.B) Breakdown of lending and deposits Total to finance productive activity (a) and breakdown byby credit institutions type of spending. Deposit-taking institutions
See notes at the end of chapter.
EUR millions
Total Financing Other financing to households by type of spending of NPISHs Unclas- Memo items productive sified activity Total House purchase and renovation Consumer Other Non-resi- durables dential (b) (c) mortgage Total House purchase Renova- loans tion (d) Total Mortgage Other loans
11+12
04 900 383 457 152 422 246 328 469 311 952 302 722 9 229 16 517 28 585 65 191 3 674 17 311 ... 05 1 147 735 572 539 553 223 442 729 421 158 409 819 11 338 21 571 34 410 76 085 4 653 17 330 25 826 06 1 445 298 743 532 675 388 543 288 518 340 504 070 14 271 24 947 39 181 92 920 5 694 20 683 35 232 07 1 691 933 900 159 764 562 616 493 589 124 574 313 14 812 27 369 47 389 100 681 6 087 21 125 40 293 08 1 795 109 970 106 791 741 646 705 618 406 603 670 14 736 28 298 44 680 100 356 6 087 27 175 43 616
09 Q1 1 790 748 974 857 782 046 643 038 613 553 600 600 12 953 29 485 41 569 97 439 5 121 28 724 46 092 Q2 1 794 471 967 656 788 638 643 058 612 603 599 893 12 710 30 455 40 670 104 910 5 380 32 797 47 314 Q3 1 782 101 958 663 784 322 643 948 613 800 601 464 12 335 30 148 40 567 99 807 5 456 33 660 47 034 Q4 1 776 533 956 233 788 639 646 142 616 486 603 944 12 542 29 656 40 730 101 767 5 521 26 139 47 967
10 Q1 1 767 995 950 690 786 747 647 038 617 567 605 093 12 474 29 471 39 316 100 393 5 370 25 181 47 484 Q2 1 788 242 960 106 797 393 651 955 621 766 610 103 11 663 30 189 36 249 109 188 5 838 24 905 49 794 Q3 1 777 706 955 990 786 906 650 738 620 358 608 194 12 164 30 380 34 132 102 036 5 740 29 070 54 039 Q4 1 782 291 947 751 788 908 654 254 624 057 612 181 11 876 30 197 33 796 100 859 6 094 39 539 50 921
11 Q1 1 763 282 934 333 780 798 649 535 619 683 606 143 13 540 29 852 32 892 98 371 5 707 42 444 49 999 Q2 1 758 573 927 182 781 799 650 427 619 928 608 111 11 817 30 499 32 077 99 295 5 895 43 686 48 231 Q3 1 728 701 914 054 771 546 647 125 616 613 604 974 11 638 30 513 30 476 93 945 6 555 36 537 48 090 Q4 1 715 037 903 147 766 970 643 556 613 761 602 037 11 725 29 794 29 798 93 616 6 998 37 922 47 880
12 Q1 1 695 547 891 824 756 694 636 897 607 464 596 233 11 231 29 433 28 219 91 579 6 640 40 423 51 677 Q2 1 674 931 872 005 754 561 631 447 602 090 591 227 10 863 29 357 27 477 95 637 7 010 41 354 50 875 Q3 1 633 489 845 984 742 832 626 835 598 388 587 585 10 803 28 447 24 819 91 178 6 907 37 765 50 954
14=15+16+ 15 16=17+22+ 17=18+21 18=19+20 19 20 21 22 23 24 25 26
4. CREDIT INSTITUTIONS 4.14 (Cont.) Total lending and total doubtful loans to other resident sectors by type.B) Breakdown of lending and deposits Total to finance productive activity (a) and breakdown byby credit institutions type of spending. Deposit-taking institutions
See notes at the end of chapter.
EUR millions
Total Financing Other financing to households by type of spending doubtful of NPISHs Unclas- Memo items loans productive sified activity Total House purchase and renovation Consumer Other Non-resi- durables dential (e) (f) mortgage Total House purchase Renova- loans tion (g) Total Mortgage Other loans
24+25 23
04 6 287 3 661 2 278 919 845 810 35 74 472 888 40 308 ... 05 7 969 4 247 3 384 1 592 1 463 1 400 63 129 604 1 188 44 294 179 06 9 101 4 442 4 247 2 135 1 971 1 886 85 164 797 1 315 49 364 266 07 14 176 6 268 7 450 4 209 3 965 3 884 81 244 1 277 1 964 47 412 421 08 59 117 36 042 21 664 14 950 14 219 13 740 479 731 2 108 4 605 49 1 362 1 061
09 Q1 74 655 47 253 25 863 17 777 16 817 16 252 565 959 2 820 5 267 70 1 469 1 592 Q2 80 538 51 685 27 201 18 785 17 794 17 237 556 991 2 798 5 619 104 1 548 1 649 Q3 84 696 55 010 27 823 19 118 18 111 17 463 648 1 007 2 790 5 915 53 1 810 1 691 Q4 88 242 60 202 26 562 17 939 16 994 16 483 511 945 2 814 5 808 54 1 425 1 669
10 Q1 92 304 65 332 25 993 17 203 16 257 15 751 506 946 2 767 6 023 56 923 1 951 Q2 94 010 67 577 25 154 16 270 15 388 14 986 402 882 2 690 6 195 79 1 200 2 074 Q3 96 337 70 460 24 690 16 383 15 488 15 004 484 895 2 285 6 022 74 1 112 2 194 Q4 102 520 77 831 23 232 15 255 14 438 14 019 419 816 2 147 5 831 109 1 348 2 297
11 Q1 106 937 82 555 23 246 15 357 14 549 14 013 536 808 2 215 5 674 105 1 030 2 419 Q2 117 379 92 496 23 699 15 763 14 922 14 384 538 841 2 036 5 900 172 1 012 2 471 Q3 123 860 97 672 24 911 16 792 15 907 15 346 560 886 1 867 6 252 182 1 095 2 726 Q4 135 505 108 096 26 200 17 799 16 883 16 307 577 916 1 736 6 665 191 1 018 2 857
12 Q1 143 614 115 054 27 360 18 611 17 653 17 044 609 958 1 680 7 069 166 1 034 3 464 Q2 163 836 133 983 28 759 19 479 18 433 17 747 686 1 046 1 616 7 664 187 907 4 684 Q3 177 427 144 606 31 618 21 747 20 567 19 942 625 1 181 1 461 8 410 213 990 5 139
BANCO DE ESPAÑA 80 BOLETÍN ESTADÍSTICO, FEBRUARY 2013

1=2+3+ 2 3=4+9+10 4=5+8 5=6+7 6 7 8 9 10 11 12 13
4. CREDIT INSTITUTIONS 4.17 (1st Part) Total lending and total doubtful loans to other resident sectors by type.B) Breakdown of lending and deposits Total to finance productive activity (a) and breakdown byby credit institutions type of spending. SCI
See notes at the end of chapter.
EUR millions
Total Financing Other financing to households by type of spending of NPISHs Unclas- Memo items productive sified activity Total House purchase and renovation Consumer Other Non-resi- durables dential (b) (c) mortgage Total House purchase Renova- loans tion (d) Total Mortgage Other loans
11+12
04 39 391 19 938 19 178 5 339 5 299 5 041 258 40 9 792 4 047 3 273 ... 05 48 874 25 534 23 011 5 941 5 778 5 443 335 163 11 516 5 553 13 317 8 06 55 577 30 384 24 885 5 432 5 235 5 072 164 197 12 279 7 174 10 298 161 07 57 427 32 098 24 666 7 027 6 785 6 406 378 243 9 186 8 453 2 661 446 08 59 573 31 666 27 649 8 419 8 193 7 810 383 226 9 495 9 735 4 254 589
09 Q1 55 371 28 450 26 647 8 436 8 238 7 884 354 199 8 990 9 221 4 267 590 Q2 50 833 24 160 26 408 8 485 8 297 7 934 363 188 8 911 9 012 1 264 593 Q3 48 030 22 130 25 805 8 466 8 302 7 927 375 164 9 272 8 068 1 94 584 Q4 44 422 19 070 25 277 8 402 8 248 7 866 381 155 8 541 8 334 1 74 599
10 Q1 42 568 17 998 24 473 8 414 8 268 7 889 379 147 8 398 7 660 2 95 592 Q2 42 204 17 737 24 045 8 460 8 317 7 949 368 143 8 461 7 124 2 420 584 Q3 41 712 17 548 23 788 8 472 8 315 8 204 112 157 6 126 9 189 2 374 582 Q4 42 125 17 901 23 850 8 522 8 370 8 250 121 152 8 271 7 056 2 376 571
11 Q1 40 413 17 096 23 208 8 577 8 433 8 300 133 143 8 179 6 452 2 107 570 Q2 40 180 16 825 23 236 8 550 8 427 7 793 634 123 8 123 6 563 2 118 559 Q3 39 495 16 408 22 985 8 579 8 467 7 833 634 113 8 001 6 405 2 100 548 Q4 43 064 16 515 26 437 12 875 12 767 10 618 2 149 108 7 887 5 676 2 111 484
12 Q1 41 416 15 571 25 724 12 797 12 696 12 528 168 101 7 615 5 311 2 119 526 Q2 40 377 14 880 25 331 12 733 12 597 12 487 109 137 7 247 5 351 2 163 514 Q3 39 050 13 896 25 001 12 666 12 534 9 593 2 941 132 7 133 5 203 2 151 506
14=15+16+ 15 16=17+22+ 17=18+21 18=19+20 19 20 21 22 23 24 25 26
4. CREDIT INSTITUTIONS 4.17 (Cont.) Total lending and total doubtful loans to other resident sectors by type.B) Breakdown of lending and deposits Total to finance productive activity (a) and breakdown byby credit institutions type of spending. SCI
See notes at the end of chapter.
EUR millions
Total Financing Other financing to households by type of spending doubtful of NPISHs Unclas- Memo items loans productive sified activity Total House purchase and renovation Consumer Other Non-resi- durables dential (e) (f) mortgage Total House purchase Renova- loans tion (g) Total Mortgage Other loans
24+25 23
04 813 248 552 94 94 91 3 1 285 173 0 12 ... 05 1 110 412 690 160 156 148 8 4 273 257 0 9 0 06 1 350 418 920 198 193 188 5 5 349 374 0 11 6 07 1 782 419 1 347 286 278 270 9 8 417 644 - 15 24 08 3 631 915 2 682 630 617 567 50 13 765 1 288 0 33 90
09 Q1 4 400 1 100 3 266 847 831 782 50 16 879 1 539 0 33 92 Q2 4 711 1 200 3 479 875 859 815 44 16 962 1 643 0 32 97 Q3 4 702 1 322 3 375 813 807 745 62 6 1 077 1 485 0 5 67 Q4 4 537 1 161 3 370 940 935 877 58 5 941 1 489 0 6 97
10 Q1 4 558 1 326 3 225 888 883 828 55 5 884 1 453 - 6 95 Q2 4 278 1 117 3 107 888 883 829 55 4 823 1 396 - 54 92 Q3 4 296 1 243 3 010 885 880 876 4 4 605 1 521 - 43 91 Q4 4 060 1 268 2 750 784 779 770 8 5 697 1 269 - 42 169
11 Q1 3 956 1 306 2 647 870 864 864 0 6 636 1 141 - 2 84 Q2 3 614 1 234 2 378 763 758 738 20 6 504 1 111 - 2 86 Q3 3 572 1 252 2 318 786 782 762 20 5 506 1 025 - 2 82 Q4 3 614 1 162 2 450 1 301 1 294 1 257 37 7 448 701 - 2 79
12 Q1 3 574 1 127 2 444 1 327 1 318 1 282 36 9 425 692 0 3 78 Q2 3 624 1 174 2 448 1 367 1 361 1 347 14 6 398 683 0 2 80 Q3 3 793 1 253 2 537 1 479 1 473 876 597 6 387 671 0 3 86
BANCO DE ESPAÑA 81 BOLETÍN ESTADÍSTICO, FEBRUARY 2013

1=2+3+4+5 2 3 4 5=6 a 11 6 7 8 9 10 11
4. CREDIT INSTITUTIONS 4.18 (1st Part) Total lending and total doubtful loans to other resident sectors by typeB) Breakdown of lending and deposits Total to finance productive activity (a). Breakdown by main activityby credit institutions
See notes at the end of chapter.
EUR millions
Total Agricul- Industry Services ture, (exclu- hunting, ding Construc- forestry construc- tion Total Whole- Hotels Trans- Finan- Real Other and tion) sale and and port, cial in- estate services fishing (b) retail rest- storage terme- activi- (b) trade aurants and co- diation ties and re- mmunica- (except pairs tion credit institu- tions)
04 482 984 18 104 90 487 78 372 296 020 49 360 18 636 31 144 17 686 112 165 67 029 05 604 061 20 738 104 695 100 761 377 867 59 629 22 126 35 469 13 521 162 087 85 036 06 781 644 23 014 119 488 134 317 504 825 70 899 25 633 40 170 18 364 244 050 105 708 07 943 086 25 245 141 571 153 453 622 818 82 397 29 260 43 875 32 482 303 514 131 290 08 1 016 948 26 244 156 141 151 848 682 716 87 831 32 002 48 414 44 363 318 032 152 074
09 Q1 1 018 902 24 472 158 905 143 515 692 011 86 592 33 221 44 734 73 142 324 222 130 099 Q2 1 007 492 23 732 158 800 134 690 690 271 84 053 33 034 43 922 73 287 324 664 131 310 Q3 996 650 23 576 153 070 134 045 685 959 81 207 33 635 44 034 72 661 324 439 129 984 Q4 991 363 23 123 152 199 130 438 685 602 81 105 33 728 43 306 74 308 322 984 130 172
10 Q1 985 197 22 791 149 368 126 464 686 574 80 195 34 164 44 083 75 764 322 820 129 547 Q2 994 441 23 366 152 413 124 054 694 607 81 027 35 636 43 964 80 239 321 946 131 795 Q3 991 374 23 456 152 031 121 514 694 374 79 968 35 657 46 262 82 025 320 090 130 372 Q4 985 157 23 128 152 376 114 519 695 134 80 203 35 992 47 865 86 543 315 782 128 749
11 Q1 971 962 22 618 145 796 109 582 693 966 79 278 35 637 47 653 89 297 312 152 129 949 Q2 963 039 22 435 146 481 105 489 688 634 80 131 35 359 48 134 89 850 308 425 126 736 Q3 951 096 22 203 145 503 102 258 681 132 78 664 35 075 47 173 89 558 303 506 127 156 Q4 944 058 21 782 143 246 98 546 680 483 79 576 35 087 47 732 96 274 298 323 123 492
12 Q1 935 176 21 416 139 850 96 193 677 716 78 145 34 820 47 082 98 903 295 696 123 069 Q2 912 949 21 085 138 007 91 869 661 988 78 334 34 114 47 566 93 654 286 942 121 378 Q3 886 962 20 852 135 140 87 793 643 178 75 976 33 530 47 183 87 622 280 245 118 622
12=13+14+ 13 14 15 16=17a22 17 18 19 20 21 22
4. CREDIT INSTITUTIONS 4.18 (Cont.) Total lending and total doubtful loans to other resident sectors by typeB) Breakdown of lending and deposits Total to finance productive activity (a). Breakdown by main activityby credit institutions
See notes at the end of chapter.
EUR millions
Total Agricul- Industry Services doubtful ture, (exclu- loans hunting, ding Construc- forestry construc- tion Total Whole- Hotels Trans- Finan- Real Other and tion) sale and and port, cial in- estate services fishing (b) retail rest- storage terme- activi- (b) trade aurants and co- diation ties and re- mmunica- (except pairs tion credit institu-
15+16 tions)
04 4 397 206 1 195 617 2 379 803 147 168 105 543 613 05 5 215 250 1 302 723 2 941 909 211 221 87 615 897 06 5 269 272 1 463 622 2 912 909 192 231 118 691 770 07 6 979 318 1 393 1 111 4 157 1 096 232 274 212 1 599 744 08 37 293 582 3 225 7 461 26 025 2 487 749 747 245 19 416 2 380
09 Q1 48 695 737 4 301 9 741 33 917 3 392 982 896 377 25 352 2 917 Q2 53 232 802 5 463 10 529 36 438 3 806 1 071 1 048 427 26 523 3 564 Q3 56 669 792 5 888 10 831 39 158 4 117 1 185 1 347 455 28 315 3 739 Q4 61 913 785 6 222 11 069 43 837 4 178 1 271 1 262 500 32 544 4 083
10 Q1 67 266 891 6 593 12 444 47 338 4 408 1 535 1 372 548 35 050 4 425 Q2 69 312 884 6 816 12 250 49 362 4 500 1 614 1 635 693 36 199 4 719 Q3 72 334 956 7 058 12 631 51 688 4 766 1 752 1 586 729 37 707 5 148 Q4 79 719 1 000 6 697 13 888 58 133 4 624 1 911 1 579 855 44 138 5 026
11 Q1 84 480 988 6 850 14 610 62 031 4 600 2 060 1 571 936 47 634 5 230 Q2 94 345 1 196 7 126 15 539 70 483 4 977 2 271 1 581 1 033 54 889 5 732 Q3 99 562 1 288 7 554 16 455 74 265 5 378 2 427 1 644 1 536 57 577 5 704 Q4 109 899 1 420 7 930 17 981 82 568 5 765 2 880 1 975 1 581 63 895 6 473
12 Q1 116 963 1 502 8 531 19 327 87 603 6 057 3 181 2 162 1 681 67 421 7 101 Q2 136 067 1 633 9 616 21 957 102 862 6 792 4 037 2 888 1 827 78 591 8 726 Q3 146 866 1 783 10 620 23 143 111 320 7 350 4 561 3 028 2 027 84 989 9 364
BANCO DE ESPAÑA 82 BOLETÍN ESTADÍSTICO, FEBRUARY 2013

1=2+3+4+5 2 3 4 5=6 a 11 6 7 8 9 10 11
4. CREDIT INSTITUTIONS 4.19 (1st Part) Total lending and total doubtful loans to other resident sectors by typeB) Breakdown of lending and deposits Total to finance productive activity (a). Breakdown by main activity.by credit institutions Deposit-taking institutions
See notes at the end of chapter.
EUR millions
Total Agricul- Industry Services ture, (exclu- hunting, ding Construc- forestry construc- tion Total Whole- Hotels Trans- Finan- Real Other and tion) sale and and port, cial in- estate services fishing (b) (b) retail rest- storage terme- activi- trade aurants and co- diation ties and re- mmunica- (except pairs tion credit institu- tions)
04 457 152 17 823 83 394 75 334 280 602 45 679 18 344 25 762 17 584 109 986 63 246 05 572 539 20 496 95 966 96 997 359 080 54 312 21 714 30 779 13 428 159 290 79 556 06 743 532 22 716 111 452 129 255 480 109 64 902 25 189 33 693 17 907 239 507 98 911 07 900 159 24 915 132 181 147 897 595 165 75 915 28 852 36 403 31 690 298 475 123 830 08 970 106 25 891 144 741 145 986 653 487 81 977 31 596 39 331 43 567 313 244 143 773
09 Q1 974 857 24 030 147 813 138 252 664 763 81 472 32 843 36 535 72 246 318 841 122 826 Q2 967 656 23 420 149 138 130 571 664 526 79 841 32 717 36 292 72 675 319 917 123 085 Q3 958 663 23 303 143 833 129 674 661 853 77 164 33 293 36 027 72 248 319 768 123 354 Q4 956 233 22 879 142 481 126 758 664 115 77 823 33 430 36 154 73 104 317 983 125 622
10 Q1 950 690 22 572 140 092 123 099 664 926 77 024 33 881 36 474 74 587 317 779 125 181 Q2 960 106 23 150 143 196 120 715 673 045 78 010 35 354 36 677 78 639 317 161 127 204 Q3 955 990 23 279 142 873 117 924 671 914 76 864 35 386 38 934 80 611 315 209 124 910 Q4 947 751 22 959 143 356 110 834 670 602 76 924 35 733 40 291 83 381 310 942 123 332
11 Q1 934 333 22 459 137 399 106 448 668 027 76 155 35 382 39 742 85 100 307 384 124 264 Q2 927 182 22 279 138 042 102 430 664 432 76 454 35 103 40 727 87 227 303 811 121 110 Q3 914 054 22 051 137 085 99 053 655 864 75 241 34 816 39 727 85 919 298 855 121 306 Q4 903 147 21 605 134 776 95 224 651 542 75 737 34 800 40 481 88 551 293 797 118 176
12 Q1 891 824 21 242 131 530 92 916 646 136 74 527 34 548 40 118 87 575 291 141 118 226 Q2 872 005 20 897 129 598 88 481 633 030 74 705 33 843 40 823 83 816 282 836 117 009 Q3 845 984 20 670 127 184 84 667 613 463 72 474 33 272 40 458 76 747 276 171 114 341
12=13+14+ 13 14 15 16=17a22 17 18 19 20 21 22
4. CREDIT INSTITUTIONS 4.19 (Cont.) Total lending and total doubtful loans to other resident sectors by typeB) Breakdown of lending and deposits Total to finance productive activity (a). Breakdown by main activity.by credit institutions Deposit-taking institutions
See notes at the end of chapter.
EUR millions
Total Agricul- Industry Services doubtful ture, (exclu- loans hunting, ding Construc- forestry construc- tion Total Whole- Hotels Trans- Finan- Real Other and tion) sale and and port, cial in- estate services fishing (b) retail rest- storage terme- activi- (b) trade aurants and co- diation ties and re- mmunica- (except pairs tion credit institu-
15+16 tions)
04 3 661 202 864 444 2 151 731 142 141 103 499 535 05 4 247 243 917 534 2 553 720 205 180 84 558 807 06 4 442 258 1 081 588 2 515 701 186 187 116 649 676 07 6 268 307 1 184 1 069 3 708 871 225 224 209 1 485 695 08 36 042 571 2 975 7 300 25 196 2 183 731 607 235 19 132 2 308
09 Q1 47 253 722 4 013 9 542 32 975 3 050 963 724 350 25 033 2 855 Q2 51 685 755 5 282 10 350 35 297 3 450 1 033 866 408 26 207 3 333 Q3 55 010 748 5 691 10 608 37 963 3 746 1 148 1 130 427 27 873 3 639 Q4 60 202 740 6 010 10 869 42 583 3 898 1 240 1 063 482 31 876 4 023
10 Q1 65 332 834 6 368 12 239 45 892 4 113 1 503 1 109 531 34 372 4 263 Q2 67 577 861 6 521 12 020 48 175 4 207 1 585 1 406 686 35 653 4 638 Q3 70 460 936 6 743 12 406 50 375 4 394 1 717 1 345 724 37 136 5 059 Q4 77 831 980 6 364 13 683 56 803 4 329 1 875 1 349 850 43 450 4 950
11 Q1 82 555 967 6 522 14 405 60 660 4 314 2 024 1 306 931 46 935 5 151 Q2 92 496 1 175 6 857 15 342 69 122 4 665 2 234 1 318 1 028 54 226 5 651 Q3 97 672 1 267 7 271 16 275 72 859 5 051 2 390 1 373 1 531 56 894 5 619 Q4 108 096 1 395 7 659 17 814 81 228 5 461 2 843 1 730 1 576 63 223 6 394
12 Q1 115 054 1 482 8 261 19 183 86 128 5 759 3 139 1 820 1 673 66 714 7 022 Q2 133 983 1 612 9 341 21 783 101 247 6 501 3 994 2 495 1 823 77 791 8 643 Q3 144 606 1 761 10 330 22 965 109 551 7 004 4 517 2 627 2 025 84 097 9 283
BANCO DE ESPAÑA 83 BOLETÍN ESTADÍSTICO, FEBRUARY 2013

1=2+3+4+5 2 3 4 5=6 a 11 6 7 8 9 10 11
4. CREDIT INSTITUTIONS 4.22 (1st Part) Total lending and total doubtful loans to other resident sectors by typeB) Breakdown of lending and deposits Total to finance productive activity (a). Breakdown by main activityby credit institutions SCI
See notes at the end of chapter.
EUR millions
Total Agricul- Industry Services ture, (exclu- hunting, ding Construc- forestry construc- tion Total Whole- Hotels Trans- Finan- Real Other and tion) sale and and port, cial in- estate services fishing (b) (b) retail rest- storage terme- activi- trade aurants and co- diation ties and re- mmunica- (except pairs tion credit institu- tions)
04 19 938 227 4 456 2 457 12 799 3 680 292 3 336 95 2 038 3 359 05 25 534 192 5 837 3 338 16 167 5 315 392 2 828 85 2 643 4 904 06 30 384 227 6 201 4 440 19 515 5 897 439 3 296 414 4 139 5 330 07 32 098 264 6 433 4 411 20 990 6 279 393 3 950 521 4 511 5 336 08 31 666 292 6 004 4 552 20 818 5 658 389 4 566 527 4 364 5 315
09 Q1 28 450 334 5 442 3 937 18 738 4 899 361 3 675 538 4 917 4 347 Q2 24 160 254 4 077 2 714 17 115 3 973 300 2 776 418 4 265 5 383 Q3 22 130 219 3 780 2 880 15 251 3 818 325 2 858 207 4 214 3 829 Q4 19 070 189 3 626 2 539 12 716 3 109 267 2 010 181 3 971 3 179
10 Q1 17 998 165 3 163 2 211 12 459 2 963 252 1 912 178 3 911 3 244 Q2 17 737 163 3 184 2 069 12 321 2 811 251 1 661 606 3 610 3 382 Q3 17 548 160 3 167 1 963 12 258 2 884 240 1 749 243 3 590 3 553 Q4 17 901 152 3 073 2 003 12 674 3 061 228 1 790 230 3 550 3 814
11 Q1 17 096 144 2 635 1 722 12 595 2 913 224 1 859 137 3 478 3 984 Q2 16 825 140 2 529 1 655 12 502 3 467 224 1 438 202 3 265 3 905 Q3 16 408 136 2 372 1 594 12 305 3 221 228 1 429 200 3 273 3 954 Q4 16 515 131 2 509 1 620 12 256 3 494 230 1 562 182 3 105 3 681
12 Q1 15 571 128 2 406 1 562 11 475 3 239 215 1 472 230 3 100 3 219 Q2 14 880 142 2 597 1 662 10 479 3 275 213 1 383 240 2 644 2 725 Q3 13 896 138 2 177 1 386 10 194 3 162 201 1 403 218 2 573 2 637
12=13+14+ 13 14 15 16=17a22 17 18 19 20 21 22
4. CREDIT INSTITUTIONS 4.22 (Cont.) Total lending and total doubtful loans to other resident sectors by typeB) Breakdown of lending and deposits Total to finance productive activity (a). Breakdown by main activityby credit institutions SCI
See notes at the end of chapter.
EUR millions
Total Agricul- Industry Services doubtful ture, (exclu- loans hunting, ding Construc- forestry construc- tion Total Whole- Hotels Trans- Finan- Real Other and tion) sale and and port, cial in- estate services fishing (b) retail rest- storage terme- activi- (b) trade aurants and co- diation ties and re- mmunica- (except pairs tion credit institu-
15+16 tions)
04 248 4 41 20 184 73 4 27 2 35 42 05 412 4 45 25 339 189 6 41 3 45 54 06 418 4 51 31 332 206 6 38 2 26 53 07 419 4 54 42 319 224 6 44 3 28 14 08 915 6 105 156 648 304 13 136 10 137 47
09 Q1 1 100 10 144 194 751 326 14 172 13 173 52 Q2 1 200 8 142 172 878 298 33 182 12 169 184 Q3 1 322 7 166 215 934 314 33 217 20 294 56 Q4 1 161 9 134 194 825 278 26 198 17 257 49
10 Q1 1 326 11 148 198 969 284 27 218 17 273 151 Q2 1 117 12 156 223 726 283 24 184 7 157 71 Q3 1 243 10 183 218 832 361 30 196 5 161 79 Q4 1 268 10 212 198 849 284 31 185 5 277 67
11 Q1 1 306 11 208 198 890 276 31 220 5 288 70 Q2 1 234 10 176 191 856 302 32 218 5 224 75 Q3 1 252 11 175 173 893 316 31 226 5 240 75 Q4 1 162 13 163 159 827 289 32 198 5 228 75
12 Q1 1 127 9 161 135 821 281 37 215 8 207 74 Q2 1 174 9 157 161 847 267 36 200 4 262 78 Q3 1 253 9 164 161 919 315 36 195 2 298 73
BANCO DE ESPAÑA 84 BOLETÍN ESTADÍSTICO, FEBRUARY 2013

1=2a11 2 3 4 5 6 7 8 9 10 11 12= 13 13 14 15 16 17
4. CREDIT INSTITUTIONS 4.23 (1st Part) Total lending and total doubtful loans to other resident sectors by typeB) Breakdown of lending and deposits Total to finance productive activity (a). Breakdown ofby credit institutions industry and construction.
See notes at the end of chapter.
EUR millions
Industry (excluding construction) Construction Manufacturing Build- Public Fitting Electri- ings works and Site Total Mining city,gas finish- prepa- SCIs
Total and Food, Re- Chem- Non-met- Metals Trans- Total and wa- Total ing ration (b) quarr- bever- fined icals allic and ma- port Other SCIs ter su- ying ages petro- mineral chinery equip- (b) pply and leum products ment tobacco a 17
04 90 487 4 087 13 600 540 4 328 6 703 17 361 3 144 19 583 3 897 17 244 78 372 56 904 4 988 9 136 4 888 2 457 05 104 695 4 865 17 293 619 5 270 9 102 22 667 3 973 23 634 ... 17 272 100 761 75 918 6 119 11 075 7 649 ... 06 119 488 5 246 18 683 1 144 5 554 10 377 26 580 4 083 26 920 ... 20 901 134 317 102 511 9 603 13 196 9 008 ... 07 141 571 5 006 21 256 694 6 572 13 580 30 800 4 320 29 062 ... 30 281 153 453 115 643 12 863 14 778 10 168 ... 08 156 141 5 331 23 658 1 526 7 096 13 923 31 167 4 363 29 028 ... 40 049 151 848 114 339 13 477 14 909 9 123 ...
09 Q1 158 905 5 667 23 253 1 366 6 367 14 083 30 350 4 586 25 915 ... 47 318 143 515 101 045 20 625 14 414 7 431 ... Q2 158 800 5 995 22 854 1 514 6 220 13 546 29 306 4 746 25 008 ... 49 611 134 690 95 200 18 823 13 954 6 714 ... Q3 153 070 6 126 22 814 1 359 6 083 12 853 28 515 4 606 24 317 ... 46 398 134 045 95 283 18 632 13 592 6 538 ... Q4 152 199 6 205 22 639 1 667 6 084 11 802 28 653 4 699 23 750 ... 46 701 130 438 94 161 16 926 13 325 6 026 ...
10 Q1 149 368 5 431 22 540 1 774 5 995 11 559 28 320 5 003 22 971 ... 45 775 126 464 91 040 16 621 13 114 5 690 ... Q2 152 413 5 530 23 069 2 283 6 180 11 655 28 801 4 852 23 171 ... 46 873 124 054 88 239 17 361 13 216 5 238 ... Q3 152 031 5 603 22 458 2 114 6 304 11 334 28 265 4 812 23 113 ... 48 027 121 514 85 451 18 096 12 945 5 022 ... Q4 152 376 5 586 22 418 2 274 6 146 10 868 27 881 5 090 22 956 ... 49 156 114 519 79 815 17 809 12 139 4 756 ...
11 Q1 145 796 5 070 22 394 2 552 6 092 10 093 26 897 5 069 22 472 ... 45 157 109 582 76 265 17 313 11 618 4 386 ... Q2 146 481 5 360 22 582 2 807 6 220 9 782 27 084 4 781 22 125 ... 45 741 105 489 73 453 16 478 11 323 4 235 ... Q3 145 503 5 080 22 311 2 747 5 976 9 454 26 247 4 158 21 795 ... 47 735 102 258 69 478 16 960 11 778 4 043 ... Q4 143 246 5 263 22 239 3 180 5 725 9 434 25 846 3 969 21 333 ... 46 258 98 546 66 458 16 932 11 246 3 910 ...
12 Q1 139 850 5 060 21 807 3 157 5 517 9 151 25 055 4 444 20 868 ... 44 791 96 193 64 585 16 969 10 955 3 684 ... Q2 138 007 4 821 21 411 3 614 5 732 9 111 24 599 4 561 20 102 ... 44 056 91 869 60 947 17 261 10 155 3 506 ... Q3 135 140 4 661 21 303 3 499 5 255 8 578 23 938 4 457 19 519 ... 43 930 87 793 58 178 16 636 9 640 3 339 ...
1=2a11 2 3 4 5 6 7 8 9 10 11 12= 13 13 14 15 16 17
4. CREDIT INSTITUTIONS 4.23 (Cont.) Total lending and total doubtful loans to other resident sectors by typeB) Breakdown of lending and deposits Total to finance productive activity (a). Breakdown ofby credit institutions industry and construction.
See notes at the end of the chapter.
EUR millions
Doubtful loans industry (excluding construction) Doubtful loans construction Manufacturing Build- Public Fitting Electri- ings works and Site Total Mining city,gas finish- prepa- SCIs
Total and Food, Re- Chem- Non-met- Metals Trans- Total and wa- Total ing ration (b) quarr- bever- fined icals allic and ma- port Other SCIs ter su- ying ages petro- mineral chinery equip- (b) pply and leum products ment tobacco a 17
04 1 195 63 145 1 168 67 247 100 297 67 41 617 478 69 16 34 20 05 1 302 65 173 0 223 67 267 83 338 87 ... 723 567 90 23 42 ... 06 1 463 66 188 0 185 70 396 69 370 117 ... 622 427 124 34 38 ... 07 1 393 22 261 0 40 80 364 64 439 122 ... 1 111 765 189 82 75 ... 08 3 225 260 423 1 124 375 721 100 1 104 117 ... 7 461 6 069 739 273 379 ...
09 Q1 4 301 289 536 1 185 549 1 147 119 1 328 148 ... 9 741 7 514 977 590 660 ... Q2 5 463 310 613 1 273 1 112 1 344 151 1 526 131 ... 10 529 8 350 1 075 560 545 ... Q3 5 888 312 657 14 343 1 083 1 472 188 1 671 149 ... 10 831 8 488 1 156 571 615 ... Q4 6 222 316 864 18 381 851 1 586 248 1 799 159 ... 11 069 8 620 1 190 656 603 ...
10 Q1 6 593 339 976 16 391 914 1 728 263 1 801 164 ... 12 444 9 609 1 543 665 626 ... Q2 6 816 266 1 151 3 383 943 1 792 290 1 812 175 ... 12 250 9 414 1 448 683 705 ... Q3 7 058 271 1 343 12 364 989 1 833 345 1 722 178 ... 12 631 9 754 1 467 740 670 ... Q4 6 697 202 1 129 4 325 937 1 813 324 1 685 278 ... 13 888 10 962 1 479 751 695 ...
11 Q1 6 850 209 1 228 4 353 979 1 843 273 1 681 280 ... 14 610 11 942 1 222 787 659 ... Q2 7 126 253 1 176 4 300 1 060 1 955 184 1 817 379 ... 15 539 12 684 1 245 809 802 ... Q3 7 554 278 1 306 6 285 1 082 2 091 227 1 917 361 ... 16 455 13 408 1 324 900 823 ... Q4 7 930 283 1 392 16 308 1 090 2 237 273 1 963 369 ... 17 981 14 661 1 441 1 048 831 ...
12 Q1 8 531 308 1 454 24 359 1 144 2 426 286 2 117 412 ... 19 327 15 673 1 518 1 282 853 ... Q2 9 616 359 1 576 26 406 1 472 2 681 310 2 286 500 ... 21 957 17 495 1 605 1 915 943 ... Q3 10 620 356 1 740 26 429 1 520 3 105 322 2 512 610 ... 23 143 18 416 1 671 2 060 997 ...
BANCO DE ESPAÑA 85 BOLETÍN ESTADÍSTICO, FEBRUARY 2013

1=2a10 2 3 4 5 6 7 8 9 10 11= 12 12 13 14 15
4. CREDIT INSTITUTIONS 4.24 (1st Part) Total lending and total doubtful loans to other resident sectors by typeB) Breakdown of lending and deposits Total to finance productive activity (a). Breakdown ofby credit institutions industry and construction. Deposit-taking institutions
See notes at the end of the chapter.
EUR millions
Industry (excluding construction) Construction Manufacturing Build- Public Fitting Electri- ings works and Site Mining city,gas finish- prepa-
Total and Food, Re- Chem- Non-met- Metals Trans- and wa- Total ing ration quarr- bever- fined icals allic and ma- port Other ter su- ying ages petro- mineral chinery equip- pply and leum products ment tobacco a 15
04 83 394 3 234 13 569 540 4 130 6 623 17 185 2 987 19 519 15 606 75 334 56 374 4 988 9 136 4 837 05 95 966 3 980 16 640 533 4 680 8 682 20 929 3 206 22 017 15 300 96 997 73 709 5 798 10 575 6 915 06 111 452 4 783 17 832 906 5 002 9 799 25 356 3 314 24 886 19 574 129 255 99 317 9 168 12 693 8 078 07 132 181 4 391 20 282 592 6 081 12 595 29 274 3 530 27 077 28 359 147 897 112 435 12 445 14 320 8 698 08 144 741 4 455 22 549 1 012 6 564 12 973 29 538 3 913 27 431 36 306 145 986 110 788 12 619 14 292 8 288
09 Q1 147 813 4 817 22 278 883 5 915 13 114 28 598 4 168 24 480 43 559 138 252 97 902 19 460 13 936 6 954 Q2 149 138 5 150 22 133 1 021 5 816 12 783 27 984 4 457 23 699 46 095 130 571 93 143 17 492 13 616 6 321 Q3 143 833 5 299 22 104 961 5 679 12 135 27 253 4 391 23 247 42 764 129 674 92 999 17 270 13 256 6 150 Q4 142 481 5 143 21 828 1 078 5 690 11 377 27 297 4 462 22 973 42 634 126 758 92 033 16 153 12 997 5 576
10 Q1 140 092 4 662 21 767 1 244 5 587 11 154 26 933 4 827 22 268 41 650 123 099 89 329 15 659 12 825 5 286 Q2 143 196 4 762 22 262 1 709 5 778 11 259 27 434 4 666 22 465 42 861 120 715 86 492 16 378 12 931 4 914 Q3 142 873 4 830 21 658 1 509 5 904 10 949 26 946 4 629 22 472 43 976 117 924 83 705 16 823 12 671 4 724 Q4 143 356 4 826 21 639 1 624 5 819 10 536 26 692 4 813 22 314 45 094 110 834 78 181 16 304 11 870 4 479
11 Q1 137 399 4 264 21 620 1 958 5 767 9 747 25 902 4 804 21 932 41 405 106 448 75 067 15 851 11 397 4 134 Q2 138 042 4 574 21 802 2 209 5 899 9 461 26 053 4 590 21 588 41 866 102 430 72 157 15 188 11 103 3 982 Q3 137 085 4 300 21 559 2 152 5 643 9 138 25 272 3 979 21 270 43 772 99 053 68 238 15 453 11 546 3 816 Q4 134 776 4 472 21 617 2 561 5 378 9 036 24 793 3 817 20 821 42 280 95 224 65 146 15 391 11 038 3 648
12 Q1 131 530 4 278 21 155 2 549 5 178 8 842 24 176 4 191 20 360 40 802 92 916 63 354 15 298 10 770 3 494 Q2 129 598 4 049 20 627 3 070 5 373 8 719 23 656 4 228 19 571 40 305 88 481 59 916 15 323 9 883 3 359 Q3 127 184 3 893 20 682 2 898 4 928 8 275 23 067 4 219 19 016 40 207 84 667 57 212 14 802 9 447 3 206
1=2a10 2 3 4 5 6 7 8 9 10 11= 12 12 13 14 15
4. CREDIT INSTITUTIONS 4.24 (Cont.) Total lending and total doubtful loans to other resident sectors by typeB) Breakdown of lending and deposits Total to finance productive activity (a). Breakdown ofby credit institutions industry and construction. Deposit-taking institutions
See notes at the end of the chapter.
EUR millions
Doubtful loans industry (excluding construction) Doubtful loans construction Manufacturing Build- Public Fitting Electri- ings works and Site Mining city,gas finish- prepa-
Total and Food, Re- Chem- Non-met- Metals Trans- and wa- Total ing ration quarr- bever- fined icals allic and ma- port Other ter su- ying ages petro- mineral chinery equip- pply and leum products ment tobacco a 15
04 864 12 136 1 42 67 224 59 297 26 444 325 69 16 34 05 917 14 161 0 52 66 224 40 320 39 534 394 85 17 37 06 1 081 17 176 0 62 67 355 25 347 32 588 410 119 25 34 07 1 184 21 247 0 38 78 325 21 414 39 1 069 746 184 71 67 08 2 975 254 406 1 117 366 681 57 1 053 40 7 300 5 983 710 253 354
09 Q1 4 013 280 518 1 173 534 1 102 73 1 262 71 9 542 7 405 963 555 619 Q2 5 282 305 595 1 261 1 103 1 299 142 1 462 114 10 350 8 266 1 064 532 489 Q3 5 691 304 644 14 330 1 069 1 419 179 1 600 132 10 608 8 383 1 141 540 545 Q4 6 010 311 850 17 371 839 1 535 201 1 741 145 10 869 8 541 1 177 614 536
10 Q1 6 368 333 959 16 382 897 1 673 215 1 742 151 12 239 9 521 1 524 624 568 Q2 6 521 259 1 071 3 370 921 1 741 242 1 748 164 12 020 9 327 1 430 641 622 Q3 6 743 263 1 244 12 350 969 1 778 298 1 661 168 12 406 9 670 1 449 696 591 Q4 6 364 196 1 022 4 313 916 1 745 279 1 621 269 13 683 10 888 1 461 711 624
11 Q1 6 522 203 1 120 4 340 956 1 782 228 1 619 270 14 405 11 868 1 206 742 589 Q2 6 857 247 1 100 4 288 1 039 1 891 180 1 754 354 15 342 12 613 1 227 764 738 Q3 7 271 267 1 241 4 273 1 063 2 005 222 1 859 337 16 275 13 338 1 307 870 760 Q4 7 659 275 1 326 16 298 1 073 2 154 266 1 910 342 17 814 14 589 1 422 1 019 784
12 Q1 8 261 302 1 382 24 350 1 127 2 340 279 2 069 388 19 183 15 604 1 497 1 257 825 Q2 9 341 354 1 510 25 388 1 455 2 597 302 2 232 478 21 783 17 417 1 574 1 880 912 Q3 10 330 350 1 672 26 412 1 496 3 013 316 2 457 588 22 965 18 325 1 640 2 033 967
BANCO DE ESPAÑA 86 BOLETÍN ESTADÍSTICO, FEBRUARY 2013

1=2a10 2 3 4 5 6 7 8 9 10 11= 12 12 13 14 15
4. CREDIT INSTITUTIONS 4.27 (1st Part) Total lending and total doubtful loans to other resident sectors by typeB) Breakdown of lending and deposits Total to finance productive activity (a). Breakdown ofby credit institutions industry and construction. SCI
See notes at the end of the chapter.
EUR millions
Industry (excluding construction) Construction Manufacturing Build- Public Fitting Electri- ings works and Site Mining city,gas finish- prepa-
Total and Food, Re- Chem- Non-met- Metals Trans- and wa- Total ing ration quarr- bever- fined icals allic and ma- port Other ter su- ying ages petro- mineral chinery equip- pply and leum products ment tobacco a 15
04 4 456 162 ... ... ... ... ... ... ... 397 2 457 ... ... ... ... 05 5 837 202 625 86 336 305 1 567 598 1 551 568 3 338 1 840 321 498 679 06 6 201 230 698 97 358 403 1 148 710 1 985 572 4 440 2 572 435 503 930 07 6 433 232 814 100 318 362 1 062 731 1 912 900 4 411 2 063 419 458 1 471 08 6 004 193 862 123 357 342 1 012 394 1 488 1 232 4 552 2 241 858 618 835
09 Q1 5 442 164 730 78 278 346 1 060 302 1 356 1 128 3 937 1 817 1 165 478 477 Q2 4 077 162 486 106 229 152 709 183 1 177 873 2 714 1 250 733 338 393 Q3 3 780 124 481 22 232 143 658 148 971 999 2 880 1 388 768 336 388 Q4 3 626 77 540 109 214 196 774 148 665 903 2 539 1 173 587 328 451
10 Q1 3 163 67 500 30 228 181 799 90 619 651 2 211 1 006 512 289 404 Q2 3 184 65 520 43 220 165 770 95 621 684 2 069 941 519 285 324 Q3 3 167 50 528 108 217 170 733 88 566 706 1 963 885 505 274 299 Q4 3 073 64 514 147 145 119 717 174 573 621 2 003 740 716 270 277
11 Q1 2 635 80 517 110 143 159 531 159 472 465 1 722 660 589 221 252 Q2 2 529 53 511 119 136 149 569 73 461 457 1 655 814 368 220 254 Q3 2 372 44 485 95 154 145 509 73 449 419 1 594 761 375 232 227 Q4 2 509 54 484 105 166 221 562 80 406 431 1 620 815 361 184 260
12 Q1 2 406 49 517 104 151 138 400 196 403 449 1 562 733 481 160 188 Q2 2 597 36 648 21 175 215 460 278 425 339 1 662 532 741 246 144 Q3 2 177 38 489 87 156 137 400 183 380 308 1 386 463 624 169 131
16= 17 17 18 19 20 21 22 23 24 25 26=27 27 28 29 30
4. CREDIT INSTITUTIONS 4.27 (Cont.) Total lending and total doubtful loans to other resident sectors by typeB) Breakdown of lending and deposits Total to finance productive activity (a). Breakdown ofby credit institutions industry and construction. SCI
See notes at the end of the chapter.
EUR millions
Doubtful loans industry (excluding construction) Doubtful loans construction Manufacturing Build- Public Fitting Electri- ings works and Site Mining city,gas finish- prepa-
Total and Food, Re- Chem- Non-met- Metals Trans- and wa- Total ing ration quarr- bever- fined icals allic and ma- port Other ter su- ying ages petro- mineral chinery equip- pply and leum products ment tobacco
a 25 a 30
04 41 ... ... ... ... ... ... ... ... ... 20 ... ... ... ... 05 45 1 3 0 2 1 15 2 18 0 25 9 5 6 4 06 51 0 5 0 2 3 12 3 23 0 31 14 5 8 4 07 54 1 8 0 2 2 10 2 25 0 42 18 5 11 8 08 105 6 11 0 7 9 15 2 51 0 156 82 29 21 25
09 Q1 144 9 14 0 12 15 20 5 66 0 194 104 15 35 41 Q2 142 5 12 0 12 10 21 5 64 0 172 76 12 28 56 Q3 166 7 10 0 13 14 29 9 71 0 215 98 15 31 71 Q4 134 5 11 0 10 11 29 6 51 0 194 72 13 41 68
10 Q1 148 7 15 0 9 17 32 7 52 0 198 81 19 41 57 Q2 156 7 13 0 13 22 30 6 57 0 223 80 18 43 82 Q3 183 8 33 0 13 21 34 4 62 0 218 77 18 44 78 Q4 212 6 49 0 12 21 49 4 64 0 198 68 19 40 71
11 Q1 208 6 51 0 12 23 42 4 62 0 198 68 16 44 70 Q2 176 6 18 0 12 20 46 4 64 0 191 64 17 45 64 Q3 175 12 19 2 12 19 43 5 57 2 173 63 17 30 63 Q4 163 7 20 0 10 17 41 7 53 0 159 65 19 28 47
12 Q1 161 6 26 0 9 17 43 7 47 0 135 62 20 24 28 Q2 157 5 21 0 10 16 41 8 51 0 161 70 28 34 30 Q3 164 6 22 0 9 19 47 7 50 0 161 80 26 26 29
BANCO DE ESPAÑA 87 BOLETÍN ESTADÍSTICO, FEBRUARY 2013

___________________________________________________________________________________________________________________________
See notes at the end of chapter.
4. CREDIT INSTITUTIONS 4.28 Loans and deposits to general government and other resident sector B) Breakdown of lending and deposits extended by Deposit-taking institutions. Detail by provinces of credit institutions
September 2012 EUR millions
Loans Deposits
Total General Other Total General Other resident sectors Govern- resident Govern- ment sectors ment Total Overnight Savings With agreed Deposits Deposits maturity
1=2+3 2 3 4=5+6 5 6=7+8+9 7 8 9
Álava . . . . . . . . . . . . . 12 889 1 567 11 321 9 917 508 9 409 1 697 2 225 5 487 Albacete . . . . . . . . . . . 8 723 234 8 489 6 415 121 6 294 854 2 037 3 403 Alacant . . . . . . . . . . . . 50 349 1 199 49 150 29 534 812 28 722 6 582 6 042 16 098 Almería . . . . . . . . . . . . 22 829 834 21 994 8 212 240 7 971 1 508 2 272 4 192
Asturias. . . . . . . . . . . . 26 718 2 233 24 485 22 587 437 22 150 3 420 6 364 12 366 Ávila . . . . . . . . . . . . . 4 150 99 4 052 3 973 60 3 913 403 1 105 2 406 Badajoz. . . . . . . . . . . . 14 035 1 675 12 360 9 378 340 9 038 1 217 3 110 4 710 Balears,Illes . . . . . . . . . . 42 544 3 265 39 279 18 022 473 17 549 4 245 3 941 9 363
Barcelona . . . . . . . . . . . 272 439 16 896 255 542 154 327 6 375 147 952 37 414 19 255 91 282 Burgos . . . . . . . . . . . . 13 295 387 12 909 11 201 243 10 958 1 312 3 009 6 637 Cáceres . . . . . . . . . . . 7 125 175 6 950 7 090 200 6 890 987 2 516 3 388 Cádiz. . . . . . . . . . . . . 25 003 1 006 23 997 11 318 313 11 005 2 179 3 523 5 303
Cantabria . . . . . . . . . . . 15 811 1 347 14 464 11 148 322 10 825 1 786 3 706 5 334 Castelló. . . . . . . . . . . . 20 651 408 20 243 11 856 250 11 606 1 541 2 821 7 244 Ciudad Real . . . . . . . . . . 9 790 276 9 514 7 384 194 7 190 949 2 567 3 674 Córdoba . . . . . . . . . . . 19 991 805 19 186 11 066 344 10 722 1 756 3 186 5 780
Coruña, La . . . . . . . . . . 30 710 2 371 28 339 22 345 1 008 21 337 3 229 5 931 12 177 Cuenca . . . . . . . . . . . . 4 912 250 4 662 5 014 74 4 940 565 1 398 2 977 Girona . . . . . . . . . . . . 22 222 692 21 529 12 859 301 12 558 2 473 2 605 7 480 Granada . . . . . . . . . . . 23 678 761 22 917 12 467 432 12 035 1 914 3 716 6 405
Guadalajara . . . . . . . . . . 7 731 99 7 633 4 047 152 3 895 721 939 2 235 Gípuzkoa . . . . . . . . . . . 23 302 942 22 360 22 528 550 21 978 4 410 5 412 12 155 Huelva . . . . . . . . . . . . 10 218 435 9 783 5 140 155 4 985 977 1 654 2 353 Huesca . . . . . . . . . . . . 5 769 146 5 623 4 970 135 4 836 949 1 118 2 768
Jaén . . . . . . . . . . . . . 11 223 412 10 811 8 223 185 8 038 953 2 874 4 211 León . . . . . . . . . . . . . 11 143 405 10 738 11 002 247 10 755 1 744 3 187 5 824 Lleida . . . . . . . . . . . . 13 263 371 12 892 8 413 180 8 233 1 834 1 598 4 801 Lugo . . . . . . . . . . . . . 5 010 131 4 879 7 211 126 7 085 720 2 104 4 261
Madrid . . . . . . . . . . . . 443 726 26 542 417 184 331 554 44 329 287 225 90 495 27 418 169 313 Málaga . . . . . . . . . . . . 40 389 1 442 38 947 19 976 955 19 021 4 226 4 750 10 045 Murcia . . . . . . . . . . . . 49 439 2 210 47 229 24 202 937 23 266 4 328 4 750 14 188 Navarra. . . . . . . . . . . . 22 200 914 21 286 15 966 584 15 381 4 327 2 229 8 826
Ourense . . . . . . . . . . . 4 564 150 4 414 7 079 111 6 968 734 1 971 4 263 Palencia . . . . . . . . . . . 3 414 87 3 327 3 943 87 3 856 523 1 276 2 057 Palmas, Las . . . . . . . . . . 27 510 2 353 25 157 11 927 817 11 111 3 934 1 622 5 555 Pontevedra . . . . . . . . . . 21 500 302 21 198 14 081 510 13 571 2 424 4 286 6 861
Rioja, La . . . . . . . . . . . 11 779 950 10 829 7 593 115 7 478 1 403 1 677 4 399 Salamanca . . . . . . . . . . 9 610 587 9 023 8 266 224 8 042 1 202 2 165 4 675 Tenerife . . . . . . . . . . . 22 563 718 21 845 10 419 630 9 789 2 840 2 125 4 823 Segovia. . . . . . . . . . . . 3 919 89 3 830 3 928 65 3 863 472 971 2 420
Sevilla . . . . . . . . . . . . 60 955 6 646 54 309 24 245 1 490 22 755 6 203 5 880 10 671 Soria . . . . . . . . . . . . . 2 171 59 2 112 2 972 57 2 915 346 791 1 778 Tarragona. . . . . . . . . . . 24 627 901 23 726 11 263 351 10 912 2 597 2 030 6 284 Teruel . . . . . . . . . . . . 2 806 141 2 665 3 081 75 3 007 486 749 1 771
Toledo . . . . . . . . . . . . 18 597 2 906 15 691 11 276 406 10 870 1 465 3 404 6 000 València . . . . . . . . . . . 97 678 9 026 88 652 51 526 2 867 48 659 10 561 11 761 26 337 Valladolid . . . . . . . . . . . 18 204 2 576 15 628 11 855 766 11 089 1 866 2 914 6 309 Bizkaia . . . . . . . . . . . . 45 371 2 443 42 927 38 266 1 579 36 687 8 443 8 637 19 607
Zamora . . . . . . . . . . . . 3 360 96 3 264 4 276 109 4 167 402 1 414 2 351 Zaragoza . . . . . . . . . . . 36 717 2 701 34 016 24 852 378 24 474 4 935 4 346 15 193 Non classified (a) . . . . . . . 27 707 0 27 707 - - - - - -
Autonomous cities Ceuta . . . . . . . . . . . . 1 588 166 1 422 832 29 802 176 220 406 Melilla . . . . . . . . . . . . 1 046 51 996 803 37 765 191 209 366
On-line banking (b) . . . . . . . - - - 28 576 1 28 575 16 571 2 523 9 481
TOTAL . . . . . . . . . . . 1 736 963 103 474 1 633 489 1 130 403 72 284 1 058 119 259 491 200 335 598 293
BANCO DE ESPAÑA 88 BOLETÍN ESTADÍSTICO, FEBRUARY 2013

___________________________________________________________________________________________________________________________
See notes at the end of chapter.
4. CREDIT INSTITUTIONS 4.29 Loans and deposits to general government and other resident B) Breakdown of lending and deposits sector extended by Deposit-taking institutions by regional of credit institutions (autonomous) governments and autonomous cities
September 2012 EUR millions
Loans Depósitos
Total General Other Total General Other resident sectors Government resident Government sectors Total Overnight Saving With agreed deposits deposits maturity
1=2+3 2 3 4=5+6 5 6=7+8+9 7 8 9
País Vasco . . . . . . . . . . . . . 81 561 4 953 76 609 70 710 2 636 68 074 14 551 16 274 37 249 Cataluña . . . . . . . . . . . . . . 332 550 18 860 313 690 186 862 7 207 179 655 44 319 25 489 109 847 Galicia . . . . . . . . . . . . . . . 61 784 2 954 58 831 50 716 1 755 48 961 7 107 14 292 27 562
Andalucía . . . . . . . . . . . . . . 214 286 12 340 201 946 100 646 4 114 96 532 19 716 27 855 48 961 Asturias, Principado de . . . . . . . . 26 718 2 233 24 485 22 587 437 22 150 3 420 6 364 12 366 Cantabria . . . . . . . . . . . . . . 15 811 1 347 14 464 11 148 322 10 825 1 786 3 706 5 334
Rioja, La . . . . . . . . . . . . . . 11 779 950 10 829 7 593 115 7 478 1 403 1 677 4 399 Murcia, Región de . . . . . . . . . . 49 439 2 210 47 229 24 202 937 23 266 4 328 4 750 14 188 Comunitat Valenciana . . . . . . . . 168 678 10 633 158 045 92 916 3 929 88 987 18 684 20 624 49 679
Aragón . . . . . . . . . . . . . . . 45 292 2 988 42 304 32 904 588 32 316 6 370 6 214 19 732 Castilla-La Mancha. . . . . . . . . . 49 754 3 764 45 989 34 136 947 33 189 4 555 10 345 18 289 Canarias . . . . . . . . . . . . . . 50 073 3 071 47 002 22 346 1 447 20 899 6 774 3 747 10 378
Navarra, Comunidad Foral de . . . . . 22 200 914 21 286 15 966 584 15 381 4 327 2 229 8 826 Extremadura . . . . . . . . . . . . 21 160 1 850 19 310 16 468 539 15 928 2 204 5 626 8 098 Balears,Illes . . . . . . . . . . . . . 42 544 3 265 39 279 18 022 473 17 549 4 245 3 941 9 363
Madrid, Comunidad de . . . . . . . . 443 726 26 542 417 184 331 554 44 329 287 225 90 495 27 418 169 313 Castilla y León. . . . . . . . . . . . 69 266 4 384 64 882 61 417 1 857 59 559 8 271 16 832 34 457 Non classified (a) . . . . . . . . . . 27 707 0 27 707 - - - - - -
TOTAL CCAA. . . . . . . . . . . 1 734 328 103 257 1 631 071 1 100 192 72 216 1 027 976 242 553 197 383 588 040
Autonomous cities Ceuta . . . . . . . . . . . . . . . 1 588 166 1 422 832 29 802 176 220 406 Melilla . . . . . . . . . . . . . . 1 046 51 996 803 37 765 191 209 366
On-line banking . . . . . . . . . . . - - - 28 576 1 28 575 16 571 2 523 9 481
TOTAL . . . . . . . . . . . . . . 1 736 963 103 474 1 633 489 1 130 403 72 284 1 058 119 259 491 200 335 598 293
BANCO DE ESPAÑA 89 BOLETÍN ESTADÍSTICO, FEBRUARY 2013

1=2+4 2 3 4 5 6 7 8 9 10 11 12 13 14 15
4. CREDIT INSTITUTIONS 4.30 (1st Part) Loans to general government and other resident sectors byB) Breakdown of lending and deposits Deposit-taking institutions by regional (autonomous) governmentsof credit institutions.
EUR millions
National Other resident General Asturias, total sectors Government País Vasco Cataluña Galicia Andalucía Principado de Total Percen- Total Percen- Total Percen- Total Percen- Total Percen- Total Percen- Total Percen- tage tage tage tage tage tage tage
03 794 400 761 927 95.91 32 472 4.09 46 844 5.90 156 636 19.72 31 683 3.99 102 842 12.95 13 885 1.75 04 934 241 900 383 96.38 33 858 3.62 52 647 5.64 187 036 20.02 36 434 3.90 125 312 13.41 15 332 1.64 05 1 184 911 1 147 746 96.86 37 166 3.14 62 351 5.26 231 010 19.50 45 548 3.84 163 523 13.80 18 875 1.59 06 1 483 280 1 445 298 97.44 37 981 2.56 72 772 4.91 281 673 18.99 55 745 3.76 201 540 13.59 22 836 1.54 07 1 730 688 1 691 933 97.76 38 755 2.24 82 203 4.75 325 245 18.79 65 555 3.79 233 543 13.49 26 739 1.54 08 1 842 797 1 795 109 97.41 47 688 2.59 87 420 4.74 350 230 19.01 70 370 3.82 241 762 13.12 27 990 1.52
09 Q1 1 840 364 1 790 761 97.30 49 603 2.70 86 298 4.69 352 502 19.15 70 385 3.82 240 146 13.05 27 850 1.51 Q2 1 852 054 1 794 471 96.89 57 582 3.11 84 933 4.59 362 134 19.55 70 848 3.83 239 026 12.91 27 995 1.51 Q3 1 840 554 1 782 101 96.82 58 453 3.18 85 249 4.63 355 594 19.32 71 046 3.86 237 130 12.88 27 616 1.50 Q4 1 837 761 1 776 533 96.67 61 228 3.33 83 863 4.56 354 662 19.30 71 283 3.88 237 031 12.90 27 745 1.51
10 Q1 1 832 961 1 767 890 96.45 65 071 3.55 85 365 4.66 356 600 19.45 70 978 3.87 236 209 12.89 27 558 1.50 Q2 1 859 564 1 788 242 96.16 71 322 3.84 86 413 4.65 360 101 19.36 72 044 3.87 237 910 12.79 28 113 1.51 Q3 1 850 837 1 777 705 96.05 73 132 3.95 86 294 4.66 357 796 19.33 71 727 3.88 235 471 12.72 28 005 1.51 Q4 1 856 783 1 782 291 95.99 74 492 4.01 86 884 4.68 357 277 19.24 70 509 3.80 234 147 12.61 28 161 1.52
11 Q1 1 842 800 1 763 282 95.68 79 518 4.32 85 268 4.63 353 832 19.20 68 641 3.72 233 487 12.67 27 912 1.51 Q2 1 841 459 1 758 573 95.50 82 886 4.50 87 414 4.75 347 426 18.87 68 719 3.73 231 508 12.57 27 888 1.51 Q3 1 812 205 1 728 691 95.39 83 513 4.61 87 819 4.85 341 573 18.85 65 722 3.63 228 603 12.61 27 705 1.53 Q4 1 798 026 1 715 037 95.38 82 989 4.62 85 904 4.78 344 754 19.17 64 076 3.56 223 380 12.42 27 575 1.53
12 Q1 1 781 082 1 695 547 95.20 85 535 4.80 84 987 4.77 344 487 19.34 63 403 3.56 220 632 12.39 27 271 1.53 Q2 1 781 190 1 674 931 94.03 106 259 5.97 83 337 4.68 339 565 19.06 63 092 3.54 219 475 12.32 27 416 1.54 Q3 1 736 963 1 633 489 94.04 103 474 5.96 81 561 4.70 332 550 19.15 61 784 3.56 214 286 12.34 26 718 1.54
16 17 18 19 20 21 22 23 24 25 26 27 28 29
4. CREDIT INSTITUTIONS 4.30 (Cont.) Loans to general government and other resident sectors byB) Breakdown of lending and deposits Deposit-taking institutions by regional (autonomous) governmentsof credit institutions.
EUR millions
Cantabria Rioja,La Murcia,Región de Comunitat Aragón Castilla- Canarias Valenciana La Mancha
Total Percen- Total Percen- Total Percen- Total Percen- Total Percen- Total Percen- Total Percen- tage tage tage tage tage tage tage
03 8 165 1.03 5 930 0.75 19 035 2.40 76 778 9.66 22 142 2.79 21 908 2.76 26 750 3.37 04 9 374 1.00 6 886 0.74 23 453 2.51 90 881 9.73 25 896 2.77 26 420 2.83 31 834 3.41 05 11 511 0.97 8 651 0.73 31 819 2.69 121 263 10.23 33 016 2.79 34 441 2.91 40 335 3.40 06 13 694 0.92 10 664 0.72 41 026 2.77 153 748 10.37 40 125 2.71 43 577 2.94 48 911 3.30 07 15 878 0.92 12 424 0.72 48 137 2.78 178 457 10.31 46 328 2.68 52 523 3.03 55 887 3.23 08 16 529 0.90 13 181 0.72 50 912 2.76 188 463 10.23 49 600 2.69 56 986 3.09 58 784 3.19
09 Q1 16 399 0.89 13 175 0.72 50 334 2.73 186 308 10.12 48 999 2.66 56 642 3.08 57 893 3.15 Q2 16 539 0.89 13 200 0.71 49 958 2.70 187 268 10.11 49 136 2.65 57 626 3.11 58 023 3.13 Q3 16 469 0.89 13 041 0.71 49 359 2.68 185 466 10.08 48 880 2.66 57 407 3.12 57 863 3.14 Q4 16 625 0.90 12 996 0.71 49 351 2.69 186 100 10.13 48 847 2.66 57 843 3.15 58 033 3.16
10 Q1 16 617 0.91 13 046 0.71 49 622 2.71 185 963 10.15 49 002 2.67 57 302 3.13 58 009 3.16 Q2 16 916 0.91 13 009 0.70 49 990 2.69 187 824 10.10 49 557 2.66 57 707 3.10 57 723 3.10 Q3 16 914 0.91 13 048 0.70 49 417 2.67 186 264 10.06 49 498 2.67 56 896 3.07 56 971 3.08 Q4 16 764 0.90 12 883 0.69 49 363 2.66 185 657 10.00 49 393 2.66 56 804 3.06 56 394 3.04
11 Q1 16 699 0.91 12 914 0.70 49 067 2.66 184 542 10.01 49 132 2.67 56 144 3.05 55 490 3.01 Q2 16 753 0.91 12 738 0.69 48 846 2.65 185 271 10.06 48 595 2.64 55 783 3.03 54 814 2.98 Q3 16 581 0.91 12 680 0.70 48 918 2.70 183 289 10.11 48 076 2.65 55 003 3.04 53 894 2.97 Q4 16 458 0.92 12 308 0.68 48 196 2.68 180 871 10.06 47 213 2.63 54 197 3.01 52 722 2.93
12 Q1 16 276 0.91 12 217 0.69 48 296 2.71 177 930 9.99 46 050 2.59 52 544 2.95 51 888 2.91 Q2 15 927 0.89 12 010 0.67 48 704 2.73 174 159 9.78 46 026 2.58 50 949 2.86 51 043 2.87 Q3 15 811 0.91 11 779 0.68 49 439 2.85 168 678 9.71 45 292 2.61 49 754 2.86 50 073 2.88
BANCO DE ESPAÑA 90 BOLETÍN ESTADÍSTICO, FEBRUARY 2013

30 31 32 33 34 35 36 37 38 39 40 41 42 43 44 45
4. CREDIT INSTITUTIONS 4.30 (Cont.) Loans to general government and other resident sectors byB) Breakdown of lending and deposits Deposit-taking institutions by regional (autonomous) governmentsof credit institutions.
See notes at the end of chapter.
EUR millions Autonomous cities
Navarra,Comu- Extremadura Balears, Illes Madrid, Castilla y Non- nidad Foral de Comunidad de León classified
Ceuta Melilla (a)
Total Percen- Total Percen- Total Percen- Total Percen- Total Percen- Total Percen- Total Percen- Total Percen- tage tage tage tage tage tage tage tage
03 11 262 1.42 11 162 1.41 20 010 2.52 180 948 22.78 36 137 4.55 639 0.08 573 0.07 1 073 0.14 04 12 884 1.38 12 908 1.38 23 802 2.55 208 913 22.36 41 872 4.48 743 0.08 682 0.07 930 0.10 05 16 216 1.37 15 682 1.32 29 737 2.51 266 535 22.49 51 846 4.38 906 0.08 790 0.07 857 0.07 06 19 660 1.33 18 548 1.25 36 154 2.44 356 713 24.05 62 729 4.23 1 067 0.07 935 0.06 1 161 0.08 07 22 767 1.32 21 723 1.26 42 406 2.45 424 836 24.55 71 553 4.13 1 266 0.07 1 104 0.06 2 117 0.12 08 24 862 1.35 23 277 1.26 46 183 2.51 452 858 24.57 77 278 4.19 1 376 0.07 1 097 0.06 3 638 0.20
09 Q1 24 379 1.32 22 988 1.25 46 368 2.52 455 321 24.74 75 589 4.11 1 401 0.08 1 583 0.09 5 790 0.31 Q2 24 449 1.32 23 185 1.25 46 827 2.53 455 767 24.61 75 327 4.07 1 448 0.08 1 080 0.06 7 288 0.39 Q3 24 365 1.32 23 137 1.26 46 345 2.52 450 949 24.50 75 132 4.08 1 448 0.08 1 066 0.06 12 991 0.71 Q4 24 491 1.33 23 221 1.26 46 661 2.54 449 943 24.48 75 601 4.11 1 509 0.08 1 075 0.06 10 880 0.59
10 Q1 24 332 1.33 23 128 1.26 46 562 2.54 442 848 24.16 75 181 4.10 1 506 0.08 1 053 0.06 12 170 0.66 Q2 24 591 1.32 23 445 1.26 46 979 2.53 455 296 24.48 76 031 4.09 1 541 0.08 1 067 0.06 13 309 0.72 Q3 24 549 1.33 23 361 1.26 46 480 2.51 450 695 24.35 75 173 4.06 1 548 0.08 1 077 0.06 19 655 1.06 Q4 24 320 1.31 23 371 1.26 46 197 2.49 450 895 24.28 75 227 4.05 1 595 0.09 1 070 0.06 29 874 1.61
11 Q1 24 317 1.32 23 249 1.26 46 036 2.50 446 520 24.23 74 525 4.04 1 584 0.09 1 072 0.06 32 369 1.76 Q2 23 917 1.30 23 261 1.26 45 959 2.50 452 679 24.58 74 568 4.05 1 561 0.08 1 088 0.06 32 670 1.77 Q3 23 726 1.31 23 034 1.27 45 118 2.49 446 568 24.64 73 899 4.08 1 553 0.09 1 067 0.06 27 386 1.51 Q4 23 572 1.31 22 815 1.27 45 004 2.50 445 841 24.80 72 872 4.05 1 548 0.09 1 064 0.06 27 658 1.54
12 Q1 23 211 1.30 21 994 1.23 44 589 2.50 441 035 24.76 71 514 4.02 1 546 0.09 1 052 0.06 30 160 1.69 Q2 23 085 1.30 21 690 1.22 43 680 2.45 457 731 25.70 71 162 4.00 1 633 0.09 1 064 0.06 29 443 1.65 Q3 22 200 1.28 21 160 1.22 42 544 2.45 443 726 25.55 69 266 3.99 1 588 0.09 1 046 0.06 27 707 1.60
1=2+4 2 3 4 5 6 7 8 9 10 11 12 13 14 15
4. CREDITS INSTITUTIONS 4.31 (1st Part) Deposits of general government and other residentB) Breakdown of lending and deposits sectors in Deposit-taking institutions by regional (autonomous) governmentsof credit institutions.
EUR millions
National Other resident General Government Asturias, total sectors País Vasco Cataluña Galicia Andalucía Principado de Total Percen- Total Percen- Total Percen- Total Percen- Total Percen- Total Percen- Total Percen- tage tage tage tage tage tage tage
03 674 399 639 816 94.87 34 583 5.13 44 855 6.65 115 174 17.08 32 153 4.77 72 049 10.68 13 185 1.96 04 765 307 723 328 94.51 41 979 5.49 48 060 6.28 133 444 17.44 34 746 4.54 84 939 11.10 14 009 1.83 05 839 171 784 213 93.45 54 958 6.55 48 870 5.82 141 215 16.83 35 640 4.25 87 942 10.48 15 503 1.85 06 994 807 929 017 93.39 65 790 6.61 57 272 5.76 165 029 16.59 40 620 4.08 102 454 10.30 17 847 1.79 07 1 116 871 1 042 400 93.33 74 471 6.67 65 433 5.86 175 853 15.75 45 939 4.11 110 773 9.92 20 304 1.82 08 1 218 488 1 143 674 93.86 74 813 6.14 76 344 6.27 193 615 15.89 51 056 4.19 114 703 9.41 22 681 1.86
09 Q1 1 215 612 1 135 482 93.41 80 131 6.59 74 651 6.14 194 583 16.01 50 844 4.18 111 861 9.20 22 163 1.82 Q2 1 227 677 1 143 891 93.18 83 786 6.82 77 416 6.31 200 173 16.31 51 998 4.24 112 983 9.20 22 555 1.84 Q3 1 204 205 1 124 221 93.36 79 984 6.64 77 648 6.45 197 828 16.43 52 576 4.37 113 285 9.41 22 281 1.85 Q4 1 219 886 1 142 013 93.62 77 873 6.38 78 640 6.45 202 565 16.61 53 872 4.42 113 446 9.30 22 520 1.85
10 Q1 1 190 402 1 118 551 93.96 71 851 6.04 77 312 6.49 197 711 16.61 53 286 4.48 110 825 9.31 22 259 1.87 Q2 1 208 415 1 139 067 94.26 69 348 5.74 79 486 6.58 207 531 17.17 54 750 4.53 113 614 9.40 23 217 1.92 Q3 1 207 284 1 134 056 93.93 73 229 6.07 78 734 6.52 200 635 16.62 54 940 4.55 112 918 9.35 23 388 1.94 Q4 1 223 496 1 148 253 93.85 75 243 6.15 78 799 6.44 206 317 16.86 55 470 4.53 113 766 9.30 23 879 1.95
11 Q1 1 228 219 1 144 062 93.15 84 157 6.85 78 446 6.39 200 906 16.36 54 085 4.40 112 313 9.14 23 739 1.93 Q2 1 231 057 1 156 767 93.97 74 290 6.03 78 115 6.35 202 089 16.42 55 199 4.48 111 282 9.04 23 952 1.95 Q3 1 192 710 1 125 504 94.37 67 206 5.63 76 180 6.39 196 940 16.51 53 642 4.50 108 875 9.13 23 639 1.98 Q4 1 176 126 1 109 656 94.35 66 470 5.65 74 850 6.36 194 333 16.52 53 224 4.53 106 593 9.06 23 611 2.01
12 Q1 1 174 557 1 103 113 93.92 71 444 6.08 72 960 6.21 189 939 16.17 52 494 4.47 104 253 8.88 22 797 1.94 Q2 1 155 339 1 088 677 94.23 66 662 5.77 72 346 6.26 187 336 16.21 52 301 4.53 103 579 8.97 22 883 1.98 Q3 1 130 403 1 058 119 93.61 72 284 6.39 70 710 6.26 186 862 16.53 50 716 4.49 100 646 8.90 22 587 2.00
BANCO DE ESPAÑA 91 BOLETÍN ESTADÍSTICO, FEBRUARY 2013

16 17 18 19 20 21 22 23 24 25 26 27 28 29 30 31
4. CREDITS INSTITUTIONS 4.31 (Cont.) Deposits of general government and other residentB) Breakdown of lending and deposits sectors in Deposit-taking institutions by regional (autonomous) governmentsof credit institutions.
EUR millions
Cantabria Rioja,La Murcia, Comunitat Aragón Castilla- Canarias Navarra, Comu- Región de Valenciana La Mancha nidad Foral de
Total Percen- Total Percen- Total Percen- Total Percen- Total Percen- Total Percen- Total Percen- Total Percen- tage tage tage tage tage tage tage tage
03 6 749 1.00 4 401 0.65 14 054 2.08 54 724 8.11 21 416 3.18 21 876 3.24 17 307 2.57 11 686 1.73 04 7 298 0.95 4 918 0.64 16 260 2.12 64 454 8.42 23 071 3.01 24 214 3.16 18 935 2.47 12 965 1.69 05 7 953 0.95 5 064 0.60 17 871 2.13 71 832 8.56 22 291 2.66 25 080 2.99 19 908 2.37 12 207 1.45 06 9 192 0.92 6 024 0.61 21 394 2.15 89 193 8.97 27 059 2.72 29 207 2.94 23 276 2.34 14 178 1.43 07 10 054 0.90 6 886 0.62 23 338 2.09 101 918 9.13 29 891 2.68 32 447 2.91 24 622 2.20 16 551 1.48 08 11 354 0.93 7 888 0.65 24 501 2.01 104 832 8.60 33 489 2.75 35 246 2.89 25 599 2.10 17 529 1.44
09 Q1 11 270 0.93 7 907 0.65 23 629 1.94 103 612 8.52 33 447 2.75 34 813 2.86 24 937 2.05 17 507 1.44 Q2 11 503 0.94 8 076 0.66 24 371 1.99 106 577 8.68 33 800 2.75 35 588 2.90 25 629 2.09 17 135 1.40 Q3 11 731 0.97 8 204 0.68 24 266 2.02 104 379 8.67 34 138 2.83 35 760 2.97 25 409 2.11 17 164 1.43 Q4 11 974 0.98 8 288 0.68 24 623 2.02 102 614 8.41 34 556 2.83 36 353 2.98 25 702 2.11 17 585 1.44
10 Q1 11 710 0.98 8 097 0.68 24 378 2.05 99 619 8.37 34 536 2.90 35 133 2.95 26 097 2.19 17 366 1.46 Q2 12 389 1.03 8 488 0.70 24 813 2.05 100 169 8.29 35 118 2.91 36 098 2.99 26 507 2.19 17 802 1.47 Q3 12 240 1.01 8 527 0.71 24 932 2.07 103 919 8.61 35 320 2.93 36 276 3.00 26 128 2.16 18 116 1.50 Q4 12 200 1.00 8 649 0.71 24 938 2.04 100 720 8.23 35 900 2.93 37 137 3.04 26 104 2.13 18 462 1.51
11 Q1 12 103 0.99 8 621 0.70 23 963 1.95 100 359 8.17 35 683 2.91 36 398 2.96 25 728 2.09 18 335 1.49 Q2 12 213 0.99 8 514 0.69 24 354 1.98 101 415 8.24 35 463 2.88 36 758 2.99 25 471 2.07 17 669 1.44 Q3 12 198 1.02 8 283 0.69 24 908 2.09 98 641 8.27 34 743 2.91 35 723 3.00 24 867 2.08 17 566 1.47 Q4 11 752 1.00 8 019 0.68 23 684 2.01 100 156 8.52 34 622 2.94 35 586 3.03 24 263 2.06 17 488 1.49
12 Q1 11 529 0.98 7 829 0.67 23 239 1.98 95 016 8.09 33 840 2.88 34 376 2.93 23 686 2.02 16 724 1.42 Q2 11 525 1.00 7 793 0.67 23 690 2.05 94 688 8.20 33 599 2.91 35 100 3.04 23 366 2.02 16 767 1.45 Q3 11 148 0.99 7 593 0.67 24 202 2.14 92 916 8.22 32 904 2.91 34 136 3.02 22 346 1.98 15 966 1.41
32 33 34 35 36 37 38 39 40 41 42 43 44 45 46 47
4. CREDITS INSTITUTIONS 4.31 (Cont.) Deposits of general government and other residentB) Breakdown of lending and deposits sectors in Deposit-taking institutions by regional (autonomous) governmentsof credit institutions.
See notes at the end of chapter.
EUR millions Madrid, Castilla y Autonomous Cities On-line Non
Extremadura Balears, Illes Comunidad de León banking classified Ceuta Melilla (a)
Total Percen- Total Percen- Total Percen- Total Percen- Total Percen- Total Percen- Total Percen- Total Percen- tage tage tage tage tage tage tage tage
03 11 129 1.65 12 578 1.87 165 117 24.48 43 043 6.38 551 0.08 556 0.08 11 789 1.75 7 0.00 04 11 982 1.57 14 250 1.86 189 178 24.72 46 329 6.05 579 0.08 596 0.08 15 052 1.97 27 0.00 05 12 464 1.49 14 686 1.75 235 869 28.11 45 395 5.41 621 0.07 583 0.07 18 178 2.17 3 0.00 06 14 355 1.44 16 897 1.70 288 798 29.03 50 944 5.12 730 0.07 718 0.07 19 620 1.97 - -07 15 993 1.43 18 132 1.62 339 649 30.41 56 789 5.08 782 0.07 768 0.07 20 751 1.86 - -08 17 344 1.42 19 148 1.57 376 681 30.91 63 406 5.20 867 0.07 813 0.07 21 393 1.76 - -
09 Q1 16 792 1.38 18 938 1.56 382 127 31.43 61 730 5.08 842 0.07 799 0.07 23 160 1.91 - - Q2 17 249 1.41 19 582 1.60 374 881 30.54 62 817 5.12 860 0.07 816 0.07 23 669 1.93 - - Q3 17 184 1.43 20 300 1.69 353 896 29.39 62 773 5.21 838 0.07 824 0.07 23 720 1.97 - - Q4 17 646 1.45 20 343 1.67 359 192 29.44 64 157 5.26 858 0.07 826 0.07 24 126 1.98 - -
10 Q1 17 132 1.44 19 915 1.67 346 224 29.08 62 479 5.25 848 0.07 820 0.07 24 655 2.07 - - Q2 17 410 1.44 20 286 1.68 340 722 28.20 63 206 5.23 863 0.07 842 0.07 25 103 2.08 - - Q3 17 477 1.45 20 970 1.74 341 814 28.31 63 681 5.27 857 0.07 849 0.07 25 565 2.12 - - Q4 18 069 1.48 21 138 1.73 348 669 28.50 65 538 5.36 879 0.07 865 0.07 25 997 2.12 - -
11 Q1 17 809 1.45 20 366 1.66 363 844 29.62 67 244 5.47 876 0.07 863 0.07 26 538 2.16 - - Q2 17 782 1.44 20 114 1.63 363 869 29.56 68 520 5.57 890 0.07 881 0.07 26 510 2.15 - - Q3 17 320 1.45 20 616 1.73 342 951 28.75 67 766 5.68 860 0.07 868 0.07 26 125 2.19 - - Q4 17 303 1.47 18 734 1.59 338 428 28.77 64 819 5.51 855 0.07 856 0.07 26 952 2.29 - -
12 Q1 16 863 1.44 17 784 1.51 359 123 30.58 63 222 5.38 831 0.07 815 0.07 27 239 2.32 - - Q2 17 019 1.47 18 218 1.58 342 839 29.67 62 784 5.43 893 0.08 812 0.07 27 800 2.41 - - Q3 16 468 1.46 18 022 1.59 331 554 29.33 61 417 5.43 832 0.07 803 0.07 28 576 2.53 - -
BANCO DE ESPAÑA 92 BOLETÍN ESTADÍSTICO, FEBRUARY 2013

P
1=2+6 2=3+4+5 3 4 5 6 7=8+9+10 8 9 10
4. CREDIT INSTITUTIONS 4.32 Credit institutions’ liabilities vis-á-visB) Breakdown of lending and deposits general government, by type of institutionsof credit institutions
See notes at the end of the chapter
EUR millions
Liabilities Vis-á-vis general goverments Liabilities Vis-á-vis other resident sector Deposits Credit Deposit- Specialised Official
Total Endowments institu- taking credit Credit (a) Credit Deposit- Specialised Official tions institutions institutions Institute institu- taking credit Credit tions institutions institutions Institute (c) (b) (b)
06 66 715 66 486 65 790 6 689 229 1 144 526 1 142 147 732 1 264 07 75 220 75 220 74 471 8 741 - 1 322 583 1 319 391 925 1 885 08 76 054 76 054 75 058 10 986 - 1 432 573 1 428 936 1 312 1 560 09 81 805 81 805 77 873 13 3 919 - 1 426 888 1 422 781 1 483 1 418 10 79 080 79 080 75 287 15 3 778 - 1 440 425 1 434 104 1 773 3 219
11 Aug 60 661 60 661 57 199 14 3 448 - 1 395 413 1 389 789 1 933 3 691 Sep 70 743 70 743 67 206 13 3 525 - 1 392 640 1 386 898 1 605 4 137 Oct 66 764 66 764 63 271 13 3 480 - 1 370 645 1 363 714 1 780 5 151 Nov 75 355 75 355 71 937 13 3 406 - 1 365 472 1 356 064 1 707 7 701 Dec 69 717 69 717 66 470 13 3 234 - 1 373 079 1 358 356 6 646 8 076
12 Jan 75 499 75 499 72 224 12 3 263 - 1 354 684 1 339 009 6 848 8 827 Feb 75 519 75 519 71 911 12 3 595 - 1 356 829 1 341 345 6 698 8 785 Mar 74 253 74 253 71 444 12 2 797 - 1 367 763 1 348 183 6 291 13 289 Apr 67 638 67 638 65 196 10 2 431 - 1 334 340 1 318 862 6 564 8 914 May 80 083 80 083 77 876 9 2 198 - 1 326 957 1 314 274 6 435 6 249 Jun 68 590 68 590 66 662 8 1 920 - 1 331 824 1 318 912 6 052 6 861 Jul 61 976 61 976 60 054 8 1 915 - 1 287 248 1 273 605 6 249 7 393 Aug 55 460 55 460 53 525 8 1 928 - 1 273 698 1 259 600 6 119 7 978 Sep 74 069 74 069 72 284 7 1 778 - 1 291 019 1 277 126 5 801 8 093 Oct 68 915 68 915 66 267 8 2 640 - 1 291 653 1 276 792 6 132 8 730 Nov 75 442 75 442 73 338 9 2 095 - 1 303 268 1 290 779 6 368 6 121 Dec 69 183 69 183 67 341 9 1 832 - 1 316 443 1 303 880 6 323 6 239
BANCO DE ESPAÑA 93 BOLETÍN ESTADÍSTICO, FEBRUARY 2013

Res
ults
for
the
perio
d to
: 201
2-III
ME
MO
RA
ND
UM
ITE
M:
____
____
____
____
____
____
____
____
____
____
____
____
____
____
____
____
____
____
____
____
____
____
____
____
____
____
____
____
____
____
____
____
____
____
____
____
____
____
____
____
____
____
____
____
____
____
4. E
NT
IDA
DE
S D
E C
RÉ
DIT
O4.
B E
nti
dad
es d
e d
epó
sito
C
) C
uen
ta d
e re
sult
ado
sR
esu
men
Dato
s E
nero
-
Septiem
bre
de 2
012
Mill
ones d
e e
uro
s y
Porc
enta
jes
Res
ulta
dos/
Res
ult
R
atio
s so
bre
bala
nce
med
io/R
atio
s
Ser
ie e
n
(
prop
ortio
n of
ave
rage
bal
ance
she
et)
c
uadr
o y
c
olum
na/
T
ime
serie
s E
ntid
ades
Suc
ursa
les
E
ntid
ades
Ent
idad
es
S
ucur
sale
s
Ent
idad
es
in
tabl
e
dep
ósito
re-
e
spañ
olas
en
dep
ósito
re-
d
epós
ito r
e-
esp
añol
as e
n d
epós
ito r
e-
and
col
umn
s
iden
tes/
el e
xtra
nje-
s
iden
tes
y
sid
ente
s/
e
l ext
ranj
e- s
iden
tes
y
R
esid
ent
ro/
Spa
nish
s
ucur
sale
s/
Res
iden
t
r
o/S
pani
sh
suc
ursa
les/
Dep
osit-
taki
ng b
ranc
hes
Res
iden
t
D
epos
it-ta
king
bra
nche
s
Res
iden
t
inst
itutio
ns
abr
oad
Dep
osit-
taki
ng in
stitu
tions
a
broa
d
D
epos
it-ta
king
in
stitu
tions
in
stitu
tions
and
bra
nche
s
and
bra
nche
s
Res
ulta
dos
del p
erio
do h
asta
: III-
2012
Pro
duct
os fi
nanc
iero
s.
..
..
..
..
..
..
..
..
..
..
..
.4.
36/1
62 0
03
515
62 5
18
2,6
4,9
2,6
Int
eres
t inc
ome
Cos
tes
finan
cier
os.
..
..
..
..
..
..
..
..
..
..
..
..
.4.
36/2
36 7
55
74
36 8
30
1,5
0,7
1,5
Int
eres
t exp
ense
s
Mar
gen
de in
tere
ses
..
..
..
..
..
..
..
..
..
..
..
..
.4.
36/3
25 2
48
441
25 6
88
1,1
4,2
1,1
Net
inte
rest
inco
me
Ren
dim
ient
os d
e in
stru
men
tos
de c
apita
l y o
tros
pro
duct
os y
gas
tos
..
..
4.36
/420
032
30
0 20
333
0,
82,
90,
8 R
etur
n on
equ
ity in
stru
men
ts a
nd n
on in
tere
st in
com
e
Mar
gen
brut
o.
..
..
..
..
..
..
..
..
..
..
..
..
..
.4.
36/5
45 2
80
741
46 0
21
1,9
7,1
1,9
Gro
ss in
com
e G
asto
s de
exp
lota
ción
..
..
..
..
..
..
..
..
..
..
..
..
4.36
/620
274
35
2 20
626
0,
83,
40,
9 O
pera
ting
expe
nses
d
e lo
s cu
ales
: de
pers
onal
..
..
..
..
..
..
..
..
..
..
.4.
36/7
11 8
28
219
12 0
47
0,5
2,1
0,5
o
f whi
ch: s
taff
cost
s
Dot
acio
nes
neta
s.
..
..
..
..
..
..
..
..
..
..
..
..
.4.
36/8
4 28
3 -2
4
281
0,2
-0,0
0,2
Pro
visi
onin
g ex
pens
e (n
et)
Pér
dida
por
det
erio
ro d
e ac
tivos
fina
ncie
ros.
..
..
..
..
..
..
..
4.36
/933
697
19
9 33
896
1,
41,
91,
4 F
inan
cial
ass
ets
impa
irmen
t los
ses
Res
ulta
do d
e la
act
ivid
ad d
e ex
plot
ació
n.
..
..
..
..
..
..
..
.4.
36/1
0-1
2 97
4 19
2 -1
2 78
2 -0
,51,
8-0
,5
Adj
uste
d ne
t inc
ome
Pér
dida
por
det
erio
ro d
el r
esto
de
activ
os.
..
..
..
..
..
..
..
.4.
36/1
18
650
0 8
650
0,4
0,0
0,4
Oth
er a
sset
s im
pairm
ent l
osse
s O
tros
res
ulta
dos
..
..
..
..
..
..
..
..
..
..
..
..
..
4.36
/12
1 85
6 9
1 86
5 0,
10,
10,
1 O
ther
gai
ns a
nd lo
sses
Ben
efic
ios
ante
s de
impu
esto
s (c
onta
ble
hast
a 19
91)
..
..
..
..
..
4.36
/13
-19
768
201
-19
567
-0,8
1,9
-0,8
P
rofit
bef
ore
tax
(boo
k pr
ofit
until
199
1)
Im
pues
to s
obre
soc
ieda
des
..
..
..
..
..
..
..
..
..
..
..
4.36
/14
-5 9
12
88
-5 8
25
-0,2
0,8
-0,2
C
orpo
rate
inco
me
tax
Dot
acio
nes
oblig
ator
ias
a ob
ras
y fo
ndos
soc
iale
s.
..
..
..
..
..
.4.
36/1
514
-
14
0,0
0,0
0,0
Man
dato
ry tr
ansf
er to
wel
fare
fund
s B
enef
icio
con
tabl
e (d
esde
199
2).
..
..
..
..
..
..
..
..
..
4.36
/16
-13
869
113
-13
756
-0,6
1,1
-0,6
B
ook
prof
it (s
ince
199
2)
PR
O M
EM
OR
IA:
Tot
al d
otac
ione
s fo
ndos
..
..
..
..
..
..
..
..
..
..
..
.-
53 8
97
393
54 2
90
2,2
3,7
2,3
Fun
ds a
llow
ance
s R
ecur
sos
gene
rado
s.
..
..
..
..
..
..
..
..
..
..
..
..
-35
662
60
4 36
266
1,
55,
81,
5 F
unds
gen
erat
ed B
alan
ce a
just
ado
med
io.
..
..
..
..
..
..
..
..
..
..
..
-3
199
730
13 9
64
3 21
3 69
5 10
0,0
100,
010
0,0
Ave
rage
adj
uste
d ba
lanc
e sh
eet
Data
January
- S
epte
mber
2012
EU
R m
illio
ns a
nd %
4.B
Su
mm
ary
4. C
RE
DIT
INS
TIT
UT
ION
SD
epo
sit-
taki
ng
inst
itu
tio
ns
C
) P
rofi
t an
d lo
ss a
cco
un
t
BANCO DE ESPAÑA 94 BOLETÍN ESTADÍSTICO, FEBRUARY 2013

1 2 3 4 5 6 7 8 9 10 11 12 13 14 15 16
4. CREDIT INSTITUTIONS 4.36 Profit and loss account structureC) Profit and loss account Deposit-taking institutions
EUR millions
Inte- Inte- Net Return Gross Provi- Finan- Adjus- Other Other Profit Corpo- Manda- Book rest rest inte- on inco- of sio- cial ted assets gains before rate tory profit
income expen- rest equity me which: ning assets net im- and tax income trans- (since ses income instru- Opera- expen- im- income pair- losses (book tax fer 1992) ments ting staff se pair- ment profit to and non ex- costs (net) ment losses until welfa- interest penses losses 1991) re income funds (a) (b) (c)
07 113 600 81 458 32 141 32 978 65 119 28 074 17 087 1 446 8 029 27 569 1 233 2 983 29 319 4 118 89 25 112 08 141 654 106 496 35 158 31 224 66 382 29 508 17 901 3 405 15 245 18 225 948 3 112 20 389 1 903 65 18 421 09 103 089 60 054 43 035 24 517 67 552 29 400 17 742 1 351 19 551 17 249 7 494 4 611 14 367 1 365 45 12 956 10 77 091 42 799 34 292 29 021 63 313 29 431 17 643 3 963 16 719 13 200 5 290 1 927 9 837 134 30 9 673 11 83 963 54 398 29 565 27 561 57 126 28 464 16 889 1 805 22 668 4 189 21 738 113 -17 436 -2 743 24 -14 717
See notes at the end of chapter.
11 Q1-Q3 62 048 40 155 21 894 18 864 40 757 21 522 12 831 1 229 12 025 5 982 4 062 408 2 328 -1 295 21 3 601 12 Q1-Q3 62 003 36 755 25 248 20 032 45 280 20 274 11 828 4 283 33 697 -12 974 8 650 1 856 -19 768 -5 912 14 -13 869
08 Q4 36 424 27 500 8 924 7 329 16 253 7 603 4 560 2 507 5 740 402 599 1 636 1 440 -550 0 1 989
09 Q1 31 417 20 721 10 696 5 042 15 738 7 259 4 424 267 3 710 4 502 443 1 723 5 781 797 18 4 967 Q2 27 219 15 788 11 432 7 100 18 531 7 183 4 339 52 6 020 5 277 814 475 4 938 700 17 4 221 Q3 23 143 12 566 10 577 5 669 16 246 7 272 4 413 283 4 641 4 050 692 1 776 5 134 784 15 4 335 Q4 21 309 10 979 10 330 6 706 17 036 7 686 4 566 749 5 180 3 421 5 545 637 -1 487 -915 -5 -567
10 Q1 19 311 9 908 9 403 5 844 15 247 7 185 4 361 297 4 090 3 675 543 268 3 401 556 10 2 835 Q2 19 215 10 098 9 117 8 378 17 495 7 242 4 331 522 5 859 3 873 1 076 444 3 240 -73 8 3 305 Q3 19 027 10 874 8 154 6 599 14 753 7 297 4 371 236 4 333 2 888 962 284 2 210 364 6 1 839 Q4 19 538 11 919 7 618 8 200 15 818 7 708 4 579 2 909 2 438 2 764 2 710 932 985 -714 6 1 693
11 Q1 19 767 12 449 7 318 6 302 13 620 7 026 4 187 152 3 075 3 368 677 236 2 927 218 8 2 700 Q2 20 817 13 540 7 276 8 035 15 311 7 454 4 467 551 5 212 2 093 888 236 1 441 -597 7 2 031 Q3 21 465 14 166 7 299 4 526 11 826 7 042 4 176 526 3 738 521 2 497 -64 -2 040 -916 6 -1 130 Q4 21 915 14 243 7 671 8 697 16 368 6 942 4 059 576 10 643 -1 792 17 676 -295 -19 764 -1 448 3 -18 319
12 Q1 21 676 13 563 8 113 6 281 14 393 6 928 4 109 781 5 720 964 802 466 628 -438 7 1 060 Q2 21 022 12 264 8 757 7 722 16 479 6 873 4 008 2 169 15 977 -8 540 7 052 -333 -15 925 -4 003 4 -11 926 Q3 19 305 10 928 8 378 6 030 14 408 6 472 3 711 1 333 12 001 -5 398 795 1 722 -4 471 -1 471 3 -3 003
1=2+3=4+9+ 2 3 4 5 6 7 8 9 10 11
4. CREDIT INSTITUTIONS 4.37 Interest incomeC) Profit and loss account Deposit-taking institutions
EUR millions Income on credit transactions Adjust- Securities ments re- Other portfolio sulting interest In In Credit General Other Non-resi- except from hed- income
Total euro foreign Total system govern- resident dent sec- equity ging fi- currency ment sectors tors nancial
+10+11 (a) derivatives
07 113 600 107 796 5 804 101 489 7 832 1 621 81 330 10 706 10 256 703 1 152 08 141 654 135 162 6 492 124 021 9 107 1 922 100 643 12 349 13 157 2 448 2 028 09 103 089 99 514 3 575 87 638 4 085 1 443 76 758 5 352 12 503 617 2 331 10 77 091 74 030 3 061 62 440 3 024 1 495 54 453 3 467 12 417 157 2 078 11 83 963 81 088 2 875 67 387 3 599 2 495 56 814 4 479 14 611 -27 1 991
See notes at the end of chapter.
11 Q1-Q3 62 048 59 974 2 075 49 802 2 738 1 766 42 022 3 275 10 771 28 1 448 12 Q1-Q3 62 003 59 526 2 477 48 776 2 513 2 436 40 533 3 294 12 490 -567 1 303
08 Q4 36 424 34 842 1 582 31 869 2 357 499 26 115 2 899 3 456 469 629
09 Q1 31 417 30 248 1 169 27 331 1 555 419 23 471 1 886 3 271 290 525 Q2 27 219 26 360 860 23 234 1 078 361 20 376 1 419 3 141 195 650 Q3 23 143 22 327 817 19 425 733 345 17 227 1 120 3 098 81 540 Q4 21 309 20 580 730 17 648 719 319 15 683 927 2 994 51 617
10 Q1 19 311 18 553 758 15 838 669 321 14 026 822 2 940 44 489 Q2 19 215 18 426 789 15 477 740 345 13 578 814 3 083 64 591 Q3 19 027 18 248 779 15 390 773 392 13 347 878 3 134 19 484 Q4 19 538 18 802 735 15 735 843 436 13 503 953 3 260 30 514
11 Q1 19 767 19 065 701 15 897 952 500 13 465 980 3 441 -38 468 Q2 20 817 20 134 682 16 691 1 000 585 13 999 1 108 3 607 -23 541 Q3 21 465 20 774 691 17 214 786 682 14 558 1 187 3 723 89 440 Q4 21 915 21 114 800 17 585 861 728 14 792 1 204 3 840 -55 544
12 Q1 21 676 20 903 773 17 205 867 736 14 472 1 130 4 217 -204 457 Q2 21 022 20 206 815 16 438 753 758 13 795 1 132 4 270 -210 524 Q3 19 305 18 416 889 15 134 894 942 12 266 1 032 4 003 -154 323
BANCO DE ESPAÑA 95 BOLETÍN ESTADÍSTICO, FEBRUARY 2013

1=2+3=4+9 2 3 4 5 6 7 8 9 10 11 12
4. CREDIT INSTITUTIONS 4.38 Interest expensesC) Profit and loss account Deposit-taking institutions
EUR millions Interest on Deposit transactions Promisso- Adjust- ry notes ments re- and bills sulting Other Produc-
Total In In Credit General Other Non- other debt from interest tion euro foreign Total system govern- resident resident securities hedging expenses commi- currency ment sectors sectors and subor- transac- ssions dinated tions financing
+10+11+12 (a)
07 81 458 73 616 7 843 62 008 7 733 2 412 34 759 17 104 18 435 447 391 177 08 106 496 98 506 7 990 78 440 9 847 2 511 45 710 20 372 21 133 5 533 1 205 184 09 60 054 56 717 3 337 48 741 5 073 1 100 33 921 8 646 15 783 -5 321 724 127 10 42 799 40 733 2 066 35 998 4 149 963 25 710 5 176 15 020 -8 972 678 74 11 54 398 52 537 1 861 43 225 5 215 1 269 30 011 6 730 16 767 -6 227 561 73
See notes at the end of chapter.
11 Q1-Q3 40 155 38 787 1 368 32 160 3 806 918 22 546 4 889 12 498 -4 989 431 56 12 Q1-Q3 36 755 35 183 1 573 29 092 5 386 616 19 434 3 656 11 616 -4 305 288 63
08 Q4 27 500 25 455 2 044 20 438 2 720 619 11 971 5 127 5 129 1 595 291 47
09 Q1 20 721 19 455 1 266 16 012 1 913 406 10 434 3 258 4 288 191 192 38 Q2 15 788 14 917 871 13 134 1 441 266 9 096 2 331 3 773 -1 357 205 33 Q3 12 566 11 976 590 10 630 810 213 7 877 1 730 3 879 -2 124 151 31 Q4 10 979 10 369 610 8 966 909 215 6 514 1 327 3 842 -2 031 176 26
10 Q1 9 908 9 396 512 8 438 899 196 6 133 1 210 3 733 -2 417 133 21 Q2 10 098 9 573 525 8 449 1 043 215 6 031 1 159 3 745 -2 361 247 18 Q3 10 874 10 392 482 9 231 1 126 268 6 529 1 308 3 669 -2 205 160 19 Q4 11 919 11 373 547 9 881 1 081 283 7 017 1 500 3 873 -1 989 138 17
11 Q1 12 449 11 980 469 10 211 1 206 280 7 241 1 485 4 026 -1 939 134 17 Q2 13 540 13 095 446 10 925 1 341 312 7 571 1 701 4 226 -1 792 165 16 Q3 14 166 13 712 454 11 024 1 259 327 7 735 1 703 4 246 -1 258 132 23 Q4 14 243 13 750 493 11 065 1 408 351 7 465 1 842 4 269 -1 238 130 17
12 Q1 13 563 12 958 605 10 494 1 677 216 7 103 1 498 4 218 -1 285 120 17 Q2 12 264 11 860 404 9 810 1 841 206 6 549 1 213 3 802 -1 465 92 26 Q3 10 928 10 364 563 8 789 1 868 194 5 782 945 3 597 -1 554 76 20
1 2 3 4 5 6 7 8 9 10 11 12 13 14
4. CREDIT INSTITUTIONS 4.39 Income from securities and costs ofC) Profit and loss account securities issued
EUR millions
Income from securities Financial costs of securities issued Interests from debt securities Interest Income held to maturity from from Other debt securities debt se- shares curities Promis- Subordi-
Total Total Resident General Other Non-re- held for Total sory no- Total Interest Expenses nated credit govern- resi- sident trading tes and finan- insti- ment dent sectors bills cing tutions sectors (b) (a)
07 21 506 10 256 2 321 3 119 1 879 2 937 ... 11 250 18 435 3 577 11 155 ... ... 3 703 08 25 192 13 157 2 905 3 441 3 708 3 103 ... 12 034 21 133 4 431 12 130 ... ... 4 572 09 20 305 12 503 2 637 4 222 3 057 2 587 ... 7 802 15 783 1 479 10 395 ... ... 3 909 10 24 438 12 417 2 406 4 947 2 906 2 158 ... 12 021 15 020 503 10 573 ... ... 3 944 11 27 665 14 611 2 764 6 517 3 187 2 143 ... 13 054 16 767 565 11 611 ... ... 4 591
See notes at the end of chapter.
11 Q1-Q3 18 549 10 771 2 036 4 787 2 395 1 552 ... 7 778 12 498 374 8 651 ... ... 3 473 12 Q1-Q3 23 610 12 490 2 331 6 434 2 144 1 581 ... 11 120 11 616 1 389 7 765 ... ... 2 462
09 Q2 5 366 3 141 678 1 049 731 682 ... 2 225 3 773 414 2 480 ... ... 880 Q3 4 532 3 098 647 1 072 738 641 ... 1 435 3 879 274 2 607 ... ... 998 Q4 5 850 2 994 636 1 119 649 590 ... 2 856 3 842 186 2 623 ... ... 1 033
10 Q1 4 379 2 940 616 1 103 648 572 ... 1 439 3 733 130 2 610 ... ... 994 Q2 6 268 3 083 612 1 212 695 563 ... 3 185 3 745 134 2 632 ... ... 979 Q3 5 587 3 134 567 1 263 782 522 ... 2 452 3 669 116 2 568 ... ... 985 Q4 8 204 3 260 610 1 369 781 500 ... 4 944 3 873 123 2 763 ... ... 986
11 Q1 5 250 3 441 654 1 484 807 495 ... 1 809 4 026 122 2 763 ... ... 1 141 Q2 8 052 3 607 691 1 599 799 518 ... 4 445 4 226 131 2 919 ... ... 1 176 Q3 5 247 3 723 691 1 703 790 539 ... 1 524 4 246 121 2 968 ... ... 1 156 Q4 9 116 3 840 728 1 730 791 591 ... 5 276 4 269 191 2 960 ... ... 1 118
12 Q1 6 677 4 217 846 2 093 760 519 ... 2 460 4 218 358 2 815 ... ... 1 045 Q2 8 737 4 270 821 2 209 713 526 ... 4 467 3 802 462 2 614 ... ... 725 Q3 8 196 4 003 665 2 131 671 536 ... 4 193 3 597 569 2 335 ... ... 692
BANCO DE ESPAÑA 96 BOLETÍN ESTADÍSTICO, FEBRUARY 2013

1=2+12+ 2 3 4 5 6 7 8 9 10 11 12 13 14
4. CREDIT INSTITUTIONS 4.40 Non-interest incomeC) Profit and loss account Deposi-taking institutions
EUR millions Fees Net profit: Of which: Of which: Foreign Other Other curency finan- net
Net Net Fees Arising Transfe Asset Other Fees Fees Fees Other transac cial operating recei- for co- giros manage- paid asigned on se- tions tran- income ved llectio and ment curitie saction and other transac payment payment tions
+13 service orders
07 21 728 13 594 16 225 5 871 1 752 4 237 2 773 2 631 1 310 195 1 108 1 279 6 251 604 08 19 190 13 026 15 555 6 277 1 287 3 660 2 763 2 529 1 279 258 971 785 4 865 515 09 16 715 12 163 14 630 5 738 1 178 3 003 3 112 2 467 1 201 265 980 810 3 297 445 10 17 000 11 870 14 414 5 340 1 289 3 104 3 047 2 544 1 144 212 1 163 632 4 348 150 11 14 507 11 750 14 298 5 169 1 400 3 064 2 967 2 548 1 078 219 1 224 -96 3 033 -180
11 Q1-Q3 11 086 8 877 10 730 3 858 994 2 277 2 323 1 853 795 171 868 -136 2 404 -60 12 Q1-Q3 8 913 8 594 10 525 3 833 914 2 163 2 292 1 931 801 164 931 -531 2 410 -1 561
08 Q4 4 565 3 097 3 724 1 571 296 780 695 627 310 80 231 324 917 227
09 Q1 3 755 3 115 3 686 1 469 271 789 762 571 293 57 217 103 495 42 Q2 4 875 3 168 3 790 1 456 314 744 887 621 295 83 239 138 1 374 195 Q3 4 234 2 903 3 521 1 399 293 699 718 617 309 64 240 418 912 2 Q4 3 850 2 977 3 633 1 415 300 771 746 657 305 62 285 151 516 207
10 Q1 4 404 2 974 3 555 1 305 306 832 713 580 268 50 256 61 1 248 120 Q2 5 193 2 996 3 619 1 359 316 767 773 623 278 58 282 115 2 058 24 Q3 4 147 2 900 3 542 1 339 263 738 796 641 302 47 286 396 868 -17 Q4 3 256 2 999 3 698 1 338 403 767 765 699 297 57 339 60 174 23
11 Q1 4 493 2 951 3 541 1 247 329 773 765 590 257 63 264 390 1 045 107 Q2 3 591 3 070 3 725 1 308 379 777 845 655 263 57 328 149 434 -63 Q3 3 002 2 856 3 465 1 304 285 727 712 609 275 51 276 -675 925 -104 Q4 3 421 2 873 3 568 1 311 406 787 644 695 283 48 357 39 629 -120
12 Q1 3 821 2 913 3 569 1 281 329 750 752 656 264 64 317 -71 1 489 -510 Q2 3 255 2 996 3 642 1 321 335 753 785 646 283 51 300 -454 1 230 -517 Q3 1 837 2 686 3 314 1 231 250 660 755 628 255 49 314 -7 -309 -534
1 2 3 4 5 6 7 8 9 10 11 12 13 14 15 16
4. CREDIT INSTITUTIONS 4.41 Profit and loss account structureC) Profit and loss account Resident deposit-taking institutions and branches abroad
EUR millions
Inte- Inte- Net Return Gross Provi- Finan- Adjus- Other Other Profit Corpo- Manda- Book rest rest inte- on inco- of sio- cial ted assets gains before rate tory profit
income expen- rest equity me which: ning assets net im- and tax income trans- (since ses income instru- Opera- expen- im- income pair- losses (book tax fer 1992) ments ting staff se pair- ment profit to and non ex- costs (net) ment losses until welfa- interest penses losses 1991) re income funds
07 114 965 82 378 32 587 33 190 65 776 28 381 17 269 1 397 8 127 27 871 1 233 2 987 29 625 4 195 89 25 341 08 143 003 107 164 35 839 31 644 67 483 29 884 18 133 3 405 15 377 18 817 949 3 100 20 967 2 093 65 18 809 09 104 319 60 405 43 914 24 968 68 882 29 759 17 964 1 354 19 622 18 147 7 496 4 607 15 258 1 579 45 13 634 10 77 979 42 928 35 051 29 550 64 601 29 847 17 911 3 965 16 834 13 954 5 292 1 923 10 585 275 30 10 280 11 84 865 54 534 30 332 28 068 58 400 28 995 17 224 1 806 22 724 4 874 21 746 112 -16 760 -2 583 24 -14 201
See notes at the end of chapter.
11 Q1-Q3 62 714 40 250 22 463 19 267 41 730 21 893 13 072 1 230 12 033 6 575 4 069 417 2 923 -1 177 21 4 079 12 Q1-Q3 62 518 36 830 25 688 20 333 46 021 20 626 12 047 4 281 33 896 -12 782 8 650 1 865 -19 567 -5 825 14 -13 756
08 Q4 36 720 27 583 9 137 7 459 16 596 7 709 4 624 2 509 5 814 565 600 1 626 1 590 -484 0 2 073
09 Q1 31 748 20 817 10 931 5 160 16 091 7 350 4 480 270 3 740 4 731 443 1 722 6 010 845 18 5 146 Q2 27 603 15 958 11 645 7 220 18 865 7 267 4 392 53 6 045 5 499 814 471 5 157 766 17 4 373 Q3 23 409 12 610 10 799 5 754 16 553 7 359 4 466 283 4 690 4 220 692 1 775 5 303 833 15 4 455 Q4 21 559 11 020 10 539 6 835 17 374 7 782 4 627 748 5 146 3 697 5 547 639 -1 211 -866 -5 -340
10 Q1 19 542 9 947 9 595 5 971 15 566 7 283 4 428 297 4 082 3 905 543 268 3 630 613 10 3 007 Q2 19 500 10 144 9 356 8 515 17 870 7 352 4 404 520 5 885 4 114 1 076 443 3 482 -10 8 3 484 Q3 19 205 10 899 8 306 6 720 15 026 7 390 4 429 236 4 315 3 086 962 283 2 406 405 6 1 995 Q4 19 733 11 938 7 795 8 343 16 138 7 822 4 650 2 912 2 553 2 850 2 712 929 1 067 -733 6 1 795
11 Q1 19 984 12 483 7 501 6 426 13 927 7 136 4 259 151 3 095 3 545 678 237 3 104 251 8 2 845 Q2 21 022 13 566 7 457 8 171 15 627 7 569 4 541 552 5 171 2 335 883 238 1 690 -561 7 2 244 Q3 21 707 14 202 7 506 4 671 12 176 7 187 4 273 527 3 767 695 2 508 -59 -1 872 -867 6 -1 010 Q4 22 152 14 283 7 869 8 801 16 669 7 103 4 151 576 10 691 -1 701 17 677 -305 -19 682 -1 406 3 -18 280
12 Q1 21 866 13 593 8 272 6 378 14 650 7 040 4 177 780 5 753 1 077 802 465 740 -407 7 1 141 Q2 21 200 12 293 8 907 7 897 16 803 6 996 4 084 2 171 16 022 -8 385 7 053 -335 -15 774 -3 953 4 -11 825 Q3 19 453 10 944 8 509 6 058 14 567 6 590 3 786 1 331 12 121 -5 474 794 1 735 -4 533 -1 464 3 -3 072
BANCO DE ESPAÑA 97 BOLETÍN ESTADÍSTICO, FEBRUARY 2013

1=2+5+8 2=3+4 3 4 5=6+7 6 7 8
4. CREDIT INSTITUTIONS 4.45 Credit institutionsD) Supplementary tables Number of institutions
See notes at the end of chapter.
Number of institutions
Total Deposit-taking institutions Specialised credit institutions/ Official (a) Special lending credit (b) Total Spanish Branches of Total Specialised Special companies foreign credit lending companies instituyions (EFC)
99 387 290 237 53 96 96 - 1 00 368 281 229 52 86 86 - 1 01 367 281 225 56 85 85 - 1
02 359 275 216 59 83 83 - 1 03 348 269 211 58 78 78 - 1 04 346 266 205 61 79 79 - 1
05 348 269 204 65 78 78 - 1 06 352 272 202 70 79 79 - 1 07 357 280 201 79 76 76 - 1
08 362 286 198 88 75 75 - 1 09 352 280 192 88 70 70 - 1 10 337 276 188 88 59 59 - 1
10 Q4 337 276 188 88 59 59 - 1
11 Q1 334 273 185 88 59 59 - 1 Q2 336 276 188 88 59 59 - 1 Q3 340 280 192 88 59 59 - 1 Q4 335 275 189 86 59 59 - 1
12 Q1 334 275 188 87 58 58 - 1 Q2 331 273 186 87 57 57 - 1 Q3 323 266 181 85 56 56 - 1
1=2+3+6 2 3=4+5 4 5 6
4. CREDIT INSTITUTIONS 4.46 Credit institutionsD) Supplementary tables Number of employees
See notes at the end of chapter.
Number of employees Deposit- Specialised credit institutions/
Total taking Special lending (a) Official institu- credit tions Total Specialised Special credit lending institu- tions
92 261 839 253 197 6 359 ... 6 359 2 283 93 254 265 246 780 5 240 ... 5 240 2 245 94 251 078 246 127 4 712 ... 4 712 239
95 249 023 244 908 3 847 ... 3 847 268 96 246 800 242 221 4 306 4 276 30 273 97 247 361 242 155 4 936 4 936 ... 270
98 247 685 242 268 5 154 5 154 ... 263 99 244 513 239 020 5 229 5 229 ... 264 00 243 743 238 587 4 889 4 889 ... 267
01 245 228 239 895 5 062 5 062 - 271 02 243 677 238 199 5 210 5 210 ... 268 03 245 157 239 103 5 759 5 759 ... 295
04 247 471 241 164 6 016 6 016 ... 291 05 254 411 247 765 6 356 6 356 ... 290 06 263 682 256 585 6 803 6 803 ... 294
07 277 311 269 920 7 113 7 113 ... 278 08 278 301 270 855 7 150 7 150 ... 296 09 269 475 263 093 6 075 6 075 ... 307
10 263 715 257 578 5 815 5 815 ... 322 11 248 093 242 726 5 047 5 047 ... 320
BANCO DE ESPAÑA 98 BOLETÍN ESTADÍSTICO, FEBRUARY 2013

1 2=3+7 3=4+5+6 4 5 6 7 8 9
4. CREDIT INSTITUTIONS 4.47 Number of branch and representative offices ofD) Supplementary tables resident credit institutions and Banco de España (a)
See notes at the end of chapter.
Number of offices
Banco Credit institutions Representatives offices de
España Branches in Spain Branches Of resident Of non- Total abroad institutions resident abroad institutions Deposit- Others CI Total taking institutions Official EFC credit
04 33 40 688 40 603 40 230 1 372 85 116 56 05 23 42 071 41 979 41 599 1 379 92 122 53 06 23 43 788 43 691 43 286 1 404 97 130 54 07 23 45 596 45 500 45 086 1 413 96 136 57 08 23 46 167 46 065 45 662 1 402 102 130 55 09 23 44 532 44 431 44 085 1 345 101 121 55
10 Q1 23 44 238 44 135 43 818 1 316 103 118 56 Q2 23 44 047 43 944 43 637 1 306 103 119 55 Q3 23 43 830 43 727 43 453 1 273 103 95 54 Q4 23 43 267 43 164 42 894 1 269 103 103 54
11 Q1 23 42 263 42 159 41 890 1 268 104 100 53 Q2 16 41 497 41 395 41 126 1 268 102 99 53 Q3 16 40 759 40 657 40 390 1 266 102 100 54 Q4 16 40 202 40 103 39 843 1 259 99 94 55
12 Q1 16 39 961 39 862 39 616 1 245 99 92 52 Q2 16 39 618 39 521 39 273 1 247 97 90 52 Q3 16 39 413 39 317 39 072 1 244 96 89 47
BANCO DE ESPAÑA 99 BOLETÍN ESTADÍSTICO, FEBRUARY 2013

___________________________________________________________________________________________________________________________
4. ENTIDADES DE CRÉDITO 4.48 Entidades de crédito D) Cuadros complementarios Número de oficinas por
Comunidades Autónomas
Datos referidos a Septiembre de 2012 Número de oficinas Entidades de Crédito/ Credit Institutions
Banco Oficinas Entidades de Otras de en España/ depósito/ entidades de
España Branches Deposit-taking crédito/ in Spain institutions Other credit institutions 1 2=3+4 3 4
País Vasco . . . . . . . . . . . . . . 1 1 853 1 840 13 País Vasco Cataluña . . . . . . . . . . . . . . . 1 6 535 6 502 33 Cataluña Galicia . . . . . . . . . . . . . . . . 1 2 113 2 099 14 Galicia
Andalucía . . . . . . . . . . . . . . . 2 6 069 6 028 41 Andalucía Asturias, Principado de . . . . . . . . . 1 896 890 6 Asturias, Principado de Cantabria . . . . . . . . . . . . . . . - 478 475 3 Cantabria
Rioja, La . . . . . . . . . . . . . . . - 440 439 1 Rioja, La Murcia, Región de . . . . . . . . . . . 1 1 145 1 138 7 Murcia, Región de Comunitat Valenciana . . . . . . . . . 2 4 289 4 267 22 Comunitat Valenciana
Aragón . . . . . . . . . . . . . . . . 1 1 547 1 539 8 Aragón Castilla-La Mancha. . . . . . . . . . . - 1 893 1 885 8 Castilla-La Mancha Canarias . . . . . . . . . . . . . . . 2 1 266 1 250 16 Canarias
Navarra, Comunidad Foral de . . . . . . - 670 668 2 Navarra, Comunidad Foral de Extremadura . . . . . . . . . . . . . 1 1 132 1 126 6 Extremadura Balears, Illes . . . . . . . . . . . . . 1 1 116 1 111 5 Balears, Illes
Madrid, Comunidad de . . . . . . . . . 1 5 098 5 048 50 Madrid, Comunidad de Castilla y León. . . . . . . . . . . . . 1 2 734 2 724 10 Castilla y León Ceuta y Melilla. . . . . . . . . . . . . - 43 43 - Ceuta and Melilla
TOTAL EN ESPAÑA . . . . . . . . 16 39 317 39 072 245 TOTAL IN SPAIN
September 2012 Data Number of branches
4.48 Credit Institutions 4. CREDIT INSTITUTIONS Number of branches by D) Supplementary tables Regional (autonomous) governments
BANCO DE ESPAÑA 100 BOLETÍN ESTADÍSTICO, FEBRUARY 2013

___________________________________________________________________________________________________________________________
4. ENTIDADES DE CRÉDITO 4.49 Entidades de crédito D) Cuadros complementarios Número de oficinas por provincias
Datos referidos a Septiembre de 2012 Número de oficinas Entidades de Crédito/ Credit Institutions
Banco Oficinas Entidades de Otras de en España/ depósito/ entidades de
España Branches Deposit-taking crédito/ in Spain institutions Other credit institutions 1 2=3+4 3 4
Álava . . . . . . . . . . . . - 317 316 1 Álava Albacete . . . . . . . . . . - 328 327 1 Albacete Alacant . . . . . . . . . . . 1 1 432 1 423 9 Alacant Almería . . . . . . . . . . . - 600 597 3 Almería
Asturias. . . . . . . . . . . 1 896 890 6 Asturias Ávila . . . . . . . . . . . . - 183 183 - Ávila Badajoz. . . . . . . . . . . 1 713 709 4 Badajoz Balears, Illes . . . . . . . . 1 1 116 1 111 5 Balears, Illes
Barcelona . . . . . . . . . . 1 4 693 4 665 28 Barcelona (capital) . . . . . . . . . . 1 1 733 1 715 18 (capital) Burgos . . . . . . . . . . . - 461 460 1 Burgos Cáceres . . . . . . . . . . - 419 417 2 Cáceres
Cádiz. . . . . . . . . . . . - 684 676 8 Cádiz Cantabria . . . . . . . . . . - 478 475 3 Cantabria Castelló. . . . . . . . . . . - 584 581 3 Castelló Ciudad Real . . . . . . . . . - 453 450 3 Ciudad Real
Córdoba . . . . . . . . . . - 617 611 6 Córdoba Coruña, La . . . . . . . . . 1 855 847 8 Coruña, La Cuenca . . . . . . . . . . . - 238 238 - Cuenca Girona . . . . . . . . . . . - 643 640 3 Girona
Granada . . . . . . . . . . - 719 714 5 Granada Guadalajara . . . . . . . . . - 252 251 1 Guadalajara Gipuzkoa . . . . . . . . . . - 573 570 3 Gipuzkoa Huelva . . . . . . . . . . . - 401 399 2 Huelva
Huesca . . . . . . . . . . . - 300 299 1 Huesca Jaén . . . . . . . . . . . . - 579 576 3 Jaén León . . . . . . . . . . . . - 494 492 2 León Lleida . . . . . . . . . . . - 512 511 1 Lleida
Lugo . . . . . . . . . . . . - 303 303 - Lugo Madrid . . . . . . . . . . . 1 5 098 5 048 50 Madrid (capital) . . . . . . . . . . 1 2 841 2 810 31 (capital) Málaga . . . . . . . . . . . 1 1 159 1 152 7 Málaga
Murcia . . . . . . . . . . . 1 1 145 1 138 7 Murcia Navarra. . . . . . . . . . . - 670 668 2 Navarra Ourense . . . . . . . . . . - 278 278 - Ourense Palencia . . . . . . . . . . - 184 183 1 Palencia
Palmas, Las . . . . . . . . . 1 641 632 9 Palmas, Las Pontevedra . . . . . . . . . - 677 671 6 Pontevedra Rioja, La . . . . . . . . . . - 440 439 1 Rioja, La Salamanca . . . . . . . . . - 362 361 1 Salamanca
Tenerife . . . . . . . . . . 1 625 618 7 Tenerife Segovia. . . . . . . . . . . - 181 180 1 Segovia Sevilla . . . . . . . . . . . 1 1 310 1 303 7 Sevilla Soria . . . . . . . . . . . . - 134 134 - Soria
Tarragona. . . . . . . . . . - 687 686 1 Tarragona Teruel . . . . . . . . . . . - 232 232 - Teruel Toledo . . . . . . . . . . . - 622 619 3 Toledo València . . . . . . . . . . 1 2 273 2 263 10 València
Valladolid . . . . . . . . . . 1 508 504 4 Valladolid Bizkaia . . . . . . . . . . . 1 963 954 9 Bizkaia Zamora . . . . . . . . . . . - 227 227 - Zamora Zaragoza . . . . . . . . . . 1 1 015 1 008 7 Zaragoza Ceuta y Melilla. . . . . . . . - 43 43 - Ceuta and Melilla
TOTAL NACIONAL . . . . 16 39 317 39 072 245 NATIONAL TOTAL Extranjero. . . . . . . . . . - 96 80 16 Foreign branches
TOTAL . . . . . . . . . . 16 39 413 39 152 261 TOTAL
September 2012 Data Number of branches
4.49 Credit institutions 4. CREDIT INSTITUTIONS Number of branches by provinces D) Supplementary tables
BANCO DE ESPAÑA 101 BOLETÍN ESTADÍSTICO, FEBRUARY 2013

P
1 =2a11 2 3 4 5 6 7 8 9 10 11 12 13
4. CREDIT INSTITUTIONS (data from 4.51 Deposit-taking institutions. Assetssupervisory returns)E) Balance sheet of the institutional groupings of credit institutions
See notes at the end of the chapter
EUR millions Securities Shares and
Total Loans other than other equity Unsectorised Memo items shares assets Of which: Domestic Rest Domestic Rest Domestic Rest Cash Other Doubtful Arrears of the (b) of the (b) of the (c) loans (d) world world world Credit General Other (b) institu- govern- resident tions ment sector (a)
06 2 420 500 202 129 37 981 1 445 298 203 376 134 571 85 055 103 492 48 184 8 352 152 061 9 773 7 721 07 2 836 830 229 824 38 755 1 691 933 248 361 176 057 80 882 101 608 81 781 8 542 179 088 14 949 12 316 08 3 096 256 239 047 47 688 1 795 109 247 392 232 077 82 291 91 990 79 669 9 007 271 987 61 692 48 534 09 3 122 834 215 657 61 228 1 776 533 231 046 311 923 93 537 99 199 84 620 8 517 240 573 91 954 74 765 10 3 119 257 188 442 74 492 1 782 291 223 179 313 916 63 886 102 878 77 311 7 883 284 980 106 573 82 687
11 Aug 3 186 789 203 365 82 511 1 728 171 223 883 309 909 61 704 155 047 88 802 7 165 326 232 127 493 ... Sep 3 205 627 187 480 83 513 1 728 701 225 478 306 687 60 299 162 730 88 612 6 863 355 263 127 969 105 162 Oct 3 192 371 191 810 82 826 1 718 755 224 467 305 164 60 341 165 391 88 718 7 082 347 816 131 878 ... Nov 3 187 031 181 884 82 618 1 722 588 222 919 306 468 58 621 161 321 89 049 7 018 354 546 134 099 ... Dec 3 250 226 199 245 82 989 1 715 037 226 960 338 967 58 340 160 409 90 131 7 486 370 662 139 557 106 542
12 Jan 3 270 911 192 812 84 405 1 698 997 222 729 365 968 60 983 166 380 91 273 7 072 380 293 143 945 ... Feb 3 286 306 188 653 84 456 1 695 379 231 711 378 712 65 771 167 566 91 491 6 803 375 763 146 613 ... Mar 3 342 422 225 988 85 535 1 695 547 242 971 391 843 66 967 166 227 91 146 6 853 369 345 147 687 116 230 Apr 3 294 567 190 713 84 888 1 678 073 242 080 385 526 65 269 166 610 91 935 6 829 382 644 152 599 ... May 3 354 196 201 520 91 886 1 671 320 247 669 378 057 63 188 166 493 91 457 6 790 435 817 155 807 ... Jun 3 360 482 198 252 106 259 1 674 931 260 783 379 164 61 135 165 670 90 879 6 837 416 573 168 398 124 089 Jul 3 330 367 202 351 106 263 1 648 327 250 158 369 156 59 016 166 190 91 204 7 083 430 619 173 184 ... Aug 3 288 459 201 164 104 432 1 630 157 239 102 360 697 59 047 167 374 91 987 6 843 427 656 178 660 ... Sep 3 301 138 206 198 103 474 1 633 489 233 660 371 336 59 939 167 788 91 186 6 606 427 462 182 252 139 067 Oct 3 269 903 209 428 103 392 1 618 514 235 297 369 214 54 588 166 770 91 019 6 778 414 902 190 387 ... Nov 3 263 723 216 282 101 786 1 618 121 232 038 365 916 45 405 164 186 90 991 6 644 422 354 192 426 ... Dec 3 257 009 229 493 96 890 1 536 953 226 272 406 626 82 827 168 130 90 167 7 434 412 216 168 387 ...
P
1=3 a10 2=3a6 3 4 5 6 7 8 9 10
4. CREDIT INSTITUTIONS 4.52 Deposit-taking institutions. LiabilitiesA) Aggregated balance sheet fromsupervisory returns
Véanse notas al final del capítulo
EUR millions
Total Deposits Unsectorised liabilities Total Domestic Rest Securities Equity, Welfare Accrual of the other adjustments fund and world than and liabilities sundry Credit General Other shares impairment (c) accounts system govern- resid. allowances (c) ment sector (b) (a)
06 2 420 500 1 763 159 185 960 65 790 1 142 147 369 261 327 716 174 187 2 529 152 909 07 2 836 830 2 046 685 222 760 74 471 1 319 391 430 062 395 916 199 177 2 994 192 058 08 3 096 255 2 262 196 265 744 75 058 1 428 936 492 458 355 875 232 758 3 136 242 290 09 3 122 834 2 267 891 270 897 77 873 1 422 781 496 339 390 791 259 750 3 314 201 088 10 3 119 257 2 244 624 236 123 75 287 1 434 104 499 111 377 455 269 888 3 217 224 072
11 Aug 3 186 790 2 237 112 266 285 57 199 1 389 789 523 838 365 969 330 058 3 403 250 248 Sep 3 205 627 2 231 746 257 324 67 206 1 386 898 520 319 359 957 337 141 3 329 273 454 Oct 3 192 371 2 216 931 281 045 63 271 1 363 714 508 901 363 011 340 675 3 274 268 480 Nov 3 187 032 2 213 690 287 421 71 937 1 356 064 498 268 363 935 337 213 3 171 269 022 Dec 3 250 226 2 245 317 340 066 66 470 1 358 356 480 425 368 620 350 126 3 022 283 140
12 Jan 3 270 911 2 231 617 342 583 72 224 1 339 009 477 801 373 433 362 196 2 982 300 683 Feb 3 286 306 2 265 594 388 092 71 911 1 341 345 464 246 369 561 364 320 2 896 283 935 Mar 3 342 422 2 331 875 478 788 71 444 1 348 183 433 460 367 976 363 323 2 915 276 333 Apr 3 294 567 2 285 871 471 566 65 196 1 318 862 430 247 358 748 361 516 2 878 285 553 May 3 354 196 2 316 146 505 140 77 876 1 314 274 418 857 351 208 356 487 3 299 327 056 Jun 3 360 482 2 344 347 562 781 66 662 1 318 912 395 992 338 604 369 018 3 276 305 237 Jul 3 330 367 2 291 674 584 149 60 054 1 273 605 373 866 340 952 369 584 3 208 324 950 Aug 3 288 459 2 252 413 589 622 53 525 1 259 600 349 666 339 789 372 953 3 165 320 138 Sep 3 301 138 2 263 208 557 980 72 284 1 277 126 355 818 333 300 383 058 3 102 318 471 Oct 3 269 903 2 243 606 547 662 66 267 1 276 792 352 885 327 482 384 758 3 051 311 006 Nov 3 263 723 2 240 958 544 756 73 338 1 290 779 332 085 321 031 383 292 2 936 315 506 Dec 3 257 009 2 224 309 523 992 67 341 1 303 880 329 095 324 418 391 392 2 085 314 804
BANCO DE ESPAÑA 102 BOLETÍN ESTADÍSTICO, FEBRUARY 2013

P
1=4+5+7 2 3 4 5 6 7 8 9 10 11 12 13
4. CREDIT INSTITUTIONS (data from 4.53 Deposit-taking institutions. Lending. Other resident sectorssupervisory returns)E) Balance sheet of the institutional groupings of credit institutions
EUR millions
of which: Secured loans Other fixed- Debts Finance Doubtful Loans Trade term loans repay- leases debtors assu- credit able (c) med
Total At a va- In of which: of which: on by the (a) riable foreign demand State interest curren- Total Total rate cy Mortgage Repur- Hybrid loans chase finan- agree- cial ments assets
+10+11+12 (b)
06 1 445 298 1 010 706 10 928 72 935 916 260 877 466 388 587 3 524 14 30 433 27 983 9 101 - 07 1 691 933 1 189 851 15 253 77 827 1 059 314 1 010 114 470 304 6 537 - 36 691 33 621 14 176 - 08 1 795 109 1 236 992 23 624 61 223 1 098 080 1 054 007 498 109 16 070 5 45 166 33 440 59 090 - 09 1 776 533 1 249 050 16 939 49 175 1 105 111 1 064 803 466 092 23 364 13 37 433 30 481 88 240 - 10 1 782 291 1 256 445 19 138 48 354 1 090 224 1 049 149 480 623 39 219 14 34 709 25 861 102 520 -
11 Aug 1 728 171 1 230 931 17 568 41 521 1 046 266 1 007 492 459 693 38 336 13 33 802 23 308 123 581 - Sep 1 728 701 1 234 717 18 533 41 894 1 043 426 1 004 963 461 746 42 325 13 34 762 23 004 123 870 - Oct 1 718 755 1 200 909 17 674 41 158 1 035 419 996 948 455 757 36 185 12 36 027 22 653 127 742 - Nov 1 722 588 1 255 228 17 946 41 331 1 031 093 992 132 457 437 38 013 11 40 425 22 317 129 985 - Dec 1 715 037 1 250 187 18 556 44 440 1 018 402 981 966 456 709 43 849 10 38 291 21 689 135 505 -
12 Jan 1 698 997 1 245 879 17 995 40 473 1 009 012 972 518 449 728 38 204 9 38 976 21 195 139 614 - Feb 1 695 379 1 240 208 17 228 38 997 1 003 533 966 621 452 327 43 832 6 37 585 20 788 142 149 - Mar 1 695 547 1 240 208 17 330 39 850 998 477 961 404 454 331 47 525 1 38 729 20 548 143 612 - Apr 1 678 073 1 193 763 17 715 38 541 989 419 952 588 442 688 36 285 1 38 760 20 241 148 424 - May 1 671 320 1 231 482 18 676 37 540 981 777 946 423 443 219 38 593 1 37 258 19 965 151 560 - Jun 1 674 931 1 227 715 17 778 38 110 967 781 932 692 441 123 45 965 1 44 350 19 731 163 836 - Jul 1 648 327 1 217 702 18 158 35 658 959 782 925 351 427 472 37 305 7 37 279 19 472 168 664 - Aug 1 630 157 1 214 632 17 596 33 902 953 009 918 479 416 342 34 379 7 33 751 19 109 174 043 - Sep 1 633 489 1 217 340 17 287 34 697 947 193 913 385 421 969 43 671 7 33 399 18 803 177 427 - Oct 1 618 514 1 189 432 16 513 33 545 936 372 902 646 411 386 41 915 7 33 878 18 482 184 851 - Nov 1 618 121 1 203 488 15 848 33 602 928 300 895 016 410 844 44 647 6 40 372 18 208 186 795 - Dec 1 536 953 1 132 649 15 304 36 208 888 651 856 360 397 992 41 673 6 33 789 17 734 162 580 -
P
1=2+8+11 2=3+4+7 3 4=5-6 5 6 7 8=9-10 9 10 =12+15 12=13+14 13 14 15
4. CREDIT INSTITUTIONS (data from 4.54 Deposits-taking institutions. Assets. Securitiessupervisory returns)E) Balance sheet of the institutional groupings of credit institutions
EUR millions
Securities other than shares Shares and other equity
Total Domestic Rest of the world Total Domestic Rest of the world Total Credit General government Other Net Total Short Total Credit Other institu- resi- positions insti- resi- tions dent (a) tution dent Net Total Short sector sector positions (a) 11=
06 219 626 134 571 24 906 70 477 76 439 5 962 39 188 85 055 87 146 2 091 151 676 103 492 16 255 87 237 48 184 07 256 939 176 057 37 154 76 499 79 423 2 924 62 404 80 882 83 250 2 369 183 389 101 608 16 015 85 593 81 781 08 314 368 232 077 41 973 96 572 100 187 3 615 93 532 82 291 83 737 1 447 171 659 91 990 13 659 78 332 79 669 09 405 461 311 923 60 033 148 722 154 413 5 691 103 168 93 537 96 129 2 591 183 819 99 199 13 409 85 790 84 620 10 377 801 313 916 58 861 156 326 164 349 8 023 98 728 63 886 70 498 6 612 180 189 102 878 14 944 87 934 77 311
11 Aug 371 613 309 909 55 848 162 919 171 967 9 048 91 142 61 704 69 038 7 334 243 849 155 047 55 307 99 741 88 802 Sep 366 986 306 687 55 285 160 322 169 109 8 787 91 080 60 299 67 299 7 000 251 342 162 730 58 226 104 503 88 612 Oct 365 505 305 164 55 175 158 952 165 771 6 819 91 037 60 341 67 239 6 898 254 109 165 391 59 180 106 211 88 718 Nov 365 089 306 468 54 285 159 465 167 282 7 817 92 718 58 621 65 495 6 874 250 370 161 321 58 309 103 012 89 049 Dec 397 307 338 967 62 368 186 635 194 454 7 820 89 964 58 340 64 105 5 765 250 540 160 409 59 546 100 863 90 131
12 Jan 426 951 365 968 69 142 207 246 216 220 8 974 89 580 60 983 67 173 6 191 257 653 166 380 64 467 101 913 91 273 Feb 444 483 378 712 69 917 219 733 228 906 9 172 89 062 65 771 72 430 6 659 259 057 167 566 65 030 102 536 91 491 Mar 458 810 391 843 73 389 227 265 236 003 8 738 91 188 66 967 72 927 5 960 257 373 166 227 64 017 102 210 91 146 Apr 450 796 385 526 70 673 224 707 232 785 8 078 90 147 65 269 71 626 6 356 258 545 166 610 64 083 102 527 91 935 May 441 245 378 057 66 771 221 120 227 684 6 564 90 165 63 188 69 204 6 016 257 950 166 493 62 705 103 788 91 457 Jun 440 299 379 164 64 235 224 095 230 216 6 121 90 833 61 135 67 147 6 012 256 549 165 670 60 982 104 688 90 879 Jul 428 172 369 156 65 520 215 607 222 082 6 475 88 028 59 016 65 010 5 994 257 394 166 190 61 163 105 028 91 204 Aug 419 744 360 697 64 578 213 179 219 273 6 094 82 940 59 047 65 048 6 001 259 361 167 374 61 584 105 790 91 987 Sep 431 276 371 336 64 707 224 181 229 020 4 838 82 448 59 939 66 231 6 292 258 974 167 788 61 851 105 937 91 186 Oct 423 803 369 214 64 687 220 188 227 841 7 653 84 340 54 588 61 462 6 874 257 790 166 770 61 523 105 248 91 019 Nov 411 321 365 916 63 702 226 672 232 823 6 151 75 542 45 405 52 194 6 790 255 177 164 186 56 038 108 148 90 991 Dec 489 453 406 626 73 763 222 997 229 112 6 115 109 866 82 827 90 282 7 455 258 297 168 130 55 846 112 284 90 167
BANCO DE ESPAÑA 103 BOLETÍN ESTADÍSTICO, FEBRUARY 2013

P
1=3+7+8+ 2 3=4 a 6 4 5 6 7 8 9 10 11 12 13
4. CREDIT INSTITUTIONS (data from 4.55 Deposit-taking institutions. Liabilities. Other resident sectorssupervisory returns)E) Balance sheet of the institutional groupings of credit institutions
See notes at the end of the chapter
EUR millions
Of which: Overnight, saving and agreed mat. dep. Funds Hybrid Repur- Subor- Other By from finan- chase dinate liabi- Provin- financial cial agree- depo- lities ces
Total In In euro asset liabi- ments sits (e) (a) foreign In transfers lities (d) curren- foreign (b) (c) cy Total Over- Savings With curren- night accoun. agreed cy
+12 maturi. 9+10+11
06 1 142 147 32 717 883 033 261 885 186 408 434 740 29 207 96 179 23 519 83 851 26 358 ... 929 017 07 1 319 391 43 844 1 008 048 258 549 179 395 570 105 35 644 116 575 29 196 85 626 44 302 ... 1 042 400 08 1 428 936 36 740 1 151 097 244 724 179 777 726 595 29 318 90 996 27 463 84 976 45 086 ... 1 143 674 09 1 422 781 33 064 1 187 763 261 509 207 791 718 463 22 015 66 933 24 095 69 388 52 587 ... 1 142 013 10 1 434 104 30 737 1 211 843 258 755 211 287 741 800 19 383 54 285 25 664 71 137 51 793 ... 1 148 253
11 Aug 1 389 789 27 878 1 188 188 259 596 202 760 725 833 18 356 49 772 27 082 57 942 48 449 ... ... Sep 1 386 898 28 366 1 181 046 258 270 199 648 723 128 18 403 49 802 27 376 60 891 49 379 ... 1 125 504 Oct 1 363 714 25 996 1 166 274 254 130 197 144 714 999 16 261 50 263 27 077 55 587 48 253 ... ... Nov 1 356 064 26 918 1 161 601 256 927 198 708 705 966 16 882 48 200 27 012 53 834 48 535 ... ... Dec 1 358 356 28 062 1 162 269 262 173 202 949 697 147 17 719 47 350 27 180 59 933 43 906 ... 1 109 656
12 Jan 1 339 009 27 892 1 146 527 253 375 197 452 695 700 17 631 46 217 26 899 58 028 43 708 ... ... Feb 1 341 345 27 371 1 147 632 253 165 196 345 698 122 17 279 45 166 26 956 63 776 40 535 ... ... Mar 1 348 183 26 153 1 151 349 256 276 197 542 697 531 15 913 43 905 26 959 69 348 40 710 ... 1 103 113 Apr 1 318 862 26 532 1 137 648 254 008 195 471 688 168 16 165 42 705 26 632 56 213 39 499 ... ... May 1 314 274 27 587 1 135 746 261 256 196 783 677 707 16 793 40 995 25 752 56 214 38 775 ... ... Jun 1 318 912 27 161 1 140 358 269 272 205 806 665 281 16 488 39 778 24 450 61 371 36 466 ... 1 088 677 Jul 1 273 605 27 718 1 109 809 254 194 201 566 654 049 16 775 38 127 23 583 52 162 33 150 ... ... Aug 1 259 600 27 227 1 104 844 253 353 201 384 650 107 16 494 38 109 22 552 47 255 30 346 ... ... Sep 1 277 126 27 634 1 111 475 253 640 200 291 657 545 17 081 38 114 21 755 58 902 29 799 ... 1 058 119 Oct 1 276 792 30 272 1 112 690 246 425 198 725 667 540 20 067 36 780 20 400 60 025 26 830 ... ... Nov 1 290 779 30 353 1 127 242 250 997 201 912 674 334 20 469 36 491 20 636 59 704 26 236 ... ... Dec 1 303 880 30 200 1 140 975 258 971 199 073 682 930 20 486 36 817 19 610 60 111 25 882 ... ...
P
1 2 3 4 5 6 7 8=9+10 9 10 11=12+15 12=13+ 13 14 15
4. CREDIT INSTITUTIONS (data from 4.56 Deposit-taking institutions. Other unsectorisedsupervisory returns) assetsE) Balance sheet of the institutional groupings of credit institutions
EUR millions
Fixed assets Welfare fund assets Accrual and sundry accounts Rights Assets Non-cu- Intan- Accrual
Total Furni- Real on leased rrent gible Total Real Furni- Sundry shings estate assets out assets assets estate shings accounts held under held Total Accrued Other under opera- for Total inte- accrual finance ting sale rest lease leases 14
06 26 255 6 168 17 730 556 125 413 1 262 1 474 1 167 307 124 332 10 379 8 080 2 299 113 953 07 27 854 6 728 18 155 540 125 722 1 584 1 679 1 245 434 149 554 13 344 11 167 2 177 136 211 08 33 872 7 260 19 636 594 150 3 908 2 323 1 767 1 285 483 236 349 15 366 12 829 2 537 220 983 09 42 414 6 943 20 767 594 738 10 852 2 520 1 815 1 305 510 196 344 10 565 8 366 2 199 185 779 10 46 919 6 300 21 743 600 669 15 019 2 588 1 868 1 398 470 236 192 11 594 8 353 3 241 224 598
11 Aug 51 915 5 842 21 980 577 629 19 916 2 971 1 828 1 402 426 272 489 12 969 9 090 3 879 259 520 Sep 52 470 5 789 21 897 571 619 20 550 3 044 1 798 1 373 425 300 996 13 103 8 839 4 264 287 893 Oct 53 117 5 727 21 887 568 608 21 258 3 070 1 794 1 354 440 292 905 13 358 9 088 4 270 279 546 Nov 53 561 5 685 19 637 563 622 23 938 3 117 1 789 1 347 442 299 195 14 649 9 812 4 836 284 546 Dec 54 333 5 656 19 418 573 646 24 629 3 411 1 738 1 309 429 314 591 12 222 9 076 3 146 302 369
12 Jan 54 838 5 619 19 400 584 638 25 216 3 382 1 733 1 313 420 323 722 11 635 8 664 2 971 312 087 Feb 55 501 5 600 19 351 572 622 25 975 3 381 1 728 1 311 417 318 534 13 993 9 240 4 753 304 542 Mar 56 064 5 530 19 178 572 617 26 774 3 393 1 723 1 311 412 311 558 14 234 9 185 5 048 297 325 Apr 56 541 5 525 19 069 570 605 27 346 3 426 1 718 1 309 409 324 386 14 152 8 700 5 452 310 233 May 56 994 5 465 19 033 568 597 27 745 3 586 1 719 1 314 406 377 103 15 164 9 219 5 945 361 939 Jun 57 031 5 423 18 716 566 593 27 268 4 465 1 720 1 317 403 357 823 14 551 8 468 6 083 343 272 Jul 57 034 5 391 18 179 562 584 27 733 4 585 1 714 1 314 399 371 872 14 323 8 068 6 255 357 549 Aug 58 161 5 399 18 331 558 572 27 687 5 613 1 708 1 312 396 367 787 15 635 8 910 6 724 352 152 Sep 58 688 5 333 18 490 585 562 27 944 5 773 1 704 1 310 393 367 071 15 172 9 303 5 869 351 899 Oct 59 133 5 258 18 448 580 545 28 372 5 929 1 698 1 307 391 354 071 14 645 9 063 5 583 339 426 Nov 59 431 5 240 18 328 547 536 28 892 5 888 1 662 1 279 383 361 262 14 941 9 584 5 357 346 321 Dec 50 801 5 180 16 670 539 530 20 735 7 146 1 086 831 255 360 329 11 844 7 600 4 243 348 486
BANCO DE ESPAÑA 104 BOLETÍN ESTADÍSTICO, FEBRUARY 2013

P
1=2+9+ 2=3+8 3=4a7 4 5 6 7 8 9 10 11 12 13
4. CREDIT INSTITUTIONS (data from 4.57 Deposit-taking institutions. Equity, valuation adjustments and impairment allowancessupervisory returns)E) Balance sheet of the institutional groupings of credit institutions
EUR millions Equity Financial Impairment assets and allowances (c) Memo items liabili-
Total Total Own funds Valua- ties tion valuation Total Of which: Investment adjust- adjust- impairments Total Capital Reser- Net Other ments ments losses and en- ves profits accounts Total Loans dowment (a) (b) Loans especific (f)
10 fund (d) ORS (e)
06 174 187 143 088 131 871 12 972 103 989 19 119 -4 210 11 217 2 152 28 946 27 519 3 871 101 07 199 177 168 479 158 349 14 034 117 348 25 115 1 851 10 130 -4 769 35 468 32 817 5 438 1 165 08 232 758 173 338 173 187 16 304 137 689 18 391 803 151 13 836 45 584 41 721 17 073 610 09 259 750 183 439 180 952 18 546 145 811 12 885 3 709 2 486 15 116 61 195 51 284 32 552 4 873 10 269 888 170 885 174 139 25 293 134 680 9 287 4 878 -3 254 12 089 86 914 68 079 39 644 2 649
11 Aug 330 058 223 420 226 333 39 201 175 198 3 518 8 416 -2 913 14 668 91 970 69 097 ... ... Sep 337 141 228 935 232 915 41 935 179 082 3 601 8 296 -3 980 15 784 92 421 69 101 44 138 2 916 Oct 340 675 232 733 237 534 43 154 184 056 2 256 8 067 -4 801 14 924 93 019 69 499 ... ... Nov 337 213 229 184 237 091 43 297 183 489 2 463 7 842 -7 907 13 883 94 146 70 474 ... ... Dec 350 126 212 606 216 816 46 746 177 958 -14 721 6 833 -4 210 15 630 121 890 80 090 49 631 17 404
12 Jan 362 196 236 436 238 800 48 662 182 790 70 7 279 -2 364 16 784 108 976 79 190 ... ... Feb 364 320 239 240 241 106 48 764 182 965 689 8 688 -1 866 15 692 109 388 80 130 ... ... Mar 363 323 238 786 242 625 49 759 180 603 1 058 11 205 -3 838 14 846 109 690 80 194 51 329 277 Apr 361 516 234 038 241 195 49 894 181 222 -731 10 810 -7 157 15 486 111 993 81 071 ... ... May 356 487 215 039 228 871 50 101 167 952 -190 11 008 -13 831 17 839 123 609 84 052 ... ... Jun 369 018 208 643 220 631 53 629 168 253 -10 871 9 620 -11 988 15 299 145 077 97 868 59 117 5 940 Jul 369 584 206 220 220 167 53 985 171 908 -12 196 6 470 -13 947 16 805 146 558 99 156 ... ... Aug 372 953 207 909 219 454 53 759 170 281 -10 840 6 254 -11 545 14 578 150 466 103 279 ... ... Sep 383 058 210 973 219 837 58 322 169 351 -13 869 6 034 -8 865 14 071 158 014 108 737 67 630 6 431 Oct 384 758 207 672 214 547 58 820 170 418 -17 585 2 895 -6 876 13 517 163 570 113 734 ... ... Nov 383 292 198 868 204 289 59 203 170 709 -28 399 2 777 -5 421 14 247 170 176 123 559 ... ... Dec 391 392 189 980 194 658 71 159 185 862 -63 777 1 414 -4 678 13 736 187 677 120 782 ... ...
P
1 2 3 4 5 6 7 8 9 10 11 12 13
4. CREDIT INSTITUTIONS (data from 4.58 Deposit-taking institutions. Unsectorisedsupervisory returns) liabilitiesE) Balance sheet of the institutional groupings of credit institutions
EUR millions
Welfare fund and liabilities Other liabilities
Total Fund Reser- Other Total Provisions Accruals Sundry ves accounts Total For For Other Total Accrued Other pensions taxes interest
06 2 529 2 020 122 387 152 909 27 610 21 745 481 5 384 21 022 14 927 6 094 104 278 07 2 994 2 360 120 514 192 058 28 380 20 577 416 7 387 26 762 20 076 6 686 136 915 08 3 136 2 492 109 535 242 290 29 769 20 937 710 8 122 28 345 22 828 5 517 184 176 09 3 314 2 625 109 580 201 088 29 932 20 009 826 9 097 22 965 17 023 5 941 148 192 10 3 217 2 581 130 507 224 072 32 320 20 810 704 10 806 23 575 17 878 5 696 168 177
11 Aug 3 403 2 856 124 423 250 248 27 861 18 763 699 8 399 24 766 19 180 5 587 197 620 Sep 3 329 2 777 124 429 273 454 27 914 18 616 707 8 591 25 297 19 746 5 551 220 243 Oct 3 274 2 717 138 418 268 480 27 661 18 429 689 8 543 25 583 19 612 5 971 215 236 Nov 3 171 2 633 138 400 269 022 27 430 18 342 663 8 424 26 724 20 292 6 432 214 868 Dec 3 022 2 423 138 461 283 140 27 757 18 253 608 8 896 25 011 19 671 5 341 230 372
12 Jan 2 982 2 386 138 457 300 683 27 081 17 859 614 8 607 25 139 19 439 5 699 248 464 Feb 2 896 2 339 138 419 283 935 27 185 17 839 666 8 680 24 287 19 107 5 180 232 463 Mar 2 915 2 408 138 368 276 333 27 642 17 626 664 9 352 23 321 18 340 4 982 225 371 Apr 2 878 2 385 138 355 285 553 27 669 17 639 651 9 379 22 986 17 785 5 202 234 898 May 3 299 2 822 138 338 327 056 27 580 17 576 698 9 306 23 757 18 366 5 390 275 720 Jun 3 276 2 850 138 288 305 237 29 649 17 670 744 11 235 22 518 17 466 5 052 253 070 Jul 3 208 2 693 138 377 324 950 29 525 17 236 723 11 566 22 795 17 695 5 100 272 630 Aug 3 165 2 779 138 248 320 138 29 941 17 031 783 12 127 24 927 19 374 5 553 265 270 Sep 3 102 2 743 138 221 318 471 30 998 16 617 808 13 574 25 525 20 005 5 520 261 948 Oct 3 051 2 681 138 232 311 006 31 168 16 545 682 13 941 25 268 19 416 5 853 254 570 Nov 2 936 2 607 130 199 315 506 30 806 16 315 736 13 754 26 116 20 016 6 101 258 584 Dec 2 085 1 703 55 328 314 804 35 165 16 581 678 17 907 25 228 20 060 5 168 254 410
BANCO DE ESPAÑA 105 BOLETÍN ESTADÍSTICO, FEBRUARY 2013

P
1 =2a11 2 3 4 5 6 7 8 9 10 11 12 13
4. CREDIT INSTITUTIONS (data from 4.81 Specialised credit institutions. Assetssupervisory returns)E) Balance sheet of the institutional groupings of credit institutions
See notes at the end of the chapter
EUR millions Securities Shares and
Total Loans other than other equity Unsectorised Memo items shares assets Of which: Domestic Rest Domestic Rest Domestic Rest Cash Other Doubtful Arrears of the of the of the (b) Loans (c) world world world Credit General Other institu- govern- resident tions ment sector (a)
06 63 874 2 134 2 069 55 577 2 114 128 - 59 4 0 1 791 1 498 1 231 07 69 315 2 620 3 000 57 427 3 665 277 - 50 17 0 2 258 1 941 1 674 08 73 842 3 492 3 899 59 573 4 058 473 - 56 15 0 2 276 3 845 3 486 09 54 200 1 918 1 760 44 422 3 656 756 - 49 14 0 1 626 4 790 4 514 10 53 540 2 132 2 180 42 125 4 604 557 - 35 13 0 1 893 4 252 3 961
11 Aug 50 621 2 072 1 764 39 566 4 675 451 - 55 13 0 2 025 3 802 ... Sep 50 515 1 960 1 882 39 495 4 842 351 - 54 13 0 1 918 3 783 3 425 Oct 50 188 2 002 1 897 39 064 4 902 278 - 61 13 0 1 970 3 799 ... Nov 49 603 1 937 1 853 38 705 4 868 162 - 61 13 0 2 003 3 815 ... Dec 54 637 2 121 1 919 43 064 5 034 1 - 61 13 0 2 423 3 831 3 478
12 Jan 53 477 2 242 1 609 42 055 5 040 1 6 61 13 0 2 449 3 826 ... Feb 53 246 2 471 1 563 41 532 5 149 2 12 60 13 0 2 444 3 821 ... Mar 53 772 2 865 1 569 41 416 5 357 4 18 60 13 0 2 469 3 815 3 484 Apr 53 636 2 740 1 818 41 073 5 344 21 17 87 13 0 2 522 3 826 ... May 52 355 2 743 1 826 40 398 4 713 37 17 87 13 0 2 521 3 838 ... Jun 52 106 2 819 1 617 40 377 4 466 53 17 87 13 0 2 657 3 849 3 492 Jul 51 642 2 717 1 423 40 161 4 505 137 12 87 13 0 2 587 3 902 ... Aug 51 078 2 664 1 370 39 515 4 602 222 6 87 13 0 2 600 3 955 ... Sep 50 190 3 077 1 349 39 050 3 601 306 1 86 13 0 2 706 4 007 3 593 Oct 49 171 2 773 1 342 38 574 3 525 233 1 86 13 0 2 623 3 945 ... Nov 48 547 2 848 1 307 37 980 3 466 162 1 86 13 0 2 684 3 885 ... Dec 49 555 2 822 1 312 38 996 3 723 90 1 86 13 0 2 511 3 824 ...
P
1=3a9 2=3a6 3 4 5 6 7 8 9
4. CREDIT INSTITUTIONS (data from 4.82 Specialised credit institutions. Liabilitiessupervisory returns)E) Balance sheet of the institutional groupings of credit institutions
See notes at the end of the chapter
EUR millions
Total Deposits Unsectorised liabilities Total Domestic Rest Securities Equity, Accrual of the other adjustments and world than and sundry Credit General Other shares impairment accounts institu- govern- resid. allowances (b) tions ment sector (a)
06 63 874 52 583 41 695 6 732 10 149 742 5 939 4 610 07 69 315 57 346 45 541 8 925 10 873 866 6 160 4 943 08 73 842 61 741 48 976 10 1 312 11 443 565 7 220 4 316 09 54 200 44 410 33 935 13 1 483 8 980 389 6 970 2 431 10 53 540 43 889 33 192 15 1 773 8 909 330 6 923 2 399
11 Aug 50 621 41 571 31 857 14 1 933 7 767 318 6 679 2 053 Sep 50 515 41 381 32 035 13 1 605 7 728 314 6 637 2 182 Oct 50 188 41 406 31 983 13 1 780 7 630 315 6 451 2 016 Nov 49 603 41 128 31 957 13 1 707 7 452 306 6 209 1 961 Dec 54 637 45 933 31 629 13 6 646 7 645 296 6 229 2 179
12 Jan 53 477 44 908 30 315 12 6 848 7 733 293 6 361 1 915 Feb 53 246 44 394 29 978 12 6 698 7 707 314 6 641 1 896 Mar 53 772 44 385 30 273 12 6 291 7 809 329 6 904 2 154 Apr 53 636 44 097 29 768 10 6 564 7 754 330 6 921 2 288 May 52 355 42 679 29 630 9 6 435 6 605 331 6 924 2 422 Jun 52 106 42 203 29 615 8 6 052 6 529 316 6 912 2 675 Jul 51 642 42 194 29 306 8 6 249 6 630 314 6 965 2 169 Aug 51 078 41 568 28 835 8 6 119 6 606 312 7 035 2 163 Sep 50 190 40 328 28 725 7 5 801 5 795 313 7 094 2 455 Oct 49 171 39 804 28 005 8 6 132 5 660 267 7 104 1 996 Nov 48 547 38 990 27 237 9 6 368 5 376 273 7 120 2 164 Dec 49 555 40 239 28 678 9 6 323 5 228 156 6 624 2 535
BANCO DE ESPAÑA 106 BOLETÍN ESTADÍSTICO, FEBRUARY 2013

P
1=4+5+7 2 3 4 5 6 7 8 9 10 11 12
4. CREDIT INSTITUTIONS (data from 4.83 Specialised credit institutions. Lending. Other resident sectorssupervisory returns)E) Balance sheet of the institutional groupings of credit institutions
See notes at the end of the chapter
EUR millions
of which: Secured loans Other fixed- Debts Finance Doubtful Trade term loans repay- leases debtors credit able (a)
Total At a va- In of which: of which: on riable foreign demand interest curren- Total Total rate cy Mortgage Repur- Hybrid loans chase finan- agree- cial ments assets
+10+11+12
06 55 577 13 559 44 12 441 6 703 6 363 18 699 - - 3 653 12 730 1 350 07 57 427 14 296 22 13 014 8 950 8 595 17 141 - - 3 867 12 673 1 782 08 59 573 15 021 84 12 991 10 621 10 469 16 617 - - 3 925 11 788 3 631 09 44 422 22 402 0 6 088 10 631 10 104 12 346 - - 3 468 7 352 4 537 10 42 125 19 619 1 5 865 10 766 10 178 11 816 - - 3 235 6 385 4 060
11 Aug 39 566 20 109 - 5 498 10 431 9 841 11 482 - - 2 878 5 691 3 586 Sep 39 495 18 243 8 4 941 10 768 10 201 11 757 - - 2 914 5 543 3 572 Oct 39 064 17 911 8 5 140 10 571 10 015 11 464 - - 2 861 5 442 3 586 Nov 38 705 17 622 8 5 328 10 401 9 853 11 207 - - 2 815 5 354 3 600 Dec 43 064 22 370 4 5 496 14 369 13 807 11 411 - - 2 753 5 422 3 614
12 Jan 42 055 21 721 4 5 577 13 952 13 406 10 989 - - 2 673 5 265 3 600 Feb 41 532 21 333 3 5 706 13 703 13 167 10 741 - - 2 625 5 171 3 587 Mar 41 416 21 313 4 4 816 14 253 13 689 11 221 - - 2 441 5 111 3 574 Apr 41 073 21 030 4 4 959 14 064 13 507 11 008 - - 2 409 5 043 3 590 May 40 398 20 582 4 5 052 13 765 13 220 10 681 - - 2 357 4 936 3 607 Jun 40 377 22 735 1 4 978 13 478 13 033 11 095 - - 2 429 4 773 3 624 Jul 40 161 22 511 1 5 111 13 345 12 905 10 893 - - 2 405 4 726 3 681 Aug 39 515 22 052 1 5 180 13 073 12 641 10 539 - - 2 356 4 629 3 738 Sep 39 050 21 810 1 4 310 11 000 10 623 13 099 - - 2 353 4 496 3 793 Oct 38 574 21 452 1 4 405 10 819 10 448 12 879 - - 2 314 4 422 3 735 Nov 37 980 21 168 1 4 348 10 676 10 310 12 630 - - 2 284 4 363 3 679 Dec 38 996 20 866 5 4 342 12 184 11 795 10 583 - - 4 157 4 108 3 621
P
1 2 3 4 5 6 7 8 9 10 11 12
4. CREDIT INSTITUTIONS (data from 4.84 Specialised credit institutions. Other unsectorisedsupervisory returns) assetsE) Balance sheet of the institutional groupings of credit institutions
EUR millions
Fixed assets Accrual and sundry accounts Rights Assets Non-cu- Intan- Accrual
Total Furni- Real on leased rrent gible Sundry shings estate assets out assets assets accounts held under held Total Accrued Other under opera- for Total interest accrual finance ting sale lease leases
06 872 65 71 0 679 32 24 919 424 145 279 495 07 999 51 82 0 785 50 31 1 259 444 128 316 815 08 1 141 51 86 0 731 228 45 1 135 509 223 286 626 09 681 39 105 - 93 402 41 945 248 197 52 697 10 788 34 95 - 96 520 43 1 105 301 239 62 804
11 Aug 762 32 93 - 97 497 44 1 263 370 289 80 894 Sep 770 30 91 - 91 516 43 1 147 331 248 83 816 Oct 774 30 91 - 91 518 43 1 196 345 259 86 851 Nov 795 31 94 - 94 533 44 1 208 349 261 87 859 Dec 937 28 90 - 89 691 39 1 486 624 252 372 862
12 Jan 940 28 90 - 89 693 40 1 509 634 256 378 875 Feb 948 28 91 - 90 699 40 1 496 628 254 374 868 Mar 968 17 93 - 87 732 39 1 501 633 249 384 868 Apr 974 17 94 - 87 737 40 1 548 653 256 396 895 May 974 17 94 - 87 736 40 1 548 653 256 396 895 Jun 984 15 104 - 87 736 43 1 673 673 236 437 999 Jul 992 15 105 - 87 742 43 1 594 642 225 417 953 Aug 990 15 104 - 87 740 43 1 610 648 227 421 962 Sep 997 15 106 - 87 748 41 1 709 683 235 447 1 027 Oct 996 15 106 - 87 747 41 1 627 650 224 426 978 Nov 1 005 15 107 - 87 754 41 1 680 671 231 439 1 009 Dec 956 16 115 - 88 700 38 1 555 675 245 431 880
BANCO DE ESPAÑA 107 BOLETÍN ESTADÍSTICO, FEBRUARY 2013

P
1=2+9+ 2=3+8 3=4a7 4 5 6 7 8 9 10 11 12 13
4. CREDIT INSTITUTIONS (data from 4.85 Specialised credit institutions. Equity, valuation adjustments and impairment allowancessupervisory returns)E) Balance sheet of the institutional groupings of credit institutions
EUR millions Equity Financial Impairment assets and allowances (c) Memo items liabili-
Total Total Own funds Valua- ties tion valuation Total Of which: Investment adjust- adjust- impairments Total Capital Reser- Net Other ments ments losses and en- ves profits accounts Total Loans dowment (a) (b) Loans especific (f)
10 fund (d) ORS (e)
06 5 939 4 297 4 279 1 999 1 932 467 -119 18 68 1 574 1 571 592 -1 07 6 160 4 376 4 357 2 082 1 950 478 -153 19 92 1 692 1 687 796 0 08 7 220 4 848 4 989 2 742 2 186 76 -15 -142 31 2 342 2 331 1 549 1 09 6 970 4 210 4 341 2 917 1 821 -392 -5 -131 -40 2 800 2 750 2 299 -0 10 6 923 4 049 4 170 2 776 1 544 -74 -76 -121 -47 2 921 2 824 2 446 3
11 Aug 6 679 4 109 4 198 2 655 1 487 45 11 -89 -15 2 585 2 477 ... ... Sep 6 637 4 113 4 272 2 491 1 607 107 67 -159 -20 2 544 2 431 2 061 0 Oct 6 451 3 997 4 152 2 421 1 562 104 65 -155 -19 2 473 2 363 ... ... Nov 6 209 3 847 3 996 2 330 1 504 100 62 -149 -19 2 380 2 274 ... ... Dec 6 229 3 870 3 990 2 199 1 622 72 96 -120 3 2 356 2 217 1 788 2
12 Jan 6 361 3 906 4 031 2 289 1 688 27 27 -125 3 2 452 2 307 ... ... Feb 6 641 4 098 4 228 2 370 1 749 54 55 -129 3 2 540 2 390 ... ... Mar 6 904 4 591 4 715 2 914 1 639 81 82 -124 -9 2 322 2 162 1 744 -1 Apr 6 921 4 602 4 727 2 921 1 643 81 82 -125 -9 2 327 2 167 ... ... May 6 924 4 604 4 729 2 922 1 643 81 82 -125 -9 2 328 2 168 ... ... Jun 6 912 4 567 4 694 2 898 1 592 108 96 -126 -10 2 355 2 185 1 670 2 Jul 6 965 4 602 4 730 2 920 1 604 109 97 -127 -10 2 373 2 202 ... ... Aug 7 035 4 649 4 777 2 950 1 620 110 98 -129 -10 2 397 2 224 ... ... Sep 7 094 4 780 4 906 2 930 1 774 177 25 -126 -24 2 338 2 160 1 676 2 Oct 7 104 4 787 4 913 2 934 1 777 178 25 -126 -24 2 342 2 163 ... ... Nov 7 120 4 798 4 924 2 941 1 781 178 25 -127 -24 2 347 2 168 ... ... Dec 6 624 4 385 4 500 2 987 1 509 -60 64 -115 -25 2 264 2 061 ... ...
P
1 2 3 4 5 6 7 8 9
4. CREDIT INSTITUTIONS (data from 4.86 Specialised credit institutions. Unsectorisedsupervisory returns) liabilitiesE) Balance sheet of the institutional groupings of credit institutions
EUR millions
Total Provisions Accruals Sundry accounts Total For For Other Total Accrued Other pensions taxes interest
06 4 610 266 31 6 228 856 424 432 3 487 07 4 943 275 39 4 232 838 480 358 3 830 08 4 316 302 56 25 221 894 539 355 3 120 09 2 431 189 101 20 69 495 241 254 1 747 10 2 399 168 96 18 55 465 209 256 1 765
11 Aug 2 053 180 98 20 63 495 243 252 1 378 Sep 2 182 161 90 18 53 462 214 248 1 559 Oct 2 016 167 93 19 55 478 222 256 1 371 Nov 1 961 166 93 18 55 475 220 254 1 320 Dec 2 179 157 87 18 53 499 204 295 1 523
12 Jan 1 915 156 86 18 52 494 202 292 1 266 Feb 1 896 159 88 18 53 503 205 297 1 235 Mar 2 154 158 85 18 54 437 189 247 1 560 Apr 2 288 197 106 23 67 545 236 309 1 547 May 2 422 211 114 25 72 584 253 331 1 627 Jun 2 675 152 83 18 52 350 177 172 2 173 Jul 2 169 137 75 16 47 315 160 155 1 716 Aug 2 163 137 75 16 47 315 160 155 1 711 Sep 2 455 152 81 17 54 409 170 239 1 895 Oct 1 996 145 77 16 51 388 161 227 1 463 Nov 2 164 152 81 17 54 410 170 239 1 602 Dec 2 535 169 85 20 64 400 136 264 1 966
BANCO DE ESPAÑA 108 BOLETÍN ESTADÍSTICO, FEBRUARY 2013

BANCO DE ESPAÑA / BOLETÍN ESTADÍSTICO
NOTES TO THE TABLES OF CHAPTER 4
General note
Chapter 4 of the Boletín Estadístico presents information on credit institutions as a whole, and on each of the groups of institutions that come under this heading, namely deposit-taking institutions, specialised credit institutions [including specialised lending institutions (ECAOL) until 1996] and the Instituto de Crédito Oficial [including official credit banks (EOC) until May 1994). The basic source of this information is the individual confidential returns that credit institutions submit to the Banco de España for supervisory purposes in relation to their activity in Spain, in accordance with the criteria and rules laid down in the Accounting Circular CBE 4/2004 and prior provisions. The information in Chapter 8 (Tables 8.41- 8.44) also relates to credit institutions. The difference between these two sets of data arises from the fact that they are compiled on the basis of different sources of information. Thus, while the data in this chapter are, as already mentioned, drawn from the financial statements credit institutions send to the Banco de España for supervisory purposes, those of Chapter 8 are obtained from the accounting statements used to compile statistics for the euro area and, therefore, incorporate the conceptual framework common to all the countries that make up that area. There are certain differences in sectorisation and instrument valuation (see Table 4 and the notes thereto), but the structure of these two chapters means that they can be used to complement one other. Thus, while there is greater detail in this chapter on credit instruments (commercial, mortgage, etc.), deposits (sight, time, structured, etc.), capital accounts (capital, reserves, provisions, etc.) and other assets and liabilities (accruals, derivatives, etc.), the extra detail in Chapter 8 relates to counterpart sectors and residence, indicating whether the households or NPISHs, non-financial corporations and other financial intermediaries are resident in Spain, in other euro area countries or in the rest of the world (in which case, there is no information on the counterparty). Readers' attention is drawn to these details in order that they may benefit from the complementary information in these chapters.
Table 4
As already mentioned in the general note, the balance sheet in Chapter 4 is based on the information institutions send to the Banco de España for supervisory purposes, while the balance sheet in Chapter 8 is obtained from the accounting statements used to compile statistics for the euro area and, given its purpose, is compiled on the basis of the same conceptual framework used for all the countries that make up the euro area. The reconciliation of the two chapters shows that the same set of institutions is being considered from two complementary viewpoints. There are some small differences, attributable to the different purposes of the chapters, that can, for a specific period, be appreciated in this reconciliation table: The returns for euro area statistics (euro area returns), which are used, inter alia, as the basis for calculating the monetary aggregates monitored by the ECB, distinguish between non-resident units situated in other euro area countries and non-resident units situated in third countries, while the supervisory returns group all counterparts vis-à-vis units not resident in Spain in the sector rest of the world. In the balance sheet compiled on the basis of the euro area statistical returns, money market funds (MMFs) are included with the Banco de España and credit institutions to form a sector called "monetary financial institutions" (MFIs). In the supervisory returns, these MMFs are included with other collective investment institutions of a financial nature in the sector “other resident sectors” (see the sectorisation schemes at the end of the Bulletin), while the grouping composed of the Banco de España and credit institutions is called the "credit system". The differences in scope between MFIs and the credit system are, in some cases, more conceptual than practical in nature, which is why these two groupings are opposite each other in the reconciliation tables. There are some other differences in accounting rules which are not detailed in this note, since the discrepancies to which they give rise are not significant. Also, some discrepancies may be attributable to the fact that the accounting statements have been updated at different times. Table 4.A
a. From January 2009 to April 2011 there may be small differences between total credit institutions and the sum of deposit-taking institutions, SCIs and ICO. This is because in this period electronic money institutions were considered to be credit institutions, but upon the entry into force of Directive 2009/110/EC of the European Parliament and of the Council, they ceased to be considered as such. Given the scant quantitative importance of these institutions, it was decided to retain their amount in the credit institution totals but it was not considered necessary to retain the breakdowns. The detail of this column is given in Tables 4.1 and 4.2. b. See details in Tables 4.51 and 4.52. c. See details in Tables 4.81 and 4.82. Table 4.1
a. See the breakdown by subsector in Table 8.25. There are some small differences, owing to the fact that the tables use different definitions of credit and have been updated at different times.
BANCO DE ESPAÑA 109 BOLETÍN ESTADÍSTICO, FEBRUARY 2013

BANCO DE ESPAÑA / BOLETÍN ESTADÍSTICO
b. See breakdown by instrument in Table 4.3. c. See details in Table 4.4. d. See details in Table 4.6. e. See details in Table 4.99. f. Includes non-performing doubtful loans which are those in respect of which some amount of principal, interest or any other contractually agreed expense is more than three months past-due or exceeds 25% of total debt (unless these loans are specifically classified as written-off assets).It corresponds to the amount of column 14, Table 4.99. Table 4.2
a. See the breakdown by subsector in Table 8.25. There are some small differences, owing to the different definition of deposits and the fact that the tables have been updated at different times. b. See breakdown by instrument in Table 4.5. c. See details in Table 4.7. d. See details in Table 4.8. Table 4.3
a. The breakdown by institutional sector can be consulted in Table 8.26. There are some discrepancies between this amount and that in Table 8.26, owing to differences in the institutional scope and in the concept of credit and the fact that the tables have been updated at different times. b. Hybrid financial assets are those financial assets that include simultaneously a principal contract other than a derivative and a financial derivative known as an "implicit derivative", which is not individually transferable. The flows generated by the hybrid contract normally vary in the same way as those of the derivative considered in isolation. For example, a debt instrument whose interest payments are related to a securities index. c. Doubtful loans are loans in relation to which there is reasonable doubt regarding full repayment (of principal and interest) in accordance with the contractual terms. They include non-performing loans, which are those in respect of which some amount of principal, interest or contractually agreed expense is more than three months past-due. See details in Table 4.99. There may be differences between the amounts in these two tables, owing to the fact that they have been updated at different times. Table 4.4
a. Short securities positions reflect the amount of the financial liabilities arising from the outright sale of financial assets acquired temporarily or received on loan. However, Table 4.4 shows short positions in the assets (columns 6 and 10) and deducts them from the total figures for "securities other than shares" of residents in Spain and in the rest of the world. Thus, columns 4 and 8 contain net figures and follow the same criterion as the returns the institutions submit for statistical purposes (and, therefore, the same criterion as Chapter 8 of this Bulletin), according to which short securities positions must be deducted from the item "securities other than shares" [see Rule 71. c) iii)]. Table 4.5
a. The breakdown by institutional sector may be consulted in Table 8.28. There are discrepancies between the amounts of these two Tables, owing to differences in the institutional scope, the fact that the tables have been updated at different times, and differences in the accounting for the acquisition of securities of securitisation special purpose entities used to securitise financial assets kept on the institution’s balance sheet (see changes introduced in the Boletín Estadístico of January 2010). b. Funds received under financial asset transfers include the funds raised by institutions through financial asset transfer transactions when the transferred financial asset cannot be derecognised as the risk and benefits associated with its ownership have not been substantially transferred. c. Hybrid financial liabilities are financial liabilities that include simultaneously a principal contract other than a derivative and a financial derivative known as an "implicit derivative", which is not individually transferable. The flows generated by the hybrid contract normally vary in the same way as those of the derivative considered in isolation. For example, a deposit whose interest rate depends on the changes in the price of a share. d. Subordinated deposits include the amount of deposits received which, for the purposes of payment priority, rank behind ordinary debt. e. This column includes overnight deposits, savings accounts, deposits with agreed maturity and repurchase agreements. However, mortgage covered bonds with the character of deposits and funds received under financial asset transfers are not included. Mortgage covered bonds are securities whose capital and interest are secured and when they are non-marketable they are included under deposits. Funds received under financial asset transfers are defined in footnote b to Table 4.5 . The amount recorded in column 13 of Table 4.5 is broken down by province and region in Tables 4.29 and 4.31. Table 4.6
a. See details in Table 4.9.
BANCO DE ESPAÑA 110 BOLETÍN ESTADÍSTICO, FEBRUARY 2013

BANCO DE ESPAÑA / BOLETÍN ESTADÍSTICO
Table 4.7
a. The valuation adjustments to equity include the amounts of the adjustments made to assets and liabilities recorded temporarily in equity, under this heading, until they are extinguished or realised, when they are recorded in the income statement. b. Financial assets and liabilities valuation adjustments include the difference between the valuation of the assets and liabilities in the institutions' public balance sheets and in the euro area statistical returns, except those attributable to accrued interest and impairment allowances which are presented under separate headings of the assets and/or liabilities. c. Impairment allowances include the amounts set aside to cover impairment losses, in relation to loans and other assets. d. Impairment allowances, total loans, include the amounts set aside to cover both specific and general insolvency risk attributable to loans and advances to other debtors. e. Impairment allowances, specific loans, include only the amounts set aside to cover specific insolvency risk attributable to loans and advances to other resident sectors. f. The figure of net profit (column 6) (following the same criterion of other tables in Chapter 4) includes the sum of the profit or loss of each deposit-taking institution taken individually. This figure is highly influenced by the segregation process of the savings banks' banking business to newly-created banks. Given that a significant portion of the shares of these new banks are part of the savings banks' investment portfolio, the results recorded by the banks to which the business has been transferred, are transmitted to savings banks' results, amplifying the figure of aggregate net profit (or loss) of the deposit-taking institutions as a whole. In order to facilitate interpretation of the amount of net profit (column 6), this column includes the quantity of said net profit which is due to impairment losses on investments. Table 4.8
a. See details in Table 4.9. Table 4.9
a. Trading derivatives include the fair value in favor of the institution of derivates which do not form part of hedge accounting. b. Hedging derivatives include the fair value in favor of the institution of derivates designated as hedging instruments in hedge accounting. c. Insurance contracts linked to pensions include the fair value of the insurance policies to cover staff pension commitments that do not meet the requirements established by Rule thirty-five of Banco de España Circular CBE 4/04 for not recording them in the balance sheet. d. Tax assets include the amount of all assets of a tax nature such as taxes paid on account, assets arising from unused tax losses or credits for tax deductions. e. Trading derivatives include the fair value of the institution's liability in respect of derivatives that do not form part of hedge accounting. f. Hedging derivatives include the fair value of the institution's liability in respect of derivatives designated as hedging instruments in hedge accounting. g. Tax collection accounts include the amount collected on behalf of general government in respect of taxes, duties, excise and social security contributions until such monies are finally made over to the relevant agency. h. Tax liabilities include the amount of all liabilities of a tax nature, primarily the amount payable in respect of the tax on the taxable profit for the period. Table 4.10
a. Includes only the amount of the specific allowances for insolvency risk attributable to loans and advances to other resident sectors. Table 4.11
a. The details of each general government subsector can be found in Table 8.25. There are some small differences owing to the fact that the tables use different definitions of lending and they have been updated at different times. See footnote a to Table 4.A. b. The breakdown by province and regional (autonomous) government may be consulted in Tables 4.28 and 4.29. c. The breakdown of the total by instrument appears in Table 4.3. In addition, the breakdown by institutional sector can be consulted in Table 8.26. The small discrepancies between the amounts of this table and those of Table 8.26 are attributable to differences in institutional scope and in the definition of lending and the fact that the tables have been updated at different times. Table 4.99
a. See notes to Table 4.1, column 12. b. Until the entry into force of Circular 4/2004, this amount was included in column 10. c. Until the entry into force of Circular 4/2004, these details were not available for specialised credit institutions. d. See notes to Table 4.1 column 13. e. Assets considered as doubtful, since there is doubt regarding full repayment although they cannot be considered non-performing or written-off assets. f. Assets considered as doubtful because they are vis-à-vis countries in a certain risk group.
BANCO DE ESPAÑA 111 BOLETÍN ESTADÍSTICO, FEBRUARY 2013

BANCO DE ESPAÑA / BOLETÍN ESTADÍSTICO
Table 4.13
a. Of the companies and sole proprietorships that receive the loans. b. See notes to Tables 8.26 and 8.27. c. See details in Table 4.18. d. Includes loans and credits to households for the acquisition of land, the acquisition of securities and the acquisition of current goods and services not considered to be consumer durables (for example, loans to finance travel) and of those for miscellaneous purposes not included in the foregoing. e. This heading refers to lending to households, secured by a residential mortgage, but not for house purchase or for financing productive activities. Accordingly, these loans are included among those granted for renovation, consumer durable purchases and other purposes, i.e. they are part of columns 8 to 10. f. See details in Table 4.18 (columns 12 to 22). g. Includes doubtful loans and credits to households for the acquisition of land, securities and current goods and services that are not considered durables (for instance, loans to finance travel) as well as those for miscellaneous purposes not included among the foregoing. h. Includes doubtful loans to households, secured by a residential mortgage, but not for house purchase or for financing productive activities. Accordingly, these doubtful loans are included among those granted for renovation, consumer durable purchases and other purposes, i.e. they are part of columns 21 to 23.
Table 4.14
a. Of the companies and sole proprietorships that receive the loans. b. See details in Table 4.19. c. Includes loans and credits to households for the acquisition of land, the acquisition of securities and the acquisition of current goods and services not considered to be consumer durables (for example, loans to finance travel) and of those for miscellaneous purposes not included in the foregoing. d. This heading refers to lending to households, secured by a residential mortgage, but not for house purchase or for financing productive activities. Accordingly, these loans are included as follows: 1) a portion in column 2 (financing of productive activity), insofar as this includes loans to non-financial corporations and sole proprietorships, the latter being able to carry out this type of transaction; 2) the rest, and presumably the majority, in columns 8 to 10, which include loans to households for purposes other than house purchase. e. See details in Table 4.19 (columns 12 to 22). f. Includes doubtful loans and credits to households for the acquisition of land, the acquisition of securities and the acquisition of current goods and services not considered to be consumer durables (for instance, loans to finance travel) and of those for miscellaneous purposes not included in the foregoing. g. Includes doubtful loans to households, secured by a residential mortgage, but not for house purchase or for financing productive activities. Accordingly, these loans are included as follows: 1) a portion in column 15 (financing of productive activity), insofar as this includes doubtful loans to non-financial corporations and sole proprietorships, the latter being able to carry out this type of transaction; 2) the rest, and presumably the majority, in columns 21 to 23, which include doubtful loans to households for purposes other than house purchase. Table 4.17
a. Of the companies and sole proprietorships that receive the loans b. See details in Table 4.22. c. Includes loans and credits to households for the acquisition of land, the acquisition of securities and the acquisition of current goods and services not considered to be consumer durables (for example, loans to finance travel) and of those for miscellaneous purposes not included in the foregoing. d. This heading refers to lending to households, secured by a residential mortgage, but not for house purchase or for financing productive activities. Accordingly, these loans are included as follows: 1) a portion in column 2 (financing of productive activity), insofar as this includes loans to non-financial corporations and sole proprietorships, the latter being able to carry out this type of transaction; 2) the rest, and presumably the majority, in columns 8 to 10, which include loans to households for purposes other than house purchase. e. See details in Table 4.22 (columns 12 to 22). f. Includes doubtful loans and credits to households for the acquisition of land, the acquisition of securities and the acquisition of current goods and services not considered to be consumer durables (for instance, loans to finance travel) and of those for miscellaneous purposes not included in the foregoing. g. Includes doubtful loans to households, secured by a residential mortgage, but not for house purchase or for financing productive activities. Accordingly, these loans are included as follows: 1) a portion in column 15 (financing of productive activity), insofar as this includes doubtful loans to non-financial corporations and sole proprietorships, the latter being able to carry out this type of transaction; 2) the rest, and presumably the majority, in columns 21 to 23, which include doubtful loans to households for purposes other than house purchase Table 4.18
a. Of the companies and sole proprietorships that receive the loans. b. See details in Table 4.23.
BANCO DE ESPAÑA 112 BOLETÍN ESTADÍSTICO, FEBRUARY 2013

BANCO DE ESPAÑA / BOLETÍN ESTADÍSTICO
Table 4.19
a. Of the companies and sole proprietorships that receive the loans. b. See details in Table 4.24. Table 4.22
a. Of the companies and sole proprietorships that receive the loans. b. See details in Table 4.27. Table 4.23
a. Of the companies and sole proprietorships that receive the loans. b. Until March 2005 these details were not available for specialised credit institutions. Thereafter, and as a result of the entry into force of Banco de España Circular CBE 4/2004, the amount is assigned to the relevant industry. Table 4.24
a. Of the companies and sole proprietorships that receive the loans.
Table 4.27
a. Of the companies and sole proprietorships that receive the loans. b. Until March 2005 these details were not available for specialised credit institutions. Thereafter, and as a result of the entry into force of Banco de España Circular CBE 4/2004, the amount is assigned to the relevant industry.
Table 4.28
a. Unclassified loans, apart from the residual transactions for which the institution has not been able to determine the province to which they should be assigned, includes the amount of reverse repurchase agreements through counterparties. Unclassified deposits include the residual transactions for which the institution has not been able to determine the province to which they should be assigned. See also footnote e to Table 4.5. b. Available from 2003 Q1. Table 4.29
a. Unclassified loans, apart from the residual transactions for which the institution has not been able to determine the province to which they should be assigned, includes the amount of reverse repurchase agreements through counterparties. Unclassified deposits include the residual transactions for which the institution has not been able to determine the province to which they should be assigned. See also footnote e to Table 4.5. Table 4.30
a. Apart from the residual transactions for which the institution has not been able to determine the regional (autonomous) community to which they should be assigned, it includes the amount of reverse repurchase agreements with counterparties. Table 4.31
a. Includes residual transactions for which the institution has not been able to determine the regional (autonomous) community to which they should be assigned. See footnote e to Table 4.5. Table 4.32
a. See breakdown by subsector in Table 8.25. There are discrepancies between the amounts of these two Tables, owing to differences in the institutional scope, the fact that the tables have been updated at different times, and differences in the accounting for the acquisition of securities of securitisation special purpose entities used to securitise financial assets kept on the institution’s balance sheet (see changes introduced in the Boletín Estadístico of January 2010). b. See breakdown by province and region in Tables 4.28 and 4.29. c. See breakdown by instrument in Table 4.5. Also, the amount of this column less MMF deposits at credit institutions is the same, apart from some small differences owing to the fact that the tables have been updated at different times, as that of column 1 of Table 8.28. The breakdown by institutional sector may be consulted in this latter Table.
Table 4.36
a. See details in Table 4.37. b. See details in Table 4.38. c. See details in column 8 of Table 4.39 and in Table 4.40. Table 4.37
a. See details in Table 4.39.
Table 4.38
a. See details in Table 4.39.
BANCO DE ESPAÑA 113 BOLETÍN ESTADÍSTICO, FEBRUARY 2013

BANCO DE ESPAÑA / BOLETÍN ESTADÍSTICO
Table 4.39
a. It should be taken into account that while gains and losses on the equity portfolio are included in this table, they are not included in financial revenue. b. Since 1996 this interest has been included in interest from debt securities held to maturity. Table 4.45
a. It includes credit institutions whose scope of operations is restricted and which, under Royal Decree 692/96 of 26 April 1996, became specialised credit institutions. The specialised lending institutions in place at the time of this change were: finance companies, mortgage lending companies and financial leasing companies. Money Market Intermediaries disappeared in 1994, becoming broker-dealers or agency brokers, following their regulation under the Spanish Stock Market Act24/88 of 24 July 1988. b. See footnote a to Table 4.A. Table 4.46
a. It includes specialised lending institutions which, under Royal Decree 692/96 of 26 April 1996, became specialised credit institutions. The specialised lending institutions in place at the time of this change were: finance companies, mortgage lending companies and financial leasing companies. Money Market Intermediaries disappeared in 1994, becoming broker-dealers or agency brokers, following their regulation under the Spanish Stock Market Act 24/88 of 24 July 1988. Table 4.47
a. See details in Tables 4.48 and 4.49. Table 4.51
a. See breakdown by instrument in Table 4.53. b. See details in Table 4.54. c. See details in Table 4.56. d. Includes non-performing doubtful loans which are those in respect of which some amount of principal, interest or any other contractually agreed expense is more than three months past-due or exceeds 25% of total debt (unless these loans are specifically classified as written-off assets). Table 4.52
a. See breakdown by instrument in Table 4.55. b. See details in Table 4.57. c. See details in Table 4.58. Table 4.53
See notes to Table 4.3.
Table 4.54
See notes to Table 4.4.
Table 4.55
See notes to Table 4.5.
Table 4.57
See notes to Table 4.7.
Table 4.81
a. See breakdown by instrument in Table 4.83. b. See details in Table 4.84. c. Includes non-performing doubtful loans which are those in respect of which some amount of principal, interest or any other contractually agreed expense is more than three months past-due or exceeds 25% of total debt (unless these loans are specifically classified as written-off assets). Table 4.82
a. See details in Table 4.85.b. See details in Table 4.86. Table 4.83
a. Up to May 05, this column includes doubtful assets for all sectors (and not only for other resident sectors).
Table 4.85
See notes to Table 4.7.
BANCO DE ESPAÑA 114 BOLETÍN ESTADÍSTICO, FEBRUARY 2013

CHAPTER 5 FINANCIAL INSTITUTIONS

BALANCE SHEET
in FASE (=I-I.1+I.2)
By instrument
By counterpart sector (2)
By instrument
By counterpart sector
By instrument
By counterpart sector
5. INSTITUCIONES FINANCIERAS 5A. Activo A) Conciliación entre el balance financiero de las CFEE y el balance según los estados de la zona del euro (caso de IFM) y los balances oficiales (IFnM)
Datos referidos a Septiembre de 2008 Millones de euros Instituciones Empresas de
Instituciones Instituciones financieras no seguros y financieras/ financieras monetarias ex- fondos de
Financial monetarias/ cepto E. de se- pensiones/ institutions Monetary guros y F.P./ Insurance
financial Non-monetary corporations institutions financial insti- and pension
tutions except funds insurance corpo rations and pen- sion funds
A=B+C+D B C D (cuadro 6.A) (cuadro 9.A) (cuadro 10.A)
I. TOTAL ACTIVO BALANCE UEM/OFICIAL . . . 4 511 485 3 350 442 821 082 339 961 I. TOTAL ASSETS EMU’s/OFFICIAL’s
I.1 ACTIVOS no incluidos en CFEE . . . . . . 52 779 37 752 6 633 8 394 I.1 ASSETS not included in FASE
Activo fijo . . . . . . . . . . . . . . . . . . 49 342 34 315 6 633 8 394 Fixed assets Otros . . . . . . . . . . . . . . . . . . . . 3 437 3 437 - - Other
I.2 AJUSTES (1) . . . . . . . . . . . . . . . 109 266 60 140 25 827 23 299 I.2 ADJUSTMENTS (1)
II. ACTIVOS FINANCIEROS incluidos . . . . . 4 567 972 3 372 830 840 276 354 866 I.OUTSTANDING FINANCIAL ASSETS included en CFEE (=I-I.1+I.2)
AF. 1 ORO MONETARIO Y D.E.G. . . . . . . . 5 836 5 836 - - AF.1 MONETARY GOLD AND SDRs
Por instrumentos Oro monetario . . . . . . . . . . . . . . . . 5 678 5 678 - - Monetary gold Derechos Especiales de Giro . . . . . . . . . 158 158 - - Special Drawing Rights
Por sectores de contrapartida (2)
AF. 2 EFECTIVO Y DEPÓSITOS . . . . . . . . 1 208 671 569 855 572 475 66 340 AF.2 CURRENCY AND DEPOSITS
Por instrumentos Efectivo . . . . . . . . . . . . . . . . . . . 7 460 7 460 - 0 Currency Depósitos transferibles . . . . . . . . . . . . 43 408 - 31 364 12 045 Transferable deposits Otros depósitos . . . . . . . . . . . . . . . 1 157 802 562 395 541 112 54 296 Other deposits
Por sectores de contrapartida Instituciones financieras. . . . . . . . . . . . . 960 621 336 408 572 354 51 859 Financial institutions
Instituciones financieras monetarias . . . . . . . 958 813 335 819 572 354 50 641 Monetary financial institutions
Instituciones financieras no monetarias . . . . . . 1 807 589 - 1 218 Non-monetary financial institutions
Resto del mundo . . . . . . . . . . . . . . . . 248 050 233 447 122 14 482 Rest of the world
AF.3 VALORES DISTINTOS DE ACCIONES . . . 841 209 527 605 115 979 197 625 AF.3 SECURITIES OTHER THAN SHARES
Por instrumentos Valores a corto plazo . . . . . . . . . . . . . 85 152 36 661 25 377 23 115 Short-term securities Valores a largo plazo . . . . . . . . . . . . . 733 310 470 076 88 724 174 510 Long-term securities Derivados . . . . . . . . . . . . . . . . . . 22 748 20 868 1 879 ... Financial derivatives
Por sectores de contrapartida Sociedades no financieras . . . . . . . . . . . . 14 970 8 788 3 408 2 775 Non-financial corporations
Instituciones financieras. . . . . . . . . . . . . 343 387 259 555 38 350 45 482 Financial institutions
Instituciones financieras monetarias . . . . . . . 125 880 60 408 29 282 36 190 Monetary financial institutions
Instituciones financieras no monetarias . . . . . . 217 507 199 147 9 068 9 292 Non-monetary financial institutions
Administraciones Públicas . . . . . . . . . . . . 140 568 86 017 17 836 36 715 General government
Resto del mundo . . . . . . . . . . . . . . . . 342 285 173 245 56 386 112 654 Rest of the world
September 2008 data EUR millions
5A. Assets 5. FINANCIAL INSTITUTIONSA) Reconciliation between the FASE financial balance sheet and the balance
sheet of euro area returns (MFIs) and the accounting balance sheets (non-MFIs)
BANCO DE ESPAÑA 116 BOLETÍN ESTADÍSTICO, FEBRUARY 2013

I. OUTSTANDING FINANCIAL ASSETS included in FASE (cont.)
By instrument
By counterpart sector
By instrument
By counterpart sector
By instrument
By counterpart sector
AF.79 Other accounts receivable
5. INSTITUCIONES FINANCIERAS 5A. Activo (continuación) A) Conciliación entre el balance financiero de las CFEE y el balance según los estados de la zona del euro (caso de IFM) y los balances oficiales (IFnM)
Datos referidos a Septiembre de 2008 Millones de euros Instituciones Empresas de
Instituciones Instituciones financieras no seguros y financieras/ financieras monetarias ex- fondos de
Financial monetarias/ cepto E. de se- pensiones/ institutions Monetary guros y F.P./ Insurance
financial Non-monetary corporations institutions financial insti- and pension
tutions except funds insurance corpo rations and pen- sion funds
A=B+C+D B C D (cuadro 6.A) (cuadro 9.A) (cuadro 10.A)
I. ACTIVOS FINANCIEROS incluidos en CFEE (continuación)
AF.4 PRÉSTAMOS . . . . . . . . . . . . . . 2 014 867 1 953 306 58 540 3 021 AF.4 LOANS
Por instrumentos Préstamos a corto plazo. . . . . . . . . . . . 313 446 310 316 2 801 330 Short-term loans Préstamos a largo plazo. . . . . . . . . . . . 1 701 421 1 642 990 55 739 2 691 Long-term loans
Por sectores de contrapartida Sociedades no financieras . . . . . . . . . . . . 971 818 944 827 25 346 1 645 Non-financial corporations
Instituciones financieras. . . . . . . . . . . . . 26 909 25 293 1 486 130 Financial institutions
Instituciones financieras monetarias . . . . . . . 23 - 23 - Monetary financial institutions
Instituciones financieras no monetarias . . . . . . 26 886 25 293 1 462 130 Non-monetary financial institutions
Administraciones Públicas . . . . . . . . . . . . 46 249 45 016 1 233 - General goverment
Hogares e instituciones sin fines de lucro . . . . . . 907 714 875 993 30 476 1 245 Households and non-profit institutions
Resto del mundo . . . . . . . . . . . . . . . . 62 177 62 177 - - Rest of the world
AF.5 ACCIONES Y PARTICIPACIONES . . . . . 417 533 283 017 80 943 53 573 AF.5 SHARES AND OTHER EQUITY
Por instrumentos Acciones cotizadas . . . . . . . . . . . . . . 133 812 68 722 34 465 30 624 Quoted shares Acciones no cotizadas . . . . . . . . . . . . 229 311 195 796 25 691 7 824 Unquoted shares Otras participaciones . . . . . . . . . . . . . 10 498 3 498 7 000 - Other equity Participaciones en fondos de inversión . . . . . 43 914 15 001 13 787 15 125 Mutual funds shares
Por sectores de contrapartida Sociedades no financieras . . . . . . . . . . . . 179 323 145 825 27 081 6 418 Non-financial corporations
Instituciones financieras. . . . . . . . . . . . . 106 732 51 106 30 476 25 150 Financial institutions
Instituciones financieras monetarias . . . . . . . 41 318 25 994 9 413 5 911 Monetary financial institutions
Instituciones financieras no monetarias . . . . . . 65 413 25 112 21 063 19 238 Non-monetary financial institutions
Resto del mundo . . . . . . . . . . . . . . . . 131 479 86 087 23 386 22 006 Rest of the world
AF.6 RESERVAS TÉCNICAS DE SEGUROS . . 15 303 - - 15 303 AF.6 INSURANCE TECHNICAL RESERVES
Por instrumentos Reservas para primas y siniestros . . . . . . . 15 303 - - 15 303 Prepayment of premiums & res. for outs. claims
Por sectores de contrapartida Instituciones financieras. . . . . . . . . . . . . 10 048 - - 10 048 Financial institutions
Instituciones financieras monetarias . . . . . . . - - - - Monetary financial institutions
Instituciones financieras no monetarias . . . . . . 10 048 - - 10 048 Non-monetary financial institutions
Resto del mundo . . . . . . . . . . . . . . . . 5 255 - - 5 255 Rest of the world
AF.7 OTRAS CUENTAS PENDIENTES COBRO . 64 552 33 211 12 338 19 004 AF.7 OTHER ACCOUNTS RECEIVABLE
AF.71 Crédito comercial. . . . . . . . . . . . - - - - AF.71 Trade credit AF.79 Otras ctas ptes de cobro excluido el crédito comercial . . . . . . . . . . . . 64 552 33 211 12 338 19 004 excluding trade credits
September 2008 data EUR millions
5A. Assets (cont.) 5. FINANCIAL INSTITUTIONSA) Reconciliation between the FASE financial balance sheet and the balance
sheet of euro area returns (MFIs) and the accounting balance sheets (non-MFIs)
BANCO DE ESPAÑA 117 BOLETÍN ESTADÍSTICO, FEBRUARY 2013

BALANCE SHEET
in FASE (=I-I.1+I.2)
By instrument
By counterpart sector
By instrument
By counterpart sector
___________________________________________________________________________________________________________________________
Véanse notas al final del capítulo./ See notes at the end of the chapter.
5. INSTITUCIONES FINANCIERAS 5B. Pasivo B) Conciliación entre el balance financiero de las CFEE y el balance según los estados de la zona del euro (caso de IFM) y los balances oficiales (IFnM)
Datos referidos a Septiembre de 2008 Millones de euros Instituciones Empresas de
Instituciones Instituciones financieras no seguros y financieras/ financieras monetarias ex- fondos de
Financial monetarias/ cepto E. de se- pensiones/ institutions Monetary guros y F.P./ Insurance
financial Non-monetary corporations institutions financial insti- and pension
tutions except funds insurance corpo rations and pen- sion funds
A=B+C+D B C D (cuadro 6.B) (cuadro 9.B) (cuadro 10.B)
I. TOTAL PASIVO BALANCE UEM/OFICIAL . . . 4 511 485 3 350 442 821 082 339 961 I. TOTAL LIABILITIES EMU’s/OFFICIAL’s
I.1 PASIVOS no incluidos en CFEE . . . . . . 10 123 3 437 6 686 - I.1 LIABILITIES not included in FASE
I.2 AJUSTES (1) . . . . . . . . . . . . . . . -66 878 -58 023 6 741 -15 597 I.2 ADJUSTMENTS (1)
II. PASIVOS FINANCIEROS incluidos . . . . . 4 434 484 3 288 982 821 138 324 365 I.OUTSTANDING LIABILITIES included en CFEE (=I-I.1+I.2)
AF. 2 EFECTIVO Y DEPÓSITOS . . . . . . . . 2 539 766 2 535 558 2 166 2 042 AF.2 CURRENCY AND DEPOSITS
Por instrumentos Efectivo . . . . . . . . . . . . . . . . . . . 76 308 76 308 - - Currency Depósitos transferibles . . . . . . . . . . . . 497 156 497 156 - - Transferable deposits Otros depósitos . . . . . . . . . . . . . . . 1 966 303 1 962 095 2 166 2 042 Other deposits
Por sectores de contrapartida Sociedades no financieras . . . . . . . . . . . . 223 035 221 458 1 577 - Non-financial corporations
Instituciones financieras. . . . . . . . . . . . . 960 621 958 813 589 1 218 Financial institutions
Instituciones financieras monetarias . . . . . . . 336 408 335 819 589 - Monetary financial institutions
Instituciones financieras no monetarias . . . . . . 624 212 622 994 - 1 218 Non-monetary financial institutions
Administraciones Públicas . . . . . . . . . . . . 97 258 97 258 - - General government
Hogares e instituciones sin fines de lucro . . . . . . 720 908 720 908 - - Households and non-profit institutions
Resto del mundo . . . . . . . . . . . . . . . . 537 946 537 122 - 824 Rest of the world
AF.3 VALORES DISTINTOS DE ACCIONES . . . 1 015 361 461 140 553 880 341 AF.3 SECURITIES OTHER THAN SHARES
Por instrumentos Valores a corto plazo . . . . . . . . . . . . . 103 583 86 143 17 440 - Short-term securities Valores a largo plazo . . . . . . . . . . . . . 885 463 348 682 536 439 341 Long-term securities Derivados . . . . . . . . . . . . . . . . . . 26 315 26 315 - - Financial derivatives
Por sectores de contrapartida Sociedades no financieras . . . . . . . . . . . . 12 647 15 299 -2 993 341 Non-financial corporations
Instituciones financieras. . . . . . . . . . . . . 343 387 125 880 217 507 - Financial institutions
Instituciones financieras monetarias . . . . . . . 259 555 60 408 199 147 - Monetary financial institutions
Instituciones financieras no monetarias . . . . . . 83 832 65 472 18 360 - Non-monetary financial institutions
Administraciones públicas . . . . . . . . . . . . 763 763 - - General government
Hogares e instituciones sin fines de lucro . . . . . . 25 389 20 428 4 961 - Households and non-profit institutions
Resto del mundo . . . . . . . . . . . . . . . . 633 175 298 771 334 404 - Rest of the world
September 2008 data EUR millions
5B. Liabilities 5. FINANCIAL INSTITUTIONSB) Reconciliation between the FASE financial balance sheet and the balance
sheet of euro area returns (MFIs) and the accounting balance sheets (non-MFIs)
BANCO DE ESPAÑA 118 BOLETÍN ESTADÍSTICO, FEBRUARY 2013

II. OUTSTANDING LIABILITIES included in FASE (cont.)
By instrument
By counterpart sector
By instrument
By counterpart sector
By instrument
By counterpart sector
AF.79 Others accounts payable,
Memorandum item:
(FASE financial assets minus liabilities)
___________________________________________________________________________________________________________________________
5. INSTITUCIONES FINANCIERAS 5B. Pasivo (continuación) B) Conciliación entre el balance financiero de las CFEE y el balance según los estados de la zona del euro (caso de IFM) y los balances oficiales (IFnM)
Datos referidos a Septiembre de 2008 Millones de euros Instituciones Empresas de
Instituciones Instituciones financieras no seguros y financieras/ financieras monetarias ex- fondos de
Financial monetarias/ cepto E. de se- pensiones/ institutions Monetary guros y F.P./ Insurance
financial Non-monetary corporations institutions financial insti- and pension
tutions except funds insurance corpo rations and pen- sion funds
A=B+C+D B C D (cuadro 6.B) (cuadro 9.B) (cuadro 10.B)
II. PASIVOS incluidos en CFEE (continuación)
AF.4 PRÉSTAMOS . . . . . . . . . . . . . . 31 557 1 766 22 009 7 782 AF.4 LOANS
Por instrumentos Préstamos a corto plazo. . . . . . . . . . . . 14 336 - 7 693 6 643 Short-term loans Préstamos a largo plazo. . . . . . . . . . . . 17 220 1 766 14 315 1 139 Long-term loans
Por sectores de contrapartida Sociedades no financieras . . . . . . . . . . . . 1 823 1 743 80 - Non-financial corporations
Instituciones financieras. . . . . . . . . . . . . 26 909 23 19 104 7 782 Financial institutions
Instituciones financieras monetarias . . . . . . . 25 293 - 17 815 7 478 Monetary financial institutions
Instituciones financieras no monetarias . . . . . . 1 616 23 1 290 303 Non-monetary financial institutions
Administraciones Públicas . . . . . . . . . . . . 0 0 - - General government
Hogares e instituciones sin fines de lucro . . . . . . - - - - Households and non-profit institutions
Resto del mundo . . . . . . . . . . . . . . . . 2 824 - 2 824 - Rest of the world
AF. 5 ACCIONES Y PARTICIPACIONES . . . . 495 612 239 128 236 033 20 451 AF.5 SHARES AND OTHER EQUITY
Por instrumentos Acciones cotizadas . . . . . . . . . . . . . . 156 379 144 875 11 504 - Quoted shares Acciones no cotizadas . . . . . . . . . . . . 71 267 38 770 12 045 20 451 Unquoted shares Otras participaciones . . . . . . . . . . . . . 24 555 24 555 - - Other equity Participaciones en fondos de inversión . . . . . 243 411 30 927 212 484 - Mutual funds shares
Por sectores de contrapartida Sociedades no financieras . . . . . . . . . . . . 60 536 24 549 33 639 2 348 Non-financial corporations
Instituciones financieras. . . . . . . . . . . . . 106 732 41 318 52 535 12 878 Financial institutions
Instituciones financieras monetarias . . . . . . . 51 106 25 994 22 249 2 863 Monetary financial institutions
Instituciones financieras no monetarias . . . . . . 55 626 15 324 30 286 10 015 Non-monetary financial institutions
Administraciones Públicas . . . . . . . . . . . . 21 541 15 660 5 881 - General goverment
Hogares e instituciones sin fines de lucro . . . . . . 213 949 75 325 138 036 588 Households and non-profit institutions
Resto del mundo . . . . . . . . . . . . . . . . 92 854 82 276 5 942 4 636 Rest of the world
AF.6 RESERVAS TÉCNICAS DE SEGUROS . . 293 511 7 989 - 285 522 AF.6 INSURANCE TECHNICAL RESERVES
Por instrumentos Reservas de seguro de vida . . . . . . . . . . 120 812 - - 120 812 Life insurance reserves Reservas para fondos de pensiones . . . . . . 107 110 7 989 - 99 121 Pension fund reserves held by Reservas para primas y siniestros . . . . . . . 65 589 - - 65 589 Prepay. of premiums & res. for outs. claims
Por sectores de contrapartida Sociedades no financieras . . . . . . . . . . . . 26 065 - - 26 065 Non-financial corporations
Instituciones financieras. . . . . . . . . . . . . 10 048 - - 10 048 Financial institutions
Instituciones financieras monetarias . . . . . . . - - - - Monetary financial institutions
Instituciones financieras no monetarias . . . . . . 10 048 - - 10 048 Non-monetary financial institutions
Hogares e instituciones sin fines de lucro . . . . . . 257 398 7 989 - 249 409 Households and non-profit institutions
Resto del mundo . . . . . . . . . . . . . . . . - - - - Rest of the world
AF.7 OTRAS CUENTAS PENDIENTES COBRO . 58 678 43 400 7 050 8 227 AF.7 OTHER ACCOUNTS PAYABLE
AF.71 Crédito comercial. . . . . . . . . . . . - - - - AF.71 Trade credit AF.79 Otros ctas ptes de cobro excluido el crédito comercial . . . . . . . . . . . . 58 678 43 400 7 050 8 227 excluding trade credit
Pro memoria:
Activos financieros netos . . . . . . . . . . 133 488 83 848 19 138 30 502 Net financial assets (Activos financieros menos pasivos de las CFEE)
September 2008 data EUR millions
5B. Liabilities (cont.) 5. FINANCIAL INSTITUTIONSB) Reconciliation between the FASE financial balance sheet and the balance
sheet of euro area returns (MFIs) and the accounting balance sheets (non-MFIs)
BANCO DE ESPAÑA 119 BOLETÍN ESTADÍSTICO, FEBRUARY 2013

1=2+10 2=3+4 3 4=5+9 5=6+7+8 6 7 8 9 10
5. FINANCIAL INSTITUTIONS 5.1 Financial assets = Liabilities plus net financial assetsB) Aggregated balance sheet Absolute values
EUR billions M F Is Non-mo-
Financial netary institu- financial tions O M F I s institu- Total BE tions Credit institutions Money Total Market Funds Total Total SCI OCI (MMF) deposit- taking institu- tions
03 2 182.8 1 657.9 105.7 1 552.2 1 494.0 1 426.8 36.5 27.0 58.2 524.9 04 2 527.1 1 880.5 109.5 1 770.9 1 712.8 1 634.9 42.3 25.9 58.2 646.6 05 3 129.2 2 309.9 123.9 2 186.0 2 131.0 2 042.4 51.9 27.4 55.0 819.2 06 3 686.6 2 646.6 136.9 2 509.7 2 509.6 2 404.9 60.7 33.3 0.1 1 040.0 07 4 348.6 3 151.2 174.0 2 977.2 2 977.2 2 862.8 65.3 40.0 - 1 197.5
04 Q4 2 527.1 1 880.5 109.5 1 770.9 1 712.8 1 634.9 42.3 25.9 58.2 646.6
05 Q1 2 652.6 1 968.0 118.9 1 849.1 1 794.9 1 715.3 42.8 26.2 54.2 684.6 Q2 2 866.1 2 124.5 122.8 2 001.7 1 946.9 1 862.6 47.1 27.4 54.8 741.6 Q3 2 935.6 2 162.9 117.5 2 045.4 1 990.2 1 905.9 48.2 26.8 55.2 772.7 Q4 3 129.2 2 309.9 123.9 2 186.0 2 131.0 2 042.4 51.9 27.4 55.0 819.2
06 Q1 3 253.9 2 365.9 126.2 2 239.8 2 205.3 2 112.5 52.1 30.5 34.5 888.0 Q2 3 372.2 2 451.0 132.3 2 318.8 2 283.6 2 185.7 55.0 32.3 35.2 921.2 Q3 3 507.4 2 543.0 125.5 2 417.5 2 390.8 2 289.1 57.4 33.8 26.7 964.3 Q4 3 686.6 2 646.6 136.9 2 509.7 2 509.6 2 404.9 60.7 33.3 0.1 1 040.0
07 Q1 3 842.0 2 736.2 135.7 2 600.5 2 600.5 2 492.8 60.8 35.6 - 1 105.8 Q2 4 032.2 2 878.9 150.3 2 728.5 2 728.5 2 620.3 56.6 41.6 - 1 153.4 Q3 4 124.9 2 963.7 142.3 2 821.5 2 821.5 2 709.5 58.6 43.6 - 1 161.2 Q4 4 348.6 3 151.2 174.0 2 977.2 2 977.2 2 862.8 65.3 40.0 - 1 197.5
08 Q1 4 321.2 3 172.8 138.4 3 034.3 2 995.9 2 883.7 64.7 43.1 38.4 1 148.5 Q2 4 474.3 3 297.8 150.2 3 147.6 3 112.8 2 997.6 67.3 45.2 34.8 1 176.4 Q3 4 527.2 3 361.0 174.6 3 186.4 3 155.4 3 035.9 67.4 49.0 31.1 1 166.2
14=13= 15=16+23 16=17a22 17 18 19 20 21 22 23=24a26 24 25 26 27
5. FINANCIAL INSTITUTIONS 5.1 (cont.) Financial assets = Liabilities plus net financial assetsB) Aggregated balance sheet Absolute values
EUR billions
Non-mone- Non-monetary financial institutions except insurance corporations and pension funds Insuran- tary FI ce cor- pora- Other financial intermediaries Financial auxiliarees tion and Total pension funds Total Portfo- Securi- Asset Real es Prefere Rest Total Deposit Securi- Rest lio in- ties securi- tate in share guaran- ties vest.ins dealer tisa- vest- issuing tee agen- titut company tion ment special fund cies exc. MMF funds instit. porpose
=15+27 vehicle
03 524.9 284.8 274.3 174.6 10.3 85.8 0.8 1.6 1.2 10.5 4.8 0.5 5.2 240.1 04 646.6 376.7 365.2 202.5 9.7 131.3 1.6 18.4 1.7 11.5 5.5 0.6 5.4 269.9 05 819.2 515.1 503.2 237.1 12.2 183.9 2.5 65.7 1.8 11.9 5.6 0.8 5.6 304.2 06 1 040.0 715.8 701.6 302.6 16.2 254.4 2.8 123.5 2.0 14.3 6.1 0.9 7.3 324.1 07 1 197.5 871.8 849.8 289.8 21.8 368.9 1.7 166.6 6.5 16.4 7.1 1.2 8.1 331.2
04 Q4 646.6 376.7 365.2 202.5 9.7 131.3 1.6 18.4 1.7 11.5 5.5 0.6 5.4 269.9
05 Q1 684.6 406.9 395.6 213.4 12.4 139.3 2.1 26.8 1.7 11.3 5.3 0.6 5.3 277.7 Q2 741.6 460.1 448.7 222.7 15.0 160.1 2.2 46.9 1.8 11.4 5.3 0.7 5.4 281.5 Q3 772.7 480.1 468.6 233.3 13.0 160.0 2.5 58.0 1.8 11.6 5.4 0.8 5.4 292.5 Q4 819.2 515.1 503.2 237.1 12.2 183.9 2.5 65.7 1.8 11.9 5.6 0.8 5.6 304.2
06 Q1 888.0 580.0 567.5 267.3 12.9 192.7 2.6 90.0 1.9 12.5 5.8 1.0 5.7 308.0 Q2 921.2 610.5 598.1 263.8 12.0 211.2 2.4 106.7 1.9 12.5 5.8 0.9 5.7 310.7 Q3 964.3 643.9 631.2 274.7 16.1 218.5 2.6 117.4 1.9 12.7 6.0 1.0 5.8 320.4 Q4 1 040.0 715.8 701.6 302.6 16.2 254.4 2.8 123.5 2.0 14.3 6.1 0.9 7.3 324.1
07 Q1 1 105.8 773.0 758.1 305.4 14.8 285.3 2.8 143.8 5.6 15.3 6.5 1.1 7.7 332.4 Q2 1 153.4 819.1 802.0 312.3 18.0 314.6 2.5 149.7 5.6 16.2 6.6 1.2 8.5 335.1 Q3 1 161.2 824.8 804.3 305.5 19.5 323.4 2.3 151.1 6.4 16.7 6.8 1.2 8.7 340.2 Q4 1 197.5 871.8 849.8 289.8 21.8 368.9 1.7 166.6 6.5 16.4 7.1 1.2 8.1 331.2
08 Q1 1 148.5 819.0 802.0 232.7 20.2 384.1 1.3 158.8 6.5 16.8 7.2 0.3 8.1 329.7 Q2 1 176.4 846.9 825.4 214.3 20.5 414.1 1.1 173.4 6.5 18.1 7.2 0.3 9.5 333.0 Q3 1 166.2 839.8 814.7 195.9 16.8 420.3 0.9 181.8 6.6 18.5 7.5 0.3 9.6 333.1
BANCO DE ESPAÑA 120 BOLETÍN ESTADÍSTICO, FEBRUARY 2013

28=27=29+ 29 30=31+32 31 32 33 34
5. FINANCIAL INSTITUTIONS 5.1 (cont.) Financial assets = Liabilities plus net financial assetsB) Aggregated balance sheet Absolute values
EUR billions
Insurance Private Non-profit insurance entities Insurance External corporations insurance Compensation pension and pension corporations Consortium funds
funds Total DGSFP Reg. Gvt. (Law 8/87) supervision supervision
+30+33+34
03 240.1 157.9 18.9 6.7 12.2 4.6 58.7 04 269.9 176.9 21.3 7.3 14.0 5.4 67.8 05 304.2 196.4 24.5 8.5 16.0 6.1 80.9 06 324.1 208.9 26.9 9.3 17.6 6.7 88.5 07 331.2 210.1 28.3 9.7 18.6 7.2 91.5
04 Q4 269.9 176.9 21.3 7.3 14.0 5.4 67.8
05 Q1 277.7 ... ... ... ... ... ... Q2 281.5 ... ... ... ... ... ... Q3 292.5 ... ... ... ... ... ... Q4 304.2 196.4 24.5 8.5 16.0 6.1 80.9
06 Q1 308.0 ... ... ... ... ... ... Q2 310.7 ... ... ... ... ... ... Q3 320.4 ... ... ... ... ... ... Q4 324.1 208.9 26.9 9.3 17.6 6.7 88.5
07 Q1 332.4 ... ... ... ... ... ... Q2 335.1 ... ... ... ... ... ... Q3 340.2 ... ... ... ... ... ... Q4 331.2 210.1 28.3 9.7 18.6 7.2 91.5
08 Q1 329.7 ... ... ... ... ... ... Q2 333.0 ... ... ... ... ... ... Q3 333.1 ... ... ... ... ... ...
1=2+10 2=3+4 3 4=5+9 5=6+7+8 6 7 8 9 10
5. FINANCIAL INSTITUTIONS 5.2 Financial assets = Liabilities plus net financial assetsB) Aggregated balance sheet Structures
Percentage M F Is Non-mo-
Financial netary Institu- financial tions O M F I s institu- Total BE tions Credit institutions Money Total Market Funds Total Total SCI OCI (MMF) deposit- taking institu- tions
03 100.00 75.95 4.84 71.11 68.45 65.37 1.67 1.24 2.67 24.05 04 100.00 74.37 4.33 70.04 67.74 64.66 1.67 1.02 2.30 25.63 05 100.00 73.73 3.96 69.77 68.02 65.19 1.66 0.88 1.75 26.27 06 100.00 71.66 3.71 67.95 67.95 65.11 1.64 0.90 0.00 28.34 07 100.00 72.31 3.99 68.33 68.33 65.57 1.50 0.92 - 27.69
04 Q4 100.00 74.37 4.33 70.04 67.74 64.66 1.67 1.02 2.30 25.63
05 Q1 100.00 74.13 4.48 69.65 67.61 64.62 1.61 0.99 2.04 25.87 Q2 100.00 74.06 4.28 69.78 67.87 64.92 1.64 0.95 1.91 25.94 Q3 100.00 73.59 4.00 69.59 67.71 64.84 1.64 0.91 1.88 26.41 Q4 100.00 73.73 3.96 69.77 68.02 65.19 1.66 0.88 1.75 26.27
06 Q1 100.00 72.62 3.87 68.74 67.69 64.84 1.60 0.94 1.06 27.38 Q2 100.00 72.57 3.92 68.65 67.61 64.71 1.63 0.96 1.04 27.43 Q3 100.00 72.38 3.57 68.81 68.05 65.15 1.63 0.96 0.76 27.62 Q4 100.00 71.66 3.71 67.95 67.95 65.11 1.64 0.90 0.00 28.34
07 Q1 100.00 71.13 3.53 67.60 67.60 64.78 1.58 0.92 - 28.87 Q2 100.00 71.29 3.72 67.57 67.57 64.82 1.40 1.03 - 28.71 Q3 100.00 71.68 3.44 68.24 68.24 65.45 1.41 1.05 - 28.32 Q4 100.00 72.31 3.99 68.33 68.33 65.57 1.50 0.92 - 27.69
08 Q1 100.00 73.26 3.19 70.07 69.19 66.43 1.49 0.99 0.88 26.74 Q2 100.00 73.52 3.34 70.18 69.41 66.63 1.49 1.00 0.77 26.48 Q3 100.00 74.05 3.83 70.21 69.53 66.68 1.48 1.08 0.68 25.95
BANCO DE ESPAÑA 121 BOLETÍN ESTADÍSTICO, FEBRUARY 2013

14=13= 15=16+23 16=17a22 17 18 19 20 21 22 23=24a26 24 25 26 27
5. FINANCIAL INSTITUTIONS 5.2 (cont.) Financial assets = Liabilities plus net financial assetsB) Aggregated balance sheet Structures
Percentage
Non-mone- Non-monetary financial institutions except insurance corporations and pension funds Insuran- tary FI ce cor- pora- Other financial intermediaries Financial auxiliarees tion and Total pension funds Total Portfo- Securi- Asset Real es Prefere Rest Total Deposit Securi- Rest lio in- ties securi- tate in share guaran- ties vest.ins dealer tisa- vest- issuing tee agen- titut company tion ment special fund cies exc. MMF funds instit. porpose
=15+27 vehicle
03 24.05 13.05 12.57 8.00 0.47 3.93 0.04 0.07 0.06 0.48 0.22 0.02 0.24 11.00 04 25.63 14.90 14.44 8.01 0.38 5.19 0.06 0.73 0.07 0.46 0.22 0.03 0.21 10.73 05 26.27 16.44 16.06 7.57 0.39 5.87 0.08 2.10 0.06 0.38 0.18 0.03 0.18 9.83 06 28.34 19.38 18.99 8.19 0.44 6.89 0.08 3.35 0.05 0.39 0.16 0.03 0.20 8.96 07 27.69 19.97 19.59 6.64 0.50 8.45 0.04 3.82 0.15 0.38 0.16 0.03 0.19 7.72
04 Q4 25.63 14.90 14.44 8.01 0.38 5.19 0.06 0.73 0.07 0.46 0.22 0.03 0.21 10.73
05 Q1 25.87 15.33 14.90 8.04 0.47 5.25 0.08 1.01 0.06 0.42 0.20 0.02 0.20 10.54 Q2 25.94 16.04 15.64 7.76 0.52 5.58 0.08 1.64 0.06 0.40 0.19 0.02 0.19 9.91 Q3 26.41 16.34 15.94 7.94 0.44 5.44 0.08 1.97 0.06 0.39 0.18 0.03 0.18 10.08 Q4 26.27 16.44 16.06 7.57 0.39 5.87 0.08 2.10 0.06 0.38 0.18 0.03 0.18 9.83
06 Q1 27.38 17.80 17.42 8.21 0.40 5.92 0.08 2.76 0.06 0.38 0.18 0.03 0.18 9.58 Q2 27.43 18.08 17.71 7.81 0.36 6.25 0.07 3.16 0.06 0.37 0.17 0.03 0.17 9.36 Q3 27.62 18.33 17.97 7.82 0.46 6.22 0.07 3.34 0.05 0.36 0.17 0.03 0.16 9.29 Q4 28.34 19.38 18.99 8.19 0.44 6.89 0.08 3.35 0.05 0.39 0.16 0.03 0.20 8.96
07 Q1 28.87 20.09 19.69 7.94 0.38 7.41 0.07 3.74 0.14 0.40 0.17 0.03 0.20 8.79 Q2 28.71 20.26 19.86 7.72 0.45 7.78 0.06 3.70 0.14 0.40 0.16 0.03 0.21 8.45 Q3 28.32 19.92 19.52 7.38 0.47 7.81 0.05 3.65 0.15 0.40 0.16 0.03 0.21 8.40 Q4 27.69 19.97 19.59 6.64 0.50 8.45 0.04 3.82 0.15 0.38 0.16 0.03 0.19 7.72
08 Q1 26.74 18.86 18.51 5.36 0.46 8.85 0.03 3.66 0.15 0.36 0.17 0.01 0.19 7.87 Q2 26.48 18.82 18.45 4.76 0.46 9.20 0.03 3.85 0.15 0.38 0.16 0.01 0.21 7.66 Q3 25.95 18.45 18.06 4.30 0.37 9.23 0.02 3.99 0.14 0.38 0.17 0.01 0.21 7.51
28=27=28+ 29 30=31+32 31 32 33 34
5. FINANCIAL INSTITUTIONS 5.2 (cont.) Financial assets = Liabilities plus net financial assetsB) Aggregated balance sheet Structures
Percentage
Insurance Private Non-profit insurance entities Insurance External corporations insurance Compensation pension and pension corporations Consortium funds
funds Total DGSFP Reg. Gvt. (Law 8/87) supervision supervision
+30+33+34
03 11.00 7.23 0.86 0.31 0.56 0.21 2.69 04 10.73 7.00 0.84 0.29 0.55 0.21 2.68 05 9.83 6.27 0.78 0.27 0.51 0.20 2.58 06 8.96 5.66 0.73 0.25 0.48 0.18 2.40 07 7.72 4.81 0.65 0.22 0.43 0.17 2.10
04 Q4 10.73 7.00 0.84 0.29 0.55 0.21 2.68
05 Q1 10.54 ... ... ... ... ... ... Q2 9.91 ... ... ... ... ... ... Q3 10.08 ... ... ... ... ... ... Q4 9.83 6.27 0.78 0.27 0.51 0.20 2.58
06 Q1 9.58 ... ... ... ... ... ... Q2 9.36 ... ... ... ... ... ... Q3 9.29 ... ... ... ... ... ... Q4 8.96 5.66 0.73 0.25 0.48 0.18 2.40
07 Q1 8.79 ... ... ... ... ... ... Q2 8.45 ... ... ... ... ... ... Q3 8.40 ... ... ... ... ... ... Q4 7.72 4.81 0.65 0.22 0.43 0.17 2.10
08 Q1 7.87 ... ... ... ... ... ... Q2 7.66 ... ... ... ... ... ... Q3 7.51 ... ... ... ... ... ...
BANCO DE ESPAÑA 122 BOLETÍN ESTADÍSTICO, FEBRUARY 2013

CHAPTER 6 MONETARY FINANCIAL INSTITUTIONS

in FASE (=I-I.1+I.2)
By instrument
By counterpart sector (c)
By instrument
By counterpart sector
By instrument
By counterpart sector
___________________________________________________________________________________________________________________________
Véanse notas al final del capítulo./ See notes at the end of the chapter.
6. INSTITUCIONES FINANCIERAS MONETARIAS 6A. Activo A) Conciliación entre el balance financiero de las CFEE y el balance de los estados UEM
Datos referidos a Septiembre de 2012 Millones de euros Otras
Instituciones Banco instituciones financieras de financieras monetarias/ España/ monetarias/ Monetary National Other mone- financial Central tary finan- institutions Bank cial insti-
tutions A=B+C B C
(Cuadro 7.A) (Cuadro 8.A)
I. TOTAL ACTIVO BALANCE UEM . . . . . . . . . . . 4 181 366 544 461 3 636 905 I. TOTAL ASSETS EMU’s BALANCE SHEET
I.1 ACTIVOS no incluidos en CFEE . . . . . . . . . . 65 508 3 956 61 552 I.1 ASSETS not included in FASE
Activo fijo . . . . . . . . . . . . . . . . . . . . . . 61 818 266 61 552 Fixed assets Moneda en circulación (a) . . . . . . . . . . . . . . . 3 690 3 690 - Coins in circulation (a)
I.2 AJUSTES (b) . . . . . . . . . . . . . . . . . . . -82 564 -25 -82 539 I.2 ADJUSTMENTS (b)
II. ACTIVOS FINANCIEROS incluidos . . . . . . . . . 4 033 294 540 480 3 492 814 I.OUTSTANDING FINANCIAL ASSETS included en CFEE (=I-I.1+I.2)
AF. 1 ORO MONETARIO Y D.E.G. . . . . . . . . . . . 15 665 15 665 - AF.1 MONETARY GOLD AND SDRs
Por instrumentos Oro monetario . . . . . . . . . . . . . . . . . . . . 12 471 12 471 - Monetary gold Derechos Especiales de Giro . . . . . . . . . . . . . 3 195 3 195 - Special Drawings Rights
Por sectores de contrapartida (c)
AF. 2 EFECTIVO Y DEPÓSITOS . . . . . . . . . . . . 831 081 395 586 435 495 AF.2 CURRENCY AND DEPOSITS
Por instrumentos Efectivo . . . . . . . . . . . . . . . . . . . . . . . 6 606 0 6 606 Currency Otros depósitos . . . . . . . . . . . . . . . . . . . 824 475 395 586 428 889 Other deposits
Por sectores de contrapartida Instituciones financieras. . . . . . . . . . . . . . . . . 655 978 387 676 268 302 Financial institutions
Instituciones financieras monetarias . . . . . . . . . . . 655 978 387 676 268 302 Monetary financial institutions
Instituciones financieras no monetarias . . . . . . . . . . ... - ... Non-monetary financial institutions
Resto del mundo . . . . . . . . . . . . . . . . . . . . 175 103 7 910 167 193 Rest of the world
AF.3 VALORES DISTINTOS DE ACCIONES . . . . . . . 942 771 121 102 821 669 AF.3 SECURITIES OTHER THAN SHARES
Por instrumentos Valores a corto plazo . . . . . . . . . . . . . . . . . 52 300 222 52 078 Short-term securities Valores a largo plazo . . . . . . . . . . . . . . . . . 859 334 120 888 738 447 Long-term securities Derivados . . . . . . . . . . . . . . . . . . . . . . 31 137 -8 31 145 Financial derivatives
Por sectores de contrapartida Sociedades no financieras . . . . . . . . . . . . . . . . 15 992 - 15 992 Non-financial corporations
Instituciones financieras. . . . . . . . . . . . . . . . . 519 603 23 545 496 058 Financial institutions
Instituciones financieras monetarias . . . . . . . . . . . 296 584 18 206 278 378 Monetary financial institutions
Instituciones financieras no monetarias . . . . . . . . . . 223 018 5 339 217 679 Non-monetary financial institutions
Administraciones Públicas . . . . . . . . . . . . . . . . 263 814 30 887 232 927 General government
Resto del mundo . . . . . . . . . . . . . . . . . . . . 143 363 66 671 76 693 Rest of the world
September 2012 data EUR millions
6A. Assets 6. MONETARY FINANCIAL INSTITUTIONSA) Reconciliation between FASE’s financial balance sheet and EMU’s balance sheet
BANCO DE ESPAÑA 124 BOLETÍN ESTADÍSTICO, FEBRUARY 2013

I. OUTSTANDING FINANCIAL ASSETS included in FASE (cont.)
By instrument
By counterpart sector
By instrument
By counterpart sector
___________________________________________________________________________________________________________________________
Véanse notas al final del capítulo./ See notes at the end of the chapter.
6. INSTITUCIONES FINANCIERAS MONETARIAS 6A. Activo (continuación) A) Conciliación entre el balance financiero de las CFEE y el balance de los estados UEM
Datos referidos a Septiembre de 2012 Millones de euros Otras
Instituciones Banco instituciones financieras de financieras monetarias/ España/ monetarias/ Monetary National Other mone- financial Central tary finan- institutions Bank cial insti-
tutions A=B+C B C
(Cuadro 7.A) (Cuadro 8.A)
I. ACTIVOS FINANCIEROS incluidos en CFEE (continuación)
AF.4 PRÉSTAMOS . . . . . . . . . . . . . . . . . . . 1 906 655 3 101 1 903 554 AF.4 LOANS
Por instrumentos Préstamos a corto plazo. . . . . . . . . . . . . . . . . 228 402 - 228 402 Short-term loans Préstamos a largo plazo. . . . . . . . . . . . . . . . . 1 678 253 3 101 1 675 152 Long-term loans
Por sectores de contrapartida Sociedades no financieras . . . . . . . . . . . . . . . . . 791 308 - 791 308 Non-financial corporations
Instituciones financieras. . . . . . . . . . . . . . . . . . 98 978 - 98 978 Financial institutions
Instituciones financieras monetarias . . . . . . . . . . . . - - - Monetary financial institutions
Instituciones financieras no monetarias . . . . . . . . . . . 98 978 - 98 978 Non-monetary financial institutions
Administraciones Públicas . . . . . . . . . . . . . . . . . 119 555 2 915 116 640 General government
Hogares e instituciones sin fines de lucro . . . . . . . . . . . 829 366 186 829 181 Households and non-profit institutions
Resto del mundo . . . . . . . . . . . . . . . . . . . . . 67 448 - 67 448 Rest of the world
AF.5 ACCIONES Y PARTICIPACIONES . . . . . . . . . . 275 181 965 274 216 AF.5 SHARES AND OTHER EQUITY
Por instrumentos Acciones cotizadas . . . . . . . . . . . . . . . . . . . 42 016 - 42 016 Quoted shares Acciones no cotizadas . . . . . . . . . . . . . . . . . 222 853 - 222 853 Unquoted shares Otras participaciones . . . . . . . . . . . . . . . . . . 8 126 965 7 161 Other equity Participaciones en fondos de inversión . . . . . . . . . . 2 186 - 2 186 Mutual funds shares
Por sectores de contrapartida Sociedades no financieras . . . . . . . . . . . . . . . . . 107 589 - 107 589 Non-financial corporations
Instituciones financieras. . . . . . . . . . . . . . . . . . 61 224 - 61 224 Financial institutions
Instituciones financieras monetarias . . . . . . . . . . . . 48 998 - 48 998 Monetary financial institutions
Instituciones financieras no monetarias . . . . . . . . . . . 12 226 - 12 226 Non-monetary financial institutions
Resto del mundo . . . . . . . . . . . . . . . . . . . . . 106 368 965 105 402 Rest of the world
AF.7 OTRAS CUENTAS PENDIENTES DE COBRO . . . . 61 940 4 061 57 880 AF.7 OTHER ACCOUNTS RECEIVABLE
AF.71 Crédito comercial. . . . . . . . . . . . . . . . . - - - AF.71 Trade credit AF.79 Otras ctas ptes de cobro excl. el cdto comercial . . . 61 940 4 061 57 880 AF.79 Other accounts receivable excluding trade credits
September 2012 data EUR millions
6A. Assets (cont.) 6. MONETARY FINANCIAL INSTITUTIONSA) Reconciliation between FASE’s financial balance sheet and EMU’s balance sheet
BANCO DE ESPAÑA 125 BOLETÍN ESTADÍSTICO, FEBRUARY 2013

in FASE (=I-I.1+I.2)
By instrument
By counterpart sector
By instrument
By counterpart sector
___________________________________________________________________________________________________________________________
Véanse notas al final del capítulo./ See notes at the end of the chapter.
6. INSTITUCIONES FINANCIERAS MONETARIAS 6B. Pasivo B) Conciliación entre el balance financiero de las CFEE y el balance de los estados UEM
Datos referidos a Septiembre de 2012 Millones de euros Otras
Instituciones Banco instituciones financieras de financieras monetarias/ España/ monetarias/ Monetary National Other monetary financial Central financial ins- institutions Bank titutions
A=B+C B C (Cuadro 7.B) (Cuadro 8.B)
I. TOTAL PASIVO BALANCE UEM . . . . . . . . . . 4 181 369 544 461 3 636 909 I. TOTAL LIABILITIES EMU’s BALANCE SHEET
I.1 PASIVOS no incluidos en CFEE . . . . . . . . . 3 690 3 690 - I.1 LIABILITIES not included in FASE Moneda en circulación (a) . . . . . . . . . . . . . . 3 690 3 690 - Coins in circulation (a)
I.2 AJUSTES (b) . . . . . . . . . . . . . . . . . . -260 550 -8 -260 542 I.2 ADJUSTMENTS (b)
II. PASIVOS FINANCIEROS incluidos . . . . . . . . 3 917 130 540 763 3 376 367 I.OUTSTANDING LIABILITIES included en CFEE (=I-I.1+I.2)
AF. 2 EFECTIVO Y DEPÓSITOS . . . . . . . . . . . 3 017 017 511 315 2 505 701 AF.2 CURRENCY AND DEPOSITS
Por instrumentos Efectivo . . . . . . . . . . . . . . . . . . . . . . 97 447 97 447 - Currency Depósitos transferibles . . . . . . . . . . . . . . . 517 804 3 883 513 920 Transferable deposits Otros depósitos . . . . . . . . . . . . . . . . . . 2 401 766 409 985 1 991 781 Other deposits
Por sectores de contrapartida Sociedades no financieras . . . . . . . . . . . . . . . 188 324 7 931 180 393 Non-financial corporations
Instituciones financieras. . . . . . . . . . . . . . . . 1 216 143 45 970 1 170 173 Financial institutions
Instituciones financieras monetarias . . . . . . . . . . 655 978 45 062 610 916 Monetary financial institutions
Instituciones financieras no monetarias . . . . . . . . . 560 164 907 559 257 Non-monetary financial institutions
Administraciones Públicas . . . . . . . . . . . . . . . 81 981 2 922 79 058 General government
Hogares e instituciones sin fines de lucro . . . . . . . . . 790 800 83 136 707 664 Households and non-profit institutions
Resto del mundo . . . . . . . . . . . . . . . . . . . 739 770 371 356 368 414 Rest of the world
AF.3 VALORES DISTINTOS DE ACCIONES . . . . . . 624 084 - 624 084 AF.3 SECURITIES OTHER THAN SHARES
Por instrumentos Valores a corto plazo . . . . . . . . . . . . . . . . 45 754 - 45 754 Short-term securities Valores a largo plazo . . . . . . . . . . . . . . . . 550 221 - 550 221 Long-term securities Derivados . . . . . . . . . . . . . . . . . . . . . 28 109 - 28 109 Financial derivatives
Por sectores de contrapartida Sociedades no financieras . . . . . . . . . . . . . . . 40 206 - 40 206 Non-financial corporations
Instituciones financieras. . . . . . . . . . . . . . . . 354 176 - 354 176 Financial institutions
Instituciones financieras monetarias . . . . . . . . . . 296 584 - 296 584 Monetary financial institutions
Instituciones financieras no monetarias . . . . . . . . . 57 592 - 57 592 Non-monetary financial institutions
Administraciones Públicas . . . . . . . . . . . . . . . 5 780 - 5 780 General government
Hogares e instituciones sin fines de lucro . . . . . . . . . 40 196 - 40 196 Households and non-profit institutions
Resto del mundo . . . . . . . . . . . . . . . . . . . 183 726 - 183 726 Rest of the world
September 2012 data EUR millions
6B. Liabilities 6. MONETARY FINANCIAL INSTITUTIONSB) Reconciliation between FASE’s financial balance sheet and EMU’s balance sheet
BANCO DE ESPAÑA 126 BOLETÍN ESTADÍSTICO, FEBRUARY 2013

II. OUTSTANDING LIABILITIES included in FASE (cont.)
By instrument
By counterpart sector
By instrument
By counterpart sector
By instrument
By counterpart sector
Memorandum item:
(FASE’s financial assets minus liabilities)
___________________________________________________________________________________________________________________________
Véanse notas al final del capítulo./ See notes at the end of the chapter.
6. INSTITUCIONES FINANCIERAS MONETARIAS 6B. Pasivo (continuación) B) Conciliación entre el balance financiero de las CFEE y el balance de los estados UEM
Datos referidos a Septiembre de 2012 Millones de euros Otras
Instituciones Banco instituciones financieras de financieras monetarias/ España/ monetarias/ Monetary National Other monetary financial Central financial ins- institutions Bank titutions
A=B+C B C (Cuadro 7.B) (Cuadro 8.B)
II. PASIVOS incluidos en CFEE (continuación)
AF.4 PRÉSTAMOS . . . . . . . . . . . . . . . . . . . 2 058 - 2 058 AF.4 LOANS
Por instrumentos Préstamos a corto plazo. . . . . . . . . . . . . . . . . - - - Short-term loans Préstamos a largo plazo. . . . . . . . . . . . . . . . . 2 058 - 2 058 Long-term loans
Por sectores de contrapartida Sociedades no financieras . . . . . . . . . . . . . . . . . 327 - 327 Non-financial corporations
Instituciones financieras. . . . . . . . . . . . . . . . . . - - - Financial institutions
Instituciones financieras monetarias . . . . . . . . . . . . - - - Monetary financial institutions
Instituciones financieras no monetarias . . . . . . . . . . . - - - Non-monetary financial institutions
Administraciones Públicas . . . . . . . . . . . . . . . . . 1 731 - 1 731 General government
Hogares e instituciones sin fines de lucro . . . . . . . . . . . - - - Households and non-profit institutions
Resto del mundo . . . . . . . . . . . . . . . . . . . . . - - - Rest of the world
AF. 5 ACCIONES Y PARTICIPACIONES . . . . . . . . . 227 353 28 826 198 527 AF.5 SHARES AND OTHER EQUITY
Por instrumentos Acciones cotizadas . . . . . . . . . . . . . . . . . . . 119 494 - 119 494 Quoted shares Acciones no cotizadas . . . . . . . . . . . . . . . . . 57 514 - 57 514 Unquoted shares Otras participaciones . . . . . . . . . . . . . . . . . . 41 676 28 826 12 850 Other equity Participaciones en fondos de inversión . . . . . . . . . . 8 668 - 8 668 Mutual funds shares
Por sectores de contrapartida Sociedades no financieras . . . . . . . . . . . . . . . . . 16 140 - 16 140 Non-financial corporations
Instituciones financieras. . . . . . . . . . . . . . . . . . 55 170 - 55 170 Financial institutions
Instituciones financieras monetarias . . . . . . . . . . . . 48 998 - 48 998 Monetary financial institutions
Instituciones financieras no monetarias . . . . . . . . . . . 6 172 - 6 172 Non-monetary financial institutions
Administraciones Públicas . . . . . . . . . . . . . . . . . 32 574 28 826 3 748 General government
Hogares e instituciones sin fines de lucro . . . . . . . . . . . 53 358 - 53 358 Households and non-profit institutions
Resto del mundo . . . . . . . . . . . . . . . . . . . . . 70 110 - 70 110 Rest of the world
AF.6 RESERVAS TÉCNICAS DE SEGUROS . . . . . . . 5 723 - 5 723 AF.6 INSURANCE TECHNICAL RESERVES
Por instrumentos Reservas para fondos de pensiones . . . . . . . . . . . 5 723 - 5 723 Pension fund reserves held by
Por sectores de contrapartida Hogares e instituciones sin fines de lucro . . . . . . . . . . . 5 723 - 5 723 Households and non-profit institutions
AF.7 OTRAS CUENTAS PENDIENTES DE COBRO . . . . 40 896 622 40 274 AF.7 OTHER ACCOUNTS PAYABLE
AF.71 Crédito comercial. . . . . . . . . . . . . . . . . - - - AF.71 Trade credit AF.79 Otros ctas ptes de cobro excl. el cdto comercial . . . 40 896 622 40 274 AF.79 Others accounts payable, excluding trade credit
Pro memoria:
Activos financieros netos . . . . . . . . . . . . . . . 116 164 -283 116 447 Net financial assets (Activos financieros menos pasivos de las CFEE)
September 2012 data EUR millions
6B. Liabilities (cont.) 6. MONETARY FINANCIAL INSTITUTIONSB) Reconciliation between FASE’s financial balance sheet and EMU’s balance sheet
BANCO DE ESPAÑA 127 BOLETÍN ESTADÍSTICO, FEBRUARY 2013

ASSETS
___________________________________________________________________________________________________________________________
6. INSTITUCIONES FINANCIERAS MONETARIAS 6.C Balance. Detalle por instituciones B) Balance según los estados de la zona del euro
Datos referidos a Enero de 2013 Millones de euros
Serie en Instituciones Otras insti- cuadro y financieras Banco de tuciones fi- columna/ monetarias/ España nancieras mo- Time se- Monetary netarias/ ries in financial Other mone-
table and institutions tary financial column institutions
(Capítulo 7/ (Capítulo 8/ Chapter 7) Chapter 8) A=B+C B C
ACTIVO
1 A. RESIDENTES EN ESPAÑA . . . . . . . . . . 6.3/1 3 058 652 354 873 2 703 779 1 A. DOMESTIC
2 2. Préstamos y créditos . . . . . . . . . . . . 6.3/2 2 263 347 299 865 1 963 482 2 2. Loans 3 2e. Del cual: euros . . . . . . . . . . . . . . 6.3/3 2 243 714 297 356 1 946 358 3 2e. Of which: euro 4 IFM . . . . . . . . . . . . . . . . . . . . . 6.3/4 548 631 296 763 251 868 4 MFIs
5 2e. Del cual: euros . . . . . . . . . . . . . . 6.3/5 543 866 294 254 249 612 5 2e. Of which: euro 6 Administraciones Públicas . . . . . . . . . . . . 6.3/6 116 586 2 915 113 671 6 General government
7 2e. Del cual: euros . . . . . . . . . . . . . . 6.3/7 116 586 2 915 113 671 7 2e. Of which: euro 8 Otros residentes . . . . . . . . . . . . . . . . 6.3/8 1 598 130 187 1 597 943 8 Other residents
9 2e. Del cual: euros . . . . . . . . . . . . . . 6.3/9 1 583 262 187 1 583 075 9 2e. Of which: euro
10 3. Valores distintos de acciones y participa- ciones . . . . . . . . . . . . . . . . . . . 6.3/10 625 146 54 987 570 159 10 3. Securities other than shares 11 3e. Del cual: euros . . . . . . . . . . . . . . 6.3/11 620 469 54 987 565 482 11 3e. Of which: euro 12 IFM . . . . . . . . . . . . . . . . . . . . . 6.4/3 97 190 18 765 78 425 12 MFIs
13 3e. Euros . . . . . . . . . . . . . . . . . . 6.4/4 96 830 18 765 78 065 13 3e. Euro 14 Del cual: hasta dos años . . . . . . . . . . - 18 069 - 18 069 14 Of which: up to 2 years 15 3x. Monedas distintas del euro. . . . . . . . . - 360 - 360 15 3x. Other currencies 16 Del cual: hasta dos años . . . . . . . . . . - - - - 16 Of which: up to 2 years 17 Administraciones Públicas . . . . . . . . . . . . 6.4/6 280 447 30 237 250 210 17 General government
18 3e. Del cual: euros . . . . . . . . . . . . . . 6.4/7 280 381 30 237 250 144 18 3e. Of which: euro 19 Otros residentes . . . . . . . . . . . . . . . . 6.4/8 247 509 5 985 241 525 19 Other residents
20 3e. Del cual: euros . . . . . . . . . . . . . . 6.4/9 243 257 5 985 237 273 20 3e. Of which: euro
21 4. Participaciones en FMM . . . . . . . . . . 6.3/12 8 - 8 21 4. Money market fund shares/units 22 IFM . . . . . . . . . . . . . . . . . . . . . - 8 - 8 22 MFIs
23 4e. Del cual: euros . . . . . . . . . . . . . . - 8 - 8 23 4e. Of which: euro
24 5. Acciones y participaciones . . . . . . . . . 6.3/13 170 151 21 170 130 24 5. Shares and other equity 25 IFM . . . . . . . . . . . . . . . . . . . . . - 56 620 - 56 620 25 MFIs
26 Otros residentes . . . . . . . . . . . . . . . . - 113 531 21 113 511 26 Other residents
27 B. RESIDENTES EN OTROS PAISES DE LA ZONA DEL EURO . . . . . . . . . . . . . . 6.5/1 224 157 46 756 177 400 27 B. OTHER EURO AREA COUNTRIES
28 2. Préstamos y créditos . . . . . . . . . . . . 6.5/2 92 291 4 785 87 506 28 2. Loans 29 2e. Del cual: euros . . . . . . . . . . . . . . 6.5/3 85 154 4 785 80 369 29 2e. Of which: euro 30 IFM . . . . . . . . . . . . . . . . . . . . . 6.5/4 61 802 4 785 57 017 30 MFIs
31 2e. Del cual: euros . . . . . . . . . . . . . . 6.5/5 58 420 4 785 53 635 31 2e. Of which: euro 32 Administraciones Públicas . . . . . . . . . . . . 6.5/6 28 - 28 32 General government
33 2e. Del cual: euros . . . . . . . . . . . . . . 6.5/7 28 - 28 33 2e. Of which: euro 34 Otros residentes . . . . . . . . . . . . . . . . 6.5/8 30 460 - 30 460 34 Other residents
35 2e. Del cual: euros . . . . . . . . . . . . . . 6.5/9 26 706 - 26 706 35 2e. Of which: euro
36 3. Valores distintos de acciones y participa- ciones . . . . . . . . . . . . . . . . . . . 6.5/10 107 971 40 893 67 078 36 3. Securities other than shares 37 3e. Del cual: euros . . . . . . . . . . . . . . 6.5/11 106 296 40 893 65 404 37 3e. Of which: euro 38 IFM . . . . . . . . . . . . . . . . . . . . . 6.6/3 5 620 775 4 845 38 MFIs
39 3e. Euros . . . . . . . . . . . . . . . . . . 6.6/4 5 462 775 4 687 39 3e. Euro 40 Del cual: hasta dos años . . . . . . . . . . - 746 - 746 40 Of which: up to 2 years 41 3x. Monedas distintas del euro. . . . . . . . . - 158 - 158 41 3x. Other currencies 42 Del cual: hasta dos años . . . . . . . . . . - 84 - 84 42 Of which: up to 2 years 43 Administraciones Públicas . . . . . . . . . . . . 6.6/6 53 792 40 118 13 674 43 General government
44 3e. Del cual: euros . . . . . . . . . . . . . . 6.6/7 53 686 40 118 13 568 44 3e. Of which: euro 45 Otros residentes . . . . . . . . . . . . . . . . 6.6/8 48 559 - 48 559 45 Other residents
46 3e. Del cual: euros . . . . . . . . . . . . . . 6.6/9 47 148 - 47 148 46 3e. Of which: euro
January 2013 data EUR millions
6.C Balance sheet by institutional grouping 6. MONETARY FINANCIAL INSTITUTIONS B) Balance sheet according to the euro area returns
BANCO DE ESPAÑA 128 BOLETÍN ESTADÍSTICO, FEBRUARY 2013

ASSETS (continued)
B. OTHER EURO AREA COUNTRIES (continued)
___________________________________________________________________________________________________________________________
6. INSTITUCIONES FINANCIERAS MONETARIAS 6.C Balance. Detalle por instituciones B) Balance según los estados de la zona del euro
Datos referidos a Enero de 2013 Millones de euros
Serie en Instituciones Otras insti- cuadro y financieras Banco de tuciones fi- columna/ monetarias/ España nancieras mo- Time se- Monetary netarias/ ries in financial Other mone-
table and institutions tary financial column institutions
(Capítulo 7/ (Capítulo 8/ Chapter 7) Chapter 8) A=B+C B C
ACTIVO (continuación)
B. RESIDENTES EN OTROS PAÍSES DE LA ZONA DEL EURO(continuación)
47 4. Participaciones en FMM . . . . . . . . . . 6.5/12 - - - 47 4. Money market fund shares/units 48 IFM . . . . . . . . . . . . . . . . . . . . . - - - - 48 MFIs
49 5. Acciones y participaciones . . . . . . . . . 6.5/14 23 895 1 079 22 817 49 5. Shares and other equity 50 IFM . . . . . . . . . . . . . . . . . . . . . - 6 691 1 079 5 612 50 MFIs
51 Otros residentes . . . . . . . . . . . . . . . . - 17 204 - 17 204 51 Other residents
52 C. RESTO DEL MUNDO . . . . . . . . . . . . 6.1/4 254 753 21 748 233 005 52 C. REST OF THE WORLD
53 2. Préstamos y créditos . . . . . . . . . . . . 6.11/3 147 804 119 147 685 53 2. Loans 54 2e. Del cual: euros . . . . . . . . . . . . . . 6.11/4 112 040 - 112 040 54 2e. Of which: euro
55 3. Valores distintos de acciones y participa- ciones . . . . . . . . . . . . . . . . . . . 6.11/5 39 930 21 604 18 327 55 3. Securities other than shares 56 3e. Del cual: euros . . . . . . . . . . . . . . 6.11/6 ... 813 ... 56 3e. Of which: euro
57 5. Acciones y participaciones . . . . . . . . . 6.11/7 67 019 25 66 994 57 5. Shares and other equity 58 5e. Del cual: euros . . . . . . . . . . . . . . - ... - ... 58 5e. Of which: euro
59 D. SIN CLASIFICAR . . . . . . . . . . . . . . 6.1/5 456 159 60 112 396 047 59 D. UNCLASSIFIED
60 1. Efectivo (todas las monedas) . . . . . . . . 6.1/10 6 559 0 6 558 60 1. Cash (all currencies) 61 1e. Del cual: euros . . . . . . . . . . . . . . - 6 406 - 6 406 61 1e. Of which: euro
62 6. Activo fijo . . . . . . . . . . . . . . . . . 6.1/11 53 594 262 53 332 62 6. Fixed assets
63 7. Otros activos . . . . . . . . . . . . . . . 6.1/12 396 007 59 850 336 157 63 7. Remaining assets 64 7e. Del cual: euros . . . . . . . . . . . . . . - ... ... ... 64 7e. Of which: euro
65 TOTAL ACTIVO. . . . . . . . . . . . . . . . 6.1/1 3 993 721 483 488 3 510 232 65 TOTAL ASSETS
66 e Euros . . . . . . . . . . . . . . . . . . . 6.1/13 ... 400 195 ... 66 e Euro 67 x Monedas distintas del euro . . . . . . . . . 6.1/14 ... 40 376 ... 67 x Other currencies 68 s/c Sin clasificar . . . . . . . . . . . . . . . 6.1/15 432 406 42 917 389 489 68 n/c Unclassified
January 2013 data EUR millions
6.C Balance sheet by institutional grouping 6. MONETARY FINANCIAL INSTITUTIONS B) Balance sheet according to the euro area returns
BANCO DE ESPAÑA 129 BOLETÍN ESTADÍSTICO, FEBRUARY 2013

LIABILITIES
___________________________________________________________________________________________________________________________
6. INSTITUCIONES FINANCIERAS MONETARIAS 6.C Balance. Detalle por instituciones B) Balance según los estados de la zona del euro
Datos referidos a Enero de 2013 Millones de euros
Serie en Instituciones Otras insti- cuadro y financieras Banco de tuciones fi- columna/ monetarias/ España nancieras mo- Time se- Monetary netarias/ ries in financial Other mone-
table and institutions tary financial column institutions
(Capítulo 7/ (Capítulo 8/ Chapter 7) Chapter 8) A=B+C B C
PASIVO
1 A. RESIDENTES EN ESPAÑA . . . . . . . . . . 6.2/2 2 096 985 45 718 2 051 267 1 A. DOMESTIC
2 9. Depósitos. . . . . . . . . . . . . . . . . . 6.7/1 2 090 001 45 718 2 044 283 2 9. Deposits 3 9e. Del cual: euros . . . . . . . . . . . . . . 6.7/2 2 057 039 45 717 2 011 322 3 9e. Of which: euro 4 IFM . . . . . . . . . . . . . . . . . . . . . 6.7/3 552 446 34 141 518 304 4 MFIs
5 9e. Del cual: euros . . . . . . . . . . . . . . 6.7/4 548 538 34 141 514 397 5 9e. Of which: euro
6 Administración Central . . . . . . . . . . . . . 6.7/5 44 529 4 293 40 236 6 Central government
7 9e. Del cual: euros . . . . . . . . . . . . . . - 44 505 4 293 40 212 7 9e. Of which: euro
8 Otras Administraciones Públicas . . . . . . . . . . 6.7/6 33 672 5 241 28 432 8 Other general government
9 9e. Depósitos en euros . . . . . . . . . . . . 6.7/9 33 672 5 241 28 431 9 9e. Deposits in euro 10 9.1e. A la vista . . . . . . . . . . . . . . - 27 837 5 241 22 596 10 9.1e. Overnight 11 9.2e. A plazo . . . . . . . . . . . . . . . - 5 492 - 5 492 11 9.2e. With agreed maturity 12 Del cual: hasta dos años . . . . . . . . - 5 176 - 5 176 12 Of which: up to two years 13 9.3e. Con preaviso. . . . . . . . . . . . . - - - - 13 9.3e. Redeemable at notice 14 9.4e. Cesiones temporales . . . . . . . . . - 342 - 342 14 9.4e. Repos 15 9x. Depósitos en monedas distintas del euro . . - 1 - 1 15 9x. Deposits in other currencies 16 9.1x. A la vista . . . . . . . . . . . . . . - 1 - 1 16 9.1x. Overnight 17 9.2x. A plazo . . . . . . . . . . . . . . . - - - - 17 9.2x. With agreed maturity 18 Del cual: hasta dos años . . . . . . . . - - - - 18 Of which: up to two years 19 9.3x. Con preaviso . . . . . . . . . . . . . - - - - 19 9.3x. Redeemable at notice 20 9.4x. Cesiones temporales . . . . . . . . . - - - - 20 9.4x. Repos
21 Otros residentes . . . . . . . . . . . . . . . . 6.7/7 1 459 390 2 043 1 457 346 21 Other residents
22 9e. Depósitos en euros . . . . . . . . . . . . 6.8/2 1 430 325 2 042 1 428 282 22 9e. Deposits in euro 23 9.1e. A la vista . . . . . . . . . . . . . . 6.8/3 459 270 2 042 457 228 23 9.1e. Overnight 24 9.2e. A plazo . . . . . . . . . . . . . . . 6.8/4 914 500 - 914 500 24 9.2e. With agreed maturity 25 Del cual: hasta dos años . . . . . . . . 6.8/5 463 481 - 463 481 25 Of which: up to two years 26 9.3e. Con preaviso. . . . . . . . . . . . . 6.8/6 42 - 42 26 9.3e. Redeemable at notice 27 9.4e. Cesiones temporales . . . . . . . . . 6.8/7 56 512 - 56 512 27 9.4e. Repos 28 9x. Depósitos en monedas distintas del euro . . 6.8/8 29 029 1 29 028 28 9x. Deposits in other currencies 29 9.1x. A la vista . . . . . . . . . . . . . . 6.8/9 5 741 1 5 741 29 9.1x. Overnight 30 9.2x. A plazo . . . . . . . . . . . . . . . 6.8/10 23 287 - 23 287 30 9.2x. With agreed maturity 31 Del cual: hasta dos años . . . . . . . . 6.8/11 6 994 - 6 994 31 Of which: up to two years 32 9.3x. Con preaviso . . . . . . . . . . . . . 6.8/12 - - - 32 9.3x. Redeemable at notice 33 9.4x. Cesiones temporales . . . . . . . . . 6.8/13 - - - 33 9.4x. Repos
34 10. Participaciones de los fondos del merca- do monetario . . . . . . . . . . . . . . . . - 6 984 - 6 984 34 10. Money market fund shares/units
35 B. RESIDENTES EN OTROS PAÍSES DE LA ZONA DEL EURO . . . . . . . . . . . . . . 6.2/3 481 522 309 414 172 108 35 B. OTHER EURO AREA COUNTRIES
36 9. Depósitos . . . . . . . . . . . . . . . . . 6.9/1 481 480 309 414 172 066 36 9. Deposits 37 9e. Del cual: euros . . . . . . . . . . . . . . 6.9/2 469 356 309 414 159 942 37 9e. Of which: euro 38 IFM . . . . . . . . . . . . . . . . . . . . . 6.9/3 446 318 309 414 136 904 38 MFIs
39 9e. Del cual: euros . . . . . . . . . . . . . . 6.9/4 436 739 309 414 127 325 39 9e. Of which: euro
40 Administración Central . . . . . . . . . . . . . 6.9/5 1 062 - 1 062 40 Central government
41 9e. Del cual: euros . . . . . . . . . . . . . . - 1 062 - 1 062 41 9e. Of which: euro
42 Otras Administraciones Públicas . . . . . . . . . 6.9/6 0 - 0 42 Other general government
43 9e. Depósitos en euros . . . . . . . . . . . . 6.9/9 0 - 0 43 9e. Deposits in euro 44 9.1e. A la vista . . . . . . . . . . . . . . - 0 - 0 44 9.1e. Overnight 45 9.2e. A plazo . . . . . . . . . . . . . . . - - - - 45 9.2e. With agreed maturity 46 Del cual: hasta dos años . . . . . . . . - - - - 46 Of which: up to two years 47 9.3e. Con preaviso. . . . . . . . . . . . . - - - - 47 9.3e. Redeemable at notice 48 9.4e. Cesiones temporales . . . . . . . . . - - - - 48 9.4e. Repos 49 9x. Depósitos en monedas distintas del euro . . - - - - 49 9x. Deposits in other currencies 50 9.1x. A la vista . . . . . . . . . . . . . . - - - - 50 9.1x. Overnight 51 9.2x. A plazo . . . . . . . . . . . . . . . - - - - 51 9.2x. With agreed maturity 52 Del cual: hasta dos años . . . . . . . . - - - - 52 Of which: up to two years 53 9.3x. Con preaviso . . . . . . . . . . . . . - - - - 53 9.3x. Redeemable at notice 54 9.4x. Cesiones temporales . . . . . . . . . - - - - 54 9.4x. Repos
January 2013 data EUR millions
6.C Balance sheet by institutional grouping 6. MONETARY FINANCIAL INSTITUTIONS B) Balance sheet according to the euro area returns
BANCO DE ESPAÑA 130 BOLETÍN ESTADÍSTICO, FEBRUARY 2013

LIABILITIES (continued)
B. OTHER EURO AREA COUNTRIES (continued)
9. Deposits (continued)
72 Overnight, up to 2 years
76 Overnight, up to 2 years
___________________________________________________________________________________________________________________________
6. INSTITUCIONES FINANCIERAS MONETARIAS 6.C Balance. Detalle por instituciones B) Balance según los estados de la zona del euro
Datos referidos a Enero de 2013 Millones de euros
Serie en Instituciones Otras insti- cuadro y financieras Banco de tuciones fi- columna/ monetarias/ España nancieras mo- Time se- Monetary netarias/ ries in financial Other mone-
table and institutions tary financial column institutions
(Capítulo 7/ (Capítulo 8/ Chapter 7) Chapter 8) A=B+C B C
PASIVO (continuación)
B. RESIDENTES EN OTROS PAÍSES DE LA ZONA DEL EURO (continuación)
9. Depósitos (continuación)
55 Otros residentes . . . . . . . . . . . . . . . . 6.10/1 34 100 - 34 100 55 Other residents
56 9e. Depósitos en euros . . . . . . . . . . . . 6.10/2 31 554 - 31 554 56 9e. Deposits in euro 57 9.1e. A la vista . . . . . . . . . . . . . . 6.10/3 3 791 - 3 791 57 9.1e. Overnight 58 9.2e. A plazo . . . . . . . . . . . . . . . 6.10/4 17 148 - 17 148 58 9.2e. With agreed maturity 59 Del cual: hasta dos años . . . . . . . . 6.10/5 9 529 - 9 529 59 Of which: up to two years 60 9.3e. Con preaviso. . . . . . . . . . . . . 6.10/6 345 - 345 60 9.3e. Redeemable at notice 61 9.4e. Cesiones temporales . . . . . . . . . 6.10/7 10 270 - 10 270 61 9.4e. Repos 62 9x. Depósitos en monedas distintas del euro . . 6.10/8 2 546 - 2 546 62 9x. Deposits in other currencies 63 9.1x. A la vista . . . . . . . . . . . . . . 6.10/9 261 - 261 63 9.1x. Overnight 64 9.2x. A plazo . . . . . . . . . . . . . . . 6.10/10 2 285 - 2 285 64 9.2x. With agreed maturity 65 Del cual: hasta dos años . . . . . . . . 6.10/11 854 - 854 65 Of which: up to two years 66 9.3x. Con preaviso . . . . . . . . . . . . . 6.10/12 - - - 66 9.3x. Redeemable at notice 67 9.4x. Cesiones temporales . . . . . . . . . 6.10/13 - - - 67 9.4x. Repos
68 10. Participaciones de los fondos del merca- do monetario . . . . . . . . . . . . . . . . - 42 - 42 68 10. Money market fund shares/units
69 C. RESTO DEL MUNDO . . . . . . . . . . . . 6.2/4 182 524 284 182 240 69 C. REST OF THE WORLD
70 9. Depósitos . . . . . . . . . . . . . . . . . 6.12/1 182 505 284 182 221 70 9. Deposits 71 9e. Depósitos en euros . . . . . . . . . . . . 6.12/2 149 529 283 149 246 71 9e. Deposits in euro 72 A la vista, hasta dos años y con prea- viso . . . . . . . . . . . . . . . . . . . - 60 727 - 60 727 and redeemable at notice 73 A plazo mayor que dos años . . . . . . . . - 63 166 - 63 166 73 With agreed maturity over 2 years 74 Cesiones temporales. . . . . . . . . . . . - 25 352 - 25 352 74 Repos 75 9x. Depósitos en monedas distintas del euro . . - 32 976 1 32 975 75 9x. Deposits in other currencies 76 A la vista, hasta dos años y con prea- viso . . . . . . . . . . . . . . . . . . . - 26 459 1 26 459 and redeemable at notice 77 A plazo mayor que dos años . . . . . . . . - 4 779 - 4 779 77 With agreed maturity over 2 years 78 Cesiones temporales. . . . . . . . . . . . - 1 737 - 1 737 78 Repos
79 10. Participaciones en los fondos del merca- do monetario . . . . . . . . . . . . . . . . - 19 - 19 79 10. Money market fund shares/units
80 D. SIN CLASIFICAR . . . . . . . . . . . . . . 6.2/5 1 232 694 128 072 1 104 622 80 D. UNCLASSIFIED
81 8. Billetes y monedas . . . . . . . . . . . . 6.2/6 100 043 100 043 - 81 8. Notes and coins
82 11. Valores distintos de acciones y partici- paciones . . . . . . . . . . . . . . . . . . 6.2/9 390 689 - 390 689 82 11. Debt securities issued 83 11e. Euros . . . . . . . . . . . . . . . . 6.12/10 377 854 - 377 854 83 11e. In euro 84 Del cual: hasta dos años . . . . . . . . . - 59 978 - 59 978 84 Of which: up to 2 years 85 11x. En monedas distintas del euro . . . . . . - 12 835 - 12 835 85 11x. In other currencies 86 Del cual: hasta dos años . . . . . . . . . - 386 - 386 86 Of which: up to 2 years
87 13. Capital y reservas . . . . . . . . . . . . . 6.2/10 428 235 24 258 403 977 87 13. Capital and reserves
88 14. Otros pasivos. . . . . . . . . . . . . . . 6.2/11 313 723 3 771 309 952 88 14. Remaining liabilities 89 14e. Del cual: euros . . . . . . . . . . . . - ... - ... 89 14e. Of which: euro
90 TOTAL PASIVOS . . . . . . . . . . . . . . . 6.2/1 3 993 724 483 488 3 510 236 90 TOTAL LIABILITIES
91 e Euros . . . . . . . . . . . . . . . . . . . 6.2/12 3 160 865 455 457 2 705 408 91 e Euro 92 x Monedas distintas del euro . . . . . . . . . 6.2/13 94 117 3 218 90 899 92 x Other currencies 93 s/c Sin clasificar . . . . . . . . . . . . . . . 6.2/14 738 742 24 813 713 929 93 n/c Unclassified
January 2013 data EUR millions
6.C Balance sheet by institutional grouping 6. MONETARY FINANCIAL INSTITUTIONS B) Balance sheet according to the euro area returns
BANCO DE ESPAÑA 131 BOLETÍN ESTADÍSTICO, FEBRUARY 2013

P
1=2 a 5 2 3 4 5=10a12 6 7 8 9 10 11 12 13 14 15
6. MONETARY FINANCIAL INSTITUTIONS 6.1 Assets: summaryB) Balance sheet according to euro area returns
See notes at the end of the chapter
EUR billions By residence By instrument By currency
Total Domes- Other Rest Not Loans Securi- Money Shares Cash Fixed Remai- Euro Non Un- tic euro of the alloca- (a) ties market and (all assets ning (a) euro clas- (a) area world ted other fund other curren- assets curren- sified coun- (c) issuers than shares/ equity cies) cies tries shares units (b) (a)
=13 a 15 =6 a 12
07 3 183 2 488 281 211 203 2 387 409 - 184 9 31 163 2 824 170 188 08 3 621 2 823 289 209 301 2 561 586 0 173 9 37 254 3 140 196 285 09 3 667 2 896 275 217 279 2 496 707 0 185 9 45 225 3 229 179 259 10 3 676 2 900 216 224 336 2 474 684 0 181 8 50 278 3 176 186 314 11 3 979 3 074 222 245 438 2 555 732 0 254 7 57 373 3 353 212 413 12 4 133 3 169 220 256 488 2 616 770 0 260 7 53 427 3 482 189 462
11 Aug 3 792 2 949 229 228 385 2 463 696 0 247 7 55 323 ... ... 362 Sep 3 818 2 941 230 230 417 2 453 696 0 252 7 55 354 3 231 194 393 Oct 3 823 2 953 229 231 410 2 467 691 0 255 7 56 347 ... ... 386 Nov 3 842 2 965 221 236 419 2 478 693 0 252 7 57 356 ... ... 395 Dec 3 979 3 074 222 245 438 2 555 732 0 254 7 57 373 3 353 212 413
12 Jan 3 991 3 076 223 244 448 2 526 758 0 260 7 58 383 ... ... 423 Feb 4 048 3 124 231 250 443 2 569 775 0 261 7 59 378 ... ... 419 Mar 4 233 3 307 227 262 436 2 745 792 0 259 7 59 370 3 618 203 412 Apr 4 175 3 239 219 265 451 2 684 778 0 261 7 60 385 ... ... 427 May 4 253 3 261 210 277 505 2 724 764 0 260 7 60 438 ... ... 481 Jun 4 318 3 334 217 283 484 2 821 756 0 258 7 60 417 3 643 215 460 Jul 4 273 3 289 210 276 499 2 794 722 0 259 7 60 431 ... ... 473 Aug 4 234 3 262 205 269 498 2 765 710 0 261 7 61 430 ... ... 473 Sep 4 211 3 245 203 264 500 2 734 717 0 260 7 62 431 3 529 208 474 Oct 4 159 3 213 199 261 486 2 707 706 0 259 7 62 417 ... ... 461 Nov 4 146 3 202 189 258 497 2 697 697 0 256 7 62 428 ... ... 472 Dec 4 133 3 169 220 256 488 2 616 770 0 260 7 53 427 3 482 189 462
13 Jan 3 994 3 059 224 255 456 2 503 773 0 261 7 54 396 ... ... 432
P
=2to5 2 3 4 5=6+9to12 6 7 8 9 10 11 12 13 14
6. MONETARY FINANCIAL INSTITUTIONS 6.2 Liabilities: summaryB) Balance sheet according to euro area returns
See notes at the end of the chapter
EUR billions By residence By instrument By currency
Total Domes- Other Rest Not - Notes Deposits Money Debt Capital Remai- Euro Non- Un- tic euro of the alloca- and market securi- and ning (a) euro classi- area world ted coins fund ties reserves liabili- curren- fied coun- (a) holders hares/ issued ties cies tries (a) units (b)
1=12to14 =6to11
07 3 183 1 799 233 212 939 71 2 244 - 426 218 224 2 548 211 423 08 3 621 2 081 270 270 1 000 79 2 593 28 399 256 266 2 873 233 515 09 3 667 2 083 286 263 1 034 92 2 619 13 440 285 218 2 944 223 500 10 3 676 2 044 279 284 1 069 96 2 599 8 433 300 240 2 976 163 537 11 3 979 2 089 420 249 1 222 101 2 750 8 435 389 298 3 172 124 683 12 4 133 2 199 498 181 1 256 103 2 870 7 394 429 329 3 274 105 755
11 Aug 3 792 2 016 348 271 1 157 96 2 627 8 430 364 266 3 034 130 628 Sep 3 818 2 009 355 272 1 181 97 2 629 8 425 371 288 3 035 126 656 Oct 3 823 2 002 377 260 1 185 98 2 630 8 429 374 284 3 048 121 654 Nov 3 842 2 009 393 256 1 183 98 2 651 8 430 371 284 3 071 119 652 Dec 3 979 2 089 420 249 1 222 101 2 750 8 435 389 298 3 172 124 683
12 Jan 3 991 2 056 432 244 1 259 99 2 722 10 445 400 315 3 160 119 712 Feb 4 048 2 115 460 230 1 244 98 2 795 10 445 402 299 3 230 121 697 Mar 4 233 2 277 503 220 1 232 99 2 992 9 442 400 291 3 428 117 688 Apr 4 175 2 197 531 215 1 231 99 2 934 9 432 399 301 3 364 115 696 May 4 253 2 214 559 218 1 263 100 2 981 9 424 396 343 3 405 113 735 Jun 4 318 2 261 606 211 1 240 101 3 070 9 411 406 321 3 482 112 724 Jul 4 273 2 201 613 199 1 261 102 3 004 9 410 410 339 3 415 113 745 Aug 4 234 2 178 610 188 1 258 102 2 967 9 408 413 335 3 381 108 745 Sep 4 211 2 182 577 192 1 260 101 2 942 9 401 424 334 3 352 105 754 Oct 4 159 2 167 556 190 1 246 101 2 905 8 396 423 326 3 301 112 746 Nov 4 146 2 192 526 184 1 244 101 2 895 8 390 423 330 3 294 102 750 Dec 4 133 2 199 498 181 1 256 103 2 870 7 394 429 329 3 274 105 755
13 Jan 3 994 2 097 482 183 1 233 100 2 754 7 391 428 314 3 161 94 739
BANCO DE ESPAÑA 132 BOLETÍN ESTADÍSTICO, FEBRUARY 2013

P
+13 2=4+6+8 3=5+7+9 4 5 6 7 8 9 10 11 12 13
6. MONETARY FINANCIAL INSTITUTIONS 6.3 Assets. DomesticB) Balance sheet according to euro area returns
See notes at the end of the chapter
EUR millions Loans Securities other Money Shares than shares market and
Total fund other shares/ equity of which: of which: of which: of which: of which: units Total MFIs General Other Total Euro Euro govern- Euro resident Euro (a) Euro ment sectors (a)
1=2+10+12+
07 2 487 536 2 127 357 2 103 317 319 630 311 538 48 569 48 556 1 759 158 1 743 222 258 366 257 514 - 101 813 08 2 822 616 2 303 045 2 264 827 373 685 360 506 58 021 57 984 1 871 339 1 846 337 426 476 425 598 340 92 756 09 2 896 138 2 254 311 2 233 126 343 195 339 922 69 115 69 093 1 842 001 1 824 110 542 426 540 173 0 99 401 10 2 899 945 2 239 840 2 216 656 299 585 296 557 82 665 82 665 1 857 591 1 837 434 556 932 552 325 0 103 172 11 3 074 395 2 316 298 2 288 815 426 089 418 291 92 783 92 783 1 797 426 1 777 741 595 247 590 573 0 162 850 12 3 169 416 2 379 895 2 358 934 644 781 639 948 117 136 117 136 1 617 979 1 601 850 621 066 616 246 8 168 446
11 Aug 2 948 963 2 227 657 2 206 131 335 857 333 222 89 774 89 774 1 802 026 1 783 135 563 565 559 489 0 157 740 Sep 2 941 141 2 215 906 2 193 304 321 608 318 620 90 903 90 903 1 803 395 1 783 781 562 234 557 968 0 163 001 Oct 2 952 972 2 230 806 2 209 158 346 901 344 018 90 762 90 762 1 793 142 1 774 378 556 594 552 472 0 165 572 Nov 2 965 005 2 243 969 2 222 115 353 247 350 482 91 154 91 154 1 799 568 1 780 479 559 398 555 211 0 161 637 Dec 3 074 395 2 316 298 2 288 815 426 089 418 291 92 783 92 783 1 797 426 1 777 741 595 247 590 573 0 162 850
12 Jan 3 075 675 2 289 566 2 263 313 411 608 404 459 93 952 93 952 1 784 006 1 764 902 618 175 613 490 0 167 934 Feb 3 124 326 2 322 917 2 297 180 451 125 443 668 94 733 94 733 1 777 060 1 758 779 632 874 628 391 1 168 533 Mar 3 306 567 2 488 060 2 465 584 609 927 605 839 95 525 95 525 1 782 608 1 764 220 651 296 646 865 1 167 210 Apr 3 239 213 2 429 874 2 407 553 569 121 565 575 95 683 95 683 1 765 070 1 746 294 641 506 636 907 1 167 832 May 3 261 118 2 465 599 2 442 301 603 337 599 929 107 403 107 403 1 754 859 1 734 969 627 826 622 985 1 167 692 Jun 3 333 962 2 549 122 2 523 645 664 282 657 685 126 145 126 145 1 758 694 1 739 815 618 966 614 239 1 165 873 Jul 3 288 708 2 532 591 2 502 519 675 228 664 380 126 518 126 518 1 730 845 1 711 621 589 645 584 810 1 166 472 Aug 3 261 720 2 514 579 2 485 516 675 664 665 378 124 782 124 782 1 714 134 1 695 357 579 587 574 864 1 167 553 Sep 3 244 549 2 490 093 2 464 985 648 524 641 766 123 820 123 820 1 717 748 1 699 399 586 423 581 432 1 168 032 Oct 3 212 576 2 462 606 2 437 265 634 578 626 739 123 659 123 659 1 704 368 1 686 867 583 068 578 176 3 166 899 Nov 3 202 228 2 456 144 2 432 137 635 193 628 041 122 197 122 197 1 698 754 1 681 899 582 212 577 357 6 163 866 Dec 3 169 416 2 379 895 2 358 934 644 781 639 948 117 136 117 136 1 617 979 1 601 850 621 066 616 246 8 168 446
13 Jan 3 058 652 2 263 347 2 243 714 548 631 543 866 116 586 116 586 1 598 130 1 583 262 625 146 620 469 8 170 151
P
1=3+6+8 2 3 4 5 6 7 8 9
6. MONETARY FINANCIAL INSTITUTIONS 6.4 Assets. Domestic: securitiesB) Balance sheet according to euro area returns other than shares
EUR millions
of which: MFIs General government Other resident sectors
Total Euro of which: of which: of which: Total Total Total Euro Up to Euro Euro 2 years
07 258 366 257 514 38 713 38 252 12 098 85 656 85 552 133 997 133 711 08 426 476 425 598 59 163 58 779 24 023 111 268 111 157 256 044 255 661 09 542 426 540 173 80 227 79 496 20 442 167 124 166 991 295 075 293 687 10 556 932 552 325 77 332 76 933 15 241 176 691 176 570 302 909 298 822 11 595 247 590 573 85 524 85 104 18 274 221 124 221 002 288 599 284 467 12 621 066 616 246 95 149 94 769 18 609 274 258 274 202 251 659 247 276
11 Aug 563 565 559 489 78 714 78 319 16 865 191 923 191 787 292 928 289 383 Sep 562 234 557 968 78 758 78 359 15 971 191 377 191 268 292 099 288 341 Oct 556 594 552 472 79 725 79 328 16 907 190 719 190 620 286 150 282 524 Nov 559 398 555 211 77 961 77 583 15 571 192 255 192 167 289 182 285 461 Dec 595 247 590 573 85 524 85 104 18 274 221 124 221 002 288 599 284 467
12 Jan 618 175 613 490 94 055 93 611 19 046 245 158 244 998 278 962 274 881 Feb 632 874 628 391 95 113 94 710 18 991 260 643 260 479 277 118 273 202 Mar 651 296 646 865 92 478 92 080 17 146 277 904 277 814 280 913 276 971 Apr 641 506 636 907 88 783 88 372 15 906 275 244 275 118 277 479 273 417 May 627 826 622 985 84 725 84 308 16 161 269 897 269 768 273 205 268 910 Jun 618 966 614 239 83 327 82 910 16 983 271 013 270 936 264 626 260 393 Jul 589 645 584 810 85 299 84 874 18 585 263 132 263 052 241 214 236 885 Aug 579 587 574 864 86 205 85 784 20 731 259 087 259 009 234 295 230 071 Sep 586 423 581 432 84 707 84 303 18 457 271 116 271 062 230 599 226 067 Oct 583 068 578 176 85 120 84 717 18 265 270 210 270 156 227 738 223 303 Nov 582 212 577 357 84 357 83 977 18 415 276 596 276 541 221 259 216 839 Dec 621 066 616 246 95 149 94 769 18 609 274 258 274 202 251 659 247 276
13 Jan 625 146 620 469 97 190 96 830 18 571 280 447 280 381 247 509 243 257
BANCO DE ESPAÑA 133 BOLETÍN ESTADÍSTICO, FEBRUARY 2013

P
1=2+10+ 2=4+6+8 3=5+7+9 4 5 6 7 8 9 10 11 12 13
6. MONETARY FINANCIAL INSTITUTIONS 6.5 Assets. Other euro area countriesB) Balance sheet according to euro area returns
See notes at the end of the chapter
EUR millions Loans Securities other Money Shares than shares market and
Total fund other shares/ equity of which: of which: of which: of which: of which: units Total MFIs General Other Total Euro Euro govern- Euro resi- Euro (a) Euro ment dent (a) sectors
12+13
07 281 462 140 461 129 489 118 925 111 142 117 117 21 419 18 230 106 677 103 915 - 34 324 08 289 116 146 844 134 098 121 172 111 859 101 101 25 571 22 138 110 928 108 752 - 31 344 09 274 974 125 851 115 621 99 272 92 444 97 97 26 482 23 080 117 046 115 561 9 32 067 10 215 736 106 047 95 934 80 173 73 545 92 92 25 782 22 296 87 103 85 784 5 22 581 11 221 958 106 192 95 130 78 006 71 140 89 89 28 098 23 901 92 453 90 059 2 23 311 12 220 364 87 299 79 625 60 617 56 842 36 36 26 646 22 748 109 233 107 531 - 23 833
11 Aug 229 022 109 949 99 395 82 613 75 841 90 90 27 246 23 464 96 095 94 518 - 22 978 Sep 229 865 110 194 98 946 82 099 75 012 90 90 28 005 23 844 96 978 95 520 - 22 693 Oct 229 008 109 497 99 364 82 116 75 965 90 90 27 291 23 310 96 826 95 411 - 22 685 Nov 221 442 106 265 96 089 78 437 72 231 89 89 27 739 23 769 92 570 90 477 - 22 606 Dec 221 958 106 192 95 130 78 006 71 140 89 89 28 098 23 901 92 453 90 059 2 23 311
12 Jan 223 139 104 939 94 681 76 693 70 477 87 87 28 159 24 116 94 236 91 801 2 23 962 Feb 230 702 112 963 102 820 82 924 76 805 87 87 29 952 25 928 93 726 91 314 3 24 010 Mar 227 226 110 616 100 935 80 945 75 014 87 87 29 585 25 834 92 274 90 083 3 24 333 Apr 219 154 106 173 96 749 77 492 71 932 73 73 28 608 24 743 88 214 86 045 3 24 765 May 210 498 99 941 90 007 73 236 67 391 90 90 26 615 22 526 86 264 84 198 3 24 290 Jun 217 142 108 528 98 309 75 581 70 084 88 88 32 859 28 137 84 875 82 844 3 23 737 Jul 209 578 103 681 93 883 74 026 68 924 87 87 29 569 24 872 82 403 80 278 2 23 492 Aug 204 838 98 975 89 556 70 537 65 721 129 129 28 309 23 707 82 097 80 086 2 23 765 Sep 202 585 96 287 86 777 68 720 63 753 87 87 27 480 22 937 82 532 80 547 - 23 766 Oct 198 807 96 374 85 367 69 847 63 094 81 81 26 447 22 192 78 706 76 827 - 23 727 Nov 188 502 90 767 82 871 63 535 59 731 80 80 27 152 23 060 73 958 72 439 - 23 777 Dec 220 364 87 299 79 625 60 617 56 842 36 36 26 646 22 748 109 233 107 531 - 23 833
13 Jan 224 157 92 291 85 154 61 802 58 420 28 28 30 460 26 706 107 971 106 296 - 23 895
P
1=3+6+8 2=4+7+9 3 4 5 6 7 8 9
6. MONETARY FINANCIAL INSTITUTIONS 6.6 Assets. Other euro area countriesB) Balance sheet according to euro area returns Securities other than shares
EUR millions
of which: MFIs General government Other resident sectors
Total Euro of which: of which: of which: Total Total Total Euro Up tp Euro Euro 2 years
07 106 677 103 915 22 072 19 885 1 389 68 762 68 724 15 843 15 306 08 110 928 108 752 18 069 16 534 1 690 75 029 75 022 17 830 17 196 09 117 046 115 561 15 907 14 946 1 502 81 630 81 623 19 510 18 992 10 87 103 85 784 11 047 10 261 274 61 396 61 117 14 660 14 406 11 92 453 90 059 9 210 8 483 318 66 076 65 896 17 167 15 680 12 109 233 107 531 5 626 5 463 851 54 456 54 347 49 151 47 721
11 Aug 96 095 94 518 9 460 8 730 209 65 210 64 966 21 425 20 822 Sep 96 978 95 520 9 370 8 656 290 64 847 64 641 22 761 22 223 Oct 96 826 95 411 9 417 8 706 339 64 792 64 609 22 617 22 096 Nov 92 570 90 477 9 034 8 288 365 65 957 65 784 17 579 16 405 Dec 92 453 90 059 9 210 8 483 318 66 076 65 896 17 167 15 680
12 Jan 94 236 91 801 9 332 8 609 509 67 146 66 860 17 757 16 332 Feb 93 726 91 314 9 719 9 006 719 66 612 66 337 17 395 15 971 Mar 92 274 90 083 10 155 9 436 1 154 65 133 65 036 16 986 15 612 Apr 88 214 86 045 9 637 8 905 1 077 62 215 62 115 16 361 15 026 May 86 264 84 198 9 110 8 437 733 61 907 61 800 15 247 13 962 Jun 84 875 82 844 8 904 8 236 738 60 674 60 571 15 296 14 037 Jul 82 403 80 278 8 732 8 151 716 58 683 58 578 14 987 13 550 Aug 82 097 80 086 8 670 8 118 715 59 228 59 125 14 198 12 843 Sep 82 532 80 547 8 696 8 134 724 59 788 59 679 14 047 12 735 Oct 78 706 76 827 8 320 7 824 799 56 688 56 579 13 698 12 424 Nov 73 958 72 439 5 534 5 369 824 56 440 56 330 11 984 10 739 Dec 109 233 107 531 5 626 5 463 851 54 456 54 347 49 151 47 721
13 Jan 107 971 106 296 5 620 5 462 831 53 792 53 686 48 559 47 148
BANCO DE ESPAÑA 134 BOLETÍN ESTADÍSTICO, FEBRUARY 2013

P
1=3+5to7 2 3 4 5 6=8 7 +13+14 9 10 11 12 13 14
6. MONETARY FINANCIAL INSTITUTIONS 6.7 Liabilities. Domestic by sector, with deposits ofB) Balance sheet according to euro area returns other General government by instruments
EUR millions
By sector Deposits of other general government: by instrument
of which: MFIs General Other of which: of which: government resi-
Total dent Total Over- With Rede- Repos Euro of which: sectors Euro night agreed Up 2 emable Central Other maturity years at Total govern- general notice Euro ment govern- ment 8=10+11+
07 1 798 740 1 746 871 320 978 312 972 30 924 62 326 1 384 511 62 326 62 323 52 812 7 356 7 226 0 2 158 08 2 052 574 2 003 182 375 757 363 154 42 749 52 076 1 581 993 52 076 52 074 44 154 6 567 6 335 - 1 355 09 2 069 550 2 031 579 343 258 338 401 58 553 54 486 1 613 253 54 486 54 484 47 329 5 491 5 368 - 1 666 10 2 036 086 2 002 750 299 080 296 529 49 091 39 325 1 648 590 39 325 39 324 32 593 5 504 5 375 - 1 228 11 2 080 699 2 045 750 424 791 417 962 47 835 27 308 1 580 765 27 308 27 303 22 580 4 042 3 862 - 685 12 2 192 119 2 157 761 646 427 642 299 48 881 29 312 1 467 536 29 312 29 311 24 240 4 660 4 359 - 412
11 Aug 2 008 142 1 977 991 332 503 330 268 39 919 31 925 1 603 796 31 925 31 921 26 504 4 876 4 696 - 545 Sep 2 001 158 1 970 419 321 404 319 081 49 543 29 005 1 601 206 29 005 29 000 23 567 4 848 4 673 - 590 Oct 1 994 181 1 965 791 345 494 343 174 42 725 33 260 1 572 702 33 260 33 254 27 751 4 897 4 719 - 612 Nov 2 001 766 1 972 674 347 182 344 959 45 235 39 070 1 570 280 39 070 39 066 33 565 4 881 4 689 - 624 Dec 2 080 699 2 045 750 424 791 417 962 47 835 27 308 1 580 765 27 308 27 303 22 580 4 042 3 862 - 685
12 Jan 2 046 557 2 012 080 412 753 406 259 53 871 28 645 1 551 288 28 645 28 643 24 021 4 204 4 031 - 421 Feb 2 105 581 2 071 673 453 044 446 605 71 189 30 285 1 551 064 30 285 30 283 25 595 4 329 4 153 - 361 Mar 2 267 977 2 238 627 605 441 602 275 69 230 28 397 1 564 910 28 397 28 395 23 531 4 518 4 342 - 348 Apr 2 187 710 2 158 412 569 054 566 358 58 821 30 749 1 529 086 30 749 30 747 26 043 4 439 4 247 - 266 May 2 204 529 2 174 655 600 789 598 537 55 571 30 504 1 517 666 30 504 30 502 25 381 4 818 4 624 - 305 Jun 2 251 956 2 219 075 661 393 655 713 42 210 33 805 1 514 548 33 805 33 804 28 537 4 888 4 693 - 380 Jul 2 192 471 2 154 697 674 277 664 271 37 892 31 596 1 448 707 31 596 31 594 26 263 5 121 4 921 - 212 Aug 2 169 201 2 132 466 673 134 663 652 33 022 28 170 1 434 901 28 170 28 169 22 682 5 227 5 039 - 262 Sep 2 173 455 2 139 833 646 967 641 019 50 294 26 698 1 449 536 26 698 26 696 21 008 5 445 5 261 - 245 Oct 2 158 865 2 121 352 631 402 624 191 43 765 35 244 1 448 492 35 244 35 243 29 406 5 520 5 331 - 318 Nov 2 184 557 2 147 531 635 236 628 626 54 323 34 385 1 460 650 34 385 34 384 28 458 5 660 5 448 - 267 Dec 2 192 119 2 157 761 646 427 642 299 48 881 29 312 1 467 536 29 312 29 311 24 240 4 660 4 359 - 412
13 Jan 2 090 001 2 057 039 552 446 548 538 44 529 33 672 1 459 390 33 672 33 672 27 838 5 492 5 176 - 342
P
1=2+8 2=3+4+6+7 3 4 5 6 7 +12+13 9 10 11 12 13
6. MONETARY FINANCIAL INSTITUTIONS 6.8 Liabilities. Domestic deposits:B) Balance sheet according to euro area returns other resident sector
EUR millions
Total Deposits in euro Deposits in non-euro Total Over- of which: Rede- Repos Total Over- of which: Rede- Repos night emable night emable With at With at agreed Up to notice agreed up to notice maturity 2 years maturity 2 years 8=9+10+
07 1 384 511 1 340 666 440 363 814 692 352 706 19 85 592 43 845 4 219 39 612 9 129 - 14 08 1 581 993 1 545 219 425 513 1 039 696 500 488 20 79 991 36 774 4 314 32 460 9 098 - - 09 1 613 253 1 580 157 471 647 1 041 390 476 500 26 67 095 33 097 4 169 28 927 9 162 - - 10 1 648 590 1 617 817 472 872 1 075 156 477 373 37 69 752 30 772 4 743 26 030 8 751 - - 11 1 580 765 1 552 666 472 595 1 019 797 442 651 45 60 229 28 099 5 484 22 615 6 416 - - 12 1 467 536 1 437 299 465 889 911 573 457 667 42 59 796 30 201 5 911 24 291 7 140 - -
11 Aug 1 603 796 1 575 895 465 371 1 053 216 462 187 44 57 264 27 901 5 297 22 604 7 794 - - Sep 1 601 206 1 572 806 461 843 1 050 362 460 537 44 60 557 28 400 5 352 23 048 7 513 - - Oct 1 572 702 1 546 650 455 780 1 035 277 453 235 44 55 548 26 053 5 172 20 881 5 738 - - Nov 1 570 280 1 543 424 462 867 1 026 080 444 719 45 54 434 26 855 5 386 21 469 6 120 - - Dec 1 580 765 1 552 666 472 595 1 019 797 442 651 45 60 229 28 099 5 484 22 615 6 416 - -
12 Jan 1 551 288 1 523 325 458 869 1 006 560 441 103 45 57 851 27 963 5 407 22 556 6 523 - - Feb 1 551 064 1 523 615 457 790 1 002 268 450 320 46 63 511 27 448 5 441 22 007 6 396 - - Mar 1 564 910 1 538 753 466 721 1 002 833 449 677 46 69 153 26 156 5 373 20 784 5 455 - - Apr 1 529 086 1 502 511 458 403 987 936 443 923 46 56 125 26 576 5 515 21 060 5 301 - - May 1 517 666 1 490 067 464 596 969 381 433 947 45 56 045 27 598 5 611 21 987 5 517 - - Jun 1 514 548 1 487 376 481 950 944 150 426 107 45 61 231 27 173 5 606 21 567 5 252 - - Jul 1 448 707 1 420 967 463 312 905 511 414 907 44 52 101 27 739 5 621 22 118 5 295 - - Aug 1 434 901 1 407 650 463 171 897 380 412 017 43 47 055 27 224 5 529 21 695 5 053 - - Sep 1 449 536 1 421 852 462 654 900 528 418 021 42 58 629 27 645 5 898 21 746 5 373 - - Oct 1 448 492 1 418 180 455 417 903 260 429 209 42 59 460 30 274 5 498 24 776 7 142 - - Nov 1 460 650 1 430 223 460 864 910 004 441 944 42 59 313 30 390 5 642 24 747 7 305 - - Dec 1 467 536 1 437 299 465 889 911 573 457 667 42 59 796 30 201 5 911 24 291 7 140 - -
13 Jan 1 459 390 1 430 325 459 270 914 500 463 481 42 56 512 29 029 5 741 23 287 6 994 - -
BANCO DE ESPAÑA 135 BOLETÍN ESTADÍSTICO, FEBRUARY 2013

P
1=3+5to7 2 3 4 5 6=8 7 +13+14 9 10 11 12 13 14
6. MONETARY FINANCIAL INSTITUTIONS 6.9 Liabilities. Deposits of other euro area countries by sector:B) Balance sheet according to euro area returns with deposits of other general government by instrument
See notes at the end of the chapter
EUR millions
By sector Deposits of other general government: by instrument
of which: MFIs General government Other of which: Over- of which: Rede- Repos resi- night With emable
Total dent Total agreed at Euro of which: Central Other sectors Euro maturity Up notice govern- general (a) to 2 Total ment govern- years Euro ment 8=10+11+
07 233 369 215 781 200 274 183 904 2 0 33 093 0 0 0 - - - - 08 270 044 248 194 233 680 213 932 4 0 36 360 0 0 0 - - - - 09 286 364 267 965 249 771 233 683 2 0 36 591 0 0 0 - - - - 10 279 120 261 618 230 986 217 323 3 0 48 131 0 0 0 - - - - 11 419 791 406 031 344 776 334 010 203 0 74 812 0 0 0 - - - - 12 497 688 484 856 463 924 453 694 4 288 0 29 476 0 0 0 - - - -
11 Aug 347 541 328 816 264 718 249 640 504 0 82 319 0 0 0 - - - - Sep 355 246 337 960 264 710 251 022 243 0 90 292 0 0 0 - - - - Oct 376 504 361 047 283 762 271 750 253 0 92 489 0 0 0 - - - - Nov 392 743 377 938 309 922 298 548 203 0 82 618 0 0 0 - - - - Dec 419 791 406 031 344 776 334 010 203 0 74 812 0 0 0 - - - -
12 Jan 432 240 417 292 348 241 336 402 133 0 83 866 0 0 0 - - - - Feb 459 646 443 736 381 574 369 415 103 0 77 968 0 0 0 - - - - Mar 503 218 486 837 433 610 421 096 3 578 0 66 030 0 0 0 - - - - Apr 531 320 514 059 458 348 445 056 2 192 0 70 781 0 0 0 - - - - May 559 252 544 949 509 139 498 025 2 229 0 47 884 0 0 0 - - - - Jun 606 293 593 532 564 136 554 095 2 233 0 39 924 0 0 0 - - - - Jul 612 720 601 091 575 182 566 465 2 267 0 35 271 0 0 0 - - - - Aug 609 930 597 282 575 777 565 775 944 0 33 209 0 0 0 - - - - Sep 576 877 564 499 543 475 533 599 2 289 0 31 113 0 0 0 - - - - Oct 555 940 543 577 523 993 514 287 2 274 0 29 673 0 0 0 - - - - Nov 525 724 514 205 492 217 483 593 2 284 0 31 223 0 0 0 - - - - Dec 497 688 484 856 463 924 453 694 4 288 0 29 476 0 0 0 - - - -
13 Jan 481 480 469 356 446 318 436 739 1 062 0 34 100 0 0 0 - - - -
P
1=2+8 2=3+4+ 3 4 5 6 7 8=9+10+ 9 10 11 12 13
6. MONETARY FINANCIAL INSTITUTIONS 6.10 Liabilities. Deposits of other euro area countries:B) Balance sheet according to euro area returns other resident sectors
EUR millions Deposits in euro Deposits in non-euro currencies
Total Total Over- of which: Rede- Repos Total Over- of which: Rede- Repos night emable night emable With at With at agreed Up to notice agreed Up to notice maturity 2 years maturity 2 years +6+7 +12+13
07 33 093 31 875 3 900 27 090 12 273 601 284 1 218 165 1 053 914 - - 08 36 360 34 259 3 533 29 788 17 159 554 384 2 101 253 1 848 1 779 - - 09 36 591 34 280 4 183 28 472 14 739 363 1 261 2 311 234 2 078 1 889 - - 10 48 131 44 293 4 736 29 001 21 129 301 10 255 3 838 272 3 566 2 794 - - 11 74 812 71 818 4 879 26 100 16 589 270 40 568 2 994 344 2 650 1 654 - - 12 29 476 26 874 3 634 18 128 9 092 345 4 768 2 602 232 2 370 900 - -
11 Aug 82 319 78 723 5 427 32 436 19 531 248 40 612 3 596 368 3 228 2 481 - - Sep 90 292 86 694 5 342 33 049 17 625 240 48 064 3 598 384 3 214 2 415 - - Oct 92 489 89 043 5 232 31 707 16 468 250 51 855 3 445 303 3 121 2 344 - 21 Nov 82 618 79 187 5 205 25 963 15 917 260 47 759 3 431 351 3 080 2 289 - - Dec 74 812 71 818 4 879 26 100 16 589 270 40 568 2 994 344 2 650 1 654 - -
12 Jan 83 866 80 757 4 579 26 278 16 551 278 49 622 3 109 418 2 691 1 669 - - Feb 77 968 74 218 4 514 28 320 15 637 285 41 098 3 750 384 3 366 2 357 - - Mar 66 030 62 163 4 624 26 246 14 407 293 31 001 3 867 337 3 530 2 510 - - Apr 70 781 66 910 4 297 24 991 13 798 308 37 314 3 871 330 3 542 2 512 - - May 47 884 44 695 4 489 20 948 9 923 324 18 933 3 189 223 2 967 1 655 - - Jun 39 924 37 204 4 399 18 438 7 758 339 14 028 2 721 216 2 504 1 219 - - Jul 35 271 32 360 4 095 18 882 8 037 347 9 035 2 912 210 2 701 1 370 - - Aug 33 209 30 568 3 938 18 534 7 732 354 7 742 2 641 225 2 416 1 119 - - Sep 31 113 28 611 4 173 18 081 8 021 362 5 996 2 502 187 2 315 1 062 - - Oct 29 673 27 016 3 975 17 698 7 838 356 4 987 2 657 299 2 358 1 109 - - Nov 31 223 28 328 3 851 18 590 9 476 351 5 536 2 895 487 2 408 1 127 - - Dec 29 476 26 874 3 634 18 128 9 092 345 4 768 2 602 232 2 370 900 - -
13 Jan 34 100 31 554 3 791 17 148 9 529 345 10 270 2 546 261 2 285 854 - -
BANCO DE ESPAÑA 136 BOLETÍN ESTADÍSTICO, FEBRUARY 2013

P
1=3+5+7 2 3 4 5 6 7
6. MONETARY FINANCIAL INSTITUTIONS 6.11 Assets. Rest of the worldB) Balance sheet according to euro area returns
EUR millions Loans Securities other Shares
of which than shares and other
Total equity Euro of which of which Total Total Euro Euro
07 211 174 86 140 119 296 69 640 43 938 16 500 47 940 08 208 634 74 198 111 208 53 755 48 621 20 443 48 805 09 216 956 84 916 115 688 67 759 47 981 17 157 53 287 10 224 078 91 957 128 476 80 553 40 034 11 404 55 568 11 244 897 95 277 132 766 86 044 44 326 9 233 67 806 12 256 149 120 154 148 722 110 880 39 947 ... 67 480
11 Aug 228 185 ... 125 056 85 731 36 460 ... 66 669 Sep 230 054 92 602 126 815 83 363 36 474 9 238 66 765 Oct 230 520 ... 126 411 84 760 37 230 ... 66 879 Nov 236 332 ... 127 944 84 947 41 100 ... 67 288 Dec 244 897 95 277 132 766 86 044 44 326 9 233 67 806
12 Jan 244 471 ... 131 075 87 210 45 098 ... 68 298 Feb 250 103 ... 133 419 90 618 48 216 ... 68 468 Mar 262 308 115 931 146 107 102 230 48 400 ... 67 801 Apr 264 973 ... 148 163 103 961 48 652 ... 68 158 May 276 691 ... 158 657 110 274 49 876 ... 68 158 Jun 282 902 127 983 162 974 116 331 51 791 11 652 68 137 Jul 276 332 ... 158 030 112 331 49 592 ... 68 710 Aug 268 969 ... 151 155 108 742 48 594 ... 69 220 Sep 263 887 116 813 147 164 104 822 48 306 11 991 68 418 Oct 261 290 ... 148 477 107 645 44 520 ... 68 292 Nov 258 243 ... 149 605 109 582 40 416 ... 68 221 Dec 256 149 120 154 148 722 110 880 39 947 ... 67 480
13 Jan 254 753 ... 147 804 112 040 39 930 ... 67 019
P
1 2 3 4 5 6 7 8 9 10 11 12
6. MONETARY FINANCIAL INSTITUTIONS 6.12 Liabilities. Rest of theB) Balance sheet according to euro area returns world and not allocated
EUR millions Not allocated
Rest of the world: deposits (liabilities other than deposits and money market fund shares)
of which: of which: Repos of which: Overnight
Total with Total Euro agreed Up to 2 Euro Up to 2 Debt securities Other liabilities maturity years years issued and redeema- of which: of which: ble at notice Total Total Euro Euro
07 211 871 101 929 197 016 164 463 14 855 938 853 483 858 116 608 426 416 395 035 223 846 ... 08 270 024 138 158 253 473 219 315 16 551 1 000 065 483 902 85 595 398 626 369 120 265 774 ... 09 262 803 130 240 247 378 205 274 15 425 1 034 413 513 763 68 098 439 877 408 535 217 687 ... 10 283 887 204 453 204 539 174 250 79 349 1 068 667 506 999 36 236 432 892 403 344 239 819 ... 11 249 056 198 197 171 879 111 048 77 177 1 221 698 521 890 53 700 434 512 413 144 297 896 ... 12 180 669 140 338 160 836 93 048 19 834 1 256 005 490 894 67 471 394 300 380 592 329 263 ...
11 Aug 271 326 216 699 184 308 127 352 87 018 1 156 687 510 933 35 451 429 571 406 519 266 321 ... Sep 272 252 220 930 183 305 123 858 88 947 1 181 370 506 133 33 524 424 836 400 962 288 336 ... Oct 259 584 209 345 182 566 123 380 77 018 1 184 523 511 648 40 722 428 984 405 728 283 841 ... Nov 256 340 207 494 176 202 116 810 80 138 1 183 420 512 899 44 335 429 546 406 679 284 252 ... Dec 249 056 198 197 171 879 111 048 77 177 1 221 698 521 890 53 700 434 512 413 144 297 896 ...
12 Jan 243 661 198 755 173 398 109 577 70 264 1 259 209 532 370 58 382 445 178 424 242 315 203 ... Feb 230 102 182 887 174 695 111 588 55 407 1 243 501 531 798 65 195 444 528 423 823 298 821 ... Mar 220 357 172 509 172 709 108 656 47 648 1 231 573 529 591 71 133 441 952 421 526 291 135 ... Apr 215 246 170 780 173 851 108 917 41 395 1 230 965 520 396 71 632 432 179 411 926 300 656 ... May 217 522 172 660 171 691 102 607 45 831 1 262 858 512 835 73 825 423 927 403 477 342 777 ... Jun 211 327 166 779 171 940 102 000 39 387 1 239 555 502 368 75 323 410 702 392 161 321 125 ... Jul 198 680 155 984 166 929 97 196 31 751 1 260 672 503 365 79 316 410 460 392 925 338 911 ... Aug 188 109 149 352 160 096 89 781 28 013 1 258 003 501 867 78 523 408 392 391 660 335 108 ... Sep 191 993 151 764 161 446 92 467 30 547 1 259 821 495 809 75 794 401 167 386 007 333 973 ... Oct 190 014 145 221 165 026 96 469 24 988 1 245 928 490 580 72 202 395 504 381 499 326 138 ... Nov 184 314 147 823 160 585 94 327 23 728 1 243 868 483 989 70 395 389 551 375 592 330 489 ... Dec 180 669 140 338 160 836 93 048 19 834 1 256 005 490 894 67 471 394 300 380 592 329 263 ...
13 Jan 182 505 149 529 155 415 87 470 27 089 1 232 694 484 942 60 364 390 689 377 854 313 723 ...
BANCO DE ESPAÑA 137 BOLETÍN ESTADÍSTICO, FEBRUARY 2013

BANCO DE ESPAÑA / BOLETÍN ESTADÍSTICO
NOTES TO THE TABLES OF CHAPTER 6
Table 6.A
a. Monetary analysis requires that coins (which are issued by the State, i.e. they are a liability of the State) should appear under Banco de España liabilities, so as to be able to calculate cash in circulation. The counterpart of this formal entry is under receivables on the asset side. Here both entries have been eliminated, their presence being meaningless when, as in this case, it is sought to reflect the financial position of the Banco de España. b. Valuation, hierarchy and other adjustments. See breakdown in tables 7.A and 8.A. c. According to ESA 95, gold and SDRs are not liabilities of any sector.
Table 6.B
a. Monetary analysis requires that coins (which are issued by the State, i.e. they are a liability of the State) should appear under Banco de España liabilities, so as to be able to calculate cash in circulation. The counterpart of this formal entry is under receivables on the asset side. Here both entries have been eliminated, their presence being meaningless when, as in this case, it is sought to reflect the financial position of the Banco de España. b. Valuation, hierarchy and other adjustments. See breakdown in tables 7.B and 8.B.
Table 6.1
a. See breakdown in tables 6.3 and 6.4. b. See breakdown in tables 6.5 and 6.6. c. See breakdown in table 6.11.
Table 6.2
a. A breakdown of this column can be found in table 6.12. b. A breakdown of this column can be found in table 6.9.
Table 6.3
a. A breakdown of this column can be found in table 6.4.
Table 6.5
a. A breakdown of this column can be found in table 6.6.
Table 6.9
a. A breakdown of this column can be found in table 6.10.
BANCO DE ESPAÑA 138 BOLETÍN ESTADÍSTICO, FEBRUARY 2013

CHAPTER 7 BANCO DE ESPAÑA

BALANCE ESTADOS
UEM
CUENTAS FINANCIERAS
1 2 3 4 5 6 7 8 9 10 11 12 13 14 15 16
___________________________________________________________________________________________________________________________
7. BANCO DE ESPAÑA A) Conciliación entre el balance financiero de las CFEE y el balance de los estados UEM
Datos referidos a Septiembre de 2012
RESIDENTES EN ESPAÑA/ RESIDENTES EN OTROS PAISES DE LA UEM/ DOMESTIC (RESIDENTS IN SPAIN) RESIDENTS IN OTHER MUMS
Valores distin- Instru- Acciones Valores distintos Instru- Acciones
Préstamos/ tos de acciones/ mentos y otras Préstamos/ de acciones/ mentos y otras Loans Securities other mercado paticipa Loans Securities other mercado paticipa than shares moneta- ciones/ than shares moneta- ciones/
rio/ Shares rio/ Shares Money and Money and
IFM/ AAPP/ OSR/ IFM/ AAPP/ OSR/ market other IFM/ AAPP/ OSR/ IFM/ AAPP/ OSR/ market other MFIs GG ORS MFIs GG ORS instru- equity MFIs GG ORS MFIs GG ORS instru- equity ments ments
TOTAL ACTIVO BALANCE UEM (=I+II). . . . . . 387 676 2 915 186 18 206 30 887 5 339 18 4 785 773 44 038 940 I. ACTIVOS no incluídos en CFEE . . . . . . . .
Activos fijos . . . . . . . . . . . . . . . . . . . Moneda en circulación (b) . . . . . . . . . . . . . II. ACTIVOS FINANCIEROS incluídos en CFEE . . 387 676 2 915 186 18 206 30 887 5 339 18 4 785 773 44 038 940
AF.1 ORO MONETARIO Y D.E.G. . . . . . . . . .
Por instrumentos. . . . . . . . . . . . . . . . . Oro monetario . . . . . . . . . . . . . . . . . Derechos Especiales de Giro . . . . . . . . . . .
Por sectores de contrapartida (a). . . . . . . . . . AF.2 EFECTIVO Y DEPÓSITOS . . . . . . . . . . 387 676 4 785
Por instrumentos. . . . . . . . . . . . . . . . . Efectivo . . . . . . . . . . . . . . . . . . . . Otros depósitos. . . . . . . . . . . . . . . . . 387 676 4 785
Por sectores de contrapartida . . . . . . . . . . . Instituciones financieras . . . . . . . . . . . . . . 387 676
Instituciones financieras monetarias. . . . . . . . . 387 676
Resto del mundo . . . . . . . . . . . . . . . . . 4 785
AF.3 VALORES DISTINTOS DE ACCIONES . . . . 18 206 30 887 5 339 773 44 038
Por instrumentos. . . . . . . . . . . . . . . . . Valores a corto plazo . . . . . . . . . . . . . . 222 Valores a largo plazo . . . . . . . . . . . . . . 18 206 30 665 5 339 773 44 038 Derivados . . . . . . . . . . . . . . . . . . .
Por sectores de contrapartida . . . . . . . . . . . Instituciones financieras . . . . . . . . . . . . . . 18 206 5 339
Instituciones financieras monetarias . . . . . . . . . 18 206
Instituciones financieras no monetarias . . . . . . . 5 339
Sociedades no financieras . . . . . . . . . . . . .
Administraciones Públicas . . . . . . . . . . . . . 30 887
Resto del mundo . . . . . . . . . . . . . . . . . 773 44 038
AF.4 PRÉSTAMOS . . . . . . . . . . . . . . . 2 915 186
Por instrumentos. . . . . . . . . . . . . . . . . Préstamos a largo plazo . . . . . . . . . . . . . 2 915 186
Por sectores de contrapartida . . . . . . . . . . . Sociedades no financieras . . . . . . . . . . . . .
Administraciones Públicas . . . . . . . . . . . . . 2 915
Hogares e instituciones sin fines de lucro . . . . . . . 186
AF.5 ACCIONES Y OTRAS PARTICIPACIONES . . 18 940
Por instrumentos. . . . . . . . . . . . . . . . . Acciones. . . . . . . . . . . . . . . . . . . . 18 Otras participaciones . . . . . . . . . . . . . . 940
Por sectores de contrapartida . . . . . . . . . . . Instituciones financieras . . . . . . . . . . . . . . 18
Instituciones financieras no monetarias . . . . . . . 18
Resto del mundo . . . . . . . . . . . . . . . . . 940
AF.7 OTRAS CUENTAS PENDIENTES DE COBRO . AF.79 Otras cuentas ptes. de cobro excl. cdtos comerc.
September 2012 data
7A. Assets
BANCO DE ESPAÑA 140 BOLETÍN ESTADÍSTICO, FEBRUARY 2013

EMU’s BALANCE SHEET
FINANCIAL ACCOUNTS
17 18 19 20 21 22 23 24=1to23 25=26+27 26 27 28=24+25
___________________________________________________________________________________________________________________________
7A. Activos
Millones de euros AJUSTES CFEE/ RESIDENTES EN EL FASE’s ADJUSTMENTS RESTO DEL MUNDO/ RESTO DE ACTIVOS/ RESIDENTS IN THE REMAINING ASSETS TOTAL REST OF THE WORLD Total Jerarqui- Valo- CFEE/ SUB zación de ra- TOTAL TOTAL fuentes y ción/ FASE otros/ Va- Prés- Valores dis Acciones Oro/ Tenencias FMI/ Resto/ Hierar- lua- tamos/ tintos de y otras Gold de DEG/ IMF Rest chy ad- tion Loans acciones/ partici- SDRs justments Securities paciones/ (a) holdings and other than Shares others shares and other (a) equity 24=1a23/
159 21 866 25 12 471 3 195 2 966 8 017 544 461 TOTAL ASSETS EMU’s BALANCE SHEET (=I+II) ... 3 956 3 956 I. ASSETS not included in FASE
266 266 Fixed assets 3 690 3 690 Coins in circulation (b) 159 21 866 25 12 471 3 195 2 966 4 061 540 505 -25 -18 -8 540 480 II. OUTSTANDING FINANCIAL ASSETS included in FASE
12 471 3 195 15 665 15 665 AF.1 MONETARY GOLD AND SDRs
By instrument 12 471 12 471 12 471 Monetary gold 3 195 3 195 3 195 Special Drawing Rights
By counterpart sector (a) 159 2 966 0 395 586 395 586 AF.2 CURRENCY AND DEPOSITS
By instrument 0 0 0 Currency 159 2 966 395 586 395 586 Other deposits
By counterpart sector 387 676 387 676 Financial institutions
387 676 387 676 Monetary financial institutions
159 2 966 0 7 910 7 910 Rest of the world
21 866 121 110 -8 -8 121 102 AF.3 SECURITIES OTHER THAN SHARES
By instrument 222 222 Short-term securities 21 866 120 888 120 888 Long-term securities -8 -8 -8 Derivatives
By counterpart sector 23 545 0 0 23 545 Financial institutions
18 206 18 206 Monetary financial institutions
5 339 5 339 Non-monetary financial institutions
Non-financial corporations
30 887 30 887 General government
21 866 66 678 -8 -8 66 671 Rest of the world
3 101 3 101 AF.4 LOANS
By instrument 3 101 3 101 Long-term loans
By counterpart sector Non-financial corporations
2 915 2 915 General government
186 186 Households and non-profit institutions
25 983 -18 -18 965 AF.5 SHARES AND OTHER EQUITY
By instrument 18 -18 -18 Shares 25 965 965 Other equity
By counterpart sector 18 -18 -18 Financial institutions
18 -18 -18 Non-monetary financial institutions
25 965 965 Rest of the world
4 061 4 061 0 0 4 061 AF.7 OTHER ACCOUNTS RECEIVABLE 4 061 4 061 0 0 4 061 AF.79 Other accounts receivable excluding trade credits
EUR millions
7. BANCO DE ESPAÑA A) Reconciliation between FASE’s financial balance sheet and EMU’s balance sheet
BANCO DE ESPAÑA 141 BOLETÍN ESTADÍSTICO, FEBRUARY 2013

BALANCE
CUENTAS FINANCIERAS
1 2 3 4 5 6 7
Véanse notas al final del capítulo./ See notes at the end of the chapter.
___________________________________________________________________________________________________________________________
7. BANCO DE ESPAÑA B) Conciliación entre el balance financiero de las CFEE y el balance de los estados UEM
Datos referidos a Septiembre de 2012
RESIDENTES EN ESPAÑA/ RESIDENTES EN OTROS PAÍSES DE RESIDENTES EN EL DOMESTIC (RESIDENTS IN SPAIN) LA UME/RESIDENTS IN OTHER RESTO DEL MUNDO/
MUMS RESIDENTS IN THE REST OF THE WORLD
Depósitos/Deposits Depósitos/Deposits
IFM/ AAPP/ OSR/ IFM/ AAPP/ OSR/ Depósitos/ MFIs GG ORS MFIs GG ORS Deposits (d)
TOTAL PASIVOS BALANCE UEM (=I+II) . . . . . . . . 38 629 2 922 961 371 040 315
I. PASIVOS no incluídos en CFEE . . . . . . . . . . . ...
Moneda en circulación (b) . . . . . . . . . . . . . . . .
II. PASIVOS incluídos en CFEE. . . . . . . . . . . . . 38 629 2 922 961 371 040 315
AF.2 EFECTIVO Y DEPÓSITOS . . . . . . . . . . . . . 38 629 2 922 961 371 040 315
* Por instrumentos Efectivo . . . . . . . . . . . . . . . . . . . . . . . Depósitos transferibles . . . . . . . . . . . . . . . . 2 922 961 Otros depósitos. . . . . . . . . . . . . . . . . . . . 38 629 371 040 315
* Por sectores de contrapartida Sociedades no financieras . . . . . . . . . . . . . . . . 50
Instituciones financieras . . . . . . . . . . . . . . . . . 38 629 907
Instituciones financieras monetarias. . . . . . . . . . . . 38 629
Instituciones financieras no monetarias . . . . . . . . . . 907
Administraciones Públicas . . . . . . . . . . . . . . . . 2 922
Hogares e instituciones sin fines de lucro . . . . . . . . . . 4
Resto del mundo . . . . . . . . . . . . . . . . . . . . 371 040 315
AF.5 ACCIONES Y OTRAS PARTICIPACIONES . . . . .
* Por instrumentos Otras participaciones . . . . . . . . . . . . . . . . .
* Por sectores de contrapartida Administraciones Públicas . . . . . . . . . . . . . . . .
AF.7 OTRAS CUENTAS PENDIENTES DE PAGO. . . . .
AF.79 Otras cuentas ptes. de pago excl. créditos comerc. . .
* Pro memoria:
* Activos financieros netos (Activos financieros menos pasivos de las CFEE) . . . . .
September 2012 data
7B. Liabilities
BANCO DE ESPAÑA 142 BOLETÍN ESTADÍSTICO, FEBRUARY 2013

EMU’s BALANCE SHEET
FINANCIAL ACCOUNTS
8 9 10 11 12 13=1to12 14=15+16 15 16 17=13+14
Véanse notas al final del capítulo./ See notes at the end of the chapter.
___________________________________________________________________________________________________________________________
7B. Pasivos
Millones de euros AJUSTES CFEE/ RESTO DE PASIVOS/ FASE’s ADJUSTMENTS REMAINING LIABILITIES TOTAL CFEE/ SUB Total Jerarqui- Valora- TOTAL TOTAL zación de ción/ FASE fuentes y Valua- Efectivo Instru- Acciones DEG Resto/ otros/ tion en circu- mentos del y otras asigna- Rest Hierar- lación/ mercado partici- dos/ chy ad- Cash put monetario/ paciones/ SDR justments in cir- Money Shares Alloca- and culation Markets and tions others Instru- other (c) ments equity 13=1a12/
101 137 25 453 3 374 629 544 461 TOTAL LIABILITIES EMU’s BALANCE SHEET (=I+II)
3 690 3 690 I. LIABILITIES not included in FASE
3 690 3 690 Coins in circulation (b)
97 447 25 453 3 374 629 540 771 -8 -8 540 763 II. OUTSTANDING LIABILITIES included in FASE
97 447 511 315 511 315 AF.2 CURRENCY AND DEPOSITS
*By instrument 97 447 97 447 97 447 Currency 3 883 3 883 Transferable deposits 409 985 409 985 Other deposits
*By counterpart sector 7 882 7 931 7 931 Non-financial corporations
6 434 45 970 45 970 Financial institutions
6 434 45 062 45 062 Monetary financial institutions
907 907 Non-monetary financial institutions
2 922 2 922 General government
83 132 83 136 83 136 Households and non-profit institutions
371 356 371 356 Rest of the world
25 453 3 374 28 826 28 826 AF.5 SHARES AND OTHER EQUITY
*By instrument 25 453 3 374 28 826 28 826 Other equity
*By counterpart sector 25 453 3 374 28 826 28 826 General government
629 629 -8 -8 622 AF.7 OTHER ACCOUNTS PAYABLE
629 629 -8 -8 622 AF.79 Other accounts payable excluding trade credits
*Memorandum item
*Net financial assets -266 -18 -18 -283 (FASE’s financial assets minus liabilities)
EUR millions
7. BANCO DE ESPAÑA B) Reconciliation between FASE’s financial balance sheet and EMU’s balance sheet
BANCO DE ESPAÑA 143 BOLETÍN ESTADÍSTICO, FEBRUARY 2013

ASSETS
___________________________________________________________________________________________________________________________
Véanse notas al final del capítulo./ See notes at the end of the chapter.
7. BANCO DE ESPAÑA 7.C Balance
Datos referidos a Enero de 2013 Millones de euros
Serie en cuadro y columna/ Time series in
table and column
ACTIVO
1 A. RESIDENTES EN ESPAÑA . . . . . . . . . . . . . 7.1/2 354 873 1 A. DOMESTIC
2 2. Préstamos y créditos . . . . . . . . . . . . . . . 7.3/2 299 865 2 2. Loans 3 2e. Del cual: euros . . . . . . . . . . . . . . . . . 7.3/3 297 356 3 2e. Of which: euro 4 IFM . . . . . . . . . . . . . . . . . . . . . . . . 7.3/4 296 763 4 MFIs
5 2e. Del cual: euros . . . . . . . . . . . . . . . . . 7.3/5 294 254 5 2e. Of which: euro 6 Administraciones Públicas . . . . . . . . . . . . . . . 7.3/6 2 915 6 General government
7 2e. Del cual: euros . . . . . . . . . . . . . . . . . 7.3/7 2 915 7 2e. Of which: euro 8 Otros residentes . . . . . . . . . . . . . . . . . . . 7.3/8 187 8 Other resident sectors
9 2e. Del cual: euros . . . . . . . . . . . . . . . . . 7.3/9 187 9 2e. Of which: euro
10 3. Valores distintos de acciones y participaciones . . 7.3/10 54 987 10 3. Securities other than shares 11 3e. Del cual: euros . . . . . . . . . . . . . . . . . 7.3/11 54 987 11 3e. Of which: euro 12 IFM . . . . . . . . . . . . . . . . . . . . . . . . 7.4/3 18 765 12 MFIs
13 3e. Del cual: euros . . . . . . . . . . . . . . . . . 7.4/4 18 765 13 3e. Of which: euro 14 Administraciones Públicas . . . . . . . . . . . . . . . 7.4/6 30 237 14 General government
15 3e. Del cual: euros . . . . . . . . . . . . . . . . . 7.4/7 30 237 15 3e. Of which: euro 16 Otros residentes . . . . . . . . . . . . . . . . . . . 7.4/8 5 985 16 Other resident sectors
17 3e. Del cual: euros . . . . . . . . . . . . . . . . . 7.4/9 5 985 17 3e. Of which: euro
18 5. Acciones y participaciones . . . . . . . . . . . . 7.3/13 21 18 5. Shares and other equity 19 IFM . . . . . . . . . . . . . . . . . . . . . . . . - - 19 MFIs
20 Otros residentes . . . . . . . . . . . . . . . . . . . - 21 20 Other resident sectors
21 B. RESIDENTES EN OTROS PAÍSES DE LA ZONA DEL EURO . . . . . . . . . . . . . . . . . 7.1/3 46 756 21 B. OTHER EURO AREA COUNTRIES
22 2. Préstamos y créditos . . . . . . . . . . . . . . . 7.5/2 4 785 22 2. Loans 23 2e. Del cual: euros . . . . . . . . . . . . . . . . . 7.5/3 4 785 23 2e. Of which: euro 24 IFM . . . . . . . . . . . . . . . . . . . . . . . . 7.5/4 4 785 24 MFIs
25 2e. Del cual: euros . . . . . . . . . . . . . . . . . 7.5/5 4 785 25 2e. Of which: euro 26 Administraciones Públicas . . . . . . . . . . . . . . . 7.5/6 - 26 General government
27 2e. Del cual: euros . . . . . . . . . . . . . . . . . 7.5/7 - 27 2e. Of which: euro 28 Otros residentes . . . . . . . . . . . . . . . . . . . 7.5/8 - 28 Other resident sectors
29 2e. Del cual: euros . . . . . . . . . . . . . . . . . 7.5/9 - 29 2e. Of which: euro
30 3. Valores distintos de acciones y participaciones . . 7.5/10 40 893 30 3. Securities other than shares 31 3e. Del cual: euros . . . . . . . . . . . . . . . . . 7.5/11 40 893 31 3e. Of which: euro 32 IFM . . . . . . . . . . . . . . . . . . . . . . . . 7.6/3 775 32 MFIs
33 3e. Del cual: euros . . . . . . . . . . . . . . . . . 7.6/4 775 33 3e. Of which: euro 34 Administraciones Públicas . . . . . . . . . . . . . . . 7.6/6 40 118 34 General government
35 3e. Del cual: euros . . . . . . . . . . . . . . . . . 7.6/7 40 118 35 3e. Of which: euro 36 Otros residentes . . . . . . . . . . . . . . . . . . . 7.6/8 - 36 Other resident sectors
37 3e. Del cual: euros . . . . . . . . . . . . . . . . . 7.6/9 - 37 3e. Of which: euro
38 4. Participaciones en FMM . . . . . . . . . . . . . 7.5/12 - 38 4. Money market fund shares/units 39 IFM . . . . . . . . . . . . . . . . . . . . . . . . - - 39 MFIs
40 4e. Del cual: euros . . . . . . . . . . . . . . . . . - - 40 4e. Of which: euro
41 5. Acciones y participaciones . . . . . . . . . . . . 7.5/13 1 079 41 5. Shares and other equity 42 IFM . . . . . . . . . . . . . . . . . . . . . . . . - 1 079 42 MFIs
43 Otros residentes . . . . . . . . . . . . . . . . . . . - - 43 Other resident sectors
44 C. RESTO DEL MUNDO . . . . . . . . . . . . . . . 7.1/4 21 748 44 C. REST OF THE WORLD
45 2. Préstamos y créditos . . . . . . . . . . . . . . . 7.11/3 119 45 2. Loans 46 2e. Del cual: euros . . . . . . . . . . . . . . . . . 7.11/4 - 46 2e. Of which: euro
47 3. Valores distintos de acciones y participaciones . . 7.11/5 21 604 47 3. Securities other than shares 48 3e. Del cual: euros . . . . . . . . . . . . . . . . . 7.11/6 813 48 3e. Of which: euro
49 5. Acciones y participaciones . . . . . . . . . . . . 7.11/7 25 49 5. Shares and other equity 50 5e. Del cual: euros . . . . . . . . . . . . . . . . . - - 50 5e. Of which: euro
January 2013 data EUR millions
7.C Balance sheet 7. BANCO DE ESPAÑA
BANCO DE ESPAÑA 144 BOLETÍN ESTADÍSTICO, FEBRUARY 2013

ASSETS (continued)
vis-a-vis IMF
PRO MEMORIA:
66 Claims on residents in other euro area countries
___________________________________________________________________________________________________________________________
Véanse notas al final del capítulo./ See notes at the end of the chapter.
7. BANCO DE ESPAÑA 7.C Balance
Datos referidos a Enero de 2013 Millones de euros
Serie en cuadro y columna/ Time series in
table and column
ACTIVO (continuación)
51 D. SIN CLASIFICAR . . . . . . . . . . . . . . . . . . 7.1/5 60 112 51 D. UNCLASSIFIED
52 1. Efectivo (todas las monedas) . . . . . . . . . . . . 7.1/10 0 52 1. Cash (all currencies) 53 1e. Del cual: euros . . . . . . . . . . . . . . . . . . - - 53 1e. Of which: euro
54 6. Activo fijo . . . . . . . . . . . . . . . . . . . . . 7.1/11 262 54 6. Fixed assets
55 7. Otros activos . . . . . . . . . . . . . . . . . . . 7.1/12 59 850 55 7. Remaining assets 56 7e. Del cual: euros . . . . . . . . . . . . . . . . . . - - 56 7e. Of which: euro 57 7.1. Oro y derechos en oro . . . . . . . . . . . . . 7.11/9 11 109 57 7.1. Gold & gold receivable 58 7.2. Tenencias de DEG . . . . . . . . . . . . . . . 7.11/10 3 057 58 7.2. SDRs holdings 59 7.3. Posición de reserva y otros activos . . . . . . . . 7.11/11 2 767 59 7.3. Reserve position in the IMF and other assets en el FMI 60 7.4. Resto de activos . . . . . . . . . . . . . . . . 7.11/12 42 917 60 7.4. Rest of assets
61 TOTAL ACTIVO. . . . . . . . . . . . . . . . . . . . 7.1/1 483 489 61 TOTAL ASSETS
62 e. euros . . . . . . . . . . . . . . . . . . . . . . . 7.1/13 400 195 62 e. euro 63 x. Monedas distintas del euro . . . . . . . . . . . . . 7.1/14 40 376 63 x. Other currencies 64 n/c Sin clasificar . . . . . . . . . . . . . . . . . . . 7.1/15 42 917 64 n/c Unclassified
PRO MEMORIA:
65 Activos en euros frente al resto del mundo (46+48+50) . . . 7.11/2 813 65 Claims on rest of the world in euro (46+48+50) 66 Activos en monedas distintas del euro frente a residentes en otros países de la zona euro (22-23+30-31+38-40) . . . 7.5/14 0 in foreign currencies (22-23+30-31+38-40) 67 Activos de reserva . . . . . . . . . . . . . . . . . . . 16.25/1 38 177 67 Reserve assets
68 TOTAL (65 a 67) . . . . . . . . . . . . . . . . . . . ... 38 990 68 TOTAL (65 a 67)
January 2013 data EUR millions
7.C Balance sheet 7. BANCO DE ESPAÑA
BANCO DE ESPAÑA 145 BOLETÍN ESTADÍSTICO, FEBRUARY 2013

LIABILITIES
___________________________________________________________________________________________________________________________
Véanse notas al final del capítulo./ See notes at the end of the chapter.
7. BANCO DE ESPAÑA 7.C Balance
Datos referidos a Enero de 2013 Millones de euros
Serie en cuadro y columna/ Time series in
table and column
PASIVO
1 A. RESIDENTES EN ESPAÑA . . . . . . . . . . . . . . 7.2/2 45 718 1 A. DOMESTIC
2 9. Depósitos . . . . . . . . . . . . . . . . . . . . . 7.7/1 45 718 2 9. Deposits 3 9e. Del cual: euros. . . . . . . . . . . . . . . . . . . 7.7/2 45 717 3 9e. Of which: euro 4 IFM . . . . . . . . . . . . . . . . . . . . . . . . . 7.7/3 34 141 4 MFIs
5 9e. Del cual: euros. . . . . . . . . . . . . . . . . . . 7.7/4 34 141 5 9e. Of which in euro 6 Administración Central . . . . . . . . . . . . . . . . . . 7.7/5 4 293 6 Central government
7 9e. Del cual: euros. . . . . . . . . . . . . . . . . . . - 4 293 7 9e. Of which: euro 8 Otras Administraciones Públicas . . . . . . . . . . . . . . 7.7/6 5 241 8 Other general government
9 9e. Del cual: euros. . . . . . . . . . . . . . . . . . . 7.7/9 5 241 9 9e. Of which: euro 10 Otros residentes . . . . . . . . . . . . . . . . . . . . 7.7/7 2 043 10 Other resident sectors
11 9e. Del cual: euros . . . . . . . . . . . . . . . . . . 7.8/2 2 042 11 9e. Of which: euro
12 B. RESIDENTES EN OTROS PAÍSES DE LA ZONA DEL EURO . . . . . . . . . . . . . . . . . . 7.2/3 309 414 12 B. OTHER EURO AREA COUNTRIES
13 9. Depósitos . . . . . . . . . . . . . . . . . . . . . 7.9/1 309 414 13 9. Deposits 14 9e. Del cual: euros . . . . . . . . . . . . . . . . . . 7.9/2 309 414 14 9e. Of which: euro 15 IFM . . . . . . . . . . . . . . . . . . . . . . . . . 7.9/3 309 414 15 MFIs
16 9e. Del cual: euros . . . . . . . . . . . . . . . . . . 7.9/4 309 414 16 9e. Of which: euro 17 Administración Central . . . . . . . . . . . . . . . . . 7.9/5 - 17 Central government
18 9e. Del cual: euros . . . . . . . . . . . . . . . . . . - - 18 9e. Of which: euro 19 Otras Administraciones Públicas . . . . . . . . . . . . . 7.9/6 - 19 Other general government
20 9e. Del cual: euros . . . . . . . . . . . . . . . . . . 7.9/9 - 20 9e. Of which: euro 21 Otros residentes . . . . . . . . . . . . . . . . . . . . 7.9/7 - 21 Other resident sectors
22 9e. Del cual: euros . . . . . . . . . . . . . . . . . . 7.10/2 - 22 9e. Of which: euro
23 C. RESTO DEL MUNDO . . . . . . . . . . . . . . . . 7.2/4 284 23 C. REST OF THE WORLD
24 9. Depósitos . . . . . . . . . . . . . . . . . . . . . 7.12/1 284 24 9. Deposits 25 9e. Del cual: euros . . . . . . . . . . . . . . . . . . 7.12/2 283 25 9e. Of which: euro
26 D. SIN CLASIFICAR . . . . . . . . . . . . . . . . . . 7.2/5 128 073 26 D. UNCLASSIFIED
27 8. Billetes y monedas (a) . . . . . . . . . . . . . . . 7.2/6 100 043 27 8. Notes and coins (a)
28 11. Valores distintos de acciones y participaciones . . 7.2/10 - 28 11. Debt securities issued 29 11e. Del cual: euros . . . . . . . . . . . . . . . . . - - 29 11e. Of which: euro
30 13. Capital y reservas . . . . . . . . . . . . . . . . 7.2/11 24 258 30 13. Capital and reserves
31 14. Otros pasivos . . . . . . . . . . . . . . . . . . 7.2/12 3 771 31 14. Remaining liabilities 32 14e. Del cual: euros . . . . . . . . . . . . . . . . . 7.12/7 - 32 14e. Of which: euro 33 14.1. Del cual: DEG asignados . . . . . . . . . . . . 7.12/8 3 216 33 14.1. Of which: Allocated SDRs
34 TOTAL PASIVO. . . . . . . . . . . . . . . . . . . . 7.2/1 483 489 34 TOTAL LIABILITIES
35 e euro . . . . . . . . . . . . . . . . . . . . . . . 7.2/13 455 457 35 e euro 36 x Monedas distintas del euro . . . . . . . . . . . . . 7.2/14 3 218 36 x Other currencies 37 s/c Sin clasificar . . . . . . . . . . . . . . . . . . . 7.2/15 24 813 37 n/c Unclassified
January 2013 data EUR millions
7.C Balance sheet 7. BANCO DE ESPAÑA
BANCO DE ESPAÑA 146 BOLETÍN ESTADÍSTICO, FEBRUARY 2013

1=2a5 2 3 4 5=10a12 6 7 8 9 10 11 12 13 14 15
7. BANCO DE ESPAÑA 7.1 Assets: summary
See notes at the end of the chapter
EUR millions By residence By instrument By currency
Total Domes- Other Rest Not Loans Securi- Money Shares Cash Fixed Remai- Euro Curren- Un- tic euro of the classi- ties market and (all assets ning cies clas- (a) area world fied other fund other curren- assets other sified coun- (c) issuers than shares/ equity cies) (c) than tries shares units the (b) euro
=13 a 15 =6 a 12
07 177 554 90 783 63 513 11 907 11 350 84 629 81 086 - 489 0 230 11 120 156 921 15 248 5 385 08 211 483 121 588 65 896 10 465 13 534 111 215 86 246 - 487 1 236 13 298 181 708 22 972 6 803 09 219 804 122 981 62 737 9 228 24 859 100 834 93 398 - 714 0 240 24 619 186 973 19 270 13 561 10 204 887 103 201 56 056 10 190 35 440 70 748 97 851 - 849 0 255 35 185 160 419 23 621 20 847 11 358 108 227 634 60 631 20 085 49 758 181 022 126 341 - 987 0 269 49 489 285 127 40 313 32 668 12 551 638 422 107 47 475 21 523 60 533 371 688 118 292 - 1 124 0 271 60 262 468 089 40 614 42 936
11 Aug 240 041 125 863 57 704 11 064 45 410 86 439 107 345 - 847 0 277 45 133 184 687 26 723 28 631 Sep 248 635 132 094 57 703 11 785 47 053 88 750 111 987 - 845 0 276 46 777 190 916 27 278 30 441 Oct 271 650 153 298 57 844 12 303 48 205 108 945 113 655 - 845 0 276 47 929 212 261 27 912 31 477 Nov 296 124 169 932 59 914 16 541 49 737 124 801 120 741 - 845 0 268 49 469 230 958 32 851 32 315 Dec 358 108 227 634 60 631 20 085 49 758 181 022 126 341 - 987 0 269 49 489 285 127 40 313 32 668
12 Jan 353 005 221 810 59 962 19 816 51 417 173 863 126 737 - 987 0 267 51 150 278 645 40 994 33 366 Feb 392 055 262 255 58 229 19 400 52 172 214 582 124 315 - 987 0 267 51 904 317 441 40 433 34 182 Mar 499 498 372 306 56 140 19 449 51 603 325 768 121 140 - 987 0 267 51 336 428 251 36 958 34 289 Apr 496 475 370 233 53 839 19 798 52 606 324 822 118 061 - 987 0 265 52 340 424 845 36 507 35 122 May 523 354 396 121 53 571 21 387 52 274 351 224 118 871 - 984 0 265 52 009 450 446 38 433 34 475 Jun 590 096 461 510 53 159 24 506 50 920 415 861 122 331 - 984 0 264 50 656 512 965 43 883 33 248 Jul 600 214 473 434 51 871 23 128 51 781 426 587 120 861 - 984 0 269 51 512 519 059 47 845 33 310 Aug 603 283 476 522 50 775 22 566 53 420 428 330 120 548 - 984 0 267 53 153 521 080 47 163 35 040 Sep 573 561 445 226 50 537 22 050 55 748 395 721 121 110 - 983 0 266 55 482 492 935 43 775 36 851 Oct 558 741 431 450 48 832 21 938 56 521 382 086 119 151 - 983 0 266 56 255 476 183 44 351 38 207 Nov 555 820 425 268 48 866 21 949 59 737 375 289 119 811 - 983 0 265 59 471 470 592 43 792 41 436 Dec 551 638 422 107 47 475 21 523 60 533 371 688 118 292 - 1 124 0 271 60 262 468 089 40 614 42 936
13 Jan 483 488 354 873 46 756 21 748 60 112 304 769 117 483 - 1 124 0 262 59 850 400 195 40 376 42 917
1=2 a 5= 2 3 4 5=6+8 6 7 8 9 10 11 12 13 14 15 16
7. BANCO DE ESPAÑA 7.2 Liabilities: summary
See notes at the end of the chapter
EUR millions By residence By instrument By currency Memo
Total item: cash put Domes- Other Rest Not - Notes and coins Depo- Secu- Capital Remain- Euro Curren- Un- into tic euro of the classi sits rities and ing cies classi- circula- (a) area world fied other reserves liabi- other fied tion by coun- (c) holders Total Notes Coins than lities than the Ban- tries shares (c) the co de (b) (d) (e) euro España (f)
6 a 11= a 11
07 177 554 72 678 3 275 275 101 326 70 920 67 613 3 307 76 228 - 11 384 19 023 164 933 439 12 182 88 823 08 211 483 74 861 34 989 244 101 389 79 438 76 018 3 420 110 094 - 13 780 8 171 196 584 403 14 496 86 563 09 219 804 67 816 41 135 265 110 589 91 741 88 274 3 468 109 215 - 15 319 3 529 200 955 3 080 15 770 84 067 10 204 887 36 454 50 922 401 117 110 95 502 91 918 3 584 87 777 - 17 925 3 684 183 277 3 274 18 336 80 141 11 358 110 56 506 174 979 382 126 243 100 710 97 025 3 685 231 867 - 21 440 4 094 332 573 3 359 22 178 74 256 12 551 638 83 067 337 344 142 131 084 103 323 99 641 3 681 420 554 - 23 943 3 818 523 875 3 298 24 465 69 106
11 Aug 240 041 41 070 78 224 399 120 348 96 466 92 784 3 681 119 693 - 20 283 3 599 216 158 3 151 20 733 73 338 Sep 248 635 37 777 88 620 399 121 839 97 300 93 607 3 693 126 796 - 20 841 3 699 224 094 3 272 21 270 72 492 Oct 271 650 40 316 108 487 415 122 432 98 066 94 375 3 691 149 219 - 20 607 3 759 247 283 3 204 21 163 72 037 Nov 296 124 35 369 137 178 420 123 157 98 436 94 749 3 687 172 967 - 20 869 3 851 271 401 3 271 21 451 71 958 Dec 358 110 56 506 174 979 382 126 243 100 710 97 025 3 685 231 867 - 21 440 4 094 332 573 3 359 22 178 74 256
12 Jan 353 005 43 185 183 786 535 125 499 98 549 94 865 3 683 227 506 - 23 180 3 770 326 053 3 330 23 621 71 305 Feb 392 055 54 772 211 425 505 125 353 98 379 94 699 3 680 266 702 - 23 212 3 763 365 079 3 275 23 702 70 629 Mar 499 498 98 332 276 033 463 124 669 98 651 94 985 3 666 374 828 - 22 005 4 013 473 478 3 284 22 736 70 958 Apr 496 475 68 018 302 841 444 125 172 99 070 95 412 3 657 371 302 - 22 163 3 940 470 370 3 320 22 785 70 297 May 523 354 50 543 345 105 283 127 422 100 063 96 412 3 652 395 931 - 23 367 3 992 495 993 3 445 23 916 72 356 Jun 590 096 53 191 408 420 275 128 210 101 247 97 583 3 664 461 886 - 22 759 4 204 563 131 3 411 23 555 75 203 Jul 600 214 45 520 423 272 840 130 582 101 707 98 033 3 674 469 632 - 24 449 4 425 571 337 3 474 25 402 75 530 Aug 603 283 38 292 434 428 324 130 239 101 568 97 877 3 691 473 044 - 24 748 3 923 574 610 3 414 25 259 73 993 Sep 573 561 42 512 400 141 315 130 593 101 137 97 447 3 690 442 968 - 25 453 4 003 544 104 3 375 26 082 72 037 Oct 558 741 47 672 380 437 197 130 436 101 008 97 327 3 681 428 305 - 25 511 3 917 529 311 3 354 26 075 70 520 Nov 555 820 58 935 366 048 165 130 672 100 820 97 146 3 674 425 148 - 26 024 3 828 525 966 3 344 26 510 67 542 Dec 551 638 83 067 337 344 142 131 084 103 323 99 641 3 681 420 554 - 23 943 3 818 523 875 3 298 24 465 69 106
13 Jan 483 488 45 718 309 414 284 128 072 100 043 96 360 3 683 355 416 - 24 258 3 771 455 457 3 218 24 813 65 382
BANCO DE ESPAÑA 147 BOLETÍN ESTADÍSTICO, FEBRUARY 2013

1=2+10+ 2 3 4 5 6 7 8 9 10 11 12 13
7. BANCO DE ESPAÑA 7.3 Assets. Domestic
See notes at the end of the chapter
EUR millions Loans Securities other Money Shares than shares market and
Total fund other shares equity of which: of which: of which: of which: of which: units Total MFIs General Other Total Euro Euro govern- Euro resident Euro (a) Euro ment sectors (a)
12+13
07 90 783 79 343 77 206 73 511 71 374 5 832 5 832 - - 11 414 11 414 - 26 08 121 588 106 766 97 826 101 517 92 577 5 249 5 249 - - 14 798 14 798 - 25 09 122 981 95 903 95 903 91 238 91 238 4 665 4 665 - - 27 053 27 053 - 25 10 103 201 65 820 65 820 61 550 61 550 4 082 4 082 187 187 37 359 37 359 - 22 11 227 634 176 131 171 881 172 447 168 196 3 499 3 499 186 186 51 481 51 481 - 22 12 422 107 366 768 364 191 363 664 361 087 2 915 2 915 189 189 55 319 55 319 - 21
11 Aug 125 863 81 473 81 473 77 791 77 791 3 499 3 499 183 183 44 370 44 370 - 20 Sep 132 094 83 722 83 722 80 041 80 041 3 499 3 499 183 183 48 353 48 353 - 18 Oct 153 298 103 980 103 980 100 298 100 298 3 499 3 499 183 183 49 300 49 300 - 18 Nov 169 932 119 893 119 893 116 211 116 211 3 499 3 499 183 183 50 021 50 021 - 18 Dec 227 634 176 131 171 881 172 447 168 196 3 499 3 499 186 186 51 481 51 481 - 22
12 Jan 221 810 168 936 164 697 165 252 161 013 3 499 3 499 186 186 52 852 52 852 - 22 Feb 262 255 209 585 205 431 205 901 201 746 3 499 3 499 186 186 52 648 52 648 - 22 Mar 372 306 320 844 319 571 317 158 315 885 3 499 3 499 188 188 51 441 51 441 - 22 Apr 370 233 319 920 319 618 316 818 316 515 2 915 2 915 188 188 50 291 50 291 - 22 May 396 121 346 275 345 953 343 173 342 850 2 915 2 915 188 188 49 827 49 827 - 19 Jun 461 510 410 933 408 153 407 830 405 050 2 915 2 915 188 188 50 558 50 558 - 19 Jul 473 434 421 233 413 907 418 130 410 804 2 915 2 915 188 188 52 181 52 181 - 19 Aug 476 522 423 369 416 073 420 267 412 972 2 915 2 915 186 186 53 134 53 134 - 19 Sep 445 226 390 777 386 871 387 676 383 771 2 915 2 915 186 186 54 432 54 432 - 18 Oct 431 450 376 841 371 664 373 741 368 565 2 915 2 915 185 185 54 591 54 591 - 18 Nov 425 268 370 417 365 796 367 317 362 697 2 915 2 915 184 184 54 834 54 834 - 18 Dec 422 107 366 768 364 191 363 664 361 087 2 915 2 915 189 189 55 319 55 319 - 21
13 Jan 354 873 299 865 297 356 296 763 294 254 2 915 2 915 187 187 54 987 54 987 - 21
1 2 3 4 5 6 7 8 9
7. BANCO DE ESPAÑA 7.4 Assets. Domestic:securities other than shares
EUR millions
of which: MFIs General government Other residents
Total Euro of which: of which: of which: Total Total Total Euro Up to Euro Euro 2 years
07 11 414 11 414 1 554 1 554 - 9 153 9 153 707 707 08 14 798 14 798 2 218 2 218 76 11 674 11 674 906 906 09 27 053 27 053 8 014 8 014 142 15 130 15 130 3 908 3 908 10 37 359 37 359 14 582 14 582 - 18 440 18 440 4 338 4 338 11 51 481 51 481 18 337 18 337 200 28 129 28 129 5 015 5 015 12 55 319 55 319 18 443 18 443 492 31 006 31 006 5 870 5 870
11 Aug 44 370 44 370 16 148 16 148 107 23 813 23 813 4 409 4 409 Sep 48 353 48 353 17 828 17 828 157 25 475 25 475 5 050 5 050 Oct 49 300 49 300 18 130 18 130 173 26 121 26 121 5 050 5 050 Nov 50 021 50 021 17 952 17 952 169 26 997 26 997 5 072 5 072 Dec 51 481 51 481 18 337 18 337 200 28 129 28 129 5 015 5 015
12 Jan 52 852 52 852 18 763 18 763 223 28 989 28 989 5 100 5 100 Feb 52 648 52 648 18 496 18 496 259 29 027 29 027 5 124 5 124 Mar 51 441 51 441 17 393 17 393 259 28 866 28 866 5 182 5 182 Apr 50 291 50 291 16 378 16 378 257 28 730 28 730 5 182 5 182 May 49 827 49 827 16 198 16 198 300 28 256 28 256 5 372 5 372 Jun 50 558 50 558 17 371 17 371 353 28 520 28 520 4 667 4 667 Jul 52 181 52 181 18 068 18 068 356 29 122 29 122 4 991 4 991 Aug 53 134 53 134 17 845 17 845 360 30 012 30 012 5 276 5 276 Sep 54 432 54 432 18 206 18 206 410 30 887 30 887 5 339 5 339 Oct 54 591 54 591 18 378 18 378 455 30 767 30 767 5 447 5 447 Nov 54 834 54 834 18 267 18 267 468 30 825 30 825 5 742 5 742 Dec 55 319 55 319 18 443 18 443 492 31 006 31 006 5 870 5 870
13 Jan 54 987 54 987 18 765 18 765 502 30 237 30 237 5 985 5 985
BANCO DE ESPAÑA 148 BOLETÍN ESTADÍSTICO, FEBRUARY 2013

1=12+13 2=4+6+8 3=5+7+9 4 5 6 7 8 9 10 11 12 13 14
7. BANCO DE ESPAÑA 7.5 Assets. Other euro area countries
See notes at the end of the chapter
EUR millions Loans Securities other Money Shares Memo than shares market. and item:
Total fund other Claims shares, equity denomina- of which: of which: of which: of which: of which: units ted in curren- Total MFIs General Other Total cies Euro Euro govern- Euro resi- Euro (a) Euro other ment dent (a) than the sector: euro
2+10+
07 63 513 4 793 4 351 4 793 4 351 - - - - 58 283 58 283 - 438 442 08 65 896 4 352 4 351 4 352 4 351 - - - - 61 106 61 106 - 438 0 09 62 737 4 785 4 785 4 785 4 785 - - - - 57 288 57 288 - 663 0 10 56 056 4 786 4 786 4 786 4 786 - - - - 50 469 50 469 - 802 0 11 60 631 4 786 4 786 4 786 4 786 - - - - 54 904 54 904 - 940 0 12 47 475 4 785 4 785 4 785 4 785 - - - - 41 612 41 612 - 1 079 0
11 Aug 57 704 4 786 4 786 4 786 4 786 - - - - 52 116 52 116 - 802 0 Sep 57 703 4 786 4 786 4 786 4 786 - - - - 52 116 52 116 - 802 0 Oct 57 844 4 809 4 809 4 809 4 809 - - - - 52 234 52 234 - 802 0 Nov 59 914 4 786 4 786 4 786 4 786 - - - - 54 327 54 327 - 802 0 Dec 60 631 4 786 4 786 4 786 4 786 - - - - 54 904 54 904 - 940 0
12 Jan 59 962 4 787 4 787 4 787 4 787 - - - - 54 235 54 235 - 940 0 Feb 58 229 4 786 4 786 4 786 4 786 - - - - 52 503 52 503 - 940 0 Mar 56 140 4 786 4 786 4 786 4 786 - - - - 50 413 50 413 - 940 0 Apr 53 839 4 786 4 786 4 786 4 786 - - - - 48 113 48 113 - 940 0 May 53 571 4 785 4 785 4 785 4 785 - - - - 47 846 47 846 - 940 0 Jun 53 159 4 785 4 785 4 785 4 785 - - - - 47 434 47 434 - 940 0 Jul 51 871 4 786 4 786 4 786 4 786 - - - - 46 145 46 145 - 940 0 Aug 50 775 4 785 4 785 4 785 4 785 - - - - 45 050 45 050 - 940 0 Sep 50 537 4 785 4 785 4 785 4 785 - - - - 44 812 44 812 - 940 0 Oct 48 832 4 785 4 785 4 785 4 785 - - - - 43 107 43 107 - 940 0 Nov 48 866 4 785 4 785 4 785 4 785 - - - - 43 140 43 140 - 940 0 Dec 47 475 4 785 4 785 4 785 4 785 - - - - 41 612 41 612 - 1 079 0
13 Jan 46 756 4 785 4 785 4 785 4 785 - - - - 40 893 40 893 - 1 079 0
1=3+6+8 2=4+7+9 3 4 5 6 7 8 9
7. BANCO DE ESPAÑA 7.6 Assets. Other euro area countries:securities othen than shares
EUR millions
of which: MFIs General government Other resident sectors
Total Euro of which: of which: of which: Total Total Total Euro Up tp Euro Euro 2 years
07 58 283 58 283 7 450 7 450 144 50 833 50 833 - - 08 61 106 61 106 3 384 3 384 - 57 723 57 723 - - 09 57 288 57 288 1 567 1 567 - 55 721 55 721 - - 10 50 469 50 469 996 996 - 49 473 49 473 - - 11 54 904 54 904 1 002 1 002 - 53 903 53 903 - - 12 41 612 41 612 775 775 - 40 837 40 837 - -
11 Aug 52 116 52 116 997 997 - 51 119 51 119 - - Sep 52 116 52 116 998 998 - 51 118 51 118 - - Oct 52 234 52 234 999 999 - 51 235 51 235 - - Nov 54 327 54 327 1 000 1 000 - 53 326 53 326 - - Dec 54 904 54 904 1 002 1 002 - 53 903 53 903 - -
12 Jan 54 235 54 235 833 833 - 53 403 53 403 - - Feb 52 503 52 503 833 833 - 51 670 51 670 - - Mar 50 413 50 413 833 833 - 49 580 49 580 - - Apr 48 113 48 113 833 833 - 47 280 47 280 - - May 47 846 47 846 833 833 - 47 013 47 013 - - Jun 47 434 47 434 833 833 - 46 600 46 600 - - Jul 46 145 46 145 772 772 - 45 373 45 373 - - Aug 45 050 45 050 773 773 - 44 277 44 277 - - Sep 44 812 44 812 773 773 - 44 038 44 038 - - Oct 43 107 43 107 774 774 - 42 333 42 333 - - Nov 43 140 43 140 774 774 - 42 366 42 366 - - Dec 41 612 41 612 775 775 - 40 837 40 837 - -
13 Jan 40 893 40 893 775 775 - 40 118 40 118 - -
BANCO DE ESPAÑA 149 BOLETÍN ESTADÍSTICO, FEBRUARY 2013

1=3+5a7 2 3 4 5 6=8 7 8=13+14 9 10 11 12 13 14
7. BANCO DE ESPAÑA 7.7 Liabilities. Domestic deposits by sector, whithdeposits of other general government by instrument
See notes at the end of the chapter
EUR millions
By sector Deposits of other general government by instrument
Of which: MFIs General Other Of which: Of which: Government resi- Over-
dent night Redeem- Repos Total sectors Total With able Euro Of which: Central Other (a) Euro agreed Up to at govern- general matur- 2 notice Total ment govern- ity years Euro ment 10+11+
07 72 678 72 676 52 321 52 321 4 194 13 837 2 326 13 837 13 837 13 837 - - - - 08 74 861 74 860 54 315 54 315 7 081 11 690 1 776 11 690 11 690 11 690 - - - - 09 67 816 67 815 35 089 35 089 14 422 16 811 1 493 16 811 16 811 16 811 - - - - 10 36 454 36 453 26 964 26 964 3 633 5 704 153 5 704 5 704 5 704 - - - - 11 56 506 56 504 50 934 50 934 2 097 3 329 147 3 329 3 329 3 329 - - - - 12 83 067 83 067 72 115 72 115 6 307 2 703 1 943 2 703 2 703 2 703 - - - -
11 Aug 41 070 41 069 29 747 29 747 5 215 5 935 173 5 935 5 935 5 935 - - - - Sep 37 777 37 776 29 786 29 786 4 249 3 556 187 3 556 3 556 3 556 - - - - Oct 40 316 40 315 30 782 30 782 2 110 7 076 348 7 076 7 076 7 076 - - - - Nov 35 369 35 368 26 173 26 173 363 8 624 209 8 624 8 624 8 624 - - - - Dec 56 506 56 504 50 934 50 934 2 097 3 329 147 3 329 3 329 3 329 - - - -
12 Jan 43 185 43 184 36 049 36 049 2 031 4 944 160 4 944 4 944 4 944 - - - - Feb 54 772 54 771 28 670 28 670 19 811 6 149 141 6 149 6 149 6 149 - - - - Mar 98 332 98 330 74 824 74 824 20 346 3 029 133 3 029 3 029 3 029 - - - - Apr 68 018 68 017 45 932 45 932 16 082 5 812 193 5 812 5 812 5 812 - - - - May 50 543 50 542 44 125 44 125 1 817 4 107 494 4 107 4 107 4 107 - - - - Jun 53 191 53 190 45 344 45 344 2 418 5 008 422 5 008 5 008 5 008 - - - - Jul 45 520 45 518 37 442 37 442 1 702 5 845 530 5 845 5 845 5 845 - - - - Aug 38 292 38 291 31 788 31 788 1 841 3 874 789 3 874 3 874 3 874 - - - - Sep 42 512 42 511 38 629 38 629 1 608 1 314 961 1 314 1 314 1 314 - - - - Oct 47 672 47 671 36 133 36 133 2 587 7 506 1 446 7 506 7 506 7 506 - - - - Nov 58 935 58 934 43 416 43 416 6 942 6 698 1 879 6 698 6 698 6 698 - - - - Dec 83 067 83 067 72 115 72 115 6 307 2 703 1 943 2 703 2 703 2 703 - - - -
13 Jan 45 718 45 717 34 141 34 141 4 293 5 241 2 043 5 241 5 241 5 241 - - - -
1=2+8 2=3+4+6+7 3 4 5 6 7 8=12+13 9 10 11 12 13
7. BANCO DE ESPAÑA 7.8 Liabilities. Domestic deposits:other resident sector
EUR millions
Total Deposits in euro Deposits in other currencies Total Over- of which: Redeem- Repos Total Over- of which: Redeem- Repos night able night able With at With at agreed Up to notice agreed up to notice maturity 2 years maturity 2 years 9+10+
07 2 326 2 325 2 325 - - - - 1 1 - - - - 08 1 776 1 774 1 774 - - - - 1 1 - - - - 09 1 493 1 493 1 493 - - - - 1 1 - - - - 10 153 152 152 - - - - 1 1 - - - - 11 147 144 144 - - - - 2 2 - - - - 12 1 943 1 942 1 942 - - - - 1 1 - - - -
11 Aug 173 172 172 - - - - 1 1 - - - - Sep 187 186 186 - - - - 1 1 - - - - Oct 348 347 347 - - - - 1 1 - - - - Nov 209 208 208 - - - - 1 1 - - - - Dec 147 144 144 - - - - 2 2 - - - -
12 Jan 160 159 159 - - - - 1 1 - - - - Feb 141 140 140 - - - - 1 1 - - - - Mar 133 132 132 - - - - 1 1 - - - - Apr 193 191 191 - - - - 1 1 - - - - May 494 493 493 - - - - 1 1 - - - - Jun 422 421 421 - - - - 1 1 - - - - Jul 530 528 528 - - - - 2 2 - - - - Aug 789 788 788 - - - - 1 1 - - - - Sep 961 960 960 - - - - 1 1 - - - - Oct 1 446 1 445 1 445 - - - - 1 1 - - - - Nov 1 879 1 878 1 878 - - - - 1 1 - - - - Dec 1 943 1 942 1 942 - - - - 1 1 - - - -
13 Jan 2 043 2 042 2 042 - - - - 1 1 - - - -
BANCO DE ESPAÑA 150 BOLETÍN ESTADÍSTICO, FEBRUARY 2013

1=3+5a7 2 3 4 5 6=8 7 8=10+11+ 9 10 11 12 13 14
7. BANCO DE ESPAÑA 7.9 Liabilities. Deposits of other euro area countries by sector,with deposits of other general government by instrument
See notes at the end of the chapter
EUR millions
By sector Other general government: deposits by instrument
of which: MFIs General government Other of which: Over- of which: Redeem- Repos resi- night With able
Total dents Total agreed at Euro of which: Central Other (a) Euro maturity Up notice govern- general to 2 Total ment govern- years Euro ment 13+14
07 3 275 3 275 3 275 3 275 - - - - - - - - - - 08 34 989 34 989 34 989 34 989 - - - - - - - - - - 09 41 135 41 135 41 135 41 135 - - - - - - - - - - 10 50 922 50 922 50 922 50 922 - - - - - - - - - - 11 174 979 174 979 174 979 174 979 - - - - - - - - - - 12 337 344 337 344 337 344 337 344 - - - - - - - - - -
11 Aug 78 224 78 224 78 224 78 224 - - - - - - - - - - Sep 88 620 88 620 88 620 88 620 - - - - - - - - - - Oct 108 487 108 487 108 487 108 487 - - - - - - - - - - Nov 137 178 137 178 137 178 137 178 - - - - - - - - - - Dec 174 979 174 979 174 979 174 979 - - - - - - - - - -
12 Jan 183 786 183 786 183 786 183 786 - - - - - - - - - - Feb 211 425 211 425 211 425 211 425 - - - - - - - - - - Mar 276 033 276 033 276 033 276 033 - - - - - - - - - - Apr 302 841 302 841 302 841 302 841 - - - - - - - - - - May 345 105 345 105 345 105 345 105 - - - - - - - - - - Jun 408 420 408 420 408 420 408 420 - - - - - - - - - - Jul 423 272 423 272 423 272 423 272 - - - - - - - - - - Aug 434 428 434 428 434 428 434 428 - - - - - - - - - - Sep 400 141 400 141 400 141 400 141 - - - - - - - - - - Oct 380 437 380 437 380 437 380 437 - - - - - - - - - - Nov 366 048 366 048 366 048 366 048 - - - - - - - - - - Dec 337 344 337 344 337 344 337 344 - - - - - - - - - -
13 Jan 309 414 309 414 309 414 309 414 - - - - - - - - - -
1 2 3 4 5 6 7 8 9 10 11 12 13
7. BANCO DE ESPAÑA 7.10 Liabilities. Deposit of other euro area countries:other resident sectors
EUR millions Deposits in euro Deposits in other currencies
Total Total Over- of which: Redeem- Repos Total Over- of which: Redeem- Repos night able at night able at With notice With notice agreed Up to agreed Up to maturity 2 years maturity 2 years
07 - - - - - - - - - - - - - 08 - - - - - - - - - - - - - 09 - - - - - - - - - - - - - 10 - - - - - - - - - - - - - 11 - - - - - - - - - - - - - 12 - - - - - - - - - - - - -
11 Aug - - - - - - - - - - - - - Sep - - - - - - - - - - - - - Oct - - - - - - - - - - - - - Nov - - - - - - - - - - - - - Dec - - - - - - - - - - - - -
12 Jan - - - - - - - - - - - - - Feb - - - - - - - - - - - - - Mar - - - - - - - - - - - - - Apr - - - - - - - - - - - - - May - - - - - - - - - - - - - Jun - - - - - - - - - - - - - Jul - - - - - - - - - - - - - Aug - - - - - - - - - - - - - Sep - - - - - - - - - - - - - Oct - - - - - - - - - - - - - Nov - - - - - - - - - - - - - Dec - - - - - - - - - - - - -
13 Jan - - - - - - - - - - - - -
BANCO DE ESPAÑA 151 BOLETÍN ESTADÍSTICO, FEBRUARY 2013

1 2 3 4 5 6 7 8 9 10 11 12
7. BANCO DE ESPAÑA 7.11 Assets. Rest of the world and remaining assets
EUR millions
Rest of the world Remaining assets
of which: of which: of which: Shares Total Gold SDR Reserve Other and and holdings position assets Loans Securi- other gold in and
Total Euro Total Euro ties Euro equity receiv- other other ables claims than on the shares IMF
07 11 907 4 973 493 - 11 390 4 973 25 11 120 5 145 251 339 5 385 08 10 465 2 929 97 - 10 343 2 929 25 13 298 5 627 160 708 6 803 09 9 228 1 015 145 - 9 057 1 015 25 24 619 6 938 3 221 898 13 561 10 10 190 907 142 - 10 023 907 25 35 185 9 555 3 394 1 388 20 847 11 20 085 844 105 - 19 955 844 25 49 489 11 017 3 162 2 642 32 668 12 21 523 813 136 - 21 362 813 25 60 262 11 418 3 132 2 776 42 936
11 Aug 11 064 843 180 - 10 859 843 25 45 133 11 373 2 957 2 172 28 631 Sep 11 785 844 242 - 11 518 844 25 46 777 10 922 3 070 2 343 30 441 Oct 12 303 844 157 - 12 122 844 25 47 929 11 150 3 007 2 295 31 477 Nov 16 541 844 123 - 16 393 844 25 49 469 11 740 3 071 2 343 32 315 Dec 20 085 844 105 - 19 955 844 25 49 489 11 017 3 162 2 642 32 668
12 Jan 19 816 844 141 - 19 650 844 25 51 150 12 025 3 138 2 621 33 366 Feb 19 400 844 211 - 19 165 844 25 51 904 11 949 3 086 2 687 34 182 Mar 19 449 811 138 - 19 286 811 25 51 336 11 258 3 095 2 694 34 289 Apr 19 798 811 115 - 19 657 811 25 52 340 11 300 3 129 2 789 35 122 May 21 387 811 164 - 21 198 811 25 52 009 11 392 3 247 2 894 34 475 Jun 24 506 811 143 - 24 339 811 25 50 656 11 287 3 225 2 896 33 248 Jul 23 128 812 568 - 22 535 812 25 51 512 11 961 3 286 2 955 33 310 Aug 22 566 812 176 - 22 365 812 25 53 153 11 875 3 231 3 007 35 040 Sep 22 050 812 159 - 21 866 812 25 55 482 12 471 3 195 2 966 36 851 Oct 21 938 812 459 - 21 453 812 25 56 255 12 002 3 175 2 871 38 207 Nov 21 949 812 87 - 21 837 812 25 59 471 12 011 3 165 2 858 41 436 Dec 21 523 813 136 - 21 362 813 25 60 262 11 418 3 132 2 776 42 936
13 Jan 21 748 813 119 - 21 604 813 25 59 850 11 109 3 057 2 767 42 917
1 2 (a) 3 4 5 6 7 8
7. BANCO DE ESPAÑA 7.12 Liabilities. Rest of the world andnot classified by residence of holder
See notes at the end of the chapter
EUR millions
Rest of the world: deposits Not classified holder
of which: of which: of which: Overnight, Repos Total
Total with agreed Euro maturity Euro Euro Allocated and redee- SDR mable at notice
07 275 158 275 158 - 19 023 17 904 321 08 244 172 244 172 - 8 171 7 125 330 09 265 264 265 264 - 3 529 - 3 078 10 401 400 401 400 - 3 684 - 3 272 11 382 381 382 381 - 4 094 - 3 355 12 142 142 142 142 - 3 818 - 3 296
11 Aug 399 399 399 399 - 3 599 - 3 149 Sep 399 398 399 398 - 3 699 - 3 270 Oct 415 415 415 415 - 3 759 - 3 203 Nov 420 419 420 419 - 3 851 - 3 270 Dec 382 381 382 381 - 4 094 - 3 355
12 Jan 535 534 535 534 - 3 770 - 3 329 Feb 505 504 505 504 - 3 763 - 3 273 Mar 463 463 463 463 - 4 013 - 3 282 Apr 444 443 444 443 - 3 940 - 3 318 May 283 282 283 282 - 3 992 - 3 443 Jun 275 274 275 274 - 4 204 - 3 409 Jul 840 839 840 839 - 4 425 - 3 472 Aug 324 323 324 323 - 3 923 - 3 413 Sep 315 315 315 315 - 4 003 - 3 374 Oct 197 196 197 196 - 3 917 - 3 353 Nov 165 164 165 164 - 3 828 - 3 342 Dec 142 142 142 142 - 3 818 - 3 296
13 Jan 284 283 284 283 - 3 771 - 3 216
BANCO DE ESPAÑA 152 BOLETÍN ESTADÍSTICO, FEBRUARY 2013

P
P
A
1 2 3 4 5 6 7 8 9 10 11 12
7. BANCO DE ESPAÑA 7.13 Balance sheetSummary by sectors
See notes at the end of the chapter
NEDD/SDDS(a) EUR millions Assets Liabilities Memo item:
Total assets= Total Euro area residents Rest Not Euro area residents Rest Not Currency in liabi- of classi- of classi- circulation lities the fied by the fied by and Eurodep- Total General Other world residence Total General Other world residence posits of govern- residents of iusser govern- residents of iusser MFIs resid- ment ment dents in Spain
07 177 554 154 297 65 819 88 478 11 907 11 350 75 953 18 030 57 922 275 101 326 123 240 08 211 483 187 484 74 646 112 838 10 465 13 534 109 850 18 771 91 079 244 101 389 133 753 09 219 804 185 718 75 517 110 201 9 228 24 859 108 950 31 233 77 717 265 110 589 126 831 10 204 887 159 257 71 995 87 263 10 190 35 440 87 376 9 337 78 040 401 117 110 122 466 11 358 108 288 265 85 530 202 735 20 085 49 758 231 485 5 426 226 059 382 126 243 151 643 12 551 638 469 582 74 758 394 824 21 523 60 533 420 412 9 010 411 402 142 131 084 175 437
11 Aug 240 041 183 567 78 431 105 135 11 064 45 410 119 294 11 150 108 144 399 120 348 126 213 Sep 248 635 189 797 80 091 109 706 11 785 47 053 126 397 7 805 118 593 399 121 839 127 086 Oct 271 650 211 142 80 854 130 288 12 303 48 205 148 803 9 186 139 618 415 122 432 128 848 Nov 296 124 229 846 83 822 146 024 16 541 49 737 172 547 8 987 163 560 420 123 157 124 610 Dec 358 108 288 265 85 530 202 735 20 085 49 758 231 485 5 426 226 059 382 126 243 151 643
12 Jan 353 005 281 772 85 890 195 882 19 816 51 417 226 971 6 975 219 996 535 125 499 134 598 Feb 392 055 320 483 84 195 236 288 19 400 52 172 266 197 25 961 240 236 505 125 353 127 049 Mar 499 498 428 446 81 944 346 502 19 449 51 603 374 365 23 374 350 991 463 124 669 173 475 Apr 496 475 424 072 78 925 345 147 19 798 52 606 370 859 21 894 348 965 444 125 172 145 001 May 523 354 449 693 78 184 371 509 21 387 52 274 395 649 5 924 389 725 283 127 422 144 189 Jun 590 096 514 669 78 035 436 635 24 506 50 920 461 611 7 426 454 185 275 128 210 146 590 Jul 600 214 525 305 77 410 447 895 23 128 51 781 468 792 7 547 461 245 840 130 582 139 150 Aug 603 283 527 297 77 204 450 092 22 566 53 420 472 720 5 715 467 005 324 130 239 133 356 Sep 573 561 495 763 77 840 417 923 22 050 55 748 442 653 2 922 439 730 315 130 593 139 766 Oct 558 741 480 282 76 015 404 267 21 938 56 521 428 109 10 093 418 016 197 130 436 137 141 Nov 555 820 474 134 76 107 398 028 21 949 59 737 424 983 13 640 411 343 165 130 672 144 236 Dec 551 638 469 582 74 758 394 824 21 523 60 533 420 412 9 010 411 402 142 131 084 175 437
13 Jan 483 488 401 629 73 270 328 359 21 748 60 112 355 132 9 534 345 599 284 128 072 134 184
1=2+4+6 2 3 4 5 6 7 8 9 10 11
7. BANCO DE ESPAÑA 7.14 Peseta banknotes in circulationBreakdown denomination
Amount in millions of euros and number in millions of notes
Total ESP 10,000 ESP 5,000 ESP 2,000 ESP 1,000 Below Held by Amount ESP Euro-
1,000 system Amount Number Amount Number Amount Number Amount Number Amount
+8+10-11
97 51 913 28 151 468 19 812 659 2 446 203 1 480 246 23 ...98 52 731 29 372 489 19 270 641 2 608 217 1 481 246 ... ...99 58 911 33 472 557 20 735 690 3 164 263 1 574 262 ... 34 00 57 198 33 887 564 18 838 627 2 994 249 1 515 252 ... 36 01 46 228 27 437 457 15 250 507 2 444 203 1 269 211 ... 173
01 Jan 53 807 32 440 540 17 292 575 2 672 222 1 431 238 ... 29 Feb 53 353 32 232 536 17 074 568 2 669 222 1 419 236 ... 40 Mar 53 486 32 279 537 17 097 569 2 728 227 1 433 239 ... 51 Apr 53 462 32 105 534 17 104 569 2 828 235 1 463 243 ... 38 May 52 971 31 806 529 16 943 564 2 836 236 1 456 242 ... 69 Jun 53 668 32 015 533 17 272 575 2 949 245 1 481 246 ... 49 Jul 53 747 31 932 531 17 367 578 3 004 250 1 478 246 ... 34 Aug 52 239 30 967 515 16 922 563 2 973 247 1 443 240 ... 66 Sep 51 309 30 529 508 16 553 551 2 905 242 1 418 236 ... 96 Oct 49 968 29 801 496 16 032 534 2 844 237 1 377 229 ... 86 Nov 48 388 28 893 481 15 571 518 2 772 231 1 322 220 ... 169 Dec 46 228 27 437 457 15 250 507 2 444 203 1 269 211 ... 173
02 Jan 15 100 ... ... ... ... ... ... ... ... ... ... Feb 5 231 ... ... ... ... ... ... ... ... ... ...
BANCO DE ESPAÑA 153 BOLETÍN ESTADÍSTICO, FEBRUARY 2013

1 2 3 4 5 6 7 8 9 10 11 12 13 14 15 16
7. BANCO DE ESPAÑA 7.15 Peseta coins in circulationBreakdown by coin denomination
Amount (in millions of euros) y number (in millions of coins)
Total ESP 2,000 ESP 500 ESP 100 ESP 50 ESP 25 ESP 5 ESP Remain- 1 ing coin
Amount Number Amount Number Amount Number Amount Number Amount Number Amount Number Amount Number Amount Amount
97 2 128 8 494 221 18 610 203 744 1 238 34 114 234 1 557 97 3 215 10 178 98 2 295 9 714 235 20 637 212 811 1 350 35 118 256 1 705 115 3 839 12 192 99 2 433 10 650 246 20 669 223 879 1 462 34 112 272 1 812 130 4 336 14 191 00 2 595 11 546 251 21 702 233 964 1 605 32 107 295 1 961 144 4 801 14 192 01 2 522 11 684 256 21 652 217 948 1 577 28 93 295 1 960 149 4 963 15 180
01 Jan 2 599 11 602 250 21 699 233 970 1 614 32 106 295 1 966 145 4 842 14 193 Feb 2 592 11 629 249 21 694 231 971 1 615 32 105 296 1 967 146 4 863 14 191 Mar 2 588 11 678 248 21 690 230 972 1 617 31 103 296 1 970 147 4 901 14 190 Apr 2 598 11 711 247 21 694 231 979 1 629 31 103 296 1 973 148 4 914 15 189 May 2 620 11 770 256 21 698 232 986 1 640 31 103 298 1 981 148 4 939 15 189 Jun 2 640 11 865 260 22 701 233 995 1 655 31 102 301 2 004 150 4 985 15 188 Jul 2 666 11 972 261 22 706 235 1 009 1 679 31 102 304 2 024 151 5 041 15 188 Aug 2 670 11 990 261 22 710 236 1 011 1 683 30 101 305 2 027 152 5 052 15 187 Sep 2 671 12 005 261 22 709 236 1 013 1 686 30 100 305 2 028 152 5 063 15 186 Oct 2 647 11 983 259 22 697 232 1 004 1 670 30 98 304 2 026 152 5 065 15 186 Nov 2 584 11 837 257 21 674 224 976 1 624 28 95 299 1 991 151 5 023 15 183 Dec 2 522 11 684 256 21 652 217 948 1 577 28 93 295 1 960 149 4 963 15 180
02 Jan 2 090 10 683 256 21 527 175 783 1 302 26 86 255 1 699 138 4 583 15 89 Feb 1 647 9 324 255 21 384 128 559 930 25 83 206 1 369 121 4 029 14 82
12+14 2 3 4 5 6 7 8 9 10 11 12 13 14 15 16
7. BANCO DE ESPAÑA 7.16 Banknotes distributed less banknotes withdrawnby the Banco de España and unreturned peseta banknotes.Breakdown of euro banknotes by denomination (a)
See notes at the end of the chapter
Amount (EUR millions) and number (millions)
Euro banknotes Memo item EUR 500 EUR 200 EUR 100 EUR 50 EUR 20 EUR 10 EUR 5 Unre-
Total turned Amount peseta
(b) Amount Num- Amount Num- Amount Num- Amount Num- Amount Num- Amount Num- Amount Num- bank- ber mero mero ber ber ber ber notes
2+4 Amount +6+8+10+
07 85 517 56 759 114 4 189 21 7 377 74 26 936 539 -7 222 -361 -2 636 -264 114 23 970 08 83 144 56 243 112 4 341 22 6 738 67 29 239 585 -9 839 -492 -3 596 -360 18 4 945 09 80 600 54 385 109 4 107 21 6 314 63 32 419 648 -12 125 -606 -4 434 -443 -66 -13 926 10 76 558 52 244 104 3 779 19 5 748 57 34 910 698 -14 645 -732 -5 339 -534 -139 -28 909 11 70 571 50 421 101 3 329 17 4 678 47 36 021 720 -17 325 -866 -6 314 -631 -239 -48 895 12 65 425 46 483 93 2 963 15 3 792 38 39 878 798 -20 039 -1 002 -7 325 -732 -328 -66 881
11 Aug 69 656 50 359 101 3 403 17 4 718 47 34 236 685 -16 739 -837 -6 094 -609 -227 -45 899 Sep 68 799 50 328 101 3 371 17 4 616 46 34 019 680 -17 090 -855 -6 205 -620 -239 -48 898 Oct 68 346 50 342 101 3 350 17 4 567 46 33 988 680 -17 351 -868 -6 295 -629 -255 -51 897 Nov 68 271 50 366 101 3 333 17 4 549 45 34 158 683 -17 536 -877 -6 340 -634 -257 -51 896 Dec 70 571 50 421 101 3 329 17 4 678 47 36 021 720 -17 325 -866 -6 314 -631 -239 -48 895
12 Jan 66 839 48 355 100 3 170 16 4 271 45 38 793 693 -20 081 -898 -7 326 -648 -343 -53 894 Feb 66 950 49 591 99 3 235 16 4 432 44 34 672 693 -18 157 -908 -6 549 -655 -274 -55 893 Mar 67 291 49 296 99 3 204 16 4 403 44 35 372 707 -18 143 -907 -6 560 -656 -279 -56 892 Apr 66 639 48 876 98 3 167 16 4 327 43 35 560 711 -18 365 -918 -6 645 -665 -281 -56 891 May 68 704 49 349 99 3 274 16 4 591 46 36 967 739 -18 482 -924 -6 706 -671 -288 -58 890 Jun 71 540 49 704 99 3 352 17 4 891 49 39 126 783 -18 487 -924 -6 757 -676 -289 -58 889 Jul 71 856 49 540 99 3 334 17 4 867 49 40 099 802 -18 793 -940 -6 896 -690 -295 -59 888 Aug 70 303 49 162 98 3 281 16 4 676 47 39 826 797 -19 270 -963 -7 063 -706 -310 -62 887 Sep 68 347 48 805 98 3 229 16 4 468 45 39 134 783 -19 744 -987 -7 214 -721 -331 -66 886 Oct 66 839 48 355 97 3 170 16 4 271 43 38 793 776 -20 081 -1 004 -7 326 -733 -343 -69 885 Nov 63 868 46 866 94 3 006 15 3 819 38 38 189 764 -20 293 -1 015 -7 372 -737 -346 -69 882 Dec 65 425 46 483 93 2 963 15 3 792 38 39 878 798 -20 039 -1 002 -7 325 -732 -328 -66 881
13 Jan 61 698 45 855 92 2 867 14 3 490 35 38 129 763 -20 758 -1 038 -7 525 -752 -360 -72 880
BANCO DE ESPAÑA 154 BOLETÍN ESTADÍSTICO, FEBRUARY 2013

2+4+5 2 3 4 5 6 7 8 9 10 11 12 13 14 15 16 17
7. BANCO DE ESPAÑA 7.17 Euro coins placed in circulation by theBanco de España and unreturned peseta coins.Breakdown of euro coins by denomination.
See notes at the end of the chapter
Amount (EUR millions) and number (millions)
Euro coins Memo item EUR 2 EUR 50 20 10 5 2 1 Unre-
Amount 1 cent cent cent cent cent cent turned peseta (a) coins A- Num- A- A- Num- A- Num- A- Num- A- Num- A- Num- A- Num- Amount mount ber mount mount ber mount ber mount ber mount ber mount ber mount ber
13+15+ 7+9+11+
07 3 307 896 448 1 443 346 692 232 1 159 196 1 964 117 2 341 46 2 312 29 2 940 822 08 3 420 914 457 1 499 350 699 239 1 194 209 2 086 128 2 569 50 2 481 32 3 214 819 09 3 468 915 458 1 532 347 693 240 1 200 211 2 106 135 2 692 53 2 640 35 3 539 816 10 3 584 945 472 1 585 353 706 249 1 247 215 2 150 141 2 824 56 2 797 39 3 854 813 11 3 685 964 482 1 637 357 714 255 1 273 222 2 225 149 2 979 59 2 966 42 4 189 811 12 3 681 958 479 1 633 351 702 254 1 270 225 2 252 154 3 073 62 3 077 44 4 447 809
11 Aug 3 681 976 488 1 628 357 714 254 1 269 220 2 202 147 2 932 58 2 907 41 4 094 812 Sep 3 693 976 488 1 634 359 719 255 1 275 221 2 212 147 2 943 58 2 920 41 4 114 812 Oct 3 691 973 486 1 636 358 716 255 1 274 222 2 216 148 2 955 59 2 934 41 4 132 811 Nov 3 687 966 483 1 638 358 715 255 1 273 222 2 223 148 2 969 59 2 957 42 4 171 811 Dec 3 685 964 482 1 637 357 714 255 1 273 222 2 225 149 2 979 59 2 966 42 4 189 811
12 Jan 3 681 959 481 1 634 352 712 254 1 274 225 2 225 153 2 989 61 2 978 44 4 209 811 Feb 3 680 961 480 1 637 354 707 254 1 268 223 2 229 150 2 996 60 2 984 42 4 228 811 Mar 3 666 958 479 1 627 353 706 254 1 268 222 2 222 150 2 999 60 2 985 42 4 233 811 Apr 3 657 957 479 1 622 351 702 253 1 263 222 2 224 150 3 003 60 2 990 43 4 253 810 May 3 652 958 479 1 618 349 698 252 1 259 222 2 224 150 3 004 60 3 001 43 4 273 810 Jun 3 664 963 481 1 624 349 697 252 1 259 222 2 224 151 3 014 60 3 009 43 4 311 810 Jul 3 674 968 484 1 625 350 701 253 1 263 223 2 232 151 3 022 61 3 026 43 4 337 810 Aug 3 691 969 484 1 634 353 706 254 1 271 225 2 245 152 3 037 61 3 038 44 4 365 809 Sep 3 690 963 481 1 638 353 706 254 1 271 224 2 244 153 3 051 61 3 053 44 4 389 809 Oct 3 681 959 479 1 634 352 704 254 1 271 225 2 245 153 3 055 61 3 059 44 4 398 809 Nov 3 674 956 478 1 631 350 701 253 1 267 225 2 247 153 3 063 61 3 067 44 4 423 809 Dec 3 681 958 479 1 633 351 702 254 1 270 225 2 252 154 3 073 62 3 077 44 4 447 809
13 Jan 3 683 956 478 1 636 351 702 254 1 272 225 2 253 154 3 076 62 3 076 45 4 475 808
BANCO DE ESPAÑA 155 BOLETÍN ESTADÍSTICO, FEBRUARY 2013

BANCO DE ESPAÑA / BOLETÍN ESTADÍSTICO
NOTES TO THE TABLES OF CHAPTER 7
Tables 7.A and 7.B
In designing this balance sheet reconciliation, adjustments have been to the data in the EMU returns to adapt them to those in the
FASE.
a. According to ESA 95, gold and SDRs are the only financial assets for which there are no counterpart liabilities.
b. Monetary analysis requires that coins (which are issued by the State, i.e. they are a liability of the State) should appear under
Banco de España liabilities, so as to be able to calculate cash in circulation. The counter part of this formal entry is under
receivables on the asset side. Here both entries have been eliminated, their presence being meaningless when, as in this case, it
is sought to reflect the financial position of the Banco de España.
c. In ESA 95, holdings of SDRs created by the IMF to increase its members' reserve assets are recorded on the asset side of the
central bank balance sheet. These holdings which, like gold, are negative financial assets (instead of liabilities) of the Rest of the
World, can be used in transactions with the IMF and with other members of the System. In the FASE, allocations of SDRs are not
liabilities vis-à-vis the IMF but a change in the volume of flows of holdings. This is why they have to be deducted from liabilities,
which entails greater 'own funds' for the Banco de España.
d. The figure for banknotes in AF.2 Currency and deposits under the heading "Currency" relates to euro banknotes assigned to
the Banco de España in accordance with its share in ECB paid-in capital. The difference between this amount and the value of the
euro banknotes placed in circulation is recorded as an Intra-Eurosystem asset/liability which is included in the same caption under
the heading "Other deposits".
Table 7.C
a. See notes to table 7.2, columns 6 to 8.
Table 7.1
a. See breakdown in tables 7.3 and 7.4.
b. See breakdown in table 7.5.
c. See breakdown in table 7.11.
Table 7.2
a. See breakdown in tables 7.7 and 7.8.
b. See breakdown in table 7.9.
c. See breakdown in table 7.12.
d. Including, since January 2002, the percentage of all euro banknotes in circulation allocated to the Banco de España under the
accounting system established for the Eurosystem (see note to the summary balance sheet at the end of this bulletin), as well as
unreturned peseta banknotes.
e. From January 2003, only the amount of banknotes allocated by the Eurosystem is included here.
f. From January 2003, only the amount of euro coins is included here.
g. Comprising the notes and coins actually put into circulation by the Banco de España (see tables 7.14 to 7.17).
Table 7.3
a. See breakdown in table 7.4.
Table 7.5
a. See breakdown in table 7.6.
Table 7.7
a. See breakdown in table 7.8.
Table 7.9
a. See breakdown in table 7.10.
Table 7.12
a. Until December 1998 repos are included in column 3 as separate data were not available.
Table 7.13
a. The design of this table follows the IMF’s Special Data Dissemination Standard (SDDS) and is, thus, an alternative to that of
tables 7.1 and 7.2.
Table 7.16
BANCO DE ESPAÑA 156 BOLETÍN ESTADÍSTICO, FEBRUARY 2013

BANCO DE ESPAÑA / BOLETÍN ESTADÍSTICO
a. The euro banknotes distributed by the Banco de España do not coincide with the percentage of the total value of euro
banknotes in circulation that corresponds to the Banco de España under the rules for allocation of banknotes in the Eurosystem
(see table7.2 and the note to the summary balance sheet included at the end of this publication).
b. Since January 2003, this total for euro banknotes, plus the total for euro coins placed in circulation by the Banco de España
(table 7.17, column 1), make up the cash placed in circulation by the Banco de España (table 7.2, column 16). Until December
2002, the cash placed in circulation by the Banco de España is made up of the total for euro banknotes, plus the total for euro
coins placed in circulation, plus unreturned peseta banknotes and coins (table 7.16, column 16 and table 7.17, column 17).
Table 7.17
a. Since January 2003, this total for euro coins, plus the total for banknotes placed in circulation by the Banco de España (table
7.16, column 1) make up the cash placed in circulation by the Banco de España (table 7.2, column 16). Until December 2002, the
cash placed in circulation by the Banco de España is made up of the total for euro banknotes, plus the total for euro coins placed
in circulation, plus unreturned peseta banknotes and coins (table 7.16, column 16 and table 7.17, column 17).
BANCO DE ESPAÑA 157 BOLETÍN ESTADÍSTICO, FEBRUARY 2013


CHAPTER 8 OTHER MONETARY FINANCIAL INSTITUTIONS

BANCO DE ESPAÑA / BOLETÍN ESTADÍSTICO
NOTICE RELATED TO THE CHAPTER 8
Changes made to the series
from June 2005
This chapter includes credit institutions (along with money market funds), although with an alternative presentation to that of Chapter 4. Its tables are based on Rule seventy-one and Annex VII of CBE 4/4004 (to apply IFRS to credit institutions), approved on 22 December 2004, which refer to the EMU statistical requirements. Although the returns have not been changed significantly, they have been affected by the new accounting rules. Accordingly, although these tables continue to be updated, there have been some changes as a consequence of the entry into force of the new Circular. The most relevant are: a) savings accounts, classified until May 2005 as deposits redeemable at notice up to three months (column 12 of Table 8.44 and columns 6 and 12 of Table 8.9, among others), are now included within overnight deposits (column 9 of Table 8.44 and columns 3 and 9 of Table 8.9, among others). This change is reflected in the tables of the interest rates of these instruments (Tables 9 and 15 of Chapter 19 relating to the interest rates of credit institutions); and b) the return to the balance sheet of some of the securitised assets that had been removed from the balance sheet in application of the rules in force until the approval and entry into force of CBE 4/2004. This change has led to an exceptional increase in the amount of credit (column 6 of Table 8.41 and column 6 of Table 8.2, among others) and in time deposits (column 6 of Table 8.42 and column 6 of Table 8.3, among others).
General note: Many columns are broken down in subsequent tables, as indicated at the
foot of each table.
BANCO DE ESPAÑA 160 BOLETÍN ESTADÍSTICO, FEBRUARY 2013

BANCO DE ESPAÑA / BOLETÍN ESTADÍSTICO
BANCO DE ESPAÑA 161 BOLETÍN ESTADÍSTICO, FEBRUARY 2013

EMU’s BALANCE SHEET
FINANCIAL ACCOUNTS
1 2 3 4 5 6 7 8 9 10 11
___________________________________________________________________________________________________________________________
8. OTHER MONETARY FINANCIAL INSTITUTIONS A) Reconciliation between FASE’s financial balance sheet and EMU’s balance sheet
September 2012 data RESIDENTS IN OTHER
DOMESTIC (RESIDENT IN SPAIN) MUMS Securities other
Loans than shares Money Shares Loans markets and instru- other
MFI GG ORS MFI GG ORS ments equity MFI GG ORS
TOTAL ASSETS EMU’s BALANCE SHEET (=I+II) . . . 260 848 120 905 1 717 563 66 495 240 229 225 260 1 168 084 63 935 87 27 480
I. ASSETS not included in FASE . . . . . . . . . . .
Fixed assets. . . . . . . . . . . . . . . . . . . . .
II. OUTSTANDING FINANCIAL ASSETS included in FASE 260 848 120 905 1 717 563 66 495 240 229 225 261 1 168 084 63 935 87 27 480
AF.2 CURRENCY AND DEPOSITS . . . . . . . . . . 260 848 63 935
* By instrument Currency. . . . . . . . . . . . . . . . . . . . . . Other deposits . . . . . . . . . . . . . . . . . . . 260 848 63 935
* By counterpart sector Financial institutions . . . . . . . . . . . . . . . . . 260 848
Monetary financial institutions . . . . . . . . . . . . . 260 848
Non-monetary financial institutions . . . . . . . . . . .
Rest of the world . . . . . . . . . . . . . . . . . . . 63 935
AF.3 SECURITIES OTHER THAN SHARES . . . . . . 66 495 240 229 225 261
* By instrument Short-term securities . . . . . . . . . . . . . . . . 13 352 31 081 2 729 Long-term securities. . . . . . . . . . . . . . . . . 53 143 209 148 222 532 Financial derivates . . . . . . . . . . . . . . . . .
* By counterpart sector Non-financial corporations . . . . . . . . . . . . . . . 10 806
Financial institutions . . . . . . . . . . . . . . . . . 66 495 214 455
Monetary financial institutions . . . . . . . . . . . . . 66 495
Non-monetary financial institutions . . . . . . . . . . . 214 455
General government . . . . . . . . . . . . . . . . . 240 229
Rest of the world . . . . . . . . . . . . . . . . . . .
AF.4 LOANS . . . . . . . . . . . . . . . . . . . . 120 905 1 717 563 87 27 480
* By instrument Short-term loans . . . . . . . . . . . . . . . . . . 225 518 4 508 Long-term loans . . . . . . . . . . . . . . . . . . 1 492 044 87 22 973
* By counterpart sector Non-financial corporations . . . . . . . . . . . . . . . 791 310
Financial institutions . . . . . . . . . . . . . . . . . 97 074
Monetary financial institutions . . . . . . . . . . . . .
Non-monetary financial institutions . . . . . . . . . . . 97 074
General government . . . . . . . . . . . . . . . . . 120 905
Households and non-profit institutions . . . . . . . . . . 829 181
Rest of the world . . . . . . . . . . . . . . . . . . . 87 27 480
BANCO DE ESPAÑA 162 BOLETÍN ESTADÍSTICO, FEBRUARY 2013

12 13 14 15 16 17 18 19 20 21 22 23=1A 22 24=25+26 25 26 27=23+24
___________________________________________________________________________________________________________________________
8A. Assets
EUR millions
RESIDENTS IN OTHER MONETARY FASE’s ADJUSTMENTS UNION MEMBER STATES RESIDENTS IN THE REMAINING ASSETS TOTAL
REST OF THE WORLD FASE Securities other SUB Total Hierar- Valua- than shares Money Shares TOTAL chy ad- tion markets and just- instru- other Loans Securi- Shares Cash Fixed Rest ments MFI GG ORS ments equity ties and assets and other other other than sha- equity res
7 923 15 750 14 047 22 826 147 005 26 439 68 392 6 606 61 552 375 476 3 636 905
61 552 61 552
61 552 61 552
7 923 15 750 14 047 22 826 147 005 26 439 68 392 6 606 375 476 3 575 353 -82 539 -318 938 236 399 3 492 814
103 086 6 606 434 475 1 020 1 020 435 495
*
6 606 6 606 -0 -0 6 606 103 086 427 869 1 020 1 020 428 889
*
6 606 267 454 848 848 268 302
6 606 267 454 848 848 268 302
...
103 086 167 021 172 172 167 193
7 923 15 750 14 047 26 439 596 145 225 525 225 525 821 669
*
41 543 47 745 4 333 4 333 52 078 7 883 15 750 13 505 26 439 548 400 190 047 190 047 738 447 0 31 145 31 145 31 145
*
10 806 5 186 5 186 15 992
280 950 215 108 215 108 496 058
66 495 211 883 211 883 278 378
214 455 3 225 3 225 217 679
240 229 -7 302 -7 302 232 927
7 923 15 750 14 047 26 439 64 159 12 533 12 533 76 693
39 881 1 905 916 -2 362 -2 362 1 903 554
*
18 485 228 402 21 396 1 675 152
*
791 310 -2 -2 791 308
97 074 1 904 1 904 98 978
97 074 1 904 1 904 98 978
120 905 -4 266 -4 266 116 640
829 181 -0 -0 829 181
39 881 67 448 -0 -0 67 448
BANCO DE ESPAÑA 163 BOLETÍN ESTADÍSTICO, FEBRUARY 2013

EMU’s BALANCE SHEET
FINANCIAL ACCOUNTS
1 2 3 4 5 6 7 8 9 10 11
___________________________________________________________________________________________________________________________
8. OTHER MONETARY FINANCIAL INSTITUTIONS (cont.) A) Reconciliation between FASE’s financial balance sheet and EMU’s balance sheet
September 2012 data RESIDENTS IN OTHER
DOMESTIC (RESIDENT IN SPAIN) MUMS Securities other
Loans than shares Money Shares Loans markets and instru- other
MFI GG ORS MFI GG ORS ments equity MFI GG ORS
*I OUTSTANDING FINANCIAL ASSETS included in FASE* (continuation)
AF.5 SHARES AND OTHER EQUITY . . . . . . . . . 1 168 084
* By instrument Quoted shares . . . . . . . . . . . . . . . . . . . Unquoted shares . . . . . . . . . . . . . . . . . . Other equity . . . . . . . . . . . . . . . . . . . . Mutual funds shares. . . . . . . . . . . . . . . . . 1
* By counterpart sector Non-financial corporations . . . . . . . . . . . . . . .
Financial institutions . . . . . . . . . . . . . . . . . 1
Monetary financial institutions. . . . . . . . . . . . . 1 61 940
Non-monetary financial institutions . . . . . . . . . . .
Rest of the world . . . . . . . . . . . . . . . . . . .
AF.7 OTHER ACCOUNTS RECEIVABLE. . . . . . . .
AF.71 Trade credit . . . . . . . . . . . . . . . . . . AF.79 Other accounts receivable excluding trade credits .
BANCO DE ESPAÑA 164 BOLETÍN ESTADÍSTICO, FEBRUARY 2013

12 13 14 15 16 17 18 19 20 21 22 23=1A 22 24=25+26 25 26 27=23+24
___________________________________________________________________________________________________________________________
8A. Assets (cont.)
EUR millions
RESIDENTS IN OTHER MONETARY FASE’s ADJUSTMENTS UNION MEMBER STATES RESIDENTS IN THE REMAINING ASSETS TOTAL
REST OF THE WORLD FASE Securities other SUB Total Hierar- Valua- than shares Money Shares TOTAL chy ad- tion markets and just- instru- other Loans Securi- Shares Cash Fixed Rest ments MFI GG ORS ments equity ties and assets and other other other than sha- equity res
*
22 826 4 038 68 392 263 341 10 874 10 874 274 216
42 016 222 853 7 161 2 186
107 589
61 224
61 941 -12 943 -12 943 48 998
12 226
22 826 4 038 68 392 95 256 10 146 10 146 105 402
375 476 375 476 -317 597 -317 597 57 880
375 476 375 476 -317 597 -317 597 57 880
BANCO DE ESPAÑA 165 BOLETÍN ESTADÍSTICO, FEBRUARY 2013

EMU’s BALANCE SHEET
FINANCIAL ACCOUNTS
1 2 3 4 5 6 7 8
___________________________________________________________________________________________________________________________
8. OTHER MONETARY FINANCIAL INSTITUTIONS A) Reconciliation between FASE’s financial balance sheet and EMU’s balance sheet
September 2012 data
DOMESTIC (RESIDENT IN SPAIN) RESIDENTS IN OTHER MUMS
Deposits Money Deposits Money markets markets fund fund
MFI GG ORS Shares/ MFI GG ORS Shares/ units units
LIABILITIES EMU’s BALANCE SHEET (=I+II) . . . . . . . . . . 608 337 74 069 1 448 536 8 559 143 334 2 289 31 113 81
I. LIABILITIES not included in FASE . . . . . . . . . . . . . .
II. OUTSTANDING LIABILITIES included in FASE . . . . . . . . 608 337 74 069 1 448 536 8 559 143 334 2 289 31 113 81
AF.2 CURRENCY AND DEPOSITS . . . . . . . . . . . . . . . 608 337 74 069 1 448 536 143 334 2 289 31 113
* By instrument Transferable deposits . . . . . . . . . . . . . . . . . . . . . 68 380 467 591 4 360 Other deposits . . . . . . . . . . . . . . . . . . . . . . . . 608 337 5 690 980 945 143 334 2 289 26 753
* By counterpart sector Non-financial corporations . . . . . . . . . . . . . . . . . . . . 180 393
Financial institutions . . . . . . . . . . . . . . . . . . . . . . 608 337 560 479
Monetary financial institutions . . . . . . . . . . . . . . . . . . 608 337
Non-monetary financial institutions . . . . . . . . . . . . . . . . 560 479
General government . . . . . . . . . . . . . . . . . . . . . . 74 069
Households and non-profit institutions . . . . . . . . . . . . . . . 707 664
Rest of the world . . . . . . . . . . . . . . . . . . . . . . . . 143 334 2 289 31 113
AF.3 SECURITIES OTHER THAN SHARES . . . . . . . . . . .
* By instrument Short term securities issued . . . . . . . . . . . . . . . . . . Long term securities issued . . . . . . . . . . . . . . . . . . Financial derivates . . . . . . . . . . . . . . . . . . . . . .
* By counterpart sector Non-financial corporations . . . . . . . . . . . . . . . . . . .
Financial institutions . . . . . . . . . . . . . . . . . . . . . .
Monetary financial institutions. . . . . . . . . . . . . . . . . .
Non-monetary financial institutions . . . . . . . . . . . . . . . .
General government . . . . . . . . . . . . . . . . . . . . . .
Households and non-profit institutions . . . . . . . . . . . . . . .
Rest of the world . . . . . . . . . . . . . . . . . . . . . . . .
AF.4 LOANS . . . . . . . . . . . . . . . . . . . . . . . . . ...
* By instrument Short term loans . . . . . . . . . . . . . . . . . . . . . . . Long term loans . . . . . . . . . . . . . . . . . . . . . . . ...
* By counterpart sector Non-financial corporations . . . . . . . . . . . . . . . . . . .
Financial institutions . . . . . . . . . . . . . . . . . . . . . .
Monetary financial institutions. . . . . . . . . . . . . . . . . .
Non-monetary financial institutions . . . . . . . . . . . . . . . .
General government . . . . . . . . . . . . . . . . . . . . . . ...
Households and non-profit institutions . . . . . . . . . . . . . . .
Rest of the world . . . . . . . . . . . . . . . . . . . . . . . .
BANCO DE ESPAÑA 166 BOLETÍN ESTADÍSTICO, FEBRUARY 2013

9 10 11 12 13 14 15=1a 14 16=17+18 17 18 19=15+16
___________________________________________________________________________________________________________________________
8B. Liabilities
EUR millions FASE’s ADJUSTMENTS RESIDENTS IN THE REMAINING LIABILITIES TOTAL REST OF THE WORLD FASE SUB Total Hierar- Valua- TOTAL chy ad- tion jusments Deposits Money Securi- Money Shares Rest and markets ties markets and other other funds other instru- equity than ments shares
191 678 24 401 167 398 123 329 595 3 636 905
191 678 24 401 167 398 123 329 595 3 636 905 -260 538 -275 194 14 656 3 376 367
191 678 2 499 355 6 346 6 346 2 505 701
* 6 773 547 104 -33 183 -33 183 513 920 184 905 1 952 252 39 529 39 529 1 991 781
* 180 393 0 0 180 393
1 168 816 1 357 1 357 1 170 173
608 337 2 579 2 579 610 916
560 479 -1 222 -1 222 559 257
74 069 4 989 4 989 79 058
707 664 -0 -0 707 664
191 678 368 414 0 0 368 414
401 167 401 167 222 917 222 917 624 084
* 45 754 45 754 45 754 355 413 355 413 194 808 194 808 550 221 0 28 109 28 109 28 109
* 40 206
354 176
296 584
57 592
5 780
40 196
183 726
... 2 058 2 058 2 058
* ... 2 058 2 058 2 058
* 327 327 327
... 1 731 1 731 1 731
BANCO DE ESPAÑA 167 BOLETÍN ESTADÍSTICO, FEBRUARY 2013

EMU’s BALANCE SHEET
FINANCIAL ACCOUNTS
1 2 3 4 5 6 7 8
___________________________________________________________________________________________________________________________
8. OTHER MONETARY FINANCIAL INSTITUTIONS (continuation) A) Reconciliation between FASE’s financial balance sheet and EMU’s balance sheet
September 2012 data
DOMESTIC (RESIDENT IN SPAIN) RESIDENTS IN OTHER MUMS
Deposits Money Deposits Money markets markets fund fund
MFI GG ORS Shares/ MFI GG ORS Shares/ units units
* OUTSTANDING LIABILITIES included in FASE (cont.)
AF. 5 SHARES AND OTHER EQUITY . . . . . . . . . . . . . . 8 559 81
* By instrument Quoted shares . . . . . . . . . . . . . . . . . . . . . . . . Unquoted shares . . . . . . . . . . . . . . . . . . . . . . . Other equity . . . . . . . . . . . . . . . . . . . . . . . . . Mutual funds shares . . . . . . . . . . . . . . . . . . . . . 8 559 81
* By counterpart sector Non-financial corporations . . . . . . . . . . . . . . . . . . .
Financial institutions . . . . . . . . . . . . . . . . . . . . . .
Monetary financial institutions. . . . . . . . . . . . . . . . . .
Non-monetary financial institutions . . . . . . . . . . . . . . . .
General government . . . . . . . . . . . . . . . . . . . . . .
Households and non-profit institutions . . . . . . . . . . . . . . .
Rest of the world . . . . . . . . . . . . . . . . . . . . . . . . 81
AF.6 INSURANCE TECHNICAL RESERVES . . . . . . . . . .
Pension fund reserves held by . . . . . . . . . . . . . . . . . Households and non-profit institutions . . . . . . . . . . . . . . .
AF.7 OTHER ACCOUNTS PAYABLE . . . . . . . . . . . . . .
AF.71 Trade credit . . . . . . . . . . . . . . . . . . . . . . AF.79 Others accounts payable, excluding trade credit . . . . . .
* Memorandum item
Net financial assets . . . . . . . . . . . . . . . . . . . . . . * (FASE’s financial assets minus liabilities)
BANCO DE ESPAÑA 168 BOLETÍN ESTADÍSTICO, FEBRUARY 2013

9 10 11 12 13 14 15=1a 14 16=17+18 17 18 19=15+16
___________________________________________________________________________________________________________________________
8B. Liabilities (cont.)
Eur millions FASE’s ADJUSTMENTS RESIDENTS IN THE REMAINING LIABILITIES TOTAL REST OF THE WORLD FASE SUB Total Hierar- Valua- TOTAL chy ad- tion jusments Deposits Money Securi- Money Shares Rest and markets ties markets and other other funds other instru- equity than ments shares
*
24 398 123 406 788 -208 261 -208 261 198 527
* 398 123 398 123 -278 629 -278 629 119 494 57 514 57 514 57 514 12 850 12 850 12 850 24 8 664 4 4 8 668
* 16 140
55 170
48 998
6 172
3 748
53 358
24 105 70 110
5 723 5 723 5 723
5 723 5 723 5 723 5 723 5 723 5 723
323 872 323 872 -283 598 -283 598 40 274
323 872 323 872 -283 598 -283 598 40 274
*
-61 552 177 999 177 999 116 447 *
BANCO DE ESPAÑA 169 BOLETÍN ESTADÍSTICO, FEBRUARY 2013

ASSETS
27 B. OTHER EURO AREA COUNTRIES
___________________________________________________________________________________________________________________________
Véanse notas al final del capítulo./ See notes at the end of the chapter.
8. OTRAS INSTITUCIONES FINANCIERAS MONETARIAS 8.C Balance. Detalle por instituciones B) Balance agregado de las OIFM según los estados de la zona del euro
Datos referidos a Enero de 2013 Millones de euros
Serie en Otras cuadro y instituciones Entidades FMM (a) columna/ financieras de crédito y EDE Time se- monetarias/ (Cuadro 8.D)/ / ries in Other monetary Credit MMF (a)
table and financial ins- institutions & ELMIs column titutions (Table 8.D)
A=B+C B C
ACTIVO
1 A. RESIDENTES EN ESPAÑA . . . . . . . . . . . 8.2/2 2 703 817 2 697 874 5 943 1 A. DOMESTIC
2 2. Préstamos y créditos . . . . . . . . . . . . . 8.4/2 1 963 520 1 961 329 2 190 2 2. Loans 3 2e. Del cual: euros . . . . . . . . . . . . . . . 8.4/3 1 946 396 1 944 206 2 190 3 2e. Of which: euro 4 IFM . . . . . . . . . . . . . . . . . . . . . . 8.4/4 251 905 249 738 2 166 4 MFIs
5 2e. Del cual: euros . . . . . . . . . . . . . . . 8.4/5 249 649 247 483 2 166 5 2e. Of which: euro 6 Administraciones Públicas . . . . . . . . . . . . . 8.4/6 113 671 113 671 - 6 General government
7 2e. Del cual: euros . . . . . . . . . . . . . . . 8.4/7 113 671 113 671 - 7 2e. Of which: euro 8 Otros residentes . . . . . . . . . . . . . . . . . 8.4/8 1 597 944 1 597 920 24 8 Other resident sectors
9 2e. Del cual: euros . . . . . . . . . . . . . . . 8.4/9 1 583 076 1 583 052 24 9 2e. Of which: euro
10 3. Valores distintos de acciones y participaciones 8.4/10 570 159 566 407 3 752 10 3. Securities other than shares 11 3e. Del cual: euros . . . . . . . . . . . . . . . 8.4/11 565 482 561 730 3 752 11 3e. Of which: euro 12 IFM . . . . . . . . . . . . . . . . . . . . . . 8.5/3 78 425 77 398 1 026 12 MFIs
13 3e. Euros . . . . . . . . . . . . . . . . . . . 8.5/4 78 065 77 038 1 026 13 3e. euro 14 Del cual: hasta dos años . . . . . . . . . . . - 18 069 17 705 364 14 Of which: up to 2 years 15 3x. Monedas distintas del euro. . . . . . . . . . - 360 360 - 15 3x. Non-MU currencies 16 Del cual: hasta dos años . . . . . . . . . . . - - - - 16 Of which: up to 2 years 17 Administraciones Públicas . . . . . . . . . . . . . 8.5/6 250 210 247 756 2 454 17 General government
18 3e. Del cual: euros . . . . . . . . . . . . . . . 8.5/7 250 144 247 691 2 454 18 3e. Of which: euro 19 Otros residentes . . . . . . . . . . . . . . . . . 8.5/8 241 525 241 253 272 19 Other residents
20 3e. Del cual: euros . . . . . . . . . . . . . . . 8.5/9 237 273 237 001 272 20 3e. Of which: euro
21 4. Participaciones en FMM . . . . . . . . . . . 8.4/12 8 7 1 21 4. Money market fund shares/units 22 IFM . . . . . . . . . . . . . . . . . . . . . . - 8 7 1 22 MFIs
23 4e. Del cual: euros . . . . . . . . . . . . . . . - 8 7 1 23 4e. Of which euro
24 5. Acciones y participaciones . . . . . . . . . . 8.4/13 170 130 170 130 - 24 5. Shares and other equity 25 IFM . . . . . . . . . . . . . . . . . . . . . . - 56 620 56 620 - 25 MFIs
26 Otros residentes . . . . . . . . . . . . . . . . . - 113 511 113 511 - 26 Other resident sectors
27 B. RESIDENTES EN OTROS PAISES DE LA ZONA DEL EURO . . . . . . . . . . . . . . . 8.2/3 177 400 176 566 834
28 2. Préstamos y créditos . . . . . . . . . . . . . 8.6/2 87 506 87 506 - 28 2. Loans 29 2e. Del cual: euros . . . . . . . . . . . . . . . 8.6/3 80 369 80 369 - 29 2e. Of which: euro 30 IFM . . . . . . . . . . . . . . . . . . . . . . 8.6/4 57 017 57 017 - 30 MFIs
31 2e. Del cual: euros . . . . . . . . . . . . . . . 8.6/5 53 635 53 635 - 31 2e. Of which: euro 32 Administraciones Públicas . . . . . . . . . . . . . 8.6/6 28 28 - 32 General government
33 2e. Del cual: euros . . . . . . . . . . . . . . . 8.6/7 28 28 - 33 2e. Of which: euro 34 Otros residentes . . . . . . . . . . . . . . . . . 8.6/8 30 460 30 460 - 34 Other resident sectors
35 2e. Del cual: euros . . . . . . . . . . . . . . . 8.6/9 26 706 26 706 - 35 2e. Of which: euro
36 3. Valores distintos de acciones y participaciones 8.6/10 67 078 66 244 834 36 3. Securities other than shares 37 3e. Del cual: euros . . . . . . . . . . . . . . . 8.6/11 65 404 64 574 830 37 3e. Of which: euro 38 IFM . . . . . . . . . . . . . . . . . . . . . . 8.7/3 4 845 4 415 430 38 MFIs
39 3e. Euros . . . . . . . . . . . . . . . . . . . 8.7/4 4 687 4 257 430 39 3e. euro 40 Del cual: hasta dos años . . . . . . . . . . . - 746 664 82 40 Of which: up to 2 years 41 3x. Monedas distintas del euro. . . . . . . . . . - 158 158 - 41 3x. Non-MU currencies 42 Del cual: hasta dos años . . . . . . . . . . . - 84 84 - 42 Of which: up to 2 years 43 Administraciones Públicas . . . . . . . . . . . . . 8.7/6 13 674 13 442 232 43 General government
44 3e. Del cual: euros . . . . . . . . . . . . . . . 8.7/7 13 568 13 340 228 44 3e. Of which: euro 45 Otros residentes . . . . . . . . . . . . . . . . . 8.7/8 48 559 48 386 172 45 Other resident sectors
46 3e. Del cual: euros . . . . . . . . . . . . . . . 8.7/9 47 148 46 977 172 46 3e. Of which: euro
January 2013 data EUR millions
8.C Balance sheet by institutional grouping 8. OTHER MONETARY FINANCIAL INSTITUTIONS B) Aggregated balance sheet according
to the euro area returns
BANCO DE ESPAÑA 170 BOLETÍN ESTADÍSTICO, FEBRUARY 2013

ASSETS (continued)
B. OTHER MUMS (continued)
___________________________________________________________________________________________________________________________
Véanse notas al final del capítulo./ See notes at the end of the chapter.
8. OTRAS INSTITUCIONES FINANCIERAS MONETARIAS 8.C Balance. Detalle por instituciones B) Balance agregado de las OIFM según los estados de la zona del euro
Datos referidos a Enero de 2013 Millones de euros
Serie en Otras cuadro y instituciones Entidades FMM (a) columna/ financieras de crédito y EDE Time se- monetarias/ (Cuadro 8.D)/ / ries in Other monetary Credit MMF (a)
table and financial ins- institutions & ELMIs column titutions (Table 8.D)
A=B+C B C
ACTIVO (continuación)
B. RESIDENTES EN OTROS PAÍSES DE LA ZONA DEL EURO (continuación)
47 4. Participaciones en FMM . . . . . . . . . . . 8.6/12 - - - 47 4. Money market fund shares/units 48 IFM . . . . . . . . . . . . . . . . . . . . . . - - - - 48 MFIs
49 5. Acciones y participaciones . . . . . . . . . . 8.6/13 22 817 22 817 - 49 5. Shares and other equity 50 IFM . . . . . . . . . . . . . . . . . . . . . . - 5 612 5 612 - 50 MFIs
51 Otros residentes . . . . . . . . . . . . . . . . . - 17 204 17 204 - 51 Other residents
52 C. RESTO DEL MUNDO . . . . . . . . . . . . . 8.2/4 233 005 232 767 239 52 C. REST OF THE WORLD
53 2. Préstamos y créditos . . . . . . . . . . . . . 8.12/3 147 685 147 684 2 53 2. Loans 54 2e. Del cual: euros . . . . . . . . . . . . . . . 8.12/4 112 040 112 040 - 54 2e. Of which: euro
55 3. Valores distintos de acciones y participaciones 8.12/5 18 327 18 089 237 55 3. Securities other than shares 56 3e. Del cual: euros . . . . . . . . . . . . . . . 8.12/6 - - - 56 3e. Of which: euro
57 5. Acciones y participaciones . . . . . . . . . . 8.12/7 66 994 66 994 - 57 5. Shares and other equity 58 5e. Del cual: euros . . . . . . . . . . . . . . . - - - - 58 5e. Of which: euro
59 D. SIN CLASIFICAR . . . . . . . . . . . . . . . 8.2/5 396 049 395 963 87 59 D. UNCLASSIFIED
60 1. Efectivo (todas las monedas) . . . . . . . . . 8.2/10 6 558 6 558 - 60 1. Cash (all currencies) 61 1e. Del cual: euros . . . . . . . . . . . . . . . - 6 406 6 406 - 61 1e. Of which: euro
62 6. Activo fijo . . . . . . . . . . . . . . . . . . 8.2/11 53 333 53 332 2 62 6. Fixed assets
63 7. Otros activos . . . . . . . . . . . . . . . . 8.2/12 336 157 336 072 85 63 7. Remaining assets 64 7e. Del cual: euros . . . . . . . . . . . . . . . - - - - 64 7e. Of which: euro
65 TOTAL ACTIVOS . . . . . . . . . . . . . . . . 8.2/1 3 510 272 3 503 169 7 103 65 TOTAL ASSETS
66 e Euros . . . . . . . . . . . . . . . . . . . . 8.2/13 38 - 6 773 66 e Euro 67 e Monedas distintas del euro . . . . . . . . . . 8.2/14 - - 243 67 x Other currencies 68 s/c Sin clasificar por monedas. . . . . . . . . . 8.2/15 389 491 389 404 87 68 n/a Not classified by currencies
January 2013 data EUR millions
8.C Balance sheet by institutional grouping 8. OTHER MONETARY FINANCIAL INSTITUTIONS B) Aggregated balance sheet according
to the euro area returns
BANCO DE ESPAÑA 171 BOLETÍN ESTADÍSTICO, FEBRUARY 2013

LIABILITIES
9 Overnight, up to two years
13 Overnight, up to two years
18 Overnight, up to two years
22 Overnight, up to two years
___________________________________________________________________________________________________________________________
Véanse notas al final del capítulo./ See notes at the end of the chapter.
8. OTRAS INSTITUCIONES FINANCIERAS MONETARIAS 8.C Balance. Detalle por instituciones B) Balance agregado de las OIFM según los estados de la zona del euro
Datos referidos a Enero de 2013 Millones de euros
Serie en Otras cuadro y instituciones Entidades FMM (a) columna/ financieras de crédito y EDE Time se- monetarias/ (Cuadro 8.D)/ / ries in Other monetary Credit MMF (a)
table and financial ins- institutions & ELMIs column titutions (Table 8.D)
A=B+C B C
PASIVO
1 A. RESIDENTES EN ESPAÑA . . . . . . . . . . . 8.3/2 2 051 303 2 044 283 7 020 1 A. DOMESTIC
2 9. Depósitos. . . . . . . . . . . . . . . . . . . 8.8/1 2 044 319 2 044 283 36 2 9. Deposits 3 9e. Del cual: euros . . . . . . . . . . . . . . . 8.8/2 2 011 358 2 011 322 36 3 9e. Of which: euro 4 IFM . . . . . . . . . . . . . . . . . . . . . . 8.8/3 518 304 518 304 - 4 MFIs
5 Entidades de crédito y BE . . . . . . . . . . . 8.8/5 516 897 516 897 - 5 Credit institutions and BE 6 9e. Del cual: euros . . . . . . . . . . . . . . . - 512 990 512 990 - 6 9e. Of which: euro 7 Fondos del mercado monetario . . . . . . . . . 8.8/7 1 407 1 407 - 7 Money market funds 8 9e. En euros . . . . . . . . . . . . . . . . . . - 1 407 1 407 - 8 9e. Of which: euro 9 A la vista, a plazo hasta dos años y dis- ponible con preaviso . . . . . . . . . . . . . - 1 171 1 171 - and redeemable at notice 10 A plazo a más de dos años . . . . . . . . . . - - - - 10 With agreed maturity over two years 11 Cesiones temporales. . . . . . . . . . . . . - 236 236 - 11 Repos 12 9x. En monedas distintas del euro . . . . . . . . - - - - 12 9x. Of which: other currencies 13 A la vista, a plazo hasta dos años y dis- ponible con preaviso . . . . . . . . . . . . . - - - - and redeemable at notice 14 A plazo a más de dos años . . . . . . . . . . - - - - 14 With agreed maturity over two years 15 Cesiones temporales. . . . . . . . . . . . . - - - - 15 Repos
16 Administración Central . . . . . . . . . . . . . . 8.8/8 40 236 40 236 - 16 Central government
17 9e. Depósitos en euros . . . . . . . . . . . . . - 40 212 40 212 - 17 9e. Deposits in euro 18 A la vista, a plazo hasta dos años y dis- ponible con preaviso . . . . . . . . . . . . . - 11 755 11 755 - and redeemable at notice 19 A plazo a más de dos años . . . . . . . . . . - 318 318 - 19 With agreed maturity over two years 20 Cesiones temporales. . . . . . . . . . . . . - 28 139 28 139 - 20 Repos 21 9x. Depósitos en monedas distintas del euro . . . - 24 24 - 21 9x. Deposits in other currencies 22 A la vista, a plazo hasta dos años y dis- ponible con preaviso . . . . . . . . . . . . . - 24 24 - and redeemable at notice 23 A plazo a más de dos años . . . . . . . . . . - - - - 23 With agreed maturity over two years 24 Cesiones temporales. . . . . . . . . . . . . - - - - 24 Repos
25 Otras Administraciones Públicas . . . . . . . . . . 8.8/9 28 432 28 432 - 25 Other general government
26 9e. Depósitos en euros . . . . . . . . . . . . . 8.8/10 28 431 28 431 - 26 9e. Deposits in euro 27 9.1e. A la vista . . . . . . . . . . . . . . . - 22 596 22 596 - 27 9.1e. Overnight 28 9.2e. A plazo . . . . . . . . . . . . . . . . - 5 492 5 492 - 28 9.2e. With agreed maturity 29 Del cual: hasta dos años . . . . . . . . . - 5 176 5 176 - 29 Of which: up to two years 30 9.3e. Con preaviso. . . . . . . . . . . . . . - - - - 30 9.3e. Redeemable at notice 31 9.4e. Cesiones temporales . . . . . . . . . . - 342 342 - 31 9.4e. Repos 32 9x. Depósitos en monedas distintas del euro . . . - 1 1 - 32 9x. Deposits in other currencies 33 9.1x. A la vista . . . . . . . . . . . . . . . - 1 1 - 33 9.1x. Overnight 34 9.2x. A plazo . . . . . . . . . . . . . . . . - - - - 34 9.2x. With agreed maturity 35 Del cual: hasta dos años . . . . . . . . . - - - - 35 Of which: up to two years 36 9.3x. Con preaviso . . . . . . . . . . . . . . - - - - 36 9.3x. Redeemable at notice 37 9.4x. Cesiones temporales . . . . . . . . . . - - - - 37 9.4x. Repos
38 Otros residentes . . . . . . . . . . . . . . . . . 8.9/1 1 457 382 1 457 310 36 38 Other resident sectors
39 9e. Depósitos en euros . . . . . . . . . . . . . 8.9/2 1 428 318 1 428 282 36 39 9e. Deposits in euro 40 9.1e. A la vista . . . . . . . . . . . . . . . 8.9/3 457 264 457 228 36 40 9.1e. Overnight 41 9.2e. A plazo . . . . . . . . . . . . . . . . 8.9/4 914 500 914 500 - 41 9.2e. With agreed maturity 42 Del cual: hasta dos años . . . . . . . . . 8.9/5 463 481 463 481 - 42 Of which: up to two years 43 9.3e. Con preaviso. . . . . . . . . . . . . . 8.9/6 42 42 - 43 9.3e. Redeemable at notice 44 9.4e. Cesiones temporales . . . . . . . . . . 8.9/7 56 512 56 512 - 44 9.4e. Repos 45 9x. Depósitos en monedas distintas del euro . . . 8.9/8 29 028 29 028 - 45 9x. Deposits in other currencies 46 9.1x. A la vista . . . . . . . . . . . . . . . 8.9/9 5 741 5 741 - 46 9.1x. Overnight 47 9.2x. A plazo . . . . . . . . . . . . . . . . 8.9/10 23 287 23 287 - 47 9.2x. With agreed maturity 48 Del cual: hasta dos años . . . . . . . . . 8.9/11 6 994 6 994 - 48 Of which: up to two years 49 9.3x. Con preaviso . . . . . . . . . . . . . . 8.9/12 - - - 49 9.3x. Redeemable at notice 50 9.4x. Cesiones temporales . . . . . . . . . . 8.9/13 - - - 50 9.4x. Repos
51 10. Participaciones de los fondos del merca- do monetario . . . . . . . . . . . . . . . . . 8.91/11 6 984 - 6 984 51 10. Money market fund shares/units
January 2013 data EUR millions
8.C Balance sheet by institutional grouping 8. OTHER MONETARY FINANCIAL INSTITUTIONS B) Aggregated balance sheet according
to the euro area returns
BANCO DE ESPAÑA 172 BOLETÍN ESTADÍSTICO, FEBRUARY 2013

LIABILITIES (continued)
52 B. RESIDENTS IN OTHER EURO AREA
60 Overnight, up to two years
64 Overnight, up to two years
69 Overnight, up to two years
73 Overnight, up to two years
___________________________________________________________________________________________________________________________
Véanse notas al final del capítulo./ See notes at the end of the chapter.
8. OTRAS INSTITUCIONES FINANCIERAS MONETARIAS 8.C Balance. Detalle por instituciones B) Balance agregado de las OIFM según los estados de la zona del euro
Datos referidos a Enero de 2013 Millones de euros
Serie en Otras cuadro y instituciones Entidades FMM (a) columna/ financieras de crédito y EDE Time se- monetarias/ (Cuadro 8.D)/ / ries in Other monetary Credit MMF (a)
table and financial ins- institutions & ELMIs column titutions (Table 8.D) |
A=B+C B C
PASIVO (continuación)
52 B. RESIDENTES EN OTROS PAÍSES DE LA ZONA DEL EURO . . . . . . . . . . . . . . . 8.3/3 172 108 172 066 42 COUNTRIES
53 9. Depósitos . . . . . . . . . . . . . . . . . . 8.10/1 172 066 172 066 - 53 9. Deposits 54 9e. Del cual: euros . . . . . . . . . . . . . . . 8.10/2 159 942 159 942 - 54 9e. Of which: euro 55 IFM . . . . . . . . . . . . . . . . . . . . . . 8.10/3 136 904 136 904 - 55 MFIs 56 Entidades de crédito, BCE y otros bancos centrales nacionales. . . . . . . . . . . . . . 8.10/5 136 900 136 900 - 56 Credit institutions, ECB and others NCBs 57 9e. Del cual: euros . . . . . . . . . . . . . . . - 127 322 127 322 - 57 9e. Of which: euro 58 Fondos del mercado monetario . . . . . . . . 8.10/7 3 3 - 58 Money market funds 59 9e. En euros . . . . . . . . . . . . . . . . . - 3 3 - 59 9e. Of which: euro 60 A la vista, a plazo hasta dos años y dis- ponible con preaviso . . . . . . . . . . . . . - 3 3 - and redeemable at notice 61 A plazo a más de dos años . . . . . . . . . . - - - - 61 With agreed maturity over two years 62 9.4e. Cesiones temporales . . . . . . . . . . - - - - 62 9.4e. Repos 63 9x. En monedas distintas del euro . . . . . . . . - -0 - - 63 9x. Of which: other currencies 64 A la vista, a plazo hasta dos años y dis- ponible con preaviso . . . . . . . . . . . . . - -0 - - and redeemable at notice 65 A plazo a más de dos años . . . . . . . . . . - - - - 65 With agreed maturity over two years 66 9.4x. Cesiones temporales . . . . . . . . . . - - - - 66 9.4x. Repos
67 Administración Central . . . . . . . . . . . . . . 8.10/8 1 062 1 062 - 67 Central government
68 9e. Depósitos en euros . . . . . . . . . . . . . - 1 062 1 062 - 68 9e. Deposits in euro 69 A la vista, a plazo hasta dos años y dis- ponible con preaviso . . . . . . . . . . . . . - 1 062 1 062 - and redeemable at notice 70 A plazo a más de dos años . . . . . . . . . . - - - - 70 With agreed maturity over two years 71 9.4e. Cesiones temporales . . . . . . . . . . - - - - 71 9.4e. Repos 72 9x. Del cual: monedas distintas del euro . . . . . - - - - 72 9x. Of which: other currencies 73 A la vista, a plazo hasta dos años y dis- ponible con preaviso . . . . . . . . . . . . . - - - - and redeemable at notice 74 A plazo a más de dos años . . . . . . . . . . - - - - 74 With agreed maturity over two years 75 9.4x. Cesiones temporales . . . . . . . . . . - - - - 75 9.4x. Repos
76 Otras Administraciones Públicas . . . . . . . . . . 8.10/9 0 0 - 76 Other general government
77 9e. Depósitos en euros . . . . . . . . . . . . . 8.10/10 0 0 - 77 9e. Deposits in euro 78 9.1e. A la vista . . . . . . . . . . . . . . . - 0 0 - 78 9.1e. Overnight 79 9.2e. A plazo . . . . . . . . . . . . . . . . - - - - 79 9.2e. With agreed maturity 80 Del cual: hasta dos años . . . . . . . . . - - - - 80 Of which: up to two years 81 9.3e. Con preaviso. . . . . . . . . . . . . . - - - - 81 9.3e. Redeemable at notice 82 9.4e. Cesiones temporales . . . . . . . . . . - - - - 82 9.4e. Repos 83 9x. Depósitos en monedas distintas del euro . . . - - - - 83 9x. Deposits in other currencies 84 9.1x. A la vista . . . . . . . . . . . . . . . - - - - 84 9.1x. Overnight 85 9.2x. A plazo . . . . . . . . . . . . . . . . - - - - 85 9.2x. With agreed maturity 86 Del cual: hasta dos años . . . . . . . . . - - - - 86 Of which: up to two years 87 9.3x. Con preaviso . . . . . . . . . . . . . . - - - - 87 9.3x. Redeemable at notice 88 9.4x. Cesiones temporales . . . . . . . . . . - - - - 88 9.4x. Repos
89 Otros residentes . . . . . . . . . . . . . . . . . 8.11/1 34 100 34 100 - 89 Other resident sectors
90 9e. Depósitos en euros . . . . . . . . . . . . . 8.11/2 31 554 31 554 - 90 9e. Deposits in euro 91 9.1e. A la vista . . . . . . . . . . . . . . . 8.11/3 3 791 3 791 - 91 9.1e. Overnight 92 9.2e. A plazo . . . . . . . . . . . . . . . . 8.11/4 17 148 17 148 - 92 9.2e. With agreed maturity 93 Del cual: hasta dos años . . . . . . . . . 8.11/5 9 529 9 529 - 93 Of which: up to two years 94 9.3e. Con preaviso. . . . . . . . . . . . . . 8.11/6 345 345 - 94 9.3e. Redeemable at notice 95 9.4e. Cesiones temporales . . . . . . . . . . 8.11/7 10 270 10 270 - 95 9.4e. Repos 96 9x. Depósitos en monedas distintas del euro . . . 8.11/8 2 546 2 546 - 96 9x. Deposits in other currencies 97 9.1x. A la vista . . . . . . . . . . . . . . . 8.11/9 261 261 - 97 9.1x. Overnight 98 9.2x. A plazo . . . . . . . . . . . . . . . . 8.11/10 2 285 2 285 - 98 9.2x. With agreed maturity 99 Del cual: hasta dos años . . . . . . . . . 8.11/11 854 854 - 99 Of which: up to two years 100 9.3x. Con preaviso . . . . . . . . . . . . . 8.11/12 - - - 100 9.3x. Redeemable at notice 101 9.4x. Cesiones temporales . . . . . . . . . . 8.11/13 - - - 101 9.4x. Repos
102 10. Participaciones de los fondos del merca- do monetario . . . . . . . . . . . . . . . . . 8.91/12 42 - 42 102 10. Money market fund shares/units
January 2013 data EUR millions
8.C Balance sheet by institutional grouping 8. OTHER MONETARY FINANCIAL INSTITUTIONS B) Aggregated balance sheet according
to the area euro returns
BANCO DE ESPAÑA 173 BOLETÍN ESTADÍSTICO, FEBRUARY 2013

P
1=2+6 2=3+4+5 3 4 5 6
8. OTHER MONETARY FINANCIAL INSTITUTIONS 8.1 Assets=Liabilities of otherB) Aggregated balance sheet according to the euro area returns MFIs by institutions
See notes at the end of the chapter
EUR millions
OMFIs Credit Deposit-taking SCI Official MMF Total institutuions institutions (d) Credit & (a) (b) (c) Institute ELMIs (e)
07 3 005 279 3 005 279 2 896 225 68 700 40 354 - 08 3 409 444 3 381 189 3 252 295 75 276 53 617 28 255 09 3 446 812 3 433 286 3 314 963 57 121 61 201 13 527 10 3 471 027 3 462 860 3 305 526 55 729 101 602 8 170 11 3 621 168 3 613 113 3 444 607 55 911 112 595 8 057 12 3 581 818 3 574 826 3 394 907 50 928 128 991 7 032
11 Aug 3 551 603 3 543 640 3 383 803 51 638 108 198 7 966 Sep 3 569 262 3 561 372 3 400 736 51 584 109 053 7 894 Oct 3 550 994 3 543 118 3 381 343 51 235 110 540 7 879 Nov 3 545 927 3 538 119 3 376 992 50 686 110 440 7 811 Dec 3 621 168 3 613 113 3 444 607 55 911 112 595 8 057
12 Jan 3 638 239 3 628 635 3 454 515 54 724 119 396 9 606 Feb 3 656 369 3 646 719 3 469 716 54 506 122 497 9 652 Mar 3 733 040 3 723 594 3 524 150 55 107 144 338 9 448 Apr 3 678 163 3 668 729 3 474 205 54 973 139 552 9 437 May 3 730 099 3 720 770 3 532 615 53 728 134 427 9 332 Jun 3 727 992 3 718 993 3 529 089 53 478 136 426 9 003 Jul 3 673 058 3 664 306 3 476 292 52 993 135 021 8 756 Aug 3 630 596 3 621 943 3 435 183 52 439 134 321 8 682 Sep 3 637 247 3 628 566 3 446 116 51 569 130 881 8 723 Oct 3 600 075 3 591 985 3 410 278 50 527 131 180 8 132 Nov 3 590 217 3 582 620 3 406 290 49 834 126 496 7 638 Dec 3 581 818 3 574 826 3 394 907 50 928 128 991 7 032
13 Jan 3 510 232 3 503 169 3 323 221 50 014 129 935 7 103
P
1=2 a 5 2 3 4 5 6 7 8 9 10 11 12 13 14 15
8. OTHER MONETARY FINANCIAL INSTITUTIONS 8.2 Assets: summaryB) Aggregated balance sheet according to the euro area returns
See notes at the end of the chapter
EUR billions By residence By instrument By currencies
Total Domes- Other Rest Not Loans Securi- Money Shares Cash Fixed Remai- Euro Other Unclas- tic euro of the classi- ties market and assets ning curren- sified (a) area world fied by other fund other assets cies coun- (c) residen than shares equity tries ce of shares units (b) issuer (a)
=13 a 15 =6 a 12
07 3 005 2 397 218 199 191 2 302 328 - 184 9 31 152 2 668 155 183 08 3 409 2 701 223 198 287 2 450 500 0 172 9 37 241 2 958 173 278 09 3 447 2 773 212 208 254 2 395 614 0 184 9 45 200 3 042 159 245 10 3 471 2 797 160 214 301 2 404 586 0 180 8 50 243 3 016 162 293 11 3 621 2 847 161 225 388 2 374 606 0 253 7 57 324 3 068 172 381 12 3 582 2 747 173 235 427 2 244 652 0 259 7 53 367 3 014 148 420
11 Aug 3 552 2 823 171 217 340 2 376 589 0 247 7 55 278 ... ... 333 Sep 3 569 2 809 172 218 370 2 364 584 0 252 7 55 308 3 040 166 363 Oct 3 551 2 800 171 218 362 2 358 577 0 254 7 56 299 ... ... 355 Nov 3 546 2 795 162 220 370 2 353 572 0 251 7 56 306 ... ... 363 Dec 3 621 2 847 161 225 388 2 374 606 0 253 7 57 324 3 068 172 381
12 Jan 3 638 2 854 163 225 397 2 352 631 0 259 7 58 332 ... ... 389 Feb 3 656 2 862 172 231 391 2 355 651 0 260 7 58 326 ... ... 384 Mar 3 733 2 934 171 243 385 2 419 671 0 258 7 59 319 3 189 166 378 Apr 3 678 2 869 165 245 399 2 359 660 0 260 7 59 332 ... ... 392 May 3 730 2 865 157 255 453 2 373 645 0 259 7 60 386 ... ... 446 Jun 3 728 2 872 164 258 433 2 405 633 0 257 7 60 366 3 130 171 426 Jul 3 673 2 815 158 253 447 2 368 601 0 258 7 60 380 ... ... 440 Aug 3 631 2 785 154 246 445 2 336 590 0 260 7 61 377 ... ... 438 Sep 3 637 2 799 152 242 444 2 338 596 0 259 7 62 376 3 036 164 437 Oct 3 600 2 781 150 239 430 2 325 587 0 258 7 62 361 ... ... 423 Nov 3 590 2 777 140 236 437 2 321 577 0 255 7 62 369 ... ... 431 Dec 3 582 2 747 173 235 427 2 244 652 0 259 7 53 367 3 014 148 420
13 Jan 3 510 2 704 177 233 396 2 199 656 0 260 7 53 336 ... ... 389
BANCO DE ESPAÑA 174 BOLETÍN ESTADÍSTICO, FEBRUARY 2013

P
1=2 a 5= 2 3 4 5=8 a 10 6 7 8 9 10 11 12 13
8. OTHER MONETARY FINANCIAL INSTITUTIONS 8.3 Liabilities: summaryB) Aggregated balance sheet according to the euro area returns
See notes at the end of the chapter
EUR billions By residence By instrument By currencies
Total Domes- Other Rest Not - Deposits Money Debt Capital Remai- Euro Other Unclas- tic euro of the classi- (e) market securi- and ning (g) curren- sified (a) area world fied by fund ties reserves liabili- cies coun- (c) residen- shares/ issued ties tries ce of units (b) holder (f) (d)
11 a 13 6 a 10 =
07 3 005 1 726 230 212 838 2 168 - 426 206 205 2 384 211 411 08 3 409 2 006 235 270 899 2 483 28 399 242 258 2 677 233 500 09 3 447 2 015 245 263 924 2 510 13 440 270 214 2 743 220 484 10 3 471 2 008 228 284 952 2 511 8 433 283 236 2 793 160 519 11 3 621 2 032 245 249 1 095 2 518 8 435 367 294 2 839 121 661 12 3 582 2 116 160 181 1 125 2 450 7 394 405 325 2 750 101 731
11 Aug 3 552 1 975 269 271 1 036 2 507 8 430 344 263 2 818 127 607 Sep 3 569 1 971 267 272 1 060 2 502 8 425 350 285 2 811 123 635 Oct 3 551 1 962 268 259 1 062 2 481 8 429 353 280 2 801 117 633 Nov 3 546 1 974 256 256 1 060 2 478 8 430 350 280 2 800 116 631 Dec 3 621 2 032 245 249 1 095 2 518 8 435 367 294 2 839 121 661
12 Jan 3 638 2 013 249 243 1 134 2 495 10 445 377 311 2 834 115 689 Feb 3 656 2 060 248 230 1 118 2 529 10 445 379 295 2 865 118 674 Mar 3 733 2 179 227 220 1 107 2 617 9 442 378 287 2 954 114 665 Apr 3 678 2 129 229 215 1 106 2 563 9 432 377 297 2 893 111 674 May 3 730 2 163 214 217 1 135 2 585 9 424 373 339 2 909 109 712 Jun 3 728 2 208 198 211 1 111 2 608 9 411 384 317 2 919 109 701 Jul 3 673 2 156 190 198 1 130 2 534 9 410 385 334 2 844 110 720 Aug 3 631 2 139 176 188 1 128 2 494 9 408 388 331 2 806 105 719 Sep 3 637 2 140 177 192 1 129 2 499 9 401 398 330 2 808 101 728 Oct 3 600 2 119 176 190 1 115 2 477 8 396 398 322 2 771 109 720 Nov 3 590 2 133 160 184 1 113 2 469 8 390 397 327 2 768 99 724 Dec 3 582 2 116 160 181 1 125 2 450 7 394 405 325 2 750 101 731
13 Jan 3 510 2 051 172 182 1 105 2 399 7 391 404 310 2 705 91 714
P
1=2+10+ 2 3 4 5 6 7 8 9 10 11 12 13
8. OTHER MONETARY FINANCIAL INSTITUTIONS 8.4 Assets. DomesticB) Aggregated balance sheet according to the euro area returns
See notes at the end of the chapter
EUR millions Loans Securities other Money Shares than shares market and
Total fund other shares/ equity of which: of which: of which: of which: of which: units Total MFIs General Other Total Euro total Euro govern- Euro resi- Euro Euro ment dent (a) sectors
12+13 (b)
07 2 396 752 2 048 013 2 026 111 246 119 240 165 42 737 42 724 1 759 158 1 743 222 246 953 246 100 - 101 786 08 2 701 028 2 196 279 2 167 001 272 167 267 929 52 772 52 735 1 871 339 1 846 337 411 678 410 800 2 92 732 09 2 773 157 2 158 408 2 137 223 251 958 248 685 64 449 64 428 1 842 001 1 824 110 515 373 513 121 0 99 376 10 2 796 744 2 174 021 2 150 836 238 034 235 006 78 583 78 583 1 857 404 1 837 247 519 573 514 965 0 103 150 11 2 846 761 2 140 167 2 116 934 253 642 250 094 89 285 89 285 1 797 240 1 777 555 543 765 539 092 0 162 829 12 2 747 309 2 013 128 1 994 743 281 117 278 861 114 221 114 221 1 617 790 1 601 661 565 747 560 927 7 168 426
11 Aug 2 823 100 2 146 184 2 124 658 258 066 255 430 86 276 86 276 1 801 843 1 782 952 519 195 515 120 0 157 720 Sep 2 809 047 2 132 183 2 109 581 241 567 238 579 87 404 87 404 1 803 212 1 783 598 513 881 509 615 0 162 983 Oct 2 799 674 2 126 826 2 105 178 246 603 243 720 87 263 87 263 1 792 959 1 774 195 507 294 503 171 0 165 554 Nov 2 795 073 2 124 076 2 102 222 237 036 234 270 87 656 87 656 1 799 385 1 780 296 509 377 505 190 0 161 619 Dec 2 846 761 2 140 167 2 116 934 253 642 250 094 89 285 89 285 1 797 240 1 777 555 543 765 539 092 0 162 829
12 Jan 2 853 866 2 120 630 2 098 616 246 356 243 446 90 454 90 453 1 783 820 1 764 717 565 323 560 637 0 167 912 Feb 2 862 072 2 113 332 2 091 749 245 224 241 922 91 234 91 234 1 776 875 1 758 593 580 227 575 744 0 168 512 Mar 2 934 261 2 167 216 2 146 012 292 769 289 954 92 027 92 027 1 782 420 1 764 032 599 855 595 424 0 167 188 Apr 2 868 981 2 109 954 2 087 935 252 303 249 060 92 768 92 768 1 764 882 1 746 107 591 216 586 616 0 167 810 May 2 864 997 2 119 323 2 096 348 260 164 257 079 104 488 104 488 1 754 672 1 734 782 578 000 573 158 0 167 673 Jun 2 872 452 2 138 189 2 115 493 256 452 252 635 123 230 123 230 1 758 507 1 739 628 568 408 563 680 0 165 854 Jul 2 815 274 2 111 357 2 088 612 257 098 253 576 123 603 123 603 1 730 657 1 711 433 537 464 532 629 0 166 452 Aug 2 785 198 2 091 210 2 069 443 255 396 252 406 121 867 121 867 1 713 947 1 695 171 526 453 521 730 0 167 534 Sep 2 799 323 2 099 316 2 078 114 260 848 257 996 120 905 120 905 1 717 563 1 699 213 531 991 527 000 0 168 015 Oct 2 781 126 2 085 765 2 065 600 260 837 258 174 120 744 120 744 1 704 184 1 686 682 528 477 523 585 3 166 881 Nov 2 776 960 2 085 727 2 066 341 267 876 265 343 119 282 119 282 1 698 569 1 681 715 527 378 522 523 5 163 849 Dec 2 747 309 2 013 128 1 994 743 281 117 278 861 114 221 114 221 1 617 790 1 601 661 565 747 560 927 7 168 426
13 Jan 2 703 779 1 963 482 1 946 358 251 868 249 612 113 671 113 671 1 597 943 1 583 075 570 159 565 482 7 170 130
BANCO DE ESPAÑA 175 BOLETÍN ESTADÍSTICO, FEBRUARY 2013

P
1=3+6+8 2=4+7+9 3 4 5 6 7 8 9
8. OTHER MONETARY FINANCIAL INSTITUTIONS 8.5 Assets. DomesticB) Aggregated balance sheet according to the euro area returns Debt securities
EUR millions
of which: MFIs General government Other resident sectors
Total Euro of which: of which: of which: Total Total Total Euro Up to Euro Euro 2 years
07 246 953 246 100 37 159 36 698 12 098 76 503 76 399 133 291 133 004 08 411 678 410 800 56 945 56 561 23 947 99 594 99 484 255 139 254 755 09 515 373 513 121 72 213 71 482 20 300 151 993 151 860 291 167 289 778 10 519 573 514 965 62 750 62 351 15 241 158 251 158 130 298 572 294 484 11 543 765 539 092 67 188 66 767 18 074 192 994 192 873 283 583 279 452 12 565 747 560 927 76 706 76 326 18 117 243 253 243 196 245 788 241 405
11 Aug 519 195 515 120 62 567 62 172 16 758 168 110 167 974 288 519 284 974 Sep 513 881 509 615 60 930 60 531 15 814 165 902 165 794 287 048 283 290 Oct 507 294 503 171 61 595 61 199 16 733 164 599 164 499 281 100 277 474 Nov 509 377 505 190 60 009 59 630 15 402 165 258 165 171 284 110 280 389 Dec 543 765 539 092 67 188 66 767 18 074 192 994 192 873 283 583 279 452
12 Jan 565 323 560 637 75 292 74 847 18 823 216 169 216 009 273 862 269 781 Feb 580 227 575 744 76 617 76 214 18 732 231 616 231 452 271 994 268 078 Mar 599 855 595 424 75 085 74 687 16 887 249 039 248 949 275 731 271 789 Apr 591 216 586 616 72 405 71 994 15 649 246 514 246 388 272 296 268 234 May 578 000 573 158 68 527 68 110 15 861 241 641 241 512 267 832 263 537 Jun 568 408 563 680 65 956 65 539 16 630 242 493 242 416 259 958 255 726 Jul 537 464 532 629 67 231 66 806 18 229 234 009 233 929 236 223 231 894 Aug 526 453 521 730 68 360 67 939 20 371 229 075 228 996 229 018 224 795 Sep 531 991 527 000 66 501 66 097 18 047 240 229 240 176 225 260 220 728 Oct 528 477 523 585 66 742 66 340 17 810 239 443 239 389 222 292 217 857 Nov 527 378 522 523 66 090 65 710 17 947 245 771 245 716 215 517 211 098 Dec 565 747 560 927 76 706 76 326 18 117 243 253 243 196 245 788 241 405
13 Jan 570 159 565 482 78 425 78 065 18 069 250 210 250 144 241 525 237 273
P
1=2+10+ 2=4+6+8 3=5+7+9 4 5 6 7 8 9 10 11 12 13
8. OTHER MONETARY FINANCIAL INSTITUIONS 8.6 Assets. Other euro area countriesB) Aggregated balance sheet according to the euro area returns
See notes at the end of the chapter
EUR millions Loans Securities other Money Shares than shares market and
Total fund other shares/ equity of which: of which: of which: of which: of which: units Total MFIs General Other Total Euro total Euro govern- Euro resi- Euro (a) Euro ment dent (a) sectors
+12+13
07 217 949 135 668 125 138 114 133 106 791 117 117 21 419 18 230 48 394 45 632 - 33 886 08 223 221 142 492 129 746 116 820 107 507 101 101 25 571 22 138 49 822 47 646 - 30 907 09 212 237 121 066 110 835 94 487 87 659 97 97 26 482 23 080 59 758 58 273 9 31 403 10 159 680 101 261 91 148 75 387 68 760 92 92 25 782 22 296 36 634 35 315 5 21 779 11 161 328 101 406 90 343 73 220 66 354 89 89 28 098 23 901 37 548 35 155 - 22 371 12 172 889 82 514 74 840 55 833 52 057 36 36 26 646 22 748 67 621 65 920 - 22 754
11 Aug 171 318 105 163 94 610 77 827 71 055 90 90 27 246 23 464 43 979 42 402 - 22 176 Sep 172 161 105 408 94 160 77 313 70 227 90 90 28 005 23 844 44 863 43 405 - 21 891 Oct 171 164 104 688 94 556 77 307 71 156 90 90 27 291 23 310 44 593 43 178 - 21 883 Nov 161 528 101 480 91 304 73 651 67 446 89 89 27 739 23 769 38 243 36 150 - 21 805 Dec 161 328 101 406 90 343 73 220 66 354 89 89 28 098 23 901 37 548 35 155 - 22 371
12 Jan 163 177 100 153 89 894 71 906 65 690 87 87 28 159 24 116 40 000 37 565 - 23 022 Feb 172 473 108 177 98 034 78 138 72 019 87 87 29 952 25 928 41 223 38 812 - 23 070 Mar 171 086 105 830 96 149 76 159 70 228 87 87 29 585 25 834 41 861 39 670 - 23 393 Apr 165 315 101 387 91 962 72 706 67 146 73 73 28 608 24 743 40 101 37 932 - 23 825 May 156 926 95 156 85 221 68 451 62 606 90 90 26 615 22 526 38 418 36 352 - 23 350 Jun 163 983 103 743 93 524 70 796 65 299 88 88 32 859 28 137 37 441 35 411 - 22 797 Jul 157 707 98 895 89 097 69 240 64 138 87 87 29 569 24 872 36 258 34 133 - 22 552 Aug 154 063 94 189 84 771 65 752 60 935 129 129 28 309 23 707 37 047 35 036 - 22 825 Sep 152 048 91 502 81 992 63 935 58 968 87 87 27 480 22 937 37 720 35 736 - 22 826 Oct 149 975 91 589 80 581 65 061 58 309 81 81 26 447 22 192 35 600 33 721 - 22 786 Nov 139 636 85 982 78 085 58 749 54 945 80 80 27 152 23 060 30 817 29 298 - 22 837 Dec 172 889 82 514 74 840 55 833 52 057 36 36 26 646 22 748 67 621 65 920 - 22 754
13 Jan 177 400 87 506 80 369 57 017 53 635 28 28 30 460 26 706 67 078 65 404 - 22 817
BANCO DE ESPAÑA 176 BOLETÍN ESTADÍSTICO, FEBRUARY 2013

P
1=3+6+8 2=4+7+9 3 4 5 6 7 8 9
8. OTHER MONETARY FINANCIAL INSTITUTIONS 8.7 Assets. Other euro area countriesB) Aggregated balance sheet according to the euro area returns Debt securities
EUR millions
of which: MFIs General government Other resident sectors
Total Euro of which: of which: of which: Total Total Total Euro Up to Euro Euro 2 years
07 48 394 45 632 14 622 12 435 1 245 17 929 17 891 15 843 15 306 08 49 822 47 646 14 685 13 150 1 690 17 306 17 299 17 830 17 196 09 59 758 58 273 14 340 13 379 1 502 25 908 25 902 19 510 18 992 10 36 634 35 315 10 051 9 265 274 11 923 11 645 14 660 14 406 11 37 548 35 155 8 208 7 481 318 12 173 11 994 17 167 15 680 12 67 621 65 920 4 851 4 689 851 13 619 13 510 49 151 47 721
11 Aug 43 979 42 402 8 463 7 733 209 14 091 13 846 21 425 20 822 Sep 44 863 43 405 8 372 7 658 290 13 729 13 524 22 761 22 223 Oct 44 593 43 178 8 418 7 708 339 13 558 13 374 22 617 22 096 Nov 38 243 36 150 8 033 7 288 365 12 631 12 457 17 579 16 405 Dec 37 548 35 155 8 208 7 481 318 12 173 11 994 17 167 15 680
12 Jan 40 000 37 565 8 499 7 777 509 13 744 13 457 17 757 16 332 Feb 41 223 38 812 8 886 8 173 719 14 942 14 667 17 395 15 971 Mar 41 861 39 670 9 322 8 603 1 154 15 553 15 455 16 986 15 612 Apr 40 101 37 932 8 804 8 071 1 077 14 936 14 835 16 361 15 026 May 38 418 36 352 8 277 7 603 733 14 894 14 787 15 247 13 962 Jun 37 441 35 411 8 071 7 403 738 14 074 13 971 15 296 14 037 Jul 36 258 34 133 7 960 7 378 716 13 310 13 205 14 987 13 550 Aug 37 047 35 036 7 897 7 345 715 14 951 14 848 14 198 12 843 Sep 37 720 35 736 7 923 7 361 724 15 750 15 640 14 047 12 735 Oct 35 600 33 721 7 546 7 051 799 14 355 14 246 13 698 12 424 Nov 30 817 29 298 4 760 4 595 824 14 074 13 964 11 984 10 739 Dec 67 621 65 920 4 851 4 689 851 13 619 13 510 49 151 47 721
13 Jan 67 078 65 404 4 845 4 687 831 13 674 13 568 48 559 47 148
P
1=3+7+8+ 2 3=5+7 4 5 6 7 8 +12+13=9 10 11 12 13 14 15
8. OTHER MONETARY FINANCIAL INSTITUIONS 8.8 Liabilities. Domestic deposits by sectors, with depositsB) Aggregated balance sheet according to the euro area returns of other general government by instrument
See notes at the end of the chapter
EUR millions Other general government
of which By sector By instruments deposits
Total Euro MFIs General government (a) Other of which Other resi- Over- With dent night agreed of which Credit of wich Money of which sectors matu - Up to institu- market Central Other (b) rity 2 years tions funds govern- general Total Euro subject with a- ment govern- Euro to reser greed ma- ment ve requi turity up rements to 2 ye-
+10 and BE ars +15
07 1 726 062 1 674 194 268 658 260 651 268 638 153 901 19 26 730 48 489 48 486 1 382 185 38 975 7 356 7 226 2 158 08 1 977 713 1 928 322 321 442 308 839 314 960 194 584 6 482 35 668 40 386 40 385 1 580 218 32 464 6 567 6 335 1 355 09 2 001 735 1 963 765 308 169 303 312 304 928 185 728 3 241 44 130 37 675 37 673 1 611 760 30 518 5 491 5 368 1 666 10 1 999 632 1 966 297 272 116 269 565 269 665 134 998 2 451 45 458 33 622 33 620 1 648 437 26 889 5 504 5 375 1 228 11 2 024 193 1 989 247 373 858 367 028 372 485 168 399 1 373 45 738 23 979 23 974 1 580 619 19 252 4 042 3 862 685 12 2 109 052 2 074 695 574 312 570 185 572 845 125 807 1 467 42 574 26 609 26 608 1 465 593 21 537 4 660 4 359 412
11 Aug 1 967 072 1 936 922 302 756 300 521 300 850 151 493 1 905 34 704 25 990 25 986 1 603 623 20 569 4 876 4 696 545 Sep 1 963 381 1 932 643 291 618 289 295 290 121 149 690 1 497 45 294 25 449 25 445 1 601 019 20 011 4 848 4 673 590 Oct 1 953 865 1 925 476 314 712 312 392 313 284 164 519 1 428 40 615 26 185 26 179 1 572 354 20 675 4 897 4 719 612 Nov 1 966 397 1 937 306 321 008 318 786 319 690 173 471 1 318 44 872 30 447 30 443 1 570 071 24 942 4 881 4 689 624 Dec 2 024 193 1 989 247 373 858 367 028 372 485 168 399 1 373 45 738 23 979 23 974 1 580 619 19 252 4 042 3 862 685
12 Jan 2 003 373 1 968 897 376 704 370 209 375 268 168 205 1 436 51 840 23 701 23 699 1 551 128 19 077 4 204 4 031 421 Feb 2 050 810 2 016 902 424 374 417 934 421 838 212 215 2 536 51 377 24 136 24 134 1 550 923 19 446 4 329 4 153 361 Mar 2 169 646 2 140 296 530 617 527 452 528 929 107 567 1 688 48 884 25 368 25 366 1 564 776 20 502 4 518 4 342 348 Apr 2 119 692 2 090 395 523 122 520 427 521 424 103 591 1 698 42 739 24 937 24 935 1 528 894 20 231 4 439 4 247 266 May 2 153 986 2 124 113 556 664 554 412 555 102 119 068 1 562 53 754 26 397 26 396 1 517 172 21 275 4 818 4 624 305 Jun 2 198 765 2 165 885 616 049 610 369 614 665 148 047 1 385 39 792 28 797 28 796 1 514 127 23 529 4 888 4 693 380 Jul 2 146 952 2 109 179 636 834 626 828 635 466 164 623 1 368 36 191 25 751 25 749 1 448 176 20 417 5 121 4 921 212 Aug 2 130 908 2 094 175 641 346 631 864 639 974 175 024 1 372 31 182 24 297 24 295 1 434 111 18 808 5 227 5 039 262 Sep 2 130 943 2 097 321 608 339 602 391 606 889 157 231 1 449 48 686 25 384 25 382 1 448 575 19 694 5 445 5 261 245 Oct 2 111 193 2 073 681 595 269 588 058 593 678 147 945 1 591 41 178 27 738 27 737 1 447 046 21 900 5 520 5 331 318 Nov 2 125 622 2 088 597 591 820 585 210 590 261 149 292 1 559 47 381 27 687 27 686 1 458 772 21 760 5 660 5 448 267 Dec 2 109 052 2 074 695 574 312 570 185 572 845 125 807 1 467 42 574 26 609 26 608 1 465 593 21 537 4 660 4 359 412
13 Jan 2 044 283 2 011 322 518 304 514 397 516 897 126 797 1 407 40 236 28 432 28 431 1 457 346 22 597 5 492 5 176 342
BANCO DE ESPAÑA 177 BOLETÍN ESTADÍSTICO, FEBRUARY 2013

P
1=2+8 2=3+4+6+7 3 4 5 6 7 8=9+10+ 9 10 11 12 13
8. OTHER MONETARY FINANCIAL INSTITUTIONS 8.9 Liabilities. Domestic deposits:B) Aggregated balance sheet according to the euro area returns other resident sectors
EUR millions
Total Deposits in euro Deposits in other currencies Total Over- of which: Rede- Repos Total Over- of which: Rede- Repos night emable night emable With at With at agreed Up to notice agreed up to notice maturity 2 years maturity 2 years +12+13
07 1 382 185 1 338 341 438 038 814 692 352 706 19 85 592 43 844 4 217 39 612 9 129 - 14 08 1 580 218 1 543 445 423 739 1 039 696 500 488 20 79 991 36 773 4 312 32 460 9 098 - - 09 1 611 760 1 578 664 470 154 1 041 390 476 500 26 67 095 33 096 4 168 28 927 9 162 - - 10 1 648 437 1 617 665 472 720 1 075 156 477 373 37 69 752 30 772 4 742 26 030 8 751 - - 11 1 580 619 1 552 522 472 450 1 019 797 442 651 45 60 229 28 097 5 482 22 615 6 416 - - 12 1 465 593 1 435 357 463 947 911 573 457 667 42 59 796 30 200 5 910 24 291 7 140 - -
11 Aug 1 603 623 1 575 723 465 199 1 053 216 462 187 44 57 264 27 900 5 296 22 604 7 794 - - Sep 1 601 019 1 572 620 461 657 1 050 362 460 537 44 60 557 28 399 5 351 23 048 7 513 - - Oct 1 572 354 1 546 302 455 433 1 035 277 453 235 44 55 548 26 052 5 171 20 881 5 738 - - Nov 1 570 071 1 543 217 462 659 1 026 080 444 719 45 54 434 26 854 5 385 21 469 6 120 - - Dec 1 580 619 1 552 522 472 450 1 019 797 442 651 45 60 229 28 097 5 482 22 615 6 416 - -
12 Jan 1 551 128 1 523 166 458 710 1 006 560 441 103 45 57 851 27 962 5 406 22 556 6 523 - - Feb 1 550 923 1 523 476 457 650 1 002 268 450 320 46 63 511 27 447 5 440 22 007 6 396 - - Mar 1 564 776 1 538 621 466 589 1 002 833 449 677 46 69 153 26 155 5 372 20 784 5 455 - - Apr 1 528 894 1 502 319 458 212 987 936 443 923 46 56 125 26 574 5 514 21 060 5 301 - - May 1 517 172 1 489 574 464 103 969 381 433 947 45 56 045 27 597 5 610 21 987 5 517 - - Jun 1 514 127 1 486 955 481 529 944 150 426 107 45 61 231 27 172 5 604 21 567 5 252 - - Jul 1 448 176 1 420 439 462 783 905 511 414 907 44 52 101 27 737 5 619 22 118 5 295 - - Aug 1 434 111 1 406 861 462 383 897 380 412 017 43 47 055 27 223 5 528 21 695 5 053 - - Sep 1 448 575 1 420 892 461 693 900 528 418 021 42 58 629 27 644 5 898 21 746 5 373 - - Oct 1 447 046 1 416 734 453 972 903 260 429 209 42 59 460 30 274 5 497 24 776 7 142 - - Nov 1 458 772 1 428 345 458 986 910 004 441 944 42 59 313 30 389 5 641 24 747 7 305 - - Dec 1 465 593 1 435 357 463 947 911 573 457 667 42 59 796 30 200 5 910 24 291 7 140 - -
13 Jan 1 457 346 1 428 282 457 228 914 500 463 481 42 56 512 29 028 5 741 23 287 6 994 - -
P
1=3+8+9 2 3=5+6 4 5 6 7 8 13+12=9 10 11 12 13 14 15 16
8. OTHER MONETARY FINANCIAL INSTITUTIONS 8.10 Liabilities. Deposits of other euro area countries by sector,B) Aggregated balance sheet according to the euro area returns with deposits of other general government by instrument
See notes at the end of the chapter
EUR millions Other general government.
of which By sector By instruments deposits.
Total Euro MFIs General government Other of which Rede- Repos resi- Over- Whit emable dent night agreed at of which Credit of wich Money of which sectors matu- Up to notice institu- market Central Other (a) rity 2 tions funds govern- general years Total Euro subject Up to ment govern- Euro to reser 2 years ment ve requi rements
+11 and NCB +15+16
07 230 094 212 506 196 999 180 629 196 999 112 975 - 2 0 0 33 093 0 - - - - 08 235 055 213 205 198 691 178 943 198 691 117 979 - 4 0 0 36 360 0 - - - - 09 245 229 226 830 208 636 192 548 208 636 115 647 - 2 0 0 36 591 0 - - - - 10 228 197 210 696 180 064 166 401 180 064 100 011 - 3 0 0 48 131 0 - - - - 11 244 812 231 052 169 798 159 031 169 797 85 760 1 203 0 0 74 812 0 - - - - 12 160 343 147 512 126 579 116 350 126 579 63 621 0 4 288 0 0 29 476 0 - - - -
11 Aug 269 317 250 592 186 493 171 415 186 486 98 037 8 504 0 0 82 319 0 - - - - Sep 266 625 249 339 176 089 162 401 176 088 92 233 2 243 0 0 90 292 0 - - - - Oct 268 016 252 559 175 275 163 263 175 270 93 128 5 253 0 0 92 489 0 - - - - Nov 255 565 240 760 172 744 161 370 172 735 92 343 9 203 0 0 82 618 0 - - - - Dec 244 812 231 052 169 798 159 031 169 797 85 760 1 203 0 0 74 812 0 - - - -
12 Jan 248 454 233 506 164 455 152 616 164 450 90 072 5 133 0 0 83 866 0 - - - - Feb 248 220 232 310 170 149 157 989 170 141 89 614 8 103 0 0 77 968 0 - - - - Mar 227 184 210 804 157 576 145 062 157 576 81 446 1 3 578 0 0 66 030 0 - - - - Apr 228 480 211 218 155 507 142 215 155 502 81 977 5 2 192 0 0 70 781 0 - - - - May 214 147 199 844 164 033 152 920 164 024 74 223 9 2 229 0 0 47 884 0 - - - - Jun 197 873 185 112 155 716 145 675 155 716 66 313 0 2 233 0 0 39 924 0 - - - - Jul 189 448 177 819 151 910 143 193 151 910 68 224 0 2 267 0 0 35 271 0 - - - - Aug 175 502 162 854 141 349 131 347 141 345 64 973 4 944 0 0 33 209 0 - - - - Sep 176 736 164 358 143 334 133 458 143 326 64 663 8 2 289 0 0 31 113 0 - - - - Oct 175 504 163 140 143 557 133 850 143 546 63 386 11 2 274 0 0 29 673 0 - - - - Nov 159 675 148 157 126 168 117 545 126 154 64 184 14 2 284 0 0 31 223 0 - - - - Dec 160 343 147 512 126 579 116 350 126 579 63 621 0 4 288 0 0 29 476 0 - - - -
13 Jan 172 066 159 942 136 904 127 325 136 900 64 021 3 1 062 0 0 34 100 0 - - - -
BANCO DE ESPAÑA 178 BOLETÍN ESTADÍSTICO, FEBRUARY 2013

P
1=2+8 2=3+4+ 3 4 5 6 7 8=9+10+ 9 10 11 12 13
8. OTHER MONETARY FINANCIAL INSTITUTIONS 8.11 Liabilities. Deposit of other euro area countries:B) Aggregated balance sheet according to the euro area returns other resident sectors
EUR millions Deposits in euro Deposits in other currencies
Total Total Over- of which: Rede- Repos Total Over- of which: Rede- Repos night emable night emable With at With at agreed Up to notice agreed Up to notice maturity 2 years maturity 2 years +6+7 +12+13
07 33 093 31 875 3 900 27 090 12 273 601 284 1 218 165 1 053 914 - - 08 36 360 34 259 3 533 29 788 17 159 554 384 2 101 253 1 848 1 779 - - 09 36 591 34 280 4 183 28 472 14 739 363 1 261 2 311 234 2 078 1 889 - - 10 48 131 44 293 4 736 29 001 21 129 301 10 255 3 838 272 3 566 2 794 - - 11 74 812 71 818 4 879 26 100 16 589 270 40 568 2 994 344 2 650 1 654 - - 12 29 476 26 874 3 634 18 128 9 092 345 4 768 2 602 232 2 370 900 - -
11 Aug 82 319 78 723 5 427 32 436 19 531 248 40 612 3 596 368 3 228 2 481 - - Sep 90 292 86 694 5 342 33 049 17 625 240 48 064 3 598 384 3 214 2 415 - - Oct 92 489 89 043 5 232 31 707 16 468 250 51 855 3 445 303 3 121 2 344 - 21 Nov 82 618 79 187 5 205 25 963 15 917 260 47 759 3 431 351 3 080 2 289 - - Dec 74 812 71 818 4 879 26 100 16 589 270 40 568 2 994 344 2 650 1 654 - -
12 Jan 83 866 80 757 4 579 26 278 16 551 278 49 622 3 109 418 2 691 1 669 - - Feb 77 968 74 218 4 514 28 320 15 637 285 41 098 3 750 384 3 366 2 357 - - Mar 66 030 62 163 4 624 26 246 14 407 293 31 001 3 867 337 3 530 2 510 - - Apr 70 781 66 910 4 297 24 991 13 798 308 37 314 3 871 330 3 542 2 512 - - May 47 884 44 695 4 489 20 948 9 923 324 18 933 3 189 223 2 967 1 655 - - Jun 39 924 37 204 4 399 18 438 7 758 339 14 028 2 721 216 2 504 1 219 - - Jul 35 271 32 360 4 095 18 882 8 037 347 9 035 2 912 210 2 701 1 370 - - Aug 33 209 30 568 3 938 18 534 7 732 354 7 742 2 641 225 2 416 1 119 - - Sep 31 113 28 611 4 173 18 081 8 021 362 5 996 2 502 187 2 315 1 062 - - Oct 29 673 27 016 3 975 17 698 7 838 356 4 987 2 657 299 2 358 1 109 - - Nov 31 223 28 328 3 851 18 590 9 476 351 5 536 2 895 487 2 408 1 127 - - Dec 29 476 26 874 3 634 18 128 9 092 345 4 768 2 602 232 2 370 900 - -
13 Jan 34 100 31 554 3 791 17 148 9 529 345 10 270 2 546 261 2 285 854 - -
P
1=3+8+10 2 3 4 5 6 7 8 9 10
8. OTHER MONETARY FINANCIAL INSTITUTIONS 8.12 Assets. Rest of the worldB) Aggregated balance sheet according to the euro area returns
EUR millions Securities other Shares
of which Loans than shares and other
Total equity Euro of which Credit General Other of which Total Institu- Gover- resident Total tions ment sectors Euro Euro
07 199 267 81 167 118 803 69 640 81 950 1 754 35 099 32 549 11 527 47 915 08 198 170 71 270 111 111 53 755 75 076 1 619 34 416 38 279 17 514 48 780 09 207 729 83 902 115 542 67 759 79 095 1 787 34 661 38 924 16 142 53 262 10 213 888 91 050 128 334 80 553 87 354 2 047 38 933 30 011 10 497 55 543 11 224 812 94 433 132 661 86 044 90 987 1 923 39 751 24 370 8 389 67 781 12 234 626 119 342 148 586 110 880 110 173 1 903 36 508 18 586 8 462 67 455
11 Aug 217 121 ... 124 876 85 731 85 866 1 788 37 222 25 601 ... 66 644 Sep 218 269 91 758 126 573 83 363 86 919 1 820 37 835 24 956 8 395 66 740 Oct 218 217 ... 126 255 84 760 86 917 1 818 37 520 25 109 ... 66 854 Nov 219 792 ... 127 822 84 947 87 140 1 873 38 808 24 707 ... 67 263 Dec 224 812 94 433 132 661 86 044 90 987 1 923 39 751 24 370 8 389 67 781
12 Jan 224 656 ... 130 934 87 210 92 622 1 884 36 429 25 448 ... 68 273 Feb 230 703 ... 133 209 90 618 94 031 1 864 37 314 29 051 ... 68 443 Mar 242 859 115 121 145 969 102 230 106 884 1 870 37 216 29 113 12 890 67 776 Apr 245 176 ... 148 048 103 961 110 509 1 977 35 541 28 995 ... 68 133 May 255 303 ... 158 493 110 274 115 886 1 986 40 620 28 677 ... 68 133 Jun 258 396 127 172 162 831 116 331 114 408 1 960 46 461 27 452 10 841 68 112 Jul 253 204 ... 157 463 112 331 113 553 2 001 41 908 27 057 ... 68 685 Aug 246 403 ... 150 979 108 742 110 701 1 968 38 309 26 229 ... 69 195 Sep 241 837 116 001 147 005 104 822 107 123 1 933 37 948 26 439 11 179 68 392 Oct 239 352 ... 148 018 107 645 107 667 1 955 38 388 23 067 ... 68 267 Nov 236 294 ... 149 518 109 582 110 248 1 980 37 289 18 580 ... 68 196 Dec 234 626 119 342 148 586 110 880 110 173 1 903 36 508 18 586 8 462 67 455
13 Jan 233 005 ... 147 685 112 040 110 142 1 883 35 658 18 327 ... 66 994
BANCO DE ESPAÑA 179 BOLETÍN ESTADÍSTICO, FEBRUARY 2013

P
1=3+5 2 3 4 5 6 7 8 9 10 11 12 13 14 15
8. OTHER MONETARY FINANCIAL INSTITUTIONS 8.13 Liabilities. Rest of the worldB) Aggregated balance sheet according to the euro area returns and not allocated
See notes at the end of the chapter
EUR millions Not allocated (liabilities excluding deposits
Rest of the world. Deposits and money market fund shares/units)
of which Credit Instituions General Other of which Gover- resi-
Total ment dent Total Euro Total Over- With Over Repos sectors Euro Up to Securities other Total night agreed 2 years 2 years than shares liabi- maturi- (a) lities ty of which Total Euro
07 211 596 101 771 151 238 26 318 105 007 7 471 12 442 16 559 43 799 837 527 395 035 116 608 426 416 395 035 204 823 08 269 780 137 986 213 042 24 335 164 052 12 971 11 684 556 56 182 898 676 397 339 85 595 398 626 369 120 257 603 09 262 538 129 976 210 141 24 430 153 427 21 438 10 846 449 51 948 923 824 422 021 68 098 439 877 408 535 214 158 10 283 486 204 053 170 219 17 326 116 374 13 798 22 720 927 112 341 951 557 411 498 36 236 432 892 403 344 236 136 11 248 674 197 817 142 981 10 922 67 850 42 559 21 650 765 104 928 1 095 455 421 180 53 700 434 512 413 144 293 802 12 180 527 140 197 130 556 7 595 59 504 50 341 13 116 132 49 838 1 124 921 387 571 67 471 394 300 380 592 325 445
11 Aug 270 926 216 301 157 779 12 128 81 260 40 946 23 445 1 256 111 891 1 036 339 414 467 35 451 429 571 406 519 262 722 Sep 271 854 220 532 154 032 13 416 75 996 41 659 22 962 934 116 888 1 059 531 408 834 33 524 424 836 400 962 284 638 Oct 259 168 208 930 151 747 11 816 76 798 41 408 21 725 982 106 439 1 062 091 413 581 40 722 428 984 405 728 280 083 Nov 255 920 207 075 146 277 11 277 72 000 41 432 21 568 781 108 862 1 060 263 414 462 44 335 429 546 406 679 280 400 Dec 248 674 197 817 142 981 10 922 67 850 42 559 21 650 765 104 928 1 095 455 421 180 53 700 434 512 413 144 293 802
12 Jan 243 126 198 220 143 212 12 100 65 084 45 577 20 451 954 98 960 1 133 710 433 821 58 382 445 178 424 242 311 433 Feb 229 597 182 383 140 699 11 496 67 447 45 231 16 525 880 88 018 1 118 148 433 419 65 195 444 528 423 823 295 058 Mar 219 894 172 046 138 669 11 426 65 894 46 146 15 204 1 105 80 120 1 106 904 430 939 71 133 441 952 421 526 287 122 Apr 214 802 170 337 139 596 12 092 65 816 46 667 15 021 999 74 206 1 105 792 421 326 71 632 432 179 411 926 296 717 May 217 239 172 378 142 366 11 561 61 696 50 766 18 343 484 74 390 1 135 436 412 771 73 825 423 927 403 477 338 786 Jun 211 052 166 504 141 594 13 708 61 578 51 632 14 676 380 69 078 1 111 344 401 121 75 323 410 702 392 161 316 920 Jul 197 840 155 145 139 933 13 157 57 096 52 367 17 313 313 57 595 1 130 090 401 658 79 316 410 460 392 925 334 486 Aug 187 785 149 029 130 945 11 332 54 434 51 882 13 297 256 56 584 1 127 764 400 299 78 523 408 392 391 660 331 185 Sep 191 678 151 449 132 051 12 441 55 282 51 102 13 226 208 59 418 1 129 228 394 672 75 794 401 167 386 007 329 970 Oct 189 817 145 026 134 555 15 063 56 208 50 608 12 676 172 55 090 1 115 492 389 572 72 202 395 504 381 499 322 221 Nov 184 149 147 660 129 519 8 039 60 328 48 300 12 852 168 54 462 1 113 196 383 169 70 395 389 551 375 592 326 661 Dec 180 527 140 197 130 556 7 595 59 504 50 341 13 116 132 49 838 1 124 921 387 571 67 471 394 300 380 592 325 445
13 Jan 182 221 149 246 132 200 7 116 55 829 50 591 18 664 111 49 909 1 104 622 384 899 60 364 390 689 377 854 309 952
P
1=2+6 2=3+4+5 3 4 5 6 7=8+12 8=9+10+11 9 10 11 12
8. OTHER MONETARY FINANCIAL INSTITUTIONS 8.21 Loans to/deposits held by general governmentC) Breakdown of assets and liabilities from/with other MFIs, by sub-sector
See notes at the end of the chapter
EUR Millions
Loans Deposits
OMFIs Credit Deposit- SCI OCI MMF OMFIs Credit Deposit- SCI OCI MMF Total insti- taking & Total insti- taking & (a) tutions insti- ELMIs (a) tutions insti- ELMIs tutions tutions
07 42 737 42 737 38 676 2 975 1 086 - 75 220 75 220 74 471 8 741 ... 08 52 772 52 772 47 565 3 875 1 332 - 76 054 76 054 75 058 10 986 ... 09 64 449 64 449 61 016 1 759 1 674 - 81 805 81 805 77 873 13 3 919 - 10 78 583 78 583 74 116 2 167 2 300 - 79 080 79 080 75 287 15 3 778 0 11 89 285 89 285 82 593 1 912 4 780 - 69 717 69 717 66 470 13 3 234 0 12 114 221 114 221 96 840 1 308 16 072 - 69 183 69 182 67 341 9 1 832 36
11 Aug 86 276 86 276 82 095 1 764 2 417 - 60 694 60 694 57 232 14 3 448 1 Sep 87 404 87 404 83 144 1 863 2 397 - 70 743 70 743 67 206 13 3 525 1 Oct 87 263 87 263 82 398 1 897 2 968 - 66 799 66 799 63 306 13 3 480 1 Nov 87 656 87 656 82 193 1 853 3 610 - 75 319 75 319 71 900 13 3 406 1 Dec 89 285 89 285 82 593 1 912 4 780 - 69 717 69 717 66 470 13 3 234 0
12 Jan 90 454 90 454 84 063 1 609 4 781 - 75 541 75 541 72 266 12 3 263 0 Feb 91 234 91 234 84 363 1 563 5 309 - 75 513 75 513 71 906 12 3 595 0 Mar 92 027 92 027 85 113 1 553 5 361 - 74 253 74 253 71 444 12 2 797 0 Apr 92 768 92 768 84 552 1 818 6 398 - 67 676 67 676 65 234 10 2 431 0 May 104 488 104 488 91 662 1 826 11 000 - 80 151 80 151 77 943 9 2 198 0 Jun 123 230 123 230 105 980 1 604 15 645 - 68 590 68 590 66 662 8 1 920 0 Jul 123 603 123 603 105 979 1 423 16 200 - 61 941 61 941 60 019 8 1 915 0 Aug 121 867 121 867 104 286 1 370 16 211 - 55 478 55 478 53 543 8 1 928 27 Sep 120 905 120 905 103 363 1 344 16 198 - 74 069 74 069 72 284 7 1 778 40 Oct 120 744 120 744 103 230 1 342 16 172 - 68 916 68 339 66 268 8 2 063 38 Nov 119 282 119 282 101 745 1 307 16 231 - 75 068 75 061 72 964 9 2 088 37 Dec 114 221 114 221 96 840 1 308 16 072 - 69 183 69 182 67 341 9 1 832 36
13 Jan 113 671 113 671 96 978 950 15 743 - 68 668 68 668 66 622 9 2 037 36
BANCO DE ESPAÑA 180 BOLETÍN ESTADÍSTICO, FEBRUARY 2013

P
1=2+6 2=3+4+5 3 4 5 6 7=8+12 8=9+10+11 9 10 11 12
8. OTHER MONETARY FINANCIAL INSTITUTIONS 8.22 Loans to/deposits held by other resident sectorsC) Breakdown of assets and liabilities from/with other MFIs, by sub-sector
See notes at the end of the chapter
EUR Millions
Loans Deposits
OMFIs Credit Deposit- SCI OCI MMF OMFIs Credit Deposit- SCI OCI MMF Total insti- taking & Total insti- taking & (a) tutions insti- ELMIs (a) tutions insti- ELMIs tutions tutions
07 1 759 158 1 759 158 1 691 729 56 576 10 852 - 1 382 185 1 382 185 1 379 090 1 209 1 885 ... 08 1 871 339 1 871 337 1 797 106 59 030 15 200 2 1 580 218 1 580 218 1 575 403 3 254 1 560 ... 09 1 842 001 1 841 982 1 781 740 44 160 16 083 135 1 611 760 1 611 760 1 605 533 4 809 1 418 - 10 1 857 404 1 857 337 1 787 983 41 816 27 537 68 1 648 437 1 648 437 1 618 056 4 293 26 088 - 11 1 797 240 1 797 230 1 721 912 42 861 32 457 11 1 580 619 1 580 619 1 547 351 8 169 25 098 - 12 1 617 790 1 617 768 1 542 342 38 982 36 444 24 1 465 593 1 465 557 1 439 781 7 906 18 449 -
11 Aug 1 801 843 1 801 825 1 734 361 39 232 28 232 19 1 603 623 1 603 623 1 577 227 3 062 23 334 - Sep 1 803 212 1 803 195 1 735 290 39 240 28 665 17 1 601 019 1 601 019 1 574 246 2 993 23 780 - Oct 1 792 959 1 792 949 1 725 259 38 775 28 915 11 1 572 354 1 572 354 1 544 644 2 915 24 795 - Nov 1 799 385 1 799 376 1 729 158 38 434 31 784 10 1 570 071 1 570 071 1 542 506 2 842 24 723 - Dec 1 797 240 1 797 230 1 721 912 42 861 32 457 11 1 580 619 1 580 619 1 547 351 8 169 25 098 -
12 Jan 1 783 820 1 783 811 1 705 225 41 815 36 771 10 1 551 128 1 551 128 1 517 299 7 980 25 849 - Feb 1 776 875 1 776 868 1 701 094 41 304 34 471 7 1 550 923 1 550 923 1 517 285 7 830 25 808 - Mar 1 782 420 1 782 412 1 701 667 41 250 39 495 8 1 564 776 1 564 776 1 526 628 7 837 30 311 - Apr 1 764 882 1 764 874 1 684 074 40 866 39 934 9 1 528 894 1 528 894 1 495 180 7 777 25 936 - May 1 754 672 1 754 664 1 677 446 40 199 37 018 9 1 517 172 1 517 171 1 488 988 7 648 20 535 - Jun 1 758 507 1 758 495 1 681 351 40 233 36 912 13 1 514 127 1 514 127 1 485 361 7 618 21 147 - Jul 1 730 657 1 730 647 1 654 183 39 979 36 485 11 1 448 176 1 448 176 1 418 965 7 531 21 680 - Aug 1 713 947 1 713 938 1 637 490 39 341 37 108 10 1 434 111 1 434 085 1 404 418 7 401 22 265 - Sep 1 717 563 1 717 557 1 641 387 38 916 37 254 6 1 448 575 1 448 535 1 418 819 7 337 22 379 - Oct 1 704 184 1 704 167 1 626 208 38 409 39 551 17 1 447 046 1 447 008 1 416 675 7 317 23 016 - Nov 1 698 569 1 698 565 1 625 224 37 815 35 526 5 1 458 772 1 458 734 1 433 463 7 554 17 718 - Dec 1 617 790 1 617 768 1 542 342 38 982 36 444 24 1 465 593 1 465 557 1 439 781 7 906 18 449 -
13 Jan 1 597 943 1 597 920 1 522 599 38 483 36 838 24 1 457 346 1 457 310 1 430 378 7 667 19 265 -
P
1=2a5 2 3 4 5 6=7a10 7 8 9 10
8. OTHER MONETARY FINANCIAL INSTITUTIONS 8.25 Loans to/deposits held by general governmentC) Breakdown of assets and liabilities from/with other MFIs, by sub-sector
EUR millions
Loans Deposits Central Regional Local Social Central Regional Local Social Govern- (autono- govern- security Govern- (autono- govern- security
Total ment mous ment funds Total ment mous ment funds govern govern- ment) ment)
10 78 583 5 086 41 276 32 017 204 79 080 45 458 14 869 14 086 4 652 11 89 285 3 809 52 124 33 145 206 69 717 45 738 9 055 10 735 4 189
10 Q2 74 883 3 874 37 730 32 722 556 73 223 38 804 13 921 15 298 5 187 Q3 76 882 3 684 40 841 32 186 171 77 171 42 761 13 918 15 334 5 144 Q4 78 583 5 086 41 276 32 017 204 79 080 45 458 14 869 14 086 4 652
11 Q1 83 320 3 455 45 876 33 806 182 88 237 57 747 12 632 12 241 5 617 Q2 86 600 3 669 48 164 34 337 430 77 815 50 512 10 548 11 444 5 311 Q3 87 404 3 698 50 148 33 372 186 70 743 45 294 9 725 10 781 4 943 Q4 89 285 3 809 52 124 33 145 206 69 717 45 738 9 055 10 735 4 189
12 Q1 92 027 3 965 53 482 34 352 227 74 253 48 884 10 569 10 053 4 746 Q2 123 230 31 015 58 702 32 927 587 68 590 39 792 9 062 11 006 8 730 Q3 120 905 31 449 57 429 31 629 398 74 069 48 686 7 819 11 977 5 587 Q4 114 221 30 791 54 420 28 790 221 69 183 42 574 10 603 11 669 4 336
BANCO DE ESPAÑA 181 BOLETÍN ESTADÍSTICO, FEBRUARY 2013

P
1=2+3+4 2 3 4=5+6+10 5 6=7+8+9 7 8 9 10
8. OTHER MONETARY FINACIAL INSTITUTIONS 8.26 Other MFI Loans to other residentC) Breakdown of assets and liabilities in Spain sectors, by sub-sector.
See notes at the end of the chapter
EUR million Non mone- Insurance Non financial corporations. NPISH and households tary corpora-
Total financial tions and (a) institu- pension Total Non fi- Households NPISH tions founds nancial corpora- tions Total House Consumer Other (b) purchase credit (d) and renova- tion (c)
06 1 507 747 10 741 3 257 1 493 748 746 908 741 136 548 739 92 082 100 315 5 704 07 1 759 158 22 034 3 707 1 733 416 892 990 834 337 623 540 103 375 107 422 6 089 08 1 871 339 30 676 8 168 1 832 495 952 075 874 329 655 144 102 330 116 854 6 091 09 1 842 001 44 960 8 531 1 788 510 915 105 867 882 654 566 92 391 120 925 5 523 10 1 857 404 74 936 10 128 1 772 339 895 893 870 349 662 798 82 105 125 447 6 096 11 1 797 240 82 415 17 373 1 697 452 840 403 850 049 656 531 70 488 123 030 7 000
11 Aug 1 801 843 73 362 15 292 1 713 189 853 509 853 200 656 250 72 112 124 838 6 479 Sep 1 803 212 76 290 15 436 1 711 486 852 961 851 968 655 726 71 814 124 427 6 557 Oct 1 792 959 72 219 15 196 1 705 544 850 513 848 342 653 844 70 810 123 688 6 689 Nov 1 799 385 73 800 17 308 1 708 277 849 493 852 035 652 658 70 830 128 546 6 749 Dec 1 797 240 82 415 17 373 1 697 452 840 403 850 049 656 531 70 488 123 030 7 000
12 Jan 1 783 820 81 425 15 600 1 686 795 834 489 845 473 653 485 69 271 122 718 6 833 Feb 1 776 875 82 825 16 541 1 677 510 829 847 840 909 650 724 67 929 122 256 6 754 Mar 1 782 420 90 987 18 504 1 672 930 827 456 838 832 649 716 67 421 121 695 6 642 Apr 1 764 882 81 667 16 468 1 666 748 824 410 835 482 650 081 65 981 119 420 6 856 May 1 754 672 79 009 16 821 1 658 843 817 945 833 054 647 360 65 672 120 022 7 844 Jun 1 758 507 86 851 17 681 1 653 977 811 153 835 811 644 201 65 856 125 754 7 013 Jul 1 730 657 74 860 15 883 1 639 916 803 583 829 352 643 859 65 041 120 452 6 981 Aug 1 713 947 72 427 16 897 1 624 625 791 892 825 731 641 479 64 124 120 128 7 002 Sep 1 717 563 80 267 16 807 1 620 490 791 309 822 270 639 522 63 289 119 460 6 910 Oct 1 704 184 78 607 16 260 1 609 317 782 785 819 520 636 994 62 929 119 597 7 013 Nov 1 698 569 76 375 16 696 1 605 500 775 412 823 115 635 094 63 691 124 329 6 973 Dec 1 617 790 73 736 15 672 1 528 383 706 729 814 651 633 359 67 177 114 115 7 002
13 Jan 1 597 943 68 539 14 954 1 514 451 697 417 810 067 629 938 65 450 114 678 6 966
1=2+5 2=3+4 3 4 5=6+7 6 7=8+9 8 9 10 11=12+ 12 13 14 15
8. OTHER MONETARY FINANCIAL INSTITUTIONS 8.27 Other MFI loans and creditsC) Breakdown of assets and liabilities. to households.
See notes at the end of the chapter
EUR millions
Total House purchase Other purposes Memo- (a) randum item: Total Resi- Other Total Finan- Other House (b) dential (b) cing of purcha- mort- produc- se and gage tive Total Secured loans By purpose renova- loans acti- tion (b) vities (g) Resi- Other House Consumer credit Other dential renova- mort- tion gage (d) Total Consume Other loans durable (c) 13 (e) (f)
04 476 639 317 268 307 766 9 503 159 371 35 196 124 175 ... ... 16 557 62 269 38 379 23 890 45 348 333 825 05 613 846 426 954 415 265 11 689 186 892 37 592 149 299 25 834 123 466 21 734 77 126 45 928 31 198 50 440 448 687 06 741 136 523 595 509 144 14 451 217 541 40 842 176 699 35 392 141 307 25 144 92 082 51 461 40 621 59 473 548 739 07 834 337 595 929 580 722 15 207 238 408 45 088 193 321 40 739 152 582 27 611 103 375 56 576 46 799 62 334 623 540 08 874 329 626 620 611 483 15 137 247 709 54 917 192 792 44 205 148 587 28 525 102 330 54 176 48 154 61 937 655 144
09 Q2 871 731 620 920 607 830 13 090 250 811 56 663 194 148 47 907 146 240 30 643 97 770 49 583 48 187 65 735 651 564 Q3 867 204 622 122 609 395 12 728 245 082 57 055 188 027 47 618 140 409 30 312 95 999 49 840 46 159 61 716 652 434 Q4 867 882 624 755 611 813 12 942 243 127 53 943 189 184 48 566 140 618 29 811 92 391 49 273 43 118 66 983 654 566
10 Q1 864 804 625 856 612 985 12 872 238 948 53 562 185 386 48 076 137 310 29 617 89 392 47 716 41 676 66 376 655 473 Q2 879 568 630 104 618 055 12 049 249 463 58 108 191 355 50 378 140 977 30 332 88 147 44 712 43 435 72 876 660 436 Q3 867 868 628 696 616 401 12 295 239 172 57 151 182 021 54 621 127 401 30 537 84 041 40 259 43 782 67 443 659 232 Q4 870 349 632 449 620 433 12 016 237 900 57 568 180 332 51 493 128 839 30 348 82 105 42 068 40 037 67 879 662 798
11 Q1 861 311 628 138 614 447 13 692 233 173 57 283 175 891 50 570 125 321 29 995 79 223 41 073 38 151 66 672 658 133 Q2 863 821 628 377 615 907 12 470 235 444 58 764 176 681 48 789 127 891 30 622 74 782 40 201 34 580 71 277 658 999 Q3 851 968 625 101 612 810 12 291 226 867 57 414 169 453 48 638 120 815 30 625 71 814 38 478 33 336 67 014 655 726 Q4 850 049 626 550 612 657 13 893 223 420 56 619 166 802 48 364 118 438 29 902 70 488 37 686 32 802 66 411 656 531
12 Q1 838 832 620 182 608 763 11 419 218 651 56 391 162 260 52 202 110 058 29 534 67 421 35 835 31 586 65 304 649 716 Q2 835 811 614 707 603 717 10 991 221 104 55 896 165 208 51 389 113 819 29 493 65 856 34 726 31 130 69 858 644 201 Q3 822 270 610 943 597 181 13 762 211 328 54 415 156 913 51 460 105 452 28 579 63 289 31 953 31 336 65 045 639 522
BANCO DE ESPAÑA 182 BOLETÍN ESTADÍSTICO, FEBRUARY 2013

P
1=2+11 2=3a5+7a10 3 4 5 6 7 8 9 10 11 12
8. OTHER MONETARY FINANCIAL INSTITUTIONS 8.28 Deposits held by other residents andC) Breakdown of asset and liabilities other general government in the euro area with other MFIs, by sub-sector
Millones de euros Residents in Spain Residents in Other MUM
Total Total Other Portfolio Other non of wich Insu- Non- NPISH House- Total of wich General invest- monetary rance finan- holds Govern- ment financial Asset corpo- cial ment except institu- Securiti- ration corpo- Central MMF tions sation and ration counter- funds pension parties funds
07 1 463 767 1 430 674 48 489 49 740 475 622 ... 44 554 204 140 16 031 592 099 33 093 ... 08 1 656 964 1 620 604 40 386 40 709 592 258 ... 54 706 212 782 18 451 661 312 36 360 ... 09 1 686 026 1 649 435 37 675 35 583 603 307 ... 53 148 215 636 16 738 687 348 36 591 ... 10 1 730 189 1 682 059 33 622 30 358 617 544 445 422 54 163 219 083 16 676 710 613 48 131 5 854 11 1 679 410 1 604 598 23 979 28 449 575 346 418 012 52 673 197 473 16 206 710 472 74 812 39 964 12 1 521 642 1 492 166 26 609 21 491 468 891 328 154 52 574 190 861 14 698 717 044 29 476 4 172
11 Aug 1 711 932 1 629 613 25 990 29 785 581 461 420 921 50 461 208 645 16 261 717 010 82 319 40 060 Sep 1 716 761 1 626 468 25 449 28 555 584 723 421 785 51 135 205 535 16 386 714 685 90 292 47 006 Oct 1 691 027 1 598 539 26 185 28 143 570 359 413 788 51 932 196 745 16 178 708 997 92 489 50 669 Nov 1 683 135 1 600 518 30 447 27 715 573 091 413 010 52 505 196 229 15 988 704 543 82 618 46 896 Dec 1 679 410 1 604 598 23 979 28 449 575 346 418 012 52 673 197 473 16 206 710 472 74 812 39 964
12 Jan 1 658 695 1 574 829 23 701 29 484 564 181 400 880 50 510 189 213 15 791 701 949 83 866 42 671 Feb 1 653 026 1 575 058 24 136 30 678 558 907 394 059 53 220 190 726 15 472 701 921 77 968 40 060 Mar 1 656 174 1 590 144 25 368 32 287 567 079 402 951 54 500 191 192 15 305 704 413 66 030 30 316 Apr 1 624 611 1 553 830 24 937 31 760 548 641 391 463 52 642 182 697 15 040 698 114 70 781 36 154 May 1 591 453 1 543 569 26 397 29 500 539 702 393 531 51 339 186 633 15 130 694 867 47 884 18 015 Jun 1 582 848 1 542 924 28 797 28 769 525 062 381 371 50 310 190 510 15 055 704 420 39 924 12 474 Jul 1 509 198 1 473 927 25 751 28 324 485 934 355 316 49 421 175 446 14 346 694 705 35 271 8 507 Aug 1 491 591 1 458 381 24 297 26 574 473 090 353 626 49 415 178 533 14 312 692 160 33 210 7 204 Sep 1 505 033 1 473 919 25 384 21 725 488 539 353 321 50 215 180 393 14 359 693 305 31 113 5 000 Oct 1 504 419 1 474 746 27 738 22 258 489 737 350 969 49 432 174 659 14 333 696 589 29 673 4 472 Nov 1 517 644 1 486 422 27 687 21 826 483 057 345 719 51 199 180 790 14 530 707 333 31 223 5 013 Dec 1 521 642 1 492 166 26 609 21 491 468 891 328 154 52 574 190 861 14 698 717 044 29 476 4 172
13 Jan 1 519 843 1 485 742 28 432 25 099 458 101 321 365 53 196 188 215 15 028 717 672 34 100 9 642
P
1=2a5 2 3 4 5 6=7a10 7 8 9 10
8. OTHER MONETARY FINANCIAL INSTITUTIONS 8.29 Deposits held by non-financial corporations, households andC) Breakdown of asset and liabilities NPISH resident in Spain, by type
See notes at the end of the chapter
EUR millions
Non-financial corporation, NPISH and households NPISH and Households Over- Redee- With Repos Over- Redee- With Repos night mable at agreed night mable agreed
Total depo- notice maturity Total deposits at maturity sits (a) deposits notice deposits (a)
07 812 269 398 424 19 394 617 19 209 608 130 275 382 0 328 041 4 707 08 892 545 381 706 20 490 698 20 121 679 763 267 914 - 407 405 4 444 09 919 722 422 150 26 484 275 13 272 704 086 308 980 - 393 296 1 811 10 946 372 421 506 37 515 248 9 581 727 289 307 291 - 418 762 1 235 11 924 151 413 803 45 503 538 6 765 726 678 307 626 - 417 557 1 495 12 922 638 413 485 42 502 447 6 664 731 777 307 650 - 422 598 1 530
11 Aug 941 916 412 958 44 522 285 6 630 733 271 303 317 - 428 769 1 185 Sep 936 607 409 388 44 520 662 6 513 731 072 302 150 - 427 810 1 112 Oct 921 920 401 562 44 514 407 5 907 725 175 298 728 - 425 217 1 230 Nov 916 760 405 932 45 504 869 5 915 720 531 300 340 - 418 947 1 244 Dec 924 151 413 803 45 503 538 6 765 726 678 307 626 - 417 557 1 495
12 Jan 906 954 399 863 45 500 812 6 233 717 740 299 213 - 417 115 1 412 Feb 908 119 398 535 46 503 447 6 091 717 393 297 292 - 418 567 1 535 Mar 910 911 403 848 46 500 772 6 245 719 718 300 748 - 417 422 1 549 Apr 895 851 395 334 46 494 593 5 878 713 154 297 793 - 413 875 1 487 May 896 631 405 051 45 486 190 5 345 709 998 301 096 - 407 662 1 240 Jun 909 986 423 850 45 480 417 5 674 719 476 315 563 - 402 704 1 208 Jul 884 497 405 779 44 473 123 5 550 709 050 308 312 - 399 206 1 532 Aug 885 032 406 848 43 472 312 5 829 706 498 306 849 - 398 058 1 592 Sep 888 096 407 102 42 474 809 6 144 707 703 305 811 - 400 471 1 422 Oct 885 619 397 440 42 481 799 6 339 710 961 301 303 - 408 151 1 507 Nov 902 691 405 890 42 490 505 6 254 721 900 305 818 - 414 509 1 573 Dec 922 638 413 485 42 502 447 6 664 731 777 307 650 - 422 598 1 530
13 Jan 920 951 404 314 42 508 331 8 265 732 736 303 682 - 427 587 1 466
BANCO DE ESPAÑA 183 BOLETÍN ESTADÍSTICO, FEBRUARY 2013

P
1=2a5 2 3 4 5 6=7a10 7 8 9 10 11=12A 12 13 14 15
8. OTHER MONETARY FINANCIAL INSTITUTIONS 8.30 Breakdown of deposits held by non-financial corporations,C) Breakdown of asset and liabilities households and NPISH residents in Spain, by type
See notes at the end of the chapter
EUR millions
Non-financial corporations Households NPISH
Total Over- Redee- With Repos Total Over- Redee- With Repos Total Over- Redee- With Repos night mable agreed night mable agreed night mable agreed depo- at no- matu- depo- at no- matu- depo- at no- matu- sits tice rity sits tice rity sits tice rity (a) (a) (a)
07 204 140 123 042 19 66 576 14 502 592 099 265 895 0 322 324 3 880 16 031 9 486 - 5 718 827 08 212 782 113 792 20 83 294 15 677 661 312 257 599 - 400 200 3 512 18 451 10 315 - 7 204 932 09 215 636 113 170 26 90 979 11 461 687 348 299 508 - 386 351 1 489 16 738 9 472 - 6 945 321 10 219 083 114 215 37 96 485 8 346 710 613 298 097 - 411 459 1 056 16 676 9 193 - 7 303 179 11 197 473 106 177 45 85 981 5 270 710 472 298 854 - 410 430 1 188 16 206 8 772 - 7 127 307 12 190 861 105 835 42 79 850 5 134 717 044 299 690 - 416 043 1 311 14 698 7 924 - 6 555 219
11 Aug 208 645 109 641 44 93 516 5 445 717 010 294 873 - 421 114 1 022 16 261 8 444 - 7 655 162 Sep 205 535 107 238 44 92 852 5 401 714 685 293 464 - 420 267 954 16 386 8 686 - 7 543 158 Oct 196 745 102 834 44 89 190 4 677 708 997 290 197 - 417 768 1 033 16 178 8 531 - 7 449 197 Nov 196 229 105 592 45 85 922 4 670 704 543 291 865 - 411 676 1 003 15 988 8 475 - 7 272 241 Dec 197 473 106 177 45 85 981 5 270 710 472 298 854 - 410 430 1 188 16 206 8 772 - 7 127 307
12 Jan 189 213 100 650 45 83 697 4 821 701 949 290 680 - 410 097 1 172 15 791 8 534 - 7 018 240 Feb 190 726 101 243 46 84 879 4 557 701 921 288 963 - 411 601 1 357 15 472 8 329 - 6 966 178 Mar 191 192 103 100 46 83 350 4 696 704 413 292 521 - 410 463 1 429 15 305 8 227 - 6 959 120 Apr 182 697 97 541 46 80 719 4 391 698 114 289 714 - 407 032 1 368 15 040 8 079 - 6 842 119 May 186 633 103 954 45 78 529 4 105 694 867 292 813 - 400 938 1 116 15 130 8 283 - 6 723 124 Jun 190 510 108 288 45 77 712 4 466 704 420 307 182 - 396 167 1 071 15 055 8 381 - 6 537 137 Jul 175 446 97 467 44 73 917 4 018 694 705 300 418 - 392 897 1 390 14 346 7 894 - 6 309 142 Aug 178 533 99 999 43 74 254 4 237 692 160 298 935 - 391 772 1 453 14 312 7 887 - 6 286 139 Sep 180 393 101 291 42 74 338 4 721 693 305 297 894 - 394 144 1 267 14 359 7 877 - 6 327 155 Oct 174 659 96 137 42 73 648 4 832 696 589 293 436 - 401 814 1 340 14 333 7 829 - 6 337 167 Nov 180 790 100 072 42 75 995 4 681 707 333 297 932 - 408 017 1 384 14 530 7 849 - 6 492 190 Dec 190 861 105 835 42 79 850 5 134 717 044 299 690 - 416 043 1 311 14 698 7 924 - 6 555 219
13 Jan 188 215 100 632 42 80 743 6 798 717 672 295 454 - 420 945 1 274 15 028 8 192 - 6 642 193
BANCO DE ESPAÑA 184 BOLETÍN ESTADÍSTICO, FEBRUARY 2013

OTHER EURO AREA
REST OF THE WORLD,
___________________________________________________________________________________________________________________________
8. OTRAS INSTITUCIONES FINANCIERAS MONETARIAS 8.31 Detalle por países de losC) Detalles del activo y del pasivo obtenidos de principales activos y pasivos los estados estadístico-contables de la zona del euro
Datos referidos a Diciembre de 2012 Millones de euros
Activo/Assets Pasivo/Liabilities
Préstamos Préstamos y Valores Valores Participa- Acciones y Depósitos Depósitos y créditos créditos a distintos distintos ciones participa- de IFMs/ de otros a IFMs/ otros de acciones de acciones en FMM/ ciones/ MFIs’ de- sectores/ Loans to sectores/ y partici- y partici- Money mar- Shares and posits Other sec- MFIs Loans to paciones paciones de ket fund other tors’ de- other de IFMs/ otros sec- shares/ equity posits sectors MFIs’ secu- tores/ units rities Other sec- other than tors’ secu- shares rities other than shares 1 2 3 4 5 6 7 8
ESPAÑA . . . . . . . . 281 567 1 731 969 76 706 489 041 8 168 428 574 762 1 534 740 SPAIN
OTROS PAISES DE LA UEM . . . . . . . . . . 55 833 26 682 4 851 62 770 - 22 754 123 290 33 764 COUNTRIES
Alemania . . . . . . . . 5 412 7 191 492 1 803 - 2 453 23 486 7 890 Germany Austria . . . . . . . . . 39 130 197 142 - 1 311 185 97 Austria Bélgica . . . . . . . . . 7 475 586 17 757 - 976 9 888 1 592 Belgium Finlandia . . . . . . . . 1 000 20 10 117 - 42 32 39 Finland Francia . . . . . . . . . 14 542 3 185 1 077 4 285 - 401 69 925 8 223 France Grecia . . . . . . . . . 367 271 26 67 - 0 24 111 Greece Holanda . . . . . . . . . 2 031 7 051 663 5 720 - 12 598 4 019 5 129 Netherlands Irlanda . . . . . . . . . 223 1 542 288 4 288 - 330 1 530 6 148 Ireland Italia . . . . . . . . . . 11 591 827 1 020 5 741 - 756 4 304 1 433 Italy Luxemburgo . . . . . . . 468 2 243 59 490 - 936 1 098 2 024 Luxembourg Portugal . . . . . . . . . 12 684 3 359 1 001 2 189 - 2 951 8 614 1 008 Portugal Eslovenia . . . . . . . . 0 20 1 0 - - 0 1 Slovenia Chipre . . . . . . . . . - 135 - - - - 1 13 Cyprus Malta . . . . . . . . . . 0 89 - - - - 182 37 Malta Eslovaquia. . . . . . . . 1 23 - - - - - 10 Slovaquia Estonia . . . . . . . . . - 8 - - - - - 9 Estonia
OTROS PAISES DE LA UE 90 286 14 618 5 543 1 624 - 20 528 105 237 9 647 OTHER EU COUNTRIES
Dinamarca. . . . . . . . 400 64 33 6 - 1 91 177 Denmark Reino Unido . . . . . . . 89 534 13 463 5 190 1 171 - 15 985 104 676 9 168 United Kingdom Suecia . . . . . . . . . 82 176 320 184 - 51 129 161 Sweden
RESTO . . . . . . . . . 270 915 - 264 - 4 491 341 142 REST
RESTO DEL MUNDO EX- CLUÍDA LA UE . . . . . 19 889 23 793 1 766 9 555 - 46 927 28 608 40 324 EXCLUDING EU
TOTAL . . . . . . . . . 447 574 1 797 060 88 866 562 990 8 258 637 831 897 1 618 475 TOTAL
December 2012 Data EUR millions
8.31 Main assets and liabilities 8.OTHER MONETARY FINANCIAL INSTITUTIONS of other MFIS, by country C) Assets and liabilities figures obtained
from the euro area statistical returns
BANCO DE ESPAÑA 185 BOLETÍN ESTADÍSTICO, FEBRUARY 2013

POSITION VIS-A-VIS RESIDENTS IN SPAIN
ASSETS
other than shares
LIABILITIES
POSITION VIS-A-VIS OTHER EURO AREA COUNTRIES (EXCLUDING SPAIN)
ASSETS
other than shares
LIABILITIES
POSITION VIS-A-VIS REST OF THE WORLD
ASSETS
other than shares
LIABILITIES
POSITION VIS-A-VIS UNITS NOT CLASSIFIED BY RESIDENCE
LIABILITIES
___________________________________________________________________________________________________________________________
8. OTRAS INSTITUCIONES FINANCIERAS MONETARIAS 8.32 Detalle por monedas de los C) Detalles del activo y del pasivo obtenidos de principales activos y pasivos los estados estadístico-contables de la zona del euro
Datos referidos a Diciembre de 2012 Millones de euros Resto de monedas/Other currencies
Total/ Euros/ Total Euros Resto de Francos Otras monedas $ USA/ Yenes/ suizos/ monedas/ UE USD JPY SFR Remai- (no UME)/ ning cu- Other UE rrencies currencies
1= 2 a 7 2 3 4 5 6 7
POSICION FRENTE A RESIDENTES EN ESPAÑA
ACTIVO Préstamos y créditos a otros sectores . . . .1 731 969 1 715 840 1 110 5 919 7 149 1 800 151 Loans to other sectors Valores dist.de accio.y partic.de IFM . . . . 76 706 76 326 351 25 - 4 - MFIs’ holdings of securities other than shares Valores distintos de acciones y participacio- . 489 041 484 601 2 222 2 217 - - - Other sectors’ holdings of securities nes de otros sectores
PASIVO Depósitos de IFM . . . . . . . . . . . . . 574 762 570 635 129 3 776 110 76 36 MFIs’ deposits Depósitos de otros sectores . . . . . . . .1 534 740 1 504 510 5 894 22 922 503 257 653 Other sectors’ deposits
POSICION FRENTE A RESIDENTES EN PAISES UEM (SIN INCLUIR ESPAÑA)
ACTIVO Préstamos y créditos a otros sectores . . . . 26 682 22 783 134 3 678 7 6 74 Loans to other sectors Valores dist.de accio.y partic.de IFM . . . . 4 851 4 689 89 41 - - 33 MFIs’ holdings of securities other than shares Valores distintos de acciones y participacio- . 62 770 61 231 18 886 - - 635 Other sectors’ holdings of securities nes de otros sectores
PASIVO Depósitos de IFM . . . . . . . . . . . . . 123 290 116 350 480 6 178 172 22 88 MFIs’ deposits Depósitos de otros sectores . . . . . . . . 33 764 31 162 58 2 493 2 24 25 Other sectors’ deposits
POSICION FRENTE A RESIDENTES EN EL RESTO DEL MUNDO
ACTIVO Préstamos y créditos a IFM . . . . . . . . 110 175 90 976 3 523 12 477 434 741 2 024 Loans to MFIs Préstamos y créditos a otros sectores . . . . 38 411 19 905 3 037 13 491 77 119 1 781 Loans to other sectors Valores dist.de accio.y partic.de IFM . . . . 7 357 5 957 363 1 030 - 2 9 MFIs’ holdings of securities other than shares Valores distintos de acciones y participacio- . 11 229 2 505 286 2 112 - - 6 328 Other sectors’ holdings of securities nes de otros sectores
PASIVO Depósitos de IFM . . . . . . . . . . . . . 133 845 104 926 3 021 23 956 1 183 481 279 MFIs’ deposits Depósitos de otros sectores . . . . . . . . 49 971 37 570 1 859 10 249 100 81 112 Other sectors’ deposits
POSICION FRENTE A UNIDADES NO CLASIFICADAS POR RESIDENCIA
PASIVO Valores emitidos distintos de accio.y partic. . 394 300 380 592 1 847 7 509 1 362 1 276 1 714 Debt securities issued
December 2012 Data Euro millions
8.32 Main assets and liabilities 8.OTHER MONETARY FINANCIAL INSTITUTIONS of other MFIS, by currency C) Assets and liabilities figures obtained from
the euro area statistical returns
BANCO DE ESPAÑA 186 BOLETÍN ESTADÍSTICO, FEBRUARY 2013

ASSETS
___________________________________________________________________________________________________________________________
Véanse notas al final del capítulo./ See notes at the end of the chapter.
8. OTRAS INSTITUCIONES FINANCIERAS MONETARIAS 8.D Balance de las entidades de crédito. Detalle por entidades D) Balances de los componentes de OIFM
Datos referidos a Enero de 2013 Millones de euros
Entidades Entidades EFC/ Instituto de de SCI de crédito/ depósito/ Crédito Credit Deposit Oficial/ institu- institu- Official tions tions Credit Institute
(8.41 a/ (8.51 a/ (8.81 a/ to 8.44) to 8.54) to 8.84)
C D E
B=C+D+E ACTIVO
1 A. RESIDENTES EN ESPAÑA . . . . . . 2 697 874 2 529 591 43 945 124 338 1 A. DOMESTIC
2 2. Préstamos y créditos . . . . . . . . 1 961 329 1 822 373 42 409 96 548 2 2. Loans 3 2e. Del cual: euros . . . . . . . . . . 1 944 206 1 806 286 42 406 95 514 3 2e. Of which: euro 4 IFM . . . . . . . . . . . . . . . . . 249 738 202 796 2 976 43 967 4 MFIs
5 2e. Del cual: euros . . . . . . . . . . 247 483 200 812 2 975 43 696 5 2e. Of which: euro 6 Administraciones Públicas . . . . . . . . 113 671 96 978 950 15 743 6 General government
7 2e. Del cual: euros . . . . . . . . . . 113 671 96 978 950 15 743 7 2e. Of which: euro 8 Otros residentes . . . . . . . . . . . . 1 597 920 1 522 599 38 483 36 838 8 Other residents
9 2e. Del cual: euros . . . . . . . . . . 1 583 052 1 508 496 38 481 36 075 9 2e. Of which: euro
10 3. Valores distintos de acciones . . . . 566 407 537 390 1 450 27 567 10 3. Securities other than shares y participaciones 11 3e. Del cual: euros . . . . . . . . . . 561 730 532 713 1 450 27 567 11 3e. Of which: euro 12 IFM . . . . . . . . . . . . . . . . . 77 398 75 697 89 1 611 12 MFIs
13 3e. Del cual: euros . . . . . . . . . . 77 038 75 337 89 1 611 13 3e. Of which: euro 14 Administraciones Públicas . . . . . . . . 247 756 225 757 - 21 999 14 General government
15 3e. Del cual: euros . . . . . . . . . . 247 691 225 692 - 21 999 15 3e. Of which: euro 16 Otros residentes . . . . . . . . . . . . 241 253 235 935 1 361 3 956 16 Other residents
17 3e. Del cual: euros . . . . . . . . . . 237 001 231 684 1 361 3 956 17 3e. Of which: euro
18 4. Participaciones en FMM . . . . . . 7 7 - - 18 4. Money market fund shares/units 19 IFM . . . . . . . . . . . . . . . . . 7 7 - - 19 MFIs
20 4e. Del cual: euros . . . . . . . . . . 7 7 - - 20 4e. Of which euro
21 5. Acciones y participaciones . . . . . 170 130 169 821 86 223 21 5. Shares and other equity 22 IFM . . . . . . . . . . . . . . . . . 56 620 56 620 0 - 22 MFIs
23 Otros residentes . . . . . . . . . . . . 113 511 113 201 86 223 23 Other residents
24 B. RESIDENTES EN OTROS PAISES DE LA ZONA DEL EURO . . . . . . . 176 566 173 616 2 556 394 24 B. OTHER EURO AREA COUNTRIES
25 2. Préstamos y créditos . . . . . . . . 87 506 84 606 2 542 358 25 2. Loans 26 2e. Del cual: euros . . . . . . . . . . 80 369 77 557 2 526 286 26 2e. Of which: euro 27 IFM . . . . . . . . . . . . . . . . . 57 017 54 865 2 152 0 27 MFIs
28 2e. Del cual: euros . . . . . . . . . . 53 635 51 482 2 152 0 28 2e. Of which: euro 29 Administraciones Públicas . . . . . . . . 28 28 - - 29 General government
30 2e. Del cual: euros . . . . . . . . . . 28 28 - - 30 2e. Of which: euro 31 Otros residentes . . . . . . . . . . . . 30 460 29 712 390 358 31 Other residents
32 3. Valores distintos de acciones . . . . 66 244 66 243 1 - 32 3. Securities other than shares y participaciones 33 3e. Del cual: euros . . . . . . . . . . 64 574 64 573 1 - 33 3e. Of which: euro 34 IFM . . . . . . . . . . . . . . . . . 4 415 4 415 - - 34 MFIs
35 3e. Del cual: euros . . . . . . . . . . 4 257 4 257 - - 35 3e. Of which: euro 36 Administraciones Públicas . . . . . . . . 13 442 13 442 - - 36 General government
37 3e. Del cual: euros . . . . . . . . . . 13 340 13 340 - - 37 3e. Of which: euro 38 Otros residentes . . . . . . . . . . . . 48 386 48 386 1 - 38 Other residents
39 3e. Del cual: euros . . . . . . . . . . 46 977 46 976 1 - 39 3e. Of which: euro
40 4. Participaciones en FMM . . . . . . - - - - 40 4. Money market fund shares/units 41 IFM . . . . . . . . . . . . . . . . . - - - - 41 MFIs
42 4e. Del cual: euros . . . . . . . . . . - - - - 42 4e. Of which euro
43 5. Acciones y participaciones . . . . . 22 817 22 767 13 36 43 5. Shares and other equity 44 IFM . . . . . . . . . . . . . . . . . 5 612 5 577 - 36 44 MFIs
45 Otros residentes . . . . . . . . . . . . 17 204 17 191 13 0 45 Other residents
January 2013 data EUR millions
8.D Balance sheet of credit institutions 8. OTHER MONETARY FINANCIAL INSTITUTIONSby institutional grouping D) Balance sheet of the institutional groupings of other MFIs
BANCO DE ESPAÑA 187 BOLETÍN ESTADÍSTICO, FEBRUARY 2013

ASSETS (continued)
___________________________________________________________________________________________________________________________
Véanse notas al final del capítulo./ See notes at the end of the chapter.
8. OTRAS INSTITUCIONES FINANCIERAS MONETARIAS 8.D Balance de las entidades de crédito. Detalle por entidades D) Balances de los componentes de OIFM
Datos referidos a Enero de 2013 Millones de euros
Entidades Entidades EFC Instituto de de SCI de crédito/ depósito/ Crédito Credit Deposit Oficial/ institu- institu- Official tions tions Credit Institute
(8.41 a/ (8.51 a/ (8.81 a/ to 8.44) to 8.54) to 8.84)
C D E
B=C+D+E ACTIVO (continuación)
46 C. RESTO DEL MUNDO . . . . . . . . 232 767 230 649 981 1 136 46 C. REST OF THE WORLD
47 2. Préstamos y créditos . . . . . . . . 147 684 145 569 981 1 134 47 2. Loans 48 2e. Del cual: euros . . . . . . . . . . 112 040 111 198 796 47 48 2e. Of which: euro
49 3. Valores distintos de acciones . . . . 18 089 18 089 - - 49 3. Securities other than shares y participaciones 50 3e. Del cual: euros . . . . . . . . . . ... ... ... ... 50 3e. Of which: euro
51 5. Acciones y participaciones . . . . . 66 994 66 991 - 3 51 5. Shares and other equity 52 5e. Del cual: euros . . . . . . . . . . - - - - 52 5e. Of which: euro
53 D. SIN CLASIFICAR . . . . . . . . . . 395 963 389 364 2 531 161 53 D. UNCLASSIFIED
54 1. Efectivo (todas las monedas) . . . . 6 558 6 558 0 0 54 1. Cash (all currencies) 55 1e. Del cual: euros . . . . . . . . . . 6 406 6 406 0 0 55 1e. Of which: euro
56 6. Activo fijo . . . . . . . . . . . . . 53 332 52 205 965 161 56 6. Fixed assets
57 7. Otros activos . . . . . . . . . . . 336 072 330 601 1 567 3 905 57 7. Remaining assets 58 7e. Del cual: euros . . . . . . . . . . ... ... ... ... 58 7e. Of which: euro
59 TOTAL ACTIVO. . . . . . . . . . . . 3 503 169 3 323 221 50 014 129 935 59 TOTAL ASSETS
60 e Euros . . . . . . . . . . . . . . ... ... ... ... 60 e Euro 61 x Monedas distintas del euro . . . . ... ... ... ... 61 x Other currencies 62 s/c Sin clasificar por monedas . . . . 389 404 382 806 2 531 4 067 62 n/c Not classified by currency
January 2013 data EUR millions
8.D Balance sheet of credit institutions 8. OTHER MONETARY FINANCIAL INSTITUTIONSby institutional grouping D) Balance sheet of the institutional groupings of other MFIs
BANCO DE ESPAÑA 188 BOLETÍN ESTADÍSTICO, FEBRUARY 2013

LIABILITIES
___________________________________________________________________________________________________________________________
Véanse notas al final del capítulo./ See notes at the end of the chapter.
8. OTRAS INSTITUCIONES FINANCIERAS MONETARIAS 8.D Balance de las entidades de crédito. Detalle por entidades D) Balances de los componentes de OIFM
Datos referidos a Enero de 2013 Millones de euros
Entidades Entidades EFC/ Instituto de de SCI de crédito/ depósito/ Crédito Credit Deposit Oficial/ institu- institu- Official tions tions Credit Institute
(8.41 a/ (8.51 a/ (8.81 a/ to 8.44) to 8.54) to 8.84)
C D E
B=C+D+E PASIVO
1 A. RESIDENTES EN ESPAÑA . . . . . . . . 2 044 283 1 967 045 35 787 41 451 1 A. DOMESTIC
2 9. Depósitos. . . . . . . . . . . . . . . . 2 044 283 1 967 045 35 787 41 451 2 9. Deposits 3 9e. Del cual: euros . . . . . . . . . . . . 2 011 322 1 934 160 35 784 41 377 3 9e. Of which: euro 4 IFM . . . . . . . . . . . . . . . . . . . 518 304 470 045 28 111 20 149 4 MFIs
5 9e. Del cual: euros . . . . . . . . . . . . 514 397 466 213 28 108 20 075 5 9e. Of which: euro 6 Administración Central . . . . . . . . . . . 40 236 38 200 - 2 037 6 Central government
7 9e. Del cual: euros . . . . . . . . . . . . 40 212 38 175 - 2 037 7 9e. Of which: euro 8 Otras Administraciones Públicas . . . . . . . . 28 432 28 422 9 0 8 Other general government
9 9e. Del cual: euros . . . . . . . . . . . . 28 431 28 421 9 0 9 9e. Of which: euro 10 Otros residentes . . . . . . . . . . . . . . 1 457 310 1 430 378 7 667 19 265 10 Other residents
11 9e. Del cual: euros . . . . . . . . . . . . 1 428 282 1 401 350 7 667 19 265 11 9e. Of which: euro
12 10. Participaciones de los fondos del mercado monetario . . . . . . . . . . . - - - - 12 10. Money markets fund shares/units
13 B. RESIDENTES EN OTROS PAÍSES DE LA ZONA DEL EURO . . . . . . . . . . 172 066 166 530 5 030 506 13 B. OTHER EURO AREA COUNTRIES
14 9. Depósitos . . . . . . . . . . . . . . . 172 066 166 530 5 030 506 14 9. Deposits 15 9e. Del cual: euros . . . . . . . . . . . . 159 942 154 421 5 015 506 15 9e. Of which: euro 16 IFM . . . . . . . . . . . . . . . . . . . 136 904 133 489 2 909 506 16 MFIs
17 9e. Del cual: euros . . . . . . . . . . . . 127 325 123 926 2 893 506 17 9e. Of which: euro 18 Administración Central . . . . . . . . . . . 1 062 1 062 - - 18 Central government
19 9e. Del cual: euros . . . . . . . . . . . . 1 062 1 062 - - 19 9e. Of which: euro 20 Otras Administraciones Públicas . . . . . . . 0 0 - - 20 Other general government
21 9e. Del cual: euros . . . . . . . . . . . . 0 0 - - 21 9e. Of which: euro 22 Otros residentes . . . . . . . . . . . . . . 34 100 31 979 2 122 - 22 Other residents
23 9e. Del cual: euros . . . . . . . . . . . . 31 554 29 432 2 122 - 23 9e. Of which: euro
24 10. Participaciones de los fondos del mercado monetario . . . . . . . . . . . - - - - 24 10. Money markets fund shares/units
25 C. RESTO DEL MUNDO . . . . . . . . . . 182 221 178 098 196 3 927 25 C. REST OF THE WORLD
26 9. Depósitos (total) . . . . . . . . . . . . 182 221 178 098 196 3 927 26 9. Deposits (total) 27 9e. Del cual: euros . . . . . . . . . . . . 149 246 145 485 196 3 565 27 9e. Of which: euro
28 10. Participaciones de los fondos del mercado monetario . . . . . . . . . . . - - - - 28 10. Money markets fund shares/units
29 D. SIN CLASIFICAR . . . . . . . . . . . . 1 104 600 1 011 548 9 001 70 258 29 D. UNCLASSIFIED
30 11. Valores distintos de acciones y par- ticipaciones. . . . . . . . . . . . . . . 390 689 320 271 160 70 258 30 11. Debts securities issued 31 11e. Del cual: euros . . . . . . . . . . . 377 854 316 967 160 60 728 31 11e. In euro 32 Del cual: hasta dos años . . . . . . . . 59 978 54 574 158 5 246 32 Of which: up to two years
33 11x. Monedas distintas del euro . . . . . . 12 835 3 304 - 9 531 33 11x. In other currencies 34 Del cual: hasta dos años . . . . . . . . 386 - - 386 34 Of which: up to two years
35 13. Capital y reservas . . . . . . . . . . . 403 977 390 321 6 689 6 966 35 13. Capital and Reserves
36 14. Otros pasivos. . . . . . . . . . . . . 309 934 300 955 2 152 6 826 36 14. Remaining liabilities 37 14e. Del cual: euros . . . . . . . . . . . ... ... ... ... 37 14e. Of which: euro
38 TOTAL PASIVO. . . . . . . . . . . . . . 3 503 169 3 323 221 50 014 129 935 38 TOTAL LIABILITIES
39 e Euros . . . . . . . . . . . . . . . . 2 698 363 ... ... 106 176 39 e Euro 40 x Monedas distintas del euro . . . . . . 90 896 2 631 944 41 172 9 966 40 x Other currencies 41 s/c Sin clasificar por monedas . . . . . . 713 911 691 277 8 842 13 792 41 n/c Not classified by currency
January 2013 data EUR millions
8.D Balance sheet of credit institutions 8. OTHER MONETARY FINANCIAL INSTITUTIONSby institutional grouping D) Balance sheet of the institutional groupings of other MFIs
BANCO DE ESPAÑA 189 BOLETÍN ESTADÍSTICO, FEBRUARY 2013

P
1=2a5= 2 3 4 5=10a12 6 7 8 9 10 11 12 13 14 15
8. OTHER MONETARY FINANCIAL INSTITUTIONS 8.41 Credit institutions(data from euro area returns) Assets. SummaryD) Balance sheet of the institutional groupings of other MFIs
See notes at the end of the chapter
Eur billions By residence By instrument By currencies
Total Domestic Other Rest Not a- Loans Securi- Money Shares Cash Fixed Remai- Euro Other Not (a) MUMS of the lloca- ties market and (all assets ning curren- clas- world ted other fund other curren- assets cies sified than sha- equity cies) shares res/ units
=13a15= =6a12=
07 3 005.3 2 396.8 217.9 199.3 191.3 2 302.5 327.9 - 183.6 8.5 30.7 152.1 2 667.6 154.9 182.8 08 3 381.2 2 678.3 219.1 196.9 286.9 2 440.6 481.8 0.0 171.8 9.0 36.9 241.0 2 930.9 172.3 277.9 09 3 433.3 2 762.8 209.7 207.2 253.6 2 389.9 605.8 0.0 184.0 8.5 45.1 200.0 3 029.0 159.2 245.1 10 3 462.9 2 789.9 158.7 213.6 300.7 2 399.6 582.1 0.0 180.5 7.9 49.8 243.0 3 007.7 162.4 292.8 11 3 613.1 2 839.7 160.6 224.6 388.2 2 371.4 600.6 0.0 253.0 7.5 57.2 323.5 3 060.4 172.0 380.7 12 3 574.8 2 741.6 172.0 234.4 426.9 2 242.4 646.9 0.0 258.6 7.4 53.0 366.5 3 007.3 148.1 419.5
11 Aug 3 543.6 2 816.3 170.5 216.9 340.0 2 372.8 584.3 0.0 246.5 7.1 54.8 278.0 ... ... 332.8 Sep 3 561.4 2 802.3 171.3 218.0 369.7 2 361.2 578.9 0.0 251.6 6.9 55.2 307.6 3 032.2 166.4 362.8 Oct 3 543.1 2 792.9 170.4 218.0 361.9 2 354.8 572.1 0.0 254.3 7.1 55.7 299.1 ... ... 354.8 Nov 3 538.1 2 788.4 160.8 219.5 369.5 2 350.7 567.3 0.0 250.7 7.0 56.3 306.1 ... ... 362.4 Dec 3 613.1 2 839.7 160.6 224.6 388.2 2 371.4 600.6 0.0 253.0 7.5 57.2 323.5 3 060.4 172.0 380.7
12 Jan 3 628.6 2 846.0 161.9 224.3 396.4 2 348.8 624.2 0.0 259.2 7.1 57.6 331.8 ... ... 389.4 Feb 3 646.7 2 854.1 171.2 230.4 391.0 2 351.3 644.4 0.0 260.0 6.8 58.3 325.9 ... ... 384.2 Mar 3 723.6 2 926.5 169.9 242.6 384.7 2 415.5 665.0 0.0 258.4 6.9 58.9 318.9 3 180.2 165.6 377.9 Apr 3 668.7 2 861.2 164.1 244.8 398.6 2 355.7 654.6 0.0 259.8 6.8 59.4 332.4 ... ... 391.8 May 3 720.8 2 857.4 155.6 255.0 452.8 2 369.6 639.2 0.0 259.2 6.8 59.9 386.1 ... ... 446.0 Jun 3 719.0 2 865.1 162.8 258.1 433.1 2 401.7 627.5 0.0 256.8 6.8 59.9 366.3 3 121.5 171.3 426.2 Jul 3 664.3 2 808.1 156.6 252.9 446.8 2 364.8 595.1 0.0 257.7 7.1 59.9 379.8 ... ... 439.7 Aug 3 621.9 2 778.1 152.9 246.1 444.8 2 333.5 584.1 0.0 259.6 6.8 61.0 377.0 ... ... 438.0 Sep 3 628.6 2 792.2 150.9 241.5 443.9 2 334.8 590.6 0.0 259.2 6.6 61.6 375.8 3 027.5 163.7 437.3 Oct 3 592.0 2 774.5 148.9 239.1 429.5 2 322.6 581.9 0.0 257.9 6.8 61.8 361.0 ... ... 422.8 Nov 3 582.6 2 770.7 138.7 236.0 437.2 2 318.9 571.6 0.0 254.9 6.6 61.9 368.7 ... ... 430.6 Dec 3 574.8 2 741.6 172.0 234.4 426.9 2 242.4 646.9 0.0 258.6 7.4 53.0 366.5 3 007.3 148.1 419.5
13 Jan 3 503.2 2 697.9 176.6 232.8 396.0 2 196.5 650.7 0.0 259.9 6.6 53.3 336.1 ... ... 389.4
P
1=2a5= 2 3 4 5=8a10 6 7 8 9 10 11 12 13
8. OTHER MONETARY FINANCIAL INSTITUTIONS 8.42 Credit institutions(data from euro area returns) Liabilities. SummaryD) Balance sheet of the institutional groupings of other MFIs
See notes at the end of the chapter
Eur billions By residence By instrument By currencies
Total Domes- Other Rest Not Depo- Money Securi- Capital Remai- Euro Other Not tic MUMS of the alloca- sits market ties and ning curren- clas- (a) world ted fund other reserves liabili- cies sified shares/ than ties units shares
=11a13 =6a10=
07 3 005.3 1 726.1 230.1 211.6 837.5 2 167.8 ... 426.4 206.3 204.8 2 281.7 312.4 411.1 08 3 381.2 1 977.7 235.1 269.8 898.6 2 482.5 ... 398.6 242.4 257.6 2 510.6 370.5 500.0 09 3 433.3 2 001.7 245.2 262.5 923.8 2 509.5 ... 439.9 269.8 214.1 2 599.1 350.2 483.9 10 3 462.9 1 999.6 228.2 283.5 951.5 2 511.3 ... 432.9 282.5 236.1 2 580.3 363.9 518.7 11 3 613.1 2 024.2 244.8 248.7 1 095.4 2 517.7 ... 434.5 367.1 293.8 2 633.4 318.7 660.9 12 3 574.8 2 109.1 160.3 180.5 1 124.9 2 449.9 ... 394.3 405.2 325.4 2 602.8 241.4 730.6
11 Aug 3 543.6 1 967.1 269.3 270.9 1 036.3 2 507.3 ... 429.6 344.0 262.7 2 594.0 342.9 606.8 Sep 3 561.4 1 963.4 266.6 271.9 1 059.5 2 501.9 ... 424.8 350.1 284.6 2 582.9 343.8 634.7 Oct 3 543.1 1 953.9 268.0 259.2 1 062.1 2 481.1 ... 429.0 353.0 280.1 2 583.8 326.3 633.1 Nov 3 538.1 1 966.4 255.6 255.9 1 060.2 2 477.9 ... 429.5 350.3 280.4 2 584.7 322.7 630.7 Dec 3 613.1 2 024.2 244.8 248.7 1 095.4 2 517.7 ... 434.5 367.1 293.8 2 633.4 318.7 660.9
12 Jan 3 628.6 2 003.4 248.5 243.1 1 133.7 2 495.0 ... 445.2 377.1 311.4 2 626.6 313.5 688.5 Feb 3 646.7 2 050.8 248.2 229.6 1 118.1 2 528.6 ... 444.5 378.6 295.0 2 673.0 300.1 673.6 Mar 3 723.6 2 169.6 227.2 219.9 1 106.9 2 616.7 ... 442.0 377.8 287.1 2 772.6 286.1 664.9 Apr 3 668.7 2 119.7 228.5 214.8 1 105.8 2 563.0 ... 432.2 376.9 296.7 2 713.5 281.6 673.6 May 3 720.8 2 154.0 214.1 217.2 1 135.4 2 585.4 ... 423.9 372.7 338.8 2 727.4 281.9 711.5 Jun 3 719.0 2 198.8 197.9 211.1 1 111.3 2 607.7 ... 410.7 383.7 316.9 2 743.2 275.2 700.6 Jul 3 664.3 2 147.0 189.4 197.8 1 130.1 2 534.2 ... 410.5 385.1 334.5 2 679.9 264.8 719.6 Aug 3 621.9 2 130.9 175.5 187.8 1 127.7 2 494.2 ... 408.4 388.2 331.2 2 648.7 253.9 719.4 Sep 3 628.6 2 130.9 176.7 191.7 1 129.2 2 499.4 ... 401.2 398.1 330.0 2 647.7 252.8 728.0 Oct 3 592.0 2 111.2 175.5 189.8 1 115.5 2 476.5 ... 395.5 397.8 322.2 2 618.3 253.7 720.0 Nov 3 582.6 2 125.6 159.7 184.1 1 113.2 2 469.4 ... 389.6 397.0 326.6 2 612.3 246.7 723.6 Dec 3 574.8 2 109.1 160.3 180.5 1 124.9 2 449.9 ... 394.3 405.2 325.4 2 602.8 241.4 730.6
13 Jan 3 503.2 2 044.3 172.1 182.2 1 104.6 2 398.6 ... 390.7 404.0 309.9 2 549.1 240.1 713.9
BANCO DE ESPAÑA 190 BOLETÍN ESTADÍSTICO, FEBRUARY 2013

P
1=2+10+ 2=4+6+8 3=5+7+9 4 5 6 7 8 9 10 11 12 13
8. OTHER MONETARY FINANCIAL INSTITUTIONS 8.43 Credit institutions(data from euro area returns) Assets. DomesticD) Balance sheet of the institutional groupings of other MFIs
EUR millions Loans Securities other Money Shares than shares market and
Total fund other shares/ equity of which of which of which of which of which units MFIs General Other Total total govern- resi- Total Euro Euro ment Euro dents Euro Euro
12+13
07 2 396 752 2 048 013 2 026 111 246 119 240 165 42 737 42 724 1 759 158 1 743 222 246 953 246 100 - 101 786 08 2 678 303 2 187 260 2 157 983 263 151 258 912 52 772 52 735 1 871 337 1 846 335 398 882 398 004 2 92 160 09 2 762 785 2 153 242 2 132 174 246 811 243 654 64 449 64 428 1 841 982 1 824 092 510 167 507 914 0 99 376 10 2 789 922 2 170 017 2 146 833 234 098 231 070 78 583 78 583 1 857 337 1 837 180 516 754 512 147 0 103 150 11 2 839 749 2 137 301 2 114 068 250 787 247 239 89 285 89 285 1 797 230 1 777 545 539 619 534 945 0 162 829 12 2 741 563 2 011 282 1 992 897 279 294 277 038 114 221 114 221 1 617 768 1 601 639 561 848 557 029 7 168 426
11 Aug 2 816 274 2 142 813 2 121 286 254 712 252 076 86 276 86 276 1 801 825 1 782 934 515 741 511 665 0 157 720 Sep 2 802 339 2 129 198 2 106 596 238 599 235 611 87 404 87 404 1 803 195 1 783 582 510 157 505 892 0 162 983 Oct 2 792 869 2 123 892 2 102 245 243 680 240 797 87 263 87 263 1 792 949 1 774 185 503 422 499 300 0 165 554 Nov 2 788 376 2 121 425 2 099 571 234 394 231 628 87 656 87 656 1 799 376 1 780 287 505 332 501 145 0 161 619 Dec 2 839 749 2 137 301 2 114 068 250 787 247 239 89 285 89 285 1 797 230 1 777 545 539 619 534 945 0 162 829
12 Jan 2 845 973 2 117 675 2 095 660 243 410 240 500 90 454 90 453 1 783 811 1 764 707 560 386 555 700 0 167 912 Feb 2 854 113 2 109 920 2 088 337 241 818 238 516 91 234 91 234 1 776 868 1 758 587 575 681 571 198 0 168 512 Mar 2 926 455 2 163 697 2 142 494 289 258 286 443 92 027 92 027 1 782 412 1 764 024 595 568 591 137 0 167 188 Apr 2 861 192 2 106 331 2 084 312 248 688 245 445 92 768 92 768 1 764 874 1 746 099 587 050 582 450 0 167 810 May 2 857 425 2 115 962 2 092 986 256 811 253 725 104 488 104 488 1 754 664 1 734 774 573 790 568 949 0 167 673 Jun 2 865 080 2 135 099 2 112 403 253 373 249 556 123 230 123 230 1 758 495 1 739 617 564 127 559 399 0 165 854 Jul 2 808 113 2 108 412 2 085 667 254 162 250 641 123 603 123 603 1 730 647 1 711 424 533 248 528 413 0 166 452 Aug 2 778 129 2 088 334 2 066 567 252 529 249 538 121 867 121 867 1 713 938 1 695 162 522 261 517 538 0 167 534 Sep 2 792 187 2 096 288 2 075 086 257 825 254 973 120 905 120 905 1 717 557 1 699 208 527 884 522 893 0 168 015 Oct 2 774 451 2 082 992 2 062 828 258 081 255 418 120 744 120 744 1 704 167 1 686 666 524 575 519 683 3 166 881 Nov 2 770 693 2 083 397 2 064 011 265 549 263 017 119 282 119 282 1 698 565 1 681 711 523 441 518 587 5 163 849 Dec 2 741 563 2 011 282 1 992 897 279 294 277 038 114 221 114 221 1 617 768 1 601 639 561 848 557 029 7 168 426
13 Jan 2 697 874 1 961 329 1 944 206 249 738 247 483 113 671 113 671 1 597 920 1 583 052 566 407 561 730 7 170 130
P
1=2+5+6+7 2=3+4 3 4 5 6 7=8+14 8=9+10+ 9 10 11 12 13 14
8. OTHER MONETARY FINANCIAL INSTITUTIONS 8.44 Credit institutions(data from euro area returns) Liabilities. Domestic deposits by sector andD) Balance sheet of the institutional groupings of other MFIs deposits of other resident sectors by instrument
EUR millions
By sectors
Total MFIs General govern. Other residents Total Credit Money Central Other In euros Not insti- market govern- general Total clas- tutions funds ment govern- sified and ment Total Over- of which Redee- Repos B.E. night With mable agreed at no- maturi- Up to 2 tice 12+13 ty years
07 1 726 062 268 658 268 638 19 26 730 48 489 1 382 185 1 338 341 438 038 814 692 352 706 19 85 592 43 844 08 1 977 713 321 442 314 960 6 482 35 668 40 386 1 580 218 1 543 445 423 738 1 039 696 500 488 20 79 991 36 773 09 2 001 735 308 169 304 928 3 241 44 130 37 675 1 611 760 1 578 664 470 154 1 041 390 476 500 26 67 095 33 096 10 1 999 632 272 116 269 665 2 451 45 458 33 622 1 648 437 1 617 665 472 720 1 075 156 477 373 37 69 752 30 772 11 2 024 193 373 858 372 485 1 373 45 738 23 979 1 580 619 1 552 522 472 450 1 019 797 442 651 45 60 229 28 097 12 2 109 052 574 312 572 845 1 467 42 574 26 609 1 465 557 1 435 357 463 947 911 573 457 667 42 59 796 30 200
11 Aug 1 967 072 302 756 300 850 1 905 34 704 25 990 1 603 623 1 575 723 465 199 1 053 216 462 187 44 57 264 27 900 Sep 1 963 381 291 618 290 121 1 497 45 294 25 449 1 601 019 1 572 620 461 657 1 050 362 460 537 44 60 557 28 399 Oct 1 953 865 314 712 313 284 1 428 40 615 26 185 1 572 354 1 546 302 455 433 1 035 277 453 235 44 55 548 26 052 Nov 1 966 397 321 008 319 690 1 318 44 872 30 447 1 570 071 1 543 217 462 659 1 026 080 444 719 45 54 434 26 854 Dec 2 024 193 373 858 372 485 1 373 45 738 23 979 1 580 619 1 552 522 472 450 1 019 797 442 651 45 60 229 28 097
12 Jan 2 003 373 376 704 375 268 1 436 51 840 23 701 1 551 128 1 523 166 458 710 1 006 560 441 103 45 57 851 27 962 Feb 2 050 809 424 374 421 838 2 536 51 377 24 136 1 550 923 1 523 476 457 650 1 002 268 450 320 46 63 511 27 447 Mar 2 169 646 530 617 528 929 1 688 48 884 25 368 1 564 776 1 538 621 466 589 1 002 833 449 677 46 69 153 26 155 Apr 2 119 692 523 122 521 424 1 698 42 739 24 937 1 528 894 1 502 319 458 212 987 936 443 923 46 56 125 26 574 May 2 153 986 556 664 555 102 1 562 53 754 26 397 1 517 171 1 489 574 464 103 969 381 433 947 45 56 045 27 597 Jun 2 198 766 616 049 614 665 1 385 39 792 28 797 1 514 127 1 486 955 481 529 944 150 426 107 45 61 231 27 172 Jul 2 146 952 636 834 635 466 1 368 36 191 25 751 1 448 176 1 420 439 462 783 905 511 414 907 44 52 101 27 737 Aug 2 130 908 641 346 639 974 1 372 31 182 24 297 1 434 085 1 406 861 462 383 897 380 412 017 43 47 055 27 223 Sep 2 130 943 608 339 606 889 1 449 48 686 25 384 1 448 535 1 420 892 461 693 900 528 418 021 42 58 629 27 644 Oct 2 111 193 595 269 593 678 1 591 41 178 27 738 1 447 008 1 416 734 453 972 903 260 429 209 42 59 460 30 274 Nov 2 125 622 591 820 590 261 1 559 47 381 27 687 1 458 734 1 428 345 458 986 910 004 441 944 42 59 313 30 389 Dec 2 109 052 574 312 572 845 1 467 42 574 26 609 1 465 557 1 435 357 463 947 911 573 457 667 42 59 796 30 200
13 Jan 2 044 283 518 304 516 897 1 407 40 236 28 432 1 457 310 1 428 282 457 228 914 500 463 481 42 56 512 29 028
BANCO DE ESPAÑA 191 BOLETÍN ESTADÍSTICO, FEBRUARY 2013

CONCEPTS
I. DEPOSITS IN CREDIT INSTITUTIONS, EXCEPT OF EMU RESIDENTS CREDIT INSTITUTIONS, NCBs AND ECB
A.1. Overnight, with agreed maturity up to two years and redeemable at notice up to two years (9+ +13+18+22+27+29+30+33+35+36+ +40+42+43+46+48+49+60+64 +69+73+78+80+81+84+86+87
B.1. With agreed maturity over two years (10+14+ +19+23+28-29+34-35+41-42+ +47-48+61+65+70+74+79-80+
B.2. Reedemable at notice over two years
B.3. Repos (11+15+20+24+31+37+44+ +50+62+66+71+75+82+88+95+
II. NEGOTIABLE INSTRUMENTS ISSUED BY CREDIT INSTITUTIONS
A.1. Debt securities issued up to two year (net)
B.1. Debt securities issued over two year (net)
___________________________________________________________________________________________________________________________
Véanse notas al final del capítulo./ See notes at the end of the chapter.
8. ENTIDADES DE CRÉDITO 8.E Apéndice al balance. Determinación de los pasivos D) Balances de los componentes de OIFM de las entidades de crédito sujetas a reservas mínimas (a),(b)
Datos referidos a Diciembre de 2012 Millones de euros
Serie en cuadro y Entidades columna/ de crédito Time se- (Cuadro 8.C col.3)/ ries in Credit
table and institutions column (Table 8.C col.3)
1 2
CONCEPTOS
I. DEPÓSITOS EN LAS ENTIDADES DE CRÉDITO RESIDENTES, EXCEPTO LOS DE LAS ENTIDADES RESIDENTES EN LA ZONA EURO, BCNS Y BCE
A. Sujetos a coeficiente de caja del 1 % . . . . . . . . . . . . 8.45/2 1 081 161 A. Subject to reserve ratio of 1 % A.1. A la vista, a plazo hasta dos años y disponi- ble con preaviso hasta dos años (9+13+18+ +22+27+29+30+33+35+36+40+42+ +43+46+48+49+60+64+69+73 +78+80+81+84+86+87+91+93+94+ +97+99+100+106+110) . . . . . . . . . . . . . . . . . . 8.45/2 1 081 161 +91+93+94+97+99+100+106+110)
B. Sujetos a coeficiente de caja cero . . . . . . . . . . . . . - 668 447 B. Subject to zero reserve ratio
B.1. A plazo a más de dos años (10+14+19+ +23+28-29+34-35+41-42+47-48+ +61+65+70+74+79-80+85-86+92- -93+98-99+107+111) . . . . . . . . . . . . . . . . . . . 8.45/5 550 662 +85-86+92-93+98-99+107+111)
B.2. Disponible con preaviso a más de dos años (inexistente para las IFMs residentes). . . . . . . . . . . . - - (it doesn’t exist in residents MFIs)
B.3. Cesiones temporales (11+15+20+24+31+ +37+44+50+62+66+71+75+82+ +88+95+101+108+112) . . . . . . . . . . . . . . . . . . 8.45/7 117 786 +101+108+112)
II. INSTRUMENTOS NEGOCIABLES EMITIDOS POR ENTIDADES DE CRÉDITO
A. Sujetos a coeficiente de caja del 1 % . . . . . . . . . . . . 8.45/3 46 886 A. Subject to reserve ratio of 1 %
A.1. Valores distintos de acciones y participacio- nes emitidos hasta dos años (neto) (70%(117+119)) . . . . . . . . . . . . . . . . . . . . . 8.45/3 46 886 (70%(117+119))
B. Sujetos a coeficiente de caja cero . . . . . . . . . . . . . 8.45/6 326 832 B. Subject to zero reserve ratio
B.1. Valores distintos de acciones y participacio- nes emitidos a más de dos años (neto) (116- -117+118-119) . . . . . . . . . . . . . . . . . . . . . . 8.45/6 326 832 (116-117+118-119)
December 2012 data EUR millions
8.E Appendix to Balance sheet. Determination of credit 8.CREDIT INSTITUTIONSinstitutions’ liabilities subject to minimun reserves D) Balance sheet of the institutional groupings of other MFIs(reserve base).
BANCO DE ESPAÑA 192 BOLETÍN ESTADÍSTICO, FEBRUARY 2013

P
1 2 3 4 5 6 7
8. OTHER MONETARY FINANCIAL INSTITUTIONS 8.45 Reserve base for the ESCB’s minimumD) Balance sheet of the institutional groupings of other MFIs reserve system
EUR millions
Necesary information to compute reserve requirements
Liabilities to which a positive Liabilities to which a 0% reserve reserve coefficient is applied coefficient is applied
Total Deposits Securities Total With agreed Securities Repos up to up to 2 maturity o- over 2 2 years years ver 2 years years deposits
06 968 474 915 378 53 096 797 029 409 009 276 783 110 726 07 1 123 559 1 041 934 81 625 909 325 480 183 309 809 118 713 08 1 293 222 1 233 305 59 917 1 047 325 607 016 313 030 126 705 09 1 279 454 1 231 786 47 669 1 135 198 644 437 371 779 118 593 10 1 231 087 1 207 026 24 061 1 249 609 658 138 396 635 194 836 11 1 131 476 1 095 914 35 562 1 257 829 668 052 380 811 208 966
11 Jul 1 159 282 1 137 145 22 138 1 308 209 683 914 395 892 228 403 Aug 1 150 913 1 129 065 21 848 1 283 168 680 429 394 129 208 610 Sep 1 137 641 1 116 540 21 100 1 307 362 684 566 391 325 231 472 Oct 1 127 546 1 101 658 25 888 1 277 290 675 871 388 280 213 138 Nov 1 129 753 1 100 833 28 921 1 267 878 670 623 385 246 212 008 Dec 1 131 476 1 095 914 35 562 1 257 829 668 052 380 811 208 966
12 Jan 1 118 080 1 079 294 38 786 1 260 676 659 429 386 787 214 460 Feb 1 133 172 1 089 455 43 717 1 223 643 647 761 379 328 196 553 Mar 1 141 583 1 093 881 47 702 1 204 285 647 898 370 796 185 591 Apr 1 125 954 1 077 709 48 245 1 166 421 639 449 360 530 166 442 May 1 116 913 1 066 409 50 504 1 148 124 635 437 350 099 162 588 Jun 1 125 925 1 074 229 51 695 1 097 873 617 898 335 332 144 642 Jul 1 093 490 1 038 822 54 668 1 038 949 591 156 331 128 116 666 Aug 1 077 773 1 024 036 53 737 1 018 550 585 978 329 803 102 769 Sep 1 087 587 1 035 079 52 508 1 038 900 580 743 325 323 132 834 Oct 1 095 880 1 046 097 49 783 1 016 280 573 003 323 303 119 974 Nov 1 112 357 1 064 137 48 220 1 006 658 562 804 319 070 124 784 Dec 1 128 047 1 081 161 46 886 995 280 550 662 326 832 117 786
P
1=2a5= 2 3 4 5=10a12 6 7 8 9 10 11 12 13 14 15
8. OTHER MONETARY FINANCIAL INSTITUTIONS 8.51 Deposit-taking institutions(data from euro area returns) Assets. SummaryD) Balance sheet of the institutional groupings of other MFIs
See notes at the end of the chapter
Eur billions By residence By instrument By currencies
Total Domestic Other Rest Not a- Loans Securi- Money Shares Cash Fixed Remai- Euro Other Not (a) MUMS of the lloca- ties market and (all assets ning curren- clas- world ted other fund other curren- assets cies sified than sha- equity cies) shares res/ units
=13a15= =6a12=
07 2 896.2 2 297.6 213.9 197.2 187.6 2 208.6 316.9 - 183.4 8.5 29.5 149.6 2 564.9 152.5 179.1 08 3 252.3 2 561.4 215.0 194.9 281.0 2 331.2 468.5 0.0 171.6 9.0 35.6 236.4 2 810.8 169.5 272.0 09 3 315.0 2 654.7 206.0 205.2 249.1 2 289.5 592.6 0.0 183.8 8.5 44.2 196.4 2 917.7 156.7 240.6 10 3 305.5 2 647.0 154.5 211.2 292.9 2 273.7 558.8 0.0 180.2 7.9 48.8 236.2 2 860.7 159.9 285.0 11 3 444.6 2 687.1 155.7 222.4 379.5 2 230.6 581.8 0.0 252.7 7.5 56.1 315.9 2 903.3 169.3 372.0 12 3 394.9 2 574.2 169.0 232.0 419.6 2 094.9 622.0 0.0 258.3 7.4 51.9 360.3 2 837.1 145.6 412.2
11 Aug 3 383.8 2 669.8 166.3 214.7 333.1 2 243.6 560.8 0.0 246.3 7.1 53.9 272.0 ... ... 325.9 Sep 3 400.7 2 656.2 166.6 215.7 362.1 2 231.0 556.3 0.0 251.3 6.9 54.3 301.0 2 881.5 164.0 355.3 Oct 3 381.3 2 644.8 166.1 215.7 354.7 2 223.7 548.9 0.0 254.0 7.1 54.7 292.9 ... ... 347.7 Nov 3 377.0 2 641.5 156.5 217.3 361.7 2 216.8 548.0 0.0 250.4 7.0 55.3 299.4 ... ... 354.7 Dec 3 444.6 2 687.1 155.7 222.4 379.5 2 230.6 581.8 0.0 252.7 7.5 56.1 315.9 2 903.3 169.3 372.0
12 Jan 3 454.5 2 688.1 157.0 222.0 387.3 2 205.8 602.4 0.0 258.9 7.1 56.5 323.8 ... ... 380.3 Feb 3 469.7 2 693.3 166.3 227.6 382.5 2 209.0 618.5 0.0 259.7 6.8 57.2 318.5 ... ... 375.7 Mar 3 524.1 2 744.6 164.1 239.2 376.2 2 256.0 633.9 0.0 258.1 6.9 57.8 311.6 2 991.9 162.9 369.3 Apr 3 474.2 2 683.3 159.4 242.1 389.5 2 201.7 623.5 0.0 259.4 6.8 58.3 324.4 ... ... 382.7 May 3 532.6 2 686.0 151.7 252.4 442.5 2 218.6 612.7 0.0 258.8 6.8 58.7 377.0 ... ... 435.8 Jun 3 529.1 2 691.0 158.9 255.8 423.4 2 246.4 602.9 0.0 256.4 6.8 58.8 357.8 2 944.1 168.5 416.6 Jul 3 476.3 2 636.9 152.7 250.4 436.2 2 212.3 570.4 0.0 257.4 7.1 58.7 370.4 ... ... 429.2 Aug 3 435.2 2 608.0 149.2 243.4 434.6 2 181.4 559.9 0.0 259.2 6.8 59.8 367.9 ... ... 427.8 Sep 3 446.1 2 624.5 147.9 239.2 434.5 2 184.6 568.2 0.0 258.9 6.6 60.4 367.5 2 856.9 161.3 427.9 Oct 3 410.3 2 605.5 146.0 236.8 421.9 2 171.9 558.8 0.0 257.6 6.8 60.6 354.5 ... ... 415.2 Nov 3 406.3 2 607.2 135.7 233.8 429.6 2 172.8 549.3 0.0 254.5 6.6 60.7 362.2 ... ... 422.9 Dec 3 394.9 2 574.2 169.0 232.0 419.6 2 094.9 622.0 0.0 258.3 7.4 51.9 360.3 2 837.1 145.6 412.2
13 Jan 3 323.2 2 529.6 173.6 230.6 389.4 2 052.5 621.7 0.0 259.6 6.6 52.2 330.6 ... ... 382.8
BANCO DE ESPAÑA 193 BOLETÍN ESTADÍSTICO, FEBRUARY 2013

P
1=2a5= 2 3 4 5=8a10 6 7 8 9 10 11 12 13
8. OTHER MONETARY FINANCIAL INSTITUTIONS 8.52 Deposit-taking institutions(data from euro area returns) Liabilities. SummaryD) Balance sheet of the institutional groupings of other MFIs
See notes at the end of the chapter
Eur billions By residence By instrument By currencies
Total Domes- Other Rest Not Depo- Money Securi- Capital Remai- Euro Other Not tic MUMS of the alloca- sits market ties and ning curren- clas- (a) world ted fund other reserves liabili- cies sified shares/ than ties units shares
=11a13 =6a10=
07 2 896.5 1 676.3 220.2 209.8 789.8 2 106.7 ... 395.9 199.2 194.7 2 209.7 292.9 393.9 08 3 252.3 1 922.7 224.4 268.1 837.2 2 415.1 ... 359.3 232.8 245.1 2 429.8 344.7 477.9 09 3 315.0 1 957.5 236.8 260.8 859.9 2 455.1 ... 396.5 259.7 203.6 2 528.6 323.0 463.4 10 3 305.5 1 931.9 219.0 280.7 873.9 2 431.6 ... 377.5 269.9 226.5 2 473.0 336.0 496.4 11 3 444.6 1 955.0 237.0 245.3 1 007.3 2 437.3 ... 368.6 353.9 284.8 2 507.8 298.1 638.7 12 3 394.9 2 032.0 154.6 176.3 1 032.0 2 362.9 ... 324.4 391.4 316.2 2 460.5 226.8 707.5
11 Aug 3 383.8 1 903.1 261.6 268.3 950.8 2 433.0 ... 366.0 332.0 252.9 2 477.9 321.0 584.9 Sep 3 400.7 1 900.2 258.8 269.0 972.6 2 428.1 ... 360.0 337.1 275.5 2 466.7 321.4 612.7 Oct 3 381.3 1 890.3 260.3 256.5 974.2 2 407.1 ... 363.0 340.7 270.5 2 465.6 304.5 611.2 Nov 3 377.0 1 903.2 248.0 253.2 972.7 2 404.3 ... 363.9 337.6 271.1 2 466.9 301.3 608.8 Dec 3 444.6 1 955.0 237.0 245.3 1 007.3 2 437.3 ... 368.6 353.9 284.8 2 507.8 298.1 638.7
12 Jan 3 454.5 1 935.4 240.5 239.6 1 039.1 2 415.5 ... 373.4 363.4 302.3 2 495.8 293.1 665.6 Feb 3 469.7 1 983.1 240.3 226.1 1 020.3 2 449.4 ... 369.6 364.9 285.8 2 539.1 279.9 650.7 Mar 3 524.1 2 078.2 219.2 216.5 1 010.1 2 514.0 ... 368.0 364.0 278.2 2 615.8 266.2 642.2 Apr 3 474.2 2 033.6 220.5 211.4 1 008.7 2 465.5 ... 358.8 362.6 287.3 2 562.3 262.0 649.9 May 3 532.6 2 073.8 207.2 213.5 1 038.1 2 494.5 ... 351.2 357.5 329.4 2 583.7 262.0 686.9 Jun 3 529.1 2 116.1 191.0 206.8 1 015.1 2 514.0 ... 338.6 368.9 307.6 2 596.7 255.8 676.5 Jul 3 476.3 2 064.3 182.3 193.5 1 036.2 2 440.1 ... 341.0 369.6 325.6 2 534.6 246.5 695.2 Aug 3 435.2 2 048.3 168.4 183.6 1 035.0 2 400.2 ... 339.9 372.8 322.3 2 503.6 236.4 695.1 Sep 3 446.1 2 050.5 170.5 187.8 1 037.4 2 408.7 ... 333.3 383.0 321.1 2 504.8 237.2 704.1 Oct 3 410.3 2 029.8 169.4 186.1 1 025.0 2 385.3 ... 327.4 384.1 313.5 2 473.3 239.4 697.6 Nov 3 406.3 2 050.8 153.8 180.4 1 021.3 2 385.0 ... 321.0 382.6 317.7 2 473.7 232.3 700.3 Dec 3 394.9 2 032.0 154.6 176.3 1 032.0 2 362.9 ... 324.4 391.4 316.2 2 460.5 226.8 707.5
13 Jan 3 323.2 1 967.0 166.5 178.1 1 011.5 2 311.7 ... 320.3 390.3 301.0 2 405.5 226.4 691.3
P
1=2+10+ 2=4+6+8 3=5+7+9 4 5 6 7 8 9 10 11 12 13
8. OTHER MONETARY FINANCIAL INSTITUTIONS 8.53 Deposit-taking institutions(data from euro area returns) Assets. DomesticD) Balance sheet of the institutional groupings of other MFIs
EUR millions Loans Securities other Money Shares than shares market and
Total fund other shares/ equity of which of which of which of which of which units MFIs General Other Total total govern- resi- Total Euro Euro ment Euro dents Euro Euro
12+13
07 2 297 576 1 960 220 1 939 063 229 815 223 933 38 676 38 663 1 691 729 1 676 467 236 042 235 190 - 101 577 08 2 561 382 2 083 778 2 055 945 239 106 234 958 47 565 47 528 1 797 106 1 773 458 385 657 384 779 2 91 945 09 2 654 667 2 058 417 2 038 328 215 661 212 546 61 016 60 995 1 781 740 1 764 788 497 089 494 836 0 99 160 10 2 647 002 2 050 539 2 028 414 188 440 185 465 74 116 74 116 1 787 983 1 768 832 493 585 488 977 0 102 878 11 2 687 097 2 003 669 1 981 726 199 164 195 803 82 593 82 593 1 721 912 1 703 330 520 868 516 195 0 162 559 12 2 574 211 1 869 112 1 851 790 229 930 227 944 96 840 96 840 1 542 342 1 527 005 536 972 532 153 7 168 120
11 Aug 2 669 752 2 019 944 1 999 498 203 488 200 920 82 095 82 095 1 734 361 1 716 484 492 341 488 266 0 157 466 Sep 2 656 249 2 005 896 1 984 416 187 462 184 514 83 144 83 144 1 735 290 1 716 758 487 623 483 358 0 162 729 Oct 2 644 801 1 999 279 1 978 979 191 622 189 044 82 398 82 398 1 725 259 1 707 537 480 228 476 106 0 165 293 Nov 2 641 541 1 994 060 1 973 364 182 710 180 026 82 193 82 193 1 729 158 1 711 145 486 122 481 935 0 161 358 Dec 2 687 097 2 003 669 1 981 726 199 164 195 803 82 593 82 593 1 721 912 1 703 330 520 868 516 195 0 162 559
12 Jan 2 688 140 1 981 883 1 961 095 192 595 189 833 84 063 84 062 1 705 225 1 687 200 538 614 533 928 0 167 643 Feb 2 693 322 1 975 245 1 955 138 189 789 186 941 84 363 84 363 1 701 094 1 683 835 549 835 545 352 0 168 242 Mar 2 744 628 2 013 235 1 993 226 226 455 223 805 85 113 85 113 1 701 667 1 684 308 564 473 560 042 0 166 920 Apr 2 683 314 1 959 823 1 938 952 191 196 188 062 84 552 84 552 1 684 074 1 666 338 555 976 551 377 0 167 514 May 2 685 956 1 971 360 1 949 593 202 252 199 271 91 662 91 662 1 677 446 1 658 661 547 220 542 378 0 167 376 Jun 2 691 035 1 985 943 1 964 705 198 611 195 186 105 980 105 980 1 681 351 1 663 539 539 536 534 808 0 165 557 Jul 2 636 922 1 962 211 1 941 060 202 049 199 040 105 979 105 979 1 654 183 1 636 041 508 554 503 719 0 166 157 Aug 2 608 010 1 942 638 1 921 940 200 863 197 887 104 286 104 286 1 637 490 1 619 767 498 133 493 410 0 167 238 Sep 2 624 536 1 951 382 1 931 223 206 632 203 794 103 363 103 363 1 641 387 1 624 066 505 435 500 444 0 167 718 Oct 2 605 512 1 937 428 1 918 302 207 990 205 421 103 230 103 230 1 626 208 1 609 651 501 499 496 608 3 166 581 Nov 2 607 152 1 942 413 1 924 084 215 444 213 031 101 745 101 745 1 625 224 1 609 308 501 186 496 332 5 163 547 Dec 2 574 211 1 869 112 1 851 790 229 930 227 944 96 840 96 840 1 542 342 1 527 005 536 972 532 153 7 168 120
13 Jan 2 529 591 1 822 373 1 806 286 202 796 200 812 96 978 96 978 1 522 599 1 508 496 537 390 532 713 7 169 821
BANCO DE ESPAÑA 194 BOLETÍN ESTADÍSTICO, FEBRUARY 2013

P
1=2+5+6+7 2=3+4 3 4 5 6 7=8+14 8=9+10+ 9 10 11 12 13 14
8. OTHER MONETARY FINANCIAL INSTITUTIONS 8.54 Deposit-taking institutions(data from euro area returns) Liabilities. Domestic deposits by sector andD) Balance sheet of the institutional groupings of other MFIs deposits of other resident sectors by instrument
EUR millions
By sectors
Total MFIs General govern. Other residents Total Credit Money Central Other In euros Not insti- market govern- general Total clas- tutions funds ment govern- sified and ment Total Over- of which Redee- Repos B.E. night With mable agreed at no- maturi- Up to 2 tice 12+13 ty years
07 1 676 341 222 707 222 688 19 25 989 48 482 1 379 090 1 335 583 437 944 812 047 350 586 0 85 592 43 844 08 1 922 684 272 173 265 691 6 482 34 682 40 376 1 575 403 1 538 681 423 651 1 035 039 498 741 - 79 991 36 773 09 1 957 471 274 037 270 819 3 217 40 211 37 663 1 605 533 1 572 465 468 928 1 036 443 476 236 - 67 095 33 096 10 1 931 886 238 533 236 112 2 421 41 680 33 607 1 618 056 1 587 295 469 709 1 047 834 476 990 - 69 752 30 772 11 1 955 025 341 202 339 882 1 320 42 504 23 966 1 547 351 1 519 256 464 913 994 393 442 217 - 59 950 28 097 12 2 032 004 525 459 523 992 1 467 40 742 26 599 1 439 781 1 409 002 457 892 891 315 457 316 - 59 796 30 200
11 Aug 1 903 139 268 678 266 809 1 869 31 256 25 976 1 577 227 1 549 329 461 791 1 030 274 461 848 - 57 264 27 900 Sep 1 900 234 258 779 257 322 1 457 41 770 25 436 1 574 246 1 545 849 457 773 1 027 520 460 225 - 60 557 28 399 Oct 1 890 293 282 341 280 953 1 388 37 134 26 172 1 544 644 1 518 595 450 826 1 012 513 452 926 - 55 256 26 052 Nov 1 903 169 288 761 287 481 1 280 41 466 30 434 1 542 506 1 515 654 455 654 1 005 999 444 400 - 54 001 26 854 Dec 1 955 025 341 202 339 882 1 320 42 504 23 966 1 547 351 1 519 256 464 913 994 393 442 217 - 59 950 28 097
12 Jan 1 935 390 345 824 344 441 1 383 48 577 23 689 1 517 299 1 489 339 450 221 981 369 440 814 - 57 749 27 962 Feb 1 983 053 393 861 391 376 2 484 47 782 24 124 1 517 285 1 489 840 449 202 977 227 450 031 - 63 411 27 447 Mar 2 078 239 480 166 478 528 1 638 46 087 25 357 1 526 628 1 500 474 453 628 977 793 449 397 - 69 052 26 155 Apr 2 033 593 473 178 471 530 1 648 40 308 24 926 1 495 180 1 468 608 449 507 962 976 443 664 - 56 125 26 573 May 2 073 783 506 851 505 339 1 512 51 555 26 388 1 488 988 1 461 392 458 089 947 258 433 676 - 56 045 27 597 Jun 2 116 144 564 120 562 780 1 340 37 873 28 789 1 485 361 1 458 191 474 920 922 039 425 818 - 61 231 27 172 Jul 2 064 301 585 316 583 992 1 324 34 276 25 743 1 418 965 1 391 229 455 602 883 526 414 659 - 52 101 27 737 Aug 2 048 275 590 313 588 991 1 322 29 254 24 289 1 404 418 1 377 196 454 588 875 553 411 797 - 47 055 27 223 Sep 2 050 483 559 379 557 979 1 399 46 907 25 376 1 418 819 1 391 177 453 789 878 759 417 797 - 58 629 27 644 Oct 2 029 794 546 850 545 308 1 542 39 115 27 153 1 416 675 1 386 402 445 420 881 522 428 993 - 59 460 30 274 Nov 2 050 762 544 334 542 824 1 510 45 293 27 671 1 433 463 1 403 074 453 047 890 714 441 721 - 59 313 30 389 Dec 2 032 004 525 459 523 992 1 467 40 742 26 599 1 439 781 1 409 002 457 892 891 315 457 316 - 59 796 30 200
13 Jan 1 967 045 470 045 468 638 1 407 38 200 28 422 1 430 378 1 401 350 450 345 894 493 463 266 - 56 512 29 028
P
1=2a5= 2 3 4 5=10a12 6 7 8 9 10 11 12 13 14 15
8. OTHER MONETARY FINANCIAL INSTITUTIONS 8.81. Sspecialised credit institutions(data from euro area returns) Assets. SummaryD) Balance sheet of the institutional groupings of other MFIs
See notes at the end of the chapter
EUR millions By residence By instrument By currencies
Total Domestic Other Rest Not Loans Securi- Money Shares Cash Fixed Remai- Euro Other Not (a) MUMS of the alloca- ties market and (all assets ning curren- clas- world ted other fund other curren- assets cies sified than shares/ equity cies) shares units
=13a15= =6a12=
07 68 700 62 761 3 097 582 2 259 65 832 541 - 68 0 999 1 259 66 413 28 2 259 08 75 276 68 842 3 512 650 2 273 70 544 2 389 - 70 0 1 141 1 132 72 912 92 2 273 09 57 121 51 826 3 198 471 1 626 51 493 3 940 - 63 0 681 945 55 485 11 1 626 10 55 729 49 221 3 685 932 1 890 50 723 3 067 0 48 0 785 1 105 53 838 0 1 890 11 55 911 48 439 4 138 909 2 425 51 927 1 484 0 74 0 937 1 488 53 485 1 2 425 12 50 928 44 678 2 582 1 153 2 516 46 831 1 482 - 99 0 957 1 559 48 208 204 2 516
11 Aug 51 638 44 934 3 822 866 2 016 47 742 1 812 0 68 0 762 1 254 ... ... 2 016 Sep 51 584 44 814 3 872 983 1 915 47 914 1 687 -0 68 0 770 1 145 49 669 0 1 915 Oct 51 235 44 352 3 906 1 009 1 967 47 577 1 616 -0 75 0 774 1 193 ... ... 1 967 Nov 50 686 43 804 3 873 1 009 2 000 47 092 1 519 -0 75 0 795 1 205 ... ... 2 000 Dec 55 911 48 439 4 138 909 2 425 51 927 1 484 0 74 0 937 1 488 53 485 1 2 425
12 Jan 54 724 47 214 4 040 1 019 2 451 50 707 1 492 - 74 0 940 1 511 ... ... 2 451 Feb 54 506 46 886 4 035 1 138 2 446 50 486 1 500 - 74 0 948 1 498 ... ... 2 446 Mar 55 107 47 231 4 117 1 270 2 489 51 024 1 521 - 73 0 968 1 520 52 615 3 2 489 Apr 54 973 47 056 4 106 1 268 2 542 50 768 1 563 - 100 0 974 1 568 ... ... 2 542 May 53 728 46 443 3 487 1 256 2 542 49 481 1 606 - 100 0 974 1 568 ... ... 2 541 Jun 53 478 46 326 3 527 968 2 657 49 121 1 600 - 100 0 984 1 673 50 728 93 2 657 Jul 52 993 45 876 3 419 1 112 2 587 48 625 1 681 - 100 0 992 1 594 ... ... 2 587 Aug 52 439 45 217 3 367 1 254 2 600 47 976 1 762 - 100 0 990 1 610 ... ... 2 600 Sep 51 569 45 244 2 618 997 2 710 46 937 1 822 - 100 0 997 1 713 48 777 82 2 710 Oct 50 527 44 361 2 581 958 2 627 46 049 1 752 - 100 0 996 1 630 ... ... 2 626 Nov 49 834 43 683 2 554 927 2 671 45 436 1 627 - 100 0 1 005 1 666 ... ... 2 671 Dec 50 928 44 678 2 582 1 153 2 516 46 831 1 482 - 99 0 957 1 559 48 208 204 2 516
13 Jan 50 014 43 945 2 556 981 2 531 45 932 1 451 - 99 0 965 1 567 ... ... 2 531
BANCO DE ESPAÑA 195 BOLETÍN ESTADÍSTICO, FEBRUARY 2013

P
1=2a5= 2 3 4 5=8a10 6 7 8 9 10 11 12 13
8. OTHER MONETARY FINANCIAL INSTITUTIONS 8.82. Specialised credit institutions(data from euro area returns) Liabilities. SummaryD) Balance sheet of the institutional groupings of other MFIs
See notes at the end of the chapter
EUR millions By residence By instrument By currencies
Total Domes- Other Rest Not a- Depo- Money Securi- Capital Remai- Euro Other Not tic MUMS of the llocated sits market ties and ning curren- clas- (a) world fund other reserves liabili- cies sified shares/ than ties units shares
=11a13 =6a10=
07 68 700 46 758 9 837 1 036 11 069 57 631 ... 866 6 160 4 043 57 434 1 063 10 203 08 75 276 52 239 10 675 858 11 505 63 772 ... 565 7 226 3 713 63 396 941 10 939 09 57 121 38 779 8 427 553 9 362 47 759 ... 389 6 970 2 003 47 495 653 8 973 10 55 729 37 526 8 603 306 9 293 46 435 ... 330 6 925 2 038 46 337 429 8 964 11 55 911 39 863 7 454 190 8 404 47 507 ... 296 6 231 1 876 47 612 192 8 107 12 50 928 36 591 5 033 196 9 108 41 820 ... 156 6 624 2 328 41 762 213 8 952
11 Aug 51 638 34 967 7 565 203 8 904 42 734 ... 318 6 680 1 907 42 710 342 8 587 Sep 51 584 35 079 7 530 198 8 776 42 808 ... 314 6 637 1 825 42 924 198 8 462 Oct 51 235 34 949 7 422 208 8 656 42 579 ... 315 6 451 1 890 42 686 208 8 341 Nov 50 686 34 848 7 240 211 8 386 42 300 ... 302 6 209 1 875 42 390 212 8 084 Dec 55 911 39 863 7 454 190 8 404 47 507 ... 296 6 231 1 876 47 612 192 8 107
12 Jan 54 724 38 359 7 541 192 8 633 46 091 ... 291 6 485 1 858 46 189 193 8 342 Feb 54 506 37 870 7 514 193 8 929 45 576 ... 322 6 717 1 891 45 704 195 8 607 Mar 55 107 38 171 7 619 190 9 127 45 980 ... 329 6 906 1 893 46 115 193 8 798 Apr 54 973 37 605 7 563 191 9 614 45 359 ... 330 6 922 2 361 45 496 194 9 284 May 53 728 37 335 6 420 185 9 788 43 941 ... 332 6 925 2 531 44 086 186 9 456 Jun 53 478 37 285 6 344 185 9 665 43 814 ... 316 6 912 2 436 43 945 185 9 348 Jul 52 993 36 889 6 444 186 9 474 43 519 ... 313 6 965 2 195 43 646 186 9 161 Aug 52 439 36 293 6 418 188 9 539 42 899 ... 310 7 035 2 194 43 021 188 9 229 Sep 51 569 36 119 5 607 188 9 655 41 914 ... 313 7 097 2 245 42 039 188 9 342 Oct 50 527 35 378 5 467 192 9 490 41 038 ... 248 7 108 2 133 41 088 198 9 241 Nov 49 834 34 848 5 180 197 9 610 40 224 ... 257 7 096 2 258 40 272 209 9 354 Dec 50 928 36 591 5 033 196 9 108 41 820 ... 156 6 624 2 328 41 762 213 8 952
13 Jan 50 014 35 787 5 030 196 9 001 41 013 ... 160 6 689 2 152 40 959 214 8 842
P
1=2+10+ 2=4+6+8 3=5+7+9 4 5 6 7 8 9 10 11 12 13
8. OTHER MONETARY FINANCIAL INSTITUTIONS 8.83. Specialised credit institutions(data from euro area returns) Assets. DomesticD) Balance sheet of the institutional groupings of other MFIs
EUR millions Loans Securities other Money Shares than shares market and
Total fund other shares/ equity of which of which of which of which of which units MFIs General Other Total total govern- resi- Total Euro Euro ment Euro dents Euro Euro
12+13
07 62 761 62 170 62 154 2 619 2 619 2 975 2 975 56 576 56 560 541 541 - 50 08 68 842 66 397 66 315 3 492 3 491 3 875 3 875 59 030 58 949 2 389 2 389 - 55 09 51 826 47 837 47 837 1 918 1 918 1 759 1 759 44 160 44 160 3 940 3 940 - 49 10 49 221 46 119 46 119 2 136 2 136 2 167 2 167 41 816 41 816 3 067 3 067 0 35 11 48 439 46 893 46 893 2 120 2 120 1 912 1 912 42 861 42 861 1 484 1 484 0 61 12 44 678 43 111 43 108 2 821 2 820 1 308 1 308 38 982 38 980 1 481 1 481 - 86
11 Aug 44 934 43 068 43 068 2 072 2 072 1 764 1 764 39 232 39 232 1 812 1 812 0 55 Sep 44 814 43 072 43 072 1 969 1 969 1 863 1 863 39 240 39 240 1 687 1 687 -0 54 Oct 44 352 42 675 42 675 2 002 2 002 1 897 1 897 38 775 38 775 1 616 1 616 -0 61 Nov 43 804 42 224 42 224 1 937 1 937 1 853 1 853 38 434 38 434 1 519 1 519 -0 61 Dec 48 439 46 893 46 893 2 120 2 120 1 912 1 912 42 861 42 861 1 484 1 484 0 61
12 Jan 47 214 45 667 45 666 2 242 2 242 1 609 1 609 41 815 41 815 1 486 1 486 - 61 Feb 46 886 45 337 45 335 2 471 2 470 1 563 1 563 41 304 41 303 1 489 1 489 - 60 Mar 47 231 45 668 45 665 2 866 2 864 1 553 1 553 41 250 41 248 1 503 1 503 - 60 Apr 47 056 45 424 45 422 2 740 2 739 1 818 1 818 40 866 40 865 1 545 1 545 - 87 May 46 443 44 768 44 767 2 743 2 742 1 826 1 826 40 199 40 199 1 589 1 589 - 87 Jun 46 326 44 657 44 656 2 819 2 819 1 604 1 604 40 233 40 233 1 583 1 583 - 87 Jul 45 876 44 119 44 119 2 717 2 717 1 423 1 423 39 979 39 979 1 669 1 669 - 87 Aug 45 217 43 375 43 374 2 664 2 664 1 370 1 370 39 341 39 341 1 756 1 756 - 87 Sep 45 244 43 337 43 337 3 077 3 077 1 344 1 344 38 916 38 916 1 821 1 821 - 86 Oct 44 361 42 524 42 523 2 773 2 773 1 342 1 342 38 409 38 408 1 751 1 751 - 86 Nov 43 683 41 970 41 968 2 848 2 847 1 307 1 307 37 815 37 814 1 626 1 626 - 86 Dec 44 678 43 111 43 108 2 821 2 820 1 308 1 308 38 982 38 980 1 481 1 481 - 86
13 Jan 43 945 42 409 42 406 2 976 2 975 950 950 38 483 38 481 1 450 1 450 - 86
BANCO DE ESPAÑA 196 BOLETÍN ESTADÍSTICO, FEBRUARY 2013

P
1=3+7a9 2=4+10 3=5+6 4 5 6 7 8 9=10+16 10 11 12 13 14 15 16
8. OTHER MONETARY FINANCIAL INSTITUTIONS 8.84. Specialised credit institutions(data from euro area returns) Liabilities. Domestic deposits by sector andD) Balance sheet of the institutional groupings of other MFIs deposits of other resident sectors by instrument
EUR millions
By sectors
of which MFIs General government Other residents
Total Euro of which Credit Money Central Other In euros Not insti- market govern- general Total clas- Total tutions funds ment govern- sified Euro and ment Total Over- of which Redee- Repos B.E. night Whit mable agreed at no- maturi- Up to 2 tice ty years
07 46 758 46 741 45 541 45 524 45 541 - - 8 1 209 1 209 72 1 118 257 19 - - 08 52 239 52 165 48 975 48 901 48 975 - - 10 3 254 3 254 66 3 168 208 20 - - 09 38 779 38 687 33 958 33 866 33 934 24 - 13 4 809 4 809 47 4 736 25 26 - - 10 37 526 37 404 33 219 33 096 33 188 30 - 15 4 293 4 293 65 4 190 108 37 - - 11 39 863 39 862 31 681 31 679 31 628 52 - 13 8 169 8 169 18 8 106 156 45 - - 12 36 591 36 589 28 676 28 674 28 676 - - 9 7 906 7 906 3 7 861 164 42 - -
11 Aug 34 967 34 827 31 891 31 752 31 855 36 - 14 3 062 3 062 25 2 993 32 44 - - Sep 35 079 35 079 32 074 32 074 32 034 40 - 13 2 993 2 993 27 2 922 32 44 - - Oct 34 949 34 949 32 021 32 021 31 981 40 - 13 2 915 2 915 24 2 847 33 44 - - Nov 34 848 34 847 31 994 31 993 31 955 38 - 13 2 842 2 842 22 2 776 34 45 - - Dec 39 863 39 862 31 681 31 679 31 628 52 - 13 8 169 8 169 18 8 106 156 45 - -
12 Jan 38 359 38 357 30 366 30 364 30 314 52 - 12 7 980 7 980 17 7 918 37 45 - - Feb 37 870 37 867 30 028 30 025 29 976 52 - 12 7 830 7 830 17 7 768 36 46 - - Mar 38 171 38 168 30 322 30 319 30 272 50 - 12 7 837 7 837 16 7 775 36 46 - - Apr 37 605 37 602 29 817 29 815 29 767 50 - 10 7 777 7 777 14 7 717 36 46 - - May 37 335 37 334 29 678 29 677 29 629 50 - 9 7 648 7 648 0 7 602 35 45 - - Jun 37 285 37 285 29 659 29 659 29 614 45 - 8 7 618 7 618 1 7 573 36 45 - - Jul 36 889 36 889 29 350 29 350 29 305 44 - 8 7 531 7 531 1 7 487 36 44 - - Aug 36 293 36 293 28 884 28 884 28 834 50 - 8 7 401 7 401 1 7 358 36 43 - - Sep 36 119 36 119 28 774 28 774 28 724 50 - 7 7 337 7 337 1 7 294 36 42 - - Oct 35 378 35 377 28 053 28 052 28 004 49 - 8 7 317 7 317 1 7 275 38 42 - - Nov 34 848 34 846 27 285 27 284 27 236 49 - 9 7 554 7 554 1 7 512 40 42 - - Dec 36 591 36 589 28 676 28 674 28 676 - - 9 7 906 7 906 3 7 861 164 42 - -
13 Jan 35 787 35 784 28 111 28 108 28 111 - - 9 7 667 7 667 3 7 622 39 42 - -
BANCO DE ESPAÑA 197 BOLETÍN ESTADÍSTICO, FEBRUARY 2013

___________________________________________________________________________________________________________________________
8. OTHER MONETARY FINANCIAL INSTITUTIONS 8.F Balance D) Aggregate balance by components Money market funds
EUR millions
December January December 1998 January January 1997 1998 1999 2013 Balance Balance Balance Balance Balance Balance Balance of FIAMM of FIAMM of FIAMM of FIAMM Total MMF=FIAMM MMF which are which are which are which are FIAMM MMF (a) MMF (b) MMF (b) not MMF(b) (c)
1 2 3 4 5=3+4 6 7
ASSETS
A. SPANISH RESIDENTS . . . . . . . . . . . . . . . . . . . . . 38 050 32 028 26 111 16 750 42 861 40 210 5 905
2. Loans and credits (deposits and repurchase agreements) . . . . 22 880 18 036 14 358 7 029 21 386 20 455 2 152
MFI . . . . . . . . . . . . . . . . . . . . . . . . . . . . . . 22 366 17 492 13 947 7 017 20 963 19 784 2 129
General Government . . . . . . . . . . . . . . . . . . . . . . - - - - - - - Other residents . . . . . . . . . . . . . . . . . . . . . . . . . 514 545 411 12 423 672 23
3. Securities other than shares . . . . . . . . . . . . . . . . . . 15 169 13 991 11 753 9 722 21 475 19 755 3 752 3e. Of which euros . . . . . . . . . . . . . . . . . . . . . . . 15 169 13 991 11 745 9 722 21 466 19 755 3 752
MFI . . . . . . . . . . . . . . . . . . . . . . . . . . . . . . 52 79 130 35 165 995 1 026 3e. Of which euros . . . . . . . . . . . . . . . . . . . . . . . 52 79 130 35 165 995 1 026 Of which up two years . . . . . . . . . . . . . . . . . . . . 25 28 118 34 152 969 364 3x. Currencies other than euros . . . . . . . . . . . . . . . . . - - - - - - -
General Government . . . . . . . . . . . . . . . . . . . . . . 14 390 13 237 10 644 9 050 19 694 17 222 2 454 3e. Of which euros . . . . . . . . . . . . . . . . . . . . . . . 14 390 13 237 10 636 9 050 19 686 17 222 2 454
Other residents . . . . . . . . . . . . . . . . . . . . . . . . . 728 676 979 637 1 615 1 538 272 3e. Of which euros . . . . . . . . . . . . . . . . . . . . . . . 728 676 979 637 1 615 1 538 272
4. y 5. Money market instruments, shares and other equity . . . . . - - - - - - 1
B. OTHER EMU RESIDENTS . . . . . . . . . . . . . . . . . . . 1 808 1 959 1 844 3 507 5 352 5 630 834
2. Loans and credits (deposits and repurchase agreements) . . . . 1 476 1 701 402 81 482 457 -
MFI . . . . . . . . . . . . . . . . . . . . . . . . . . . . . . 1 476 1 701 393 34 427 430 -
General Government. . . . . . . . . . . . . . . . . . . . . . . - - - - - - - Other residents . . . . . . . . . . . . . . . . . . . . . . . . . - - 8 47 55 28 -
3. Securities other than shares . . . . . . . . . . . . . . . . . . 332 258 1 443 3 427 4 869 5 172 834 3e. Of which euros . . . . . . . . . . . . . . . . . . . . . . . 332 258 1 413 3 376 4 789 5 117 830
MFI . . . . . . . . . . . . . . . . . . . . . . . . . . . . . . - - 193 187 379 475 430 3e. Of which euros . . . . . . . . . . . . . . . . . . . . . . . - - 187 140 327 423 430 Of which up two years . . . . . . . . . . . . . . . . . . . . - - 177 132 309 314 82 3x. Currencies other than euros . . . . . . . . . . . . . . . . . - - 6 47 52 52 -
General Government . . . . . . . . . . . . . . . . . . . . . . - - 1 139 3 089 4 227 4 132 232 3e. Of which euros . . . . . . . . . . . . . . . . . . . . . . . - - 1 117 3 085 4 202 4 132 228
Other residents . . . . . . . . . . . . . . . . . . . . . . . . . 332 258 111 152 263 564 172 3e. Of which euros . . . . . . . . . . . . . . . . . . . . . . . 332 258 108 152 260 562 172
4. y 5. Money market instruments, shares and other equity . . . . . - - - - - - -
C. REST OF THE WORLD . . . . . . . . . . . . . . . . . . . . 676 242 546 1 136 1 682 1 628 239
Loans and credits (deposits and repurchase agreements) . . . . . - - 298 881 1 179 1 069 2
3. Securities other than shares . . . . . . . . . . . . . . . . . . 676 242 248 255 503 559 237 3e. Of which euros . . . . . . . . . . . . . . . . . . . . . . . 443 ... 45 190 234 ... ...
5. Shares and other equity . . . . . . . . . . . . . . . . . . . . - - - - - - -
D. OTHER NON CLASIFIED ASSETS . . . . . . . . . . . . . . . 530 382 345 396 741 1 092 85
7. Other assets . . . . . . . . . . . . . . . . . . . . . . . . . 530 382 345 396 741 1 092 85
TOTAL ASSETS . . . . . . . . . . . . . . . . . . . . . . . . . 41 063 34 611 28 846 21 790 50 636 48 560 7 063
BANCO DE ESPAÑA 198 BOLETÍN ESTADÍSTICO, FEBRUARY 2013

___________________________________________________________________________________________________________________________
(c) From January 1999 all FIAMM are MMF. (b) In 31 december 1998 MMF included in ECB list are 136. (a) In 31 december 1997 MMF are 106 Source: National Securities Market Commision and Banco de España
8. OTHER MONETARY FINANCIAL INSTITUTIONS 8.F Balance D) Aggregate balance by components Money market funds
EUR millions
December January December 1998 January January 1997 1998 1999 2013 Balance Balance Balance Balance Balance Balance Balance of FIAMM of FIAMM of FIAMM of FIAMM Total MMF=FIAMM MMF which are which are which are which are FIAMM MMF (a) MMF (b) MMF (b) not MMF(b) (c)
1 2 3 4 5=3+4 6 7
LIABILITIES
10. Money market funds units. Total . . . . . . . . . . . . . . . . 40 965 34 526 28 788 21 737 50 525 48 343 7 045
A. SPANISH RESIDENTS . . . . . . . . . . . . . . . . . . . . . . 40 539 34 167 28 488 21 395 49 883 47 915 6 984
10. Money market funds units . . . . . . . . . . . . . . . . . . . . 40 539 34 167 28 488 21 395 49 883 47 915 6 984
B. OTHER EMU RESIDENTS . . . . . . . . . . . . . . . . . . . . 352 297 249 126 375 249 42
10. Money market funds units . . . . . . . . . . . . . . . . . . . . 352 297 249 126 375 249 42
C. REST OF THE WORLD . . . . . . . . . . . . . . . . . . . . . 74 62 50 216 266 180 19
10. Money market funds units . . . . . . . . . . . . . . . . . . . . 74 62 50 216 266 180 19
D. OTHER NON CLASIFIED LIABILITIES. . . . . . . . . . . . . . . 98 84 58 53 112 216 18
14. Other liabilities . . . . . . . . . . . . . . . . . . . . . . . . . 98 84 58 53 112 216 18
TOTAL LIABILITIES . . . . . . . . . . . . . . . . . . . . . . . . 41 063 34 611 28 846 21 790 50 636 48 560 7 063
BANCO DE ESPAÑA 199 BOLETÍN ESTADÍSTICO, FEBRUARY 2013

1 2 3 4 5 6 7 8 9 10=11+12+13 11 12 13 14
8. OTHER MONETARY FINANCIAL INSTITUTIONS 8.91 Money market funds (a)D) Aggregate balance by components Balance. Summary
(b) This column is disagregated in table 8.92 (a) Until 31/12/97, 107 FIAMM were clasified as MMF. Since 1/1/98 until 31/12/98, 136 FIAMM were clasified as MMF.Since 1/1/99 all of FIAMM are clasified as MMF.
Source: National Securities Market Commission EUR millions
Total Assets Liabilities assets
= By residence By instruments Non Shares and other equities clasi - (holders by residence) Other non
Total fied clasified liabilities items liabili- Spanish Other Rest Loans and Securities Money Shares Total Spanish Other Rest ties resi- EMU of the credits other market and resi- EMU of
=2 to 4+9= dents resi- world (deposits than instru- other dents resi- the 5 to 8+9= dents and shares ments equity dents world 10+14 (b) repurchase
agreements)
06 106 26 50 29 17 88 - - 2 106 106 0 0 0 07 - - - - - - - - - - - - - - 08 28 255 22 725 4 169 1 256 9 241 17 999 - 910 105 28 219 27 944 120 155 36 09 13 526 10 372 2 516 570 5 165 8 293 - - 68 13 486 13 328 115 43 40 10 8 168 6 822 960 325 4 019 4 088 - - 61 8 154 8 052 73 29 14 11 8 055 7 012 714 245 2 866 5 104 - 2 83 8 036 7 946 67 22 19
11 Nov 7 808 6 696 765 262 2 651 5 073 - - 84 7 784 7 695 68 21 25 Dec 8 055 7 012 714 245 2 866 5 104 - 2 83 8 036 7 946 67 22 19
12 Jan 9 604 7 893 1 264 327 2 956 6 526 - 2 120 9 578 9 477 74 28 26 Feb 9 650 7 958 1 310 260 3 413 6 113 - 3 122 9 597 9 488 81 27 53 Mar 9 446 7 806 1 235 284 3 518 5 804 - 3 120 9 414 9 311 74 28 32 Apr 9 434 7 790 1 196 339 3 645 5 676 - 3 109 9 400 9 293 78 28 35 May 9 329 7 571 1 326 326 3 363 5 858 - 3 105 9 294 9 189 77 28 34 Jun 8 999 7 372 1 190 335 3 091 5 802 - 3 102 8 960 8 860 72 28 39 Jul 8 753 7 162 1 150 339 2 946 5 702 - 3 102 8 733 8 631 75 27 20 Aug 8 653 7 069 1 143 335 2 877 5 667 - 3 106 8 639 8 538 76 25 14 Sep 8 681 7 136 1 147 296 3 029 5 549 - 1 103 8 664 8 559 81 24 17 Oct 8 090 6 675 1 040 286 2 779 5 220 - 1 90 8 073 7 976 74 23 18 Nov 7 597 6 272 961 277 2 332 5 178 - 1 87 7 578 7 462 66 50 20 Dec 6 992 5 746 906 251 1 848 5 055 - 1 89 6 979 6 919 41 19 13
13 Jan 7 063 5 905 834 239 2 154 4 824 - 1 85 7 045 6 984 42 19 18
1=2+6+14 2 3 4 5 6 7 8 9 10 11 12 13 14
8. OTHER MONETARY FINANCIAL INSTITUTIONS 8.92 Money market fundsD) Aggregate balance by components Assets. Spanish residents
Source: National Securities Market Commission and Banco de España EUR millions Loans and credits Securities other than shares Money (deposits and repurchase agreements) market instru- ments, Of which Of which Of which Of which shares General Other and
Total Total MFI Government resident Total MFI General Other other sectors Euros Euros Government Euros resident Euros equity sectors
06 26 17 17 - - 9 9 2 2 6 6 2 2 - 07 - - - - - - - - - - - - - - 08 22 725 9 019 9 017 - 2 12 796 12 796 7 708 7 708 2 893 2 893 2 195 2 195 910 09 10 372 5 165 5 030 - 135 5 207 5 207 1 507 1 507 3 015 3 015 685 685 - 10 6 822 4 004 3 937 - 67 2 818 2 818 993 993 1 552 1 552 273 273 - 11 7 012 2 866 2 855 - 10 4 147 4 147 1 162 1 162 2 796 2 796 188 188 -
11 Nov 6 696 2 651 2 642 - 9 4 045 4 045 1 111 1 111 2 684 2 684 250 250 - Dec 7 012 2 866 2 855 - 10 4 147 4 147 1 162 1 162 2 796 2 796 188 188 -
12 Jan 7 893 2 955 2 946 - 9 4 937 4 937 1 470 1 470 3 182 3 182 286 286 - Feb 7 958 3 412 3 406 - 6 4 546 4 546 1 522 1 522 2 658 2 658 365 365 1 Mar 7 806 3 518 3 511 - 7 4 287 4 287 1 591 1 591 2 335 2 335 362 362 1 Apr 7 790 3 623 3 615 - 8 4 166 4 166 1 533 1 533 2 305 2 305 328 328 1 May 7 571 3 361 3 353 - 8 4 210 4 210 1 562 1 562 2 332 2 332 316 316 1 Jun 7 372 3 090 3 079 - 11 4 281 4 281 1 558 1 558 2 426 2 426 297 297 1 Jul 7 162 2 945 2 935 - 9 4 216 4 216 1 469 1 469 2 465 2 465 282 282 1 Aug 7 069 2 876 2 867 - 9 4 192 4 192 1 406 1 406 2 530 2 530 256 256 1 Sep 7 136 3 028 3 023 - 5 4 107 4 107 1 223 1 223 2 616 2 616 268 268 1 Oct 6 675 2 772 2 755 - 17 3 902 3 902 1 107 1 107 2 533 2 533 262 262 1 Nov 6 272 2 331 2 327 - 4 3 941 3 941 1 144 1 144 2 525 2 525 271 271 1 Dec 5 746 1 846 1 823 - 23 3 899 3 899 1 142 1 142 2 525 2 525 231 231 1
13 Jan 5 905 2 152 2 129 - 23 3 752 3 752 1 026 1 026 2 454 2 454 272 272 1
BANCO DE ESPAÑA 200 BOLETÍN ESTADÍSTICO, FEBRUARY 2013

BANCO DE ESPAÑA / BOLETÍN ESTADÍSTICO
NOTES TO THE TABLES OF CHAPTER 8
Table 8.C
a. Source: CNMV. The monthly time series of the main items are published on the Banco de España website at www.bde.es, tables of the Boletín Estadístico, tables 8.91 and 8.92. Table 8.1
a. See breakdown in tables 8.2 and 8.3. b. See breakdown in tables 8.41 to 8.44. c. See breakdown in tables 8.51 to 8.54. d. See breakdown in tables 8.81 to 8.84 e. See breakdown in tables 8.91 and 8.92 Table 8.2
a. See breakdown in table 8.4. b. See breakdown in table 8.6. c. See breakdown in table 8.12. Table 8.3
a. This column coincides with the sum of column 1, table 8.8 and column 11, table 8.91. b. This column coincides with the sum of column 1, table 8.10 and column 12, table 8.91. c. This column coincides with the sum of column 1, table 8.13 and column 13, table 8.91. d. See breakdown in table 8.13. e. This column coincides with the sum of column 1, table 8.8, column 1, table 8.10 and column 1, table 8.13. f. The breakdown by holder is shown in table 8.91, columns 11 to 13. g. This column coincides with the sum of column 2, table 8.8, column 2, table 8.10 and columns 2 and 11, table 8.13. Table 8.4
a. See breakdown in table 8.21. b. See breakdown in table 8.22. Table 8.6
a. See breakdown in table 8.7. Table 8.8
a. See breakdown in tables 8.21 and 8.25. b. See breakdown in tables 8.9, 8.22 and 8.28. Table 8.10
a. See breakdown in table 8.11. Table 8.13
a. Until December 1998 the amount of repo sales is included in column 3. Table 8.21
a. See breakdown in table 8.25. Table 8.22
a. See breakdown in tables 8.26 and 8.28. Table 8.26
a. Apart from institutional differences (see sectorisation scheme) and the categorisation of loans, this column coincides with column 1 of table 4.13. b. In addition to the clarifications included in the foregoing note, it should be borne in mind that this total includes all loans and credits granted to households by OMFIs, while column 3 of table 4.13 does not include those earmarked for financing sole proprietors' productive activities. The latter are in column 2 of table 4.13 (along with those financing the productive activities of both financial and non-financial corporations), and separately in column 6 of table 8.27. c. This column coincides with column 4 of table 4.13 and with column 15 of table 8.27, and is detailed in columns 2-4 and 10 of table 8.27. d. This column coincides with the sum of columns 6 and 14 of table 8.27.
BANCO DE ESPAÑA 201 BOLETÍN ESTADÍSTICO, FEBRUARY 2013

BANCO DE ESPAÑA / BOLETÍN ESTADÍSTICO
Table 8.27
a. This total coincides with column 6 of table 8.26. This series is available monthly in csv files. b. These columns correspond to columns 6-7 of table 4.13. c. This column coincides with column 13 of table 4.13. d. This column coincides with column 8 of table 4.13. e. This series is available monthly in csv files. f. This column coincides with column 9 of table 4.13. g. This column coincides with column 4 of table 4.13 and with column 7 of table 8.26. This series is available monthly in csv files. Table 8.29
a. More than 3 months. Table 8.30
a. More than 3 months. Table 8.41
a. See breakdown in table 8.43. Table 8.42
a. See breakdown in table 8.44. Table 8.E
a. The euro area minimum reserves system entered into force in early January 1999. This appendix to table 8.C aims to describe the conceptual scope of the system, which is based on the information collected from the monthly balance sheets of the Credit Institutions. These institutions are featured in table 8.C column b. b. Any discrepancy between the data in column 2 and the sum of the codes shown in the column of items is due to the lag between the updating of the balance sheets (table 8.C) and tables of time series and the updating of the reserve base (table 8.45). Table 8.51
a. See breakdown in table 8.53. Table 8.52
a. See breakdown in table 8.54. Table 8.81
a. See breakdown in table 8.83. Table 8.82
a. See breakdown in table 8.84. Table 8.F
a. As at 31 December 1997, there are 106 MMF. b. As at 31 December 1998, 136 MMF are included in the list approved and disseminated (in April 1998) by the ECB. c. From January 1999, all FIAMM are MMF. Table 8.91
a. Until 31/12/97, 107 FIAMM were classified as MMF. From 1/1/98 until 31/12/98, 136 FIAMM were classified as MMF. Since 1/1/99, all FIAMM have been classified as MMF. b. Another table contains the breakdown of this column.
BANCO DE ESPAÑA 202 BOLETÍN ESTADÍSTICO, FEBRUARY 2013

CHAPTER 9 NON-MONETARY FINANCIAL INSTITUTIONS, EXCEPT INSURANCE CORPORATIONS
AND PENSION FUNDS

___________________________________________________________________________________________________________________________
(f) FASE: Financial Accounts of the Spanish Economy. (see the sectorisation scheme showed in this Boletín Estadístico). (e) These institutions are Others Financial Intermediaries because Monetary Financial Intermediaries (chapters 6 to 8) are, obviously, the Financial Intermediaries par excellence sector breakdowns of the balance-sheet items have been obtained in the same way (see tables 9.C and 9.F). (d) When information of some of the institutions included in the grouping is not available and figures can be estimated, data has been included in the aggregates. Counterpart (c) Related to column 8, Total FASE. which, at the moment of the edition of this publication, information is available in the statistical registers of the Banco de España. (b) Due to the peculiarities of these financial intermediaries it should be taken into account that the Non-Monetary Financial institutions that are showed in this table are those for (a) Except insurance corporations and pension funds
9. NON-MONETARY FINANCIAL INSTITUTIONS (a)(b) 9.A Assets A) Total sector Reconciliation between the financial balance sheets according to FASE and the official balance sheets
Data related to September 2008 Eur millions
Time series Balance sheet Adjustment Total in table and FASE column (f)
(c) Total Other Financial Total Hierarchy Valua- financial auxiliaries adjust- tion intermediaries (9.F) ments and (9.C) others (d) (d) y (e) (e)
TOTAL OFFICIAL BALANCE SHEET ASSETS (I+II) . . . . . 832 605 816 816 15 789
I. OUTSTANDING FINANCIAL ASSETS included in FASE . . 9.1/1 825 972 810 482 15 490 14 304 6 228 8 076 840 276
AF.2 Currency and deposits . . . . . . . . . . . . . . . 572 454 567 607 4 847 22 22 572 475 Financial corporations . . . . . . . . . . . . . . . . . . 9.1/3 572 332 567 485 4 847 22 22 572 354
Rest of the world . . . . . . . . . . . . . . . . . . . . 9.1/5 122 122 122
AF.3 Securities other than shares . . . . . . . . . . . . . 115 772 106 836 8 936 207 207 115 979
331 Short term. . . . . . . . . . . . . . . . . . . . . . 25 289 23 388 1 901 87 87 25 377 Non-financial corporations . . . . . . . . . . . . . . . . 9.1/2 1 857 1 857 33 33 1 890
Financial corporations . . . . . . . . . . . . . . . . . . 9.1/3 17 925 17 925 11 11 17 936
General Government . . . . . . . . . . . . . . . . . . . 9.1/4 5 508 3 606 1 901 43 43 5 550
332 Long term . . . . . . . . . . . . . . . . . . . . . . 88 604 81 569 7 035 120 120 88 724 Non-financial corporations . . . . . . . . . . . . . . . . 9.1/2 1 518 259 1 259 1 518
Financial corporations . . . . . . . . . . . . . . . . . . 9.1/3 20 670 20 368 302 -463 -463 20 207
General Government . . . . . . . . . . . . . . . . . . . 9.1/4 11 878 6 528 5 349 408 408 12 285
Rest of the world . . . . . . . . . . . . . . . . . . . . 9.1/5 54 538 54 413 125 175 175 54 713
34 Financial derivatives . . . . . . . . . . . . . . . . . 1 879 1 879 1 879 Financial corporations . . . . . . . . . . . . . . . . . . 9.1/3 207 207 207
Rest of the world . . . . . . . . . . . . . . . . . . . . 9.1/5 1 672 1 672 1 672
AF.4 Loans . . . . . . . . . . . . . . . . . . . . . . . 58 540 58 507 33 58 540 Non-financial corporations, households and NPISH . . . . . . 9.1/2 55 822 55 812 10 55 822
Financial corporations . . . . . . . . . . . . . . . . . . 9.1/3 1 486 1 462 23 1 486
General Government . . . . . . . . . . . . . . . . . . . 9.1/4 1 233 1 233 1 233
AF.5 Shares and other equity . . . . . . . . . . . . . . . 73 074 71 835 1 239 7 870 7 870 80 943
511/512 Shares . . . . . . . . . . . . . . . . . . . . . 52 912 51 894 1 018 7 244 7 244 60 156 Non-financial corporations . . . . . . . . . . . . . . . . 9.1/2 16 080 15 469 610 11 001 11 001 27 081
Financial corporations . . . . . . . . . . . . . . . . . . 9.1/3 8 794 8 387 407 895 895 9 689
Rest of the world . . . . . . . . . . . . . . . . . . . . 9.1/5 28 038 28 038 0 -4 652 -4 652 23 386
513 Other equity . . . . . . . . . . . . . . . . . . . . 7 000 7 000 7 000 Financial corporations . . . . . . . . . . . . . . . . . . 9.1/3 7 000 7 000 7 000
52 Mutual funds shares . . . . . . . . . . . . . . . . . 13 162 12 941 221 625 625 13 787 Financial corporations . . . . . . . . . . . . . . . . . . 9.1/3 13 162 12 941 221 625 625 13 787
AF.7 Other accounts receivable . . . . . . . . . . . . . . 6 131 5 696 435 6 207 6 207 12 338 Non-financial corporations, households and NPISH . . . . . . ... ... ... 6 613
Financial corporations . . . . . . . . . . . . . . . . . . ... ... ... 5 726
II. ASSETS not included in FASE . . . . . . . . . . . . . ... 6 633 6 334 299 Fixed assets. . . . . . . . . . . . . . . . . . . . . . . ... 6 633 6 334 299
BANCO DE ESPAÑA 204 BOLETÍN ESTADÍSTICO, FEBRUARY 2013

___________________________________________________________________________________________________________________________
(f) FASE: Financial Accounts of the Spanish Economy. (see the sectorisation scheme showed in this Boletín Estadístico). (e) These institutions are Others Financial Intermediaries because Monetary Financial Intermediaries (chapters 6 to 8) are, obviously, the Financial Intermediaries par excellence sector breakdowns of the balance-sheet items have been obtained in the same way (see tables 91.A and 92.A). (d) When information of some of the institutions included in the grouping is not available and figures can be estimated, data has been included in the aggregates. Counterpart (c) Related to column 8, Total FASE. which, at the moment of the edition of this publication, information is available in the statistical registers of the Banco de España. (b) Due to the peculiarities of these financial intermediaries it should be taken into account that the Non-Monetary Financial institutions that are showed in this table are those for (a) Except insurance corporations and pension funds
9. NON-MONETARY FINANCIAL INSTITUTIONS (a)(b) 9.B Liabilities A) Total sector Reconciliation between the financial balance sheets according to FASE and the official balance sheets
Data related to September 2008 Eur millions
Time series Balance sheet Adjustment Total in table and FASE column (f)
(c) Total Other Financial Total Hierarchy Valua- financial auxiliaries adjust- tion intermediaries (9.G) ments and (9.D) others (d) (d) y (e) (e)
TOTAL OFFICIAL BALANCE SHEET LIABILITIES (III+IV) . . 832 608 816 819 15 789
III. LIABILITIES included in FASE . . . . . . . . . . . . . 9.1/7 825 922 816 819 9 104 -4 785 -2 686 -2 099 821 138
AF.2 Currency and deposits . . . . . . . . . . . . . . . 9.1/8 2 166 2 166 2 166 Non-financial corporations . . . . . . . . . . . . . . . . 9.1/9 1 577 1 577 1 577
Financial corporations . . . . . . . . . . . . . . . . . . 9.1/10 589 589 589
AF.3 Securities other than shares . . . . . . . . . . . . . 9.1/14+15 569 514 569 514 -15 634 -15 634 553 880
331 Short term. . . . . . . . . . . . . . . . . . . . . . 9.1/14 17 440 17 440 17 440 Financial corporations . . . . . . . . . . . . . . . . . . 9.1/14 83 83 83
Rest of the world . . . . . . . . . . . . . . . . . . . . 9.1/14 17 358 17 358 17 358
332 Long term . . . . . . . . . . . . . . . . . . . . . . 9.1/14 552 074 552 074 -15 634 -15 634 536 439 Non-financial corporations, households and NPISH . . . . . . 9.1/14 5 559 5 559 -157 -157 5 402
Financial corporations . . . . . . . . . . . . . . . . . . 9.1/14 220 228 220 228 -6 237 -6 237 213 991
Rest of the world . . . . . . . . . . . . . . . . . . . . 9.1/14 326 287 326 287 -9 240 -9 240 317 047
34 Financial derivatives . . . . . . . . . . . . . . . . . 9.1/15 0 0 0
AF.4 Loans . . . . . . . . . . . . . . . . . . . . . . . 9.1/8 22 009 21 723 285 22 009 Non-financial corporations . . . . . . . . . . . . . . . . 9.1/9 80 80 80
Financial corporations . . . . . . . . . . . . . . . . . . 9.1/10 19 104 18 819 285 19 104
Rest of the world . . . . . . . . . . . . . . . . . . . . 9.1/11 2 824 2 824 2 824
AF.5 Shares and other equity . . . . . . . . . . . . . . . 9.1/12+13 225 632 220 722 4 910 10 401 10 401 236 033
511/512 Shares . . . . . . . . . . . . . . . . . . . . . 9.1/13 17 485 12 576 4 910 6 064 6 064 23 549 Non-financial corporations, households and NPISH . . . . . . 9.1/13 5 892 5 824 67 2 457 2 457 8 349
Financial corporations . . . . . . . . . . . . . . . . . . 9.1/13 8 610 4 299 4 310 1 997 1 997 10 606
General Government . . . . . . . . . . . . . . . . . . . 9.1/13 2 250 1 815 435 2 250
Rest of the world . . . . . . . . . . . . . . . . . . . . 9.1/13 734 637 97 1 610 1 610 2 343
52 Mutual funds shares . . . . . . . . . . . . . . . . . 9.1/12 208 147 208 147 4 337 4 337 212 484 Non-financial corporations, households and NPISH . . . . . . 9.1/12 160 824 160 824 2 503 2 503 163 327
Financial corporations . . . . . . . . . . . . . . . . . . 9.1/12 40 125 40 125 1 803 1 803 41 928
General Government . . . . . . . . . . . . . . . . . . . 9.1/12 3 630 3 630 3 630 3 630
Rest of the world . . . . . . . . . . . . . . . . . . . . 9.1/12 3 567 3 567 31 31 3 599
AF.7 Other accounts payable . . . . . . . . . . . . . . . 9.1/16 9 736 5 833 3 904 -2 686 -2 686 7 050 Non-financial corporations, households and NPISH . . . . . . ... ... ... 4 368
Financial corporations . . . . . . . . . . . . . . . . . . ... ... ... 2 047
IV. LIABILITIES not included in FASE . . . . . . . . . . . 6 686 6 686
Memorandum item
NET FINANCIAL ASSETS (I-III) . . . . . . . . . . . . . . 9.1/17 50 -6 337 6 387 19 089 19 138
BANCO DE ESPAÑA 205 BOLETÍN ESTADÍSTICO, FEBRUARY 2013

1=2a5 2 3 4 5 6 12a15 8=9a11 9 10 11 12 13 14 15 16 17=1-7
9. NON-MONETARY FINANCIAL INSTITUTIONS (a) 9.1 Assets and liabilities. Valuation of financialA) total sector assets and liabilities in accordance with ESA95Balance sheets
(d) Except Monetary mutual funds in tables 8.F and followings. (c) Including repurchase agreements. (b) Data based on Official balance sheet. (a) Except insurance corporations and pension funds.
BE, CNMV, DGSFP. Data on a ESA 95 basis Eur millons
Financial assets Memo- Liabilities Net randum financial item: assets
Total Non- Finan- General Rest Non Total Currency,deposits and loans(c) Mutual Shares Securi- Financial Other financial cial Gover- of the finan- funds ties deriva- account corpora- institu- ment world cial shares other tives payable tions, tions assets Total Non- Financial Rest than households finan- institu- of the shares and (b) cial tions world (d) NPISH corpo- 7=8+ rations
01 216 756 42 186 68 498 29 222 76 850 1 281 216 348 10 519 786 9 709 49 139 439 31 631 27 861 ... 6 898 409 02 215 087 51 217 68 573 23 857 71 440 1 580 213 278 11 741 698 10 302 741 124 017 26 286 47 070 ... 4 163 1 809 03 284 785 70 588 99 326 22 266 92 605 2 228 282 383 11 974 540 9 365 2 069 156 087 29 904 78 932 -0 5 487 2 402
04 Q2 328 484 81 715 125 975 21 335 99 458 2 502 326 758 13 413 520 10 828 2 064 196 993 8 537 100 636 0 7 179 1 726 Q3 339 961 85 548 133 491 20 573 100 349 2 819 338 410 12 511 507 10 203 1 801 199 442 8 597 110 994 0 6 865 1 551 Q4 376 709 98 147 149 344 22 950 106 267 3 023 374 281 10 746 487 8 225 2 034 208 427 9 567 138 840 0 6 702 2 428
05 Q1 406 909 96 373 175 551 22 218 112 768 3 149 406 968 13 172 472 10 847 1 852 217 845 10 143 158 334 - 7 474 -59 Q2 460 068 69 371 249 763 22 361 118 573 3 611 459 909 13 483 485 10 767 2 231 227 468 13 133 196 921 0 8 904 160 Q3 480 143 62 681 269 182 23 356 124 924 3 871 480 817 13 027 525 9 644 2 858 238 428 14 151 206 201 -0 9 010 -673 Q4 515 096 65 519 297 988 21 877 129 712 4 256 517 012 12 728 573 9 012 3 143 242 510 14 496 238 810 0 8 467 -1 916
06 Q1 579 999 71 652 339 796 21 947 146 603 4 428 582 478 13 141 552 9 600 2 990 274 164 16 164 269 594 0 9 416 -2 479 Q2 610 506 75 131 372 429 21 878 141 067 5 128 612 159 12 636 606 9 434 2 596 271 608 13 526 306 360 0 8 029 -1 653 Q3 643 911 78 937 398 957 22 474 143 543 5 430 647 975 12 550 906 8 489 3 156 283 136 17 729 322 554 -0 12 005 -4 064 Q4 715 942 87 730 455 007 22 960 150 245 5 739 719 153 14 207 1 115 8 465 4 627 310 404 18 026 365 732 - 10 783 -3 211
07 Q1 773 050 88 115 510 905 23 789 150 241 5 891 778 598 13 852 1 310 8 818 3 723 317 123 24 344 413 794 - 9 485 -5 547 Q2 819 127 93 110 548 706 22 078 155 234 6 499 822 167 17 345 999 11 020 5 327 323 009 25 307 446 265 0 10 241 -3 040 Q3 824 859 96 802 568 240 21 784 138 033 6 469 823 542 17 627 1 298 10 388 5 941 317 961 24 001 452 935 -0 11 018 1 318 Q4 871 642 95 441 631 519 20 674 124 008 6 517 866 827 26 363 1 247 19 194 5 922 303 367 22 987 503 080 0 11 030 4 815
08 Q1 819 335 89 824 612 830 18 871 97 810 6 572 810 751 26 919 1 533 21 224 4 162 242 848 22 638 509 925 -0 8 422 8 584 Q2 847 232 92 831 644 427 19 518 90 456 6 585 830 945 27 929 1 654 23 117 3 157 226 715 22 755 545 502 -0 8 045 16 287 Q3 840 276 92 923 648 392 19 068 79 893 6 633 821 138 24 175 1 657 19 693 2 824 212 484 23 549 553 880 0 7 050 19 138
BANCO DE ESPAÑA 206 BOLETÍN ESTADÍSTICO, FEBRUARY 2013

____
____
____
____
____
____
____
____
____
____
____
____
____
____
____
____
____
____
____
____
____
____
____
____
____
____
____
____
____
____
____
____
____
____
____
____
____
____
____
____
____
____
____
____
____
____
(d)
Rel
ated
Tot
al F
AS
E.
(c)
The
se in
stitu
tions
are
Oth
er fi
nanc
ial i
nter
med
iarie
s be
caus
e M
onet
ary
finan
cial
inte
rmed
iarie
s (c
hapt
er 6
to 8
) ar
e, o
bvio
usly
, the
Fin
anci
al in
term
edia
ries
per
exce
llenc
e (s
ee th
e se
ctor
isat
ion
sche
me
show
ed in
the
Bol
etín
Est
adís
tico)
.
av
aila
ble
in th
e st
atis
tical
reg
iste
rs o
f the
Ban
co d
e E
spañ
a. (
b) D
ue to
the
pecu
liarit
ies
of th
ese
Fin
anci
al in
term
edia
ries
it sh
ould
be
take
n in
to a
ccou
nt th
at th
e N
on-M
onet
ary
finan
cial
inst
itutio
ns th
at a
re s
how
ed in
this
tabl
e ar
e th
ose
for
whi
ch, a
t the
mom
ent o
f the
edi
tion
of th
is p
ublic
atio
n, in
form
atio
n is
(a)
Exc
ept i
nsur
ance
cor
pora
tions
and
pen
sion
fund
s
9. N
ON
-MO
NE
TA
RY
FIN
AN
CIA
L IN
ST
ITU
TIO
NS
(a)
(b)
9.C
Ass
ets
B
) O
ther
fin
anci
al in
term
edia
ries
(c)
R
eco
nci
liati
on
bet
wee
n t
he
fin
anci
al b
alan
ce s
hee
ts a
cco
rdin
g t
o F
AS
E a
nd
th
e o
ffic
ial b
alan
ce s
hee
ts
Data
rela
ted to S
epte
mber
2008
Eur
mill
ions
T
ime
Bal
ance
she
et
A
djus
tmen
t
s
erie
s in
T
otal
t
able
and
F
AS
E
colu
mn
T
otal
P
ortfo
lio
Sec
uriti
es
A
sset
Ven
ture
R
eal e
stat
e
Hol
ding
P
refe
renc
e
Hie
rarc
hy V
alua
-
(d)
inv
estm
ent
-de
aler
sec
uriti
satio
n c
apita
l i
nves
tmen
t c
orpo
ratio
ns
sha
res
T
otal
adju
st-
tió
n
inst
itutio
ns c
ompa
nies
fund
s
fu
nds
and
inst
itutio
ns o
f fin
anci
al
issu
ing
men
ts a
nd
(ex
cept
MM
F)
com
pani
es
in
stitu
tions
othe
rs
(e)
(9.
E)
(f)
(
f)
(
f)
(f)
T
OT
AL
OF
FIC
IAL
BA
LA
NC
E S
HE
ET
AS
SE
TS
(I+
II).
..
..
..
..
81
6 81
6 19
4 88
2 16
510
40
4 33
7 13
431
6
666
6 31
6 17
4 67
3
I.
OU
TS
TA
ND
ING
FIN
AN
CIA
L A
SS
ET
S in
clu
ded
in F
AS
E.
..
..
.9.
12/1
810
482
194
882
16 4
61
403
817
13 4
31
903
6 31
5 17
4 67
3 12
364
6
012
6 35
2 82
2 84
6
A
F.2
Cu
rren
cy a
nd
dep
osi
ts.
..
..
..
..
..
..
..
..
..
56
7 60
7 43
963
8
628
370
216
930
749
198
142
923
22
22
56
7 62
8 F
inanci
al
corp
ora
tions.
..
..
..
..
..
..
..
..
..
..
.9.1
2/3
567 4
85
43 8
41
8 6
28
370 2
16
93
0
749
198
142 9
23
22
22
567 5
07
R
est
of
the
worl
d.
..
..
..
..
..
..
..
..
..
..
..
.9.1
2/5
122
122
...
...
...
122
A
F.3
Sec
uri
ties
oth
er t
han
sh
ares
..
..
..
..
..
..
..
..
10
6 83
6 10
4 34
5 1
852
558
...80
...
...55
55
106
891
33
1 S
ho
rt t
erm
..
..
..
..
..
..
..
..
..
..
..
..
.
23 3
88
23 2
32
122
...
34
......
130
13
0 23
518
N
on-f
inanci
al
corp
ora
tions
..
..
..
..
..
..
..
..
..
..
9.1
2/2
1 8
57
1 8
10
12
...
34
...
...
33
33
1 8
90
F
inanci
al
corp
ora
tions.
..
..
..
..
..
..
..
..
..
..
.9.1
2/3
17 9
25
17 9
25
...
...
...
...
11
11
17 9
36
G
ener
al
Gove
rnm
ent
..
..
..
..
..
..
..
..
..
..
..
9.1
2/4
3 6
06
3 4
97
109
...
...
...
86
86
3 6
92
33
2 L
on
g t
erm
..
..
..
..
..
..
..
..
..
..
..
..
.
81 5
69
79 2
34
1 73
0 55
8 ...
46
......
-75
-7
5 81
494
N
on-f
inanci
al
corp
ora
tions
..
..
..
..
..
..
..
..
..
..
9.1
2/2
259
258
1
...
...
...
...
259
F
inanci
al
corp
ora
tions.
..
..
..
..
..
..
..
..
..
..
.9.1
2/3
20 3
68
18 6
60
1 6
62
...
46
...
...
-469
-469
19 8
99
G
ener
al
Gove
rnm
ent
..
..
..
..
..
..
..
..
..
..
..
9.1
2/4
6 5
28
6 5
10
18
...
...
...
220
220
6 7
48
R
est
of
the
worl
d.
..
..
..
..
..
..
..
..
..
..
..
.9.1
2/5
54 4
13
53 8
06
49
558
...
...
...
...
175
175
54 5
88
34
F
inan
cial
der
ivat
ives
..
..
..
..
..
..
..
..
..
..
.
1 87
9 1
879
1
879
F
inanci
al
corp
ora
tions.
..
..
..
..
..
..
..
..
..
..
.9.1
2/2
207
207
207
R
est
of
the
worl
d.
..
..
..
..
..
..
..
..
..
..
..
.9.1
2/3
1 6
72
1 6
72
1 6
72
A
F.4
Lo
ans
..
..
..
..
..
..
..
..
..
..
..
..
..
.9.
12/4
58 5
07
1 15
9 30
3 32
294
...
...
24 7
51
58
507
N
on-f
inanci
al
corp
ora
tions,
house
hold
s and N
PIS
H.
..
..
..
..
.
55 8
12
31 0
61
...
...
24 7
51
55 8
12
F
inanci
al
corp
ora
tions.
..
..
..
..
..
..
..
..
..
..
.
1 4
62
1 1
59
303
...
...
...
1 4
62
G
ener
al
Gove
rnm
ent
..
..
..
..
..
..
..
..
..
..
..
9.1
2/2
1 2
33
1 2
33
...
...
...
1 2
33
A
F.5
Sh
ares
an
d o
ther
eq
uit
y.
..
..
..
..
..
..
..
..
.9.
12/3
71 8
35
48 7
16
2 94
9
7 45
2
5 71
8 7
000
6 29
8
6 29
8 78
133
511/
512
Sh
ares
..
..
..
..
..
..
..
..
..
..
..
..
.9.
12/5
51 8
94
35 7
96
2 92
8
7 45
2
5 71
8 ...
5 87
9
5 87
9 57
773
N
on-f
inanci
al
corp
ora
tions
..
..
..
..
..
..
..
..
..
..
15 4
69
7 7
83
235
7 4
52
...
...
10 1
31
10 1
31
25 6
00
F
inanci
al
corp
ora
tions.
..
..
..
..
..
..
..
..
..
..
.9.1
2/3
8 3
87
2 5
07
162
...
5 7
18
...
400
400
8 7
87
R
est
of
the
worl
d.
..
..
..
..
..
..
..
..
..
..
..
.
28 0
38
25 5
07
2 5
31
...
...
...
-4 6
52
-4 6
52
23 3
86
51
3 O
ther
eq
uit
y.
..
..
..
..
..
..
..
..
..
..
..
..
9.12
/27
000
...
7 00
0
7 00
0 F
inanci
al
corp
ora
tions.
..
..
..
..
..
..
..
..
..
..
.9.1
2/3
7 0
00
...
7 0
00
7 0
00
52
Mu
tual
fu
nd
s sh
ares
..
..
..
..
..
..
..
..
..
..
.
12 9
41
12 9
20
21
...
...
...41
9
419
13 3
60
F
inanci
al
corp
ora
tions.
..
..
..
..
..
..
..
..
..
..
.9.1
2/6
12 9
41
12 9
20
21
...
...
...
419
419
13 3
60
A
F.7
Oth
er a
cco
un
ts r
ecei
vab
le.
..
..
..
..
..
..
..
..
...5
696
-3 3
01
2 72
8 74
8 5
049
74
398
...5
990
5 99
0
11 6
87
N
on-f
inanci
al
corp
ora
tions,
house
hold
s and N
PIS
H.
..
..
..
..
....
...
...
...
...
...
...
...
...
6 3
55
F
inanci
al
corp
ora
tions.
..
..
..
..
..
..
..
..
..
..
....
...
...
...
...
...
...
...
...
5 3
32
II
. AS
SE
TS
no
t in
clu
ded
in F
AS
E.
..
..
..
..
..
..
..
..
...6
334
0 50
52
0 ...
5 76
3 1
...
Fix
ed a
sset
s.
..
..
..
..
..
..
..
..
..
..
..
..
...6
334
0 50
52
0 ...
5 76
3 1
...
BANCO DE ESPAÑA 207 BOLETÍN ESTADÍSTICO, FEBRUARY 2013

____
____
____
____
____
____
____
____
____
____
____
____
____
____
____
____
____
____
____
____
____
____
____
____
____
____
____
____
____
____
____
____
____
____
____
____
____
____
____
____
____
____
____
____
____
____
(f)
Est
imat
ed d
ata.
(see
tabl
es 9
1.A
and
92.
A).
(e)
Whe
n in
form
atio
n of
som
e of
the
inst
itutio
ns in
clud
ed in
the
grou
ping
is n
ot a
vaila
ble
and
figur
es c
an b
e es
timat
ed, d
ata
has
been
incl
uded
in th
e ag
greg
ates
. Cou
nter
part
sec
tor
brea
kdow
ns o
f the
bal
ance
-she
et it
ems
have
bee
n ob
tain
ed in
the
sam
e w
ay
9. N
ON
-MO
NE
TA
RY
FIN
AN
CIA
L IN
ST
ITU
TIO
NS
(a)
(b)
9.D
Lia
bili
ties
B)
Oth
er f
inan
cial
inte
rmed
iari
es (
c)
Rec
on
cilia
tio
n b
etw
een
th
e fi
nan
cial
bal
ance
sh
eets
acc
ord
ing
to
FA
SE
an
d t
he
off
icia
l bal
ance
sh
eets
Data
rela
ted to S
epte
mber
2008
Eur
mill
ions
T
ime
Bal
ance
she
et
A
djus
tmen
t
s
erie
s in
T
otal
t
able
and
P
ortfo
lio
Ven
ture
H
oldi
ng
F
AS
E
colu
mn
T
otal
i
nves
tmen
t S
ecur
ities
Ass
et
c
apita
l R
eal e
stat
e c
orpo
ratio
ns P
refe
renc
e
Hie
rarc
hy V
alua
-
(d)
inst
itutio
ns -
deal
er
s
ecur
itisa
tion
fund
s an
d i
nves
tmen
t o
f fin
anci
al
sha
res
T
otal
adju
st-
tió
n
(ex
cept
MM
F)
com
pani
es
fu
nds
com
pani
es
inst
itutio
ns in
stitu
tions
is
suin
g
m
ents
and
(e)
(9.
E)
(
f)
(
f)
(
f)
(f)
othe
rs
T
OT
AL
OF
FIC
IAL
BA
LA
NC
E S
HE
ET
LIA
BIL
ITIE
S (
III+
IV)
..
..
..
81
6 81
9 19
4 88
2 16
510
40
4 33
7 13
431
6
666
6 31
9 17
4 67
3
II
I. L
IAB
ILIT
IES
incl
ud
ed in
FA
SE
..
..
..
..
..
..
..
..
.9.
12/7
816
819
194
882
16 5
10
404
337
13 4
31
6 66
6 6
319
174
673
-5 4
15
-2 2
14
-3 2
01
811
404
A
F.2
Cu
rren
cy a
nd
dep
osi
ts.
..
..
..
..
..
..
..
..
..
9.12
/82
166
2
166
...
...
...
2 16
6 N
on-f
inanci
al
corp
ora
tions
..
..
..
..
..
..
..
..
..
..
9.1
2/9
1 5
77
...
...
...
...
1 5
77
F
inanci
al
corp
ora
tions.
..
..
..
..
..
..
..
..
..
..
.9.1
2/1
0589
...
...
...
...
589
A
F.3
Sec
uri
ties
oth
er t
han
sh
ares
..
..
..
..
..
..
..
..
9.12
/11
569
514
397
731
...
975
156
150
-15
634
-1
5 63
4 55
3 88
0
33
1 S
ho
rt t
erm
..
..
..
..
..
..
..
..
..
..
..
..
.9.
12/1
417
440
49
9 ...
...
13 8
07
17
440
F
inanci
al
corp
ora
tions.
..
..
..
..
..
..
..
..
..
..
.9.1
2/1
483
...
...
...
...
83
R
est
of
the
worl
d.
..
..
..
..
..
..
..
..
..
..
..
.9.1
2/1
417 3
58
...
...
...
...
17 3
58
33
2 L
on
g t
erm
..
..
..
..
..
..
..
..
..
..
..
..
.9.
12/1
455
2 07
4
39
7 23
2 ...
97
5 15
3 86
7 -1
5 63
4
-15
634
536
439
N
on-f
inanci
al
corp
ora
tions,
house
hold
s and N
PIS
H.
..
..
..
..
.9.1
2/1
45 5
59
...
...
941
...
-157
-157
5 4
02
F
inanci
al
corp
ora
tions.
..
..
..
..
..
..
..
..
..
..
.9.1
2/1
4220 2
28
...
...
34
...
-6 2
37
-6 2
37
213 9
91
R
est
of
the
worl
d.
..
..
..
..
..
..
..
..
..
..
..
.9.1
2/1
4326 2
87
...
...
...
...
-9 2
40
-9 2
40
317 0
47
A
F.4
Lo
ans
..
..
..
..
..
..
..
..
..
..
..
..
..
.9.
12/1
421
723
10 5
07
4 20
0 ...
9
7 00
0
21 7
23
N
on-f
inanci
al
corp
ora
tions
..
..
..
..
..
..
..
..
..
..
9.1
2/1
080
80
...
...
...
80
F
inanci
al
corp
ora
tions.
..
..
..
..
..
..
..
..
..
..
.9.1
2/1
018 8
19
7 6
02
4 2
00
...
9
7 0
00
18 8
19
R
est
of
the
worl
d.
..
..
..
..
..
..
..
..
..
..
..
.9.1
2/1
02 8
24
2 8
24
...
...
...
2 8
24
A
F.5
Sh
ares
an
d o
ther
eq
uit
y.
..
..
..
..
..
..
..
..
.9.
12/1
022
0 72
2 19
2 80
8 1
864
14
748
6
263
5 04
0 ...
9 29
4
9 29
4 23
0 01
6
51
1/51
2 S
har
es.
..
..
..
..
..
..
..
..
..
..
..
..
9.12
/12+
1312
576
1 86
4
5 67
2
5 04
0 ...
4 95
6
4 95
6 17
532
N
on-f
inanci
al
corp
ora
tions,
house
hold
s and N
PIS
H.
..
..
..
..
.9.1
2/1
35 8
24
...
...
...
...
2 4
57
2 4
57
8 2
82
F
inanci
al
corp
ora
tions.
..
..
..
..
..
..
..
..
..
..
.9.1
2/1
34 2
99
...
...
...
...
1 0
00
1 0
00
5 2
99
G
ener
al
Gove
rnm
ent
..
..
..
..
..
..
..
..
..
..
..
9.1
2/1
31 8
15
...
...
...
...
1 8
15
R
est
of
the
worl
d.
..
..
..
..
..
..
..
..
..
..
..
.9.1
2/1
3637
...
...
...
...
1 4
99
1 4
99
2 1
36
52
Mu
tual
fu
nd
s sh
ares
issu
ed b
y in
vest
men
t co
mp
anie
s.
..
..
9.12
/13
208
147
192
808
9 07
6 6
263
......
4 33
7
4 33
7 21
2 48
4
a
nd
issu
ed b
y in
vest
men
t fu
nd
s.
..
..
..
..
..
..
..
.
N
on-f
inanci
al
corp
ora
tions,
house
hold
s and N
PIS
H.
..
..
..
..
.9.1
2/1
2160 8
24
154 5
61
...
...
...
...
2 5
03
2 5
03
163 3
27
F
inanci
al
corp
ora
tions.
..
..
..
..
..
..
..
..
..
..
.9.1
2/1
240 1
25
34 6
80
...
...
...
...
1 8
03
1 8
03
41 9
28
G
ener
al
Gove
rnm
ent
..
..
..
..
..
..
..
..
..
..
..
9.1
2/1
23 6
30
...
...
...
...
3 6
30
R
est
of
the
worl
d.
..
..
..
..
..
..
..
..
..
..
..
.9.1
2/1
23 5
67
3 5
67
...
...
...
...
31
31
3 5
99
AF
.7 O
ther
acc
ou
nts
pay
able
..
..
..
..
..
..
..
..
..
.9.
12/1
25
833
2 07
4 1
974
2 40
6 -1
315
38
7 30
7 ...
-2 2
14
-2 2
14
3
619
N
on-f
inanci
al
corp
ora
tions,
house
hold
s and N
PIS
H.
..
..
..
..
.9.1
2/1
5...
...
...
...
...
...
...
...
2 3
50
F
inanci
al
corp
ora
tions.
..
..
..
..
..
..
..
..
..
..
.
...
...
...
...
...
...
...
...
634
IV
. LIA
BIL
ITIE
S n
ot
incl
ud
ed in
FA
SE
..
..
..
..
..
..
..
.
Mem
ora
nd
um
item
N
ET
FIN
AN
CIA
L A
SS
ET
S (
I-III
).
..
..
..
..
..
..
..
..
.
-6
337
-0
-5
0 -5
20
...-5
763
-4
...
17 7
79
11 4
42
BANCO DE ESPAÑA 208 BOLETÍN ESTADÍSTICO, FEBRUARY 2013

1=2a6 2 3 4 5 6 7 8 9 10 11 12 13 14 15
9. NON-MONETARY FINANCIAL INSTITUTIONS (a) (b) 9.11 Official balance sheets.B) Other financial intermediaries (c) Total assets and liabilitiesBalance sheets by institutional grouping
(see the sectorisation scheme showed in this Boletín Estadístico). (c) These institutions are Others Financial Intermediaries because Monetary Financial Intermediaries (chapters 6 to 8) are, obviously, the Financial Intermediaries par excellence which, at the moment of the edition of this publication, information is available in the statistical registers of the Banco de España. (b) Due to the peculiarities of these financial intermediaries it should be taken into account that the Non-Monetary Financial institutions that are showed in this table are those for (a) Except insurance corporations and pension funds.
CNMV Eur millions and %
Other financial intermediaries % on total other financial intermediaries
Total Portfolio Securities Asset Venture Real estate Holding Preference Portfolio Securities Asset Venture Real estate Holding Preference investment dealer securitisation capital investment corporations shares investment dealer securitisation capital investment corporations shares institutions companies funds funds and institutions of financial issuing institutions companies funds funds and institutions of financial issuing except MMF companies institutions except MMF companies institutions
01 202 786 155 037 10 499 31 436 3 069 1 488 1 258 ... 76,45 5,18 15,50 1,51 0,73 0,62 ... 02 205 003 139 118 10 009 50 827 1 961 1 930 1 158 ... 67,86 4,88 24,79 0,96 0,94 0,56 ... 03 272 346 172 484 10 229 81 792 2 488 2 538 1 290 1 526 63,33 3,76 30,03 0,91 0,93 0,47 0,56
04 Q2 315 603 190 465 12 917 102 000 2 900 3 283 1 655 2 382 60,35 4,09 32,32 0,92 1,04 0,52 0,75 Q3 326 706 192 214 11 691 105 984 2 900 3 640 1 655 8 622 58,83 3,58 32,44 0,89 1,11 0,51 2,64 Q4 361 847 199 072 10 043 125 737 3 657 4 076 1 658 17 605 55,02 2,78 34,75 1,01 1,13 0,46 4,87
05 Q1 392 103 207 715 13 128 135 075 3 840 4 778 1 658 25 908 52,97 3,35 34,45 0,98 1,22 0,42 6,61 Q2 440 185 215 283 13 601 154 892 4 059 5 280 1 731 45 339 48,91 3,09 35,19 0,92 1,20 0,39 10,30 Q3 456 585 223 538 11 625 154 087 4 242 5 647 1 731 55 714 48,96 2,55 33,75 0,93 1,24 0,38 12,20 Q4 493 124 227 705 10 669 178 791 4 469 6 042 1 798 63 650 46,18 2,16 36,26 0,91 1,23 0,36 12,91
06 Q1 555 545 257 442 11 447 186 463 4 692 6 765 1 798 86 939 46,34 2,06 33,56 0,84 1,22 0,32 15,65 Q2 592 295 256 947 10 808 206 379 4 960 7 291 1 831 104 080 43,38 1,82 34,84 0,84 1,23 0,31 17,57 Q3 620 585 265 804 13 970 212 193 5 184 7 778 1 831 113 824 42,83 2,25 34,19 0,84 1,25 0,30 18,34 Q4 689 091 290 464 14 292 248 516 5 274 8 106 1 971 120 468 42,15 2,07 36,06 0,77 1,18 0,29 17,48
07 Q1 747 367 295 332 13 379 278 132 7 155 7 971 5 419 139 979 39,52 1,79 37,21 0,96 1,07 0,73 18,73 Q2 789 704 300 214 16 590 305 769 8 345 8 034 5 486 145 267 38,02 2,10 38,72 1,06 1,02 0,69 18,40 Q3 796 761 296 342 18 068 312 951 9 534 7 714 6 186 145 966 37,19 2,27 39,28 1,20 0,97 0,78 18,32 Q4 844 528 281 971 20 509 356 793 10 723 7 342 6 289 160 901 33,39 2,43 42,25 1,27 0,87 0,74 19,05
08 Q1 ... 225 489 19 675 ... ... 7 020 6 289 153 310 ... ... ... ... ... ... ... Q2 ... 208 893 20 398 ... ... 6 800 6 316 164 274 ... ... ... ... ... ... ... Q3 ... 194 882 16 510 ... ... 6 666 6 316 174 673 ... ... ... ... ... ... ...
1=2a5 2 3 4 5 6 7=8+12a15 8=9a11 9 10 11 12 13 14 15 16=1-7
9. NON-MONETARY FINANCIAL INSTITUTIONS (a) 9.12 Assets and liabilitiesB) Other financial intermediaries (b) Valuation of financial assets andBalance sheets liabilities in accordance with ESA 95
(d) Including repurchase agreements. (c) Data based on Official balance sheet. (see the sectorisation scheme showed in this Boletín Estadístico). (b) These institutions are Others Financial Intermediaries because Monetary Financial Intermediaries (chapters 6 to 8) are, obviously, the Financial Intermediaries par excellence (a) Except Insurance corporations and pension funds.
CNMV. Data on a ESA95 basis Eur millions
Financial assets Memo- Liabilities Net randum financial item: assets
Total Non- Finan- General Rest Non Total Currency,deposits and loans(d) Mutual Shares Securi- Other financial cial Gover- of the finan- funds ties account corpora- institu- ment world cial shares other payable tions, tions assets Total Non- Financial Rest than households finan- institu- of the shares and (c) cial tions world NPISH corpo- rations
01 206 367 40 100 65 108 24 349 76 810 1 112 210 510 10 395 786 9 585 49 139 439 29 054 27 861 3 762 -4 143 02 205 492 49 842 65 713 18 539 71 399 1 392 208 245 11 580 698 10 140 741 124 017 23 688 47 070 1 890 -2 752 03 274 267 69 413 95 992 16 336 92 526 2 017 276 796 11 755 540 9 146 2 069 156 087 27 275 78 932 2 747 -2 529
04 Q3 328 634 84 352 129 871 14 155 100 256 2 612 332 579 12 337 507 10 029 1 801 199 442 5 876 110 994 3 929 -3 945 Q4 365 182 97 179 145 581 16 253 106 170 2 817 368 356 10 492 487 7 971 2 034 208 427 6 836 138 840 3 762 -3 174
05 Q1 395 649 95 512 171 762 15 707 112 668 2 943 401 369 12 912 472 10 588 1 852 217 845 7 405 158 334 4 872 -5 720 Q2 448 666 68 639 245 858 15 696 118 473 3 407 453 737 13 234 485 10 518 2 231 227 468 10 335 196 921 5 780 -5 071 Q3 468 556 61 993 265 098 16 650 124 815 3 667 474 452 12 712 525 9 329 2 858 238 428 11 327 206 201 5 784 -5 896 Q4 503 169 64 678 293 523 15 367 129 601 4 054 510 448 12 450 573 8 734 3 143 242 510 11 527 238 810 5 151 -7 279
06 Q1 567 457 70 427 335 147 15 406 146 477 4 223 575 591 12 799 552 9 257 2 990 274 164 13 136 269 594 5 899 -8 135 Q2 598 053 74 056 367 809 15 244 140 945 4 906 605 296 12 349 606 9 147 2 596 271 608 10 452 306 360 4 528 -7 243 Q3 631 194 77 999 394 055 15 720 143 420 5 211 638 432 12 239 906 8 178 3 156 283 136 12 132 322 554 8 370 -7 238 Q4 701 655 86 051 449 442 16 050 150 112 5 558 708 929 13 792 1 115 8 050 4 627 310 404 12 313 365 732 6 688 -7 274
07 Q1 757 772 85 608 505 222 16 843 150 100 5 702 767 704 13 439 1 310 8 405 3 723 317 123 18 134 413 794 5 214 -9 933 Q2 802 885 90 210 542 510 15 071 155 093 6 136 809 532 16 961 999 10 636 5 327 323 009 17 687 446 265 5 609 -6 647 Q3 808 192 93 673 562 017 14 608 137 894 6 105 810 837 17 195 1 298 9 956 5 941 317 961 16 300 452 935 6 447 -2 645 Q4 855 219 93 642 624 169 13 535 123 873 6 312 854 783 25 934 1 247 18 766 5 922 303 367 15 718 503 080 6 683 436
08 Q1 803 816 88 112 606 366 11 676 97 662 6 371 800 818 26 687 1 533 20 993 4 162 242 848 16 742 509 925 4 617 2 998 Q2 830 256 90 146 637 490 12 299 90 321 6 286 820 385 27 644 1 654 22 833 3 157 226 715 16 258 545 502 4 265 9 871 Q3 822 846 89 916 641 490 11 672 79 768 6 334 811 404 23 890 1 657 19 408 2 824 212 484 17 532 553 880 3 619 11 442
BANCO DE ESPAÑA 209 BOLETÍN ESTADÍSTICO, FEBRUARY 2013

___________________________________________________________________________________________________________________________
(c) Related to column 8, Total FASE (b) Portfolio investment institutins except Money market funds as Monetary Financial Institutions are included in chapter 8 (tables 8.F, 8.91 and 8.92) (a) Except insurance corporations and pension funds
9. NON-MONETARY FINANCIAL INSTITUTIONS (a) 9.E Assets and liabilities B) Other financial intermediaries: Portfolio investment institutions (b) Reconciliation between the financial balance sheets according to FASE and the official balance sheets
Data related to September 2008 Eur millions
Time Balance sheet Adjustments series in Total table and FASE column Total Capital Closed-end Open-end Hierarchy Valua-
(c) market mutual investment investment Total adjust- tion funds companies companies ments and (b) others
TOTAL OFFICIAL BALANCE SHEET ASSETS (I+II) . . . 194 882 168 011 26 871
I. OUTSTANDING FINANCIAL ASSETS included in FASE 9.21/2 194 882 168 011 26 870 1 049 6 009 -4 960 195 930
AF.2 Currency and deposits . . . . . . . . . . . . . 43 963 34 846 9 117 43 963 Financial corporations . . . . . . . . . . . . . . . . 9.23/2 43 841 ... ... ... 43 841
Rest of the world . . . . . . . . . . . . . . . . . . 9.23/11 122 ... ... ... 122
AF.3 Securities other than shares . . . . . . . . . . . 104 345 97 672 ... 6 673 21 21 104 366 331 Short term. . . . . . . . . . . . . . . . . . . . 23 232 20 770 ... 2 462 134 134 23 366 Non-financial corporations . . . . . . . . . . . . . . 9.22/4 1 810 1 156 ... 654 35 35 1 845
Financial corporations . . . . . . . . . . . . . . . . 9.23/5 17 925 16 506 ... 1 419 11 11 17 936
General Government . . . . . . . . . . . . . . . . . 9.22/10+13 3 497 3 108 ... 389 88 88 3 585
332 Long term . . . . . . . . . . . . . . . . . . . . 79 234 75 121 ... 4 113 -114 -114 79 121 Non-financial corporations . . . . . . . . . . . . . . 9.22/5 258 104 ... 154 258
Financial corporations . . . . . . . . . . . . . . . . 9.23/6 18 660 17 889 ... 771 -507 -507 18 153
General Government . . . . . . . . . . . . . . . . . 9.22/11+14 6 510 5 957 ... 553 219 219 6 730
Rest of the world . . . . . . . . . . . . . . . . . . 9.23/13 53 806 51 171 ... 2 635 174 174 53 980
34 Financial derivatives . . . . . . . . . . . . . . . 1 879 1 781 ... 98 1 879 Financial corporations . . . . . . . . . . . . . . . . 9.23/7 207 268 ... -61 207
Rest of the world . . . . . . . . . . . . . . . . . . 9.23/14 1 672 1 513 ... 159 1 672
AF.4 Loans . . . . . . . . . . . . . . . . . . . . . 1 159 1 159 1 159 Financial corporations . . . . . . . . . . . . . . . . 1 159 1 159 1 159
AF.5 Shares and other equity . . . . . . . . . . . . . 48 716 35 998 ... 12 718 -4 981 -4 981 43 735
511/512 Shares . . . . . . . . . . . . . . . . . . . 35 796 24 356 ... 11 441 -5 400 -5 400 30 396 Non-financial corporations . . . . . . . . . . . . . . 7 783 4 565 ... 3 217 -830 -830 6 953
Financial corporations . . . . . . . . . . . . . . . . 2 507 1 446 ... 1 060 -338 -338 2 169
Rest of the world . . . . . . . . . . . . . . . . . . 25 507 18 344 ... 7 163 -4 232 -4 232 21 275
52 Mutual funds shares . . . . . . . . . . . . . . . 12 920 11 642 ... 1 277 419 419 13 339 Financial corporations . . . . . . . . . . . . . . . . 12 920 11 642 ... 1 277 419 419 13 339
AF.7 Other accounts receivable . . . . . . . . . . . . -3 301 -1 664 -1 637 6 009 6 009 2 708 Non-financial corporations . . . . . . . . . . . . . . 9.22/7 ... ... ... ... 1 447
Financial corporations . . . . . . . . . . . . . . . . 9.23/9 ... ... ... ... 1 261
II. ASSETS not included in FASE . . . . . . . . . . . 0 ... 0 Fixed assets. . . . . . . . . . . . . . . . . . . . 9.21/8 0 ... 0
TOTAL OFFICIAL BALANCE SHEET LIABILITIES (III+IV) 194 882 168 011 ... 26 871
III. LIABILITIES included in FASE . . . . . . . . . . . 194 882 168 011 ... 26 871 1 767 -302 2 070 196 649
AF.5 Shares and other equity . . . . . . . . . . . . . 192 808 166 285 ... 26 523 2 070 2 070 194 878
511/512 Shares . . . . . . . . . . . . . . . . . . . Non-financial corporations, households and NPISH . . . . ...
Financial corporations . . . . . . . . . . . . . . . . ...
Rest of the world . . . . . . . . . . . . . . . . . . ...
52 Mutual funds shares issued by investment companies 192 808 166 285 ... 26 523 2 070 2 070 194 878 and issued by investment funds. . . . . . . . . . . Non-financial corporations, households and NPISH . . . . ... ... ... ... 154 796
Financial corporations . . . . . . . . . . . . . . . . ... ... ... ... 36 483
Rest of the world . . . . . . . . . . . . . . . . . . ... ... ... ... 3 599
AF.7 Other accounts payable . . . . . . . . . . . . . 9.24/10 2 074 1 726 ... 348 -302 -302 1 772
IV. LIABILITIES not included in FASE . . . . . . . . .
Memorandum item
NET FINANCIAL ASSETS (I-III) . . . . . . . . . . . . -0 -0 -719 -719
BANCO DE ESPAÑA 210 BOLETÍN ESTADÍSTICO, FEBRUARY 2013

1 2=3+4+5+7 3 4 5 6 7 8 9=10 a 12 10 11 12 13 = 2-9
9. NON-MONETARY FINANCIAL INSTITUTIONS (a) 9.21 Assets and liabilities. Valuation ofB) Other financial intermediaries: Porfolio investment institutions (b) financial balance sheets according toBalance sheets FASE and the official balance sheets
(c) Data based on Official balance sheet. (b) Portfolio investment institutions except Money markets funds (see in tables 8.F, 8.91 and 8.92). (a) Except insurance corporations and pension funds.
CNMV. Data on a ESA 95 basis Eur millions Financial assets Memorandum Liabilities
Number item: of Non-
entities Total Non-financial General Financial Rest financial Total Mutual Shares Other Net corporations Government corporations of the assets funds issued by account financial world (c) shares investment payable assets Of which except companies OMFIs MMF
01 4 689 156 999 11 079 23 173 46 064 39 310 76 684 2 162 242 137 493 23 709 1 040 -5 242 02 5 148 140 349 7 692 17 529 43 991 36 330 71 136 1 141 491 121 367 19 521 603 -1 142 03 5 388 174 576 9 765 15 436 59 305 39 405 90 070 1 181 254 152 573 27 463 1 219 -6 678
04 Q2 5 388 192 293 11 025 14 182 70 716 44 883 96 370 2 198 018 169 144 27 081 1 793 -5 725 Q3 5 486 194 424 11 459 13 271 72 162 44 857 97 532 2 196 193 171 087 23 636 1 470 -1 769 Q4 5 553 202 508 12 865 13 589 73 801 47 277 102 253 2 204 841 178 100 25 103 1 638 -2 333
05 Q1 5 603 213 392 13 152 13 104 75 891 47 974 111 245 2 213 572 186 060 25 773 1 740 -180 Q2 5 606 222 670 14 043 13 248 79 888 49 483 115 492 2 222 994 194 567 26 461 1 966 -324 Q3 5 644 233 322 15 266 13 880 83 064 52 975 121 113 2 233 564 203 669 27 754 2 141 -241 Q4 5 687 237 067 15 028 12 591 83 530 53 795 125 918 1 237 253 207 450 27 610 2 193 -186
06 Q1 5 738 267 348 16 336 12 658 95 183 63 845 143 170 1 268 049 237 410 28 691 1 948 -701 Q2 5 780 263 774 16 057 12 797 97 304 66 426 137 617 1 264 264 234 879 27 944 1 441 -490 Q3 5 860 274 654 17 931 13 447 103 396 72 424 139 879 1 275 414 244 734 29 200 1 480 -760 Q4 6 000 302 562 19 314 13 820 123 034 88 350 145 641 0 302 536 270 301 30 076 2 159 26
07 Q1 6 034 305 385 19 335 14 493 125 158 90 247 145 547 0 307 131 273 422 31 516 2 193 -1 746 Q2 6 138 312 253 18 955 13 451 129 446 92 505 149 533 0 311 810 276 600 32 792 2 418 443 Q3 6 198 305 471 17 870 13 011 141 648 104 649 132 058 0 305 681 270 736 32 360 2 584 -210 Q4 6 241 289 765 16 393 12 051 142 540 107 566 117 930 0 289 782 256 055 31 482 2 246 -17
08 Q1 6 220 232 662 13 581 10 120 114 972 83 870 93 356 0 229 050 197 834 29 056 2 160 3 612 Q2 6 268 214 304 11 632 10 523 104 750 76 313 86 835 0 211 943 181 725 28 415 1 802 2 362 Q3 6 259 195 930 10 502 10 315 97 649 73 515 77 049 0 196 649 167 738 27 140 1 772 -719
1=2+7 2=3+6 3=4+5 4 5 6 7 8=9+12 9=10+11 10 11 12=13+14 13 14
9. NON-MONETARY FINANCIAL INSTITUTIONS (a) 9.22 Financial assetsB) Other financial intermediaries: Porfolio investment institutions (b) Non-financial corporationsBalance sheets and General Government
(b) Portfolio investment institutions except Money market funds (see in tables 8.F, 8.91 and 8.92). (a) Except insurance corporations and pension funds.
CNMV. Data on an ESA 95 basis Eur millions
Non-financial corporations General Government Securities portfolio Other Securities portfolio account receivable Securities other than Shares State Other General Government
Total shares and Total Total other equity Short Long Short Long Short Long Total term term Total term term Total term term
01 11 079 9 792 2 327 1 722 606 7 465 1 286 23 173 21 923 1 327 20 596 1 250 418 832 02 7 692 6 798 740 657 83 6 058 894 17 529 16 574 1 420 15 155 955 420 535 03 9 765 8 970 990 555 435 7 980 795 15 436 14 604 1 323 13 281 832 192 640
04 Q2 11 025 10 132 1 006 554 452 9 127 893 14 182 13 294 937 12 357 888 267 621 Q3 11 459 10 514 1 178 875 304 9 336 946 13 271 12 299 748 11 551 972 435 537 Q4 12 865 11 906 1 242 941 300 10 665 959 13 589 12 565 1 290 11 275 1 025 532 493
05 Q1 13 152 12 584 1 337 906 431 11 247 567 13 104 12 128 1 154 10 974 975 392 584 Q2 14 043 13 149 1 357 920 437 11 791 894 13 248 12 238 1 689 10 549 1 009 583 427 Q3 15 266 14 493 1 173 733 439 13 320 774 13 880 12 932 2 396 10 536 948 435 512 Q4 15 028 14 307 1 322 517 805 12 985 721 12 591 11 782 1 555 10 226 809 402 407
06 Q1 16 336 15 477 1 548 1 200 348 13 929 859 12 658 12 022 2 249 9 773 636 241 396 Q2 16 057 15 193 1 815 1 409 406 13 378 864 12 797 12 123 2 604 9 520 673 283 390 Q3 17 931 16 894 1 969 1 542 428 14 924 1 037 13 447 12 819 2 932 9 887 628 235 393 Q4 19 314 17 935 2 735 2 259 476 15 200 1 379 13 820 13 156 3 026 10 130 665 331 334
07 Q1 19 335 18 128 2 120 1 613 507 16 008 1 208 14 493 13 791 3 310 10 481 702 301 401 Q2 18 955 17 449 1 323 820 503 16 126 1 505 13 451 12 648 2 539 10 108 804 424 379 Q3 17 870 16 098 1 490 1 122 367 14 608 1 773 13 011 12 229 2 388 9 841 782 420 361 Q4 16 393 14 978 1 803 1 347 456 13 175 1 415 12 051 11 335 2 264 9 071 717 384 333
08 Q1 13 581 12 055 2 274 1 613 661 9 781 1 526 10 120 9 406 2 806 6 600 714 318 396 Q2 11 632 10 576 2 103 1 600 503 8 473 1 056 10 523 9 806 3 524 6 282 717 315 402 Q3 10 502 9 055 2 103 1 845 258 6 953 1 447 10 315 9 532 3 222 6 309 783 363 420
BANCO DE ESPAÑA 211 BOLETÍN ESTADÍSTICO, FEBRUARY 2013

+8 2 +8 4=5+6 5 6 7 8 9 10=11+12 11 +15 13 14 15
9. NON-MONETARY FINANCIAL INSTITUTIONS (a) 9.23 Financial assetsB) Other financial intermediaries: Porfolio investment institutions (b) Financial institutionsBalance sheets and Rest of the world
(c) Incluiding repurchase agreements. (b) Portfolio investment institutions except Money market funds (see in tables 8.F, 8.91 and 8.92). (a) Except insurance corporations and pension funds.
CNMV. Data on an ESA 95 basis Eur millions
Financial corporations Rest of the world Currency Securities portfolio Other Currency Securities portfolio deposits account deposits and receivable and
Total loans (c) Securities other Financial Shares Total loans Securities Financial Shares Total than shares deriva- and Total other deriva- and tives other (c) than tives other equity shares equity Total Short Long
1=2+3+7 3=4+7 term term 12=13+14
01 46 064 32 001 12 561 5 983 3 078 2 905 - 6 577 1 502 76 684 100 76 584 48 195 - 28 388 02 43 991 30 865 12 112 5 613 2 962 2 651 - 6 499 1 014 71 136 100 71 036 53 412 - 17 625 03 59 305 33 662 24 816 8 563 2 940 5 623 - 16 254 827 90 070 100 89 970 64 850 - 25 120
04 Q2 70 716 38 029 31 759 11 663 4 805 6 859 - 20 096 928 96 370 100 96 270 64 040 - 32 230 Q3 72 162 36 368 34 886 14 017 6 468 7 549 - 20 869 909 97 532 100 97 432 66 432 - 31 000 Q4 73 801 34 900 37 976 16 808 8 608 8 200 - 21 168 925 102 253 100 102 153 68 539 - 33 614
05 Q1 75 891 36 492 38 520 18 020 8 625 9 395 124 20 375 879 111 245 100 111 145 72 425 2 596 36 124 Q2 79 888 36 435 42 625 21 071 11 388 9 684 176 21 377 828 115 492 100 115 392 74 818 3 014 37 560 Q3 83 064 36 678 45 444 22 731 10 939 11 792 337 22 376 942 121 113 100 121 013 75 394 3 505 42 114 Q4 83 530 34 783 47 797 24 892 13 457 11 435 348 22 557 950 125 918 100 125 818 75 987 3 756 46 075
06 Q1 95 183 39 164 54 923 30 781 17 586 13 195 391 23 752 1 095 143 170 100 143 070 81 578 4 482 57 010 Q2 97 304 39 080 57 153 33 133 20 143 12 990 318 23 702 1 072 137 617 100 137 517 77 822 3 749 55 946 Q3 103 396 40 308 61 881 38 145 24 287 13 858 448 23 289 1 207 139 879 100 139 779 78 338 4 182 57 259 Q4 123 034 47 994 73 892 49 788 31 188 18 600 610 23 495 1 900 145 641 100 145 541 82 153 4 706 58 682
07 Q1 125 158 47 828 76 093 51 801 33 314 18 487 546 23 746 2 088 145 547 105 145 442 81 276 4 762 59 404 Q2 129 446 47 228 80 942 55 259 35 489 19 769 586 25 098 2 145 149 533 148 149 384 80 373 5 134 63 877 Q3 141 648 54 525 85 733 59 845 41 212 18 633 437 25 451 2 274 132 058 102 131 955 74 059 4 752 53 144 Q4 142 540 54 256 86 937 61 786 44 249 17 537 519 24 632 2 197 117 930 122 117 809 68 669 4 205 44 935
08 Q1 114 972 48 592 65 041 42 086 31 516 10 570 260 22 695 1 973 93 356 - 93 356 59 750 2 708 30 899 Q2 104 750 41 604 62 037 41 811 31 220 10 591 262 19 964 1 673 86 835 122 86 714 56 930 2 141 27 643 Q3 97 649 45 000 51 804 36 089 17 936 18 153 207 15 508 1 261 77 049 122 76 927 53 980 1 672 21 275
1=2+6+10 2= 3 a 5 3 4 5 6=7 a 9 7 8 9 10
9. NON-MONETARY FINANCIAL INSTITUTIONS (a) 9.24 Liabilities by sector.B) Other financial intermediaries: Porfolio investment institutions (b) Valuation of liabilities inBalance sheets accordance whit ESA 95
(b) Portfolio investment institutions except Money market funds (see in tables 8.F, 8.91 and 8.92). (a) Except insurance corporations and pension funds.
CNMV. Data on a ESA 95 basis Eur millions Shares Mutual funds shares Other account payable
Total Total Non-financial Financial Rest Total Non-financial Financial Rest corporations, corporations of the corporations, corporations of the households world households world and NPISH and NPISH
01 162 242 23 709 18 826 4 883 - 137 493 112 481 22 581 2 431 1 040 02 141 491 19 521 15 539 3 982 - 121 367 96 763 21 921 2 682 603 03 181 254 27 463 22 687 4 776 - 152 573 117 179 32 258 3 136 1 219
04 Q2 198 018 27 081 22 307 4 774 - 169 144 129 374 36 351 3 419 1 793 Q3 196 193 23 636 19 431 4 205 - 171 087 130 398 37 255 3 434 1 470 Q4 204 841 25 103 20 586 4 517 - 178 100 141 837 32 393 3 870 1 638
05 Q1 213 572 25 773 21 215 4 558 - 186 060 150 021 32 305 3 733 1 740 Q2 222 994 26 461 21 772 4 689 - 194 567 156 442 34 343 3 782 1 966 Q3 233 564 27 754 22 820 4 934 - 203 669 164 915 35 089 3 665 2 141 Q4 237 253 27 610 22 716 4 894 - 207 450 169 351 34 395 3 704 2 193
06 Q1 268 049 28 691 23 589 5 102 - 237 410 195 470 37 695 4 245 1 948 Q2 264 264 27 944 22 976 4 968 - 234 879 192 364 38 314 4 201 1 441 Q3 275 414 29 200 23 989 5 211 - 244 734 202 274 37 720 4 740 1 480 Q4 302 536 30 076 24 731 5 345 - 270 301 225 581 39 584 5 136 2 159
07 Q1 307 131 31 516 25 924 5 592 - 273 422 228 073 40 143 5 206 2 193 Q2 311 810 32 792 26 966 5 826 - 276 600 229 351 41 856 5 393 2 418 Q3 305 681 32 360 26 617 5 743 - 270 736 222 421 43 217 5 099 2 584 Q4 289 782 31 482 25 629 5 852 - 256 055 208 688 42 719 4 647 2 246
08 Q1 229 050 29 056 21 873 7 183 - 197 834 158 181 36 585 3 067 2 160 Q2 211 943 28 415 21 649 6 767 - 181 725 143 418 34 389 3 919 1 802 Q3 196 649 27 140 20 902 6 238 - 167 738 133 894 30 245 3 599 1 772
BANCO DE ESPAÑA 212 BOLETÍN ESTADÍSTICO, FEBRUARY 2013

1=2 a 5 2 3 4 5 6 10+12 8 9 10 11 12 13=1 - 7
9. NON-MONETARY FINANCIAL INSTITUTIONS (a) 9.31 Assets and liabilitiesB) Other financial intermediaries: Securities-dealers companies Valuation of financial assets andBalance sheets liabilities in accordance whit ESA 95
(b) Data based on Official balance sheet. (a) Except insurance corporations and pension funds.
CNMV. Data on a ESA 95 basis Eur millions
Financial assets Memorandum Liabilities item: Non-
Total Non- General Financial Rest financial Total Shares Loans Currency and Other Net financial Government institu- of the assets deposits including account financial corporations tions world (b) repurchase agreements payable assets Total Of which: Financial institu- 7=8+9+ tions
01 11 361 3 360 66 7 809 126 89 10 499 1 198 - 7 032 6 222 2 269 862 02 10 044 1 171 49 8 562 263 73 10 009 1 116 - 7 553 6 760 1 340 36 03 10 288 2 061 49 7 370 807 61 10 229 996 1 915 6 490 5 796 828 59
04 Q2 11 876 1 996 61 8 828 991 58 12 917 1 100 1 956 7 935 7 306 1 926 -1 041 Q3 11 272 2 133 34 8 087 1 018 56 11 691 1 150 1 690 7 297 6 679 1 554 -419 Q4 9 662 1 818 52 6 382 1 411 54 10 043 1 104 1 918 5 574 4 971 1 447 -380
05 Q1 12 385 1 905 51 9 006 1 422 46 13 128 1 157 1 720 8 193 7 588 2 059 -743 Q2 15 047 2 706 62 9 268 3 011 45 13 601 1 198 2 115 8 119 7 518 2 170 1 446 Q3 13 016 2 437 1 6 846 3 732 44 11 625 1 287 2 743 5 969 5 329 1 626 1 391 Q4 12 212 2 120 1 6 405 3 685 43 10 669 1 206 3 029 5 421 4 734 1 013 1 542
06 Q1 12 890 2 657 1 6 849 3 383 42 11 447 1 283 2 878 5 921 5 257 1 365 1 443 Q2 12 042 2 215 4 6 435 3 388 42 10 808 1 261 2 493 5 855 5 147 1 198 1 235 Q3 16 115 5 271 62 7 184 3 598 41 13 970 1 497 3 054 5 185 4 178 4 234 2 144 Q4 16 168 3 862 7 7 765 4 533 40 14 292 1 355 4 522 5 270 4 050 3 145 1 876
07 Q1 14 809 3 169 7 7 079 4 553 40 13 379 1 679 3 716 5 706 4 388 2 277 1 430 Q2 18 040 3 230 30 9 219 5 560 43 16 590 1 771 5 321 7 421 6 416 2 078 1 450 Q3 19 494 4 631 76 8 951 5 836 43 18 068 1 890 5 935 7 036 5 732 3 207 1 426 Q4 21 833 5 006 1 10 884 5 942 45 20 509 1 633 5 918 8 777 7 526 4 181 1 324
08 Q1 20 183 3 410 1 12 588 4 184 50 19 675 1 865 4 157 11 301 9 763 2 353 508 Q2 20 487 2 882 1 14 118 3 486 50 20 398 1 816 3 154 13 257 11 599 2 172 88 Q3 16 775 3 086 1 10 969 2 719 50 16 510 1 864 2 821 9 852 8 191 1 974 265
+17= 1 3+6= 2 4+5=3 4 5 6 7 8 a 15=9 10 11 12 13 14 15 16 17 18
9. NON-MONETARY FINANCIAL INSTITUTIONS, (a) 9.32 Financial assetsB) Other financial intermediaries: Securities-dealer companies Breakdown byBalance sheets institutional sectors
(c) Including repurchase agreements. (b) Balance sheets at book value, for the Securities-dealer companies and Securities agencies are disseminated by the National Securities Market Commission (CNMV) (a) Except Insurance corporations and pension funds.
CNMV. Data on an ESA 95 basis (b) Eur millions Non-financial corporations General Financial institutions Rest of the world Government Securi- ties Securities portfolio Other portfo- Securities portfolio Cu- Loans Other Securities portfolio accounts lio: rrency accounts payable Securi- and payable Securi- Shares Total ties Securi- Shares depo- Securi- Shares
Total Total ties and other Total ties and sits ties and Total other other than Total other other Total other other than equity shares than equity (c) than equity shares shares shares
2+7+10+ 10+13 11+12= 17+18=
01 11 361 3 360 1 835 3 1 832 1 525 66 66 7 809 383 10 372 7 153 23 250 126 3 123 02 10 044 1 171 461 13 448 711 49 49 8 562 175 55 120 8 127 110 150 263 7 255 03 10 288 2 061 979 7 972 1 082 49 49 7 370 346 161 184 6 721 115 188 807 17 791 04 9 662 1 818 573 10 564 1 244 52 52 6 382 660 490 170 5 540 58 124 1 411 27 1 383
05 Q1 12 385 1 905 488 10 478 1 417 51 51 9 006 700 545 155 8 046 136 124 1 422 27 1 395 Q2 15 047 2 706 1 130 0 1 130 1 576 62 62 9 268 804 363 440 8 139 202 124 3 011 1 538 1 474 Q3 13 016 2 437 502 0 502 1 935 1 1 6 846 502 342 160 6 049 171 124 3 732 1 431 2 302 Q4 12 212 2 120 494 0 494 1 626 1 1 6 405 659 509 150 5 428 194 124 3 685 1 324 2 362
06 Q1 12 890 2 657 583 0 583 2 074 1 1 6 849 1 071 908 163 5 331 323 124 3 383 1 224 2 159 Q2 12 042 2 215 575 0 574 1 641 4 4 6 435 1 270 1 120 150 4 497 544 124 3 388 1 140 2 248 Q3 16 115 5 271 2 293 0 2 293 2 977 62 62 7 184 2 442 1 267 1 175 4 350 268 124 3 598 1 073 2 525 Q4 16 168 3 862 1 514 0 1 514 2 348 7 7 7 765 2 544 1 056 1 488 4 620 451 150 4 533 1 029 3 504
07 Q1 14 809 3 169 627 0 627 2 542 7 7 7 079 1 315 1 102 213 5 021 593 150 4 553 979 3 573 Q2 18 040 3 230 511 0 511 2 719 30 30 9 219 1 684 1 478 206 6 563 822 150 5 560 952 4 609 Q3 19 494 4 631 631 0 630 4 001 76 76 8 951 1 552 1 371 181 6 796 454 150 5 836 920 4 916 Q4 21 833 5 006 786 0 786 4 220 1 1 10 884 1 331 924 407 9 069 333 150 5 942 867 5 075
08 Q1 20 183 3 410 568 0 568 2 842 1 1 12 588 1 147 1 016 130 10 854 437 150 4 184 794 3 390 Q2 20 487 2 882 627 0 626 2 255 1 1 14 118 1 031 682 348 12 627 310 150 3 486 733 2 752 Q3 16 775 3 086 570 1 569 2 516 1 1 10 969 1 866 1 699 167 8 650 303 150 2 719 608 2 111
BANCO DE ESPAÑA 213 BOLETÍN ESTADÍSTICO, FEBRUARY 2013

____
____
____
____
____
____
____
____
____
____
____
____
____
____
____
____
____
____
____
____
____
____
____
____
____
____
____
____
____
____
____
____
____
____
____
____
____
____
____
____
____
____
____
____
____
____
9. N
ON
-MO
NE
TA
RY
FIN
AN
CIA
L IN
ST
ITU
TIO
NS
(a)
9.F
A
sset
s
C)
Fin
anci
al a
uxi
liari
es (
b)
R
eco
nci
liati
on
bet
wee
n t
he
fin
anci
al b
alan
ce s
hee
ts a
cord
ing
to
FA
SE
an
d t
he
off
icia
l bal
ance
sh
eets
Data
rela
ted to S
epte
mber
2008
Eur
mill
ions
Bal
ance
-she
et
Adj
ustm
ent
Tot
al
T
ime
FA
SE
s
erie
s
in
tabl
e
Tot
al
D
epos
it
UC
ITs
Mut
ual
Sec
uri-
P
ensi
on
App
rais
al P
ortfo
lio V
entu
re
Ins
u-
For
eing
S
ecur
ity
T
otal
H
iera
rchy
Val
ua-
an
d
g
uara
ntee
m
anag
e-
gua
rant
ee
ties
fund
s
com
pani
es
man
age-
c
apita
l r
ance
e
xcha
nge
mar
kets
adj
ust-
t
ión
c
olum
n
fu
nds
men
ts
com
pani
es a
genc
ies
man
agem
ent
m
ent
m
anag
e-
com
pany
offi
ces
m
anag
e-
m
ents
and
c
ompa
nies
com
pani
es
com
pani
es
men
t
liqu
ida
men
t and
ot
hers
com
pani
es t
ion
c
lear
ing
boa
rd
com
pani
es
(c)
(d)
(e)
(
e)
(e)(
f)
(
e)
(
e)
(g)
T
OT
AL
OF
FIC
IAL
BA
LA
NC
E S
HE
ET
AS
SE
TS
(I+
II).
..
..
.
15 7
89
6 68
7 4
038
768
250
511
256
48
......
...3
233
I.
OU
TS
TA
ND
ING
FIN
AN
CIA
L A
SS
ET
S in
clu
ded
in F
AS
E.
..
9.42
/115
490
...
3 85
2 73
5 24
3 ...
...47
...
......
...1
940
216
1 72
3 17
430
A
F.2
Cu
rren
cy a
nd
dep
osi
ts.
..
..
..
..
..
..
..
.
4 84
7 ...
895
252
172
......
34
......
......
-0
-0
4
847
F
inanci
al
corp
ora
tions.
..
..
..
..
..
..
..
..
..
9.4
2/3
4 8
47
...
895
252
172
...
...
34
...
...
...
...
-0
-0
4 8
47
A
F.3
Sec
uri
ties
oth
er t
han
sh
ares
..
..
..
..
..
..
.
8 93
6 ...
1 90
5 43
9 0
......
3 ...
......
...15
2
152
9 08
9
33
1 S
ho
rt t
erm
..
..
..
..
..
..
..
..
..
..
..
1
901
...18
5 ...
......
......
......
......
-43
-4
3 1
859
N
on-f
inanci
al
corp
ora
tions
..
..
..
..
..
..
..
..
.9.4
2/2
...
...
...
...
...
...
...
...
...
F
inanci
al
corp
ora
tions.
..
..
..
..
..
..
..
..
..
9.4
2/3
...
...
...
...
...
...
...
...
G
ener
al
Gove
rnm
ent
..
..
..
..
..
..
..
..
..
.9.4
2/4
1 9
01
...
185
...
...
...
...
...
...
...
...
...
-43
-43
1 8
59
33
2 L
on
g t
erm
..
..
..
..
..
..
..
..
..
..
..
7
035
...1
720
...0
......
3 ...
......
...19
5
195
7 23
0 N
on-f
inanci
al
corp
ora
tions
..
..
..
..
..
..
..
..
.9.4
2/2
1 2
59
...
1 1
68
...
...
...
...
0
...
...
...
...
1 2
59
F
inanci
al
corp
ora
tions.
..
..
..
..
..
..
..
..
..
9.4
2/3
302
...
1
...
...
...
...
...
...
...
...
...
7
7
308
G
ener
al
Gove
rnm
ent
..
..
..
..
..
..
..
..
..
.9.4
2/4
5 3
49
...
550
...
0
...
...
2
...
...
...
...
188
188
5 5
37
R
est
of
the
worl
d.
..
..
..
..
..
..
..
..
..
..
9.4
2/5
125
2
...
...
...
1
...
...
...
...
1
1
125
A
F.4
Lo
ans
..
..
..
..
..
..
..
..
..
..
..
..
33
...
8
...
...
33
N
on-f
inanci
al
corp
ora
tions,
house
hold
s and N
PIS
H.
..
..
..
9.4
2/2
10
...
8
...
...
10
F
inanci
al
corp
ora
tions.
..
..
..
..
..
..
..
..
..
9.4
2/3
23
...
...
...
23
A
F.5
Sh
ares
an
d o
ther
eq
uit
y.
..
..
..
..
..
..
..
1
239
...40
2 19
29
...
...4
......
......
1 57
1
1 57
1 2
810
51
1/51
2 S
har
es.
..
..
..
..
..
..
..
..
..
..
.
1 01
8 ...
402
19
7 ...
...4
......
......
1 36
6
1 36
6 2
383
N
on-f
inanci
al
corp
ora
tions
..
..
..
..
..
..
..
..
.9.4
2/2
610
...
5
...
7
...
...
...
...
...
...
...
870
870
1 4
81
F
inanci
al
corp
ora
tions.
..
..
..
..
..
..
..
..
..
9.4
2/3
407
...
397
...
...
...
...
4
...
...
...
...
495
495
902
R
esto
del
mundo
..
..
..
..
..
..
..
..
..
..
.9.4
2/5
0
0
...
...
...
0
...
...
...
...
-0
-0
0
52
Mu
tual
fu
nd
s sh
ares
..
..
..
..
..
..
..
..
..
22
1 ...
22
......
...
......
...20
6
206
427
F
inanci
al
corp
ora
tions.
..
..
..
..
..
..
..
..
..
9.4
2/3
221
...
22
...
...
...
...
...
...
206
206
427
A
F.7
Oth
er a
cco
un
ts r
ecei
vab
le.
..
..
..
..
..
..
.
435
...64
9 24
33
...
...6
......
......
216
216
65
1 N
on-f
inanci
al
corp
ora
tions,
house
hold
s and N
PIS
H.
..
..
..
9.4
2/2
...
...
...
...
...
...
...
...
...
...
...
...
257
F
inanci
al
corp
ora
tions.
..
..
..
..
..
..
..
..
..
9.4
2/3
...
...
...
...
...
...
...
...
...
...
...
...
394
II
. AS
SE
TS
no
t in
clu
ded
in F
AS
E.
..
..
..
..
..
..
.
299
...18
6 33
7
......
1 ...
......
...
Fix
ed a
sset
s.
..
..
..
..
..
..
..
..
..
..
.9.
42/6
299
...18
6 33
7
......
1 ...
......
...
BANCO DE ESPAÑA 214 BOLETÍN ESTADÍSTICO, FEBRUARY 2013

____
____
____
____
____
____
____
____
____
____
____
____
____
____
____
____
____
____
____
____
____
____
____
____
____
____
____
____
____
____
____
____
____
____
____
____
____
____
____
____
____
____
____
____
____
____
(g)
Law
44/
2002
has
sup
pres
sed
this
org
anis
m a
nd it
s fu
ntio
ns h
ave
been
ass
umed
by
the
Con
sorc
io d
e C
ompe
nsac
ión
de S
egur
os.
(f)
Ent
ities
that
onl
y re
aliz
e pe
nsio
n fu
nds
man
agem
ent a
ctiv
ities
. (
e) E
stim
ated
dat
a.
ta
bles
91.
A a
nd 9
2.A
). (
d) W
hen
info
rmat
ion
of s
ome
of th
e in
stitu
tions
incl
uded
in th
e gr
oupi
ng is
not
ava
ilabl
e an
d fig
ures
can
be
estim
ated
, dat
a ha
s be
en in
clud
ed in
the
aggr
egat
es. C
ount
erpa
rt s
ecto
r br
eakd
owns
of t
he b
alan
ce-s
heet
item
s ha
ve b
een
obta
ined
in th
e sa
me
way
(se
e (
c) R
elat
ed T
otal
FA
SE
.
st
atis
tical
reg
iste
rs o
f the
Ban
co d
e E
spañ
a. (
b) D
ue to
the
pec
ulia
ritie
s of
thes
e fin
anci
al in
term
edia
ries
it sh
ould
be
take
n in
to a
ccou
nt th
at th
e N
on-m
onet
ary
finan
cial
ins
titut
ions
that
are
sho
wed
in th
is ta
ble
are
thos
e fo
r w
hich
, at t
he m
omen
t of t
he e
ditio
n of
this
pub
licat
ion,
info
rmat
ion
is a
vaila
ble
in th
e (
a) E
xcep
t ins
uran
ce c
orpo
ratio
ns a
nd p
ensi
on fu
nds.
9. N
ON
-MO
NE
TA
RY
FIN
AN
CIA
L IN
ST
ITU
TIO
NS
(a)
9.G
Lia
bili
ties
C
) F
inan
cial
au
xilia
ries
(b
)
Rec
on
cilia
tio
n b
etw
een
th
e fi
nan
cial
bal
ance
sh
eets
aco
rdin
g t
o F
AS
E a
nd
th
e o
ffic
ial b
alan
ce s
hee
ts
Data
rela
ted to S
epte
mber
2008
Eur
mill
ions
Bal
ance
-she
et
Adj
ustm
ent
Tot
al
T
ime
FA
SE
s
erie
s
in
tabl
e
Tot
al
D
epos
it
UC
ITs
Mut
ual
Sec
uri-
P
ensi
on
App
rais
al P
ortfo
lio V
entu
re
Ins
u-
For
eing
S
ecur
ity
T
otal
H
iera
rchy
Val
ua-
an
d
g
uara
ntee
m
anag
e-
gua
rant
ee
ties
fund
s
com
pani
es
man
age-
c
apita
l r
ance
e
xcha
nge
mar
kets
adj
ust-
t
ión
c
olum
n
fu
nds
men
ts
com
pani
es a
genc
ies
man
agem
ent
m
ent
m
anag
e-
com
pany
offi
ces
m
anag
e-
m
ents
and
c
ompa
nies
com
pani
es
com
pani
es
men
t
liqu
ida
men
t and
ot
hers
com
pani
es t
ion
c
lear
ing
boa
rd
com
pani
es
(c)
(d)
(e)
(
e)
(e)(
f)
(
e)
(
e)
(g)
T
OT
AL
OF
FIC
IAL
BA
LA
NC
E S
HE
ET
LIA
BIL
ITIE
S (
III+
IV)
..
.
15 7
89
6 68
7 4
038
768
250
511
256
48
......
...3
233
II
I. L
IAB
ILIT
IES
incl
ud
ed in
FA
SE
..
..
..
..
..
..
..
9.42
/79
104
...4
038
768
250
511
256
48
......
...3
233
630
-472
1
102
9 73
4
A
F.3
Sec
uri
ties
oth
er t
han
sh
ares
..
..
..
..
..
..
.
...
......
......
......
......
......
0
0 0
F
inan
cial
der
ivat
ives
..
..
..
..
..
..
..
..
..
9.42
/10
...
......
......
......
......
......
0
0 0
A
F.4
Lo
ans
..
..
..
..
..
..
..
..
..
..
..
..
9.42
/828
5 ...
252
0 8
...
......
...
285
F
inanci
al
corp
ora
tions.
..
..
..
..
..
..
..
..
..
9.4
2/8
285
...
252
0
8
...
...
...
...
285
A
F.5
Sh
ares
an
d o
ther
eq
uit
y.
..
..
..
..
..
..
..
9.42
/94
910
2
834
637
167
......
39
...
......
1 10
8
1 10
8 6
017
51
1/51
2 S
har
es.
..
..
..
..
..
..
..
..
..
..
.9.
42/9
4 91
0
2 83
4 63
7 16
7 ...
...39
...
...
...1
108
1
108
6 01
7 N
on-f
inanci
al
corp
ora
tions,
house
hold
s and N
PIS
H.
..
..
..
9.4
2/9
67
...
...
...
...
...
...
...
...
...
67
F
inanci
al
corp
ora
tions.
..
..
..
..
..
..
..
..
..
9.4
2/9
4 3
10
...
...
...
...
...
...
...
...
...
997
997
5 3
07
G
ener
al
Gove
rnm
ent
..
..
..
..
..
..
..
..
..
.9.4
2/9
435
...
...
...
...
...
...
...
...
...
435
R
est
of
the
worl
d.
..
..
..
..
..
..
..
..
..
..
9.4
2/9
97
...
...
...
...
...
...
...
...
...
111
111
208
A
F.7
Oth
er a
cco
un
ts p
ayab
le.
..
..
..
..
..
..
..
9.42
/11
3 90
4 ...
952
130
72
......
9 ...
......
...-4
72
-472
3 43
2 N
on-f
inanci
al
corp
ora
tions,
house
hold
s and N
PIS
H.
..
..
..
9.4
2/1
1...
...
...
...
...
...
...
...
...
...
...
...
2 0
18
F
inanci
al
corp
ora
tions.
..
..
..
..
..
..
..
..
..
9.4
2/1
1...
...
...
...
...
...
...
...
...
...
...
...
1 4
14
IV
. LIA
BIL
ITIE
S n
ot
incl
ud
ed in
FA
SE
..
..
..
..
..
..
6
686
...
...
......
Mem
ora
nd
um
item
N
ET
FIN
AN
CIA
L A
SS
ET
S (
I-III
).
..
..
..
..
..
..
..
9.42
/12
6 38
7 ...
-186
-3
3 -7
...
...-1
...
......
...1
310
7 69
6
BANCO DE ESPAÑA 215 BOLETÍN ESTADÍSTICO, FEBRUARY 2013

1=2a10 2 3 4 5 6 7 8 9 10 11 12 13 14 15
9. NON-MONETARY FINANCIAL INSTITUTIONS (a) 9.41 Total assets and liabilities by institutional groupingC) Financial auxiliaries (b) Official balance sheet dataBalance sheets
(d) Law 44/2002 has suppressed this organism and its funtions have been assumed by the Consorcio de Compensación de Seguros. (c) Only pure pension funds management companies. which, at the moment of the edition of this publication,information is available in the statistical registers of the Banco of España. (b) Due to the peculiarities of these auxiliaries to the financial intermediation it should be taken into account that the Financial Auxiliaries that are showed in this table are those for (a) Except insurance corporations and pension funds
BE, CNMV, DGSFP Eur millions and %
Financial auxiliaries % on total Financial auxiliaries
Total Deposit Ucits and Securi- Mutual Pension Apprai- Venture Insurance Foreing Security Deposit Ucits Securi- Rest of guaran- portfolio ties guarantee funds sal capital company exchange markets guaran- and ties financial tee mana- agencies companies mana- compa- mana- liquida- offices mana- tee portfolio agencies auxilia- funds gement gement nies gement tion gement and funds mana- ries companies companies compa- board cleaning gement (c) nies companies companies (d)
01 9 845 3 901 2 046 375 320 511 100 ... 120 ... 2 473 39,63 20,78 3,81 35,79 02 9 364 4 314 1 841 456 358 482 134 ... - ... 1 779 46,07 19,66 4,87 29,40 03 10 283 4 672 1 824 474 404 497 173 ... - ... 2 240 45,43 17,74 4,60 32,22
04 Q2 10 814 5 020 1 878 584 423 497 173 ... - ... 2 240 46,42 17,36 5,40 30,82 Q3 10 995 5 147 1 891 590 445 511 173 ... - ... 2 240 46,81 17,20 5,36 30,63 Q4 11 206 5 276 1 925 620 461 511 173 ... - ... 2 240 47,08 17,18 5,54 30,20
05 Q1 11 494 5 527 1 926 639 479 511 173 ... - ... 2 240 48,08 16,75 5,56 29,60 Q2 11 800 5 669 2 052 676 479 511 173 ... - ... 2 240 48,04 17,39 5,73 28,83 Q3 12 053 5 812 2 049 772 496 511 173 ... - ... 2 240 48,22 17,00 6,41 28,37 Q4 11 841 5 425 2 159 801 532 511 173 ... - ... 2 240 45,81 18,24 6,77 29,18
06 Q1 12 153 5 530 2 159 976 564 511 173 ... - ... 2 240 45,50 17,77 8,03 28,70 Q2 12 258 5 637 2 168 885 564 511 252 ... - ... 2 240 45,99 17,69 7,22 29,10 Q3 12 493 5 745 2 170 968 607 511 252 ... - ... 2 240 45,98 17,37 7,75 28,90 Q4 13 908 5 853 2 573 911 650 511 252 ... - ... 3 158 42,08 18,50 6,55 32,87
07 Q1 14 377 5 966 2 569 1 000 677 730 277 ... - ... 3 158 41,50 17,87 6,95 33,68 Q2 15 612 6 082 3 592 1 097 677 730 277 ... - ... 3 158 38,95 23,01 7,02 31,01 Q3 15 785 6 198 3 594 1 090 738 730 277 ... - ... 3 158 39,26 22,77 6,91 31,06 Q4 15 085 6 314 2 670 1 113 748 730 277 ... - ... 3 233 41,86 17,70 7,38 33,06
08 Q1 ... ... 2 674 281 760 ... ... ... - ... ... ... ... ... ... Q2 ... ... 4 086 269 768 ... ... ... - ... ... ... ... ... ... Q3 ... ... 4 086 250 768 ... ... ... - ... ... ... ... ... ...
1=2a5 2 3 4 5 6 7=8a10 8 9 10 11 12=1-7
9. NON-MONETARY FINANCIAL INSTITUTIONS (a) 9.42 Assets and liabilities. Valuation of financialC) Financial auxiliaries assets and liabilities in accordance with ESA 95Balance sheets
(a) Except Insurance corporations and pension funds
BE, CNMV, DGSFP. Data on a ESA 95 basis Eur millions
Financial assets Memorandum Liabilities Net item: financial non- assets
Total Non-financial Financial General Rest financial Total Currency, Shares Financial Other corporations, institutions Goverment of the assets deposits and derivatives account households world loans of payable and NPISH financial institutions
01 10 389 2 086 3 389 4 874 40 168 5 837 124 2 578 ... 3 136 4 552 02 9 594 1 376 2 860 5 318 41 188 5 033 162 2 598 ... 2 273 4 562 03 10 518 1 175 3 334 5 930 79 211 5 587 219 2 628 -0 2 740 4 931
04 Q2 11 101 1 220 3 557 6 242 82 206 5 808 172 2 690 0 2 946 5 293 Q3 11 326 1 196 3 620 6 418 93 208 5 831 173 2 722 0 2 936 5 496 Q4 11 526 968 3 763 6 698 97 206 5 925 254 2 731 0 2 940 5 602
05 Q1 11 261 860 3 789 6 511 101 206 5 599 259 2 738 - 2 602 5 661 Q2 11 403 731 3 905 6 666 101 204 6 172 250 2 798 0 3 124 5 231 Q3 11 588 688 4 084 6 706 109 204 6 364 315 2 824 -0 3 226 5 223 Q4 11 927 841 4 465 6 510 111 202 6 564 278 2 969 0 3 316 5 364
06 Q1 12 542 1 225 4 649 6 541 127 205 6 887 342 3 028 0 3 517 5 656 Q2 12 453 1 076 4 621 6 634 123 222 6 863 287 3 075 0 3 501 5 590 Q3 12 717 938 4 903 6 754 122 219 9 543 311 5 597 -0 3 635 3 174 Q4 14 287 1 679 5 565 6 910 133 181 10 224 415 5 713 - 4 095 4 063
07 Q1 15 279 2 507 5 684 6 946 141 190 10 893 413 6 210 - 4 271 4 385 Q2 16 243 2 899 6 196 7 006 141 363 12 635 384 7 620 0 4 632 3 607 Q3 16 667 3 129 6 223 7 176 139 364 12 705 433 7 701 -0 4 571 3 963 Q4 16 423 1 799 7 350 7 139 135 205 12 044 428 7 269 0 4 347 4 379
08 Q1 15 519 1 712 6 463 7 195 149 201 9 933 231 5 896 -0 3 805 5 586 Q2 16 977 2 686 6 937 7 219 135 299 10 561 285 6 496 -0 3 780 6 416 Q3 17 430 3 007 6 902 7 396 125 299 9 734 285 6 017 0 3 432 7 696
BANCO DE ESPAÑA 216 BOLETÍN ESTADÍSTICO, FEBRUARY 2013

1=2+25 16+23+24 3=4 a 6 4 5 6 14+15 8=9+10 9 10 11=12+13 12 13 14 15
9. NON-MONETARY FINANCIAL INSTITUTIONS 9.50 Breakdown of appraisals:C) Financial auxiliaries: Appraisal companies number of appraisalsAppraisal activity information
See notes at the end of the chapter
BE Number in thousands Property appraisals
Total appraisals
Land Complete buildings (b) Total Residential use Tertiary use Total Urban Rural Non-buildable Total Industrial Other land property land (a) Total Primary Secondary Total Offices Commercial residence residence use 2=3+7+ 7=8+11+
02 1 191.5 1 179.6 43.9 25.7 18.3 ... 69.6 37.2 ... ... 3.1 ... ... 24.6 4.7 03 1 399.3 1 389.0 51.0 31.4 19.6 ... 77.5 38.2 ... ... 4.6 ... ... 28.6 6.1 04 1 618.0 1 610.8 65.2 41.8 20.1 3.3 76.7 41.4 38.2 3.2 4.6 1.3 3.3 24.4 6.2 05 1 803.8 1 798.1 75.0 53.6 19.9 1.6 88.5 46.9 43.7 3.2 5.8 1.5 4.3 25.7 10.1 06 1 786.1 1 779.0 83.0 61.1 20.2 1.6 92.8 52.6 49.3 3.3 5.0 1.5 3.4 25.6 9.7 07 1 518.9 1 510.8 72.5 50.8 19.0 2.7 92.1 48.5 45.8 2.7 8.4 3.5 4.9 25.4 9.8 08 1 104.6 1 093.0 72.3 48.5 20.7 3.1 70.2 27.8 26.0 1.8 12.2 6.0 6.2 22.4 7.8 09 1 062.9 1 043.8 77.4 49.6 24.8 3.0 61.0 20.2 18.9 1.3 12.7 6.8 5.9 21.5 6.6 10 976.8 964.1 64.0 39.0 23.4 1.7 44.8 17.9 16.6 1.3 4.7 1.6 3.1 16.1 6.0 11 774.0 760.0 59.8 38.0 20.5 1.4 44.3 19.5 18.3 1.2 4.6 1.7 2.9 15.6 4.7
09 Q1 288.0 282.4 22.3 14.8 6.5 0.9 18.9 5.8 5.4 0.4 5.1 2.9 2.2 6.2 1.9 Q2 286.6 280.7 21.3 13.8 6.6 0.9 16.8 5.5 5.2 0.3 3.4 1.6 1.8 6.0 2.0 Q3 227.2 224.8 16.0 9.7 5.8 0.6 12.0 4.0 3.7 0.2 2.7 1.8 0.9 4.0 1.3 Q4 261.1 255.9 17.8 11.3 5.9 0.6 13.3 4.9 4.6 0.3 1.6 0.5 1.1 5.3 1.5
10 Q1 251.1 247.5 18.1 10.8 6.9 0.4 12.2 4.6 4.4 0.2 1.4 0.5 0.8 4.6 1.6 Q2 269.0 265.3 15.7 9.7 5.5 0.5 11.4 4.4 4.2 0.3 1.2 0.3 0.9 4.3 1.4 Q3 195.8 193.1 14.2 8.2 5.7 0.3 9.0 3.7 3.5 0.2 0.8 0.3 0.6 3.1 1.3 Q4 260.9 258.2 16.0 10.3 5.3 0.4 12.3 5.2 4.6 0.6 1.3 0.5 0.8 4.1 1.7
11 Q1 205.8 202.8 15.5 9.7 5.4 0.4 11.2 4.7 4.4 0.3 1.2 0.4 0.7 4.0 1.3 Q2 206.3 201.7 15.9 9.8 5.6 0.5 10.9 4.4 4.2 0.3 1.1 0.4 0.7 4.1 1.3 Q3 162.1 158.5 11.9 7.5 4.2 0.2 9.3 3.9 3.6 0.2 1.0 0.4 0.6 3.5 0.9 Q4 199.7 197.0 16.6 11.0 5.3 0.3 12.9 6.5 6.1 0.4 1.3 0.5 0.8 4.0 1.2
12 Q1 179.5 177.8 16.3 10.4 5.5 0.4 12.2 5.6 5.2 0.3 1.3 0.4 0.9 4.1 1.2 Q2 192.1 190.9 16.7 11.0 5.4 0.3 11.6 5.3 5.0 0.3 1.2 0.5 0.7 3.9 1.1
20 a 22 17 18 19 20 21 22 23 24 25 26=27+28 27 28 29
9. NON-MONETARY FINANCIAL INSTITUTIONS 9.50 (Cont’d) Breakdown of appraisals:C) Financial auxiliaries: Appraisals companies number of appraisalsAppraisal activity information
See notes at the end of the chapter
BE Number in thousands
Property appraisals Memorandum items:
Building or part thereof Non- Other appraisals property Economic Other appraisals Patrimonies Housing Offices Business Other activity property Total Updates Intermediate
Total premises (c) assets (e) (f) appraisals (h) (d) (g) Total Apartments Single-family houses
16=17+
02 1 059.7 949.2 ... ... 9.5 63.7 37.3 5.1 1.4 12.0 138.9 27.7 111.1 2.2 03 1 254.3 1 146.3 ... ... 7.3 68.4 32.3 5.4 0.8 10.2 159.6 34.7 124.9 1.7 04 1 458.4 1 282.3 933.4 348.9 8.5 75.5 92.1 5.3 5.3 7.3 206.4 61.3 145.1 3.1 05 1 622.7 1 424.0 1 030.1 393.9 9.6 88.9 100.1 5.6 6.3 5.7 241.9 84.1 157.8 9.0 06 1 592.0 1 400.3 1 011.8 388.5 10.0 76.5 105.3 6.0 5.3 7.1 272.3 100.2 172.1 2.3 07 1 337.8 1 153.8 813.5 340.2 10.3 68.5 105.3 6.7 1.7 8.1 300.3 100.0 200.3 2.5 08 942.6 772.0 537.4 234.6 9.6 63.5 97.5 6.6 1.3 11.6 277.6 82.6 195.0 1.5 09 897.4 715.1 508.5 206.5 9.6 57.4 115.4 6.7 1.3 19.1 190.8 76.9 113.9 1.3 10 848.3 666.3 475.1 191.3 8.6 51.8 121.6 5.8 1.1 12.7 148.7 84.8 63.8 5.9 11 649.1 490.0 348.7 141.3 7.9 49.4 101.7 5.6 1.2 13.9 1 516.9 1 470.3 46.6 2.5
09 Q1 239.1 187.6 133.9 53.7 2.2 15.8 33.5 1.8 0.4 5.6 55.5 21.1 34.4 0.6 Q2 240.4 193.3 137.2 56.1 2.4 15.5 29.1 1.8 0.4 5.9 51.7 19.2 32.5 0.3 Q3 195.1 157.8 111.2 46.5 2.0 11.6 23.8 1.4 0.2 2.4 40.8 16.3 24.5 0.3 Q4 222.9 176.4 126.2 50.1 3.0 14.5 29.0 1.7 0.3 5.2 42.7 20.3 22.4 0.2
10 Q1 215.4 168.0 119.4 48.7 1.9 14.5 30.9 1.5 0.3 3.6 36.9 19.0 17.9 2.9 Q2 236.3 187.0 133.9 53.1 2.4 13.1 33.8 1.6 0.3 3.7 34.2 17.0 17.2 0.4 Q3 168.4 132.8 93.8 39.0 2.0 10.4 23.3 1.3 0.2 2.7 29.7 15.7 14.0 2.2 Q4 228.2 178.5 128.0 50.5 2.3 13.9 33.5 1.4 0.2 2.7 47.8 33.1 14.7 0.4
11 Q1 174.4 133.2 93.9 39.3 1.8 14.2 25.1 1.4 0.3 3.0 226.4 213.6 12.9 0.7 Q2 173.3 132.8 95.0 37.8 1.9 11.9 26.6 1.4 0.3 4.6 490.3 478.0 12.3 0.6 Q3 135.6 101.4 71.6 29.8 1.8 10.6 21.7 1.4 0.3 3.6 396.4 385.5 10.9 0.4 Q4 165.8 122.6 88.2 34.4 2.3 12.6 28.3 1.4 0.4 2.7 403.7 393.3 10.5 0.8
12 Q1 146.7 107.5 76.7 30.8 1.9 11.7 25.6 1.4 1.3 1.7 56.5 47.3 9.2 1.5 Q2 159.2 115.3 83.7 31.6 2.2 11.6 30.0 1.7 1.8 1.2 601.0 592.9 8.1 2.0
BANCO DE ESPAÑA 217 BOLETÍN ESTADÍSTICO, FEBRUARY 2013

1=2+25 16+23+24 3=4 a 6 4 5 6 14+15 8=9+10 9 10 11=12+13 12 13 14 15
9. NON-MONETARY FINANCIAL INSTITUTIONS 9.51 Breakdown of appraisals:C) Financial auxiliaries: Appraisal companies amount of appraisalsAppraisal activity information
See notes at the end of the chapter
BE EUR millions Property appraisals
Total appraisals
Land Complete buildings (a) Total Residential use Tertiary use Total Urban Rural Non-buildable Total Industrial Other land property land (b) Total Primary Secondary Total Offices Commercial residence residence use 2=3+7+ 7=8+11+
02 341 222 337 289 36 262 29 678 6 583 ... 122 933 84 559 ... ... 14 157 ... ... 17 285 6 932 03 441 423 439 482 53 750 44 807 8 943 ... 148 670 98 278 ... ... 17 464 ... ... 20 239 12 689 04 567 313 560 318 86 882 72 910 7 802 6 170 176 542 125 917 111 383 14 535 14 240 9 057 5 182 21 018 15 367 05 758 438 751 861 138 958 124 345 9 954 4 659 222 772 153 084 138 164 14 920 18 300 11 683 6 617 25 484 25 904 06 857 922 849 349 166 945 146 846 13 290 6 809 272 031 192 778 176 215 16 563 18 393 11 172 7 221 29 148 31 712 07 841 752 831 442 178 473 139 698 11 283 27 492 278 352 190 003 173 543 16 460 21 494 14 322 7 172 32 758 34 097 08 695 342 684 799 207 905 170 699 12 010 25 195 199 641 110 609 101 852 8 757 27 889 18 885 9 004 29 932 31 211 09 569 853 564 495 162 611 138 105 12 722 11 783 164 509 83 145 75 424 7 721 26 757 16 806 9 951 29 161 25 446 10 449 910 444 832 109 318 89 698 8 939 10 681 128 145 66 442 60 955 5 486 19 308 12 231 7 077 19 912 22 485 11 384 656 377 258 106 255 96 310 7 439 2 506 115 595 63 123 57 058 6 065 21 429 11 702 9 727 19 219 11 824
09 Q1 163 027 161 765 48 842 43 052 4 028 1 763 49 539 25 536 23 170 2 366 7 458 4 372 3 086 8 673 7 872 Q2 157 019 156 147 46 457 36 042 3 568 6 847 44 967 22 224 19 966 2 258 7 435 4 047 3 388 8 048 7 261 Q3 115 247 114 619 31 687 26 989 2 580 2 118 31 520 15 378 13 966 1 412 5 092 3 188 1 904 5 279 5 772 Q4 134 560 131 964 35 625 32 023 2 547 1 056 38 483 20 008 18 323 1 686 6 772 5 200 1 572 7 161 4 541
10 Q1 129 910 128 768 36 886 28 638 2 739 5 508 37 075 18 843 17 077 1 766 5 814 3 568 2 246 5 915 6 503 Q2 114 897 113 255 24 624 21 802 2 289 534 31 060 16 551 15 405 1 146 3 994 2 264 1 730 4 953 5 562 Q3 83 285 82 441 19 043 16 756 1 902 385 23 833 12 676 11 723 952 3 169 1 995 1 174 3 790 4 198 Q4 121 817 120 368 28 764 22 502 2 009 4 254 36 177 18 371 16 749 1 622 6 330 4 403 1 928 5 254 6 222
11 Q1 102 731 99 865 27 349 23 900 1 968 1 481 30 572 16 676 14 861 1 815 4 928 2 258 2 669 4 920 4 049 Q2 93 914 92 770 26 616 23 953 2 123 540 26 128 14 749 13 578 1 172 4 132 2 477 1 654 4 521 2 726 Q3 82 040 80 355 20 181 18 483 1 493 205 25 993 13 634 11 964 1 670 5 353 2 742 2 611 4 750 2 256 Q4 105 971 104 267 32 110 29 974 1 856 280 32 903 18 064 16 656 1 408 7 017 4 224 2 793 5 028 2 794
12 Q1 97 171 96 684 23 099 20 888 2 065 147 28 695 15 406 13 787 1 618 5 560 3 237 2 323 4 595 3 135 Q2 83 316 82 195 18 998 16 897 1 881 219 26 536 13 001 11 894 1 108 7 266 4 972 2 294 4 458 1 811
20 a 22 17 18 19 20 21 22 23 24 25 26=27+28 27 28 29
9. NON-MONETARY FINANCIAL INSTITUTIONS 9.51 (Cont’d) Breakdown of appraisals:C) Financial auxiliaries: Appraisal companies amount of appraisalsAppraisal activity information
See notes at the end of the chapter
BE EUR millions
Property appriasals Memorandum items:
Properties Non- Other appraisals property Economic Other assets Patrimonies Housing Offices Business Other activity property Total Updates Intermediate (h)
Total premises (c) assets (e) (f) appraisals (d) (g) Total Apartments Single-family houses
16=17+
02 161 333 140 737 ... ... 3 238 15 128 2 230 15 922 839 3 933 216 039 30 024 186 015 5 672 03 218 936 197 200 ... ... 3 123 16 885 1 729 17 764 362 1 941 219 338 37 249 182 088 2 418 04 278 284 248 154 160 916 87 238 3 452 20 927 5 750 15 627 2 982 6 995 357 874 71 402 286 471 4 938 05 367 270 326 597 215 432 111 165 4 252 28 704 7 717 20 941 1 921 6 578 189 341 98 173 91 169 16 812 06 383 108 343 429 221 238 122 191 4 782 25 028 9 870 25 198 2 066 8 573 218 253 143 768 74 486 10 689 07 344 696 304 405 189 501 114 904 5 739 25 382 9 170 27 552 2 368 10 310 278 250 177 808 100 441 6 206 08 245 701 204 035 122 329 81 706 5 692 26 193 9 781 29 977 1 574 10 544 323 130 180 035 143 094 15 047 09 208 534 173 380 106 626 66 754 4 673 20 682 9 799 26 940 1 901 5 358 223 159 157 942 65 217 3 114 10 183 582 152 729 94 335 58 394 4 998 17 495 8 359 22 585 1 203 5 077 171 761 137 572 34 190 13 856 11 130 709 103 412 62 636 40 775 4 172 15 949 7 176 23 089 1 609 7 398 403 749 373 705 30 045 4 724
09 Q1 56 577 47 049 29 147 17 902 1 067 5 491 2 971 6 400 407 1 262 64 631 44 793 19 838 2 433 Q2 56 788 47 087 28 677 18 410 1 100 5 875 2 726 7 133 803 872 54 970 37 242 17 728 289 Q3 44 484 37 746 23 020 14 727 1 001 3 916 1 821 6 528 399 628 45 701 31 567 14 134 109 Q4 50 684 41 498 25 783 15 715 1 505 5 400 2 281 6 880 292 2 596 57 857 44 340 13 518 283
10 Q1 47 530 39 338 24 433 14 905 1 091 4 939 2 163 7 051 226 1 142 48 221 37 132 11 089 10 894 Q2 51 418 43 389 27 064 16 326 1 498 4 238 2 293 5 769 384 1 642 40 071 31 305 8 765 198 Q3 35 186 29 476 17 905 11 571 946 3 246 1 518 4 139 240 844 35 400 28 608 6 792 2 338 Q4 49 447 40 525 24 933 15 592 1 464 5 071 2 387 5 626 353 1 450 48 069 40 526 7 543 426
11 Q1 36 405 28 954 17 417 11 537 984 4 453 2 014 4 988 552 2 866 87 156 81 987 5 169 267 Q2 34 227 27 869 16 933 10 936 897 3 754 1 706 5 530 270 1 144 121 360 105 263 16 096 209 Q3 27 255 21 101 12 690 8 411 964 3 656 1 535 6 584 343 1 684 87 294 82 547 4 747 2 932 Q4 32 823 25 488 15 597 9 891 1 327 4 087 1 921 5 988 444 1 703 107 940 103 908 4 033 1 316
12 Q1 28 547 21 735 12 906 8 829 825 3 816 2 171 5 949 10 394 487 38 244 35 035 3 209 11 927 Q2 27 511 21 535 13 125 8 410 992 3 088 1 896 5 486 3 663 1 121 106 389 103 499 2 890 9 840
BANCO DE ESPAÑA 218 BOLETÍN ESTADÍSTICO, FEBRUARY 2013

22 2=3 a 5 3 4 5 13+14 7=8+9 8 9 10=11+12 11 12 13 14
9. NON-MONETARY FINANCIAL INSTITUTIONS 9.52 Breakdown of appraisals:C) Financial auxiliaries: Appraisal companies usable areaAppraisal activity information Property appraisals
See notes at the end of the chapter
BE hectares Land Complete buildings (a)
Total Residential use Tertiary use Total Urban Rural Non- buildable land property land Total Industrial Other (b) Total Primary Secondary Total Offices Commercial residence residence use
1=2+6+15+ 6=7+10+
02 511 966 481 681 26 514 455 167 ... 13 570 7 516 ... ... 1 116 ... ... 4 080 858 03 461 941 425 193 39 590 385 603 ... 15 449 8 277 ... ... 1 416 ... ... 4 339 1 417 04 522 826 473 903 44 970 420 893 8 040 15 212 9 056 8 118 938 888 470 418 3 901 1 367 05 877 268 819 785 73 599 738 110 8 075 19 455 9 913 9 040 873 997 535 462 5 150 3 396 06 698 226 638 835 82 414 548 368 8 053 19 956 11 517 10 602 915 936 497 439 5 035 2 468 07 521 658 476 851 75 204 387 244 14 403 17 886 10 298 9 502 796 984 549 435 4 330 2 275 08 544 125 503 480 92 361 374 734 36 385 13 721 6 328 5 808 520 1 261 671 590 4 135 1 997 09 612 020 573 923 86 954 471 189 15 780 12 666 4 847 4 392 456 1 401 652 750 4 513 1 905 10 522 024 491 634 64 411 415 088 12 136 10 441 4 220 3 872 348 1 101 550 551 3 331 1 789 11 446 291 422 076 74 367 336 749 10 960 10 240 4 155 3 748 408 1 244 558 686 3 541 1 300
09 Q1 170 089 161 392 23 917 134 445 3 030 3 549 1 375 1 251 123 438 186 252 1 288 448 Q2 150 439 140 052 22 946 109 005 8 101 3 504 1 247 1 111 136 409 156 253 1 276 573 Q3 163 179 153 616 19 739 131 598 2 279 2 587 1 032 931 101 267 121 147 807 481 Q4 128 314 118 863 20 353 96 140 2 370 3 026 1 193 1 098 95 288 189 98 1 142 403
10 Q1 151 430 143 775 22 187 113 944 7 644 2 975 1 225 1 093 132 387 181 206 968 394 Q2 111 285 101 721 15 747 85 140 835 2 696 1 018 944 74 196 90 106 832 650 Q3 144 855 139 601 10 296 127 845 1 459 1 967 801 746 54 178 79 99 608 380 Q4 114 453 106 538 16 182 88 159 2 198 2 804 1 176 1 089 88 340 201 139 923 364
11 Q1 123 646 117 083 16 004 94 568 6 511 2 718 1 072 961 111 294 117 178 833 519 Q2 114 863 108 991 19 374 86 810 2 806 2 479 1 022 928 94 246 110 136 897 313 Q3 86 525 80 891 15 929 64 173 788 2 282 896 792 104 314 143 170 882 191 Q4 121 257 115 111 23 060 91 197 855 2 761 1 166 1 067 99 389 188 202 929 277
12 Q1 118 813 112 253 17 459 93 015 1 779 2 570 1 077 960 116 340 154 186 849 305 Q2 117 582 111 253 13 991 95 558 1 704 2 391 938 854 84 353 205 148 952 147
19 a 21 16=17+18 17 18 19 20 21 22
9. NON-MONETARY FINANCIAL INSTITUTIONS 9.52 (Cont’d) Breakdown of appraisals:C) Financial auxiliaries: Appraisal companies usable areaAppraisal activity information Property appraisals
See notes at the end of the chapter
BE hectares
Properties Economic activity Housing Offices Business Other (c)
Total premises Total Apartments Single-family houses
15=16+
02 13 840 12 092 ... ... 199 1 194 355 2 679 03 16 832 15 134 ... ... 188 1 245 264 4 366 04 18 179 15 581 8 888 6 693 180 1 334 1 083 15 533 05 22 418 17 472 9 859 7 612 185 1 609 3 152 15 610 06 19 995 17 098 9 603 7 495 196 1 282 1 419 19 440 07 16 881 14 291 7 707 6 585 188 1 109 1 293 10 040 08 12 968 10 194 5 288 4 906 199 1 190 1 385 13 955 09 12 587 9 573 5 200 4 373 168 1 074 1 772 12 845 10 11 156 8 711 4 739 3 972 192 959 1 294 8 793 11 8 849 6 481 3 511 2 970 172 937 1 259 5 126
09 Q1 3 166 2 436 1 318 1 118 38 280 412 1 983 Q2 3 351 2 546 1 364 1 182 40 301 464 3 531 Q3 2 780 2 207 1 171 1 035 36 215 322 4 197 Q4 3 290 2 384 1 346 1 038 54 278 574 3 134
10 Q1 2 866 2 211 1 188 1 024 42 258 354 1 816 Q2 3 099 2 481 1 375 1 107 53 236 329 3 769 Q3 2 172 1 707 921 787 38 183 244 1 116 Q4 3 019 2 311 1 256 1 055 59 282 367 2 093
11 Q1 2 384 1 764 941 823 40 261 319 1 461 Q2 2 305 1 759 954 806 39 223 284 1 089 Q3 1 854 1 338 725 614 40 208 267 1 499 Q4 2 307 1 619 892 727 53 246 389 1 077
12 Q1 2 106 1 444 775 669 38 261 363 1 884 Q2 2 208 1 551 846 705 49 254 354 1 730
BANCO DE ESPAÑA 219 BOLETÍN ESTADÍSTICO, FEBRUARY 2013

1 2 3 4 5 6 7 8 9 10 11 12 13 14 15 16
9. NON-MONETARY FINANCIAL INSTITUTIONS 9.53 Breakdown of property appraisals:C) Financial auxiliaries: Appraisal companies average value of m2 (a)Appraisal activity information
BE EUR Buildings Properties
Urban Rural land property Residential use Tertiary use Housing Industrial Total Offices Business Total premises Total Primary Secondary Total Offices Commercial Total Apartments Single-family residence residence use houses
02 112 1 906 1 125 ... ... 1 268 ... ... 424 1 166 1 164 ... ... 1 625 1 267 03 113 2 962 1 187 ... ... 1 233 ... ... 466 1 301 1 303 ... ... 1 661 1 356 04 162 2 1 161 1 390 1 372 1 550 1 603 1 925 1 241 539 1 531 1 593 1 810 1 303 1 918 1 568 05 169 1 1 145 1 544 1 528 1 710 1 836 2 185 1 432 495 1 638 1 869 2 185 1 460 2 296 1 784 06 178 2 1 363 1 674 1 662 1 810 1 966 2 250 1 645 579 1 916 2 009 2 304 1 630 2 438 1 952 07 186 3 1 556 1 845 1 826 2 067 2 185 2 609 1 650 757 2 042 2 130 2 459 1 745 3 049 2 289 08 185 3 1 455 1 748 1 754 1 685 2 212 2 814 1 527 724 1 895 2 002 2 313 1 665 2 859 2 202 09 159 3 1 299 1 715 1 717 1 695 1 909 2 579 1 327 646 1 657 1 811 2 050 1 527 2 784 1 926 10 139 2 1 227 1 574 1 574 1 576 1 754 2 223 1 285 598 1 646 1 753 1 991 1 470 2 609 1 823 11 130 2 1 129 1 519 1 522 1 487 1 723 2 099 1 418 543 1 477 1 596 1 784 1 373 2 429 1 702
See notes at the end of the chapter
09 Q1 180 3 1 396 1 858 1 851 1 920 1 703 2 350 1 225 673 1 787 1 931 2 211 1 601 2 819 1 962 Q2 157 3 1 283 1 782 1 797 1 663 1 819 2 598 1 340 631 1 694 1 849 2 102 1 558 2 732 1 952 Q3 137 2 1 218 1 489 1 500 1 394 1 905 2 643 1 299 654 1 600 1 711 1 965 1 423 2 804 1 823 Q4 157 3 1 272 1 677 1 669 1 769 2 355 2 746 1 602 627 1 540 1 741 1 915 1 514 2 786 1 941
10 Q1 129 2 1 246 1 538 1 562 1 343 1 502 1 972 1 090 611 1 659 1 779 2 057 1 456 2 616 1 913 Q2 138 3 1 152 1 626 1 632 1 541 2 037 2 527 1 625 596 1 659 1 749 1 969 1 475 2 842 1 797 Q3 163 1 1 212 1 583 1 571 1 748 1 782 2 530 1 186 623 1 620 1 727 1 945 1 471 2 503 1 770 Q4 139 2 1 290 1 562 1 538 1 847 1 861 2 192 1 384 569 1 638 1 754 1 985 1 478 2 464 1 798
11 Q1 149 2 1 125 1 556 1 547 1 633 1 673 1 937 1 501 591 1 527 1 641 1 851 1 402 2 467 1 707 Q2 124 2 1 054 1 443 1 463 1 242 1 678 2 252 1 214 504 1 485 1 584 1 776 1 358 2 328 1 685 Q3 116 2 1 139 1 522 1 510 1 612 1 707 1 914 1 532 538 1 470 1 576 1 751 1 370 2 388 1 758 Q4 130 2 1 192 1 549 1 561 1 427 1 802 2 250 1 385 541 1 423 1 574 1 749 1 360 2 506 1 664
12 Q1 120 2 1 116 1 431 1 435 1 392 1 635 2 106 1 247 541 1 356 1 505 1 666 1 319 2 194 1 460 Q2 121 2 1 110 1 386 1 392 1 321 2 059 2 424 1 552 468 1 246 1 388 1 551 1 193 2 013 1 218
1=2 a 5 2 3 4 5 6=7 a 10 7 8 9 10
9. NON-MONETARY FINANCIAL INSTITUTIONS 9.54 Breakdown of customers and appraisal purposeC) Financial auxiliaries: Appraisal companies number of appraisalsAppraisal activity information
BE Number in thousands
By customer By purpose of property appraisal Deposit Other Individuals Other Total For Required Required Other
Total institutions financial mortgage by by other institutions credit institutions financial institutions
02 1 191.5 1 013.1 40.6 74.0 63.9 1 179.6 1 099.2 4.4 1.6 74.3 03 1 399.3 1 240.9 42.5 49.2 66.6 1 389.0 1 309.0 3.4 1.6 75.0 04 1 618.0 1 409.2 57.1 61.5 90.2 1 610.8 1 525.6 3.0 1.4 80.8 05 1 803.8 1 554.7 73.5 74.7 100.8 1 798.1 1 703.2 13.4 2.1 79.4 06 1 786.1 1 534.9 65.7 82.2 103.3 1 779.0 1 696.9 1.8 3.1 77.3 07 1 518.9 1 297.3 55.3 78.7 87.7 1 510.8 1 417.5 2.0 6.3 85.0 08 1 104.6 914.2 52.1 49.7 88.7 1 093.0 948.8 8.1 23.8 112.3 09 1 062.9 861.2 61.3 38.5 101.9 1 043.8 830.8 12.7 40.5 159.8 10 976.8 796.3 41.3 36.8 102.4 964.1 741.3 8.5 23.7 190.6 11 774.0 581.6 42.8 34.5 115.1 760.0 482.3 22.1 26.0 229.7
08 H2 481.0 390.8 22.8 21.2 46.2 475.6 395.5 6.5 11.2 62.4
09 H1 574.6 462.4 40.3 19.2 52.7 563.1 448.4 6.6 27.7 80.3 H2 488.3 398.8 21.1 19.3 49.2 480.7 382.3 6.1 12.8 79.5
10 H1 520.1 425.9 21.5 20.6 52.1 512.8 402.8 3.9 13.4 92.7 H2 456.7 370.4 19.7 16.2 50.3 451.3 338.5 4.6 10.3 97.9
11 H1 412.2 308.9 22.9 20.9 59.5 404.5 262.1 9.9 13.5 119.0 H2 361.8 272.6 19.9 13.7 55.6 355.5 220.2 12.2 12.5 110.6
12 H1 371.6 276.2 17.2 14.4 63.9 368.7 221.8 17.0 12.9 117.1
BANCO DE ESPAÑA 220 BOLETÍN ESTADÍSTICO, FEBRUARY 2013

1=2 a 5 2 3 4 5 6=7 a 10 7 8 9 10
9. NON-MONETARY FINANCIAL INSTITUTIONS 9.55 Breakdown of customers and appraisal purpose:C) Financial auxiliaries: Appraisal companies amount of appraisalsAppraisal activity information
BE EUR millions
By customer By purpose of property appraisal Deposit Other Individuals Other Total For Required Required Other
Total institutions financial mortgage by by other institutions credit institutions financial institutions
02 341 222 266 313 8 780 27 472 38 657 337 289 289 065 774 3 723 43 727 03 441 423 357 944 10 809 27 454 45 217 439 482 383 959 579 5 000 49 944 04 567 313 448 764 12 650 20 832 85 067 560 318 497 683 459 3 971 58 204 05 758 438 570 432 16 826 25 389 145 792 751 861 646 111 10 993 4 176 90 581 06 857 922 646 122 21 283 34 620 155 896 849 349 742 591 1 007 9 000 96 750 07 841 752 608 850 23 174 55 827 153 900 831 442 692 936 1 881 9 369 127 256 08 695 342 442 012 23 750 47 942 181 637 684 799 504 332 3 948 14 442 162 077 09 569 853 359 339 21 640 28 784 160 090 564 495 394 462 5 095 16 942 147 996 10 449 910 285 009 16 643 26 761 121 497 444 832 282 768 6 873 11 733 143 459 11 384 656 230 224 11 685 21 392 121 354 377 258 199 566 17 109 9 298 151 285
08 H2 337 926 198 924 12 501 20 541 105 961 336 156 228 796 3 024 7 739 96 597
09 H1 320 046 200 010 13 359 17 893 88 784 317 912 226 655 2 307 10 709 78 241 H2 249 807 159 328 8 281 10 891 71 307 246 583 167 806 2 788 6 233 69 755
10 H1 244 807 156 325 8 585 14 975 64 922 242 024 155 716 2 767 6 303 77 237 H2 205 102 128 684 8 057 11 787 56 575 202 809 127 051 4 106 5 430 66 222
11 H1 196 645 118 667 6 346 10 205 61 427 192 635 110 603 5 281 3 991 72 761 H2 188 010 111 558 5 338 11 188 59 927 184 623 88 963 11 828 5 307 78 524
12 H1 180 487 96 691 4 489 6 359 72 949 178 879 89 938 7 265 3 765 77 911
1=2+3 2=4 a 7 3 4 5 6 7 8=9+10 9=11 a 14 10 11 12 13 14
9. NON-MONETARY FINANCIAL INSTITUTIONS 9.56 Geographic distribution of theC) Financial auxiliaries: Appraisal companies property appraisals: number of appraisals and amountApprisal activity information
See notes at the end of the chapter
BE EUR millions and number in thousands
Number of appraisals Amount of appraisals For spanish municipalities For spanish municipalities
Total Spain Abroad Total Spain Abroad (a) (b) Madrid and > 500000 100000 Rest Madrid and > 500000 between 100000 Rest Barcelona inhabitants to 500000 Barcelona inhabitants to 500000 inhabitants inhabitants
02 1 179.6 1 176.2 3.4 - - - - 337 289 336 680 608 - - - - 03 1 389.0 1 387.3 1.8 - - - - 439 482 438 693 789 - - - - 04 1 610.8 1 609.0 1.8 149.8 97.2 386.4 975.6 560 318 559 275 1 042 77 070 28 101 125 841 328 264 05 1 798.1 1 796.6 1.5 147.1 125.3 423.4 1 100.8 751 861 750 347 1 514 97 723 46 599 161 650 444 374 06 1 779.0 1 777.7 1.4 141.7 118.4 412.9 1 104.6 849 349 846 413 2 936 97 569 54 828 180 784 513 231 07 1 510.8 1 509.4 1.4 121.6 98.6 360.4 928.9 831 442 822 293 9 149 106 305 51 743 185 019 479 226 08 1 093.0 1 091.5 1.5 92.7 52.9 250.4 695.5 684 799 676 480 8 319 115 413 38 539 151 020 371 508 09 1 043.8 1 042.5 1.3 95.3 54.3 247.1 645.9 564 495 558 201 6 294 83 890 36 736 130 856 306 718 10 964.1 963.1 1.0 90.7 51.5 236.0 584.9 444 832 439 813 5 020 72 016 25 602 102 333 239 862 11 760.0 759.2 0.8 65.2 36.8 180.7 476.4 377 258 372 446 4 812 52 894 21 587 84 305 213 660
08 H2 475.6 474.8 0.8 39.8 22.1 109.2 303.7 336 156 331 241 4 915 58 874 20 323 76 242 175 802
09 H1 563.1 562.3 0.8 53.2 28.7 133.2 347.2 317 912 316 046 1 866 47 846 21 688 74 076 172 436 H2 480.7 480.2 0.5 42.1 25.6 113.8 298.7 246 583 242 155 4 428 36 044 15 048 56 781 134 282
10 H1 512.8 512.3 0.5 48.9 26.9 124.7 311.9 242 024 239 060 2 963 38 862 12 984 56 965 130 249 H2 451.3 450.8 0.5 41.9 24.6 111.3 273.0 202 809 200 753 2 056 33 154 12 618 45 368 109 612
11 H1 404.5 404.0 0.5 35.7 19.5 99.8 249.0 192 635 190 079 2 556 23 785 11 443 45 659 109 191 H2 355.5 355.2 0.3 29.5 17.3 81.0 227.4 184 623 182 367 2 256 29 109 10 144 38 646 104 469
12 H1 368.7 368.3 0.4 31.6 16.8 87.3 232.6 178 879 174 983 3 896 28 974 10 633 40 115 95 260
BANCO DE ESPAÑA 221 BOLETÍN ESTADÍSTICO, FEBRUARY 2013

1=2+3 2=4 a 7 3 4 5 6 7 8=9+10 9=11 a 14 10 11 12 13 14
9. NON-MONETARY FINANCIAL INSTITUTIONS 9.57 Geographic breakdown of housing appraisals:C) Financial auxiliaries:Appraisal companies number of appraisals and amountAppraisal activity information
See notes at the end of the chapter
BE EUR millions and number in thousands
Number of appraisals Amount of appraisals For spanish municipalities For spanish municipalities
Total Spain Abroad Total Spain Abroad (a) (b) Madrid and > 500000 100000 to Rest Madrid and > 500000 100000 Rest Barcelona inhabitants 500000 Barcelona inhabitants to 500000 inhabitants inhabitants
08 772.0 771.1 0.9 66.3 39.5 175.0 490.3 204 035 203 521 514 25 439 10 269 45 064 122 748 09 715.1 714.5 0.6 67.1 39.8 169.4 438.1 173 380 173 016 365 23 769 9 258 40 366 99 622 10 666.3 665.9 0.4 66.7 37.8 164.3 397.2 152 729 152 426 303 22 100 8 258 36 695 85 373 11 490.0 489.8 0.2 44.3 25.0 119.3 301.1 103 412 103 162 250 14 156 5 036 24 232 59 737
08 H2 320.0 319.5 0.5 27.6 15.6 72.6 203.7 82 895 82 525 370 10 504 3 969 18 434 49 618
09 H1 380.9 380.6 0.3 36.0 20.8 90.0 233.9 94 136 94 042 93 13 041 4 879 21 809 54 314 H2 334.2 333.9 0.2 31.2 19.0 79.5 204.3 79 245 78 973 271 10 728 4 380 18 558 45 308
10 H1 355.0 354.8 0.2 35.6 19.9 86.5 212.8 82 727 82 470 257 12 086 4 442 19 688 46 254 H2 311.3 311.1 0.2 31.1 17.8 77.7 184.4 70 002 69 956 46 10 014 3 816 17 007 39 119
11 H1 266.0 265.9 0.1 24.8 13.7 66.8 160.6 56 823 56 592 231 7 844 2 787 13 604 32 357 H2 224.0 223.9 0.1 19.5 11.3 52.5 140.6 46 589 46 570 19 6 312 2 249 10 628 27 381
12 H1 222.8 222.8 0.1 20.5 10.8 53.4 138.1 43 270 43 213 57 6 008 2 030 10 212 24 963
1 2 3 4 5 6 7 8 9 10 11 12 13 14 15 16 17
9. NON-MONETARY FINANCIAL INSTITUTIONS 9.58 Geographic breakdown of property appraisals byC) Financial auxiliaries: Appraisal companies Regional (Autonomous) Government:Appraisal activity information number in thousands (a)
See notes at the end of the chapter
BE Number in thousands
Andalucía Aragón Asturias Baleares Canarias Cantabria Castilla- Castilla Cataluña Extremadura Galicia La Rioja Madrid Murcia Navarra Pais Valencia (b) La Mancha y León Vasco
02 198.8 26.4 20.5 36.1 48.9 15.8 38.5 49.0 243.2 17.9 42.2 6.4 175.2 38.4 14.0 48.7 156.1 03 249.8 29.9 23.3 40.2 61.2 17.6 50.0 55.9 279.3 20.7 49.3 8.8 199.4 48.8 15.9 53.5 183.8 04 301.5 35.7 27.2 45.1 74.7 19.1 59.4 65.3 312.2 24.4 59.6 9.0 212.8 58.7 19.7 58.7 225.6 05 345.5 39.9 30.5 50.8 85.3 21.6 71.0 70.4 350.3 26.9 66.1 10.3 220.7 66.7 19.9 58.9 261.8 06 339.0 41.5 30.7 51.3 89.5 20.1 77.2 70.5 335.1 27.8 65.9 11.0 214.3 67.1 21.8 54.1 260.8 07 294.4 35.7 28.4 43.8 76.8 17.0 72.4 65.1 253.9 24.5 61.2 9.4 182.3 57.6 18.8 49.7 218.4 08 209.9 26.7 20.1 30.4 51.9 12.8 52.0 50.7 170.9 19.4 47.7 7.7 140.1 42.4 16.8 40.6 151.5 09 194.3 26.0 17.5 28.2 44.9 12.5 45.7 47.5 156.8 18.5 46.3 8.3 149.6 41.7 17.3 40.0 147.4 10 178.6 24.1 17.5 26.4 42.3 12.2 44.7 48.1 148.8 18.1 47.0 7.0 131.5 35.1 13.6 40.8 127.4 11 142.7 19.4 11.4 22.3 34.7 8.4 36.4 35.3 117.9 12.9 32.7 5.2 100.3 28.2 11.5 33.3 106.5
08 H2 93.3 11.6 8.6 12.9 23.6 5.5 22.0 22.7 71.9 8.2 21.5 3.6 59.6 19.6 7.1 17.2 66.0
09 H1 104.4 13.9 9.2 15.5 24.1 6.5 24.5 25.3 84.3 10.1 23.6 4.0 84.0 22.2 10.2 20.7 79.8 H2 89.9 12.1 8.3 12.7 20.8 6.0 21.2 22.3 72.4 8.4 22.7 4.2 65.6 19.5 7.2 19.3 67.6
10 H1 93.3 13.0 9.3 14.3 20.8 6.6 23.8 25.2 79.8 9.6 24.1 3.7 71.3 18.4 8.6 22.8 67.7 H2 85.3 11.1 8.1 12.1 21.5 5.6 20.9 22.9 69.1 8.5 22.9 3.3 60.2 16.7 5.0 18.0 59.7
11 H1 76.4 10.5 6.2 12.4 17.1 4.5 19.6 18.2 62.8 7.3 16.5 2.8 54.0 15.2 6.5 18.0 56.0 H2 66.3 9.0 5.2 9.9 17.6 3.9 16.8 17.1 55.2 5.6 16.2 2.4 46.3 13.0 5.0 15.3 50.5
12 H1 66.4 8.9 5.3 10.6 15.2 3.4 17.9 16.7 63.4 6.2 17.4 2.6 48.8 14.6 6.0 12.9 52.1
BANCO DE ESPAÑA 222 BOLETÍN ESTADÍSTICO, FEBRUARY 2013

1 2 3 4 5 6 7 8 9 10 11 12 13 14 15 16 17
9. NON-MONETARY FINANCIAL INSTITUTIONS 9.59 Geographic breakdown of property appraisalsC) Financial auxiliaries: Appraisal companies by Regional (Autonomous) Government:Appraisal activity information amount (a)
See notes at the end of the chapter
BE EUR millions
Andalucía Aragón Asturias Baleares Canarias Canta- Castilla Castilla Cataluña Extre- Galicia La Madrid Murcia Navarra Pais Valencia (b) bria La y León madura Rioja Vasco Mancha
02 52 315 10 108 4 782 12 516 17 015 4 389 8 181 13 096 66 260 3 366 9 481 1 873 72 825 7 927 4 307 14 002 34 238 03 78 530 8 964 5 763 14 147 20 867 5 150 13 012 16 259 85 710 3 685 11 991 3 174 92 597 11 930 3 617 15 955 47 342 04 106 460 11 400 6 962 17 855 25 113 6 069 19 755 19 699 104 291 4 874 15 295 3 260 108 876 19 935 7 518 19 832 62 083 05 155 780 15 329 8 303 22 648 30 028 8 324 30 820 25 235 137 841 6 506 21 465 4 576 138 981 25 896 11 260 22 833 84 521 06 160 879 22 605 9 705 26 243 34 347 9 718 37 902 29 592 164 946 7 977 24 355 5 203 139 525 34 300 9 179 27 190 102 747 07 151 051 20 299 12 146 26 139 33 214 7 963 41 206 32 018 147 770 7 854 25 559 4 985 145 158 35 886 9 200 25 907 95 938 08 116 731 18 102 9 211 20 902 24 586 6 545 27 764 25 905 108 049 7 067 19 596 4 624 151 948 28 124 7 433 27 370 72 523 09 100 574 14 977 7 233 17 578 19 063 5 052 21 196 21 801 93 133 6 669 16 412 3 902 116 539 21 111 6 002 23 278 63 679 10 75 879 12 500 5 913 13 998 16 449 4 154 16 393 17 749 73 938 4 783 13 949 2 982 91 624 16 145 5 181 20 115 48 059 11 66 579 10 074 5 084 14 751 13 356 3 447 13 519 14 492 60 177 4 462 11 479 2 365 74 314 12 580 4 611 17 206 43 950
08 H2 57 736 9 068 4 849 9 792 10 881 2 788 12 655 13 032 49 142 3 279 9 390 2 360 79 631 15 669 3 346 13 349 34 272
09 H1 56 428 8 939 4 050 9 910 10 465 2 790 12 138 11 891 50 582 3 771 8 782 2 295 68 381 11 829 3 470 12 600 37 725 H2 44 147 6 038 3 182 7 668 8 599 2 262 9 058 9 911 42 550 2 898 7 629 1 607 48 158 9 282 2 532 10 678 25 954
10 H1 40 602 6 734 3 238 7 788 8 609 2 347 8 858 9 694 39 500 2 470 7 408 1 688 51 370 8 916 3 103 10 807 25 928 H2 35 277 5 766 2 675 6 210 7 840 1 808 7 536 8 055 34 438 2 313 6 542 1 294 40 254 7 229 2 077 9 308 22 131
11 H1 35 739 6 178 2 511 7 538 6 985 1 925 7 678 7 445 29 886 2 350 5 745 1 190 34 563 5 929 2 347 9 242 22 829 H2 30 840 3 896 2 573 7 214 6 371 1 522 5 841 7 047 30 291 2 113 5 734 1 175 39 751 6 651 2 264 7 964 21 121
12 H1 28 464 4 264 2 217 5 657 6 832 1 453 7 191 6 556 29 177 1 986 5 561 1 019 37 183 7 424 2 080 8 137 19 782
1 2 3 4 5 6 7 8 9 10 11 12 13 14 15 16 17
9. NON-MONETARY FINANCIAL INSTITUTIONS 9.60 Geographic breakdown of housing appraisals byC) Financial auxiliaries: Appraisal companies Regional (Autonomous) Government:Appraisal activity information number of appraisals (a)
See notes at the end of the chapter
BE Number in thousands
Andalucía Aragón Asturias Baleares Canarias Cantabria Castilla- Castilla Cataluña Extremadura Galicia La Rioja Madrid Murcia Navarra Pais Valencia (b) La Mancha y León Vasco
08 150.0 18.0 14.1 22.6 35.1 9.6 35.8 34.8 125.6 13.4 31.0 4.8 97.5 29.6 11.1 27.8 110.3 09 134.1 17.5 12.0 20.7 29.2 9.2 29.3 31.3 112.5 12.5 29.5 5.6 101.8 27.8 11.4 27.1 103.1 10 123.5 16.1 12.1 19.1 27.0 8.6 29.1 31.5 106.7 12.3 30.9 4.4 94.3 23.0 8.9 28.6 89.7 11 91.6 11.9 7.4 15.0 20.9 5.7 21.9 21.3 80.0 8.1 19.2 3.0 66.5 18.1 7.3 22.1 69.9
08 H2 63.8 7.4 5.7 9.1 15.1 4.0 14.0 15.0 50.1 5.4 13.3 2.1 39.4 13.0 4.5 11.4 46.2
09 H1 71.8 9.2 6.2 11.1 15.6 4.7 15.4 16.4 60.1 6.7 15.0 2.7 54.8 14.8 6.6 14.0 55.5 H2 62.3 8.2 5.8 9.6 13.6 4.5 13.8 14.9 52.3 5.7 14.5 3.0 47.1 13.0 4.8 13.1 47.6
10 H1 64.6 8.7 6.5 10.2 13.4 4.6 15.6 16.4 57.2 6.4 16.1 2.4 50.7 12.3 5.6 16.2 47.8 H2 58.9 7.4 5.6 8.9 13.6 3.9 13.5 15.1 49.5 5.9 14.8 2.1 43.5 10.7 3.3 12.4 41.9
11 H1 50.0 6.3 4.2 8.3 10.5 3.0 11.8 11.3 43.9 4.6 10.0 1.6 36.5 9.9 3.9 12.1 37.9 H2 41.6 5.5 3.2 6.7 10.4 2.7 10.1 10.1 36.2 3.5 9.2 1.4 30.0 8.2 3.4 9.9 31.9
12 H1 39.0 5.3 3.2 6.7 9.0 2.1 10.0 9.1 41.3 3.3 9.7 1.4 30.0 8.7 3.6 8.2 32.1
BANCO DE ESPAÑA 223 BOLETÍN ESTADÍSTICO, FEBRUARY 2013

1 2 3 4 5 6 7 8 9 10 11 12 13 14 15 16 17
9. NON-MONETARY FINANCIAL INSTITUTIONS 9.61 Geographic breakdown of housing appraisals byC) Financial auxiliaries: Appraisal companies Regional(Autonomous) Government:Appraisal activity information amount (a)
See notes at the end of the chapter
BE EUR millions
Andalucía Aragón Asturias Baleares Canarias Cantabria Castilla Castilla Cataluña Extre- Galicia La Rioja Madrid Murcia Navarra Pais Valencia (b) La y León madura Vasco Mancha
08 34 969 4 162 2 944 9 035 7 511 2 420 7 324 6 934 41 852 2 203 6 158 1 090 34 700 6 052 2 688 9 360 24 119 09 29 295 3 713 2 312 7 551 5 815 2 040 5 433 6 352 33 496 1 906 5 486 1 263 32 080 5 193 2 372 8 616 20 093 10 25 138 3 150 2 266 6 635 4 919 1 877 5 278 5 742 29 678 1 787 5 404 800 28 726 4 098 1 860 8 486 16 585 11 17 254 2 013 1 340 5 181 3 546 1 329 3 466 3 649 19 974 1 127 3 341 479 18 414 2 891 1 433 6 313 11 413
08 H2 14 254 1 630 1 218 3 746 3 102 1 018 2 785 2 951 16 438 945 2 595 478 14 021 2 606 1 075 3 910 9 754
09 H1 16 081 2 028 1 225 4 157 3 218 1 086 2 908 3 246 18 280 1 031 2 858 542 17 562 2 808 1 336 4 637 11 040 H2 13 214 1 685 1 087 3 393 2 596 954 2 525 3 106 15 217 875 2 628 721 14 518 2 384 1 036 3 980 9 054
10 H1 13 449 1 686 1 233 3 563 2 474 1 029 2 767 3 216 16 136 928 2 857 446 15 530 2 187 1 115 4 804 9 049 H2 11 689 1 464 1 033 3 072 2 445 848 2 510 2 526 13 542 858 2 547 353 13 196 1 910 745 3 682 7 536
11 H1 9 457 1 076 742 2 896 1 872 712 1 907 1 985 11 070 657 1 769 275 10 130 1 598 765 3 481 6 200 H2 7 797 937 598 2 285 1 674 617 1 559 1 665 8 903 469 1 572 204 8 284 1 293 668 2 832 5 212
12 H1 7 012 847 568 2 183 1 571 436 1 407 1 432 8 873 435 1 629 203 7 795 1 301 645 2 191 4 684
=8 a 10 2 3=4+6 4 5 6 7 8 9 10 11 12 13 14 15
9. NON-MONETARY FINANCIAL INSTITUTIONS 9.62 Balance sheet and supplementary informationC) Financial auxiliaries: Appraisal companiesAccount information
See notes at the end of the chapter
BE EUR thousands and number in units Assets Liabilities No. of No. of No. of appraisals No of institu- employees offices Current assets Other Net Creditors Other tions on staff Fixed items Worth items (a) of which:
Total assets= assets related liabilities Total Debtors Short term compa- financial nies investment of which: and cash from sales and rendered services
1=2+3+7
02 133 269 43 312 88 822 32 138 25 083 56 685 1 131 76 616 59 042 -2 391 65 1 220 8 070 501 276 03 172 143 48 624 116 316 36 508 28 805 79 809 7 203 92 977 74 648 4 525 67 1 393 8 627 554 286 04 207 057 55 825 137 990 41 733 33 063 96 255 13 240 106 624 97 806 2 632 61 1 817 9 389 523 306 05 251 961 64 700 175 861 46 168 39 752 129 699 11 393 132 936 115 246 3 785 58 1 786 9 958 526 293 06 276 778 76 186 189 120 54 454 45 665 134 672 11 472 145 836 128 211 2 728 56 2 016 9 888 555 334 07 254 126 85 138 158 387 47 640 38 777 110 746 10 605 147 295 104 939 1 891 57 2 071 9 737 562 350 08 233 554 70 302 154 703 47 778 40 207 106 928 8 548 139 604 91 391 2 562 56 1 809 8 917 552 318 09 224 867 70 248 147 815 43 683 37 717 104 134 6 805 138 589 82 965 3 310 54 1 760 8 407 550 298 10 187 232 65 776 116 838 39 438 36 465 77 405 4 617 98 960 82 452 5 822 55 1 660 8 162 527 288 11 172 686 68 827 99 752 38 655 35 075 61 104 4 105 100 838 67 521 4 324 55 1 577 7 767 502 276
BANCO DE ESPAÑA 224 BOLETÍN ESTADÍSTICO, FEBRUARY 2013

1 2=11+12+13 3 4 5=1-3 6 7 8 9 10 11 12 13
9. NON-MONETARY FINANCIAL INSTITUTIONS 9.63 Profit and loss accountC) Financial auxiliaries: Appraisal companiesAccount information
See notes at the end of the chapter.
BE EUR thousand Memorandum item: breakdown by purpose of
Profit and loss account property appraisal income
Ordinary income Ordinary expenses Profit(Loss) Mortgage For credit Other Operating Financial Finan- Gains or loans institutions, of which: of which: profit income cial losses on insurance property independent expen- financial Before After corporations, appraisals proffesional ses transac- tax tax pension funds services services tions and investment rendered (a) institutions
02 289 812 268 972 259 506 173 383 30 306 1 717 750 967 31 267 31 267 246 982 2 387 19 862 03 352 382 342 586 322 571 214 268 29 811 1 525 638 887 30 831 30 707 311 219 2 447 28 931 04 433 682 412 001 373 565 265 163 60 117 2 463 668 1 795 61 904 41 015 374 064 1 508 36 430 05 533 668 510 136 451 906 325 204 81 762 2 099 789 1 310 83 069 57 511 477 154 2 479 32 630 06 596 249 570 171 506 844 365 157 89 405 3 476 1 062 2 414 91 822 61 673 528 445 2 627 39 094 07 549 981 519 926 478 991 329 387 70 990 5 434 1 496 3 938 74 924 51 245 473 772 3 750 42 395 08 429 386 394 111 394 442 247 369 34 944 6 230 1 809 4 421 39 378 27 269 331 588 5 298 57 352 09 378 940 346 736 345 248 209 729 33 692 2 575 1 589 986 34 676 24 546 276 918 7 589 62 221 10 322 580 292 894 300 600 174 459 21 981 2 616 1 407 971 22 956 16 056 221 863 4 698 66 332 11 262 308 240 813 245 199 136 547 17 114 2 321 1 315 814 17 933 12 316 158 336 9 373 73 105
BANCO DE ESPAÑA 225 BOLETÍN ESTADÍSTICO, FEBRUARY 2013

BANCO DE ESPAÑA / BOLETÍN ESTADÍSTICO
NOTES TO THE TABLES OF CHAPTER 9
Overview
These tables, which are only available in the electronic edition of the Boletín Estadístico, contain information of the activity and financial statements of appraisal companies. The scope of this information is limited to the data compiled by the Banco de España in accordance with CBE 3/1998 of 27 January 1998 (amended by CBE 5/2003). The tables contain information, broken down by appraised assets, on the number of appraisals (Table 9.50), on the amount of appraisals (Table 9.51) and on the appraised usable area of properties (Table 9.52). This information has been used to obtain the series on average value of appraised square metre (Table 9.53), which should not be interpreted as a reference price per unit of area, given the heterogeneity of the appraised properties included in the various aggregates. Nor can it be considered an accurate indicator of price behaviour, since it is not based on a homogeneous sample over time of appraised properties. Tables 9.54 and 9.55 give the number and amount of appraisals by type of customer and purpose of appraisal and Tables 9.56 to 9.61 contain a geographical breakdown. Finally, information is provided on the balance sheets (Table 9.62) and profit and loss accounts of appraisal companies (Table 9.63). Notes on Tables 9.50 to 9.63
Tables 9.50, 9.51 and 9.52
a. Buildings are classified according to their main use, based on the area devoted to each use. Since 1998 buildings under construction are included only at the value of the finished building. Intermediate appraisals are included only under the related heading in memorandum items. b. Non-buildable land, excluding that relating to an economic activity permitted under current legislation and that included in rural property. See Note (c). c. Refers to any building or part thereof relating to an economic activity or business operation: hotels, residences, hospitals, industrial facilities, transport centres, community facilities, etc. d. Including urban development works, etc. Until 2003 includes non-buildable land. e. Intangible assets, companies, machinery, fixtures, other physical assets, goodwill, options and other assets. f. Includes those less than two years old, except when they must appear as new appraisals because of a significant change in the appraised asset. Until 1997, inclusive, this heading included intermediate appraisals. g. Intermediate appraisals must include the net increments in value of the certificates issued after the initial appraisal or during the construction or rehabilitation of a building. h. Irrespective of whether the various buildings or parts thereof are included under the relevant headings. Table 9.53
a. The property items whose average values are of most significance or interest have been selected. The full information available for calculating the average values is given in Tables 9.51 and 9.52. Table 9.56
a. The detail by Regional (Autonomous) Government is given in Table 9.58. b. The detail by Regional (Autonomous) Government is given in Table 9.59. Table 9.57
a. The detail by Regional (Autonomous) Government is given in Table 9.60. b. The detail by Regional (Autonomous) Government is given in Table 9.61. Table 9.58
a. The total is given in column 2 of Table 9.56. b. Includes Ceuta and Melilla. Table 9.59
a. The total is given in column 9 of Table 9.56. b. Includes Ceuta and Melilla. Table 9.60
a. The total is given in column 2 of Table 9.57. b. Includes Ceuta and Melilla. Table 9.61
a. The total is given in column 9 of Table 9.57. b. Includes Ceuta and Melilla.
BANCO DE ESPAÑA 226 BOLETÍN ESTADÍSTICO, FEBRUARY 2013

BANCO DE ESPAÑA / BOLETÍN ESTADÍSTICO
Table 9.62
a. Number of institutions sending information on their activity and financial statements. Table 9.63
a. Gains or losses on financial transactions include, in addition to financial revenue and expenses, the following income statement captions: Change in fair value of financial instruments, Exchange differences and Impairment and gains (losses) on disposal of financial instruments.
BANCO DE ESPAÑA 227 BOLETÍN ESTADÍSTICO, FEBRUARY 2013


CHAPTER 10 INSURANCE CORPORATIONS AND PENSION FUNDS

___________________________________________________________________________________________________________________________
10. INSURANCE CORPORATIONS AND PENSIONS FUNDS 10.A Reconciliation between the financial balancesheet ofthe FASE and the accounting balance sheet. Assets
End-2009 data EUR millions
Financial investment Loans Treasury Other SUB- FASE’s ADJUSTMENTS TOTAL assets TOTAL FASE
Fixed Equities Other fi- Total Hierar Valua- income nancial chy ad tion
investm. just. 1 2 3 4 5 6 7= 1 a 6 8=9+10 9 10 11=7+8
TOTAL ASSETS ACCOUNTING BALANCE SHEET (=I+II) 202 642 35 913 58 948 9 938 32 559 16 608 356 608
II. OUTSTANDING FINANCIAL ASSETS included in FASE 202 645 35 911 58 948 9 938 32 558 6 779 346 779 2 019 -8 082 10 101 348 798
AF.2. CURRENCY AND DEPOSITS . . . . . . . . . . 9 531 27 177 31 905 68 614 -3 482 -3 482 65 132
By instruments Currency . . . . . . . . . . . . . . . . . . . . . 15 15 15 Transferable deposits . . . . . . . . . . . . . . . . 10 873 10 873 1 080 1 080 11 953 Other deposits . . . . . . . . . . . . . . . . . . . 9 531 27 177 - 21 017 57 725 -4 562 -4 562 53 164
By counterpart sectors Financial institutions . . . . . . . . . . . . . . . . . 4 203 18 004 31 890 54 097 -949 -949 53 148
Monetary financial institutions. . . . . . . . . . . . . 4 203 18 004 - 31 890 54 097 -949 -949 53 148
Non-monetary financial institutions . . . . . . . . . . .
Rest of the world . . . . . . . . . . . . . . . . . . . 5 328 9 173 15 14 517 -2 533 -2 533 11 983
AF.3. SECURITIES OTHER THAN SHARES . . . . . . 193 114 653 193 767 5 475 5 475 199 242
By instruments Short-term securities . . . . . . . . . . . . . . . . 4 390 228 4 618 79 79 4 697 Long-term securities . . . . . . . . . . . . . . . . 188 724 - 425 189 149 5 397 5 397 194 546
By counterpart sectors Non-financial corporations . . . . . . . . . . . . . . 2 081 - - 2 081 77 77 2 158
Financial institutions . . . . . . . . . . . . . . . . . 38 255 38 255 701 701 38 955
Monetary financial institutions. . . . . . . . . . . . . 24 649 - 24 649 586 586 25 235
Non-monetary financial institutions . . . . . . . . . . . 13 606 13 606 115 115 13 721
General government . . . . . . . . . . . . . . . . . 42 722 653 43 375 1 600 1 600 44 975
Rest of the world . . . . . . . . . . . . . . . . . . . 110 056 - 110 056 3 097 3 097 113 153
AF.4. LOANS . . . . . . . . . . . . . . . . . . . . 2 343 1 598 3 942 745 745 4 687
By instruments Short-term loans . . . . . . . . . . . . . . . . . . 649 1 390 2 039 95 95 2 134 Long-term loans . . . . . . . . . . . . . . . . . . 1 694 208 1 902 650 650 2 552
By counterpart sectors Non-financial corporations . . . . . . . . . . . . . . 378 260 638 650 650 1 288
Financial institutions . . . . . . . . . . . . . . . . . 573 411 984 95 95 1 079
Monetary financial institutions. . . . . . . . . . . . .
Non-monetary financial institutions . . . . . . . . . . . 573 411 984 95 95 1 079
Households and non-profit institutions . . . . . . . . . . 1 392 1 392 1 392
Rest of the world . . . . . . . . . . . . . . . . . . . 927 927 927
BANCO DE ESPAÑA 230 BOLETÍN ESTADÍSTICO, FEBRUARY 2013

___________________________________________________________________________________________________________________________
10. INSURANCE CORPORATIONS AND PENSIONS FUNDS 10.A Reconciliation between the financial balance sheet ofthe FASE and the accounting balance sheet. Assets (Cont.)
End-2009 data EUR millions
Financial investment Loans Treasury Other SUB- FASE’s ADJUSTMENTS TOTAL assets TOTAL FASE
Fixed Equities Other fi- Total Hierar Valua- income nancial chy ad tion
investm. just. 1 2 3 4 5 6 7= 1 a 6 8=9+10 9 10 11=7+8
I OUTSTANDING FINANCIAL ASSETS included in FASE (continuation)
AF.5 SHARES AND OTHER EQUITY . . . . . . . . . . . . 35 911 5 890 41 801 4 625 4 625 46 426
By instruments Quoted shares . . . . . . . . . . . . . . . . . . . . . . 22 074 2 812 24 886 3 403 3 403 28 289 Unquoted shares . . . . . . . . . . . . . . . . . . . . . 5 682 724 6 405 569 569 6 974 Other equity . . . . . . . . . . . . . . . . . . . . . . . 283 36 319 28 28 348 Mutual funds shares . . . . . . . . . . . . . . . . . . . 7 184 2 230 9 413 556 556 9 970 Shares issued by investment companies . . . . . . . . . . 689 88 777 69 69 846
By counterpart sectors Non-financial corporations . . . . . . . . . . . . . . . . . 5 954 5 954 452 452 6 406
Financial institutions . . . . . . . . . . . . . . . . . . . . 13 539 2 230 15 768 3 943 3 943 19 711
Monetary financial institutions. . . . . . . . . . . . . . . . 9 739 590 10 329 -6 805 -6 805 3 524
Non-monetary financial institutions . . . . . . . . . . . . . . 3 800 1 640 5 439 10 747 10 747 16 187
Rest of the world . . . . . . . . . . . . . . . . . . . . . 16 418 3 660 20 079 231 231 20 309
AF.6 INSURANCE TECHNICAL RESERVES . . . . . . . . . 16 614 16 614 16 614
By instruments Prepay of premiums & reserves for outs. claims . . . . . . . 16 614 16 614 16 614
By counterpart sectors Financial institutions . . . . . . . . . . . . . . . . . . . . 10 770 10 770 10 770
Monetary financial institutions. . . . . . . . . . . . . . . .
Non-monetary financial institutions . . . . . . . . . . . . . . 10 770 10 770 10 770
Rest of the world . . . . . . . . . . . . . . . . . . . . . . 5 845 5 845 5 845
AF.7 OTHER ACCOUNTS RECEIVABLE . . . . . . . . . . 6 924 8 340 6 779 22 042 -5 345 -5 345 16 697
AF.71 Trade credit . . . . . . . . . . . . . . . . . . . . AF.79 Other accounts receivable excluding trade credits . . . 6 924 8 340 - 6 779 22 042 -5 345 -5 345 16 697
II. ASSETS not included in FASE . . . . . . . . . . . . . . 9 830 9 830
Fixed assets. . . . . . . . . . . . . . . . . . . . . . . . 9 830 9 830
BANCO DE ESPAÑA 231 BOLETÍN ESTADÍSTICO, FEBRUARY 2013

___________________________________________________________________________________________________________________________
10. INSURANCE CORPORATIONS AND PENSIONS FUNDS 10.B Reconciliation between the financial balance sheet ofthe FASE and the accounting balance sheet. Liabilities
End-2009 data EUR millions
Technical provisions/ Debt Capital Other SUB- FASE’s ADJUSTMENTS TOTAL Own funds and liabi- TOTAL FASE
reserves lities
Private Non pro Insuran Pen- Total Hierar Valua- insurance fit in- ce Com- sions chy ad tion corpora- surance pensa. funds just- tions entit. Consor. ments 1 2 3 4 5 6 7 8= 1 A 7 9=10+11 10 11 12=8+9
LIABILITIES ACCOUNTING BALANCE SHEET (=I+II) 179 659 28 006 6 142 85 946 21 847 31 412 3 595 356 608
II. OUTSTANDING LIABILITIES included in FASE . 179 661 28 006 6 142 85 946 21 847 31 412 3 595 356 610 -8 525 -8 525 348 085
AF.2 CURRENCY AND DEPOSITS . . . . . . . .
By instruments Transferable deposits . . . . . . . . . . . . . . Other deposits . . . . . . . . . . . . . . . . .
By counterpart sectors Financial institutions . . . . . . . . . . . . . . .
Monetary financial institutions. . . . . . . . . . .
Non-monetary financial institutions . . . . . . . . .
Rest of the world . . . . . . . . . . . . . . . . .
AF.3 SECURITIES OTHER THAN SHARES . . . . 311 311 311
By instruments Long term securities . . . . . . . . . . . . . . 311 311 311
By counterpart sectors Non-financial corporations . . . . . . . . . . . . 311 311 311
Financial institutions . . . . . . . . . . . . . . .
Monetary financial institutions. . . . . . . . . . .
Non-monetary financial institutions . . . . . . . . .
AF.4 LOANS . . . . . . . . . . . . . . . . . . 11 576 11 576 -608 -608 10 969
By instruments Short term loans . . . . . . . . . . . . . . . . 9 651 9 651 -507 -507 9 144 Long term loans . . . . . . . . . . . . . . . . 1 926 1 926 -101 -101 1 824
By counterpart sectors Non-financial corporations . . . . . . . . . . . .
Financial institutions . . . . . . . . . . . . . . . 10 123 10 123 -608 -608 9 515
Monetary financial institutions. . . . . . . . . . . 9 138 9 138 -608 -608 8 531
Non-monetary financial institutions . . . . . . . . . 984 984 984
Households and non-profit institutions . . . . . . . .
Rest of the world . . . . . . . . . . . . . . . . . 1 454 1 454 1 454
BANCO DE ESPAÑA 232 BOLETÍN ESTADÍSTICO, FEBRUARY 2013

___________________________________________________________________________________________________________________________
(1) The hierarchisation adjustments will be zero in the next update of FASE
10. INSURANCE CORPORATIONS AND PENSIONS FUNDS 10.B Reconciliation between the financial balance sheet ofthe FASE and the accounting balance sheet. Liabilities (Cont.)
End-2009 data EUR millions
Technical provisions/ Debt Capital Other SUB- FASE’s ADJUSTMENTS TOTAL Own funds and liabi- TOTAL FASE
reserves lities
Private Non pro Insuran Pen- Total Hierar Valua- insurance fit in- ce Com- sions chy ad tion corpora- surance pensa. funds just- tions entit. Consor. ments 1 2 3 4 5 6 7 8= 1 A 7 9=10+11 10 11 12=8+9
OUTSTANDING LIABILITIES included in FASE (continuation)
AF. 5 SHARES AND OTHERS EQUITY . . . . . . . . . . 31 412 31 412 31 412
By instruments Quoted shares . . . . . . . . . . . . . . . . . . . . . ... ... ... ... Unquoted shares . . . . . . . . . . . . . . . . . . . . ... ... ... ... 31 412
By counterpart sectors Non-financial corporations . . . . . . . . . . . . . . . . ... ... ... ... 5 825
Financial institutions . . . . . . . . . . . . . . . . . . . ... ... ... ... 17 044
Monetary financial institutions. . . . . . . . . . . . . . . ... ... ... ... 2 904
Non-monetary financial institutions . . . . . . . . . . . . . ... ... ... ... 14 140
Households and non-profit institutions . . . . . . . . . . . . ... ... ... ... 1 458
Rest of the world . . . . . . . . . . . . . . . . . . . . . ... ... ... ... 7 085
AF.6 INSURANCE TECHNICAL RESERVES (1) . . . . . . 179 661 28 006 6 142 85 946 299 756 -2 -2 299 754
By instruments Life insurance reserves . . . . . . . . . . . . . . . . . 129 833 129 833 129 833 Pension fund reserves held by . . . . . . . . . . . . . . 59 15 866 85 312 101 237 101 237 Prepay of premiums & reserves for outs. claims . . . . . . 49 769 12 141 6 142 634 68 686 -2 -2 68 684
By counterpart sectors Non-financial corporations . . . . . . . . . . . . . . . . 22 277 3 693 25 969 25 969
Financial institutions . . . . . . . . . . . . . . . . . . . 10 136 634 10 770 10 770
Monetary financial institutions. . . . . . . . . . . . . . .
Non-monetary financial institutions . . . . . . . . . . . . . 10 136 634 10 770 10 770
Households and non-profit institutions . . . . . . . . . . . . 144 671 28 006 2 449 85 312 260 439 -2 -2 260 437
Rest of the world . . . . . . . . . . . . . . . . . . . . . 2 578 2 578 2 578
AF.7 OTHER ACCOUNTS RECEIVABLE . . . . . . . . . 10 270 3 595 13 866 -8 226 -8 226 5 640
Trade credit . . . . . . . . . . . . . . . . . . . . . . Other accounts payable excluding trade credits . . . . . . . 10 270 3 595 13 866 -8 226 -8 226 5 640
Memorandum item
FASE’s financial assets minus liabilities . . . . . . . . . -9 831 10 543 442 10 101 713
BANCO DE ESPAÑA 233 BOLETÍN ESTADÍSTICO, FEBRUARY 2013

1=3+5+9+11 10+12 3 4 5=7+8 6 7 8 9 10 11 12
10. INSURANCE CORPORATIONS AND PENSION FUNDS 10.1 Balance sheet and technical provisions.Detailed by agents making up the sector
(1) Nationwide institutions and those whose supervision has not been transferred to the Regional Governments.
DGSFP and Regional Governments EUR millions Non-profit insurance entities
Total Private Insurance External balance insurance Compensa- pension sheet Techni- corpora- Techni- Reg.Gvt. tion Techni. funds Own cal tions cal Total DGSFP supervi- Consortium provi- Law 8/1987 funds provi- provi- supervi- sion sions sions sions Techni. sion (1) provis. 2=4+6+
96 90 933 77 206 61 568 49 898 9 699 8 075 4 535 5 164 2 135 1 840 17 531 17 393 97 107 038 91 469 71 440 58 484 11 214 9 280 5 059 6 154 2 261 1 812 22 124 21 894 98 125 314 106 417 82 761 66 096 12 587 10 930 5 227 7 361 2 477 2 038 27 489 27 353 99 148 391 127 204 98 937 80 654 14 323 12 375 5 437 8 886 2 870 2 349 32 261 31 825 00 172 602 150 489 114 893 95 597 15 378 13 460 6 081 9 297 3 352 2 811 38 979 38 621
01 191 605 170 795 127 308 108 741 16 040 14 752 5 856 10 184 3 651 3 047 44 606 44 255 02 215 809 191 207 145 013 122 901 17 080 15 769 6 191 10 889 4 106 3 270 49 610 49 267 03 238 746 209 022 158 196 131 409 18 940 17 460 6 710 12 230 4 612 3 664 56 997 56 490 04 261 641 227 399 171 893 140 687 20 767 19 346 7 113 13 654 5 193 4 135 63 787 63 231 05 290 756 251 544 186 842 152 321 23 431 20 935 8 126 15 305 5 797 4 620 74 687 73 668
06 316 768 273 439 201 416 162 526 26 238 23 793 9 075 17 163 6 453 5 133 82 660 81 988 07 332 062 286 506 208 403 167 542 28 489 25 889 9 740 18 749 7 147 5 662 88 022 87 413 08 335 523 283 951 219 078 172 251 28 660 26 551 10 306 18 354 8 032 5 831 79 753 79 318 09 356 608 299 754 230 671 179 659 31 000 28 006 11 149 19 851 8 617 6 142 86 319 85 946 10 ... ... 230 487 177 936 ... ... ... ... 8 728 6 449 87 034 86 389
11 ... ... 243 417 183 356 ... ... ... ... 8 792 6 617 85 325 84 947
8+13a15 2 3 4 5 6 7 11+12 9 10 11 12 13 14 15
10. INSURANCE CORPORATIONS AND PENSION FUNDS 10.2 Breakdown of assets and of liabilities
DGSFP and Regional Governments EUR millions
Total Assets Liabilities Assets= Liabi- lities Financial investment Loans Treasu- Other Technical provisions/ Own funds Sundry Capital Other ry assets debt and liabi- reser- lities Fixed Equi- Other Total Private Non- Insurance Pensions ves income ties financ. insuran. profit Compensa. funds invest. corpora. insur. Consortium
1=2a7= 8=9+10+
96 90 933 41 525 5 050 24 500 5 628 6 821 7 409 77 206 49 898 8 075 1 840 17 393 4 388 9 188 150 97 107 038 46 613 7 944 31 499 5 677 7 260 8 046 91 469 58 484 9 280 1 812 21 894 5 064 10 067 438 98 125 314 58 921 10 203 30 840 6 629 10 039 8 682 106 417 66 096 10 930 2 038 27 353 7 368 10 919 610 99 148 391 71 087 13 598 35 103 7 246 11 463 9 896 127 204 80 654 12 375 2 349 31 825 7 737 12 222 1 228 00 172 602 79 961 18 271 44 282 8 718 11 635 9 736 150 489 95 597 13 460 2 811 38 621 7 767 13 267 1 079
01 191 605 95 975 19 120 43 980 10 128 12 341 10 061 170 795 108 741 14 752 3 047 44 255 5 971 13 371 1 467 02 215 809 108 114 19 259 48 044 13 578 15 779 11 035 191 207 122 901 15 769 3 270 49 267 7 857 14 979 1 766 03 238 746 118 287 21 767 55 051 12 583 18 886 12 172 209 022 131 409 17 460 3 664 56 490 10 188 17 406 2 129 04 261 641 134 614 25 405 58 767 10 928 19 141 12 785 227 399 140 687 19 346 4 135 63 231 12 362 19 925 1 955 05 290 756 148 270 30 809 66 411 11 753 20 393 13 119 251 544 152 321 20 935 4 620 73 668 14 380 23 134 1 698
06 316 768 161 291 34 630 70 247 11 421 24 698 14 479 273 439 162 526 23 793 5 133 81 988 15 282 25 741 2 305 07 332 062 171 142 36 237 70 959 11 551 27 080 15 093 286 506 167 542 25 889 5 662 87 413 16 462 26 580 2 514 08 335 523 183 104 32 972 56 565 11 170 36 032 15 680 283 951 172 251 26 551 5 831 79 318 20 869 27 818 2 886 09 356 608 202 642 35 913 58 948 9 938 32 559 16 608 299 754 179 659 28 006 6 142 85 946 21 847 31 412 3 595 10 ... ... ... ... ... ... ... ... 177 936 ... 6 449 86 389 ... ... ...
11 ... ... ... ... ... ... ... ... 183 356 ... 6 617 84 947 ... ... ...
BANCO DE ESPAÑA 234 BOLETÍN ESTADÍSTICO, FEBRUARY 2013

8+11a13 2 3 4 5 6 7 8=9+10 9 10 11 12 13
10. INSURANCE CORPORATIONS AND PENSION FUNDS 10.3 PRIVATE INSURANCE CORPORATIONS (1)Breakdown of assets and of liabilities
DGSFP EUR millions
Total Assets Liabilities Assets= Liabi- lities Financial investment Loans Treasu- Other Technical provisions Sundry Capital Other ry assets debt and liabi- reserves lities Fixed Equi- Other Total Life Other income ties financ. insuran invest. ce
1=2a7=
07 208 403 111 072 11 420 56 240 9 349 7 451 12 871 167 542 126 580 40 961 14 590 23 881 2 390 08 219 078 119 609 13 577 47 097 9 157 16 342 13 295 172 251 130 065 42 186 18 464 25 563 2 799 09 230 671 130 116 16 495 44 328 8 653 17 052 14 027 179 659 138 585 41 074 19 504 28 033 3 476 10 230 487 129 143 18 416 48 123 9 068 11 548 14 191 177 936 138 067 39 869 21 883 27 830 2 838 11 243 417 134 873 16 878 57 340 9 400 10 874 14 052 183 356 143 502 39 854 28 446 29 181 2 434
(1) Annual information relating to all insurance corporations and quarterly information to a sample (see methodological note).
09 Q1 219 071 117 931 12 474 48 533 13 111 14 265 12 757 172 817 130 288 42 529 16 904 24 423 4 927 Q2 220 377 121 213 13 660 47 302 12 316 12 637 13 249 174 484 132 840 41 644 17 966 24 835 3 093 Q3 226 616 128 189 15 060 46 188 10 134 13 491 13 555 177 412 137 634 39 778 18 752 27 024 3 428 Q4 226 111 128 144 15 848 43 058 8 483 16 932 13 645 176 517 138 236 38 281 19 100 27 221 3 272
10 Q1 231 447 131 023 15 508 43 241 11 117 17 608 12 951 180 612 141 234 39 378 20 562 27 328 2 946 Q2 227 336 127 829 15 825 46 351 11 107 13 112 13 112 177 238 138 513 38 726 20 663 26 372 3 064 Q3 231 374 132 528 16 559 46 296 9 460 13 661 12 870 179 251 141 699 37 551 21 294 28 140 2 690 Q4 226 230 127 493 16 028 48 577 8 925 11 415 13 792 174 733 137 925 36 809 21 770 26 995 2 732
11 Q1 230 135 130 303 16 626 41 159 11 933 16 489 13 625 178 485 139 304 39 181 22 034 27 506 2 109 Q2 233 919 132 170 16 297 48 680 11 148 11 995 13 629 178 731 140 331 38 400 25 746 27 274 2 169 Q3 235 178 134 458 16 476 47 953 9 795 12 964 13 533 179 110 141 825 37 285 26 133 27 681 2 255 Q4 238 380 135 565 16 691 52 267 9 181 10 894 13 784 179 517 143 327 36 190 28 196 28 332 2 335
12 Q1 246 289 139 290 17 022 49 525 11 921 14 743 13 788 185 019 146 005 39 014 30 001 28 912 2 357 Q2 238 147 133 654 16 686 43 497 11 983 18 394 13 933 179 217 141 021 38 196 29 278 27 333 2 318 Q3 240 614 137 777 17 310 53 422 10 314 8 181 13 610 180 782 143 811 36 971 28 579 29 048 2 206
8+11a13 2 3 4 5 6 7 8=9+10 9 10 11 12 13
10. INSURANCE CORPORATIONS AND PENSION FUNDS 10.4 NON-PROFIT INSURANCE ENTITIESBreakdown of assets and of liabilities
DGSFP, Regional Government, CEM and BE estimations EUR millions
Total Assets Liabilities Assets= Liabi- lities Financial investment Loans Treasu- Other Technical provisions Sundry Capital Other ry assets debt and liabi- reserves lities Fixed Equi- Other Total Life Other income ties financ. insuran invest. ce
1=2a7=
94 7 657 3 193 769 1 841 316 500 1 038 6 165 5 311 854 1 094 375 24 95 8 427 4 064 690 1 723 387 539 1 023 7 102 6 075 1 027 1 019 295 11 96 9 699 4 976 814 1 682 528 479 1 219 8 075 6 585 1 490 1 036 576 12 97 11 214 5 555 1 182 2 038 537 570 1 331 9 280 7 199 2 081 1 011 742 181 98 12 587 6 998 951 1 694 1 387 205 1 353 10 930 8 085 2 845 391 851 415 99 14 323 7 801 1 132 2 500 1 164 274 1 453 12 375 8 924 3 451 300 850 798 00 15 378 8 792 1 384 2 925 1 104 231 942 13 460 9 644 3 817 880 697 340 01 16 040 9 674 1 566 2 511 1 058 240 992 14 752 10 565 4 188 278 699 311 02 17 080 11 083 1 530 2 270 999 285 913 15 769 11 109 4 660 363 694 253 03 18 940 12 092 1 765 2 818 918 299 1 048 17 460 11 836 5 625 364 894 222 04 20 767 13 721 1 751 2 988 681 358 1 267 19 346 12 795 6 551 424 962 35 05 23 431 14 196 2 945 3 631 842 362 1 454 20 935 12 599 8 336 943 1 391 162 06 26 238 16 226 3 230 3 852 767 558 1 604 23 793 15 435 8 358 1 125 1 178 143 07 28 489 17 673 3 557 4 099 823 596 1 741 25 889 15 622 10 268 1 239 1 247 114 08 28 660 17 083 3 269 2 148 444 3 897 1 818 26 551 15 144 11 407 1 189 836 85 09 31 000 18 804 4 053 1 992 423 3 761 1 968 28 006 15 866 12 141 1 194 1 680 119
BANCO DE ESPAÑA 235 BOLETÍN ESTADÍSTICO, FEBRUARY 2013

8a11 2 3 4 5 6 7 8 9 10 11
10. INSURANCE CORPORATIONS AND PENSION FUNDS 10.5 INSURANCE COMPENSATION CONSORTIUMBreakdown of assets and of liabilities
Insurance Compensation Consortium EUR millions
Total Assets Liabilities Assets= Liabi- lities Financial investment Loans Treasu- Other Technical Sundry Capital Other ry assets provisions debt and liabi- reserves lities Fixed Equi- Other income ties financial investment
1=2a7=
96 2 135 1 440 58 17 106 359 156 1 840 6 290 0 97 2 261 1 769 91 48 72 143 137 1 812 110 338 - 98 2 477 1 933 139 48 18 181 159 2 038 29 410 - 99 2 870 2 238 169 90 49 173 151 2 349 40 481 - 00 3 352 2 507 230 125 105 233 151 2 811 9 533 - 01 3 651 2 770 263 124 73 266 155 3 047 6 597 - 02 4 106 3 241 373 21 130 118 223 3 270 31 805 - 03 4 612 3 686 376 98 119 103 230 3 664 41 908 - 04 5 193 4 042 495 173 113 108 261 4 135 44 1 014 - 05 5 797 4 503 537 232 99 111 314 4 620 30 1 147 - 06 6 453 5 000 595 242 78 193 345 5 133 25 1 295 - 07 7 147 5 646 782 138 91 122 368 5 662 36 1 449 - 08 8 032 6 406 894 83 118 147 384 5 831 783 1 418 0 09 8 617 6 973 849 114 89 161 430 6 142 777 1 698 0 10 8 728 6 914 886 150 83 156 539 6 449 706 1 573 0 11 8 792 7 088 832 96 66 171 538 6 617 634 1 540 0
8+12a14 2 3 4 5 6 7 8=9a11 9 10 11 12 13 14
10. INSURANCE CORPORATIONS AND PENSION FUNDS 10.6 EXTERNAL PENSION FUNDS (Law 8/1987)Breakdown of assets and of liabilities
DGSFP EUR millions
Total Assets Liabilities Assets= Liabi- lities Financial investment Loans Treasu- Other Own funds Sundry Capital Other ry assets debt and liabi- reserves lities Fixed Equi- Other Total Employ Associa- Indivi- income ties financ. ment tes duals invest.
1=2a7=
96 17 531 8 946 1 023 3 532 1 113 2 813 104 17 393 7 717 555 9 121 132 1 4 97 22 124 10 884 2 760 4 293 1 028 3 052 108 21 894 8 906 684 12 304 226 0 4 98 27 489 13 325 4 556 6 218 653 2 634 103 27 353 10 207 824 16 322 134 0 2 99 32 261 15 378 6 130 5 798 797 4 054 105 31 825 11 991 880 18 954 433 0 2 00 38 979 17 198 8 928 5 218 778 6 740 117 38 621 16 179 874 21 568 354 0 5
01 44 606 21 448 10 044 5 346 939 6 723 106 44 255 19 130 889 24 236 350 0 0 02 49 610 22 135 9 477 6 432 1 394 10 068 105 49 267 22 106 809 26 352 320 1 23 03 56 997 23 127 11 240 8 663 1 327 12 515 125 56 490 24 020 880 31 590 357 1 150 04 63 787 26 796 13 301 9 346 1 193 13 009 142 63 231 25 651 957 36 623 427 2 128 05 74 687 31 019 16 393 11 766 1 842 13 525 142 73 668 28 839 1 073 43 755 946 2 71
06 82 660 33 649 18 681 12 093 1 453 16 673 111 81 988 30 729 1 175 50 084 659 2 12 07 88 022 36 752 20 479 10 482 1 287 18 910 113 87 413 32 018 1 219 54 176 597 2 10 08 79 753 40 006 15 231 7 237 1 450 15 646 182 79 318 29 127 983 49 209 433 1 1 09 86 319 46 748 14 516 12 515 772 11 584 184 85 946 31 784 1 061 53 102 372 1 0 10 87 034 46 096 15 586 13 270 625 11 255 203 86 389 32 900 998 52 492 644 1 0
11 85 325 48 763 15 040 12 534 435 8 361 192 84 947 32 907 859 51 182 377 1 0
BANCO DE ESPAÑA 236 BOLETÍN ESTADÍSTICO, FEBRUARY 2013

CHAPTER 11 GENERAL GOVERNMENT

P P
1 2 3=1+2 4 5=6+9+12 6=7+8 7 8 9=10+11 10 11 12 13=4-5 14
11. GENERAL GOVERNMENT 11.1 Net lending (+) or net borrowing (-), liabilitiesoutstanding and debt according to the excessivedeficit procedure (EDP). Amounts
Net lending (+) or net borrowing (-): INE and IGAE. GDP mp: INE. EUR millions
Net lending(+) or Memorandum net borrowing(-) (a) Liabilities outstanding and debt according to the EDP item:
GDP mp (d)
According Inte- According Liabilities Adjustments for liabilities not included in EDP debt and valuation Debt to the rest to the outstanding and other adjustments (c) according
Spanish rate EDP according to the National swaps to the EDP Accounts adjust- Financial Total General government´s EDP Other accounts payable Valua- (CNE) ment Accounts of debt held by general tion and
(b) the Spanish government other Economy adjust- ments Total Consolida- Consolida- Total Held by Rest tion within tion be- general each gene- tween dif- govern- ral govern- ferent ge- ment ment own neral go- sub-sectors vernment sub-sectors
00 -6 021 122 -5 899 448 416 74 383 18 355 - 18 355 36 333 10 391 25 942 19 695 374 033 629 907 01 -3 709 131 -3 578 451 213 72 967 19 187 - 19 187 32 464 10 337 22 126 21 316 378 247 680 397 02 -1 722 164 -1 558 475 223 91 788 23 999 - 23 999 37 947 10 345 27 602 29 842 383 435 729 258 03 -2 899 171 -2 728 474 607 92 575 28 120 - 28 120 38 478 11 658 26 820 25 976 382 032 783 082 04 -1 064 123 -941 499 861 110 719 36 581 - 36 581 40 448 11 333 29 115 33 690 389 142 841 294 05 11 504 7 11 511 516 698 124 201 39 978 - 39 978 48 353 12 696 35 657 35 870 392 497 909 298 06 23 346 3 23 349 509 304 118 249 39 066 - 39 066 58 452 13 237 45 215 20 731 391 055 985 547 07 20 246 9 20 255 503 906 121 599 42 720 - 42 720 67 817 13 867 53 950 11 062 382 307 1 053 161 08 -48 870 -27 -48 897 588 236 151 252 51 679 - 51 679 74 082 14 574 59 508 25 490 436 984 1 087 788 09 -117 098 -45 -117 143 739 914 174 832 63 274 - 63 274 79 397 13 853 65 545 32 161 565 082 1 048 060 10 -101 469 31 -101 438 811 050 166 358 78 338 - 78 338 92 868 22 568 70 301 -4 848 644 692 1 048 883 11 -100 440 38 -100 402 942 115 205 647 79 781 - 79 781 124 040 43 622 80 418 1 825 736 468 1 063 355
P
P P P P
P P A
See notes at the end of the chapter.
10 Q4 -34 824 -74 -34 898 811 050 166 358 78 338 - 78 338 92 868 22 568 70 301 -4 848 644 692 1 048 883
11 Q1 -15 777 42 -15 735 854 481 168 804 81 577 4 145 77 432 86 834 21 491 65 343 393 685 677 1 052 763 Q2 -27 344 42 -27 302 874 229 168 703 82 481 2 750 79 731 91 122 20 926 70 196 -4 899 705 526 1 058 036 Q3 -18 062 36 -18 026 889 273 180 696 81 715 835 80 880 96 665 21 310 75 355 2 316 708 577 1 062 368 Q4 -39 257 -82 -39 339 942 115 205 647 79 781 - 79 781 124 040 43 622 80 418 1 825 736 468 1 063 355
12 Q1 -13 991 11 -13 980 986 348 211 421 84 128 3 267 80 861 126 118 41 208 84 910 1 175 774 926 1 061 985 Q2 -31 176 7 -31 169 979 955 175 341 108 658 2 601 106 056 104 806 41 589 63 217 -38 124 804 615 1 058 105 Q3 -20 169 7 -20 162 1 015 507 198 343 110 430 3 618 106 811 105 625 40 034 65 591 -17 712 817 164 1 055 491
P P
1 2 3=1+2 4 5=6+9+12 6=7+8 7 8 9=10+11 10 11 12 13=4-5 14
11. GENERAL GOVERNMENT 11.2 Net lending (+) or net borrowing (-), liabilitiesoutstanding and debt according to the excessivedeficit procedure (EDP). As a percentage of GDP mp
Net lending (+) or net borrowing (-): INE and IGAE. GDP mp: INE. Percentages
Net lending(+) or Memorandum net borrowing(-) (a) Liabilities outstanding and debt according to the EDP item:
GDP mp (d) (EUR
According Inte- According Liabilities Adjustments for liabilities not included in EDP debt and valuation Debt millions) to the rest to the outstanding and other adjustments (c) according
Spanish rate EDP according to the National swaps to the EDP Accounts adjust- Financial Total General government´s EDP Other accounts payable Valua- (CNE) ment Accounts of debt held by general tion and
(b) the Spanish government other Economy adjust- ments Total Consolida- Consolida- Total Held by Rest tion within tion be- general each gene- tween dif- govern- ral govern- ferent ge- ment ment own neral go- sub-sectors vernment sub-sectors
00 -1.0 0.0 -0.9 71.2 11.8 2.9 - 2.9 5.8 1.6 4.1 3.1 59.4 629 907 01 -0.5 0.0 -0.5 66.3 10.7 2.8 - 2.8 4.8 1.5 3.3 3.1 55.6 680 397 02 -0.2 0.0 -0.2 65.2 12.6 3.3 - 3.3 5.2 1.4 3.8 4.1 52.6 729 258 03 -0.4 0.0 -0.3 60.6 11.8 3.6 - 3.6 4.9 1.5 3.4 3.3 48.8 783 082 04 -0.1 0.0 -0.1 59.4 13.2 4.3 - 4.3 4.8 1.3 3.5 4.0 46.3 841 294 05 1.3 0.0 1.3 56.8 13.7 4.4 - 4.4 5.3 1.4 3.9 3.9 43.2 909 298 06 2.4 0.0 2.4 51.7 12.0 4.0 - 4.0 5.9 1.3 4.6 2.1 39.7 985 547 07 1.9 0.0 1.9 47.8 11.5 4.1 - 4.1 6.4 1.3 5.1 1.1 36.3 1 053 161 08 -4.5 -0.0 -4.5 54.1 13.9 4.8 - 4.8 6.8 1.3 5.5 2.3 40.2 1 087 788 09 -11.2 -0.0 -11.2 70.6 16.7 6.0 - 6.0 7.6 1.3 6.3 3.1 53.9 1 048 060 10 -9.7 0.0 -9.7 77.3 15.9 7.5 - 7.5 8.9 2.2 6.7 -0.5 61.5 1 048 883 11 -9.4 0.0 -9.4 88.6 19.3 7.5 - 7.5 11.7 4.1 7.6 0.2 69.3 1 063 355
P
P P P P
P P A
See notes at the end of the chapter.
10 Q4 ... ... ... 77.3 15.9 7.5 - 7.5 8.9 2.2 6.7 -0.5 61.5 1 048 883
11 Q1 ... ... ... 81.2 16.0 7.7 0.4 7.4 8.2 2.0 6.2 0.0 65.1 1 052 763 Q2 ... ... ... 82.6 15.9 7.8 0.3 7.5 8.6 2.0 6.6 -0.5 66.7 1 058 036 Q3 ... ... ... 83.7 17.0 7.7 0.1 7.6 9.1 2.0 7.1 0.2 66.7 1 062 368 Q4 ... ... ... 88.6 19.3 7.5 - 7.5 11.7 4.1 7.6 0.2 69.3 1 063 355
12 Q1 ... ... ... 92.9 19.9 7.9 0.3 7.6 11.9 3.9 8.0 0.1 73.0 1 061 985 Q2 ... ... ... 92.6 16.6 10.3 0.2 10.0 9.7 3.9 6.0 -3.6 76.0 1 058 105 Q3 ... ... ... 96.2 18.8 10.5 0.3 10.1 10.0 3.8 6.2 -1.7 77.4 1 055 491
BANCO DE ESPAÑA 238 BOLETÍN ESTADÍSTICO, FEBRUARY 2013

P P
1= 2a5 2 3 4 5 6=7a10 7 8 9 10 11=12a15= 12=2+7 13=3+8 14=4+9 15=5+10 16
11. GENERAL GOVERNMENT 11.3 Net lending(+) or net borrowing(-) (a).Amounts
Net lending (+) or net borrowing(-): INE and IGAE. GDP mp: INE. EUR millions
Net lending(+) or net borrowing(-) according Net lending(+) or net borrowing(-) according Memoran- to the Spanish National Accounts (CNE) Interest rate swaps adjustment (b) to the excessive deficit procedure (EDP) dum item: GDP mp (d)
Total Central Regional Local Social Total Central Regional Local Social Total Central Regional Local Social - govern- (autono- govern- security govern- (autono- govern- security govern- (autono- govern- security ment mous) ments funds ment mous) ments funds ment mous) ment funds govern- govern- govern- ments ments ments =1+6
00 -6 021 -6 425 -3 211 584 3 031 122 112 10 - - -5 899 -6 313 -3 201 584 3 031 629 907 01 -3 709 -4 668 -4 346 -256 5 561 131 106 25 - - -3 578 -4 562 -4 321 -256 5 561 680 397 02 -1 722 -3 124 -3 570 -860 5 832 164 129 35 - - -1 558 -2 995 -3 535 -860 5 832 729 258 03 -2 899 -5 227 -3 829 -1 903 8 060 171 109 59 3 - -2 728 -5 118 -3 770 -1 900 8 060 783 082 04 -1 064 -8 977 -687 112 8 488 123 82 38 3 - -941 -8 895 -649 115 8 488 841 294 05 11 504 4 688 -2 604 -548 9 968 7 31 -27 3 - 11 511 4 719 -2 631 -545 9 968 909 298 06 23 346 9 818 -361 765 13 124 3 22 -21 2 - 23 349 9 840 -382 767 13 124 985 547 07 20 246 12 141 -2 343 -3 233 13 681 9 6 -3 6 - 20 255 12 147 -2 346 -3 227 13 681 1 053 161 08 -48 870 -32 909 -18 212 -5 335 7 586 -27 -43 9 7 - -48 897 -32 952 -18 203 -5 328 7 586 1 087 788 09 -117 098 -97 991 -21 343 -5 860 8 096 -45 60 -104 -1 - -117 143 -97 931 -21 447 -5 861 8 096 1 048 060 10 -101 469 -52 896 -39 603 -7 036 -1 934 31 156 -105 -20 - -101 438 -52 740 -39 708 -7 056 -1 934 1 048 883 11 -100 440 -36 619 -54 057 -8 991 -773 38 92 -91 37 - -100 402 -36 527 -54 148 -8 954 -773 1 063 355
P
P P P P
P P A
See notes at the end of the chapter.
10 Q4 -34 824 ... ... ... ... -74 ... ... ... ... -34 898 ... ... ... ... 274 045
11 Q1 -15 777 ... ... ... ... 42 ... ... ... ... -15 735 ... ... ... ... 259 907 Q2 -27 344 ... ... ... ... 42 ... ... ... ... -27 302 ... ... ... ... 273 049 Q3 -18 062 ... ... ... ... 36 ... ... ... ... -18 026 ... ... ... ... 255 367 Q4 -39 257 ... ... ... ... -82 ... ... ... ... -39 339 ... ... ... ... 275 032
12 Q1 -13 991 ... ... ... ... 11 ... ... ... ... -13 980 ... ... ... ... 258 537 Q2 -31 176 ... ... ... ... 7 ... ... ... ... -31 169 ... ... ... ... 269 169 Q3 -20 169 ... ... ... ... 7 ... ... ... ... -20 162 ... ... ... ... 252 753
P P
1= 2a5 2 3 4 5 6=7a10 7 8 9 10 11=12a15= 12=2+7 13=3+8 14=4+9 15=5+10 16
11. GENERAL GOVERNMENT 11.4 Net lending(+) or net borrowing(-) (a).As a percentage of GDP mp
Net lending (+) or net borrowing(-): INE and IGAE. GDP mp: INE. Percentages
Net lending(+) or net borrowing(-) according Net lending(+) or net borrowing(-) according Memoran- to the Spanish National Accounts (CNE) Interest rate swaps adjustment (b) to the excessive deficit procedure (EDP) dum item: GDP mp (d) (EUR
Total Central Regional Local Social Total Central Regional Local Social Total Central Regional Local Social - millions) govern- (autono- govern- security govern- (autono- govern- security govern- (autono- govern- security ment mous) ments funds ment mous) ments funds ment mous) ment funds govern- govern- govern- ments ments ments =1+6
00 -1.0 -1.0 -0.5 0.1 0.5 0.0 0.0 0.0 - - -0.9 -1.0 -0.5 0.1 0.5 629 907 01 -0.5 -0.7 -0.6 -0.0 0.8 0.0 0.0 0.0 - - -0.5 -0.7 -0.6 -0.0 0.8 680 397 02 -0.2 -0.4 -0.5 -0.1 0.8 0.0 0.0 0.0 - - -0.2 -0.4 -0.5 -0.1 0.8 729 258 03 -0.4 -0.7 -0.5 -0.2 1.0 0.0 0.0 0.0 0.0 - -0.3 -0.7 -0.5 -0.2 1.0 783 082 04 -0.1 -1.1 -0.1 0.0 1.0 0.0 0.0 0.0 0.0 - -0.1 -1.1 -0.1 0.0 1.0 841 294 05 1.3 0.5 -0.3 -0.1 1.1 0.0 0.0 -0.0 0.0 - 1.3 0.5 -0.3 -0.1 1.1 909 298 06 2.4 1.0 -0.0 0.1 1.3 0.0 0.0 -0.0 0.0 - 2.4 1.0 -0.0 0.1 1.3 985 547 07 1.9 1.2 -0.2 -0.3 1.3 0.0 0.0 -0.0 0.0 - 1.9 1.2 -0.2 -0.3 1.3 1 053 161 08 -4.5 -3.0 -1.7 -0.5 0.7 -0.0 -0.0 0.0 0.0 - -4.5 -3.0 -1.7 -0.5 0.7 1 087 788 09 -11.2 -9.3 -2.0 -0.6 0.8 -0.0 0.0 -0.0 -0.0 - -11.2 -9.3 -2.0 -0.6 0.8 1 048 060 10 -9.7 -5.0 -3.8 -0.7 -0.2 0.0 0.0 -0.0 -0.0 - -9.7 -5.0 -3.8 -0.7 -0.2 1 048 883 11 -9.4 -3.4 -5.1 -0.8 -0.1 0.0 0.0 -0.0 0.0 - -9.4 -3.4 -5.1 -0.8 -0.1 1 063 355
P
P P P P
P P A
See notes at the end of the chapter.
10 Q4 -3.3 ... ... ... ... -0.0 ... ... ... ... -3.3 ... ... ... ... 274 045
11 Q1 -1.5 ... ... ... ... 0.0 ... ... ... ... -1.5 ... ... ... ... 259 907 Q2 -2.6 ... ... ... ... 0.0 ... ... ... ... -2.6 ... ... ... ... 273 049 Q3 -1.7 ... ... ... ... 0.0 ... ... ... ... -1.7 ... ... ... ... 255 367 Q4 -3.7 ... ... ... ... -0.0 ... ... ... ... -3.7 ... ... ... ... 275 032
12 Q1 -1.3 ... ... ... ... 0.0 ... ... ... ... -1.3 ... ... ... ... 258 537 Q2 -3.0 ... ... ... ... 0.0 ... ... ... ... -3.0 ... ... ... ... 269 169 Q3 -1.9 ... ... ... ... 0.0 ... ... ... ... -1.9 ... ... ... ... 252 753
BANCO DE ESPAÑA 239 BOLETÍN ESTADÍSTICO, FEBRUARY 2013

P P P P
P P P P
P P A
1=2a5 2 3 4 5 6 7 8 9 10 10 12=2-6 13=3-7 14=4-8 15=5-9
11. GENERAL GOVERNMENT 11.5 Liabilities outstanding and debt according to theexcessive deficit procedure (EDP). Amounts
See notes at the end of the chapter.
EUR millions
Liabilities outstanding Adjustments for liabilities not Consolidation (Financial Accounts of the Spanish Economy) included in EDP debt and for valuation between Debt according to the EDP
and other adjustments (c) different general go- vernment
Total Central Regional Local Social Central Regional Local Social units Total Central Regional Local Social govern- (autono- govern- security govern- (autono- govern- security govern- (autono- govern- security ment mous) ments funds ment mous) ments funds ment mous) ments funds govern- govern- govern- ments ments ments 11=1-(6a10) 11=(12a15)-
00 448 416 340 121 48 058 28 428 31 809 25 832 8 583 8 635 12 977 18 355 374 033 314 290 39 474 19 793 18 832 01 451 213 339 947 51 143 29 070 31 053 25 094 7 436 8 901 12 349 19 187 378 247 314 853 43 706 20 170 18 704 02 475 223 355 266 57 130 31 271 31 556 34 390 10 670 9 750 12 979 23 999 383 435 320 876 46 460 21 522 18 577 03 474 607 350 378 61 749 33 021 29 459 30 584 12 754 10 107 11 009 28 120 382 032 319 793 48 995 22 914 18 450 04 499 861 369 498 66 113 34 839 29 412 38 246 14 118 10 686 11 089 36 581 389 142 331 252 51 994 24 153 18 323 05 516 698 373 681 74 839 39 000 29 179 42 809 17 016 13 465 10 933 39 978 392 497 330 872 57 822 25 535 18 246 06 509 304 358 026 80 275 42 404 28 599 32 713 21 207 14 834 10 430 39 066 391 055 325 313 59 068 27 570 18 169 07 503 906 343 323 85 681 46 084 28 817 25 889 24 642 16 700 11 649 42 720 382 307 317 435 61 039 29 385 17 169 08 588 236 409 925 99 734 50 492 28 085 42 830 27 109 18 717 10 917 51 679 436 984 367 095 72 625 31 775 17 169
09 Q4 739 914 538 346 119 330 54 749 27 489 52 821 28 368 20 049 10 321 63 274 565 082 485 525 90 962 34 700 17 169
10 Q1 748 934 545 080 124 802 52 511 26 540 48 733 25 400 16 343 9 372 66 702 582 384 496 347 99 403 36 167 17 169 Q2 763 434 547 358 133 918 55 618 26 540 33 885 24 767 19 104 9 372 71 748 604 558 513 473 109 152 36 514 17 169 Q3 793 502 572 083 139 653 55 225 26 540 45 165 27 662 19 005 9 372 76 271 616 028 526 919 111 992 36 220 17 169 Q4 811 050 570 435 153 329 59 438 27 848 20 782 32 551 24 007 10 680 78 338 644 692 549 652 120 778 35 431 17 169
11 Q1 854 481 613 528 158 505 55 881 26 567 31 635 31 801 18 537 9 399 77 432 685 677 581 893 126 704 37 344 17 169 Q2 874 229 622 351 166 774 58 427 26 677 27 557 31 118 20 789 9 509 79 731 705 526 594 794 135 656 37 638 17 169 Q3 889 273 633 337 171 512 57 866 26 557 35 302 33 960 21 165 9 389 80 880 708 577 598 035 137 552 36 701 17 169 Q4 942 115 650 674 199 040 64 958 27 442 28 377 57 677 29 539 10 274 79 781 736 468 622 298 141 363 35 420 17 169
12 Q1 986 348 693 629 203 244 62 915 26 559 38 264 56 849 26 056 9 391 80 861 774 926 655 365 146 395 36 860 17 169 Q2 979 955 685 437 203 337 64 622 26 559 5 202 35 066 19 639 9 391 106 056 804 615 680 236 168 271 44 995 17 169 Q3 1 015 507 718 973 205 491 64 457 26 586 23 454 38 026 20 656 9 391 106 811 817 164 695 519 167 460 43 802 17 195
P P P P
P P P P
P P A
1=2a5 2 3 4 5 6 7 8 9 10 10 12=2-6 13=3-7 14=4-8 15=5-9 16
11. GENERAL GOVERNMENT 11.6 Liabilities outstanding and debt according to theexcessive deficit procedure (EDP).As a percentage of GDP mp
See notes at the end of the chapter.
Percentages
Liabilities outstanding Adjustments for liabilities not Consoli- Memoran- (Financial Accounts of the Spanish Economy) included in EDP debt and for dation Debt according to the EDP dum item:
valuation and other adjustments (c) between GDP mp different (EUR general millions)
Total Central Regional Local Social Central Regional Local Social govern- Total Central Regional Local Social (d) govern- (autono- govern- security govern- (autono- govern- security ment govern- (autono- govern- security ment mous) ments funds ment mous) ments funds units ment mous) ments funds govern- govern- govern- ments ments ments 11=1-(6a10) 11=(12a15)-
00 71.2 54.0 7.6 4.5 5.0 4.1 1.4 1.4 2.1 2.9 59.4 49.9 6.3 3.1 3.0 629 907 01 66.3 50.0 7.5 4.3 4.6 3.7 1.1 1.3 1.8 2.8 55.6 46.3 6.4 3.0 2.7 680 397 02 65.2 48.7 7.8 4.3 4.3 4.7 1.5 1.3 1.8 3.3 52.6 44.0 6.4 3.0 2.5 729 258 03 60.6 44.7 7.9 4.2 3.8 3.9 1.6 1.3 1.4 3.6 48.8 40.8 6.3 2.9 2.4 783 082 04 59.4 43.9 7.9 4.1 3.5 4.5 1.7 1.3 1.3 4.3 46.3 39.4 6.2 2.9 2.2 841 294 05 56.8 41.1 8.2 4.3 3.2 4.7 1.9 1.5 1.2 4.4 43.2 36.4 6.4 2.8 2.0 909 298 06 51.7 36.3 8.1 4.3 2.9 3.3 2.2 1.5 1.1 4.0 39.7 33.0 6.0 2.8 1.8 985 547 07 47.8 32.6 8.1 4.4 2.7 2.5 2.3 1.6 1.1 4.1 36.3 30.1 5.8 2.8 1.6 1 053 161 08 54.1 37.7 9.2 4.6 2.6 3.9 2.5 1.7 1.0 4.8 40.2 33.7 6.7 2.9 1.6 1 087 788
09 Q4 70.6 51.4 11.4 5.2 2.6 5.0 2.7 1.9 1.0 6.0 53.9 46.3 8.7 3.3 1.6 1 048 060
10 Q1 71.6 52.1 11.9 5.0 2.5 4.7 2.4 1.6 0.9 6.4 55.7 47.5 9.5 3.5 1.6 1 045 514 Q2 73.0 52.3 12.8 5.3 2.5 3.2 2.4 1.8 0.9 6.9 57.8 49.1 10.4 3.5 1.6 1 045 962 Q3 75.8 54.7 13.3 5.3 2.5 4.3 2.6 1.8 0.9 7.3 58.9 50.3 10.7 3.5 1.6 1 046 663 Q4 77.3 54.4 14.6 5.7 2.7 2.0 3.1 2.3 1.0 7.5 61.5 52.4 11.5 3.4 1.6 1 048 883
11 Q1 81.2 58.3 15.1 5.3 2.5 3.0 3.0 1.8 0.9 7.4 65.1 55.3 12.0 3.5 1.6 1 052 763 Q2 82.6 58.8 15.8 5.5 2.5 2.6 2.9 2.0 0.9 7.5 66.7 56.2 12.8 3.6 1.6 1 058 036 Q3 83.7 59.6 16.1 5.4 2.5 3.3 3.2 2.0 0.9 7.6 66.7 56.3 12.9 3.5 1.6 1 062 368 Q4 88.6 61.2 18.7 6.1 2.6 2.7 5.4 2.8 1.0 7.5 69.3 58.5 13.3 3.3 1.6 1 063 355
12 Q1 92.9 65.3 19.1 5.9 2.5 3.6 5.4 2.5 0.9 7.6 73.0 61.7 13.8 3.5 1.6 1 061 985 Q2 92.6 64.8 19.2 6.1 2.5 0.5 3.3 1.9 0.9 10.0 76.0 64.3 15.9 4.3 1.6 1 058 105 Q3 96.2 68.1 19.5 6.1 2.5 2.2 3.6 2.0 0.9 10.1 77.4 65.9 15.9 4.1 1.6 1 055 491
BANCO DE ESPAÑA 240 BOLETÍN ESTADÍSTICO, FEBRUARY 2013

P P P P
P P P P
P P A
1=4+7+ 2 3 4=2-3 5 6 7=5-6 8 9 10=8-9 11 12 13=11-12
11. GENERAL GOVERNMENT 11.7 Debt according to the excessive deficit procedure (PDE)and financial assets held by general governmentAmounts
See notes at the end of the chapter.
EUR millions
General Regional (autonomous) govern- Central government governments Local governments Social security funds
ment´s debt according to the Debt Financial Debt net Debt Financial Debt net of Debt Financial Debt net of Debt Financial Debt net of EDP according assets of finan- according assets financial according assets financial according assets financial
(consolida- to the vis-à-vis cial assets to the vis-à-vis assets to the vis-à-vis assets to the vis-à-vis assets ted) (a) EDP general vis-à-vis EDP general vis-à-vis EDP general vis-à-vis EDP general vis-à-vis government general govern- general govern- general government general (FLA, FFPP, govern- ment govern- ment govern- (Fondo de government and loan ment ment ment Reserva de to social la Seguri- security dad Social funds) (b) and rest) (c)
10+13
00 374 033 314 290 17 169 297 121 39 474 - 39 474 19 793 - 19 793 18 832 1 187 17 645 01 378 247 314 853 17 169 297 685 43 706 - 43 706 20 170 - 20 170 18 704 2 018 16 686 02 383 435 320 876 17 169 303 707 46 460 - 46 460 21 522 - 21 522 18 577 6 831 11 747 03 382 032 319 793 17 169 302 625 48 995 - 48 995 22 914 - 22 914 18 450 10 952 7 498 04 389 142 331 252 17 169 314 084 51 994 - 51 994 24 153 - 24 153 18 323 19 412 -1 089 05 392 497 330 872 17 169 313 704 57 822 - 57 822 25 535 - 25 535 18 246 22 810 -4 564 06 391 055 325 313 17 169 308 145 59 068 - 59 068 27 570 - 27 570 18 169 21 897 -3 728 07 382 307 317 435 17 169 300 266 61 039 - 61 039 29 385 - 29 385 17 169 25 551 -8 383 08 436 984 367 095 17 169 349 927 72 625 - 72 625 31 775 - 31 775 17 169 34 511 -17 342
09 Q4 565 082 485 525 17 169 468 356 90 962 - 90 962 34 700 - 34 700 17 169 46 105 -28 936
10 Q1 582 384 496 347 17 169 479 179 99 403 - 99 403 36 167 - 36 167 17 169 49 533 -32 365 Q2 604 558 513 473 17 169 496 304 109 152 - 109 152 36 514 - 36 514 17 169 54 580 -37 411 Q3 616 028 526 919 17 169 509 750 111 992 - 111 992 36 220 - 36 220 17 169 59 102 -41 934 Q4 644 692 549 652 17 169 532 484 120 778 - 120 778 35 431 - 35 431 17 169 61 170 -44 001
11 Q1 685 677 581 893 17 169 564 724 126 705 - 126 705 37 344 - 37 344 17 169 60 264 -43 095 Q2 705 526 594 794 17 169 577 626 135 656 - 135 656 37 638 - 37 638 17 169 62 562 -45 394 Q3 708 577 598 035 17 169 580 867 137 552 - 137 552 36 701 - 36 701 17 169 63 711 -46 543 Q4 736 468 622 298 17 169 605 129 141 363 - 141 363 35 420 - 35 420 17 169 62 613 -45 444
12 Q1 774 926 655 365 17 169 638 196 146 395 - 146 395 36 860 - 36 860 17 169 63 693 -46 524 Q2 804 615 680 236 43 551 636 685 168 271 - 168 271 44 995 - 44 995 17 169 62 505 -45 337 Q3 817 164 695 519 43 552 651 967 167 460 - 167 460 43 802 - 43 802 17 195 63 260 -46 064
P P P P
P P P P
P P A
1=4+7+ 2 3 4=2-3 5 6 7=5-6 8 9 10=8-9 11 12 13=11-12
11. GENERAL GOVERMENT 11.8 Debt according to the excessive deficit procedure (PDE)and financial assets held by general governmentAs a percentage of GDP mp
See notes at the end of the chapter.
Percentages
General Regional (autonomous) govern- Central government governments Local governments Social security funds
ment´s debt according to the Debt Financial Debt net Debt Financial Debt net of Debt Financial Debt net of Debt Financial Debt net of EDP according assets of finan- according assets financial according assets financial according assets financial
(consolida- to the vis-à-vis cial assets to the vis-à-vis assets to the vis-à-vis assets to the vis-à-vis assets ted) (a) EDP general vis-à-vis EDP general vis-à-vis EDP general vis-à-vis EDP general vis-à-vis government general govern- general govern- general government general (FLA, FFPP, govern- ment govern- ment govern- (Fondo de government and loan ment ment ment Reserva de to social la Seguri- security dad Social funds) (b) and rest) (c)
10+13
00 59.4 49.9 2.7 47.2 6.3 - 6.3 3.1 - 3.1 3.0 0.2 2.8 01 55.6 46.3 2.5 43.8 6.4 - 6.4 3.0 - 3.0 2.7 0.3 2.5 02 52.6 44.0 2.4 41.6 6.4 - 6.4 3.0 - 3.0 2.5 0.9 1.6 03 48.8 40.8 2.2 38.6 6.3 - 6.3 2.9 - 2.9 2.4 1.4 1.0 04 46.3 39.4 2.0 37.3 6.2 - 6.2 2.9 - 2.9 2.2 2.3 -0.1 05 43.2 36.4 1.9 34.5 6.4 - 6.4 2.8 - 2.8 2.0 2.5 -0.5 06 39.7 33.0 1.7 31.3 6.0 - 6.0 2.8 - 2.8 1.8 2.2 -0.4 07 36.3 30.1 1.6 28.5 5.8 - 5.8 2.8 - 2.8 1.6 2.4 -0.8 08 40.2 33.7 1.6 32.2 6.7 - 6.7 2.9 - 2.9 1.6 3.2 -1.6
09 Q4 53.9 46.3 1.6 44.7 8.7 - 8.7 3.3 - 3.3 1.6 4.4 -2.8
10 Q1 55.7 47.5 1.6 45.8 9.5 - 9.5 3.5 - 3.5 1.6 4.7 -3.1 Q2 57.8 49.1 1.6 47.4 10.4 - 10.4 3.5 - 3.5 1.6 5.2 -3.6 Q3 58.9 50.3 1.6 48.7 10.7 - 10.7 3.5 - 3.5 1.6 5.6 -4.0 Q4 61.5 52.4 1.6 50.8 11.5 - 11.5 3.4 - 3.4 1.6 5.8 -4.2
11 Q1 65.1 55.3 1.6 53.6 12.0 - 12.0 3.5 - 3.5 1.6 5.7 -4.1 Q2 66.7 56.2 1.6 54.6 12.8 - 12.8 3.6 - 3.6 1.6 5.9 -4.3 Q3 66.7 56.3 1.6 54.7 12.9 - 12.9 3.5 - 3.5 1.6 6.0 -4.4 Q4 69.3 58.5 1.6 56.9 13.3 - 13.3 3.3 - 3.3 1.6 5.9 -4.3
12 Q1 73.0 61.7 1.6 60.1 13.8 - 13.8 3.5 - 3.5 1.6 6.0 -4.4 Q2 76.0 64.3 4.1 60.2 15.9 - 15.9 4.3 - 4.3 1.6 5.9 -4.3 Q3 77.4 65.9 4.1 61.8 15.9 - 15.9 4.1 - 4.1 1.6 6.0 -4.4
BANCO DE ESPAÑA 241 BOLETÍN ESTADÍSTICO, FEBRUARY 2013

P P
P
P P P P
P P A
1=2+3+6 2 3=4+5 4 5 6=7+10+ 7=8+9 8 9 10 11 12 13
11. GENERAL GOVERNMENT 11.9 Reconciliation between net borrowing and thechange in debt according to the excessivedeficit procedure (EDP). Amounts
See notes at the end of the chapter.
INE, IGAE and Banco de España EUR millions
Change in Net Net acquisiton of debt accor- borrowing(+) financial assets (c)(d) Adjustments (c) ding to the or net EDP (a) lending(-)
according Total Vis-à-vis Rest Total Other accounts payable Other finan- Due to Other Other to the EDP general cial tran- changes changes in adjust- (b) govern- sactions in the debt volu- ments ment Total Vis-à-vis Rest within gen- exchange me (e) (f) other ge- neral go- rate neral go- vernment vernment units units 11+12+13
00 12 258 5 899 10 363 282 10 081 -4 004 -5 132 388 -5 519 -669 -37 - 1 835 01 4 214 3 578 -2 238 626 -2 865 2 874 4 083 54 4 029 -680 -199 - -330 02 5 188 1 558 14 741 4 822 9 919 -11 111 -3 515 -8 -3 507 -4 814 -1 084 -1 647 -51 03 -1 403 2 728 1 213 5 409 -4 196 -5 344 -299 -1 313 1 015 -4 095 -793 - -157 04 7 110 941 18 949 8 105 10 843 -12 780 -1 821 325 -2 146 -8 430 -727 - -1 802 05 3 355 -11 511 25 822 4 696 21 127 -10 956 -6 999 -1 363 -5 636 -3 333 64 - -688 06 -1 442 -23 349 30 760 -410 31 169 -8 853 -10 751 -541 -10 210 951 -178 - 1 125 07 -8 748 -20 255 24 572 4 216 20 356 -13 065 -9 298 -630 -8 667 -3 586 -166 -295 279 08 54 677 48 897 22 169 9 647 12 522 -16 389 -6 463 -707 -5 756 -8 940 -353 -63 -570 09 128 098 117 143 34 949 10 902 24 048 -23 994 -4 987 722 -5 709 -11 623 -129 -48 -7 206 10 79 609 101 438 5 899 23 640 -17 741 -27 728 -13 571 -8 715 -4 856 -14 925 72 -40 736 11 91 777 100 402 20 373 22 497 -2 124 -28 999 -30 108 -21 055 -9 054 -1 442 330 -46 2 268
10 Q4 28 664 34 898 10 804 8 361 2 443 -17 039 -13 295 -6 070 -7 225 -2 291 39 - -1 491
11 Q1 40 986 15 735 19 175 2 007 17 168 6 076 7 616 1 077 6 540 -3 083 -0 - 1 543 Q2 19 848 27 302 -2 751 455 -3 206 -4 703 -3 393 565 -3 958 -1 021 54 -46 -298 Q3 3 052 18 026 -11 777 -517 -11 260 -3 197 -5 766 -384 -5 382 901 251 - 1 417 Q4 27 891 39 339 15 726 20 552 -4 826 -27 174 -28 566 -22 313 -6 253 1 761 25 - -394
12 Q1 38 458 13 980 24 832 501 24 331 -353 4 489 2 415 2 075 -2 916 -31 - -1 896 Q2 29 688 31 169 2 196 24 770 -22 574 -3 677 21 030 -381 21 412 -24 389 44 -42 -322 Q3 12 550 20 162 -6 090 217 -6 308 -1 522 -703 1 555 -2 258 -1 773 236 - 717
P P
P
P P P P
P P A
1=2+3+6 2 3=4+5 4 5 6=7+10+ 7=8+9 8 9 10 11 12 13
11. GENERAL GOVERNMENT 11.10 Reconciliation between net borrowing and thechange in debt according to the excessivedeficit procedure (EDP). As percentages of GDP mp
See notes at the end of the chapter.
INE, IGAE and Banco de España Percentages
Change in Net Net acquisiton of debt accor- borrowing(+) financial assets (c)(d) Adjustments (c) ding to the or net EDP (a) lending(-)
according Total Vis-à-vis Rest Total Other accounts payable Other finan- Due to Other Other to the EDP general cial tran- changes changes in adjust- (b) govern- sactions in the debt volu- ments ment Total Vis-à-vis Rest within gen- exchange me (e) (f) other ge- neral go- rate neral go- vernment vernment units units 11+12+13
00 1.9 0.9 1.6 0.0 1.6 -0.6 -0.8 0.1 -0.9 -0.1 -0.0 - 0.3 01 0.6 0.5 -0.3 0.1 -0.4 0.4 0.6 0.0 0.6 -0.1 -0.0 - -0.0 02 0.7 0.2 2.0 0.7 1.4 -1.5 -0.5 -0.0 -0.5 -0.7 -0.1 -0.2 -0.0 03 -0.2 0.3 0.2 0.7 -0.5 -0.7 -0.0 -0.2 0.1 -0.5 -0.1 - -0.0 04 0.8 0.1 2.3 1.0 1.3 -1.5 -0.2 0.0 -0.2 -1.0 -0.1 - -0.2 05 0.4 -1.3 2.8 0.5 2.4 -1.2 -0.8 -0.1 -0.6 -0.4 0.0 - -0.1 06 -0.1 -2.4 3.1 -0.1 3.2 -0.9 -1.1 -0.1 -1.0 0.1 -0.0 - 0.1 07 -0.8 -1.9 2.3 0.4 2.0 -1.2 -0.9 -0.1 -0.8 -0.3 -0.0 -0.0 0.0 08 5.0 4.5 2.0 0.9 1.1 -1.5 -0.6 -0.1 -0.5 -0.8 -0.0 -0.0 -0.1 09 12.2 11.2 3.3 1.0 2.3 -2.3 -0.5 0.1 -0.6 -1.1 -0.0 -0.0 -0.7 10 7.6 9.7 0.6 2.3 -1.7 -2.6 -1.3 -0.8 -0.5 -1.4 0.0 -0.0 0.1 11 8.6 9.4 1.9 2.1 -0.2 -2.7 -2.8 -2.0 -0.8 -0.1 0.0 -0.0 0.2
10 Q4 2.7 3.3 1.0 0.8 0.2 -1.6 -1.3 -0.6 -0.7 -0.2 0.0 - -0.1
11 Q1 3.9 1.5 1.8 0.2 1.6 0.6 0.7 0.1 0.6 -0.3 -0.0 - 0.1 Q2 1.9 2.6 -0.3 0.0 -0.3 -0.4 -0.3 0.1 -0.4 -0.1 0.0 -0.0 -0.0 Q3 0.3 1.7 -1.1 -0.0 -1.1 -0.3 -0.5 -0.0 -0.5 0.1 0.0 - 0.1 Q4 2.6 3.7 1.5 1.9 -0.5 -2.6 -2.7 -2.1 -0.6 0.2 0.0 - -0.0
12 Q1 3.6 1.3 2.4 0.0 2.3 -0.0 0.4 0.2 0.2 -0.3 -0.0 - -0.2 Q2 2.8 3.0 0.2 2.3 -2.1 -0.3 2.0 -0.0 2.0 -2.3 0.0 -0.0 -0.0 Q3 1.2 1.9 -0.6 0.0 -0.6 -0.1 -0.1 0.1 -0.2 -0.2 0.0 - 0.1
BANCO DE ESPAÑA 242 BOLETÍN ESTADÍSTICO, FEBRUARY 2013

P P
P
P P P P
P P A
1=2+6+10+ 2=3+4+5 3 4 5 6=7+8+9 7 8 9 10 11=12+13 12 13 14 15
11. GENERAL GOVERNMENT 11.11 Net acquisition of financial assets
EUR millions
Total Currency and deposits Securities other than shares Loans Shares and other equity Other Memoran- accounts dum item: receiva- financial Total Deposits Other Other Total Short- Long- Finan- Total Shares Other ble assets with the trans- depo- term term cial equity vis-à-vis Banco de ferable sits deri- general España deposits vati- govern- ves ment
11+14
00 10 363 11 095 8 351 1 757 987 594 58 658 -122 741 -3 219 24 -3 244 1 153 282 01 -2 238 -2 496 -17 060 -1 248 15 812 651 75 708 -131 2 219 -3 648 400 -4 048 1 037 626 02 14 741 8 116 1 785 3 559 2 772 4 544 189 4 519 -164 1 785 -1 799 294 -2 093 2 095 4 822 03 1 213 -4 203 1 767 606 -6 576 3 920 -298 4 389 -171 1 626 193 796 -602 -325 5 409 04 18 949 6 131 -1 817 5 414 2 535 9 235 1 019 8 339 -123 2 126 -443 228 -671 1 900 8 105 05 25 822 11 377 -695 9 771 2 301 7 921 508 7 419 -7 1 358 463 496 -33 4 703 4 696 06 30 760 13 343 1 780 8 261 3 301 9 542 -1 372 10 917 -3 2 096 258 353 -95 5 521 -410 07 24 572 12 168 2 973 4 909 4 286 9 739 527 9 221 -9 2 516 504 131 373 -354 4 216 08 22 169 819 740 -5 764 5 843 19 186 510 18 649 27 1 959 838 429 409 -633 9 647 09 34 949 17 814 12 463 -3 504 8 855 6 255 -38 6 248 45 7 436 344 150 193 3 100 10 902 10 5 899 -24 635 -21 896 -4 112 1 374 18 487 2 525 15 994 -31 5 122 -446 37 -483 7 652 23 640 11 20 373 -17 591 -3 911 -8 434 -5 245 -6 063 -1 506 -4 519 -38 10 709 -1 002 -1 120 118 34 315 22 497
10 Q4 10 804 -6 976 -8 319 505 839 9 245 -894 10 065 74 -374 -1 605 -213 -1 392 10 794 8 361
11 Q1 19 175 9 159 -2 708 -3 560 15 427 3 605 1 447 2 201 -42 4 157 10 5 5 2 243 2 007 Q2 -2 751 -4 596 3 844 -2 731 -5 709 1 244 -1 372 2 658 -42 1 077 154 5 149 -628 455 Q3 -11 777 -15 257 -2 669 -1 510 -11 078 -1 693 -1 138 -519 -36 2 458 971 973 -2 1 745 -517 Q4 15 726 -6 897 -2 379 -633 -3 885 -9 220 -443 -8 859 82 3 018 -2 137 -2 103 -34 30 956 20 552
12 Q1 24 832 28 007 17 949 2 950 7 109 -3 579 2 640 -6 208 -11 1 765 8 -6 13 -1 369 501 Q2 2 196 -22 412 -15 948 1 480 -7 943 -6 883 1 396 -8 273 -7 31 326 178 115 63 -12 24 770 Q3 -6 090 -1 152 -4 504 -4 002 7 353 -262 441 -696 -7 548 33 7 26 -5 257 217
P P P P
P P P P
P P A
1=3+4+7 2 3 4=5+6 5 6 7=8+9 8 9 10
11. GENERAL GOVERNMENT 11.12 Central government. Debt according to the excessivedeficit procedure (EDP) by instrument
See notes at the end of the chapter.
EUR millions and percentages Currency Memorandum and Securities other item: Debt
Total deposits than shares Loans according other gene- ral govern-
Total Short- Long- Total Short- Long- ment units term term term term (a) As a per- centage GDP mp
00 374 033 59.4 2 595 314 607 45 642 268 965 56 832 5 754 51 078 18 355 01 378 247 55.6 2 522 318 532 36 756 281 776 57 193 6 744 50 449 19 187 02 383 435 52.6 2 134 323 779 36 830 286 949 57 522 5 946 51 576 23 999 03 382 032 48.8 2 307 321 091 39 877 281 214 58 634 6 503 52 131 28 120 04 389 142 46.3 2 543 320 110 37 386 282 724 66 489 6 537 59 952 36 581 05 392 497 43.2 2 798 323 434 33 344 290 090 66 265 4 318 61 947 39 978 06 391 055 39.7 3 064 321 447 32 574 288 873 66 544 4 477 62 067 39 066 07 382 307 36.3 3 307 313 269 33 397 279 872 65 732 4 470 61 261 42 720 08 436 984 40.2 3 420 355 532 53 033 302 498 78 033 7 919 70 114 51 679
09 Q4 565 082 53.9 3 468 471 828 86 395 385 433 89 787 9 272 80 515 63 274
10 Q1 582 384 55.7 3 466 484 786 84 849 399 937 94 132 12 218 81 914 66 702 Q2 604 558 57.8 3 512 499 870 81 740 418 130 101 176 12 484 88 692 71 748 Q3 616 028 58.9 3 568 508 643 86 152 422 491 103 817 11 577 92 240 76 271 Q4 644 692 61.5 3 584 533 376 88 201 445 175 107 732 8 057 99 675 78 338
11 Q1 685 677 65.1 3 602 566 870 85 967 480 903 115 206 12 542 102 664 81 577 Q2 705 526 66.7 3 641 583 209 92 398 490 811 118 676 16 021 102 655 82 481 Q3 708 577 66.7 3 693 584 830 91 377 493 453 120 054 16 730 103 324 81 715 Q4 736 468 69.3 3 685 609 849 96 153 513 696 122 934 14 648 108 286 79 781
12 Q1 774 926 73.0 3 666 639 188 85 483 553 704 132 073 17 179 114 893 84 128 Q2 804 615 76.0 3 664 632 386 72 386 560 000 168 564 19 556 149 009 108 658 Q3 817 164 77.4 3 690 647 006 79 770 567 236 166 468 16 749 149 719 110 430
BANCO DE ESPAÑA 243 BOLETÍN ESTADÍSTICO, FEBRUARY 2013

P P P P
P P P P
P P A
1=2+8=9+10 2=3+7 3=4a6 4 5 6 7 8 9 10
11. GENERAL GOVERNMENT 11.13 Debt according to the excessive deficit procedure (EDP)by counterpart sector and currency
See notes at the end of the chapter.
EUR millions
Total By counterpart sector By currency Resident sectors Rest Euro Other of the currencies world Total Financial institutions Other resident sectors Total Banco de Other MFIs Non-monetary España financial institutions
00 374 033 229 889 187 476 14 450 92 255 80 770 42 413 144 145 363 696 10 338 01 378 247 221 649 181 924 13 952 103 849 64 122 39 725 156 598 368 420 9 827 02 383 435 217 116 182 405 14 170 107 964 60 271 34 710 166 319 375 558 7 877 03 382 032 230 888 189 423 16 319 115 858 57 246 41 465 151 144 375 120 6 912 04 389 142 213 908 170 361 17 486 100 642 52 233 43 547 175 233 383 985 5 156 05 392 497 206 719 170 391 18 225 99 856 52 310 36 329 185 778 388 406 4 091 06 391 055 194 672 156 093 15 949 85 548 54 595 38 579 196 383 388 009 3 046 07 382 307 198 868 160 091 14 985 93 183 51 923 38 777 183 439 379 847 2 460 08 436 984 230 115 177 160 16 923 115 355 44 882 52 955 206 869 434 025 2 959
10 Q1 582 384 329 957 245 565 20 960 170 614 53 992 84 392 252 427 578 165 4 219 Q2 604 558 349 007 252 864 20 477 180 587 51 801 96 143 255 551 600 599 3 959 Q3 616 028 367 123 256 777 21 851 177 954 56 972 110 346 248 905 612 225 3 803 Q4 644 692 368 305 259 627 22 522 182 597 54 508 108 678 276 386 640 691 4 001
11 Q1 685 677 405 630 272 978 23 965 188 375 60 639 132 651 280 048 681 471 4 206 Q2 705 526 428 709 288 414 24 323 199 591 64 501 140 295 276 817 701 703 3 822 Q3 708 577 438 566 282 718 28 973 187 479 66 265 155 848 270 011 704 615 3 962 Q4 736 468 472 725 311 617 31 628 212 453 67 536 161 108 263 743 732 772 3 696
12 Q1 774 926 529 005 372 689 32 364 253 077 87 249 156 316 245 921 771 202 3 724 Q2 804 615 554 150 364 869 31 435 245 718 87 716 189 282 250 464 800 868 3 747 Q3 817 164 564 084 374 956 33 802 245 223 95 931 189 127 253 080 813 505 3 659
1=2a5 2 3 4 5 6= 7a10 7 8 9 10 11
11. PUBLIC ENTERPRISES 11.14 Debt of public enterprises not included in thegeneral government sector (a), by generalgovernment owner unit
EUR millions and percentages
Amount As a percentage of GDP mp Memorandum item: GDP mp (b)
Total Central Regional Local Social Total Central Regional Local Social government (autonomous) governments security government (autonomous) governments security governments funds governments funds
00 15 483 10 655 2 832 1 996 - 2.5 1.7 0.4 0.3 - 629 907 01 16 190 10 510 3 443 2 237 - 2.4 1.5 0.5 0.3 - 680 397 02 17 405 10 394 4 568 2 444 - 2.4 1.4 0.6 0.3 - 729 258 03 20 952 11 768 6 217 2 967 - 2.7 1.5 0.8 0.4 - 783 082 04 19 444 9 626 6 620 3 198 - 2.3 1.1 0.8 0.4 - 841 294 05 21 425 11 533 6 290 3 601 - 2.4 1.3 0.7 0.4 - 909 298 06 25 646 14 078 7 687 3 881 - 2.6 1.4 0.8 0.4 - 985 547 07 32 051 18 080 9 195 4 777 - 3.0 1.7 0.9 0.5 - 1 053 161 08 37 357 21 270 10 405 5 681 - 3.4 2.0 1.0 0.5 - 1 087 788
P P P P
P P P P
P P A
See notes at the end of the chapter.
09 Q4 46 054 25 360 12 839 7 855 - 4.4 2.4 1.2 0.7 - 1 048 060
10 Q1 47 649 26 149 13 505 7 994 - 4.6 2.5 1.3 0.8 - 1 045 514 Q2 49 345 27 196 13 761 8 388 - 4.7 2.6 1.3 0.8 - 1 045 962 Q3 50 173 27 795 13 984 8 394 - 4.8 2.7 1.3 0.8 - 1 046 663 Q4 52 011 29 463 13 485 9 063 - 5.0 2.8 1.3 0.9 - 1 048 883
11 Q1 53 827 30 567 14 144 9 116 - 5.1 2.9 1.3 0.9 - 1 052 763 Q2 54 896 31 521 14 242 9 133 - 5.2 3.0 1.3 0.9 - 1 058 036 Q3 55 188 32 285 13 513 9 390 - 5.2 3.0 1.3 0.9 - 1 062 368 Q4 55 029 32 667 13 035 9 328 - 5.2 3.1 1.2 0.9 - 1 063 355
12 Q1 54 222 32 586 12 360 9 276 - 5.1 3.1 1.2 0.9 - 1 061 985 Q2 55 520 34 048 12 358 9 114 - 5.2 3.2 1.2 0.9 - 1 058 105 Q3 55 973 34 749 12 182 9 042 - 5.3 3.3 1.2 0.9 - 1 055 491
BANCO DE ESPAÑA 244 BOLETÍN ESTADÍSTICO, FEBRUARY 2013

P P P
P P
P P P P P P P P P P P
P
1=2-12 2=3a11 3 4 5 6 7 8 9 10 11 12=13a16 13 14 15 16
11. OTHER INFORMATION 11.15 Flows between Spain and the EU
See notes at the end of the chapter.
Secretaría General del Tesoro y Política Financiera and IGAE EUR millions
Balance Spain resources / European Union uses Spain uses / European Union resources Total EAGF EAFRD EFF EAGGF- EAGGF- ERDF Euro- Cohe- Other Total Traditio- VAT GNP/ Other (a) (a) (b) Guaran- Guidan- pean sion nal own resource GNI/ tee (a) ce Social Fund resources resource (a)(b) Fund (ESF)
00 4 299 10 857 - - - 5 482 514 2 819 797 1 197 48 6 558 918 2 889 2 643 109 01 5 509 12 185 - - - 6 170 628 3 381 1 085 869 53 6 676 905 3 135 2 589 48 02 8 347 14 950 - - - 5 933 978 4 046 1 795 2 121 78 6 603 585 2 525 3 406 87 03 8 673 16 615 - - - 6 459 1 274 5 344 1 653 1 807 79 7 942 753 2 656 4 405 129 04 7 810 15 907 - - - 6 319 1 127 4 712 1 774 1 908 68 8 098 955 1 921 5 084 137 05 4 874 14 803 - - - 6 407 1 270 3 851 1 784 1 391 100 9 929 1 097 2 329 6 401 103 06 2 360 12 635 - - - 6 655 1 095 2 214 1 251 1 283 137 10 275 1 198 2 374 6 547 157 07 2 167 12 052 - - - 5 712 1 024 2 761 1 691 813 50 9 884 1 290 2 488 5 937 169 08 1 018 11 255 5 476 977 8 - 482 2 713 720 741 139 10 237 1 190 2 579 6 280 188 09 30 11 125 6 068 618 9 - 62 2 485 989 801 95 11 095 1 002 1 528 8 362 203 10 2 000 12 005 5 925 858 3 - 198 2 788 526 1 920 -214 10 004 1 158 760 7 868 218 11 1 197 12 575 5 807 981 7 - 244 2 940 1 590 854 153 11 378 1 170 1 964 8 001 242 12 2 693 13 283 5 785 818 8 - 178 4 037 1 434 844 179 10 590 1 085 1 317 7 966 222
12 J-J 956 1 967 1 914 - - - 0 - 29 - 24 1 012 88 135 630 159 13 J-J 1 134 2 744 2 352 5 - - 129 37 6 175 39 1 610 83 155 1 220 151
12 Feb 331 2 880 2 652 - - - 2 48 159 9 10 2 549 85 404 2 060 - Mar -379 557 13 231 0 - 0 137 85 82 9 936 106 135 695 1 Apr 43 972 139 87 0 - 0 120 526 89 11 929 99 135 695 - May 182 1 014 271 176 0 - 0 496 49 5 16 831 85 121 625 - Jun 283 773 85 - 0 - 73 578 3 21 12 489 74 67 347 0 Jul -237 255 80 11 - - 0 14 106 13 31 493 78 67 347 - Aug 110 966 348 163 - - 11 290 21 124 10 856 76 135 603 42 Sep -60 850 9 - - - 8 399 99 326 10 909 90 135 684 0 Oct 275 1 041 - - 0 - 4 942 22 64 9 766 111 108 548 - Nov 421 1 018 116 51 - - 0 772 1 67 11 597 101 81 411 5 Dec 767 991 158 101 7 - 79 241 335 44 26 224 92 -205 321 16
13 Jan 1 134 2 744 2 352 5 - - 129 37 6 175 39 1 610 83 155 1 220 151
BANCO DE ESPAÑA 245 BOLETÍN ESTADÍSTICO, FEBRUARY 2013

NOTES TO THE TABLES OF CHAPTER 11: GENERAL GOVERNMENT
Table 11.1
a. The differences between the net lending (+) or net borrowing (-) of the Spanish National Accounts and according to the
EDP arise from the inclusion in the non-financial transactions account of interest rate swaps, in accordance with Regulation
(EC) No 2558/2001 of 3 December 2001, so that the profits (losses) on swaps transactions reduce (increase) interest. In the
National Accounts, interest rate swaps are considered to be a financial transaction.
b. A positive (negative) sign indicates that general government has obtained profits (losses) in respect of this item.
c. Liabilities issued by general government and held by other general government units, other accounts payable and
adjustments for differences between the market value and the nominal value of the liabilities net incurrence of shares and
other equity (PF.5), as well as other adjustments resulting from the reclassification of institutional units and other changes
in the information.
d. The figures for GDP at market prices are calculated using the official series of the Spanish Quarterly National Accounts
(CNE) published by the INE, by aggregating the last four quarters as at each reference date.
Note: Any discrepancies between the data in this table and in Table 2.9 are due to revisions made after the submission of
the EDP notification to the European Commission.
Table 11.2
Note: The quarterly percentages are calculated: 1) When the GDP for the four quarters of the year in question is available,
using the GDP for that year; 2) when the GDP for the four quarters of the year in question in not available, using the annual
GDP obtained by aggregating the quarterly GDP figures for the last four quarters.
See notes to Table 11.1.
Table 11.3
See notes to Table 11.1.
Table 11.4
See notes to Table 11.2
Table 11.5
See notes to Table 11.1
Table 11.6
See notes to Table 11.2
Table 11.7
a. General government EDP debt does not include financial assets/liabilities incurred by general government and held by
other general government units (columns 3, 6, 9 and 12).
b. Financing by the Autonomous Region Liquidity Fund (FLA), payments made to creditors on behalf of the Regional
(autonomous) Government and Local Governments by the Fund for the Payment of Creditors (FFPP) and Social Security
loan.
c. Debt issued by the State held by the Fondo de Garantía Salarial (FOGASA), the Mutua de Accidentes de Trabajo y
Enfermedades Profesionales and the Fondo de Prevención y Rehabilitación.
Table 11.8
Note: The quarterly percentages are calculated: 1) When the GDP for the four quarters of the year in question is available,
using the GDP for that year; 2) when the GDP for the four quarters of the year in question in not available, using the annual
GDP obtained by aggregating the quarterly GDP figures for the last four quarters.
See notes to Table 11.7.
Table 11.9
a. Annual change in column 11 of Table 11.1.
b. Column 3 of Table 11.1 with the opposite sign.
c. A positive figure means that this item increases debt and a negative figure means that it decreases debt.
d. Breakdown of column in Table 11.11.
e. Includes effects such as those produced by the reclassification of institutional units or financial items.
f. Includes adjustments for interest accrued less interest paid, for issue or redemption premiums, for the difference
between the nominal and cash amount of discounted issues, for capital losses or gains arising from early payment of
liabilities, for discrepancies between the net lending (+) or net borrowing (-) and net financial transactions and net
incurrence of shares and other equity (PF.5).
BANCO DE ESPAÑA 246 BOLETÍN ESTADÍSTICO, FEBRUARY 2013

Table 11.10
Note: The quarterly percentages are calculated: 1) When the GDP for the four quarters of the year in question is available,
using the GDP for that year; 2) when the GDP for the four quarters of the year in question in not available, using the annual
GDP obtained by aggregating the quarterly GDP figures for the last four quarters.
See notes to Table 11.9.
Table 11.12
a. Already deducted from columns 3 to 9.
Note: Any discrepancies between the data in this table and in Table 2.9 are due to revisions made after the submission of
the EDP notification to the European Commission.
Table 11.13
Note: Any discrepancies between the data in this table and in Table 2.9 are due to revisions made after the submission of
the EDP notification to the European Commission.
Table 11.14
a. The units included here as public enterprises are the main non-administrative agencies, entities and enterprises not
classified under regional (autonomous) government.
b. The figures for GDP at market prices are calculated using the official series of the Spanish Quarterly National Accounts
(CNE) published by the INE, by aggregating the last four quarters as at each reference date.
Table 11.15
a. As a result of the reform of the Common Agricultural Policy (CAP) in 2004 (Council Regulation (EC) No 1782/2003 and
subsequent provisions), and pursuant to Council Regulation (EC) 1290/2005, two new European agricultural funds have
been created, the European Agricultural Guarantee Fund (EAGF) and the European Agricultural Fund for Rural Development
(EAFRD). These funds replace the two sections of the former European Agricultural Guidance and Guarantee Fund
(EAGGF): Guarantee and Guidance.
b. Likewise, pursuant to Council Regulation (EC) No 1198/2006, the Financial Instrument for Fisheries Guidance (FIFG) has
been replaced by the European Fisheries Fund (EFF).
c. Note: further details on Spain's relations with the EU may be found in Tables III.32 to III.38 of the Financial Accounts of
the Spanish Economy, available at: www.bde.es.
BANCO DE ESPAÑA 247 BOLETÍN ESTADÍSTICO, FEBRUARY 2013


CHAPTER 12 CENTRAL GOVERNMENT AND SOCIAL SECURITY FUNDS

P P
1 2 3=1+2 4 5=6+7+10 6 7=8+9 8 9 10 11=4-5 12
12. CENTRAL GOVERNMENT 12.1 Net lending (+) or net borrowing (-), liabilitiesoutstanding and debt according to the excessivedeficit procedure (EDP). Amounts
Net lending (+) or net borrowing (-): INE and IGAE. GDP mp: INE. EUR millions
Net lending(+) or net borrowing(-) (a) Liabilities outstanding and debt according to the EDP Memorandum item: GDP mp (d)
According to Interest According Liabilities Adjustments for liabilities not included in EDP debt Debt the Spanish rate swaps to the EDP outstanding and valuation and other adjustments (c) according National adjustment according to to the Accounts (b) the Financial EDP (CNE) Accounts of Total Central go- Other accounts payable Valuation
the Spanish vernment´s and other Economy EDP debt adjust- held by Total Held by Rest ments other other central general government govern- units ment units
00 -6 425 112 -6 313 340 121 25 832 - 7 836 260 7 576 17 996 314 290 629 907 01 -4 668 106 -4 562 339 947 25 094 - 5 053 507 4 547 20 040 314 853 680 397 02 -3 124 129 -2 995 355 266 34 390 - 6 464 794 5 670 27 926 320 876 729 258 03 -5 227 109 -5 118 350 378 30 584 - 6 442 1 879 4 563 24 143 319 793 783 082 04 -8 977 82 -8 895 369 498 38 246 - 6 640 1 792 4 848 31 605 331 252 841 294 05 4 688 31 4 719 373 681 42 809 - 8 913 3 093 5 820 33 896 330 872 909 298 06 9 818 22 9 840 358 026 32 713 - 13 160 3 695 9 465 19 553 325 313 985 547 07 12 141 6 12 147 343 323 25 889 - 15 805 4 049 11 756 10 084 317 435 1 053 161 08 -32 909 -43 -32 952 409 925 42 830 - 18 511 4 818 13 693 24 318 367 095 1 087 788 09 -97 991 60 -97 931 538 346 52 821 - 21 948 4 034 17 914 30 873 485 525 1 048 060 10 -52 896 156 -52 740 570 435 20 782 - 24 411 5 399 19 012 -3 629 549 652 1 048 883 11 -36 619 92 -36 527 650 674 28 377 - 23 384 4 768 18 616 4 993 622 298 1 063 355
P P P
P P A
See notes at the end of the chapter.
11 Q2 ... ... ... 622 351 27 557 2 750 27 587 4 487 23 100 -2 780 594 794 1 058 036 Q3 ... ... ... 633 337 35 302 835 31 293 5 228 26 065 3 174 598 035 1 062 368 Q4 ... ... ... 650 674 28 377 - 23 384 4 768 18 616 4 993 622 298 1 063 355
12 Q1 ... ... ... 693 629 38 264 3 267 30 613 3 870 26 743 4 384 655 365 1 061 985 Q2 ... ... ... 685 437 5 202 2 601 31 705 5 768 25 937 -29 105 680 236 1 058 105 Q3 ... ... ... 718 973 23 454 3 618 30 414 5 606 24 809 -10 579 695 519 1 055 491
P P
1 2 3=1+2 4 5=6+7+10 6 7=8+9 8 9 10 11=4-5 12
12. CENTRAL GOVERNMENT 12.2 Net lending (+) or net borrowing (-), liabilitiesoutstanding and debt according to the excessivedeficit procedure (EDP). As a percentage of GDP mp
Net lending (+) or net borrowing (-): INE and IGAE. GDP mp: INE. Percentages
Net lending(+) or net borrowing(-) (a) Liabilities outstanding and debt according to the EDP Memorandum item: GDP mp (d)
According to Interest According Liabilities Adjustments for liabilities not included in the debt Debt (EUR the Spanish rate swaps to the EDP outstanding and valuation and other adjustments (c) according millions) National adjustment according to to the Accounts (b) the Financial EDP (CNE) Accounts of Total Central go- Other accounts payable Valuation
the Spanish vernment´s and other Economy EDP debt adjust- held by Total Held by Rest ments other other central general government govern- units ment units
00 -1.0 0.0 -1.0 54.0 4.1 - 1.2 0.0 1.2 2.9 49.9 629 907 01 -0.7 0.0 -0.7 50.0 3.7 - 0.7 0.1 0.7 2.9 46.3 680 397 02 -0.4 0.0 -0.4 48.7 4.7 - 0.9 0.1 0.8 3.8 44.0 729 258 03 -0.7 0.0 -0.7 44.7 3.9 - 0.8 0.2 0.6 3.1 40.8 783 082 04 -1.1 0.0 -1.1 43.9 4.5 - 0.8 0.2 0.6 3.8 39.4 841 294 05 0.5 0.0 0.5 41.1 4.7 - 1.0 0.3 0.6 3.7 36.4 909 298 06 1.0 0.0 1.0 36.3 3.3 - 1.3 0.4 1.0 2.0 33.0 985 547 07 1.2 0.0 1.2 32.6 2.5 - 1.5 0.4 1.1 1.0 30.1 1 053 161 08 -3.0 -0.0 -3.0 37.7 3.9 - 1.7 0.4 1.3 2.2 33.7 1 087 788 09 -9.3 0.0 -9.3 51.4 5.0 - 2.1 0.4 1.7 2.9 46.3 1 048 060 10 -5.0 0.0 -5.0 54.4 2.0 - 2.3 0.5 1.8 -0.3 52.4 1 048 883 11 -3.4 0.0 -3.4 61.2 2.7 - 2.2 0.4 1.8 0.5 58.5 1 063 355
P P P
P P A
See notes at the end of the chapter.
11 Q2 ... ... ... 58.8 2.6 0.3 2.6 0.4 2.2 -0.3 56.2 1 058 036 Q3 ... ... ... 59.6 3.3 0.1 2.9 0.5 2.5 0.3 56.3 1 062 368 Q4 ... ... ... 61.2 2.7 - 2.2 0.4 1.8 0.5 58.5 1 063 355
12 Q1 ... ... ... 65.3 3.6 0.3 2.9 0.4 2.5 0.4 61.7 1 061 985 Q2 ... ... ... 64.8 0.5 0.2 3.0 0.5 2.5 -2.8 64.3 1 058 105 Q3 ... ... ... 68.1 2.2 0.3 2.9 0.5 2.4 -1.0 65.9 1 055 491
BANCO DE ESPAÑA 250 BOLETÍN ESTADÍSTICO, FEBRUARY 2013

P P
1=2+3+6 2 3=4+5 4 5 6=7+10+ 7=8+9 8 9 10 11 12 13
12. CENTRAL GOVERNMENT 12.3 Reconciliation between net borrowing and thechange in debt according to the excessivedeficit procedure (EDP). Amounts
See notes at the end of the chapter.
INE, IGAE and Banco de España EUR millions
Change in Net Net acquisiton of debt accor- borrowing(+) financial assets (c)(d) Adjustments (c) ding to the or net EDP (a) lending(-)
according Total Vis-à-vis Rest Total Other accounts payable Other finan- Due to Other Other to the EDP general cial tran- changes changes in adjust- (b) govern- sactions in the debt volu- ments ment Total Vis-à-vis Rest within cen- exchange me (e) (f) other ge- tral govern- rate neral go- ments units vernment units 11+12+13
00 11 376 6 313 5 526 -83 5 609 -463 -2 730 367 -3 097 - -116 - 2 383 01 564 4 562 -5 983 133 -6 116 1 984 2 174 -247 2 421 - -262 - 72 02 6 022 2 995 4 664 -380 5 045 -1 637 695 -287 982 - -941 -1 647 256 03 -1 083 5 118 -6 233 -121 -6 112 33 520 -1 084 1 604 - -648 - 161 04 11 459 8 895 4 956 38 4 918 -2 392 -231 87 -318 - -692 - -1 469 05 -380 -4 719 6 246 -1 6 247 -1 907 -1 552 -1 302 -250 - -3 - -352 06 -5 559 -9 840 7 839 41 7 797 -3 558 -4 875 -602 -4 273 - -110 - 1 427 07 -7 878 -12 147 6 801 45 6 756 -2 532 -2 965 -354 -2 611 - -60 -64 558 08 49 661 32 952 20 110 286 19 824 -3 401 -2 770 -769 -2 001 - -408 -63 -160 09 118 430 97 931 30 461 -114 30 575 -9 963 -3 157 785 -3 941 - -152 -48 -6 606 10 64 127 52 740 12 607 8 503 4 104 -1 219 -2 907 -1 365 -1 542 - -41 -40 1 768 11 72 646 36 527 31 180 21 572 9 608 4 938 1 940 631 1 309 - 129 -46 2 915
P P
1=2+3+6 2 3=4+5 4 5 6=7+10+ 7=8+9 8 9 10 11 12 13
12. CENTRAL GOVERNMENT 12.4 Reconciliation between net borrowing and thechange in debt according to the excessivedeficit procedure (EDP). As a percentage of GDP mp
See notes at the end of the chapter.
INE, IGAE and Banco de España Percentages
Change in Net Net acquisiton of debt accor- borrowing(+) financial assets (c)(d) Adjustments (c) ding to the or net EDP (a) lending(-)
according Total Vis-à-vis Rest Total Other accounts payable Other finan- Due to Other Other to the EDP general cial tran- changes changes in adjust- (b) govern- sactions in the debt volu- ments ment Total Vis-à-vis Rest within cen- exchange me (e) (f) other ge- tral govern- rate neral go- ments units vernment units 11+12+13
00 1.8 1.0 0.9 -0.0 0.9 -0.1 -0.4 0.1 -0.5 - -0.0 - 0.4 01 0.1 0.7 -0.9 0.0 -0.9 0.3 0.3 -0.0 0.4 - -0.0 - 0.0 02 0.8 0.4 0.6 -0.1 0.7 -0.2 0.1 -0.0 0.1 - -0.1 -0.2 0.0 03 -0.1 0.7 -0.8 -0.0 -0.8 0.0 0.1 -0.1 0.2 - -0.1 - 0.0 04 1.4 1.1 0.6 0.0 0.6 -0.3 -0.0 0.0 -0.0 - -0.1 - -0.2 05 -0.0 -0.5 0.7 -0.0 0.7 -0.2 -0.2 -0.1 -0.0 - -0.0 - -0.0 06 -0.6 -1.0 0.8 0.0 0.8 -0.4 -0.5 -0.1 -0.4 - -0.0 - 0.1 07 -0.7 -1.2 0.6 0.0 0.6 -0.2 -0.3 -0.0 -0.2 - -0.0 -0.0 0.1 08 4.6 3.0 1.8 0.0 1.8 -0.3 -0.3 -0.1 -0.2 - -0.0 -0.0 -0.0 09 11.3 9.3 2.9 -0.0 2.9 -1.0 -0.3 0.1 -0.4 - -0.0 -0.0 -0.6 10 6.1 5.0 1.2 0.8 0.4 -0.1 -0.3 -0.1 -0.1 - -0.0 -0.0 0.2 11 6.8 3.4 2.9 2.0 0.9 0.5 0.2 0.1 0.1 - 0.0 -0.0 0.3
BANCO DE ESPAÑA 251 BOLETÍN ESTADÍSTICO, FEBRUARY 2013

P P
P P P P
P P A
1=2+6+10+ 2=3+4+5 3 4 5 6=7+8+9 7 8 9 10 11=12+13 12 13 14 15
12. CENTRAL GOVERNMENT 12.5 Net acquisition of financial assets
EUR millions
Total Currency and deposits Securities other than shares Loans Shares and other equity Other Memoran- accounts dum item: receiva- financial Total Deposits Other Other Total Short- Long- Finan- Total Shares Other ble assets with the trans- depo- term term cial equity vis-à-vis Banco de ferable sits deri- general España deposits vati- govern- ves ment
11+14
00 5 526 6 407 6 038 4 366 -112 - - -112 751 -3 085 220 -3 306 1 565 -83 01 -5 983 -5 632 -20 114 -822 15 304 -106 - - -106 2 217 -3 850 336 -4 185 1 388 133 02 4 664 2 603 5 259 2 339 -129 - - -129 1 787 -2 016 274 -2 290 2 420 -380 03 -6 233 -5 730 523 429 -6 682 -109 - - -109 1 625 -603 288 -891 -1 417 -121 04 4 956 2 028 158 487 1 384 -82 - - -82 2 113 -901 134 -1 034 1 798 38 05 6 246 3 142 278 1 587 1 276 -31 - - -31 1 347 -378 35 -413 2 166 -1 06 7 839 2 643 631 1 431 581 -22 - - -22 2 096 -229 -4 -224 3 350 41 07 6 801 3 840 -195 2 237 1 798 -6 - - -6 2 504 275 54 221 188 45 08 20 110 11 611 2 887 748 7 976 7 266 - 7 223 43 1 872 406 23 383 -1 045 286 09 30 461 15 701 7 342 -1 558 9 917 6 125 -0 6 185 -60 7 090 7 45 -38 1 538 -114 10 12 607 -9 361 -10 789 -484 1 912 8 606 - 8 762 -156 4 887 -316 78 -394 8 792 8 503 11 31 180 -5 303 -1 536 -797 -2 970 -6 695 9 -6 612 -92 10 691 -941 -1 139 199 33 427 21 572
11 Q1 21 702 11 747 -2 751 -610 15 108 5 220 2 342 2 911 -33 4 152 14 -1 15 569 3 296 Q2 -3 133 -3 941 1 506 102 -5 549 -1 223 -1 071 -122 -30 1 072 177 -2 180 782 -1 530 Q3 -5 508 -8 879 1 861 -415 -10 325 -2 217 -942 -1 255 -20 2 454 980 969 11 2 154 -2 019 Q4 18 120 -4 229 -2 152 126 -2 203 -8 475 -321 -8 146 -9 3 014 -2 112 -2 106 -7 29 922 21 824
12 Q1 21 260 26 765 18 249 1 699 6 818 -4 218 1 301 -5 507 -12 1 776 28 0 27 -3 091 348 Q2 -3 932 -28 284 -17 928 -1 547 -8 810 -5 162 -586 -4 559 -17 31 288 126 88 38 -1 900 24 303 Q3 4 851 5 831 -810 -167 6 808 1 072 -128 1 220 -20 554 26 13 13 -2 632 -332
P P P P
P P P P
P P A
1=3+4+7 2 3 4=5+6 5 6 7=8+9 8 9 10=11+12 11 12
12. CENTRAL GOVERNMENT 12.6 Central government. Debt according to the excessivedeficit procedure (EDP) by instruments
See notes at the end of the chapter.
EUR millions and percentages Currency Memorandum item: and Securities other Debt according to the EDP held by
Total deposits than shares (a) Loans other general government units (b)
Total Short- Long- Total Short- Long- Total Social Rest term term term term security As a per- funds centage GDP mp
00 314 290 49.9 2 595 293 742 44 663 249 079 17 953 476 17 477 1 187 1 187 - 01 314 853 46.3 2 522 297 836 35 584 262 252 14 496 849 13 647 2 018 2 018 - 02 320 876 44.0 2 134 304 865 35 831 269 034 13 876 1 030 12 846 6 831 6 831 - 03 319 793 40.8 2 307 304 656 38 766 265 889 12 831 816 12 015 10 952 10 952 - 04 331 252 39.4 2 543 310 634 37 113 273 522 18 075 1 445 16 630 19 412 19 412 - 05 330 872 36.4 2 798 314 500 33 294 281 206 13 575 537 13 038 22 810 22 810 - 06 325 313 33.0 3 064 309 610 31 301 278 309 12 640 579 12 061 21 897 21 897 - 07 317 435 30.1 3 307 304 833 32 444 272 389 9 295 40 9 255 25 551 25 551 - 08 367 095 33.7 3 420 354 633 52 074 302 558 9 043 316 8 727 34 511 34 511 -
09 Q4 485 525 46.3 3 468 473 877 85 513 388 364 8 180 139 8 041 46 105 46 105 -
10 Q1 496 347 47.5 3 466 484 566 83 789 400 777 8 315 169 8 146 49 533 49 533 - Q2 513 473 49.1 3 512 502 203 82 759 419 444 7 758 206 7 552 54 580 54 580 - Q3 526 919 50.3 3 568 515 458 88 632 426 825 7 893 250 7 643 59 102 59 102 - Q4 549 652 52.4 3 584 537 064 89 756 447 308 9 005 230 8 775 61 170 61 170 -
11 Q1 581 893 55.3 3 602 568 606 86 279 482 327 9 685 235 9 450 60 264 60 264 - Q2 594 794 56.2 3 641 581 128 90 096 491 032 10 025 263 9 762 62 562 62 562 - Q3 598 035 56.3 3 693 584 328 89 463 494 865 10 014 294 9 720 63 711 63 711 - Q4 622 298 58.5 3 685 607 120 90 608 516 513 11 493 276 11 217 62 613 62 613 -
12 Q1 655 365 61.7 3 666 635 021 80 914 554 107 16 678 308 16 370 63 693 63 693 - Q2 680 236 64.3 3 664 628 167 71 109 557 059 48 404 3 303 45 101 62 505 62 505 - Q3 695 519 65.9 3 690 642 795 78 164 564 631 49 033 2 340 46 694 63 260 63 260 -
BANCO DE ESPAÑA 252 BOLETÍN ESTADÍSTICO, FEBRUARY 2013

P P P P
P P P P
P P A
1=2+3-10 2 3=4a9 4 5 6 7 8 9 10
12. CENTRAL GOVERNMENT 12.7 Central government. Debt according to the excessivedeficit procedure (EDP) by administrations and units
EUR millions
Total State Other central government units Central go- verment debt according to Total Fondo de Fondo de Fondo de Fondo de Fondo para Rest the EDP held Reestruc- Garantía de Amortiza- Liquidez la Finan- by other turación Depósitos del Déficit Autonó- ciación de central go- Ordenada (FGD) Eléctrico mica los Pagos a vernment Bancaria (FADE) (FLA) Proveedores units (FROB) (FFPP)
00 314 290 309 439 4 851 - - - - - 4 851 - 01 314 853 309 355 5 499 - - - - - 5 499 - 02 320 876 314 705 6 170 - - - - - 6 170 - 03 319 793 312 896 6 897 - - - - - 6 897 - 04 331 252 323 417 7 836 - - - - - 7 836 - 05 330 872 322 907 7 965 - - - - - 7 965 - 06 325 313 316 757 8 556 - - - - - 8 556 - 07 317 435 312 083 5 352 - - - - - 5 352 - 08 367 095 362 890 4 205 - - - - - 4 205 -
09 Q4 485 525 479 541 5 984 3 000 - - - - 2 984 -
10 Q1 496 347 490 251 6 096 3 000 - - - - 3 096 - Q2 513 473 508 797 4 676 3 000 - - - - 1 676 - Q3 526 919 522 187 4 732 3 000 - - - - 1 732 - Q4 549 652 544 789 4 863 3 000 - - - - 1 863 -
11 Q1 581 893 571 990 14 048 6 000 - 6 000 - - 2 048 4 145 Q2 594 794 582 448 15 096 6 000 - 7 000 - - 2 096 2 750 Q3 598 035 581 964 16 906 7 750 - 7 000 - - 2 156 835 Q4 622 298 599 037 23 261 10 945 - 9 906 - - 2 410 -
12 Q1 655 365 632 324 26 308 10 945 - 13 115 - - 2 249 3 267 Q2 680 236 629 902 52 935 10 945 - 13 115 - 26 581 2 294 2 601 Q3 695 519 645 863 53 274 10 945 - 13 115 - 26 916 2 298 3 618
P P P P
P P P P
P P A
1=3+4+7 2 3 4=5+6 5 6 7=8+9 8 9 10 11
12. CENTRAL GOVERNMENT 12.8 State. Debt according to the excessive deficitprocedure (EDP) by instruments
EUR millions and percentages Currency Memorandum item: and guarantees given deposits Securities other than shares Loans (outstanding amount)
Total
Total Short- Long- Total Short- Long- value As a per- term term term term centage of As a per- GDP mp centage of GDP mp
00 309 439 49.1 2 595 291 016 44 663 246 353 15 828 - 15 828 5 430 0.9 01 309 355 45.5 2 522 294 624 35 584 259 040 12 209 - 12 209 5 460 0.8 02 314 705 43.2 2 134 301 167 35 831 265 336 11 404 - 11 404 6 819 0.9 03 312 896 40.0 2 307 299 991 38 766 261 225 10 598 - 10 598 6 821 0.9 04 323 417 38.4 2 543 305 533 37 113 268 420 15 341 - 15 341 7 186 0.9 05 322 907 35.5 2 798 308 898 33 294 275 605 11 211 - 11 211 6 020 0.7 06 316 757 32.1 3 064 303 658 31 301 272 357 10 035 - 10 035 5 794 0.6 07 312 083 29.6 3 307 300 442 32 444 267 998 8 334 - 8 334 6 162 0.6 08 362 890 33.4 3 420 351 633 52 074 299 558 7 838 - 7 838 8 152 0.7
09 Q4 479 541 45.8 3 468 469 377 85 513 383 864 6 696 - 6 696 58 854 5.6
10 Q1 490 251 46.9 3 466 480 066 83 789 396 277 6 719 - 6 719 61 326 5.9 Q2 508 797 48.6 3 512 499 203 82 759 416 444 6 082 - 6 082 65 418 6.3 Q3 522 187 49.9 3 568 512 458 88 632 423 825 6 161 - 6 161 65 267 6.2 Q4 544 789 51.9 3 584 534 064 89 756 444 308 7 142 - 7 142 73 560 7.0
11 Q1 571 990 54.3 3 602 560 751 88 669 472 082 7 637 - 7 637 83 500 7.9 Q2 582 448 55.0 3 641 570 878 91 391 479 488 7 928 - 7 928 87 329 8.3 Q3 581 964 54.8 3 693 570 413 89 793 480 620 7 858 - 7 858 88 606 8.3 Q4 599 037 56.3 3 685 586 269 90 608 495 662 9 083 - 9 083 99 748 9.4
12 Q1 632 324 59.5 3 666 614 228 82 849 531 379 14 429 - 14 429 131 683 12.4 Q2 629 902 59.5 3 664 606 709 72 444 534 266 19 530 - 19 530 136 900 12.9 Q3 645 863 61.2 3 690 622 354 79 364 542 990 19 819 - 19 819 130 906 12.4
BANCO DE ESPAÑA 253 BOLETÍN ESTADÍSTICO, FEBRUARY 2013

P P P P
P P P P
P P A
1=3+4+7 2 3 4=5+6 5 6 7=8+9 8 9
12. CENTRAL GOVERNMENT 12.9 Other units classified as central government. Debtaccording to the excessive deficit procedure (EDP)by instruments
EUR millions and percentages Currency Securities other than shares Loans and
Total deposits Total Short- Long- Total Short- Long-
term term term term As a per- centage of GDP mp
00 4 851 0.8 - 2 726 - 2 726 2 125 476 1 649 01 5 499 0.8 - 3 212 - 3 212 2 286 849 1 438 02 6 170 0.8 - 3 698 - 3 698 2 472 1 030 1 442 03 6 897 0.9 - 4 665 - 4 665 2 233 816 1 416 04 7 836 0.9 - 5 102 - 5 102 2 734 1 445 1 289 05 7 965 0.9 - 5 602 - 5 602 2 364 537 1 827 06 8 556 0.9 - 5 952 - 5 952 2 604 579 2 025 07 5 352 0.5 - 4 391 - 4 391 961 40 921 08 4 205 0.4 - 3 000 - 3 000 1 205 316 889
09 Q4 5 984 0.6 - 4 500 - 4 500 1 484 139 1 345
10 Q1 6 096 0.6 - 4 500 - 4 500 1 596 169 1 427 Q2 4 676 0.4 - 3 000 - 3 000 1 676 206 1 470 Q3 4 732 0.5 - 3 000 - 3 000 1 732 250 1 482 Q4 4 863 0.5 - 3 000 - 3 000 1 863 230 1 633
11 Q1 14 048 1.3 - 12 000 - 12 000 2 048 235 1 813 Q2 15 096 1.4 - 13 000 - 13 000 2 096 263 1 833 Q3 16 906 1.6 - 14 750 - 14 750 2 156 294 1 862 Q4 23 261 2.2 - 20 851 - 20 851 2 410 276 2 134
12 Q1 26 308 2.5 - 24 060 - 24 060 2 249 308 1 941 Q2 52 935 5.0 - 24 060 - 24 060 28 875 3 303 25 572 Q3 53 274 5.0 - 24 060 - 24 060 29 214 2 340 26 874
P P P P
P P P P
P P A
1 2 3 4 5 6 7 8
12. CENTRAL GOVERNMENT PUBLIC ENTERPRISES 12.10 Debt by public enterprises not included in thegeneral government sector (a)
See notes at the end of the chapter.
EUR millions GIF RENFE -----
Total RENFE OPERADORA ADIF AENA SEPI Rest (b) (c) (c) (c) As a per- centage of GDP mp
00 10 655 1.7 6 500 - 0 387 355 3 413 01 10 510 1.5 6 772 - 3 814 213 2 712 02 10 394 1.4 6 823 - - 1 370 213 1 988 03 11 768 1.5 6 714 - 300 2 872 213 1 669 04 9 626 1.1 2 104 - 800 4 917 213 1 592 05 11 533 1.3 - 1 751 2 190 5 456 91 2 044 06 14 078 1.4 - 2 246 2 607 6 425 90 2 709 07 18 080 1.7 - 2 780 3 426 7 932 90 3 852 08 21 270 2.0 - 3 152 4 080 9 463 90 4 485
09 Q4 25 360 2.4 - 3 921 5 147 10 959 90 5 243
10 Q1 26 149 2.5 - 3 921 5 140 11 545 90 5 452 Q2 27 196 2.6 - 4 097 5 627 11 622 90 5 758 Q3 27 795 2.7 - 4 493 5 622 11 804 90 5 785 Q4 29 463 2.8 - 4 852 6 653 11 960 90 5 908
11 Q1 30 567 2.9 - 5 017 7 143 12 261 90 6 056 Q2 31 521 3.0 - 5 142 7 845 12 365 90 6 079 Q3 32 285 3.0 - 5 122 8 492 12 369 90 6 212 Q4 32 667 3.1 - 5 235 8 745 12 396 90 6 201
12 Q1 32 586 3.1 - 5 336 9 092 11 724 90 6 345 Q2 34 048 3.2 - 5 302 9 572 12 750 90 6 333 Q3 34 749 3.3 - 5 282 10 544 12 514 90 6 319
BANCO DE ESPAÑA 254 BOLETÍN ESTADÍSTICO, FEBRUARY 2013

P P
1 2 3=1+2 4 5=6+7+10 6 7=8+9 8 9 10 11=4-5 12
12. SOCIAL SECURITY FUNDS 12.11 Net lending (+) or net borrowing (-), liabilitiesoutstanding and debt according to the excessivedeficit procedure (EDP). Amounts
Net lending (+) or net borrowing (-): INE and IGAE. GDP mp: INE. EUR millions
Net lending(+) or net borrowing(-) (a) Liabilities outstanding and debt according to the EDP Memorandum item: GDP mp (d)
According to Interest According Liabilities Adjustments for liabilities not included in EDP debt Debt the Spanish rate swaps to the EDP outstanding and valuation and other adjustments (c) according National adjustment according to to the Accounts (b) the Financial EDP (CNE) Accounts of Total Social Other accounts payable Valuation
the Spanish security and other Economy funds´ EDP adjust- debt held Total Held by Rest ments by other other social general security govern- funds ment units
00 3 031 - 3 031 31 809 12 977 - 12 977 9 628 3 350 -0 18 832 629 907 01 5 561 - 5 561 31 053 12 349 - 12 349 9 787 2 562 -0 18 704 680 397 02 5 832 - 5 832 31 556 12 979 - 12 979 9 527 3 452 0 18 577 729 258 03 8 060 - 8 060 29 459 11 009 - 11 009 9 491 1 518 -0 18 450 783 082 04 8 488 - 8 488 29 412 11 089 - 11 089 9 310 1 779 0 18 323 841 294 05 9 968 - 9 968 29 179 10 933 - 10 933 9 271 1 662 0 18 246 909 298 06 13 124 - 13 124 28 599 10 430 - 10 430 9 287 1 143 0 18 169 985 547 07 13 681 - 13 681 28 817 11 649 - 11 649 9 343 2 306 -0 17 169 1 053 161 08 7 586 - 7 586 28 085 10 917 - 10 917 9 327 1 590 -0 17 169 1 087 788 09 8 096 - 8 096 27 489 10 321 - 10 321 9 340 981 -0 17 169 1 048 060 10 -1 934 - -1 934 27 848 10 680 - 10 680 9 309 1 371 -0 17 169 1 048 883 11 -773 - -773 27 442 10 274 - 10 274 9 309 965 -0 17 169 1 063 355
P P P
P P A
See notes at the end of the chapter.
11 Q2 ... ... ... 26 677 9 509 - 9 509 9 309 200 -0 17 169 1 058 036 Q3 ... ... ... 26 557 9 389 - 9 389 9 309 80 -0 17 169 1 062 368 Q4 ... ... ... 27 442 10 274 - 10 274 9 309 965 -0 17 169 1 063 355
12 Q1 ... ... ... 26 559 9 391 - 9 391 9 309 82 -0 17 169 1 061 985 Q2 ... ... ... 26 559 9 391 - 9 391 9 309 82 -0 17 169 1 058 105 Q3 ... ... ... 26 586 9 391 - 9 391 9 309 82 -0 17 195 1 055 491
P P
1 2 3=1+2 4 5=6+7+10 6 7=8+9 8 9 10 11=4-5 12
12. SOCIAL SECURITY FUNDS 12.12 Net lending (+) or net borrowing (-), liabilitiesoutstanding and debt according to the excessivedeficit procedure (EDP). As a percentage of GDP mp
Net lending (+) or net borrowing (-): INE and IGAE. GDP mp: INE. Percentages
Net lending(+) or net borrowing(-) (a) Liabilities outstanding and debt according to the EDP Memorandum item: GDP mp (d)
According to Interest According Liabilities Adjustments for liabilities not included in EDP debt Debt (EUR the Spanish rate swaps to the EDP outstanding and valuation and other adjustments (c) according millions) National adjustment according to to the Accounts (b) the Financial EDP (CNE) Accounts of Total Social Other accounts payable Valuation
the Spanish security and other Economy funds´ EDP adjust- debt held Total Held by Rest ments by other other social general security govern- funds ment units
00 0.5 - 0.5 5.0 2.1 - 2.1 1.5 0.5 -0.0 3.0 629 907 01 0.8 - 0.8 4.6 1.8 - 1.8 1.4 0.4 -0.0 2.7 680 397 02 0.8 - 0.8 4.3 1.8 - 1.8 1.3 0.5 0.0 2.5 729 258 03 1.0 - 1.0 3.8 1.4 - 1.4 1.2 0.2 -0.0 2.4 783 082 04 1.0 - 1.0 3.5 1.3 - 1.3 1.1 0.2 0.0 2.2 841 294 05 1.1 - 1.1 3.2 1.2 - 1.2 1.0 0.2 0.0 2.0 909 298 06 1.3 - 1.3 2.9 1.1 - 1.1 0.9 0.1 0.0 1.8 985 547 07 1.3 - 1.3 2.7 1.1 - 1.1 0.9 0.2 -0.0 1.6 1 053 161 08 0.7 - 0.7 2.6 1.0 - 1.0 0.9 0.1 -0.0 1.6 1 087 788 09 0.8 - 0.8 2.6 1.0 - 1.0 0.9 0.1 -0.0 1.6 1 048 060 10 -0.2 - -0.2 2.7 1.0 - 1.0 0.9 0.1 -0.0 1.6 1 048 883 11 -0.1 - -0.1 2.6 1.0 - 1.0 0.9 0.1 -0.0 1.6 1 063 355
P P P
P P A
See notes at the end of the chapter.
11 Q2 ... ... ... 2.5 0.9 - 0.9 0.9 0.0 -0.0 1.6 1 058 036 Q3 ... ... ... 2.5 0.9 - 0.9 0.9 0.0 -0.0 1.6 1 062 368 Q4 ... ... ... 2.6 1.0 - 1.0 0.9 0.1 -0.0 1.6 1 063 355
12 Q1 ... ... ... 2.5 0.9 - 0.9 0.9 0.0 -0.0 1.6 1 061 985 Q2 ... ... ... 2.5 0.9 - 0.9 0.9 0.0 -0.0 1.6 1 058 105 Q3 ... ... ... 2.5 0.9 - 0.9 0.9 0.0 -0.0 1.6 1 055 491
BANCO DE ESPAÑA 255 BOLETÍN ESTADÍSTICO, FEBRUARY 2013

P P
1=2+3+6 2 3=4+5 4 5 6=7+10+ 7=8+9 8 9 10 11 12 13
12. SOCIAL SECURITY FUNDS 12.13 Reconciliation between net borrowing and thechange in debt according to the excessivedeficit procedure (EDP). Amounts
See notes at the end of the chapter.
INE, IGAE and Banco de España EUR millions
Change in Net Net acquisiton of debt accor- borrowing(+) financial assets (c)(d) Adjustments (c) ding to the or net EDP (a) lending(-)
according Total Vis-à-vis Rest Total Other accounts payable Other finan- Due to Other Other to the EDP general cial tran- changes changes in adjust- (b) govern- sactions in the debt volu- ments ment Total Held by Rest within so- exchange me (e) (f) other ge- cial securi- rate neral go- ty funds vernment units 11+12+13
00 -127 -3 031 2 887 675 2 212 17 17 35 -19 - - - -0 01 -127 -5 561 4 049 229 3 820 1 385 1 385 -160 1 545 - - - -0 02 -127 -5 832 6 536 4 995 1 540 -831 -831 261 -1 092 - - - -0 03 -127 -8 060 6 308 4 606 1 703 1 625 1 625 36 1 589 - - - - 04 -127 -8 488 8 371 8 496 -126 -10 -10 181 -191 - - - -0 05 -77 -9 968 9 445 4 065 5 380 446 446 39 407 - - - -0 06 -77 -13 124 12 424 -878 13 302 623 623 -16 639 - - - -0 07 -1 000 -13 681 13 942 4 255 9 687 -1 261 -1 030 -56 -974 - - -231 -0 08 - -7 586 6 897 8 513 -1 615 689 689 16 673 - - - - 09 - -8 096 7 583 12 110 -4 528 513 513 -13 526 - - - -0 10 - 1 934 -1 824 15 639 -17 462 -110 -110 31 -141 - - - - 11 - 773 -1 349 1 297 -2 645 576 576 - 576 - - - 0
P P
1=2+3+6 2 3=4+5 4 5 6=7+10+ 7=8+9 8 9 10 11 12 13
12. SOCIAL SECURITY FUNDS 12.14 Reconciliation between net borrowing and thechange in debt according to the excessivedeficit procedure (EDP). As a percentage of GDP mp
See notes at the end of the chapter.
INE, IGAE and Banco de España Percentages
Change in Net Net acquisiton of debt accor- borrowing(+) financial assets (c)(d) Adjustments (c) ding to the or net EDP (a) lending(-)
according Total Vis-à-vis Rest Total Other accounts payable Other finan- Due to Other Other to the EDP general cial tran- changes changes in adjust- (b) govern- sactions in the debt volu- ments ment Total Held by Rest within so- exchange me (e) (f) other ge- cial securi- rate neral go- ty funds vernment units 11+12+13
00 -0.0 -0.5 0.5 0.1 0.4 0.0 0.0 0.0 -0.0 - - - -0.0 01 -0.0 -0.8 0.6 0.0 0.6 0.2 0.2 -0.0 0.2 - - - -0.0 02 -0.0 -0.8 0.9 0.7 0.2 -0.1 -0.1 0.0 -0.1 - - - -0.0 03 -0.0 -1.0 0.8 0.6 0.2 0.2 0.2 0.0 0.2 - - - - 04 -0.0 -1.0 1.0 1.0 -0.0 -0.0 -0.0 0.0 -0.0 - - - -0.0 05 -0.0 -1.1 1.0 0.4 0.6 0.0 0.0 0.0 0.0 - - - -0.0 06 -0.0 -1.3 1.3 -0.1 1.3 0.1 0.1 -0.0 0.1 - - - -0.0 07 -0.1 -1.3 1.3 0.4 0.9 -0.1 -0.1 -0.0 -0.1 - - -0.0 -0.0 08 - -0.7 0.6 0.8 -0.1 0.1 0.1 0.0 0.1 - - - - 09 - -0.8 0.7 1.2 -0.4 0.0 0.0 -0.0 0.1 - - - -0.0 10 - 0.2 -0.2 1.5 -1.7 -0.0 -0.0 0.0 -0.0 - - - - 11 - 0.1 -0.1 0.1 -0.2 0.1 0.1 - 0.1 - - - 0.0
BANCO DE ESPAÑA 256 BOLETÍN ESTADÍSTICO, FEBRUARY 2013

P P
P P P P
P P A
1=2+6+10+ 2=3+4+5 3 4 5 6=7+8+9 7 8 9 10 11=12+13 12 13 14 15
12. SOCIAL SECURITY FUNDS 12.15 Net adquisiton of financial assets
EUR millions
Total Currency and deposits Securities other than shares Loans Shares and other equity Other Memoran- accounts dum item: receiva- financial Total Deposits Other Other Total Short- Long- Finan- Total Shares Other ble assets with the trans- depo- term term cial equity vis-à-vis Banco de ferable sits deri- general España deposits vati- govern- ves ment
11+14
00 2 887 2 350 2 326 -66 90 713 58 656 - 0 - - - -176 675 01 4 049 3 745 3 123 128 494 781 75 706 - -0 - - - -477 229 02 6 536 2 276 1 773 436 67 4 704 189 4 515 - 0 - - - -445 4 995 03 6 308 1 821 1 246 392 182 4 086 -298 4 384 - 1 - - - 401 4 606 04 8 371 -1 481 -1 976 491 4 9 353 1 019 8 334 - -1 - - - 500 8 496 05 9 445 -293 -1 020 642 85 7 923 508 7 415 - -1 - - - 1 816 4 065 06 12 424 1 855 1 117 447 291 9 541 -1 372 10 912 - -1 - - - 1 030 -878 07 13 942 4 714 2 680 1 253 782 9 743 527 9 216 - 1 - - - -516 4 255 08 6 897 -4 728 -3 375 -781 -572 11 931 510 11 421 - 1 - - - -307 8 513 09 7 583 6 219 6 042 331 -153 20 -37 58 - 2 228 - 228 1 113 12 110 10 -1 824 -11 378 -10 502 -570 -305 9 471 2 525 6 947 - 0 -85 - -85 168 15 639 11 -1 349 -3 016 -2 173 -176 -667 581 -1 514 2 095 - -0 -77 - -77 1 165 1 297
11 Q1 2 160 1 551 302 885 365 -1 605 -895 -709 - - -9 - -9 2 222 -800 Q2 3 048 1 493 1 940 -496 50 2 478 -301 2 779 - - -30 - -30 -893 2 500 Q3 -5 303 -4 517 -4 253 26 -291 538 -196 734 - - -12 - -12 -1 311 601 Q4 -1 253 -1 544 -162 -591 -791 -830 -122 -708 - -0 -26 - -26 1 147 -1 005
12 Q1 2 698 228 -340 434 135 638 1 338 -701 - - -10 - -10 1 841 647 Q2 5 832 6 455 2 064 4 062 329 -1 732 1 982 -3 714 - - 29 - 29 1 080 -126 Q3 -11 803 -7 490 -4 180 -3 056 -254 -1 347 569 -1 916 - - 17 - 17 -2 983 235
P P P P
P P P P
P P A
1=3+4+7 2 3 4=5+6 5 6 7=8+9 8 9 10=11+12 11 12
12. SOCIAL SECURITY FUNDS 12.16 Debt according to the excessive deficitprocedure (EDP) by instruments
See notes at the end of the chapter.
EUR millions and percentages Currency Memorandum item: and Securities other Debt according to the EDP held by
Total deposits than shares Loans other general government units (a)
Total Short- Long- Total Short- Long- Total State loan Rest term term term term As a per- centage GDP mp
00 18 832 3.0 - - - - 18 832 - 18 832 17 169 17 169 - 01 18 704 2.7 - - - - 18 704 - 18 704 17 169 17 169 - 02 18 577 2.5 - - - - 18 577 - 18 577 17 169 17 169 - 03 18 450 2.4 - - - - 18 450 - 18 450 17 169 17 169 - 04 18 323 2.2 - - - - 18 323 - 18 323 17 169 17 169 - 05 18 246 2.0 - - - - 18 246 - 18 246 17 169 17 169 - 06 18 169 1.8 - - - - 18 169 - 18 169 17 169 17 169 - 07 17 169 1.6 - - - - 17 169 - 17 169 17 169 17 169 - 08 17 169 1.6 - - - - 17 169 - 17 169 17 169 17 169 -
09 Q4 17 169 1.6 - - - - 17 169 - 17 169 17 169 17 169 -
10 Q1 17 169 1.6 - - - - 17 169 - 17 169 17 169 17 169 - Q2 17 169 1.6 - - - - 17 169 - 17 169 17 169 17 169 - Q3 17 169 1.6 - - - - 17 169 - 17 169 17 169 17 169 - Q4 17 169 1.6 - - - - 17 169 - 17 169 17 169 17 169 -
11 Q1 17 169 1.6 - - - - 17 169 - 17 169 17 169 17 169 - Q2 17 169 1.6 - - - - 17 169 - 17 169 17 169 17 169 - Q3 17 169 1.6 - - - - 17 169 - 17 169 17 169 17 169 - Q4 17 169 1.6 - - - - 17 169 - 17 169 17 169 17 169 -
12 Q1 17 169 1.6 - - - - 17 169 - 17 169 17 169 17 169 - Q2 17 169 1.6 - - - - 17 169 - 17 169 17 169 17 169 - Q3 17 195 1.6 - - - - 17 195 14 17 181 17 169 17 169 -
BANCO DE ESPAÑA 257 BOLETÍN ESTADÍSTICO, FEBRUARY 2013

NOTES TO THE TABLES OF CHAPTER 12
Table 12.1
a. The differences between the net lending (+) or net borrowing (-) of the Spanish National Accounts and according to the
EDP arise from the inclusion in the non-financial transactions account of interest rate swaps, in accordance with Regulation
(EC) No 2558/2001 of 3 December 2001, so that the profits (losses) on swaps transactions reduce (increase) interest. In the
National Accounts, interest rate swaps are considered to be a financial transaction.
b. A positive (negative) sign indicates that central government has obtained profits (losses) in respect of this item.
c. Liabilities issued by ceneral government and held by other central government units, other accounts payable and
adjustments for differences between the market value and the nominal value of the liabilities net incurrence of shares and
other equity (PF.5), as well as other adjustments resulting from the reclassification of institutional units and other changes
in the information.
d. The figures for GDP at market prices are calculated using the official series of the Spanish Quarterly National Accounts
(CNE) published by the INE, by aggregating the last four quarters as at each reference date.
Table 12.2
Note: The quarterly percentages are calculated: 1) When the GDP for the four quarters of the year in question is available,
using the GDP for that year; 2) when the GDP for the four quarters of the year in question in not available, using the annual
GDP obtained by aggregating the quarterly GDP figures for the last four quarters.
See notes to Table 12.1.
Table 12.3
a. Annual change in column 11 of Table 12.1.
b. Column 3 of Table 12.1 with the opposite sign.
c. A positive figure means that this item increases debt and a negative figure means that it decreases debt.
d. Breakdown of column in Table 12.5.
e. Includes effects such as those produced by the reclassification of institutional units or financial instruments.
f. Includes adjustments for interest accrued less interest paid, for issue or redemption premiums, for the difference
between the nominal and cash amount of discounted issues, for capital losses or gains arising from early payment of
liabilities and net incurrence of shares and other equity (PF.5).
Table 12.4
See notes to Table 12.3
Table 12.6
a. Breakdowns of securities other than shares by instrument and of issues denominated in euro and in other currencies are
given in Tables 21.12, 21.13 and 21.15. The difference between column 4 of this table 'Total securities other than shares'
and column 1 of Table 21.12 'Total securities other than shares, except financial derivatives' arises from the fact that debt
according to the methodology of the excessive deficit protocol excludes the securities held by other general government
units and takes currency swaps into account.
b. Not deducted from column 1.
Table 12.10
a. The units included here as public enterprises are the main non-administrative agencies, entities and enterprises not
classified under central government. For ease of comparison with the central government debt shown in this chapter, the
debt of public enterprises shown in this table has been calculated using the EDP methodology. The debt of public
enterprises does not fall within the scope of the EDP and, therefore, unlike the debt of general government (public debt), it
is not included in the notifications sent to the European Commission.
b. As a consequence of the reallocation of assets and liabilities prompted by RDL 7/2004 of 27 September 2004, between
November and December 2004, an amount of €5,458 million that formed part of the debt of RENFE was assumed by the
State.
c. Law 39/2003 on the railway industry of 17 November 2003 reorganised the state railway industry, the management of the
railway infrastructure (which was previously entrusted to RENFE and GIF) being entrusted to ADIF. Also RENFE-Operadora
was set up, as a company providing railway transport services. This company assumed the resources and assets
previously assigned by RENFE to the provision of railway services.
Table 12.11
a. The differences between the net lending (+) or net borrowing (-) of the Spanish National Accounts and according to the
EDP arise from the inclusion in the non-financial transactions account of interest rate swaps, in accordance with Regulation
(EC) No 2558/2001 of 3 December 2001, so that the profits (losses) on swaps transactions reduce (increase) interest. In the
National Accounts, interest rate swaps are considered to be a financial transaction.
b. A positive (negative) sign indicates that social security funds have obtained profits (losses) in respect of this item.
BANCO DE ESPAÑA 258 BOLETÍN ESTADÍSTICO, FEBRUARY 2013

c. Liabilities issued by social security funds and held by other social security funds, other accounts payable and
adjustments for differences between the market value and the nominal value of the liabilities net incurrence of shares and
other equity (PF.5), as well as other adjustments resulting from the reclassification of institutional units and other changes
in the information.
d. The figures for GDP at market prices are calculated using the official series of the Spanish Quarterly National Accounts
(CNE) published by the INE, by aggregating the last four quarters as at each reference date.
Table 12.12
Note: The quarterly percentages are calculated: 1) When the GDP for the four quarters of the year in question is available,
using the GDP for that year; 2) when the GDP for the four quarters of the year in question in not available, using the annual
GDP obtained by aggregating the quarterly GDP figures for the last four quarters.
See notes to Table 12.11.
Table 12.13
a. Annual change in column 11 of Table 12.11.
b. Column 3 of Table 12.11 with the opposite sign.
c. A positive figure means that this item increases debt and a negative figure means that it decreases debt.
d. Breakdown of column in Table 12.15.
e. Includes effects such as those produced by the reclassification of institutional units or financial instruments.
f. Includes adjustments for interest accrued less interest paid, for issue or redemption premiums, for the difference
between the nominal and cash amount of discounted issues, for capital losses or gains arising from early payment of
liabilities and net incurrence of shares and other equity (PF.5).
Table 12.14
See notes to Table 12.13.
Table 12.16
a. Not deducted from column 1.
BANCO DE ESPAÑA 259 BOLETÍN ESTADÍSTICO, FEBRUARY 2013


CHAPTER 13 REGIONAL AUTONOMOUS GOVERNMENTS

P P
1 2 3=1+2 4 5=6+7+10 6 7=8+9 8 9 10 11=4-5 12
13. REGIONAL (AUTONOMOUS) GOVERNMENTS 13.1 Net lending (+) or net borrowing (-), liabilitiesoutstanding and debt according to the excessivedeficit procedure (EDP). Amounts
Net lending (+) or net borrowing (-): INE and IGAE. GDP mp: INE. EUR millions
Net lending(+) or net borrowing(-) (a) Liabilities outstanding and debt according to the EDP Memorandum item: GDP mp (d)
According to Interest According Liabilities Adjustments for liabilities not included in EDP debt Debt the Spanish rate swaps to the EDP outstanding and valuation and other adjustments (c) according National adjustment according to to the Accounts (b) the Financial EDP (CNE) Accounts of Total Regional Other accounts payable Valuation
the Spanish (autono- and other Economy mous) go- adjust- vernments´ Total Held by Rest ments EDP debt other held by general other regio- govern- nal (autono- ment mous) go- units vernments
00 -3 211 10 -3 201 48 058 8 583 - 7 073 183 6 889 1 511 39 474 629 907 01 -4 346 25 -4 321 51 143 7 436 - 6 366 -0 6 366 1 070 43 706 680 397 02 -3 570 35 -3 535 57 130 10 670 - 8 965 - 8 965 1 705 46 460 729 258 03 -3 829 59 -3 770 61 749 12 754 - 11 084 264 10 820 1 670 48 995 783 082 04 -687 38 -649 66 113 14 118 - 12 196 220 11 976 1 922 51 994 841 294 05 -2 604 -27 -2 631 74 839 17 016 - 15 194 309 14 885 1 822 57 822 909 298 06 -361 -21 -382 80 275 21 207 - 20 130 231 19 899 1 077 59 068 985 547 07 -2 343 -3 -2 346 85 681 24 642 - 23 755 455 23 300 887 61 039 1 053 161 08 -18 212 9 -18 203 99 734 27 109 - 26 034 403 25 631 1 075 72 625 1 087 788 09 -21 343 -104 -21 447 119 330 28 368 - 27 156 430 26 726 1 211 90 962 1 048 060 10 -39 603 -105 -39 708 153 329 32 551 - 33 709 6 352 27 357 -1 158 120 778 1 048 883 11 -54 057 -91 -54 148 199 040 57 677 - 60 730 24 157 36 573 -3 053 141 363 1 063 355
P P P
P P A
See notes at the end of the chapter.
11 Q2 ... ... ... 166 774 31 118 - 33 151 5 751 27 400 -2 033 135 656 1 058 036 Q3 ... ... ... 171 512 33 960 - 34 779 5 493 29 286 -819 137 552 1 062 368 Q4 ... ... ... 199 040 57 677 - 60 730 24 157 36 573 -3 053 141 363 1 063 355
12 Q1 ... ... ... 203 244 56 849 - 59 943 22 922 37 021 -3 094 146 395 1 061 985 Q2 ... ... ... 203 337 35 066 - 43 800 21 687 22 113 -8 734 168 271 1 058 105 Q3 ... ... ... 205 491 38 031 - 44 944 20 549 24 395 -6 913 167 460 1 055 491
P P
1 2 3=1+2 4 5=6+7+10 6 7=8+9 8 9 10 11=4-5 12
13. REGIONAL (AUTONOMOUS) GOVERNMENTS 13.2 Net lending (+) or net borrowing (-), liabilitiesoutstanding and debt according to the excessivedeficit procedure (EDP). As a percentage of GDP mp
Net lending (+) or net borrowing (-): INE and IGAE. GDP mp: INE. Percentages
Net lending(+) or net borrowing(-) (a) Liabilities outstanding and debt according to the EDP Memorandum item: GDP mp (d)
According to Interest According Liabilities Adjustments for liabilities not included in EDP debt Debt (EUR the Spanish rate swaps to the EDP outstanding and valuation and other adjustments (c) according millions) National adjustment according to to the Accounts (b) the Financial EDP (CNE) Accounts of Total Regional Other accounts payable Valuation
the Spanish (autono- and other Economy mous) go- adjust- vernment´s Total Held by Rest ments EDP debt other held by general other regio- govern- nal (autono- ment mous) go- units vernments
00 -0.5 0.0 -0.5 7.6 1.4 - 1.1 0.0 1.1 0.2 6.3 629 907 01 -0.6 0.0 -0.6 7.5 1.1 - 0.9 -0.0 0.9 0.2 6.4 680 397 02 -0.5 0.0 -0.5 7.8 1.5 - 1.2 - 1.2 0.2 6.4 729 258 03 -0.5 0.0 -0.5 7.9 1.6 - 1.4 0.0 1.4 0.2 6.3 783 082 04 -0.1 0.0 -0.1 7.9 1.7 - 1.4 0.0 1.4 0.2 6.2 841 294 05 -0.3 -0.0 -0.3 8.2 1.9 - 1.7 0.0 1.6 0.2 6.4 909 298 06 -0.0 -0.0 -0.0 8.1 2.2 - 2.0 0.0 2.0 0.1 6.0 985 547 07 -0.2 -0.0 -0.2 8.1 2.3 - 2.3 0.0 2.2 0.1 5.8 1 053 161 08 -1.7 0.0 -1.7 9.2 2.5 - 2.4 0.0 2.4 0.1 6.7 1 087 788 09 -2.0 -0.0 -2.0 11.4 2.7 - 2.6 0.0 2.6 0.1 8.7 1 048 060 10 -3.8 -0.0 -3.8 14.6 3.1 - 3.2 0.6 2.6 -0.1 11.5 1 048 883 11 -5.1 -0.0 -5.1 18.7 5.4 - 5.7 2.3 3.4 -0.3 13.3 1 063 355
P P P
P P A
See notes at the end of the chapter.
11 Q2 ... ... ... 15.8 2.9 - 3.1 0.5 2.6 -0.2 12.8 1 058 036 Q3 ... ... ... 16.1 3.2 - 3.3 0.5 2.8 -0.1 12.9 1 062 368 Q4 ... ... ... 18.7 5.4 - 5.7 2.3 3.4 -0.3 13.3 1 063 355
12 Q1 ... ... ... 19.1 5.4 - 5.6 2.2 3.5 -0.3 13.8 1 061 985 Q2 ... ... ... 19.2 3.3 - 4.1 2.0 2.1 -0.8 15.9 1 058 105 Q3 ... ... ... 19.5 3.6 - 4.3 1.9 2.3 -0.7 15.9 1 055 491
BANCO DE ESPAÑA 262 BOLETÍN ESTADÍSTICO, FEBRUARY 2013

P P
1=2+3+6 2 3=4+5 4 5 6=7+10+ 7=8+9 8 9 10 11 12 13
13. REGIONAL (AUTONOMOUS) GOVERNMENTS 13.3 Reconciliation between net borrowing and thechange in debt according to the excessivedeficit procedure (EDP). Amounts
See notes at the end of the chapter.
INE, IGAE and Banco de España EUR millions
Change in Net Net acquisiton of debt accor- borrowing(+) financial assets (c)(d) Adjustments (c) ding to the or net EDP (a) lending(-)
according Total Vis-à-vis Rest Total Other accounts payable Other finan- Due to Other Other to the EDP general cial tran- changes changes in adjust- (b) govern- sactions in the debt volu- ments ment Total Vis-à-vis Rest within exchange me (e) (f) other ge- regional rate neral go- (autonomous) vernment governments units 11+12+13
00 1 909 3 201 438 -253 691 -1 730 -1 639 -12 -1 627 - 58 - -149 01 4 232 4 321 -636 232 -868 547 734 183 551 - 34 - -221 02 2 753 3 535 2 217 59 2 158 -2 999 -2 556 0 -2 556 - -167 - -276 03 2 535 3 770 1 250 861 389 -2 485 -2 077 -264 -1 813 - -145 - -263 04 3 000 649 3 718 -462 4 180 -1 368 -1 054 44 -1 098 - -37 - -276 05 5 828 2 631 6 430 592 5 838 -3 233 -3 049 -89 -2 960 - 71 - -255 06 1 245 382 6 160 397 5 764 -5 297 -4 984 78 -5 062 - -68 - -245 07 1 971 2 346 3 501 -115 3 616 -3 876 -3 570 -224 -3 346 - -105 - -201 08 11 586 18 203 -4 049 524 -4 573 -2 568 -2 258 52 -2 310 - 55 - -365 09 18 338 21 447 -1 476 -873 -603 -1 633 -1 061 -27 -1 034 - 23 - -595 10 29 816 39 708 -2 670 -459 -2 211 -7 222 -6 497 -5 922 -575 - 111 - -836 11 20 585 54 148 -6 057 -234 -5 823 -27 506 -27 046 -17 805 -9 241 - 200 - -661
P P
1=2+3+6 2 3=4+5 4 5 6=7+10+ 7=8+9 8 9 10 11 12 13
13. REGIONAL (AUTONOMOUS) GOVERNMENTS 13.4 Reconciliation between net borrowing and thechange in debt according to the excessivedeficit procedure (EDP). As a percentage of GDP mp
See notes at the end of the chapter.
INE, IGAE and Banco de España Percentages
Change in Net Net acquisiton of debt accor- borrowing(+) financial assets (c)(d) Adjustments (c) ding to the or net EDP (a) lending(-)
according Total Vis-à-vis Rest Total Other accounts payable Other finan- Due to Other Other to the EDP general cial tran- changes changes in adjust- (b) govern- sactions in the debt volu- ments ment Total Vis-à-vis Rest within exchange me (e) (f) other ge- regional rate neral go- (autonomous) vernment governments units 11+12+13
00 0.3 0.5 0.1 -0.0 0.1 -0.3 -0.3 -0.0 -0.3 - 0.0 - -0.0 01 0.6 0.6 -0.1 0.0 -0.1 0.1 0.1 0.0 0.1 - 0.0 - -0.0 02 0.4 0.5 0.3 0.0 0.3 -0.4 -0.4 0.0 -0.4 - -0.0 - -0.0 03 0.3 0.5 0.2 0.1 0.0 -0.3 -0.3 -0.0 -0.2 - -0.0 - -0.0 04 0.4 0.1 0.4 -0.1 0.5 -0.2 -0.1 0.0 -0.1 - -0.0 - -0.0 05 0.6 0.3 0.7 0.1 0.6 -0.4 -0.3 -0.0 -0.3 - 0.0 - -0.0 06 0.1 0.0 0.6 0.0 0.6 -0.5 -0.5 0.0 -0.5 - -0.0 - -0.0 07 0.2 0.2 0.3 -0.0 0.3 -0.4 -0.3 -0.0 -0.3 - -0.0 - -0.0 08 1.1 1.7 -0.4 0.0 -0.4 -0.2 -0.2 0.0 -0.2 - 0.0 - -0.0 09 1.7 2.0 -0.1 -0.1 -0.1 -0.2 -0.1 -0.0 -0.1 - 0.0 - -0.1 10 2.8 3.8 -0.3 -0.0 -0.2 -0.7 -0.6 -0.6 -0.1 - 0.0 - -0.1 11 1.9 5.1 -0.6 -0.0 -0.5 -2.6 -2.5 -1.7 -0.9 - 0.0 - -0.1
BANCO DE ESPAÑA 263 BOLETÍN ESTADÍSTICO, FEBRUARY 2013

P P
P P P P
P P A
1=2+6+10+ 2=3+4+5 3 4 5 6=7+8+9 7 8 9 10 11=12+13 12 13 14 15
13. REGIONAL (AUTONOMOUS) GOVERNMENTS 13.5 Net acquisition of financial assets
EUR millions
Total Currency and deposits Securities other than shares Loans Shares and other equity Other Memoran- accounts dum item: receiva- financial Total Deposits Other Other Total Short- Long- Finan- Total Shares Other ble assets with the trans- depo- term term cial equity vis-à-vis Banco de ferable sits deri- general España deposits vati- govern- ves ment
11+14
00 438 753 -22 761 14 -10 - - -10 -11 -104 -176 72 -190 -253 01 -636 -958 -64 -838 -56 -25 - - -25 2 187 65 122 158 232 02 2 217 2 013 5 1 831 177 -35 - - -35 -2 182 -2 185 59 59 03 1 250 -49 -1 -59 11 -59 - - -59 0 519 240 279 840 861 04 3 718 3 853 3 3 201 649 -38 - - -38 14 437 84 353 -548 -462 05 6 430 5 275 45 5 074 156 27 - - 27 9 594 249 345 525 592 06 6 160 4 761 32 4 094 635 21 - - 21 3 314 209 105 1 061 397 07 3 501 3 475 488 1 628 1 359 3 - - 3 8 129 -9 138 -114 -115 08 -4 049 -4 903 1 227 -4 784 -1 346 -9 - - -9 3 336 328 8 524 524 09 -1 476 -2 753 -921 -1 026 -806 104 - - 104 232 125 117 8 815 -873 10 -2 670 -1 920 -604 -1 837 521 105 - - 105 176 116 108 8 -1 147 -459 11 -6 057 -6 055 -198 -5 221 -636 91 - - 91 41 -33 -23 -10 -101 -234
11 Q1 -2 894 -2 526 -258 -2 348 80 -9 - - -9 10 -8 -5 -3 -362 -341 Q2 -1 899 -1 559 402 -2 046 85 -12 - - -12 10 -6 -3 -3 -332 -330 Q3 -314 -1 217 -278 -691 -248 -16 - - -16 10 -9 -6 -3 917 918 Q4 -950 -754 -65 -136 -553 128 - - 128 10 -10 -8 -3 -324 -481
12 Q1 1 489 1 653 40 1 364 249 -9 - - -9 -9 -6 -3 -3 -141 -502 Q2 -602 -1 665 -84 -1 696 114 - - - - 40 23 26 -3 1 000 786 Q3 -332 -764 485 -1 168 -82 3 - - 3 -4 -6 -3 -3 439 392
BANCO DE ESPAÑA 264 BOLETÍN ESTADÍSTICO, FEBRUARY 2013

ME
MO
RA
ND
UM
ITE
M:
WIT
HIN
TH
E G
EN
ER
AL
GO
VE
RN
ME
NT
____
____
____
____
____
____
____
____
____
____
____
____
____
____
____
____
____
____
____
____
____
____
____
____
____
____
____
____
____
____
____
____
____
____
____
____
____
____
____
____
____
____
____
____
____
____
13. C
OM
UN
IDA
DE
S A
UT
ÓN
OM
AS
13.6
Deu
da
seg
ún
el P
roto
colo
de
Déf
icit
Exc
esiv
o (
PD
E).
Res
um
en g
ener
al
Dato
s r
efe
ridos a
Septiem
bre
de 2
012
Mill
ones d
e e
uro
s
Val
ores
dis
tinto
s de
acc
ione
s/
Securities o
ther
than s
hare
s
Pré
stam
os/L
oans
Ser
ie e
n
Tot
al
In
stitu
cion
es fi
nanc
iera
s
A
dmin
istr
ació
n C
entr
al
Aso
ciac
ione
s c
uadr
o y
T
otal
Cor
to
La
rgo
res
iden
tes
/ Resid
ent
R
esto
/
Centr
al G
overn
ment
P
úblic
o-
col
umna
/
plaz
o /
pl
azo/
financia
l in
stitu
tions
d
el
Priv
adas
T
ime
S
hort
-
Long-
Tot
al
mun
do/
Fon
do p
ara
(A
PP
s)/
series
term
term
C
orto
L
argo
Rest
Fon
do d
e l
a F
inan
-
Public
-
in table
T
otal
p
lazo
/ p
lazo
/ o
f th
e
Liq
uide
z -
ciac
ión
de
-P
rivate
a
nd
Short
L
ong-
w
orld
Aut
onóm
ico
los
Pag
os a
P
art
ners
hip
s colu
mn
-t
erm
te
rm
(F
LA)
P
rove
edor
es
(PP
Ps)
11+
12+
13
(F
FP
P)
1
2=
3+6
3=
4+5
4
5
6=
7+10
+
7=
8+9
8
9
10
11
1
2
13
TO
TA
L.
..
..
..
..
..
..
..
..
13.9
/116
7 46
0 65
686
7
814
57 8
72
101
774
52 1
55
11 8
28
40 3
27
27 9
49
- 17
694
3
976
TO
TA
L
1. A
ndal
ucía
..
..
..
..
..
.13
.9/2
18 4
95
7 54
4 40
5 7
139
10 9
51
6 08
5 1
717
4 36
8 2
173
- 2
693
-
1. A
ndal
ucía
2
. Ara
gón
.
..
..
..
..
..
13.9
/34
230
1 49
0 18
1
472
2 74
0 1
402
88
1 31
5 91
1 -
425
2
2. A
rago
n
3. P
rinci
pado
de
Ast
uria
s
..
..
..
..
13.9
/42
395
- -
- 2
395
1 27
6 87
1
189
875
- 24
3 -
3.
Prin
cipa
do d
e A
stur
ias
4. I
lles
Bal
ears
.
..
..
..
..
..
13.9
/55
414
1 67
0 -
1 67
0 3
744
2 49
7 47
2 2
026
339
- 84
3 65
4
. Ille
s B
alea
rs
5. C
anar
ias
.
..
..
..
..
..
13.9
/64
106
1 63
7 55
1
582
2 46
9 2
084
95
1 98
9 15
3 -
231
-
5. C
anar
ias
6
. Can
tabr
ia
.
..
..
..
..
..
13.9
/71
756
48
- 48
1
708
1 17
5 12
0 1
055
206
- 32
7 -
6.
Can
tabr
ia
7. C
astil
la-L
a M
anch
a
..
..
..
..
.13
.9/8
9 69
4 1
770
- 1
770
7 92
4 3
444
586
2 85
7 1
565
- 2
916
-
7. C
astil
la-L
a M
anch
a
8. C
astil
la y
Leó
n
.
..
..
..
..
.13
.9/9
6 93
8 1
372
- 1
372
5 56
6 2
452
52
2 40
1 1
749
- 1
051
314
8.
Cas
tilla
y L
eón
9. C
atal
uña
.
..
..
..
..
..
13.9
/10
45 7
54
24 6
72
5 62
8 19
045
21
082
11
213
4
260
6 95
3 6
104
- 2
020
1 74
4
9. C
atal
uña
1
0. E
xtre
mad
ura
.
..
..
..
..
.13
.9/1
12
275
66
- 66
2
209
1 55
1 18
6 1
365
430
- 22
8 -
10.
Ext
rem
adur
a
1
1. G
alic
ia
..
..
..
..
..
.13
.9/1
27
622
4 09
5 -
4 09
5 3
527
1 98
0 13
2 1
848
1 24
5 -
- 30
2 1
1. G
alic
ia
12.
La
Rio
ja
..
..
..
..
..
.13
.9/1
31
081
- -
- 1
081
821
288
533
189
- 71
-
12.
La
Rio
ja
13.
Com
unid
ad d
e M
adrid
.
..
..
..
.13
.9/1
417
780
8
412
- 8
412
9 36
8 3
783
377
3 40
6 3
631
- 1
257
697
13.
Com
unid
ad d
e M
adrid
1
4. R
egió
n de
Mur
cia
..
..
..
..
.13
.9/1
54
349
1 10
3 29
5 80
8 3
247
1 34
6 18
6 1
160
863
- 1
038
- 1
4. R
egió
n de
Mur
cia
15.
Com
unid
ad F
oral
de
Nav
arra
.
..
..
13.9
/16
2 89
4 1
565
- 1
565
1 33
0 63
6 36
60
0 40
0 -
- 29
4 1
5. C
omun
idad
For
al d
e N
avar
ra
1
6. P
aís
Vas
co
.
..
..
..
..
.13
.9/1
77
103
2 97
3 -
2 97
3 4
129
2 04
0 13
2
028
2 08
9 -
- -
16.
Paí
s V
asco
17.
Com
unita
t Val
enci
ana
.
..
..
..
.13
.9/1
825
574
7
269
1 41
4 5
855
18 3
05
8 36
9 3
133
5 23
6 5
027
- 4
351
559
17.
Com
unita
t Val
enci
ana
PR
O M
EM
OR
IA:
EM
PR
ES
AS
PÚ
BL
ICA
S N
O IN
CL
UID
AS
.
13.1
1/1
12 1
82
1 24
9 -
1 24
9 10
933
7
265
397
6 86
8 3
668
- -
-
PU
BL
IC E
NT
ER
PR
ISE
S N
OT
INC
LU
DE
D
EN
EL
SE
CT
OR
AA
PP
Septe
mber
201
2 d
ata
EU
R m
illio
ns
13.6
Deb
t ac
cord
ing
to
th
e E
xces
sive
Def
icit
Pro
ced
ure
(E
DP
). G
ener
al S
um
mar
y13
. RE
GIO
NA
L (
AU
TO
NO
MO
US
) G
OV
ER
NM
EN
TS
BANCO DE ESPAÑA 265 BOLETÍN ESTADÍSTICO, FEBRUARY 2013

P P P P
P P P P
P A A
1=3+6 2 3=4+5 4 5 6=7+8 7 8 9=10+11+12 10 11 12
13. REGIONAL (AUTONOMOUS) GOVERNMENTS 13.7 Debt according to the excessive deficit procedure (EDP)by instruments
See notes at the end of the chapter.
EUR millions and percentages By instruments Memorandum item:: Debt according to EDP held by
Total Debt securities issued (a) Loans other general government units As a Total Short-term Long-term Total Short-term Long-term Total Fondo de Fondo para Rest percen- Liquidez la Finan- tage of Autonómica ciación de GDP mp (FLA) los Pagos a Proveedores (FFPP)
00 39 474 6.3 19 890 1 067 18 823 19 584 4 035 15 549 - - - - 01 43 706 6.4 20 614 1 343 19 271 23 092 4 530 18 562 - - - - 02 46 460 6.4 23 449 1 371 22 078 23 011 3 300 19 711 - - - - 03 48 995 6.3 25 130 1 175 23 955 23 865 3 799 20 066 - - - - 04 51 994 6.2 26 645 1 390 25 255 25 349 3 346 22 004 - - - - 05 57 822 6.4 29 510 1 697 27 813 28 312 2 257 26 055 - - - - 06 59 068 6.0 31 273 1 514 29 759 27 795 2 492 25 304 - - - - 07 61 039 5.8 31 394 1 752 29 642 29 645 2 727 26 918 - - - - 08 72 625 6.7 32 831 2 245 30 586 39 794 4 751 35 043 - - - -
09 Q4 90 962 8.7 41 616 2 091 39 525 49 346 6 740 42 606 - - - -
10 Q1 99 403 9.5 47 314 2 572 44 741 52 089 8 151 43 938 - - - - Q2 109 152 10.4 49 838 1 665 48 173 59 314 8 164 51 150 - - - - Q3 111 992 10.7 49 878 2 199 47 679 62 114 7 583 54 531 - - - - Q4 120 778 11.5 55 156 2 221 52 934 65 622 6 257 59 365 - - - -
11 Q1 126 705 12.0 56 302 2 559 53 743 70 403 8 788 61 614 - - - - Q2 135 656 12.8 62 448 4 866 57 581 73 208 11 847 61 361 - - - - Q3 137 552 12.9 62 018 4 282 57 736 75 534 12 930 62 604 - - - - Q4 141 363 13.3 63 437 7 790 55 647 77 926 12 938 64 988 - - - -
12 Q1 146 395 13.8 65 955 8 189 57 767 80 439 13 830 66 609 - - - - Q2 168 271 15.9 64 940 6 958 57 982 103 332 13 014 90 318 17 694 - 17 694 - Q3 167 460 15.9 65 686 7 814 57 872 101 774 11 828 89 945 17 694 - 17 694 -
P P P P
P P P P
P A A
1=2a5 2 3 4 5 6=7a10 7 8 9 10 11
13. REGIONAL (AUTONOMOUS) GOVERNMENTS 13.8 Debt according to the excessive deficit procedure (EDP)by institutional grouping
See notes at the end of the chapter.
EUR millions and percentages
Amount As a percentage of GDP mp Memorandum item: GDP mp
Total General ad- Other units included on the Total General ad- Other units included on the ministration sub-sector regional (autono- ministration sub-sector regional (autonomous) (a) mous) governments (a) governments Administra- Universities Corporations Administra- Universi- Corpora- tive and tive and ties tions similar similar agencies agencies
00 39 474 33 619 2 630 946 2 279 6.3 5.3 0.4 0.2 0.4 629 907 01 43 706 35 205 4 432 1 258 2 811 6.4 5.2 0.7 0.2 0.4 680 397 02 46 460 37 063 5 556 1 409 2 431 6.4 5.1 0.8 0.2 0.3 729 258 03 48 995 38 152 6 343 1 802 2 698 6.3 4.9 0.8 0.2 0.3 783 082 04 51 994 40 835 6 826 1 121 3 212 6.2 4.9 0.8 0.1 0.4 841 294 05 57 822 43 377 10 087 1 048 3 310 6.4 4.8 1.1 0.1 0.4 909 298 06 59 068 44 091 10 545 991 3 442 6.0 4.5 1.1 0.1 0.3 985 547 07 61 039 46 107 10 396 898 3 638 5.8 4.4 1.0 0.1 0.3 1 053 161 08 72 625 54 487 12 606 831 4 701 6.7 5.0 1.2 0.1 0.4 1 087 788
09 Q4 90 962 71 389 13 391 697 5 486 8.7 6.8 1.3 0.1 0.5 1 048 060
10 Q1 99 403 79 681 13 574 691 5 457 9.5 7.6 1.3 0.1 0.5 1 045 514 Q2 109 152 88 705 14 156 750 5 541 10.4 8.5 1.4 0.1 0.5 1 045 962 Q3 111 992 91 491 14 247 669 5 585 10.7 8.7 1.4 0.1 0.5 1 046 663 Q4 120 778 98 216 16 261 595 5 707 11.5 9.4 1.6 0.1 0.5 1 048 883
11 Q1 126 705 103 950 16 339 603 5 811 12.0 9.9 1.6 0.1 0.6 1 052 763 Q2 135 656 112 611 16 460 608 5 976 12.8 10.6 1.6 0.1 0.6 1 058 036 Q3 137 552 117 195 13 150 619 6 589 12.9 11.0 1.2 0.1 0.6 1 062 368 Q4 141 363 120 757 13 236 625 6 745 13.3 11.4 1.2 0.1 0.6 1 063 355
12 Q1 146 395 125 036 13 228 638 7 493 13.8 11.8 1.2 0.1 0.7 1 061 985 Q2 168 271 146 811 13 283 646 7 532 15.9 13.9 1.3 0.1 0.7 1 058 105 Q3 167 460 147 881 12 889 656 6 034 15.9 14.0 1.2 0.1 0.6 1 055 491
BANCO DE ESPAÑA 266 BOLETÍN ESTADÍSTICO, FEBRUARY 2013

P P P P
P P P P
P A A
1 2 3 4 5 6 7 8 9 10 11 12 13 14 15 16 17 18
13. REGIONAL (AUTONOMOUS) GOVERNMENTS 13.9 Debt according to the excessive deficit procedure (EDP)by regional (autonomous) government (a). Amounts
See notes at the end of the chapter.
EUR millions
Total Anda- Aragón Princ. Illes Cana- Canta- Cas- Cas- Cata- Extre- Gali- La Comun. Región Comun. País Comun. lucía de Balears rias bria tilla- tilla luña madura cia Rioja de de Foral Vasco Valen- Astu- La y Madrid Murcia Nava- (b) ciana rias Mancha León rra
00 39 474 6 977 940 605 509 905 248 603 1 086 10 177 613 3 072 141 4 218 609 648 2 119 6 004 01 43 706 7 217 938 653 516 1 001 289 605 1 270 10 757 711 3 118 164 6 855 685 646 1 627 6 654 02 46 460 7 203 1 086 825 654 929 293 784 1 356 10 830 782 3 157 166 8 614 684 643 1 352 7 101 03 48 995 7 460 1 110 880 858 1 133 372 807 1 436 10 918 782 3 186 184 9 059 685 644 1 498 7 983 04 51 994 7 427 1 134 802 950 1 178 377 1 057 1 451 12 259 783 3 265 193 8 976 748 646 1 387 9 361 05 57 822 7 354 1 153 803 1 589 1 430 411 1 351 1 789 14 544 783 3 381 187 10 099 691 646 1 138 10 474 06 59 068 7 314 1 163 729 1 635 1 563 398 1 543 1 798 14 873 784 3 535 184 10 073 686 647 929 11 212 07 61 039 7 177 1 165 744 1 798 1 562 434 1 829 1 894 15 776 785 3 712 276 10 103 648 645 642 11 849 08 72 625 8 051 1 517 770 2 427 1 883 511 2 584 2 608 20 825 904 3 954 393 10 531 755 868 990 13 052
09 Q4 90 962 9 831 1 890 1 080 3 273 2 352 662 4 288 3 227 25 402 1 086 4 842 507 11 987 1 340 1 085 2 618 15 490
10 Q1 99 403 10 789 2 234 1 077 3 546 3 483 635 4 367 3 142 27 845 1 085 5 304 627 12 123 1 687 1 468 3 413 16 577 Q2 109 152 11 473 2 612 1 309 3 822 3 395 732 5 032 3 450 31 719 1 341 5 604 689 13 004 1 827 1 518 4 021 17 604 Q3 111 992 11 386 2 625 1 407 4 024 3 392 925 5 526 3 661 32 414 1 457 5 869 739 12 994 2 016 1 518 4 194 17 844 Q4 120 778 12 179 2 901 1 701 4 135 3 298 992 6 110 4 304 34 697 1 747 6 161 726 13 503 2 107 1 654 5 015 19 548
11 Q1 126 705 12 855 3 307 1 728 4 439 3 234 1 157 6 407 4 433 37 083 1 821 6 176 870 14 122 2 348 1 854 5 030 19 843 Q2 135 656 13 545 3 332 1 956 4 560 3 422 1 273 6 567 5 071 40 119 2 017 6 923 910 14 810 2 719 1 956 5 382 21 092 Q3 137 552 13 738 3 388 2 042 4 501 3 419 1 329 6 910 5 090 40 868 2 011 6 971 933 15 203 2 759 2 037 5 355 20 998 Q4 141 363 14 314 3 403 2 155 4 432 3 718 1 293 6 886 5 476 42 239 2 021 7 009 900 15 462 2 806 2 410 5 536 21 304
12 Q1 146 395 15 373 3 731 2 242 4 480 3 779 1 301 6 585 5 557 42 461 2 045 7 381 960 16 587 3 055 2 689 6 798 21 370 Q2 168 271 18 136 4 193 2 499 5 516 4 078 1 779 9 710 6 945 45 975 2 281 7 627 1 079 18 365 4 320 2 903 7 153 25 715 Q3 167 460 18 495 4 230 2 395 5 414 4 106 1 756 9 694 6 938 45 754 2 275 7 622 1 081 17 780 4 349 2 894 7 103 25 574
P P P P
P P P P
P A A
1 2 3 4 5 6 7 8 9 10 11 12 13 14 15 16 17 18
13. REGIONAL (AUTONOMOUS) GOVERNMENTS 13.10 Debt according to the excessive deficit procedure (EDP)by regional (autonomous) government (a). As a percentage of GDP mp
See notes at the end of the chapter.
Percentages
Total Anda- Aragón Princ. Illes Cana- Canta- Cas- Cas- Cata- Extre- Gali- La Comun. Región Comun. País Comun. lucía de Balears rias bria tilla- tilla luña madura cia Rioja de de Foral Vasco Valen- Astu- La y Madrid Murcia Nava- (b) ciana rias Mancha León rra
00 6.3 8.3 4.8 4.4 3.2 3.6 3.2 2.8 3.1 8.5 5.8 9.4 2.9 3.8 4.0 5.9 5.3 9.8 01 6.4 8.0 4.5 4.4 3.0 3.6 3.4 2.6 3.4 8.4 6.3 8.9 3.2 5.7 4.1 5.5 3.8 10.0 02 6.4 7.4 4.8 5.2 3.5 3.1 3.2 3.2 3.4 7.9 6.5 8.5 3.1 6.7 3.8 5.2 3.0 10.0 03 6.3 7.0 4.6 5.2 4.4 3.5 3.8 3.0 3.4 7.4 6.0 8.0 3.1 6.5 3.5 4.8 3.1 10.5 04 6.2 6.4 4.4 4.5 4.5 3.4 3.6 3.7 3.2 7.7 5.6 7.6 3.1 6.0 3.5 4.5 2.7 11.4 05 6.4 5.9 4.1 4.1 7.0 3.9 3.6 4.4 3.7 8.6 5.1 7.3 2.8 6.3 3.0 4.2 2.0 11.8 06 6.0 5.4 3.8 3.4 6.7 4.0 3.2 4.7 3.4 8.1 4.8 7.0 2.5 5.8 2.7 3.9 1.5 11.7 07 5.8 5.0 3.5 3.2 6.9 3.7 3.3 5.1 3.3 8.0 4.5 6.9 3.5 5.4 2.4 3.6 1.0 11.6 08 6.7 5.4 4.4 3.3 9.0 4.5 3.9 6.6 4.6 10.4 5.1 6.8 4.7 5.5 2.6 4.7 1.5 12.1
09 Q4 8.7 6.9 5.7 4.8 12.6 5.8 5.2 11.4 5.9 13.1 6.3 8.6 6.4 6.3 4.8 6.1 4.1 15.3
10 Q1 9.5 7.5 6.7 4.8 13.7 8.7 4.9 11.7 5.7 14.3 6.3 9.4 7.9 6.5 6.1 8.1 5.3 16.4 Q2 10.4 8.0 7.9 5.8 14.7 8.4 5.7 13.5 6.2 16.3 7.8 9.9 8.7 7.0 6.6 8.4 6.3 17.5 Q3 10.7 7.9 7.9 6.2 15.5 8.4 7.2 14.8 6.6 16.6 8.4 10.4 9.3 7.0 7.2 8.4 6.5 17.7 Q4 11.5 8.5 8.7 7.5 15.9 8.2 7.7 16.3 7.7 17.8 10.1 10.9 9.1 7.2 7.5 9.1 7.8 19.3
11 Q1 12.0 8.9 9.8 7.5 16.7 7.8 8.8 17.0 7.8 18.7 10.5 10.8 10.8 7.5 8.4 10.0 7.6 19.5 Q2 12.8 9.4 9.8 8.5 17.1 8.2 9.6 17.4 8.9 20.1 11.6 12.1 11.2 7.9 9.7 10.5 8.1 20.6 Q3 12.9 9.5 9.9 8.8 16.8 8.2 10.0 18.2 8.9 20.4 11.5 12.1 11.4 8.0 9.8 10.9 8.1 20.4 Q4 13.3 9.8 10.0 9.3 16.5 8.9 9.7 18.1 9.5 21.1 11.6 12.2 11.0 8.2 10.0 12.9 8.3 20.7
12 Q1 13.8 10.6 11.0 9.7 16.7 9.1 9.8 17.4 9.7 21.2 11.7 12.8 11.8 8.8 10.9 14.4 10.2 20.8 Q2 15.9 12.5 12.4 10.8 20.6 9.8 13.4 25.7 12.1 23.1 13.1 13.3 13.3 9.7 15.4 15.6 10.8 25.1 Q3 15.9 12.8 12.5 10.4 20.3 9.9 13.3 25.7 12.2 23.0 13.1 13.3 13.3 9.5 15.6 15.6 10.7 25.0
BANCO DE ESPAÑA 267 BOLETÍN ESTADÍSTICO, FEBRUARY 2013

P P P P
P P P P
P A A
1 2 3 4 5 6 7 8 9 10 11 12 13 14 15 16 17 18
13. REGIONAL (AUTONOMOUS) GOVERNMENTS PUBLIC ENTERPRISES 13.11 Debt of public enterprises not included in the generalgovernment sector (a), by regional (autonomous)government owner. Amounts
See notes at the end of the chapter.
EUR millions
Total Anda- Aragón Princ. Illes Cana- Canta- Cas- Cas- Cata- Extre- Gali- La Comun. Región Comun. País Comun. lucía de Balears rias bria tilla- tilla luña madura cia Rioja de de Foral Vasco Valen- Astu- La y Madrid Murcia Nava- ciana rias Mancha León rra
00 2 832 185 12 13 46 186 5 45 17 944 1 17 5 393 0 25 76 861 01 3 443 141 12 15 37 222 5 60 18 1 207 10 13 2 441 0 53 68 1 139 02 4 568 144 10 20 36 282 8 435 23 1 634 9 12 7 438 0 60 153 1 298 03 6 217 124 128 25 49 307 9 467 28 2 613 15 17 9 593 0 52 331 1 448 04 6 620 135 145 14 39 332 9 611 41 2 813 14 18 3 559 - 57 382 1 449 05 6 290 125 124 61 44 209 10 698 39 2 663 8 20 9 506 0 159 355 1 262 06 7 687 120 88 94 92 204 19 670 37 3 274 8 178 28 956 - 144 355 1 420 07 9 195 166 218 170 548 217 19 672 54 3 698 4 237 17 924 - 249 538 1 465 08 10 405 195 309 159 712 250 20 635 94 4 480 14 305 25 1 158 29 299 462 1 259
09 Q4 12 839 342 384 215 675 249 35 749 249 5 918 18 211 0 1 321 27 350 693 1 401
10 Q1 13 505 378 388 272 690 253 35 780 264 6 095 15 225 0 1 317 25 319 705 1 745 Q2 13 761 402 417 273 706 250 39 811 280 6 186 15 233 1 1 290 25 309 730 1 794 Q3 13 984 454 424 279 665 261 35 821 296 6 374 10 225 1 1 262 25 319 738 1 793 Q4 13 485 599 464 279 678 244 35 648 349 6 434 18 214 3 1 482 0 323 598 1 117
11 Q1 14 144 616 448 278 700 236 38 647 362 6 814 28 222 3 1 683 - 334 564 1 171 Q2 14 242 664 467 303 690 225 35 690 398 6 792 21 228 0 1 663 - 323 562 1 181 Q3 13 513 662 467 326 688 228 35 80 395 6 700 24 229 1 1 641 0 312 559 1 165 Q4 13 035 714 477 321 666 224 36 79 410 6 368 22 232 1 1 678 0 74 601 1 134
12 Q1 12 360 678 431 338 636 219 35 78 415 6 318 27 231 1 1 676 0 72 75 1 127 Q2 12 358 688 441 327 626 216 38 73 405 6 365 26 228 2 1 648 1 67 93 1 114 Q3 12 182 717 433 337 618 220 38 73 407 6 184 29 232 2 1 593 1 65 102 1 132
P P P P
P P P P
P A A
1 2 3 4 5 6 7 8 9 10 11 12 13 14 15 16 17 18
13. REGIONAL (AUTONOMOUS) GOVERNMENTS PUBLIC ENTERPRISES 13.12 Debt of public enterprises not included in the generalgovernment sector (a), by regional (autonomous)government owner. As a percentage of GDP mp
See notes at the end of the chapter.
Percentages
Total Anda- Aragón Princ. Illes Cana- Canta- Cas- Cas- Cata- Extre- Gali- La Comun. Región Comun. País Comun. lucía de Balears rias bria tilla- tilla luña madura cia Rioja de de Foral Vasco Valen- Astu- La y Madrid Murcia Nava- (b) ciana rias Mancha León rra
00 0.4 0.2 0.1 0.1 0.3 0.7 0.1 0.2 0.1 0.8 0.0 0.1 0.1 0.4 0.0 0.2 0.2 1.4 01 0.5 0.2 0.1 0.1 0.2 0.8 0.1 0.3 0.0 0.9 0.1 0.0 0.0 0.4 0.0 0.5 0.2 1.7 02 0.6 0.1 0.0 0.1 0.2 0.9 0.1 1.8 0.1 1.2 0.1 0.0 0.1 0.3 0.0 0.5 0.3 1.8 03 0.8 0.1 0.5 0.2 0.3 1.0 0.1 1.8 0.1 1.8 0.1 0.0 0.2 0.4 0.0 0.4 0.7 1.9 04 0.8 0.1 0.6 0.1 0.2 1.0 0.1 2.2 0.1 1.8 0.1 0.0 0.0 0.4 - 0.4 0.7 1.8 05 0.7 0.1 0.4 0.3 0.2 0.6 0.1 2.3 0.1 1.6 0.0 0.0 0.1 0.3 0.0 1.0 0.6 1.4 06 0.8 0.1 0.3 0.4 0.4 0.5 0.2 2.0 0.1 1.8 0.0 0.4 0.4 0.5 - 0.9 0.6 1.5 07 0.9 0.1 0.7 0.7 2.1 0.5 0.1 1.9 0.1 1.9 0.0 0.4 0.2 0.5 - 1.4 0.8 1.4 08 1.0 0.1 0.9 0.7 2.6 0.6 0.1 1.6 0.2 2.2 0.1 0.5 0.3 0.6 0.1 1.6 0.7 1.2
09 Q4 1.2 0.2 1.2 1.0 2.6 0.6 0.3 2.0 0.5 3.1 0.1 0.4 0.0 0.7 0.1 2.0 1.1 1.4
10 Q1 1.3 0.3 1.2 1.2 2.7 0.6 0.3 2.1 0.5 3.1 0.1 0.4 0.0 0.7 0.1 1.8 1.1 1.7 Q2 1.3 0.3 1.3 1.2 2.7 0.6 0.3 2.2 0.5 3.2 0.1 0.4 0.0 0.7 0.1 1.7 1.1 1.8 Q3 1.3 0.3 1.3 1.2 2.6 0.6 0.3 2.2 0.5 3.3 0.1 0.4 0.0 0.7 0.1 1.8 1.1 1.8 Q4 1.3 0.4 1.4 1.2 2.6 0.6 0.3 1.7 0.6 3.3 0.1 0.4 0.0 0.8 0.0 1.8 0.9 1.1
11 Q1 1.3 0.4 1.3 1.2 2.6 0.6 0.3 1.7 0.6 3.4 0.2 0.4 0.0 0.9 - 1.8 0.9 1.1 Q2 1.3 0.5 1.4 1.3 2.6 0.5 0.3 1.8 0.7 3.4 0.1 0.4 0.0 0.9 - 1.7 0.8 1.2 Q3 1.3 0.5 1.4 1.4 2.6 0.5 0.3 0.2 0.7 3.3 0.1 0.4 0.0 0.9 0.0 1.7 0.8 1.1 Q4 1.2 0.5 1.4 1.4 2.5 0.5 0.3 0.2 0.7 3.2 0.1 0.4 0.0 0.9 0.0 0.4 0.9 1.1
12 Q1 1.2 0.5 1.3 1.5 2.4 0.5 0.3 0.2 0.7 3.2 0.2 0.4 0.0 0.9 0.0 0.4 0.1 1.1 Q2 1.2 0.5 1.3 1.4 2.3 0.5 0.3 0.2 0.7 3.2 0.1 0.4 0.0 0.9 0.0 0.4 0.1 1.1 Q3 1.2 0.5 1.3 1.5 2.3 0.5 0.3 0.2 0.7 3.1 0.2 0.4 0.0 0.8 0.0 0.3 0.2 1.1
BANCO DE ESPAÑA 268 BOLETÍN ESTADÍSTICO, FEBRUARY 2013

NOTES TO THE TABLES OF CHAPTER 13: REGIONAL (AUTOMOMOUS) GOVERNMENTS
Table 13.1
a. The differences between the net lending (+) or net borrowing (-) of the Spanish National Accounts and according to the
EDP arise from the inclusion in the non-financial transactions account of interest rate swaps, in accordance with Regulation
(EC) No 2558/2001 of 3 December 2001, so that the profits (losses) on swaps transactions reduce (increase) interest. In the
National Accounts, interest rate swaps are considered to be a financial transaction.
b. A positive (negative) sign indicates that regional (autonomous) governments have obtained profits (losses) in respect of
this item.
c. Liabilities issued by Regional (autonomous) Governments and held by other Regional (autonomous) Governments, other
accounts payable and adjustments for differences between the market value and the nominal value of the liabilities net
incurrence of shares and other equity (PF.5), as well as other adjustments resulting from the reclassification of institutional
units and other changes in the information.
d. The figures for GDP at market prices are calculated using the official series of the Spanish Quarterly National Accounts
(CNE) published by the INE, by aggregating the last four quarters as at each reference date.
Table 13.2
Note: The quarterly percentages are calculated: 1) When the GDP for the four quarters of the year in question is available,
using the GDP for that year; 2) when the GDP for the four quarters of the year in question in not available, using the annual
GDP obtained by aggregating the quarterly GDP figures for the last four quarters.
See notes to Table 13.1.
Table 13.3
a. Annual change in column 11 of Table 13.1.
b. Column 3 of Table 13.1 with the opposite sign.
c. A positive figure means that this item increases debt and a negative figure means that it decreases debt.
d. Breakdown of column in Table 13.5.
e. Includes effects such as those produced by the reclassification of institutional units or financial instruments.
f. Includes adjustments for interest accrued less interest paid, for issue or redemption premiums, for the difference
between the nominal and cash amount of discounted issues, for capital losses or gains arising from early payment of
liabilities and net incurrence of shares and other equity (PF.5).
Table 13.4
See notes to Table 13.3.
Table 13.7
a. A breakdown of issues into those denominated in euro and those denominated in currencies other than the euro is given
in Table 21.18 The difference between column 3 of this table, 'total debt securities issued' and column 1 of table 21.18
'total debt securities issued excluding financial derivatives' arises from the fact that debt according to the methodology of
the excessive deficit procedure takes into account the currency swaps carried out by the various regional (autonomous)
governments.
Table 13.8
a. Includes the governing bodies of the regional (autonomous) governments.
b. The figures for GDP at market prices are calculated using the official series of the Spanish Quarterly National Accounts
(CNE) published by the INE, by aggregating the last four quarters as at each reference date.
Table 13.9
a. Each regional (autonomous) government includes the units concerned with the general administration of the region, the
universities located within its territory and those bodies and enterprises reporting to the regional (autonomous) government
that are classified under general government. The Autonomous Cities of Ceuta and Melilla are classified in subsector Local
Governments of the national accounting system.
b. The provincial councils of the Basque Country are classified in subsector Local Governments of the national accounting
system. Table 14.8, column 16, provides information about the debt of the provincial councils of the Basque Country
Table 13.10
c. The figures for GDP at market prices used for the total are calculated using the official series of the Spanish Quarterly
National Accounts (CNE) published by the INE, by aggregating the last four quarters as at each reference date. For the
individual regional (autonomous) governments, until 2008, the regional GDP mp published in the Spanish Regional
Accounts (CRE) of the INE has been used for the years the information was available. For the rest of years, the structure of
the last regional GDP mp figure published by the INE has been applied to the national GDP mp.
See notes to Table 13.9.
BANCO DE ESPAÑA 269 BOLETÍN ESTADÍSTICO, FEBRUARY 2013

Table 13.11
a. The units included here as public enterprises are the main non-administrative agencies, entities and enterprises of the
regional (autonomous) governments, which are classified as Public Administration. For ease of comparison with the general
government debt shown in the previous tables (which is public debt, as narrowly defined), the debt of public enterprises
shown in this table has been calculated using EDP methodology. The debt of public enterprises does not fall within the
scope of the EDP, and therefore, unlike the debt of general government (public debt), it is not included in the notifications
sent to the European Commission.
Table 13.12
b. The figures for GDP at market prices used for the total are calculated using the official series of the Spanish Quarterly
National Accounts (CNE) published by the INE, by aggregating the last four quarters as at each reference date. For the
individual regional (autonomous) governments, until 2008, the regional GDP mp published in the Spanish Regional
Accounts (CRE) of the INE has been used for the years the information was available. For the rest of the years, the structure
of the last regional GDP mp figure published by the INE has been applied to the national GDP mp.
See notes to Table 13.11.
BANCO DE ESPAÑA 270 BOLETÍN ESTADÍSTICO, FEBRUARY 2013

CHAPTER 14 LOCAL GOVERNMENTS

P P
1 2 3=1+2 4 5=6+7+10 6 7=8+9 8 9 10 11=4-5 12
14. LOCAL GOVERNMENTS 14.1 Net lending (+) or net borrowing (-), liabilitiesoutstanding and debt according to the excessivedeficit procedure (EDP). Amounts
Net lending (+) or net borrowing (-): INE and IGAE. GDP mp: INE. EUR millions
Net lending(+) or net borrowing(-) (a) Liabilities outstanding and debt according to the EDP Memorandum item: GDP mp (d)
According to Interest According Liabilities Adjustments for liabilities not included in EDP debt Debt the Spanish rate swaps to the EDP outstanding and valuation and other adjustments (c) according National adjustment according to to the Accounts (b) the Financial EDP (CNE) Accounts of Total Local go- Other accounts payable Valuation
the Spanish vernments´ and other Economy EDP debt adjust- held by Total Held by Rest ments other local other governments general govern- ment units
00 584 - 584 28 428 8 635 - 8 447 320 8 127 188 19 793 629 907 01 -256 - -256 29 070 8 901 - 8 695 43 8 652 206 20 170 680 397 02 -860 - -860 31 271 9 750 - 9 539 24 9 515 210 21 522 729 258 03 -1 903 3 -1 900 33 021 10 107 - 9 944 25 9 919 164 22 914 783 082 04 112 3 115 34 839 10 686 - 10 523 12 10 511 163 24 153 841 294 05 -548 3 -545 39 000 13 465 - 13 313 23 13 290 152 25 535 909 298 06 765 2 767 42 404 14 834 - 14 732 24 14 708 101 27 570 985 547 07 -3 233 6 -3 227 46 084 16 700 - 16 608 20 16 588 92 29 385 1 053 161 08 -5 335 7 -5 328 50 492 18 717 - 18 620 26 18 594 97 31 775 1 087 788 09 -5 860 -1 -5 861 54 749 20 049 - 19 972 49 19 923 76 34 700 1 048 060 10 -7 036 -20 -7 056 59 438 24 007 - 24 069 1 508 22 561 -62 35 431 1 048 883 11 -8 991 37 -8 954 64 958 29 539 - 29 653 5 389 24 264 -115 35 420 1 063 355
P P P
P P A
See notes at the end of the chapter.
11 Q2 ... ... ... 58 427 20 789 - 20 875 1 379 19 496 -87 37 638 1 058 036 Q3 ... ... ... 57 866 21 165 - 21 204 1 280 19 924 -39 36 701 1 062 368 Q4 ... ... ... 64 958 29 539 - 29 653 5 389 24 264 -115 35 420 1 063 355
12 Q1 ... ... ... 62 915 26 056 - 26 172 5 107 21 065 -116 36 860 1 061 985 Q2 ... ... ... 64 622 19 627 - 19 910 4 825 15 085 -283 44 995 1 058 105 Q3 ... ... ... 64 457 20 656 - 20 875 4 570 16 305 -220 43 802 1 055 491
P P
1 2 3=1+2 4 5=6+7+10 6 7=8+9 8 9 10 11=4-5 12
14. LOCAL GOVERNMENTS 14.2 Net lending (+) or net borrowing (-), liabilitiesoutstanding and debt according to the excessivedeficit procedure (EDP). As a percentage of GDP mp
Net lending (+) or net borrowing (-): INE and IGAE. GDP mp: INE. Percentages
Net lending(+) or net borrowing(-) (a) Liabilities outstanding and debt according to the EDP Memorandum item: GDP mp (d)
According to Interest According Liabilities Adjustments for liabilities not included in EDP debt Debt (EUR the Spanish rate swaps to the EDP outstanding and valuation and other adjustments (c) according millions) National adjustment according to to the Accounts (b) the Financial EDP (CNE) Accounts of Total Local go- Other accounts payable Valuation
the Spanish vernments´ and other Economy EDP debt adjust- held by Total Held by Rest ments other local other governments general govern- ment units
00 0.1 - 0.1 4.5 1.4 - 1.3 0.1 1.3 0.0 3.1 629 907 01 -0.0 - -0.0 4.3 1.3 - 1.3 0.0 1.3 0.0 3.0 680 397 02 -0.1 - -0.1 4.3 1.3 - 1.3 0.0 1.3 0.0 3.0 729 258 03 -0.2 0.0 -0.2 4.2 1.3 - 1.3 0.0 1.3 0.0 2.9 783 082 04 0.0 0.0 0.0 4.1 1.3 - 1.3 0.0 1.2 0.0 2.9 841 294 05 -0.1 0.0 -0.1 4.3 1.5 - 1.5 0.0 1.5 0.0 2.8 909 298 06 0.1 0.0 0.1 4.3 1.5 - 1.5 0.0 1.5 0.0 2.8 985 547 07 -0.3 0.0 -0.3 4.4 1.6 - 1.6 0.0 1.6 0.0 2.8 1 053 161 08 -0.5 0.0 -0.5 4.6 1.7 - 1.7 0.0 1.7 0.0 2.9 1 087 788 09 -0.6 -0.0 -0.6 5.2 1.9 - 1.9 0.0 1.9 0.0 3.3 1 048 060 10 -0.7 -0.0 -0.7 5.7 2.3 - 2.3 0.1 2.2 -0.0 3.4 1 048 883 11 -0.8 0.0 -0.8 6.1 2.8 - 2.8 0.5 2.3 -0.0 3.3 1 063 355
P P P
P P A
See notes at the end of the chapter.
11 Q2 ... ... ... 5.5 2.0 - 2.0 0.1 1.8 -0.0 3.6 1 058 036 Q3 ... ... ... 5.4 2.0 - 2.0 0.1 1.9 -0.0 3.5 1 062 368 Q4 ... ... ... 6.1 2.8 - 2.8 0.5 2.3 -0.0 3.3 1 063 355
12 Q1 ... ... ... 5.9 2.5 - 2.5 0.5 2.0 -0.0 3.5 1 061 985 Q2 ... ... ... 6.1 1.9 - 1.9 0.5 1.4 -0.0 4.3 1 058 105 Q3 ... ... ... 6.1 2.0 - 2.0 0.4 1.5 -0.0 4.1 1 055 491
BANCO DE ESPAÑA 272 BOLETÍN ESTADÍSTICO, FEBRUARY 2013

P P
1=2+3+6 2 3=4+5 4 5 6=7+10+ 7=8+9 8 9 10 11 12 13
14. LOCAL GOVERNMENTS 14.3 Reconciliation between net borrowing and thechange in debt according to the excessivedeficit procedure (EDP). Amounts
See notes at the end of the chapter.
INE, IGAE and Banco de España EUR millions
Change in Net Net acquisiton of debt accor- borrowing(+) financial assets (c)(d) Adjustments (c) ding to the or net EDP (a) lending(-)
according Total Vis-à-vis Rest Total Other accounts payable Other finan- Due to Other Other to the EDP general cial tran- changes changes in adjust- (b) govern- sactions in the debt volu- ments ment Total Vis-à-vis Rest within exchange me (e) (f) other ge- local go- rate neral go- vernments vernment units 11+12+13
00 137 -584 1 511 -57 1 568 -791 -779 -2 -777 - 21 - -32 01 377 256 331 33 298 -210 -211 278 -488 - 28 - -28 02 1 352 860 1 324 148 1 176 -832 -823 19 -842 - 25 - -34 03 1 392 1 900 -113 63 -176 -395 -366 -1 -365 - -0 - -29 04 1 239 -115 1 904 33 1 871 -550 -526 13 -539 - 2 - -26 05 1 382 545 3 701 40 3 661 -2 865 -2 845 -11 -2 834 - -4 - -16 06 2 036 -767 4 336 30 4 307 -1 534 -1 514 -1 -1 513 - -0 - -19 07 1 814 3 227 329 31 298 -1 741 -1 732 4 -1 736 - -1 - -9 08 2 390 5 328 -789 325 -1 114 -2 149 -2 124 -6 -2 118 - 1 - -26 09 2 925 5 861 -1 618 -222 -1 396 -1 318 -1 283 -23 -1 260 - -0 - -35 10 731 7 056 -2 213 -42 -2 171 -4 112 -4 057 -1 459 -2 598 - 1 - -56 11 -11 8 954 -3 401 -138 -3 263 -5 564 -5 579 -3 881 -1 698 - 0 - 15
P P
1=2+3+6 2 3=4+5 4 5 6=7+10+ 7=8+9 8 9 10 11 12 13
14. LOCAL GOVERNMENTS 14.4 Reconciliation between net borrowing and thechange in debt according to the excessivedeficit procedure (EDP). As a percentage of GDP mp
See notes at the end of the chapter.
INE, IGAE and Banco de España Percentages
Change in Net Net acquisiton of debt accor- borrowing(+) financial assets (c)(d) Adjustments (c) ding to the or net EDP (a) lending(-)
according Total Vis-à-vis Rest Total Other accounts payable Other finan- Due to Other Other to the EDP general cial tran- changes changes in adjust- (b) govern- sactions in the debt volu- ments ment Total Vis-à-vis Rest within exchange me (e) (f) other ge- local go- rate neral go- vernments vernment units 11+12+13
00 0.0 -0.1 0.2 -0.0 0.2 -0.1 -0.1 -0.0 -0.1 - 0.0 - -0.0 01 0.1 0.0 0.0 0.0 0.0 -0.0 -0.0 0.0 -0.1 - 0.0 - -0.0 02 0.2 0.1 0.2 0.0 0.2 -0.1 -0.1 0.0 -0.1 - 0.0 - -0.0 03 0.2 0.2 -0.0 0.0 -0.0 -0.1 -0.0 -0.0 -0.0 - -0.0 - -0.0 04 0.1 -0.0 0.2 0.0 0.2 -0.1 -0.1 0.0 -0.1 - 0.0 - -0.0 05 0.2 0.1 0.4 0.0 0.4 -0.3 -0.3 -0.0 -0.3 - -0.0 - -0.0 06 0.2 -0.1 0.4 0.0 0.4 -0.2 -0.2 -0.0 -0.2 - -0.0 - -0.0 07 0.2 0.3 0.0 0.0 0.0 -0.2 -0.2 0.0 -0.2 - -0.0 - -0.0 08 0.2 0.5 -0.1 0.0 -0.1 -0.2 -0.2 -0.0 -0.2 - 0.0 - -0.0 09 0.3 0.6 -0.2 -0.0 -0.1 -0.1 -0.1 -0.0 -0.1 - -0.0 - -0.0 10 0.1 0.7 -0.2 -0.0 -0.2 -0.4 -0.4 -0.1 -0.2 - 0.0 - -0.0 11 -0.0 0.8 -0.3 -0.0 -0.3 -0.5 -0.5 -0.4 -0.2 - 0.0 - 0.0
BANCO DE ESPAÑA 273 BOLETÍN ESTADÍSTICO, FEBRUARY 2013

P P
P P P P
P P A
1=2+6+10+ 2=3+4+5 3 4 5 6=7+8+9 7 8 9 10 11=12+13 12 13 14 15
14. LOCAL GOVERNMENTS 14.5 Net acquisition of financial assets
EUR millions
Total Currency and deposits Securities other than shares Loans Shares and other equity Other Memoran- accounts dum item: receiva- financial Total Deposits Other Other Total Short- Long- Finan- Total Shares Other ble assets with the trans- depo- term term cial equity vis-à-vis Banco de ferable sits deri- general España deposits vati- govern- ves ment
11+14
00 1 511 1 585 9 1 059 517 2 - 2 - - -30 -20 -10 -45 -57 01 331 349 -5 284 70 2 - 2 - - 14 -1 15 -33 33 02 1 324 1 224 3 1 033 188 4 - 4 - - 35 22 13 61 148 03 -113 -245 -1 -157 -87 2 - 5 -3 - 278 268 10 -148 63 04 1 904 1 731 -2 1 235 498 2 - 5 -3 - 20 10 10 150 33 05 3 701 3 253 1 2 468 784 2 - 5 -3 3 247 212 34 196 40 06 4 336 4 084 -1 2 290 1 795 3 - 5 -2 -2 172 148 24 80 30 07 329 139 0 -208 347 -1 - 5 -6 3 100 86 14 88 31 08 -789 -1 161 0 -946 -215 -2 - 5 -7 83 96 79 18 195 325 09 -1 618 -1 354 -0 -1 250 -103 6 - 5 1 112 -16 -12 -4 -366 -222 10 -2 213 -1 976 -1 -1 221 -754 25 - 5 20 59 -161 -149 -12 -160 -42 11 -3 401 -3 216 -3 -2 241 -972 -32 - 5 -37 -23 46 42 4 -176 -138
11 Q1 -1 792 -1 613 -1 -1 487 -126 1 - 1 - -6 12 11 1 -186 -149 Q2 -766 -588 -3 -291 -295 1 - 1 - -6 12 11 1 -185 -186 Q3 -652 -644 1 -431 -214 1 - 1 - -6 11 10 1 -16 -17 Q4 -191 -371 -0 -33 -338 -36 - 1 -37 -6 11 10 1 211 213
12 Q1 -615 -640 0 -547 -93 10 - -0 10 -2 -4 -2 -2 21 7 Q2 899 1 082 -1 660 423 10 - 0 10 -2 -0 1 -2 -191 -192 Q3 1 194 1 271 1 388 882 10 - - 10 -2 -4 -2 -2 -81 -77
BANCO DE ESPAÑA 274 BOLETÍN ESTADÍSTICO, FEBRUARY 2013

ME
MO
RA
ND
UM
ITE
M:
WIT
HIN
TH
E G
EN
ER
AL
GO
VE
RN
ME
NT
____
____
____
____
____
____
____
____
____
____
____
____
____
____
____
____
____
____
____
____
____
____
____
____
____
____
____
____
____
____
____
____
____
____
____
____
____
____
____
____
____
____
____
____
____
____
14 C
OR
PO
RA
CIO
NE
S L
OC
AL
ES
14.6
Deu
da
seg
ún
el P
roto
colo
de
Déf
icit
Exc
esiv
o (
PD
E).
Res
um
en g
ener
al
Dato
s r
efe
ridos a
Septiem
bre
de 2
012
Mill
ones d
e e
uro
s
Val
ores
dis
tinto
s de
acc
ione
s/
Securities o
ther
than s
hare
s
Pré
stam
os/lo
an
s
In
stut
ionc
es fi
nanc
iera
s
A
dmin
istr
ació
n
Ser
ie e
n
Tot
al
res
iden
tes
/ Resid
ent financia
l
Cen
tral
/
Aso
ciac
ione
s c
uadr
o y
T
otal
Cor
to
La
rgo
institu
tions
Res
to
C
entr
al
Púb
lico-
c
olum
na/
pl
azo
/
plaz
o/
d
el
G
overn
ment
P
rivad
as
Tim
e
S
hort
-
Long-
T
otal
mun
do/
(A
PP
s)/
series
term
term
Tot
al
Cor
to p
lazo
Lar
go p
lazo
R
est
Fon
do p
ara
la
P
ublic
-
in table
/S
hort
-
/Long-
of th
e
Fin
anci
ació
n
-Private
a
nd
te
rm
te
rm
w
orld
de
los
Pag
os a
Part
ners
hip
s
colu
mn
Pro
veed
ores
(P
PP
s)
+
11+
12
(
FF
PP
)
1
2=
3+6
3
=4+
5
4
5
6=
7+10
7
=8+
9
8
9
10
11
12
TO
TA
L.
..
..
..
..
..
..
..
..
..
..
.14
.8/1
43 8
02
1 78
4 -
1 78
4 42
017
30
463
2
567
27 8
96
2 78
3 8
689
82
TO
TA
L
1. A
yunt
amie
ntos
..
..
..
..
..
..
..
..
.14
.8/3
36 1
73
1 33
0 -
1 33
0 34
843
23
911
1
862
22 0
49
2 37
5 8
557
-
1. M
unic
ipal
ities
C
apita
les
de p
rovi
ncia
..
..
..
..
..
..
..
14.8
/416
065
1
330
- 1
330
14 7
35
10 4
48
640
9 80
7 2
265
2 02
2 -
Pro
vinc
ial c
apita
ls
Más
de
500.
000
habi
tant
es.
..
..
..
..
..
14.8
/511
652
1
330
- 1
330
10 3
22
6 73
2 44
5 6
287
2 22
6 1
364
-
Mor
e th
an 5
00.0
00 in
hab.
B
arce
lona
..
..
..
..
..
..
..
..
.14
.8/6
1 11
5 14
0 -
140
975
685
0 68
5 29
0 -
-
Bar
celo
na
Mad
rid
..
..
..
..
..
..
..
..
..
14.8
/77
358
1 19
0 -
1 19
0 6
168
3 36
9 34
9 3
019
1 78
3 1
017
-
Mad
rid
M
álag
a
..
..
..
..
..
..
..
..
.14
.8/8
749
- -
- 74
9 72
5 -
725
24
- -
M
álag
a
S
evill
a
.
..
..
..
..
..
..
..
..
.14
.8/9
442
- -
- 44
2 43
5 46
38
9 8
- -
S
evill
a
Val
enci
a
.
..
..
..
..
..
..
..
..
14.8
/10
1 04
1 -
- -
1 04
1 73
5 1
734
123
183
-
Val
enci
a
Zar
agoz
a
.
..
..
..
..
..
..
..
..
14.8
/11
948
- -
- 94
8 78
4 49
73
4 -
164
-
Zar
agoz
a
R
esto
de
capi
tale
s de
pro
vinc
ia
..
..
..
..
.14
.8/1
24
413
- -
- 4
413
3 71
6 19
5 3
521
39
659
-
Oth
er p
rovi
ncia
l cap
itals
N
o ca
pita
les
de p
rovi
ncia
..
..
..
..
..
..
.14
.8/1
320
109
-
- -
20 1
09
13 4
64
1 22
2 12
242
11
1 6
534
-
N
on p
rovi
ncia
l cap
itals
2. D
iput
acio
nes,
Con
sejo
s y
Cab
ildos
Insu
lare
s.
..
.14
.8/1
47
254
454
- 45
4 6
800
6 25
9 68
7 5
572
407
51
82
2. P
rovi
ncia
l Gov
ernm
ents
D
iput
acio
nes
de R
égim
en C
omún
..
..
..
..
.14
.8/1
53
987
0 -
0 3
987
3 83
8 45
3 3
385
69
- 81
Ord
inar
y re
gim
e
D
iput
acio
nes
For
ales
del
Paí
s V
asco
..
..
..
..
14.8
/16
2 31
1 14
0 -
140
2 17
1 1
847
234
1 61
2 32
4 -
-
S
peci
fic S
tatu
s
Con
sejo
s y
Cab
ildos
Insu
lare
s..
..
..
..
..
.14
.8/1
795
5 31
4 -
314
641
575
0 57
5 14
51
1
Isla
nd A
utho
ritie
s
3. C
iuda
des
Aut
ónom
as.
..
..
..
..
..
..
.14
.8/1
837
4 -
- -
374
292
17
275
- 82
-
Aut
onom
ous
citie
s
PR
O M
EM
OR
IA:
EM
PR
ES
AS
PÚ
BL
ICA
S N
O
..
..
..
..
..
14.7
/11
9 04
2 -
- -
9 04
2 7
674
523
7 15
1 1
368
- -
P
UB
LIC
EN
TE
RP
RIS
ES
NO
T IN
CL
UD
ED
INC
LU
IDA
S E
N E
L S
EC
TO
R A
AP
P
Septe
mber
201
2 d
ata
EU
R m
illio
ns
14.6
Deb
t ac
cord
ing
to
th
e E
xces
sive
Def
icit
Pro
ced
ure
(E
DP
). G
ener
al S
um
mar
y14
LO
CA
L G
OV
ER
NM
EN
TS
BANCO DE ESPAÑA 275 BOLETÍN ESTADÍSTICO, FEBRUARY 2013

P P P P
P P P P
P P A
1=3+4+7 2 3 4=5+6 5 6 7=8+9 8 9 10=11+12 11 12
14. LOCAL GOVERNMENTS 14.7 Debt according to the excessive deficit procedure (EDP)by instruments
See notes at the end of the chapter.
EUR millions and percentages Currency Memorandum item: and Securities other Debt according to the EDP held by
Total deposits than shares (a) Loans other general government units
Total Short- Long- Total Short- Long- Total Fondo para Rest term term term term la Financia- As a per- ción de los centage Pagos a GDP mp Proveedores (FFPP)
00 19 793 3.1 - 2 161 0 2 161 17 632 1 243 16 389 - - - 01 20 170 3.0 - 2 101 0 2 101 18 069 1 365 16 703 - - - 02 21 522 3.0 - 2 295 0 2 295 19 226 1 616 17 610 - - - 03 22 914 2.9 - 2 258 0 2 258 20 656 1 887 18 769 - - - 04 24 153 2.9 - 2 242 0 2 242 21 911 1 746 20 165 - - - 05 25 535 2.8 - 2 233 0 2 233 23 301 1 524 21 777 - - - 06 27 570 2.8 - 2 461 - 2 461 25 109 1 406 23 702 - - - 07 29 385 2.8 - 2 593 - 2 593 26 792 1 703 25 089 - - - 08 31 775 2.9 - 2 579 - 2 579 29 196 2 852 26 345 - - -
09 Q4 34 700 3.3 - 2 440 - 2 440 32 260 2 392 29 868 - - -
10 Q1 36 167 3.5 - 2 440 - 2 440 33 728 3 897 29 830 - - - Q2 36 514 3.5 - 2 410 - 2 410 34 104 4 114 29 990 - - - Q3 36 220 3.5 - 2 410 - 2 410 33 810 3 743 30 067 - - - Q4 35 431 3.4 - 2 326 - 2 326 33 105 1 570 31 535 - - -
11 Q1 37 344 3.5 - 2 226 - 2 226 35 118 3 519 31 599 - - - Q2 37 638 3.6 - 2 196 - 2 196 35 442 3 910 31 533 - - - Q3 36 701 3.5 - 2 196 - 2 196 34 506 3 505 31 000 - - - Q4 35 420 3.3 - 1 904 - 1 904 33 516 1 434 32 082 - - -
12 Q1 36 860 3.5 - 1 904 - 1 904 34 955 3 042 31 914 - - - Q2 44 995 4.3 - 1 784 - 1 784 43 211 3 239 39 972 8 689 8 689 - Q3 43 802 4.1 - 1 784 - 1 784 42 017 2 567 39 451 8 689 8 689 -
P P P P
P P P P
P P A
1=3+ 2 3=4+13 4=5+12 5=6a11 6 7 8 9 10 11 12 13 14= 15 16 17 18
14. LOCAL GOVERNMENTS 14.8 Debt according to the excessive deficit procedure (EDP)by type of local government (a)
See notes at the end of the chapter.
EUR millions and percentages Municipalities and municipal groupings Provincial and Island
Total Authorities Auto- no- As a Provincial capitals mous percen- Ordi- Speci- Is- ci- tage nary fic land ties of More than 500.000 inhabitants Other Total regime Status Au- GDP mp Total pro- tho- (b) Total vin- Rest ri- Barce- Madrid Mála- Sevi- Valen- Zara- cial ties Total lona ga lla cia goza capi- lares tals
14+18 15a17
00 19 793 3.1 14 936 6 735 3 760 1 239 990 198 340 450 543 2 975 8 201 4 765 3 003 1 320 443 91 01 20 170 3.0 15 359 6 885 3 796 1 153 1 033 237 318 480 575 3 089 8 474 4 728 2 940 1 252 536 83 02 21 522 3.0 16 412 7 166 4 002 1 259 1 137 244 267 584 511 3 164 9 246 5 014 3 067 1 337 611 95 03 22 914 2.9 17 719 7 748 4 509 1 245 1 455 347 293 640 529 3 239 9 971 5 095 3 039 1 361 694 100 04 24 153 2.9 18 786 8 365 5 182 1 207 2 124 412 302 634 503 3 183 10 422 5 243 3 133 1 313 797 123 05 25 535 2.8 20 092 9 589 6 450 1 148 3 337 443 341 714 468 3 139 10 503 5 320 3 066 1 388 866 123 06 27 570 2.8 22 177 11 370 8 154 1 061 5 040 489 366 716 482 3 216 10 807 5 279 3 110 1 281 888 114 07 29 385 2.8 23 874 12 278 9 192 928 6 039 529 384 737 574 3 087 11 596 5 392 3 147 1 318 927 118 08 31 775 2.9 26 058 13 313 9 984 770 6 682 618 422 802 690 3 329 12 745 5 581 3 156 1 508 918 136
09 Q4 34 700 3.3 28 732 14 332 10 361 753 6 762 738 522 835 752 3 970 14 400 5 669 3 248 1 472 949 299
10 Q1 36 167 3.5 29 612 14 963 10 915 703 7 314 725 524 877 771 4 048 14 649 6 263 3 811 1 496 956 293 Q2 36 514 3.5 29 505 14 800 10 792 794 7 145 712 519 862 760 4 008 14 705 6 702 4 043 1 636 1 024 306 Q3 36 220 3.5 29 272 14 709 10 755 794 7 134 694 491 872 770 3 955 14 563 6 650 4 012 1 629 1 009 297 Q4 35 431 3.4 28 904 14 429 10 490 1 202 6 453 743 454 890 748 3 939 14 475 6 211 3 403 1 807 1 001 316
11 Q1 37 344 3.5 29 985 15 046 10 984 1 102 7 008 728 471 885 790 4 062 14 939 7 050 4 239 1 810 1 001 308 Q2 37 638 3.6 29 637 14 754 10 772 1 091 6 819 735 482 867 778 3 982 14 883 7 709 4 422 2 292 995 292 Q3 36 701 3.5 29 224 14 743 10 810 1 091 6 891 721 474 860 773 3 933 14 481 7 169 4 139 2 030 1 000 308 Q4 35 420 3.3 28 529 14 183 10 288 1 090 6 348 755 452 886 757 3 895 14 346 6 571 3 585 2 093 893 320
12 Q1 36 860 3.5 29 343 14 755 10 716 1 090 6 733 760 457 880 796 4 039 14 588 7 195 4 175 2 071 949 322 Q2 44 995 4.3 36 980 16 322 11 769 1 115 7 496 757 449 1 046 907 4 552 20 659 7 605 4 286 2 359 960 410 Q3 43 802 4.1 36 173 16 065 11 652 1 115 7 358 749 442 1 041 948 4 413 20 109 7 254 3 987 2 311 955 374
BANCO DE ESPAÑA 276 BOLETÍN ESTADÍSTICO, FEBRUARY 2013

NOTES TO THE TABLES OF CHAPTER 14
Table 14.1
a. The differences between the net lending (+) or net borrowing (-) of the Spanish National Accounts and according to the
EDP arise from the inclusion in the non-financial transactions account of interest rate swaps, in accordance with Regulation
(EC) No 2558/2001 of 3 December 2001, so that the profits (losses) on swaps transactions reduce (increase) interest. In the
National Accounts, interest rate swaps are considered to be a financial transaction.
b. A positive (negative) sign indicates that Local Governments have obtained profits (losses) in respect of this item.
c. Liabilities issued by Local Governments and held by other Local Governments, other accounts payable and adjustments
for differences between the market value and the nominal value of the liabilities net incurrence of shares and other equity
(PF.5), as well as other adjustments resulting from the reclassification of institutional units and other changes in the
information.
d. The figures for GDP at market prices are calculated using the official series of the Spanish Quarterly National Accounts
(CNE) published by the INE, by aggregating the last four quarters as at each reference date.
Table 14.2
Note: The quarterly percentages are calculated: 1) When the GDP for the four quarters of the year in question is available,
using the GDP for that year; 2) when the GDP for the four quarters of the year in question in not available, using the annual
GDP obtained by aggregating the quarterly GDP figures for the last four quarters.
See notes to Table 14.1.
Table 14.3
a. Annual change in column 11 of Table 14.1.
b. Column 3 of Table 13.1 with the opposite sign.
c. A positive figure means that this item increases debt and a negative figure means that it decreases debt.
d. Breakdown of column in Table 14.5.
e. Includes effects such as those produced by the reclassification of institutional units or financial instruments.
f. Includes adjustments for interest accrued less interest paid, for issue or redemption premiums, for the difference
between the nominal and cash amount of discounted issues, for capital losses or gains arising from early payment of
liabilities and net incurrence of shares and other equity (PF.5).
Table 14.4
See notes to Table 14.3.
Table 14.7
a. A breakdown of issues into those denominated in euro and those denominated in currencies other than the euro is given
in Table 21.18.
Table 14.8
a. Classified under local government are the municipal, ordinary-regime and specific-status provincial and island
authorities, municipal groupings, and those bodies and enterprises subordinate to local government that are classified
under general government.
b. The figures for GDP at market prices are calculated using the official series of the Spanish Quarterly National Accounts
(CNE) published by the INE, by aggregating the last four quarters as at each reference date.
BANCO DE ESPAÑA 277 BOLETÍN ESTADÍSTICO, FEBRUARY 2013


CHAPTER 15 NON FINANCIAL CORPORATIONS: SUMMARY INFORMATION COMPILED BY THE
CENTRAL BALANCE SHEET DATA OFFICE

____
____
____
____
____
____
____
____
____
____
____
____
____
____
____
____
____
____
____
____
____
____
____
____
____
____
____
____
____
____
____
____
____
____
____
____
____
____
____
____
____
____
____
____
____
____
See
not
es a
t the
end
of t
he c
hapt
er.
15
NO
N-F
INA
NC
IAL
CO
RP
OR
AT
ION
S:
15.A
All
span
ish
no
n-f
inan
cial
co
rpo
rati
on
s an
d t
ho
se c
ove
red
S
um
mar
y in
form
atio
n c
om
pile
d b
y th
e C
entr
al B
alan
ce S
hee
t D
ata
Off
ice
by
the
dat
abas
es o
f th
e C
entr
al B
alan
ce S
hee
t O
ffic
e (C
B).
Decem
ber
2010 d
ata
(2012 N
ovem
ber
update
)N
um
ber
of
corp
ora
tions
TO
TA
L
C
orpo
ratio
ns w
ith u
p to
50
empl
oyee
s
Cor
pora
tions
with
ove
r 50
em
ploy
ees
M
emor
andu
m it
em
Dat
abas
e
Dat
abas
e
T
otal
Tot
al
Cor
pora
tions
com
pile
d w
ith
T
otal
C
orpo
ratio
ns
com
pile
d w
ith
C
orpo
ratio
ns
C
orpo
ratio
ns
p
opul
atio
n
Inte
grat
ed
p
opul
atio
n
repo
rtin
g to
info
rmat
ion
p
opul
atio
n
repo
rtin
g to
info
rmat
ion
rep
ortin
g to
rep
ortin
g to
acco
rdin
g to
CB
ac
cord
ing
to
CB
ann
ual
from
Mer
cant
ile
acco
rdin
g to
C
B a
nnua
l
fr
om M
erca
ntile
CB
qua
rter
ly
C
B a
nnua
l
dire
ctor
y
dat
abas
e
d
irect
ory
d
atab
ase
Reg
istr
ies
dire
ctor
y
d
atab
ase
Reg
istr
ies
dat
abas
e
data
base
of
INE
C
BI
of
INE
C
BA
CB
BE
/MR
of I
NE
CB
A
CB
BE
/MR
C
BQ
C
BA
50 to
250
> 2
50
1
2=
4+5+
7+8
3
4
5
6
7
8
9
10
1
1=4+
7 A
) B
RA
NC
HE
S O
F A
CT
IVIT
Y
T
OT
AL
..
..
..
..
..
..
..
..
..
..
..
..
..
..
..
1 23
1 44
4 56
0 03
1 1
210
726
5 30
3 54
2 85
7 20
718
4
735
7 13
6 52
5 78
0 10
038
A. A
gric
ultu
re, l
ives
tock
, for
estr
y an
d fis
herie
s (a
).
..
..
..
..
..
....
14
457
...
10
8 14
123
...
45
18
1 8
2 15
3 B
. Min
ing
and
quar
ryin
g.
..
..
..
..
..
..
..
..
..
..
..
2 38
1 1
458
2 29
9 31
1
365
82
26
36
- 7
57
C. M
anuf
actu
ring
..
..
..
..
..
..
..
..
..
..
..
..
..
118
300
57 0
70
112
920
1 25
9 53
467
5
380
1 13
2 1
212
105
221
2 39
1 D
. Ele
ctric
ity, g
as, s
team
and
air
cond
ition
ing
supp
ly.
..
..
..
..
..
13 4
79
13 6
76
13 4
21
36
13 5
30
58
76
34
3 50
11
2 E
. Wat
er s
uppl
y, s
anita
tion,
was
te m
anag
emen
t and
dec
onta
min
atio
n.
..
3 20
7 1
521
2 94
0 39
1
319
267
126
37
5 24
16
5 F
. Con
stru
ctio
n.
..
..
..
..
..
..
..
..
..
..
..
..
..
261
422
102
267
259
043
845
99 6
96
2 37
9 55
4 1
172
32
73
1 39
9 G
. Wat
er s
uppl
y, s
anita
tion,
was
te m
anag
emen
t and
dec
onta
min
atio
n.
..
293
778
119
222
290
230
1 33
3 11
6 05
8 3
548
797
1 03
4 79
11
6 2
130
H. T
rans
port
and
sto
rage
..
..
..
..
..
..
..
..
..
..
..
.48
806
18
133
47
628
21
1 17
317
1
178
276
329
29
81
487
I. H
otel
s an
d re
stau
rant
s.
..
..
..
..
..
..
..
..
..
..
..
77 8
90
30 7
37
76 5
11
303
29 8
09
1 37
9 23
1 39
4 36
29
53
4 J
. Inf
orm
atio
n an
d co
mm
unic
atio
ns.
..
..
..
..
..
..
..
..
.33
794
15
104
32
912
11
3 14
529
88
2 20
9 25
3 31
34
32
2 K
. Act
iviti
es o
f hol
ding
com
pani
es.
..
..
..
..
..
..
..
..
..
2 08
9 2
309
2 08
9 25
2
077
- 68
13
9 12
24
93
L
. Rea
l est
ate
activ
ities
..
..
..
..
..
..
..
..
..
..
..
..
80 7
84
63 5
45
80 7
01
280
62 4
35
83
144
686
18
20
424
M. P
rofe
ssio
nal,
scie
ntifi
c an
d te
chni
cal a
ctiv
ities
..
..
..
..
..
..
123
088
60 2
50
121
851
294
59 1
73
1 23
7 34
3 44
0 44
55
63
7 N
. Adm
inis
trat
ive
and
supp
ort s
ervi
ce a
ctiv
ities
..
..
..
..
..
..
.78
116
20
517
76
325
19
6 19
316
1
791
394
611
71
26
590
P. E
duca
tion
..
..
..
..
..
..
..
..
..
..
..
..
..
..
23 1
61
7 42
0 22
344
47
7
173
817
70
130
10
2 11
7 Q
. Hea
lth a
nd s
ocia
l wor
k.
..
..
..
..
..
..
..
..
..
..
.24
942
12
031
23
951
68
11
578
99
1 14
5 24
0 28
7
213
R. A
rtis
tic, r
ecre
atio
nal a
nd e
nter
tain
men
t act
iviti
es.
..
..
..
..
..
24 3
62
9 17
7 23
893
62
8
956
469
64
95
2 7
126
S. O
ther
ser
vice
s.
..
..
..
..
..
..
..
..
..
..
..
..
.21
845
11
137
21
668
53
10
936
17
7 35
11
3 12
2
88
B)
SIZ
ES
Lar
ge a
nd m
ediu
m-s
ized
..
..
..
..
..
..
..
..
..
..
..
.20
718
4
735
- -
- 20
718
4
735
- -
780
4 73
5
Lar
ge (
> 2
50 e
mpl
oyee
s).
..
..
..
..
..
..
..
..
..
..
....
1
893
- -
- ...
1
893
- 52
5 38
5 1
893
M
ediu
m-s
ized
(50
to 2
50 e
mpl
oyee
s).
..
..
..
..
..
..
..
..
...
9 97
8 -
- -
...
2 84
2 7
136
- 39
5 2
842
Sm
all (
< 5
0 em
ploy
ees)
..
..
..
..
..
..
..
..
..
..
..
.1
210
726
548
160
1 21
0 72
6 5
303
542
857
- -
- -
- 5
303
BANCO DE ESPAÑA 280 BOLETÍN ESTADÍSTICO, FEBRUARY 2013

____
____
____
____
____
____
____
____
____
____
____
____
____
____
____
____
____
____
____
____
____
____
____
____
____
____
____
____
____
____
____
____
____
____
____
____
____
____
____
____
____
____
____
____
____
____
See
not
es a
t the
end
of t
he c
hapt
er.
15
NO
N-F
INA
NC
IAL
CO
RP
OR
AT
ION
S:
15.B
Em
plo
ymen
t in
all
span
ish
no
n-f
inan
cial
co
rpo
rati
on
s an
d in
th
ose
S
um
mar
y in
form
atio
n c
om
pile
d b
y th
e C
entr
al B
alan
ce S
hee
t D
ata
Off
ice
cove
red
by
the
dat
abas
es o
f th
e C
entr
al B
alan
ce S
hee
t O
ffic
e (C
B).
Decem
ber
2010 d
ata
(2012 N
ovem
ber
update
)N
um
ber
of
em
plo
yees
TO
TA
L
C
orpo
ratio
ns w
ith u
p to
50
empl
oyee
s
Cor
pora
tions
with
ove
r 50
em
ploy
ees
M
emor
andu
m it
em
Dat
abas
e
Dat
abas
e
T
otal
Tot
al
Cor
pora
tions
com
pile
d w
ith
T
otal
C
orpo
ratio
ns
com
pile
d w
ith
C
orpo
ratio
ns
C
orpo
ratio
ns
p
opul
atio
n
Inte
grat
ed
p
opul
atio
n
repo
rtin
g to
info
rmat
ion
p
opul
atio
n
repo
rtin
g to
info
rmat
ion
rep
ortin
g to
rep
ortin
g to
acco
rdin
g to
CB
ac
cord
ing
to
CB
ann
ual
from
Mer
cant
ile
acco
rdin
g to
C
B a
nnua
l
fr
om M
erca
ntile
CB
qua
rter
ly
C
B a
nnua
l
dire
ctor
y
dat
abas
e
d
irect
ory
d
atab
ase
Reg
istr
ies
dire
ctor
y
d
atab
ase
Reg
istr
ies
dat
abas
e
data
base
of
INE
C
BI
of
INE
C
BA
CB
BE
/MR
of I
NE
CB
A
CB
BE
/MR
C
BQ
C
BA
50 to
250
> 2
50
1
2=
4+5+
7+8
3
4
5
6
7
8
9
10
1
1=4+
7 A
) B
RA
NC
HE
S O
F A
CT
IVIT
Y
T
OT
AL
..
..
..
..
..
..
..
..
..
..
..
..
..
..
..
8 88
7 18
8 5
142
003
4 21
4 17
4 10
2 44
7 2
084
663
4 67
3 01
4 2
483
632
471
261
204
029
694
832
2 58
6 07
9
A. A
gric
ultu
re, l
ives
tock
, for
estr
y an
d fis
herie
s (a
).
..
..
..
..
..
....
70
580
...
1
877
49 5
50
...
7 86
9 11
284
4
118
153
9 74
6 B
. Min
ing
and
quar
ryin
g.
..
..
..
..
..
..
..
..
..
..
..
28 6
46
19 1
57
14 8
42
438
8 71
7 13
804
7
330
2 67
2 -
7 7
768
C. M
anuf
actu
ring
..
..
..
..
..
..
..
..
..
..
..
..
..
1 77
6 73
4 96
2 11
2 77
1 20
6 29
552
38
2 59
6 1
005
528
441
518
108
446
34 7
79
92 6
21
471
070
D. E
lect
ricity
, gas
, ste
am a
nd a
ir co
nditi
onin
g su
pply
..
..
..
..
..
.39
370
32
569
7
075
164
2 53
9 32
295
29
483
38
3 11
28
217
29
647
E
. Wat
er s
uppl
y, s
anita
tion,
was
te m
anag
emen
t and
dec
onta
min
atio
n.
..
127
528
118
770
18 6
76
765
6 90
1 10
8 85
2 10
7 82
8 3
276
1 76
3 9
393
108
593
F. C
onst
ruct
ion
..
..
..
..
..
..
..
..
..
..
..
..
..
.1
097
849
551
947
743
128
12 2
47
327
477
354
721
158
345
53 8
78
27 4
43
52 2
60
170
592
G. W
ater
sup
ply,
san
itatio
n, w
aste
man
agem
ent a
nd d
econ
tam
inat
ion
..
.1
930
771
1 17
8 35
5 97
7 06
5 27
848
52
0 47
4 95
3 70
6 54
9 75
0 80
283
31
218
20
3 19
2 57
7 59
8 H
. Tra
nspo
rt a
nd s
tora
ge.
..
..
..
..
..
..
..
..
..
..
..
533
149
386
344
241
742
4 46
3 10
7 11
7 29
1 40
7 24
7 32
2 27
442
10
216
17
0 43
4 25
1 78
5 I
. Hot
els
and
rest
aura
nts
..
..
..
..
..
..
..
..
..
..
..
.63
5 30
4 33
1 58
8 34
8 83
2 7
303
174
108
286
472
119
558
30 6
19
16 3
32
10 1
28
126
861
J. I
nfor
mat
ion
and
com
mun
icat
ions
..
..
..
..
..
..
..
..
..
351
679
231
174
100
898
2 42
6 52
946
25
0 78
1 15
3 25
2 22
550
10
279
59
693
15
5 67
8 K
. Act
iviti
es o
f hol
ding
com
pani
es.
..
..
..
..
..
..
..
..
..
6 63
7 5
425
6 63
7 25
1
844
- 2
554
1 00
2 86
0 1
939
2 57
9 L
. Rea
l est
ate
activ
ities
..
..
..
..
..
..
..
..
..
..
..
..
91 3
61
51 0
26
82 4
31
908
41 6
29
8 93
0 4
248
4 24
1 86
4 77
5 5
156
M. P
rofe
ssio
nal,
scie
ntifi
c an
d te
chni
cal a
ctiv
ities
..
..
..
..
..
..
642
330
303
545
290
086
5 26
1 15
9 14
3 35
2 24
4 11
4 54
5 24
596
15
759
18
842
11
9 80
6 N
. Adm
inis
trat
ive
and
supp
ort s
ervi
ce a
ctiv
ities
..
..
..
..
..
..
.85
1 51
9 56
7 67
0 22
2 54
4 3
788
79 9
53
628
975
434
042
49 8
87
27 9
73
39 0
62
437
830
P. E
duca
tion
..
..
..
..
..
..
..
..
..
..
..
..
..
..
214
103
65 3
14
108
971
1 19
1 36
120
10
5 13
2 16
247
11
756
4
779
627
17 4
38
Q. H
ealth
and
soc
ial w
ork
..
..
..
..
..
..
..
..
..
..
..
316
253
154
253
118
569
1 71
9 57
174
19
7 68
4 73
116
22
244
12
358
2
561
74 8
35
R. A
rtis
tic, r
ecre
atio
nal a
nd e
nter
tain
men
t act
iviti
es.
..
..
..
..
..
147
569
49 8
49
89 5
47
1 41
6 33
416
58
022
8
002
7 01
5 85
1 1
035
9 41
8 S
. Oth
er s
ervi
ces
..
..
..
..
..
..
..
..
..
..
..
..
..
96 3
86
62 3
25
71 9
25
1 05
6 42
959
24
461
8
623
9 68
7 4
426
2 30
5 9
679
B)
SIZ
ES
Lar
ge a
nd m
ediu
m-s
ized
..
..
..
..
..
..
..
..
..
..
..
.4
673
014
2 48
3 63
2 -
- -
4 67
3 01
4 2
483
632
- -
694
832
2 48
3 63
2
Lar
ge (
> 2
50 e
mpl
oyee
s).
..
..
..
..
..
..
..
..
..
..
....
2
264
221
- -
- ...
2
264
221
- 20
4 02
9 66
0 88
8 2
264
221
M
ediu
m-s
ized
(50
to 2
50 e
mpl
oyee
s).
..
..
..
..
..
..
..
..
...
690
672
- -
- ...
21
9 41
1 47
1 26
1 -
33 9
44
219
411
Sm
all (
< 5
0 em
ploy
ees)
..
..
..
..
..
..
..
..
..
..
..
.4
214
174
2 18
7 11
0 4
214
174
102
447
2 08
4 66
3 -
- -
- -
102
447
BANCO DE ESPAÑA 281 BOLETÍN ESTADÍSTICO, FEBRUARY 2013

___________________________________________________________________________________________________________________________
See notes at the end of the chapter.
15 NON-FINANCIAL CORPORATIONS: 15.C Balance sheet, profit and loss account and ratios. 2010 Summary information compiled by the Central Balance Sheet Data Office
%
Central Balance Sheet Office databases
CBI CBA CBQ (Total) 1 2 3
A. BALANCE SHEET
1 Fixed assets . . . . . . . . . . . . . . . . . . . . . . . . . . . . . . . . . . . . . . . . . . . . . . ... 69.3 ... 2 Tangible assets . . . . . . . . . . . . . . . . . . . . . . . . . . . . . . . . . . . . . . . . . . . . ... 29.9 31.9 3 1. Book value . . . . . . . . . . . . . . . . . . . . . . . . . . . . . . . . . . . . . . . . . . . . . ... 21.6 22.6 4 2. Adjustment to current prices . . . . . . . . . . . . . . . . . . . . . . . . . . . . . . . . . . . . . . ... 8.3 9.3 5 Other fixed assets . . . . . . . . . . . . . . . . . . . . . . . . . . . . . . . . . . . . . . . . . . . ... 39.4 ...
6 Current assets . . . . . . . . . . . . . . . . . . . . . . . . . . . . . . . . . . . . . . . . . . . . . ... 30.7 ... 7 Trade and other accounts receivable . . . . . . . . . . . . . . . . . . . . . . . . . . . . . . . . . . . ... 8.5 6.6 8 Other current assets . . . . . . . . . . . . . . . . . . . . . . . . . . . . . . . . . . . . . . . . . . ... 22.3 ...
9 Other assets . . . . . . . . . . . . . . . . . . . . . . . . . . . . . . . . . . . . . . . . . . . . . . ... ... 61.5
10 Assets = Liabilities . . . . . . . . . . . . . . . . . . . . . . . . . . . . . . . . . . . . . . . . . . . ... 100.0 100.0
11 Equity (including adjustment to current prices) . . . . . . . . . . . . . . . . . . . . . . . . . . . . . . . . . . . ... 42.2 45.4 12 Creditors and provisions . . . . . . . . . . . . . . . . . . . . . . . . . . . . . . . . . . . . . . . . . ... 57.8 54.6 13 Credit institutions. . . . . . . . . . . . . . . . . . . . . . . . . . . . . . . . . . . . . . . . . . . . ... 16.6 14.6 14 Trade and other accounts payable . . . . . . . . . . . . . . . . . . . . . . . . . . . . . . . . . . . . ... 6.9 7.7 15 Other creditors. . . . . . . . . . . . . . . . . . . . . . . . . . . . . . . . . . . . . . . . . . . . . ... 34.3 32.2 16 With financial cost . . . . . . . . . . . . . . . . . . . . . . . . . . . . . . . . . . . . . . . . . . . ... 22.5 25.4 17 Without financial cost . . . . . . . . . . . . . . . . . . . . . . . . . . . . . . . . . . . . . . . . . ... 11.8 6.9
B. PROFIT AND LOSS ACCOUNT (See rates of change in Tables 15.1 to 15.6)
18 Value of output (including subsidies) . . . . . . . . . . . . . . . . . . . . . . . . . . . . . . . . . . . ... 100.0 100.0 19 Net turnover . . . . . . . . . . . . . . . . . . . . . . . . . . . . . . . . . . . . . . . . . . . . . . ... 142.0 148.9 20 Other operating income . . . . . . . . . . . . . . . . . . . . . . . . . . . . . . . . . . . . . . . . . ... -42.0 -48.9 21 Inputs (including taxes) . . . . . . . . . . . . . . . . . . . . . . . . . . . . . . . . . . . . . . . . . ... 65.9 65.9 22 Gross value added at factor cost (18-21). . . . . . . . . . . . . . . . . . . . . . . . . . . . . . . . . . ... 34.1 34.1 23 Personnel costs . . . . . . . . . . . . . . . . . . . . . . . . . . . . . . . . . . . . . . . . . . . . ... 20.1 16.0 24 Gross operating profit (22-23) . . . . . . . . . . . . . . . . . . . . . . . . . . . . . . . . . . . . . . ... 14.0 18.1 25 Financial revenue. . . . . . . . . . . . . . . . . . . . . . . . . . . . . . . . . . . . . . . . . . . . ... 5.0 7.8 26 Financial costs . . . . . . . . . . . . . . . . . . . . . . . . . . . . . . . . . . . . . . . . . . . . . ... 4.2 5.9 27 Interest on borrowed funds . . . . . . . . . . . . . . . . . . . . . . . . . . . . . . . . . . . . . . . ... 3.9 5.5 28 Depreciation and operating provisions . . . . . . . . . . . . . . . . . . . . . . . . . . . . . . . . . . . ... 6.4 7.4 29 Ordinary net profit (24+25-26-28) . . . . . . . . . . . . . . . . . . . . . . . . . . . . . . . . . . . . . ... 8.3 12.5 30 Corporate income tax . . . . . . . . . . . . . . . . . . . . . . . . . . . . . . . . . . . . . . . . . . ... 1.1 1.4 31 Other income and expenses . . . . . . . . . . . . . . . . . . . . . . . . . . . . . . . . . . . . . . . ... 1.2 1.9 32 Profit/loss for the year (29-30-31) . . . . . . . . . . . . . . . . . . . . . . . . . . . . . . . . . . . . . ... 6.0 9.2
C. SIGNIFICANT RATIOS (a) (See Tables 15.7 to 15.25)
33 R.1 Ordinary return on net assets. . . . . . . . . . . . . . . . . . . . . . . . . . . . . . . . . . . . ... 5.9 6.3 34 R.2 Interest on borrowed funds / interest-bearing borrowing (outstanding balances) . . . . . . . . . . . . . . ... 3.3 3.2 35 R.3 Ordinary return on equity . . . . . . . . . . . . . . . . . . . . . . . . . . . . . . . . . . . . . ... 8.3 9.0 36 R.4 Return on investment - cost of debt (R.1 - R.2) . . . . . . . . . . . . . . . . . . . . . . . . . . . . ... 2.6 3.1 37 R.5 Operating margin . . . . . . . . . . . . . . . . . . . . . . . . . . . . . . . . . . . . . . . . . ... 14.0 18.1 38 E.1 Debt ratio: External interest-bearing funds / Net assets(current prices; end-of-year balance) . . . . . . . . ... 48.1 47.1 39 E.1’ Debt ratio: External interest-bearing funds / Net assets (book value; end-of-year balance) . . . . . . . . . ... 53.5 52.5 40 E.2 Debt ratio: External interest-bearing funds / (Gross operating profit + Financial revenue) . . . . . . . . . . ... 619.2 593.8 41 FSI.1 Total debt to equity . . . . . . . . . . . . . . . . . . . . . . . . . . . . . . . . . . . . . . . . 119.8 ... ... 42 FSI.2 Return on equity . . . . . . . . . . . . . . . . . . . . . . . . . . . . . . . . . . . . . . . . . 8.9 ... ...
BANCO DE ESPAÑA 282 BOLETÍN ESTADÍSTICO, FEBRUARY 2013

1 2 3 4 5 6 7 8 9 10 11 12 13
15 NON-FINANCIAL CORPORATIONS: 15.1 Profit and loss account. Main items. Total non-Summary information compiled by financial corporations. Annual database (CBA)the Central Balance Sheet Data Office
Growth rates on the same period a year earlier Personnel costs Financial costs
Value Gross of Inputs value Gross Ordinary Profit/
output (including added at Average operating Variation due to net loss for (including taxes) factor Total Employ- compen- profit profit the year subsidies) cost ment sation Total
Cost Interest- Other (rate of bearing financial interest) debt expenses
90 7.4 8.0 6.5 10.5 1.0 9.4 1.5 14.9 6.6 7.2 1.1 -10.5 -28.2 91 5.9 5.7 6.0 8.3 - 8.3 3.0 8.3 -2.7 10.6 0.4 -15.8 -40.4 92 3.2 3.5 2.8 5.1 -2.8 8.2 -0.3 8.8 -4.9 13.3 0.4 -28.6 -91.5 93 0.3 0.2 0.6 1.0 -4.6 5.9 -0.1 5.0 -3.6 8.3 0.3 -46.3 - 94 10.9 12.7 8.0 0.9 -2.3 3.2 18.6 -16.0 -18.4 0.6 1.8 - -
95 11.7 14.0 8.0 4.0 1.4 2.6 13.2 -0.4 -0.7 -1.2 1.5 49.2 10.1 96 5.5 7.1 2.9 3.9 0.9 3.0 1.8 -12.8 -9.7 -4.0 0.9 11.6 43.3 97 10.5 12.5 6.9 3.9 2.3 1.6 10.6 -14.1 -15.1 -0.4 1.4 21.5 48.8 98 6.4 6.3 6.7 5.9 4.0 1.8 7.6 -7.2 -16.6 9.5 -0.1 22.2 4.0 99 9.0 11.3 4.8 6.5 5.0 1.4 3.0 -6.5 -17.2 11.2 -0.5 4.0 -6.6
00 15.9 20.3 7.5 8.1 4.9 3.0 7.0 33.2 5.1 31.6 -3.5 5.2 7.9 01 5.1 4.7 5.8 5.9 2.6 3.2 5.8 19.0 1.1 21.5 -3.6 12.7 -18.9 02 3.7 2.7 5.6 5.2 1.5 3.7 6.1 -4.7 -14.0 8.6 0.7 5.8 -82.7 03 6.0 5.7 6.5 4.7 1.3 3.3 8.6 -2.7 -10.1 8.6 -1.2 15.2 -04 8.0 8.3 7.5 4.8 2.8 1.9 10.6 -3.3 -7.3 3.0 1.0 22.2 19.0
05 9.2 11.5 4.8 5.8 3.3 2.4 3.6 9.6 2.3 7.5 -0.2 9.7 19.4 06 9.0 9.5 8.0 6.8 3.4 3.3 9.4 34.8 9.0 26.8 -1.0 5.0 17.9 07 7.3 7.6 6.6 7.0 3.1 3.8 6.2 38.1 18.7 22.8 -3.4 6.3 7.2 08 -0.1 1.2 -2.7 3.9 0.7 3.1 -10.1 13.7 7.7 6.9 -0.9 -20.9 -56.8 09 -13.0 -15.6 -7.7 -3.3 -4.9 1.7 -13.8 -29.1 -31.3 1.2 1.0 -10.8 54.7
10 4.4 6.1 1.2 -0.1 -0.8 0.7 3.2 -2.4 -8.0 4.7 0.9 8.5 -11.8 11 4.8 7.8 -1.1 0.3 -1.2 1.5 -3.0 11.3 10.7 1.9 -1.3 -9.7 -17.0
1 2 3 4 5 6 7 8 9 10 11 12 13
15 NON-FINANCIAL CORPORATIONS: 15.2 Profit and loss account. Main items. Total non-financialSummary information compiled by corporations. Quarterly database (CBQ)the Central Balance Sheet Data Office
Growth rates on the same period a year earlier Personnel costs Financial costs
Value Gross of Inputs value Gross Ordinary Profit/
output (including added at Average operating Variation due to net loss for (including taxes) factor Total Employ- compen- profit profit the year subsidies) cost ment sation Total
Cost Interest- Other (rate of bearing financial interest) debt expenses
07 II 4.0 3.7 4.6 4.3 0.9 3.5 4.8 36.3 3.3 34.1 -1.1 -2.6 -4.0 III 4.0 5.4 1.4 3.5 0.6 2.9 -0.1 43.4 0.4 43.9 -0.9 -10.4 -2.1 IV 9.0 9.7 7.7 5.5 0.9 4.6 9.5 32.7 3.7 29.0 - 41.3 79.8
08 I 4.0 5.2 1.9 4.0 0.8 3.1 0.4 25.6 -2.8 30.6 -2.2 -0.3 2.3 II 5.5 7.8 1.2 4.5 1.0 3.5 -1.2 20.5 -8.3 30.7 -1.9 11.1 71.9 III 5.0 8.1 -0.9 4.0 0.2 3.9 -4.4 13.1 -4.9 19.6 -1.6 -10.6 -41.7 IV -14.3 -14.3 -14.2 0.2 -0.9 1.1 -25.7 8.9 0.3 9.8 -1.2 -54.4 -
09 I -17.6 -20.3 -12.5 -1.8 -3.2 1.4 -20.7 -20.3 35.6 -56.3 0.4 -30.0 -28.1 II -21.6 -25.0 -14.8 -1.9 -3.6 1.8 -25.0 -31.8 56.2 -88.8 0.8 -27.6 -1.3 III -14.6 -18.8 -6.2 -1.8 -4.0 2.3 -9.6 -37.7 65.9 -105.4 1.8 -0.6 - IV 0.7 -0.8 3.9 -2.2 -3.4 1.2 10.6 -34.4 57.4 -93.9 2.1 53.2 -
10 I 10.7 14.5 4.4 -1.0 -2.2 1.3 9.4 -16.3 19.8 -37.0 0.9 8.1 9.0 II 13.5 16.6 8.0 -0.8 -2.0 1.3 17.2 8.5 -3.4 11.2 0.7 13.2 -1.8 III 6.1 8.8 1.5 -1.7 -2.0 0.2 4.3 9.9 -2.7 12.4 0.2 24.3 50.1 IV 4.0 6.9 -1.8 -1.4 -2.2 0.8 -2.2 6.0 -0.3 8.8 -2.5 -6.7 -
11 I 9.0 14.0 -0.2 -0.2 -1.4 1.2 -0.2 16.7 -9.2 26.4 -0.5 22.1 25.6 II 10.2 17.1 -2.9 0.2 -1.1 1.3 -5.8 4.5 -2.4 7.0 -0.1 -9.6 -30.9 III 9.7 14.8 - 1.0 0.4 0.6 -0.9 10.3 -10.5 22.7 -1.9 -16.5 -55.4 IV 5.9 10.2 -3.1 -0.4 -1.2 0.8 -5.8 13.1 -10.6 22.9 0.8 -21.4 -
12 I 3.5 7.0 -4.3 -1.4 -1.8 0.4 -6.9 2.7 -0.6 3.8 -0.5 -40.2 -59.1 II -1.4 0.9 -6.9 -2.1 -2.6 0.5 -11.4 2.9 2.3 1.5 -0.9 -12.2 -82.9 III 5.7 8.0 0.3 -3.8 -3.3 -0.5 3.5 3.4 7.8 -4.2 -0.2 -19.7 36.7
BANCO DE ESPAÑA 283 BOLETÍN ESTADÍSTICO, FEBRUARY 2013

1 2 3 4 5 6 7 8 9 10 11 12 13
15 NON-FINANCIAL CORPORATIONS: 15.3 Profit and loss account. Main items. Total non-financialSummary information compiled by corporations. Quarterly database (CBQ)the Central Balance Sheet Data Office
See notes at the end of the chapter.
Cumulative quarters (a) Growth rates on the same period a year earlier Personnel costs Financial costs
Value Gross of Inputs value Gross Ordinary Profit/
output (including added at Average operating Variation due to net loss for (including taxes) factor Total Employ- compen- profit profit the year subsidies) cost ment sation Total
Cost Interest- Other (rate of bearing financial interest) debt expenses
98 1.6 -0.3 4.4 3.5 1.1 2.4 5.1 -7.5 -11.7 3.6 0.6 19.9 20.9 99 7.0 10.2 2.6 3.1 1.2 1.8 2.2 -4.4 -22.1 17.7 - 3.8 -16.0 00 17.5 25.0 7.4 5.4 2.1 3.3 9.0 29.9 3.2 29.3 -2.6 8.3 24.5 01 4.1 4.3 3.9 4.5 0.9 3.6 3.4 15.5 -3.7 19.9 -0.7 18.1 -14.9 02 1.5 - 3.8 4.0 0.1 3.9 3.7 -5.8 -12.6 6.7 0.1 2.5 -
03 3.7 3.3 4.2 3.8 0.4 3.4 4.6 -0.3 -8.1 6.9 0.9 11.6 -04 7.3 8.3 5.7 3.1 0.1 3.1 7.7 -7.2 -7.4 -0.7 0.9 19.4 11.0 05 11.1 15.8 3.3 3.9 0.5 3.4 2.8 4.5 -1.8 7.4 -1.1 11.0 29.6 06 9.7 11.3 6.9 5.4 1.8 3.6 8.0 39.1 7.4 32.6 -0.9 5.0 10.3 07 5.3 5.6 4.8 4.7 0.9 3.7 4.9 38.5 16.0 23.2 -0.7 8.7 13.9
08 -0.1 1.3 -2.9 3.2 0.3 2.9 -7.3 16.4 11.0 7.2 -1.8 -15.6 -48.9 09 -13.6 -16.5 -7.9 -1.9 -3.5 1.7 -12.9 -31.2 -33.9 1.4 1.3 -8.7 51.2 10 8.4 11.5 3.0 -1.2 -2.1 0.9 6.9 1.3 -3.4 4.8 -0.1 8.6 -11.6 11 8.7 13.9 -1.6 0.1 -0.8 0.9 -3.1 11.0 11.5 -0.1 -0.4 -7.8 -33.5
10 IV 8.4 11.5 3.0 -1.2 -2.1 0.9 6.9 1.3 -3.4 4.8 -0.1 8.6 -11.6
11 I 9.0 14.0 -0.2 -0.2 -1.4 1.2 -0.2 16.7 12.8 4.4 -0.5 22.1 25.6 II 9.6 15.5 -1.6 - -1.2 1.2 -3.0 10.2 8.1 2.4 -0.3 3.4 -14.2 III 9.6 15.3 -1.1 0.3 -0.7 1.0 -2.3 10.2 10.1 1.0 -0.9 -3.3 -26.0 IV 8.7 13.9 -1.6 0.1 -0.8 0.9 -3.1 11.0 11.5 -0.1 -0.4 -7.8 -33.5
12 I 3.5 7.0 -4.3 -1.4 -1.8 1.3 -6.9 2.7 4.9 -1.7 -0.5 -40.2 -59.1 II 1.0 3.9 -5.6 -1.8 -2.2 0.4 -9.0 2.8 4.0 -0.5 -0.7 -25.8 -72.6 III 2.5 5.2 -3.7 -2.4 -2.5 0.1 -4.9 3.0 1.6 1.9 -0.5 -24.1 -57.2
1 2 3 4 5 6 7 8 9 10 11 12 13
15 NON-FINANCIAL CORPORATIONS: 15.4 Profit and loss account. Main items.Summary information compiled by Industry corporations.the Central Balance Sheet Data Office Annual database (CBA)
Growth rates on the same period a year earlier Personnel costs Financial costs
Value Gross of Inputs value Gross Ordinary Profit/
output (including added at Average operating Variation due to net loss for (including taxes) factor Total Employ- compen- profit profit the year subsidies) cost ment sation Total
Cost Interest- Other (rate of bearing financial interest) debt expenses
90 1.4 2.6 -1.3 7.0 -1.7 8.9 -14.8 18.2 10.4 5.2 2.6 -29.8 -50.1 91 2.3 3.2 0.1 6.2 -2.6 9.1 -12.3 8.9 -1.8 11.5 -0.8 -64.3 - 92 1.9 3.3 -1.7 4.4 -3.3 7.9 -16.3 12.8 -5.1 16.5 1.4 - - 93 -2.3 -1.4 -4.6 - -7.0 7.5 -18.0 9.2 -1.3 11.4 -0.9 - -72.8 94 18.3 18.1 18.7 0.7 -3.9 4.8 78.8 -18.3 -21.5 0.2 3.0 - -
95 15.7 17.1 11.8 3.5 -0.5 4.0 27.0 -5.3 0.1 -7.6 2.2 107.9 106.5 96 2.8 4.1 -0.9 3.1 -0.9 4.0 -6.9 -15.8 -13.6 -6.5 4.3 -5.6 25.1 97 12.5 13.4 9.8 3.8 0.6 3.1 19.6 -16.3 -14.3 -3.5 1.5 27.2 26.1 98 7.7 8.2 6.4 5.5 2.2 3.2 7.8 -12.3 -16.4 4.4 -0.3 20.3 50.5 99 5.7 6.8 2.4 4.1 1.7 2.4 0.1 -11.8 -24.8 8.4 4.6 4.7 22.3
00 13.2 15.3 6.6 6.5 2.9 3.6 6.7 32.3 27.1 15.2 -10.0 -0.5 -22.0 01 2.7 3.5 0.1 2.7 -0.9 3.6 -3.5 14.4 -0.2 20.0 -5.4 -7.1 0.5 02 1.1 1.0 1.5 3.0 -1.0 4.1 -0.7 -1.5 -16.2 13.9 0.8 -2.1 -12.9 03 4.6 4.6 4.5 2.5 -0.9 3.4 7.7 -9.8 -19.3 10.7 -1.2 10.6 7.3 04 7.9 8.4 6.0 3.3 -0.4 3.7 10.0 -0.8 -8.5 8.1 -0.4 18.2 -6.0
05 4.2 5.5 -0.2 2.4 -0.7 3.1 -3.8 14.9 9.8 8.4 -3.3 0.5 57.1 06 7.7 8.2 5.9 3.0 -0.7 3.8 10.1 27.6 8.7 21.1 -2.2 11.1 10.7 07 11.2 11.9 9.0 4.3 0.5 3.7 15.2 38.9 21.2 18.4 -0.7 18.7 -4.2 08 -6.2 -5.3 -9.1 1.6 -1.4 3.1 -21.9 0.1 1.2 1.9 -3.0 -30.0 -79.0 09 -18.8 -19.6 -16.0 -6.7 -7.1 0.4 -30.1 -26.9 -30.3 2.5 0.9 -50.7 -
10 10.3 11.2 7.3 -0.5 -2.6 2.2 22.3 -5.1 2.5 -5.2 -2.4 71.2 -11 6.1 8.4 -1.8 0.5 -1.4 2.0 -5.2 5.6 5.2 -1.8 2.2 2.8 102.9
BANCO DE ESPAÑA 284 BOLETÍN ESTADÍSTICO, FEBRUARY 2013

1 2 3 4 5 6 7 8 9 10 11 12 13
15 NON-FINANCIAL CORPORATIONS: 15.5 Profit and loss account. Main items. IndustrySummary information compiled by corporations. Quarterly database (CBQ)the Central Balance Sheet Data Office
Growth rates on the same period a year earlier Personnel costs Financial costs
Value Gross of Inputs value Gross Ordinary Profit/
output (including added at Average operating Variation due to net loss for (including taxes) factor Total Employ- compen- profit profit the year subsidies) cost ment sation Total
Cost Interest- Other (rate of bearing financial interest) debt expenses
07 II 9.5 8.1 14.6 2.4 -1.0 3.5 30.0 31.2 2.5 32.0 -3.3 57.2 - III 4.3 4.7 2.9 0.5 -1.8 2.4 5.5 64.5 19.6 45.9 -1.0 9.9 -36.6 IV 1.7 2.4 -0.8 4.5 -1.4 6.0 -7.0 48.0 12.7 39.4 -4.1 -41.0 -
08 I -7.9 -9.6 -1.9 3.0 -0.6 3.6 -7.1 42.4 10.3 38.8 -6.7 -31.4 -31.3 II -6.4 -6.4 -6.4 3.4 -0.1 3.5 -16.6 48.2 27.1 28.4 -7.3 -34.8 -59.8 III -6.4 -5.1 -11.0 2.7 -0.5 3.3 -26.5 3.9 -0.8 10.9 -6.2 -39.8 -35.0 IV -25.1 -22.3 -37.0 -5.1 -3.1 -2.0 -84.2 11.4 3.8 10.7 -3.1 - -
09 I -29.3 -27.5 -35.0 -5.8 -5.9 0.1 -68.8 -14.6 -22.6 9.3 -1.3 -99.8 - II -32.1 -31.6 -33.7 -9.0 -8.0 -1.1 -64.7 -30.2 -30.8 1.1 -0.5 -81.9 - III -21.5 -22.9 -16.2 -7.9 -7.7 -0.2 -28.8 -29.2 -24.7 -9.5 5.0 -25.5 39.3 IV 0.9 - 5.3 -3.6 -6.1 2.6 77.0 -36.0 -24.2 -10.3 -1.5 - -93.0
10 I 16.7 18.9 9.6 -2.4 -3.8 1.5 45.8 -16.8 -6.2 -10.7 0.1 75.0 5.1 II 32.8 32.9 32.6 0.2 -2.8 3.1 147.4 3.5 6.9 -1.4 -2.0 - -46.2 III 13.7 15.1 9.2 -1.5 -2.3 0.8 31.2 10.3 8.2 12.7 -10.6 -14.6 - IV 10.7 5.5 36.0 1.0 -1.3 2.3 - 16.0 12.4 6.3 -2.7 - 94.6
11 I 12.3 11.5 15.1 2.6 -1.0 3.6 43.0 9.8 16.8 -3.1 -3.9 - - II 7.1 10.1 -3.4 2.3 -0.4 2.7 -11.8 2.6 7.3 -6.1 1.4 0.7 -39.6 III 5.8 7.3 -0.1 2.8 1.2 1.6 -5.1 -0.4 5.4 -5.8 - -18.6 -30.3 IV -2.1 -1.2 -5.3 -0.5 -1.4 0.9 -13.4 3.4 1.3 -3.3 5.4 0.2 -
12 I -3.6 -1.4 -11.7 -0.4 -2.1 1.8 -30.2 3.1 8.0 -5.1 0.2 -80.1 - II -5.6 -5.3 -6.7 -1.0 -3.1 2.2 -16.2 -3.5 7.4 -7.2 -3.7 3.7 19.6 III -4.3 -2.4 -13.4 -1.7 -5.2 3.6 -35.6 0.2 -5.0 6.6 -1.4 -80.3 -51.2
1 2 3 4 5 6 7 8 9 10 11 12 13
15 NON-FINANCIAL CORPORATIONS: 15.6 Profit and loss account. Main items. IndustrySummary information compiled by corporations. Quarterly database (CBQ)the Central Balance Sheet Data Office
See notes at the end of the chapter.
Cumulative quarters (a) Growth rates on the same period a year earlier Personnel costs Financial costs
Value Gross of Inputs value Gross Ordinary Profit/
output (including added at Average operating Variation due to net loss for (including taxes) factor Total Employ- compen- profit profit the year subsidies) cost ment sation Total
Cost Interest- Other (rate of bearing financial interest) debt expenses
98 7.7 8.1 6.6 5.2 2.0 3.1 8.5 -15.0 -19.5 2.0 2.5 20.6 14.9 99 2.4 2.5 2.4 3.1 -0.1 3.2 1.5 -3.1 -18.2 15.2 -0.1 11.3 9.3 00 17.1 19.2 11.6 6.2 2.3 3.8 18.9 37.0 32.8 8.2 -4.0 22.4 -1.2 01 1.8 3.3 -1.8 2.9 -0.3 3.2 -7.3 3.8 -0.1 5.7 -1.8 -14.3 7.0 02 0.4 0.1 1.1 1.6 -1.8 3.5 0.4 -12.9 -24.1 9.0 2.2 1.5 -10.6
03 2.1 2.6 0.9 2.1 -1.0 3.1 -0.5 -2.9 -11.5 8.5 0.1 8.6 -10.9 04 8.1 8.8 5.9 2.3 -0.5 2.8 10.7 -1.0 -7.2 7.0 -0.8 26.5 91.6 05 4.8 5.9 1.3 3.4 -0.3 3.7 -1.1 15.7 2.1 12.3 1.3 -3.7 11.6 06 11.0 12.2 7.0 2.8 -0.6 3.4 12.4 33.7 4.3 33.2 -3.8 27.4 5.5 07 7.3 7.3 7.4 2.6 -1.3 4.0 13.2 45.2 12.6 35.2 -2.6 12.2 -24.8
08 -11.2 -10.8 -12.8 1.1 -1.0 2.1 -28.9 23.9 9.4 20.2 -5.7 -51.5 -09 -21.8 -21.3 -23.4 -6.6 -6.9 0.3 -50.5 -27.7 -26.5 -1.7 0.5 -55.2 -69.4 10 18.2 17.5 20.9 -0.7 -2.6 2.0 91.9 2.0 5.5 -0.1 -3.4 182.4 -11 5.7 6.9 1.2 1.8 -0.4 2.2 0.2 3.6 6.6 -3.9 0.9 39.2 -48.5
10 IV 18.2 17.5 20.9 -0.7 -2.6 2.0 91.9 2.0 5.5 -0.1 -3.4 182.4 -
11 I 12.3 11.5 15.1 2.6 -1.0 3.6 43.0 9.8 16.8 -3.1 -3.9 - - II 9.6 10.8 5.1 2.5 -0.7 3.2 9.8 5.9 11.1 -4.1 -1.1 94.8 35.0 III 8.4 9.7 3.5 2.6 -0.1 2.7 5.1 3.7 8.5 -4.1 -0.7 59.4 -1.5 IV 5.7 6.9 1.2 1.8 -0.4 2.2 0.2 3.6 6.6 -3.9 0.9 39.2 -48.5
12 I -3.6 -1.4 -11.7 -0.4 -2.1 2.7 -30.2 3.1 8.0 -5.1 0.2 -80.1 - II -4.6 -3.4 -9.2 -0.7 -2.6 2.0 -23.3 -0.3 9.2 -7.6 -1.9 -41.1 -26.1 III -4.5 -3.1 -10.2 -0.9 -3.3 2.5 -26.0 -0.2 3.2 -1.6 -1.8 -45.8 -28.8
BANCO DE ESPAÑA 285 BOLETÍN ESTADÍSTICO, FEBRUARY 2013

1 2 3 4 5 6 7 8 9 10 11 12
15 NON-FINANCIAL CORPORATIONS: 15.7 Significant ratios: R.1 Return onSummary information compiled by investment (ROI). Annual database (CBA)the Central Balance Sheet Data Office
See notes at the end of the chapter.
% (a) Branches of activity By size Services
Total Energy Industry Other Medium- Wholesale Information Other activities Large sized Small Total and retail trade Transport and services and hotels communications
90 9.0 7.9 9.6 9.0 17.2 4.5 8.4 8.6 13.2 8.7 10.7 12.6 91 7.8 7.9 5.8 8.4 11.6 5.1 9.5 8.8 11.8 7.5 9.3 12.5 92 6.7 7.7 3.7 7.3 8.7 4.8 10.2 6.5 10.9 6.5 8.1 9.5 93 6.0 8.6 1.6 6.5 8.6 3.1 9.4 6.0 8.2 5.8 7.0 8.2 94 7.0 7.5 6.8 6.6 9.3 3.6 9.8 5.5 8.3 6.7 9.3 10.0
95 8.3 7.7 10.7 7.3 11.1 4.3 10.4 6.0 9.1 8.0 10.8 10.9 96 8.2 7.8 9.5 7.7 11.1 4.3 10.8 6.8 8.1 7.9 10.5 10.4 97 8.6 7.1 10.6 8.5 10.7 4.6 11.7 8.7 8.1 8.4 10.6 10.6 98 9.2 7.9 11.6 8.8 11.8 4.9 13.5 7.3 8.9 8.9 11.5 10.7 99 8.4 7.9 11.0 7.6 12.8 4.2 9.8 5.4 8.7 8.1 11.5 10.2
00 8.0 9.4 10.5 6.2 11.3 4.3 7.9 4.7 9.9 7.7 10.7 9.4 01 8.1 9.1 9.2 7.2 11.8 5.0 11.9 5.5 10.2 7.9 10.3 9.4 02 8.2 10.3 8.0 7.5 11.7 5.4 13.2 5.7 9.8 8.1 8.9 8.3 03 8.0 8.2 8.2 7.8 10.9 4.8 16.4 5.7 9.0 8.0 8.2 7.4 04 8.4 8.4 9.3 7.8 11.0 4.0 21.6 5.3 11.7 8.4 8.5 7.3
05 8.9 9.8 8.9 8.5 10.3 3.4 20.9 6.9 10.9 9.1 7.6 7.0 06 9.1 10.0 9.3 8.5 10.0 3.5 16.4 7.9 11.3 9.3 7.9 7.0 07 8.9 8.8 10.6 8.7 9.8 3.5 21.4 7.6 8.4 9.0 8.1 7.4 08 7.7 7.9 7.3 8.0 7.9 2.7 22.0 7.3 5.9 7.8 6.2 4.9 09 6.2 6.8 4.0 6.8 7.8 1.5 20.3 6.5 4.5 6.4 4.7 3.7
10 5.9 6.1 6.0 6.4 7.7 2.0 21.5 5.8 1.7 6.0 4.6 3.5 11 5.6 5.7 6.3 5.7 8.4 2.1 19.7 5.0 2.9 5.6 5.5 3.1
1 2 3 4 5 6 7 8 9 10 11 12
15 NON-FINANCIAL CORPORATIONS: 15.8 Significant ratios: R.1 Return onSummary information compiled by investment (ROI). Quarterly database (CBQ)the Central Balance Sheet Data Office
See notes at the end of the chapter.
% (a) (b) Branches of activity By size Services
Total Energy Industry Other Medium- Wholesale Information Other activities Large sized Small Total and retail trade Transport and services and hotels communications
07 II 7.4 7.9 9.2 6.8 5.1 4.1 40.9 4.7 7.9 7.4 8.2 ... III 7.4 7.8 7.5 7.4 7.0 4.8 41.5 5.1 5.4 7.4 7.8 ... IV 8.3 8.4 7.4 8.4 6.9 3.6 39.0 7.2 9.2 8.3 7.6 ...
08 I 5.3 7.6 6.1 4.5 8.7 2.4 23.8 1.9 4.2 5.3 6.5 ... II 6.6 8.7 6.5 6.0 3.1 2.9 27.1 4.9 5.2 6.6 7.1 ... III 6.6 7.9 4.6 6.5 5.9 3.5 27.7 5.1 3.5 6.5 7.5 ... IV 5.8 5.2 -0.1 7.1 3.7 1.7 24.8 7.3 3.1 5.8 5.7 ...
09 I 4.2 5.5 0.8 4.3 6.4 1.0 26.9 2.9 2.2 4.2 3.2 ... II 4.7 5.4 1.5 4.9 2.4 1.3 27.3 4.4 3.7 4.7 4.0 ... III 5.3 5.6 3.3 5.6 6.2 2.0 27.4 4.6 3.3 5.3 4.8 ... IV 5.7 6.0 2.5 6.2 4.9 0.8 26.1 6.3 3.7 5.8 3.8 ...
10 I 4.3 5.3 2.6 4.1 8.6 0.9 26.0 2.5 4.4 4.3 4.0 ... II 5.1 5.4 4.6 5.1 4.5 2.1 28.2 4.3 5.3 5.1 5.5 ... III 5.6 5.6 4.1 5.9 6.6 2.7 29.1 5.0 4.5 5.6 6.3 ... IV 5.5 5.4 3.8 5.9 6.9 1.5 24.0 5.8 1.0 5.5 6.0 ...
11 I 4.2 5.0 4.3 3.9 8.4 1.0 21.8 2.7 3.4 4.2 6.1 ... II 4.5 4.3 4.3 4.7 3.6 2.3 26.3 4.0 6.0 4.5 6.1 ... III 5.1 5.2 3.9 5.2 6.1 2.9 27.1 4.5 5.7 5.1 6.8 ... IV 5.0 5.0 4.3 5.1 4.5 1.3 20.4 5.6 5.0 5.0 4.9 ...
12 I 3.6 5.2 2.4 2.9 8.1 0.7 22.4 1.7 7.6 3.5 5.2 ... II 3.7 4.0 4.2 3.5 1.9 1.7 24.7 2.9 6.6 3.7 5.8 ... III 4.9 6.5 2.2 4.2 5.6 2.8 28.9 2.9 7.8 4.9 3.9 ...
BANCO DE ESPAÑA 286 BOLETÍN ESTADÍSTICO, FEBRUARY 2013

1 2 3 4 5 6 7 8 9 10 11 12
15 NON-FINANCIAL CORPORATIONS: 15.9 Significant ratios: R.1 Return onSummary information compiled by investment (ROI). Quarterly database (CBQ)the Central Balance Sheet Data Office
See notes at the end of the chapter.
Cumulative quarters (a) % (b) Branches of activity By size Services
Total Energy Industry Other Medium- Wholesale Information Other activities Large sized Small Total and retail trade Transport and services and hotels communications
98 9.3 8.8 11.2 9.1 10.8 4.7 14.1 8.6 8.1 9.2 11.2 ... 99 8.2 8.3 10.4 7.4 11.0 4.4 9.5 6.1 8.2 8.1 10.8 ... 00 8.2 9.0 12.1 6.8 9.2 4.8 13.9 5.3 11.1 8.1 11.9 ... 01 8.1 9.3 10.1 7.0 11.4 4.9 15.5 5.2 14.0 8.1 9.9 ... 02 8.8 11.1 8.9 7.8 11.3 5.9 20.5 5.9 12.2 8.8 9.3 ...
03 8.2 8.7 8.9 7.8 10.7 4.7 26.1 5.6 12.4 8.2 8.7 ... 04 8.2 9.0 9.4 7.5 9.2 4.6 26.3 5.3 11.8 8.2 8.9 ... 05 9.0 10.4 8.3 8.5 8.5 4.0 26.2 7.2 12.7 9.1 7.5 ... 06 9.4 10.1 8.9 9.1 7.9 3.9 37.1 8.0 10.5 9.4 7.1 ... 07 8.8 9.1 8.8 8.8 7.5 4.0 39.6 7.6 8.0 8.9 7.9 ...
08 7.5 8.4 5.1 7.7 5.7 2.7 26.1 7.4 4.7 7.5 7.0 ... 09 6.2 6.9 2.5 6.5 5.0 1.3 27.1 6.5 3.6 6.2 4.3 ... 10 6.3 6.4 4.5 6.5 7.6 1.9 27.1 6.3 4.6 6.3 5.8 ... 11 5.6 5.5 5.0 5.8 5.8 1.9 24.0 5.8 6.3 5.6 6.5 ...
10 IV 6.3 6.4 4.5 6.5 7.6 1.9 27.1 6.3 4.6 6.3 5.8 ...
11 I 4.2 5.0 4.3 3.9 8.4 1.0 21.8 2.7 3.4 4.2 6.1 ... II 4.7 4.9 4.6 4.7 5.7 1.7 24.2 4.0 5.0 4.7 6.2 ... III 5.1 5.2 4.5 5.1 6.0 2.2 25.2 4.5 6.2 5.1 6.5 ... IV 5.6 5.5 5.0 5.8 5.8 1.9 24.0 5.8 6.3 5.6 6.5 ...
12 I 3.6 5.2 2.4 2.9 8.1 0.7 22.4 1.7 7.6 3.5 5.2 ... II 4.0 5.1 3.6 3.6 4.7 1.2 23.7 3.0 7.3 4.0 5.5 ... III 4.4 5.9 3.4 3.8 5.2 1.8 25.5 3.0 7.6 4.4 5.1 ...
1 2 3 4 5 6 7 8 9 10 11 12
15 NON-FINANCIAL CORPORATIONS: 15.10 Significant ratios: R.2 Interest on borrowed funds /Summary information compiled by interest-bearing borrowing (outstanding balances).the Central Balance Sheet Data Office Annual database (CBA)
See notes at the end of the chapter.
% (a) Branches of activity By size Services
Total Energy Industry Other Medium- Wholesale Information Other activities Large sized Small Total and retail trade Transport and services and hotels communications
90 12.5 12.4 13.4 11.7 13.7 10.3 12.5 11.1 13.9 12.3 14.4 15.2 91 12.1 11.5 13.2 11.9 13.3 10.5 12.9 11.3 13.7 11.9 14.3 16.5 92 11.5 11.0 12.5 11.2 13.5 10.0 11.7 10.7 12.9 11.3 13.5 14.6 93 11.1 10.6 12.4 10.5 13.0 9.7 10.9 9.7 13.1 10.9 12.9 14.7 94 9.1 8.3 9.7 9.1 10.0 8.6 10.0 8.2 10.4 8.9 10.0 12.6
95 9.0 8.3 9.7 8.8 9.5 8.7 9.8 7.7 11.3 8.8 10.5 12.3 96 8.1 7.4 8.4 8.2 8.8 8.0 9.4 7.0 9.9 7.9 9.2 11.1 97 6.9 6.0 7.2 7.2 6.9 7.3 8.3 6.2 7.5 6.8 7.3 8.8 98 5.7 5.1 6.0 6.0 5.4 6.4 6.8 5.3 5.9 5.7 6.0 7.0 99 4.8 4.2 4.5 5.1 4.4 5.4 6.6 3.9 4.3 4.8 4.5 5.4
00 5.0 4.7 5.8 5.0 5.0 5.7 5.1 4.7 4.8 5.0 4.9 5.7 01 5.1 4.7 5.7 5.1 5.0 5.6 5.1 4.9 5.2 5.0 5.2 6.1 02 4.4 3.9 4.8 4.4 4.6 4.5 4.6 4.2 4.5 4.3 4.6 5.3 03 3.9 3.5 3.9 4.0 3.8 3.4 4.4 4.1 3.9 3.9 3.8 4.4 04 3.6 3.3 3.6 3.7 3.7 3.1 4.6 3.6 3.8 3.6 3.4 3.8
05 3.7 3.4 3.9 3.8 3.9 2.8 4.6 3.8 3.5 3.7 3.5 3.7 06 4.0 3.7 4.2 4.1 4.5 3.1 4.5 4.1 3.9 4.1 3.9 4.1 07 4.8 4.4 5.1 4.7 4.9 3.5 5.7 4.7 5.5 4.8 4.8 4.8 08 5.2 5.0 5.2 5.1 5.4 4.2 5.6 5.2 5.8 5.2 5.5 5.6 09 3.6 3.7 3.6 3.5 3.7 2.7 4.8 3.4 3.5 3.5 3.9 4.6
10 3.3 3.2 3.7 3.3 3.6 2.2 4.1 3.3 3.0 3.3 3.3 3.5 11 3.6 3.5 3.9 3.6 4.1 2.9 3.9 3.7 3.5 3.6 3.6 3.8
BANCO DE ESPAÑA 287 BOLETÍN ESTADÍSTICO, FEBRUARY 2013

1 2 3 4 5 6 7 8 9 10 11 12
15 NON-FINANCIAL CORPORATIONS: 15.11 Significant ratios: R.2 Interest on borrowed funds /Summary information compiled by interest-bearing borrowing (outstanding balances).the Central Balance Sheet Data Office Quarterly database (CBQ)
See notes at the end of the chapter.
% (a) Branches of activity By size Services
Total Energy Industry Other Medium- Wholesale Information Other activities Large sized Small Total and retail trade Transport and services and hotels communications
07 II 4.3 4.2 4.0 4.4 4.1 3.8 5.4 4.5 3.9 4.3 4.3 ... III 4.6 4.2 5.0 4.7 4.9 4.0 5.6 4.7 4.6 4.6 4.4 ... IV 4.8 4.7 4.7 4.9 5.2 4.1 5.9 4.9 4.6 4.8 5.2 ...
08 I 4.9 4.4 4.8 5.0 4.7 4.0 6.1 5.0 5.2 4.9 4.7 ... II 5.1 4.6 5.2 5.1 4.1 4.2 6.2 5.2 6.2 5.1 4.5 ... III 5.1 4.9 4.9 5.2 4.8 3.9 6.0 5.3 5.6 5.1 5.2 ... IV 5.1 5.1 4.9 5.1 5.1 4.1 5.8 5.2 6.2 5.1 10.6 ...
09 I 3.7 3.9 3.7 3.7 4.1 3.0 4.8 3.7 3.2 3.7 4.1 ... II 3.3 3.6 3.6 3.2 3.0 2.6 4.4 3.3 2.7 3.3 3.7 ... III 3.1 3.3 3.7 2.9 2.9 2.5 4.3 2.9 2.7 3.1 3.2 ... IV 3.2 3.3 3.6 3.2 3.4 2.5 5.3 3.1 2.8 3.2 4.3 ...
10 I 3.0 3.2 3.5 2.9 2.9 2.1 4.6 3.0 2.8 3.0 2.7 ... II 3.4 3.5 3.8 3.3 3.0 2.2 5.0 3.4 3.1 3.4 2.9 ... III 3.2 3.2 4.0 3.1 3.3 2.3 4.4 3.1 3.2 3.2 2.8 ... IV 3.3 3.2 4.2 3.3 3.5 2.0 3.4 3.5 2.8 3.3 4.3 ...
11 I 3.4 3.2 4.0 3.4 3.7 2.4 4.3 3.6 3.1 3.4 2.8 ... II 3.5 3.4 4.1 3.4 3.3 2.6 4.2 3.6 3.0 3.5 3.2 ... III 3.6 3.3 4.1 3.7 3.9 2.8 3.7 3.9 3.1 3.6 3.4 ... IV 3.7 3.6 4.2 3.7 4.1 3.2 3.9 3.9 4.0 3.7 4.2 ...
12 I 3.6 3.5 4.4 3.5 3.8 2.6 3.3 3.7 3.9 3.6 3.3 ... II 3.6 3.6 4.5 3.5 3.2 2.5 3.5 3.8 3.4 3.6 3.3 ... III 3.4 3.6 3.4 3.3 3.5 2.4 3.3 3.6 4.0 3.4 3.2 ...
1 2 3 4 5 6 7 8 9 10 11 12
15 NON-FINANCIAL CORPORATIONS: 15.12 Significant ratios: R.2 Interest on borrowed funds /Summary information compiled by interest-bearing borrowing (outstanding balances).the Central Balance Sheet Data Office Quarterly database (CBQ)
See notes at the end of the chapter.
Cumulative quarters (a) % (b) Branches of activity By size Services
Total Energy Industry Other Medium- Wholesale Information Other activities Large sized Small Total and retail trade Transport and services and hotels communications
98 6.4 5.9 5.6 7.0 6.0 6.5 7.7 7.3 6.5 6.4 6.4 ... 99 5.0 4.7 4.6 5.3 4.7 5.2 6.0 4.4 5.0 5.0 4.6 ... 00 5.2 5.3 6.1 5.1 4.9 5.9 6.1 4.7 5.2 5.2 5.7 ... 01 5.1 5.0 6.1 5.0 4.8 5.5 5.5 4.7 6.7 5.1 5.8 ... 02 4.4 4.4 4.6 4.4 4.3 4.9 5.1 4.2 5.3 4.4 4.8 ...
03 4.1 3.5 4.1 4.2 3.8 3.6 5.2 4.1 4.2 4.1 4.1 ... 04 3.7 3.5 3.8 3.8 3.6 3.2 4.7 3.7 3.7 3.7 3.7 ... 05 3.6 3.4 3.9 3.7 3.5 3.0 4.3 3.7 3.2 3.6 3.2 ... 06 3.9 3.6 4.0 4.0 3.6 3.4 5.6 4.0 3.2 3.9 3.6 ... 07 4.5 4.3 4.5 4.6 4.5 3.9 5.6 4.6 4.2 4.5 4.4 ...
08 5.1 4.8 5.0 5.1 4.6 4.0 6.0 5.2 5.8 5.0 6.2 ... 09 3.3 3.5 3.6 3.3 3.3 2.7 4.7 3.3 2.9 3.3 3.8 ... 10 3.2 3.3 3.9 3.1 3.2 2.1 4.4 3.3 3.0 3.2 3.2 ... 11 3.5 3.4 4.1 3.6 3.7 2.8 4.0 3.8 3.3 3.5 3.4 ...
10 IV 3.2 3.3 3.9 3.1 3.2 2.1 4.4 3.3 3.0 3.2 3.2 ...
11 I 3.4 3.2 4.0 3.4 3.7 2.4 4.3 3.6 3.1 3.4 2.8 ... II 3.4 3.3 4.0 3.4 3.5 2.5 4.3 3.6 3.1 3.4 3.0 ... III 3.5 3.3 4.1 3.5 3.6 2.6 4.1 3.7 3.1 3.5 3.1 ... IV 3.5 3.4 4.1 3.6 3.7 2.8 4.0 3.8 3.3 3.5 3.4 ...
12 I 3.6 3.5 4.4 3.5 3.8 2.6 3.3 3.7 3.9 3.6 3.3 ... II 3.6 3.6 4.4 3.5 3.5 2.6 3.4 3.8 3.7 3.6 3.3 ... III 3.5 3.6 4.2 3.4 3.5 2.5 3.4 3.7 3.8 3.5 3.3 ...
BANCO DE ESPAÑA 288 BOLETÍN ESTADÍSTICO, FEBRUARY 2013

1 2 3 4 5 6 7 8 9 10 11 12
15 NON FINANCIAL CORPORATIONS: 15.13 Significant ratios: R.3 Ordinary returnSummary information compiled by on equity. Annual database (CBA)the Central Balance Sheet Data Office
See notes at the end of the chapter.
% (a) Branches of activity By size Services
Total Energy Industry Other Medium- Wholesale Information Other activities Large sized Small Total and retail trade Transport and services and hotels communications
90 7.0 4.5 8.0 7.7 18.3 1.0 6.1 7.2 12.7 6.7 9.2 11.5 91 5.2 5.4 2.4 6.5 11.0 1.8 7.1 7.3 10.6 4.9 7.1 10.7 92 3.7 5.4 -1.1 5.0 6.9 1.7 8.8 3.5 9.4 3.4 5.6 6.8 93 2.5 7.2 -5.0 3.7 6.8 -1.6 8.1 3.2 4.7 2.3 4.1 4.8 94 5.7 7.1 5.0 4.9 9.0 0.4 9.6 3.4 6.9 5.2 8.9 8.5
95 7.9 7.4 11.2 6.4 11.9 1.7 10.8 4.7 7.6 7.5 10.9 10.2 96 8.2 8.0 10.0 7.5 12.1 2.3 11.8 6.6 7.2 7.8 11.2 10.0 97 9.5 7.6 12.0 9.3 12.4 3.4 14.3 10.7 8.4 9.1 12.1 11.6 98 11.0 9.2 13.7 10.6 14.8 4.2 18.3 9.0 10.4 10.6 14.1 12.6 99 10.7 10.0 13.4 9.5 16.4 3.6 13.1 7.0 11.2 10.2 14.9 13.2
00 10.1 12.8 12.6 7.3 14.5 3.6 11.1 4.7 12.8 9.7 13.8 11.8 01 10.5 12.8 10.8 9.3 15.5 4.6 25.1 6.0 13.3 10.3 13.2 11.5 02 11.4 14.9 9.8 10.7 15.3 5.9 32.0 7.4 13.2 11.5 11.5 10.0 03 11.5 11.5 10.6 11.8 14.4 5.8 42.5 7.7 12.4 11.7 10.7 9.3 04 12.3 11.7 12.4 11.8 14.3 4.5 53.9 7.4 19.6 12.5 11.3 9.4
05 13.2 14.1 11.7 12.7 13.1 3.7 45.1 10.8 18.9 13.6 9.9 8.9 06 13.5 14.5 12.3 12.6 12.3 3.7 31.9 12.8 20.8 13.9 10.2 8.6 07 12.7 11.7 14.2 12.5 12.0 3.6 42.6 11.7 12.8 13.0 9.9 8.6 08 9.9 9.8 8.7 10.7 9.3 1.9 44.2 10.2 6.2 10.3 6.6 4.5 09 8.7 8.9 4.3 10.0 10.2 0.9 43.3 10.3 6.4 9.0 5.2 3.3
10 8.3 8.2 7.5 9.3 10.0 1.9 39.7 8.8 -1.2 8.6 5.4 3.5 11 7.5 7.2 7.9 7.8 11.0 1.5 34.2 6.7 1.6 7.6 6.5 2.9
1 2 3 4 5 6 7 8 9 10 11 12
15 NON-FINANCIAL CORPORATIONS: 15.14 Significant ratios: R.3 Ordinary returnSummary information compiled by on equity. Quarterly database (CBQ)the Central Balance Sheet Data Office
See notes at the end of the chapter.
% (a) (b) Branches of activity By size Services
Total Energy Industry Other Medium- Wholesale Information Other activities Large sized Small Total and retail trade Transport and services and hotels communications
07 II 10.4 10.6 13.4 9.5 5.4 4.3 80.8 5.1 13.9 10.5 9.6 ... III 10.2 10.3 9.8 10.5 7.7 5.2 82.8 5.9 6.5 10.2 8.8 ... IV 11.8 11.0 9.9 12.2 7.5 3.4 71.1 11.0 16.2 11.9 8.5 ...
08 I 5.7 9.6 7.5 3.9 10.2 1.6 43.7 -3.0 2.4 5.7 7.2 ... II 8.1 11.2 7.8 7.0 2.8 2.4 51.7 4.4 3.1 8.1 8.0 ... III 7.9 9.8 4.3 7.9 6.3 3.3 55.2 4.9 -2.0 7.9 8.2 ... IV 6.5 5.3 -5.3 9.1 3.3 0.6 48.1 10.4 -5.4 6.6 4.0 ...
09 I 4.6 6.6 -2.2 4.8 7.3 - 51.0 1.8 -0.9 4.7 2.9 ... II 6.0 6.6 -0.5 6.6 2.2 0.7 53.9 6.0 6.5 6.0 4.2 ... III 7.3 7.2 3.0 8.1 7.5 1.8 53.0 6.8 5.2 7.4 5.3 ... IV 8.0 7.9 1.4 8.9 5.5 -0.1 44.1 10.4 7.4 8.1 3.7 ...
10 I 5.5 6.8 1.7 5.2 10.9 0.3 44.7 1.9 9.0 5.5 4.4 ... II 6.7 6.7 5.4 6.7 5.2 2.0 50.9 5.4 11.8 6.7 6.4 ... III 7.9 7.2 4.3 8.5 8.0 2.9 51.4 7.4 8.8 7.9 7.3 ... IV 7.4 7.0 3.4 8.3 8.3 1.3 40.6 8.6 -5.9 7.4 6.6 ...
11 I 5.0 6.3 4.5 4.3 10.4 0.1 33.1 1.7 4.3 4.9 7.3 ... II 5.5 4.9 4.4 5.8 3.8 2.2 36.8 4.4 17.3 5.4 7.0 ... III 6.5 6.6 3.7 6.7 7.0 2.9 39.0 5.2 15.9 6.5 7.9 ... IV 6.1 6.0 4.4 6.4 4.7 -0.1 29.2 7.9 10.3 6.2 5.2 ...
12 I 3.6 6.3 0.9 2.4 10.1 -0.9 32.6 -0.9 11.2 3.5 5.8 ... II 3.8 4.3 4.0 3.4 1.2 1.1 35.7 1.7 10.0 3.8 6.6 ... III 6.2 8.2 1.1 5.2 6.3 3.1 40.4 2.0 12.1 6.2 4.2 ...
BANCO DE ESPAÑA 289 BOLETÍN ESTADÍSTICO, FEBRUARY 2013

1 2 3 4 5 6 7 8 9 10 11 12
15 NON-FINANCIAL CORPORATIONS: 15.15 Significant ratios: R.3 Ordinary returnSummary information compiled by on equity. Quarterly database (CBQ)the Central Balance Sheet Data Office
See notes at the end of the chapter.
Cumulative quarters (a) % (b) Branches of activity By size Services
Total Energy Industry Other Medium- Wholesale Information Other activities Large sized Small Total and retail trade Transport and services and hotels communications
98 10.5 10.0 12.8 10.2 12.3 3.8 17.9 9.6 9.0 10.4 12.5 ... 99 10.1 10.3 12.8 9.0 12.8 4.0 13.2 8.0 10.0 10.0 12.4 ... 00 10.5 11.6 14.5 8.4 10.6 4.4 22.1 6.0 15.2 10.4 13.5 ... 01 10.6 12.6 11.8 9.0 13.8 4.5 36.5 5.7 19.0 10.6 11.2 ... 02 12.9 15.5 10.9 11.8 13.9 6.5 64.7 8.1 17.6 12.9 10.6 ...
03 12.1 12.4 11.1 11.8 13.1 5.5 85.6 7.4 19.3 12.2 10.0 ... 04 12.0 12.5 12.3 11.3 11.1 5.4 69.5 7.2 20.7 12.1 10.6 ... 05 13.7 15.1 10.8 13.3 10.0 4.4 61.9 11.9 23.3 13.9 9.0 ... 06 14.5 14.9 12.3 14.5 9.3 4.2 78.3 14.1 19.2 14.7 8.4 ... 07 13.1 12.5 12.5 13.5 8.5 4.1 76.3 12.6 13.5 13.3 9.1 ...
08 9.7 10.6 5.3 10.3 6.1 2.1 50.1 10.5 2.1 9.8 7.3 ... 09 8.8 9.4 1.5 9.6 5.7 0.7 50.7 10.6 5.9 8.9 4.4 ... 10 9.0 8.6 5.2 9.6 9.4 1.7 47.2 9.9 10.0 9.1 6.7 ... 11 7.5 7.1 5.6 7.9 6.7 1.4 34.8 8.5 18.7 7.5 7.6 ...
10 IV 9.0 8.6 5.2 9.6 9.4 1.7 47.2 9.9 10.0 9.1 6.7 ...
11 I 5.0 6.3 4.5 4.3 10.4 0.1 33.1 1.7 4.3 4.9 7.3 ... II 5.9 6.0 5.0 5.9 6.7 1.2 35.3 4.6 12.3 5.9 7.3 ... III 6.5 6.6 4.8 6.6 7.1 1.9 36.7 5.4 17.8 6.5 7.6 ... IV 7.5 7.1 5.6 7.9 6.7 1.4 34.8 8.5 18.7 7.5 7.6 ...
12 I 3.6 6.3 0.9 2.4 10.1 -0.9 32.6 -0.9 11.2 3.5 5.8 ... II 4.4 6.0 3.0 3.7 5.2 0.1 34.4 1.9 11.1 4.4 6.3 ... III 5.3 7.4 2.8 4.3 5.9 1.2 36.5 2.0 11.8 5.3 5.7 ...
1 2 3 4 5 6 7 8 9 10 11 12
15 NON-FINANCIAL CORPORATIONS: 15.16 Significant ratios: R.4 ROI -Summary information compiled by cost of debt (R.1 - R.2)the Central Balance Sheet Data Office Annual database (CBA)
See notes at the end of the chapter.
% (a) Branches of activity By size Services
Total Energy Industry Other Medium- Wholesale Information Other activities Large sized Small Total and retail trade Transport and services and hotels communications
90 -3.5 -4.6 -3.8 -2.6 3.4 -5.8 -4.1 -2.6 -0.7 -3.5 -3.7 -2.6 91 -4.4 -3.6 -7.4 -3.4 -1.7 -5.4 -3.4 -2.5 -1.9 -4.4 -5.0 -4.0 92 -4.8 -3.3 -8.9 -3.8 -4.9 -5.2 -1.5 -4.2 -2.0 -4.8 -5.4 -5.1 93 -5.1 -2.1 -10.8 -4.0 -4.3 -6.6 -1.5 -3.7 -4.9 -5.1 -5.8 -6.5 94 -2.0 -0.8 -2.9 -2.4 -0.7 -4.9 -0.2 -2.6 -2.1 -2.2 -0.8 -2.6
95 -0.7 -0.6 1.0 -1.5 1.6 -4.4 0.5 -1.7 -2.2 -0.8 0.3 -1.4 96 0.1 0.4 1.1 -0.5 2.2 -3.7 1.4 -0.2 -1.8 - 1.3 -0.8 97 1.7 1.1 3.4 1.3 3.8 -2.6 3.5 2.5 0.6 1.6 3.3 1.9 98 3.5 2.8 5.6 2.9 6.4 -1.5 6.7 1.9 3.0 3.2 5.6 3.7 99 3.6 3.6 6.5 2.5 8.4 -1.2 3.3 1.5 4.4 3.3 6.9 4.8
00 2.9 4.6 4.8 1.3 6.4 -1.4 2.9 - 5.1 2.7 5.8 3.7 01 3.0 4.4 3.4 2.2 6.7 -0.6 6.8 0.5 5.0 2.9 5.1 3.3 02 3.8 6.5 3.2 3.1 7.0 0.9 8.6 1.5 5.3 3.8 4.4 3.0 03 4.1 4.8 4.3 3.8 7.1 1.4 12.0 1.6 5.1 4.1 4.3 3.0 04 4.8 5.1 5.8 4.1 7.3 0.9 16.9 1.7 7.8 4.8 5.1 3.5
05 5.2 6.4 5.0 4.7 6.4 0.6 16.4 3.2 7.4 5.4 4.1 3.3 06 5.1 6.3 5.0 4.4 5.4 0.4 11.9 3.7 7.4 5.2 4.0 2.9 07 4.1 4.4 5.4 3.9 4.9 - 15.7 2.9 3.0 4.2 3.3 2.5 08 2.5 2.9 2.1 2.8 2.5 -1.5 16.4 2.2 0.2 2.7 0.7 -0.8 09 2.7 3.1 0.4 3.3 4.1 -1.2 15.5 3.0 1.0 2.8 0.9 -0.9
10 2.6 2.9 2.3 3.1 4.1 -0.2 17.4 2.4 -1.3 2.7 1.4 - 11 2.0 2.2 2.4 2.1 4.3 -0.8 15.8 1.3 -0.5 2.0 1.9 -0.6
BANCO DE ESPAÑA 290 BOLETÍN ESTADÍSTICO, FEBRUARY 2013

1 2 3 4 5 6 7 8 9 10 11 12
15 NON-FINANCIAL CORPORATIONS: 15.17 Significant ratios: R.4 ROI -Summary information compiled by cost of debt (R.1 - R.2)the Central Balance Sheet Data Office Quarterly database (CBQ)
See notes at the end of the chapter.
% (a) (b) Branches of activity By size Services
Total Energy Industry Other Medium- Wholesale Information Other activities Large sized Small Total and retail trade Transport and services and hotels communications
07 II 3.1 3.7 5.2 2.4 1.0 0.3 35.6 0.3 4.0 3.1 3.9 ... III 2.8 3.6 2.5 2.7 2.2 0.8 36.0 0.4 0.8 2.8 3.3 ... IV 3.5 3.8 2.7 3.5 1.8 -0.5 33.1 2.3 4.6 3.5 2.5 ...
08 I 0.4 3.2 1.3 -0.5 4.1 -1.6 17.7 -3.1 -1.0 0.4 1.8 ... II 1.6 4.1 1.3 1.0 -1.0 -1.2 21.0 -0.3 -1.0 1.6 2.6 ... III 1.4 3.0 -0.3 1.4 1.1 -0.4 21.8 -0.2 -2.1 1.4 2.2 ... IV 0.7 0.1 -5.0 2.1 -1.3 -2.4 18.9 2.2 -3.0 0.8 -4.9 ...
09 I 0.5 1.6 -2.9 0.6 2.4 -1.9 22.1 -0.8 -1.1 0.5 -0.9 ... II 1.4 1.8 -2.1 1.7 -0.6 -1.3 22.9 1.2 0.9 1.4 0.4 ... III 2.2 2.3 -0.4 2.6 3.3 -0.5 23.1 1.7 0.6 2.2 1.6 ... IV 2.5 2.7 -1.2 3.0 1.5 -1.7 20.8 3.2 1.0 2.6 -0.5 ...
10 I 1.3 2.1 -0.8 1.2 5.7 -1.1 21.4 -0.5 1.5 1.3 1.3 ... II 1.7 1.9 0.8 1.8 1.5 -0.1 23.2 0.9 2.2 1.7 2.7 ... III 2.5 2.4 0.1 2.8 3.3 0.4 24.7 1.9 1.3 2.5 3.5 ... IV 2.2 2.2 -0.4 2.6 3.4 -0.5 20.6 2.3 -1.9 2.2 1.8 ...
11 I 0.8 1.8 0.3 0.5 4.7 -1.4 17.5 -0.8 0.3 0.8 3.4 ... II 1.1 0.9 0.2 1.2 0.4 -0.3 22.1 0.3 3.0 1.0 2.9 ... III 1.5 1.9 -0.2 1.6 2.2 0.1 23.4 0.5 2.6 1.5 3.4 ... IV 1.3 1.4 0.1 1.4 0.4 -1.9 16.5 1.7 1.0 1.3 0.8 ...
12 I - 1.7 -2.0 -0.5 4.3 -1.9 19.1 -2.0 3.6 - 1.9 ... II 0.1 0.5 -0.3 -0.1 -1.4 -0.8 21.2 -0.9 3.2 0.1 2.5 ... III 1.5 2.9 -1.2 0.9 2.1 0.4 25.6 -0.7 3.8 1.5 0.8 ...
1 2 3 4 5 6 7 8 9 10 11 12
15 NON-FINANCIAL CORPORATIONS: 15.18 Significant ratios: R.4 ROI -Summary information compiled by cost of debt (R.1 - R.2)the Central Balance Sheet Data Office Quarterly database (CBQ)
See notes at the end of the chapter.
Cumulative quarters (a) % (b) Branches of activity By size Services
Total Energy Industry Other Medium- Wholesale Information Other activities Large sized Small Total and retail trade Transport and services and hotels communications
98 2.8 2.8 5.6 2.1 4.8 -1.8 6.4 1.2 1.6 2.7 4.8 ... 99 3.1 3.6 5.8 2.1 6.3 -0.8 3.5 1.7 3.2 3.0 6.2 ... 00 3.0 3.7 6.0 1.7 4.3 -1.0 7.8 0.6 5.9 2.9 6.2 ... 01 3.1 4.3 4.0 2.1 6.6 -0.6 10.0 0.5 7.3 3.0 4.2 ... 02 4.4 6.7 4.3 3.4 7.0 1.0 15.5 1.7 6.8 4.4 4.5 ...
03 4.2 5.2 4.8 3.6 6.9 1.1 20.9 1.4 8.2 4.2 4.6 ... 04 4.4 5.5 5.6 3.7 5.6 1.3 21.6 1.6 8.2 4.4 5.2 ... 05 5.4 7.0 4.4 4.8 4.9 0.9 21.9 3.5 9.5 5.4 4.3 ... 06 5.5 6.5 4.8 5.1 4.3 0.5 31.5 4.0 7.3 5.5 3.5 ... 07 4.3 4.9 4.3 4.2 2.9 0.2 34.1 2.9 3.8 4.4 3.4 ...
08 2.4 3.6 0.2 2.6 1.1 -1.3 20.1 2.2 -1.1 2.5 0.8 ... 09 2.9 3.4 -1.1 3.2 1.7 -1.3 22.4 3.2 0.7 2.9 0.5 ... 10 3.1 3.1 0.7 3.4 4.4 -0.3 22.7 3.0 1.7 3.1 2.7 ... 11 2.1 2.2 0.9 2.2 2.0 -0.8 19.9 2.1 3.1 2.1 3.2 ...
10 IV 3.1 3.1 0.7 3.4 4.4 -0.3 22.7 3.0 1.7 3.1 2.7 ...
11 I 0.8 1.8 0.3 0.5 4.7 -1.4 17.5 -0.8 0.3 0.8 3.4 ... II 1.3 1.5 0.5 1.3 2.2 -0.8 19.9 0.4 2.0 1.3 3.2 ... III 1.6 1.9 0.4 1.6 2.4 -0.4 21.1 0.8 3.1 1.6 3.4 ... IV 2.1 2.2 0.9 2.2 2.0 -0.8 19.9 2.1 3.1 2.1 3.2 ...
12 I - 1.7 -2.0 -0.5 4.3 -1.9 19.1 -2.0 3.6 - 1.9 ... II 0.5 1.5 -0.8 0.1 1.2 -1.3 20.3 -0.8 3.6 0.4 2.2 ... III 0.9 2.4 -0.8 0.4 1.6 -0.7 22.1 -0.7 3.9 0.9 1.8 ...
BANCO DE ESPAÑA 291 BOLETÍN ESTADÍSTICO, FEBRUARY 2013

1 2 3 4 5 6 7 8 9 10 11 12
15 NON-FINANCIAL CORPORATIONS: 15.19 Significant ratios: R.5 Operating marginSummary information compiled by (Gross operating profit / Output).the Central Balance Sheet Data Office Annual database (CBA)
See notes at the end of the chapter.
% (a) Branches of activity By size Services
Total Energy Industry Other Medium- Wholesale Information Other activities Large sized Small Total and retail trade Transport and services and hotels communications
90 16.7 30.9 9.6 25.2 23.9 18.3 45.2 9.7 8.3 17.5 12.3 12.8 91 16.3 32.2 8.3 25.1 19.1 22.0 46.5 8.4 8.1 17.1 11.8 13.4 92 15.9 32.0 6.9 24.5 16.6 22.3 45.6 8.3 9.5 16.6 12.0 12.2 93 15.7 31.9 5.9 23.8 16.7 19.9 44.2 8.0 7.9 16.4 11.6 11.5 94 16.7 30.8 9.4 25.0 18.0 20.9 45.3 9.2 7.5 17.5 12.5 12.7
95 16.7 30.0 10.5 24.7 19.9 20.3 44.1 9.4 6.7 17.6 12.5 12.9 96 16.2 28.9 9.5 23.6 19.3 21.3 37.4 9.8 7.1 16.9 12.7 12.9 97 16.2 26.6 10.3 24.3 20.1 22.4 36.2 11.1 7.2 17.0 12.3 12.3 98 16.3 27.2 10.5 23.4 20.7 21.8 35.2 9.3 7.4 17.2 12.8 12.4 99 15.8 24.5 10.2 22.0 21.5 19.0 30.3 9.4 8.0 16.3 13.4 12.9
00 15.2 24.0 9.8 20.0 20.5 18.5 27.5 6.8 9.2 15.6 13.1 12.9 01 15.6 21.7 9.3 22.2 20.7 19.6 32.0 9.0 9.7 16.0 13.4 13.7 02 16.0 21.7 9.0 23.3 21.9 19.1 33.9 10.5 9.8 16.4 13.3 13.6 03 16.3 21.4 9.3 23.5 21.5 19.6 35.2 9.2 11.2 16.9 13.0 13.1 04 16.6 21.2 9.8 22.9 21.8 18.8 34.9 8.9 13.2 17.2 13.1 13.5
05 15.7 19.2 9.1 21.7 21.2 16.2 33.9 8.4 13.0 16.2 12.3 13.8 06 15.6 18.6 9.4 21.0 21.1 17.3 31.8 7.8 14.1 16.0 12.4 13.1 07 15.5 18.3 10.1 20.8 20.9 16.1 32.1 9.0 12.5 15.9 12.8 13.1 08 14.2 16.9 8.9 19.5 18.5 13.8 33.2 8.7 7.8 14.6 11.3 10.6 09 13.7 18.5 7.8 18.0 17.2 13.7 31.4 8.4 8.1 14.1 11.1 9.7
10 14.0 17.4 8.8 18.6 17.3 15.8 30.5 9.3 5.5 14.4 10.9 9.1 11 13.3 14.3 8.1 18.4 17.6 17.0 29.9 7.9 7.4 13.6 10.5 8.3
1 2 3 4 5 6 7 8 9 10 11 12
15 NON-FINANCIAL CORPORATIONS: 15.20 Significant ratios: R.5 Operating marginSummary information compiled by (Gross operating profit / Output).the Central Balance Sheet Data Office Quarterly database (CBQ)
See notes at the end of the chapter.
% (a) Branches of activity By size Services
Total Energy Industry Other Medium- Wholesale Information Other activities Large sized Small Total and retail trade Transport and services and hotels communications
07 II 19.6 21.5 11.4 28.3 17.5 21.5 48.6 6.0 10.4 19.9 14.6 ... III 19.9 20.6 10.6 30.0 20.4 23.9 49.2 6.7 7.3 20.1 15.0 ... IV 17.6 17.0 8.9 26.3 20.9 18.9 46.5 -2.6 14.0 17.7 13.9 ...
08 I 19.9 21.3 10.5 27.8 21.7 18.7 43.9 10.9 8.3 20.2 13.4 ... II 18.7 19.9 9.8 25.7 12.6 19.6 44.4 3.3 9.5 18.9 13.6 ... III 18.5 18.6 7.8 28.0 18.7 21.0 44.9 6.6 4.5 18.7 14.7 ... IV 15.4 17.1 1.7 24.1 19.0 14.2 44.2 -6.5 3.7 15.5 12.8 ...
09 I 19.4 22.7 4.9 25.2 19.8 14.9 41.1 10.6 6.7 19.7 11.6 ... II 18.0 21.1 5.2 23.2 13.0 16.6 41.5 2.4 7.4 18.2 12.4 ... III 19.5 19.4 7.4 26.9 22.4 19.8 42.2 4.9 7.6 19.7 14.5 ... IV 16.8 17.5 3.2 24.3 18.9 15.9 43.0 1.2 8.2 16.9 12.0 ...
10 I 18.9 19.8 7.4 25.2 23.5 17.5 38.0 7.0 6.5 19.1 13.1 ... II 18.4 18.9 9.4 24.1 16.3 21.6 37.3 5.6 6.9 18.5 14.6 ... III 18.8 17.9 8.7 26.0 18.3 23.6 39.3 7.8 5.7 18.9 15.9 ... IV 16.1 16.0 7.0 22.5 17.7 19.1 38.2 -9.2 0.4 16.3 12.7 ...
11 I 16.7 16.5 8.1 23.4 22.5 17.1 33.0 9.7 5.3 16.7 15.9 ... II 15.3 13.6 7.4 23.0 14.6 21.8 34.9 3.1 7.2 15.4 14.8 ... III 16.5 14.2 6.9 25.6 20.4 24.3 35.2 7.3 5.7 16.5 16.8 ... IV 14.4 12.7 7.0 21.0 17.8 17.7 32.0 1.9 8.9 14.5 12.6 ...
12 I 15.0 14.1 5.8 22.4 21.0 16.0 30.9 15.2 8.0 15.0 13.1 ... II 13.8 11.4 6.6 21.3 12.3 20.7 31.5 7.0 12.1 13.8 13.9 ... III 16.5 13.3 4.0 27.6 19.7 26.6 35.6 17.4 9.1 16.6 12.1 ...
BANCO DE ESPAÑA 292 BOLETÍN ESTADÍSTICO, FEBRUARY 2013

1 2 3 4 5 6 7 8 9 10 11 12
15 NON-FINANCIAL CORPORATIONS: 15.21 Significant ratios: R.5 Operating marginSummary information compiled by (Gross operating profit / Output).the Central Balance Sheet Data Office Quarterly database (CBQ)
See notes at the end of the chapter.
Cumulative quarters (a) % (b) Branches of activity By size Services
Total Energy Industry Other Medium- Wholesale Information Other activities Large sized Small Total and retail trade Transport and services and hotels communications
98 23.2 34.1 11.7 30.2 21.5 26.2 41.4 13.8 6.4 23.9 14.3 ... 99 22.2 31.9 11.6 28.4 23.6 22.6 37.9 10.5 9.9 22.7 14.4 ... 00 21.6 28.2 12.1 27.2 25.7 20.9 37.6 1.2 10.4 22.2 13.6 ... 01 22.1 27.7 12.3 29.0 24.2 21.2 42.2 2.6 8.9 22.7 13.5 ... 02 22.5 27.4 12.4 28.9 22.6 22.0 43.1 3.3 11.4 23.0 14.3 ...
03 22.2 26.5 11.6 29.5 22.6 20.3 44.6 13.6 12.4 22.8 13.6 ... 04 21.5 25.6 10.6 29.5 21.8 22.4 43.4 7.5 14.5 22.0 13.5 ... 05 19.9 22.2 10.0 28.2 21.8 20.4 41.3 2.6 11.2 20.2 13.7 ... 06 19.2 19.6 10.3 28.3 20.8 21.0 45.5 -1.0 11.6 19.5 13.8 ... 07 19.3 20.3 10.5 28.4 20.7 21.2 48.0 4.7 10.7 19.5 14.2 ...
08 18.2 19.3 7.9 26.4 18.1 18.4 44.4 3.3 6.5 18.4 13.6 ... 09 18.4 20.0 5.1 24.9 18.6 16.8 41.9 4.6 7.5 18.6 12.6 ... 10 18.1 18.1 8.1 24.5 19.0 20.5 38.2 2.9 5.0 18.2 14.0 ... 11 15.7 14.2 7.4 23.3 18.9 20.4 33.8 5.4 6.7 15.8 15.0 ...
10 IV 18.1 18.1 8.1 24.5 19.0 20.5 38.2 2.9 5.0 18.2 14.0 ...
11 I 16.7 16.5 8.1 23.4 22.5 17.1 33.0 9.7 5.3 16.7 15.9 ... II 16.0 15.0 7.7 23.2 18.7 19.6 33.9 6.4 6.3 16.0 15.3 ... III 16.2 14.7 7.5 24.0 19.3 21.3 34.3 6.7 6.1 16.2 15.8 ... IV 15.7 14.2 7.4 23.3 18.9 20.4 33.8 5.4 6.7 15.8 15.0 ...
12 I 15.0 14.1 5.8 22.4 21.0 16.0 30.9 15.2 8.0 15.0 13.1 ... II 14.4 12.8 6.2 21.8 16.9 18.5 31.2 11.2 9.9 14.4 13.4 ... III 15.1 13.0 5.6 23.7 17.8 21.3 32.7 12.9 9.7 15.1 13.1 ...
1 2 3 4 5 6 7 8 9 10 11 12 13 14
15 NON-FINANCIAL CORPORATIONS: 15.22 Significant ratios: E.1 Debt ratio, External interest-bearing funds /Summary information compiled by Net assets (current prices; end-of-year balance).the Central Balance Sheet Data Office Annual database (CBA)
See notes at the end of the chapter.
% (a) Memorandum item: Branches of activity By size E.2 Debt ratio
Total Wholesale and retail Information and Energy Industry trade and hotels communications Large Total
t-1 t t-1 t t-1 t t-1 t t-1 t t-1 t t-1 t
90 36.1 36.0 43.9 41.2 29.0 30.7 25.5 25.0 34.4 38.5 36.9 36.8 253.7 275.1 91 36.3 37.4 42.3 40.6 30.6 33.1 24.8 27.3 40.1 44.0 37.0 38.2 272.9 293.4 92 37.2 39.6 40.5 41.6 33.3 36.6 25.2 27.3 44.2 48.9 37.8 40.5 290.4 322.9 93 39.8 40.6 41.2 40.3 36.8 39.4 28.1 30.7 48.4 47.8 40.6 41.4 323.6 343.6 94 40.7 38.8 40.2 37.7 39.8 36.2 33.5 30.7 47.8 46.7 41.4 39.5 341.5 281.0
95 38.2 35.8 37.6 35.3 35.5 32.6 30.6 32.7 46.7 42.7 38.9 36.3 276.1 239.3 96 35.7 32.7 34.6 30.2 32.2 28.3 33.4 31.8 43.0 41.2 36.0 32.7 239.1 214.2 97 33.0 33.2 30.5 30.9 28.9 28.0 31.1 31.6 41.2 43.0 33.2 33.4 216.5 207.7 98 32.9 35.1 30.8 33.7 27.4 27.6 32.9 31.4 43.1 40.9 33.0 35.5 206.6 217.9 99 35.5 40.3 34.0 39.7 27.5 27.6 30.4 30.6 43.1 54.3 35.7 41.0 219.4 276.8
00 40.9 43.2 40.9 44.3 29.1 30.8 32.2 34.0 52.7 52.4 41.4 44.0 283.7 327.9 01 44.3 45.2 45.1 45.7 32.6 33.7 36.0 35.6 65.8 66.2 45.0 46.1 331.0 346.8 02 45.7 46.9 41.7 41.6 34.8 35.9 34.8 32.7 66.5 70.6 46.5 48.0 353.6 362.2 03 47.0 45.5 42.1 39.4 35.0 35.1 34.7 32.0 71.1 65.9 48.0 46.5 362.4 351.5 04 45.8 44.8 40.0 39.3 34.7 34.4 33.4 30.1 69.0 62.2 46.8 45.8 352.2 335.5
05 44.9 44.8 39.7 41.3 34.9 37.0 30.8 29.4 63.9 55.9 45.8 45.8 343.4 360.4 06 45.0 47.1 41.1 41.5 37.2 38.1 29.6 30.7 56.1 57.0 45.9 48.2 363.0 418.3 07 47.4 47.4 41.7 38.6 38.2 41.2 31.3 31.8 56.8 57.9 48.6 48.6 419.2 430.0 08 46.7 48.0 39.2 41.1 40.7 42.0 33.9 36.1 55.0 60.3 47.6 49.0 422.4 487.2 09 48.3 47.6 40.2 43.1 42.9 43.3 37.2 36.4 62.4 56.8 49.1 48.5 505.9 592.8
10 48.1 48.1 43.1 42.6 41.9 39.7 36.0 36.6 54.0 48.2 49.0 48.9 624.5 619.2 11 49.0 49.1 42.8 41.2 41.1 40.5 36.9 38.5 53.2 42.3 49.8 49.9 646.1 658.2
BANCO DE ESPAÑA 293 BOLETÍN ESTADÍSTICO, FEBRUARY 2013

1 2 3 4 5 6 7 8 9 10 11 12 13 14
15 NON-FINANCIAL CORPORATIONS: 15.23 Significant ratios: E.1 Debt ratio, External interest-bearing funds /Summary information compiled by Net assets (current prices; end-of-year balance).the Central Balance Sheet Data Office Quarterly database (CBQ)
See notes at the end of the chapter.
% (a) Memorandum item: Branches of activity By size E.2 Debt ratio
Total Wholesale and retail Information and Energy Industry trade and hotels communications Large Total
t-1 t t-1 t t-1 t t-1 t t-1 t t-1 t t-1 t
98 30.8 31.6 28.5 30.7 23.1 22.4 26.8 24.6 41.1 37.6 31.1 31.9 207.1 234.1 99 31.8 39.0 30.8 36.7 26.9 29.8 24.6 22.6 39.9 52.6 32.2 39.6 239.0 278.1 00 38.9 43.1 36.7 41.5 28.0 28.5 23.4 24.7 54.5 50.6 39.5 43.8 276.5 278.4 01 43.5 45.3 40.6 43.5 29.6 29.3 25.3 27.2 62.4 67.8 44.1 45.9 293.3 340.5 02 46.3 48.3 39.0 40.0 31.0 32.0 27.3 27.5 66.0 75.7 46.9 49.0 345.2 375.7
03 48.0 47.8 40.0 41.1 30.0 31.7 27.8 25.0 76.3 72.3 48.7 48.4 362.5 330.5 04 47.7 46.2 41.1 39.2 34.4 33.9 26.2 24.7 74.4 65.4 48.2 46.7 350.8 321.6 05 46.6 46.6 38.7 40.3 35.5 37.7 24.5 23.5 68.5 61.3 47.1 47.1 327.4 346.3 06 47.0 48.6 41.8 42.1 40.0 41.8 24.3 24.6 58.7 56.2 47.5 49.1 349.5 452.1 07 48.5 49.8 41.7 40.8 41.0 46.6 24.1 25.3 57.6 51.1 49.0 50.2 487.3 427.2
08 51.1 47.9 39.6 38.4 49.0 50.4 24.4 26.6 55.8 54.6 51.5 48.3 463.9 626.2 09 48.1 47.6 38.1 41.9 51.2 48.1 26.6 28.9 50.2 50.0 48.5 48.0 615.2 599.3 10 47.7 47.1 41.8 41.7 48.5 49.5 29.1 29.4 52.1 47.0 48.1 47.5 573.3 593.8 11 47.4 47.1 41.7 42.0 47.9 43.0 28.8 31.0 49.1 33.4 47.8 47.4 613.4 654.4
10 IV 47.7 47.1 41.8 41.7 48.5 49.5 29.1 29.4 52.1 47.0 48.1 47.5 573.3 593.8
11 I 47.0 46.1 41.1 41.3 49.9 44.3 29.0 31.5 51.8 33.0 47.4 46.4 752.2 669.1 II 47.4 46.6 41.5 42.0 50.0 43.6 29.3 32.0 50.8 32.3 47.8 46.9 620.3 622.1 III 47.5 46.8 41.4 42.0 49.7 43.7 28.9 31.3 49.9 33.0 47.9 47.1 676.5 700.4 IV 47.4 47.1 41.7 42.0 47.9 43.0 28.8 31.0 49.1 33.4 47.8 47.4 613.4 654.4
12 I 44.5 46.6 38.4 37.4 43.2 41.8 29.6 31.6 35.2 35.4 44.8 46.9 629.8 796.0 II 45.1 47.0 39.0 37.4 42.5 40.9 30.1 31.9 34.1 34.2 45.4 47.4 590.3 654.1 III 45.1 47.1 38.8 37.4 43.1 42.3 27.2 29.0 34.4 32.5 45.4 47.4 626.9 724.1
1 2 3 4 5 6 7 8 9 10 11 12
15 NON-FINANCIAL CORPORATIONS: 15.24 Significant ratios: FSI.1 Total debt to equitySummary information compiled by Integrated database (CBI)the Central Balance Sheet Data Office
See notes at the end of the chapter.
% (a) Branches of activity By size Services
Total Other. Energy Industry Of wich: Medium- (b) Wholesale Information Other Construction Large sized Small Total and retail trade Transport and services and hotels communications
96 93.9 64.8 101.0 97.9 141.1 66.4 106.7 87.5 170.6 88.1 108.1 117.9 97 95.7 65.8 100.9 101.1 148.8 66.2 113.0 86.8 166.9 89.5 108.4 121.0 98 102.1 74.7 101.2 108.0 145.9 67.9 110.2 109.8 164.5 97.0 109.7 121.9 99 114.1 95.0 103.7 120.6 149.5 75.3 157.7 112.0 170.9 112.0 114.5 123.6 00 119.5 107.7 109.8 122.7 153.2 80.2 203.2 108.6 167.7 119.2 116.3 123.0
01 121.6 106.0 112.5 123.8 147.2 88.3 258.9 104.3 173.3 124.2 113.6 116.6 02 125.5 101.4 112.8 131.4 144.2 95.6 300.5 114.1 167.3 132.3 114.8 111.7 03 121.9 94.3 111.6 124.6 137.4 90.5 265.4 111.4 181.2 128.7 115.7 108.3 04 119.4 93.3 112.1 117.7 126.6 71.9 252.5 112.0 200.4 128.3 114.7 101.9 05 120.9 105.3 115.9 114.0 124.8 71.4 199.5 109.2 212.4 132.3 114.1 100.1
06 125.4 102.7 117.8 118.7 123.8 68.4 201.6 121.5 220.0 140.9 114.1 98.4 07 124.5 90.4 123.0 118.9 121.5 75.8 208.1 119.8 234.5 138.7 109.8 95.4 08 122.7 97.7 118.2 117.5 118.1 75.0 251.5 119.4 242.0 138.6 103.8 91.6 09 118.6 102.1 118.7 110.2 118.6 79.3 213.9 110.3 232.3 134.3 100.9 91.3 10 119.8 103.0 116.5 111.8 124.5 84.7 184.2 110.4 247.8 135.2 100.7 92.6
11 121.5 102.1 114.3 113.8 136.2 110.8 132.1 106.1 282.0 137.5 98.3 91.2 12 127.8 ... ... ... ... ... ... ... ... ... ... ...
BANCO DE ESPAÑA 294 BOLETÍN ESTADÍSTICO, FEBRUARY 2013

1 2 3 4 5 6 7 8 9 10 11 12
15 NON-FINANCIAL CORPORATIONS: 15.25 Significant ratios: FSI.2 Return on equitySummary information compiled by Integrated database (CBI)the Central Balance Sheet Data Office
See notes at the end of the chapter.
% (a) Branches of activity By size Services
Total Other. Energy Industry Of wich: Medium- (b) Wholesale Information Other Construction Large sized Small Total and retail trade Transport and services and hotels communications
96 12.8 11.9 14.8 12.4 16.2 7.0 18.4 11.0 12.2 12.3 15.9 12.9 97 13.2 10.7 15.9 13.3 16.1 7.4 20.5 12.2 12.5 12.7 16.0 13.2 98 14.2 12.5 16.7 14.0 17.6 8.0 22.1 11.5 12.9 13.8 16.5 14.1 99 13.4 12.7 15.9 12.7 18.3 7.0 20.1 9.5 13.5 12.8 16.4 14.0 00 13.2 15.9 15.5 11.4 17.0 7.4 19.2 8.7 14.6 12.8 16.0 13.3
01 13.8 16.5 14.1 12.9 16.9 8.4 31.9 9.8 15.3 14.0 15.1 12.2 02 14.2 17.2 12.9 14.1 15.6 9.1 41.7 11.3 14.6 15.6 13.7 10.4 03 13.3 13.8 12.6 13.4 14.2 7.7 47.2 10.6 15.7 14.9 13.1 9.4 04 13.0 13.3 13.3 12.6 13.3 6.5 51.6 9.8 17.4 15.2 12.9 8.3 05 13.3 15.8 12.7 12.8 12.6 5.4 38.6 11.5 17.2 16.2 12.1 7.7
06 13.9 16.3 13.4 13.1 12.8 5.6 35.5 12.9 18.4 17.0 12.8 7.9 07 13.9 12.8 15.4 13.6 13.5 6.0 43.2 12.5 16.8 16.5 12.4 7.9 08 11.8 12.6 11.1 12.2 10.1 4.2 51.9 12.2 11.5 14.9 9.3 5.2 09 9.1 11.1 6.3 9.8 8.5 2.7 42.8 10.0 7.4 12.3 6.5 3.3 10 8.9 10.8 8.2 9.5 9.0 3.3 36.3 9.4 4.0 12.1 6.5 2.6
11 8.6 10.0 8.5 9.1 9.5 3.8 27.5 8.7 4.5 11.8 6.8 1.9 12 7.4 ... ... ... ... ... ... ... ... ... ... ...
BANCO DE ESPAÑA 295 BOLETÍN ESTADÍSTICO, FEBRUARY 2013

BANCO DE ESPAÑA / BOLETÍN ESTADÍSTICO
NOTES TO THE TABLES OF CHAPTER 15
Table 15.A
a. Owing to the unavailability of the appropiate population estimator, the data for the agriculture, livestock, forestry and fisheries sectors in column 2 are not extrapolated to obtain the totals for the balance sheet and profit and loss account in Table 15.C. Table 15.B
a. Owing to the unavailability of the appropiate population estimator, the data for the agriculture, livestock, forestry and fisheries sectors in column 2 are not extrapolated to obtain the totals for the balance sheet and profit and loss account in Table 15.C. Table 15.C
a. Definition of the ratios: R1 = [(27+29)/(10-14-17)]*100 R2 = [27/(13+16)]*100 R3 = (29/11)*100 R4 = R1 - R2 R5 = (24/18)*100 E1 = [(13+16)/(10-14-17)]*100 E1’= [(13+16)/(10-14-17-4)]*100 E2 = (13+16)/(24+25)
Note: Ratios FSI.1 and FSI.2nd have been prepared in accordance with the methodology defined by the IMF in its document Financial Soudness Indicator. Compilation Guide. Table 15.3
a. The quarterly series of year n for quarter t includes the rates of the cumulative data for year n up to quarter t, compared with the same period a year earlier. Table 15.6
a. The quarterly series of year n for quarter t includes the rates of the cumulative data for year n up to quarter t, compared with the same period a year earlier. Table 15.7
a. The ratios are defined in Table 15.C. Table 15.8
a. The ratios are defined in Table 15.C. b. The ordinary net profit (ONP) used to calculate this ratio includes, for each quarter, the proportional part of the dividends received up to that quarter from the beginning of the year, determined on a straight-line basis; the ratio of Table 15.9 provides cumulative information for each period (Q1, Q1-Q2, Q1-Q3, Q1-Q4) in which the total dividend received is included. Table 15.9
a. The quarterly series of year n for quarter t includes the ratios of the cumulative data for year n up to quarter t. b. The ratios are defined in Table 15.C. Table 15.10
a. The ratios are defined in Table 15.C. Table 15.11
a. The ratios are defined in Table 15.C. Table 15.12
a. The quarterly series of year n for quarter t includes the ratios of the cumulative data for year n up to quarter t. b. The ratios are defined in Table 15.C. Table 15.13
a. The ratios are defined in Table 15.C. Table 15.14
a. The ratios are defined in Table 15.C.
BANCO DE ESPAÑA 296 BOLETÍN ESTADÍSTICO, FEBRUARY 2013

BANCO DE ESPAÑA / BOLETÍN ESTADÍSTICO
b. The ordinary net profit (ONP) used to calculate this ratio includes, for each quarter, the proportional part of the dividends received up to that quarter from the beginning of the year, determined on a straight-line basis; the ratio of Table 15.15 provides cumulative information for each period (Q1, Q1-Q2, Q1-Q3, Q1-Q4) in which the total dividend received is included. Table 15.15
a. The quarterly series of year n for quarter t includes the ratios of the cumulative data for year n up to quarter t. b. The ratios are defined in Table 15.C. Table 15.16
a. The ratios are defined in Table 15.C. Table 15.17
a. The ratios are defined in Table 15.C. b. The ordinary net profit (ONP) used to calculate this ratio includes, for each quarter, the proportional part of the dividends received up to that quarter from the beginning of the year, determined on a straight-line basis; the ratio of Table 15.18 provides cumulative information for each period (Q1, Q1-Q2, Q1-Q3, Q1-Q4) in which the total dividend received is included. Table 15.18
a. The quarterly series of year n for quarter t includes the ratios of the cumulative data for year n up to quarter t. b. The ratios are defined in Table 15.C. Table 15.19
a. The ratios are defined in Table 15.C. Table 15.20
a. The ratios are defined in Table 15.C. Table 15.21
a. The quarterly series of year n for quarter t includes the ratios of the cumulative data for year n up to quarter t. b. The ratios are defined in Table 15.C. Table 15.22
Note: Figures are given for the two periods included in the database for each survey. a. The ratios are defined in Table 15.C. Table 15.23
Note: Figures are given for the two periods included in the database for each survey. a. The ratios are defined in Table 15.C. Table 15.24
a. Figures for 2010 and 2011, both for total and for different aggregates by sector and size, are obtained by applying the rate of change of the previous base to the current base. b. Data from the last period is an estimate made from the latest quarterly information received in the quarterly survey of the Central balance sheet data office (CBQ). Table 15.25
a. Figures for 2010 and 2011, both for total and for different aggregates by sector and size, are obtained by applying the rate of change of the previous base to the current base. b. Data from the last period is an estimate made from the latest quarterly information received in the quarterly survey of the Central balance sheet data office (CBQ).
BANCO DE ESPAÑA 297 BOLETÍN ESTADÍSTICO, FEBRUARY 2013


CHAPTER 16 HOUSEHOLDS AND NPISH

BANCO DE ESPAÑA 300 BOLETÍN ESTADÍSTICO, FEBRUARY 2013

CHAPTER 17 BALANCE OF PAYMENTS AND INTERNATIONAL INVESTMENT POSITION VIS-à-VIS
OTHER EURO AREA COUNTRIES AND THE REST OF THE WORLD

____
____
____
____
____
____
____
____
____
____
____
____
____
____
____
____
____
____
____
____
____
____
____
____
____
____
____
____
____
____
____
____
____
____
____
____
____
____
____
____
____
____
____
____
____
____
Véa
nse
nota
s al
fina
l del
cap
ítulo
./See
not
es a
t the
end
of t
he c
hapt
er
17. B
AL
AN
ZA
DE
PA
GO
S Y
PO
SIC
IÓN
DE
INV
ER
SIÓ
N IN
TE
RN
AC
ION
AL
17.A
Res
um
en d
e re
curs
os
(in
gre
sos
y va
riac
ión
net
a d
e p
asiv
os)
A
) B
alan
za d
e p
ago
sy
emp
leo
s (p
ago
s y
vari
ació
n n
eta
de
acti
vos
fin
anci
ero
s)
Cu
enta
co
rrie
nte
y C
uen
ta d
e ca
pit
al
Dato
s r
efe
ridos a
Dic
iem
bre
de 2
012
Mill
ones d
e e
uro
s
2011
2
012
Ser
ies
en
E
nero
-Dic
iem
bre
E
nero
-Dic
iem
bre
c
uadr
o/co
lum
na January
-Decem
ber
January
-Dece
mb
er
Tim
e s
eries in
Ingr
esos
(I)
P
agos
(P
) S
aldo
(I -
P)
Ingr
esos
(I)
Pag
os (
P)
Sal
do (
I - P
) ta
ble
/colu
mn
R
eceip
ts
P
aym
ents
B
ala
nce
R
eceip
ts
P
aym
ents
Bala
nce
A)
CU
EN
TA
CO
RR
IEN
TE
(1
a 4)
..
..
..
..
..
..
..
17.1
/138
6 88
0 42
4 37
7 -3
7 49
7 39
7 61
4 40
5 87
2 -8
258
A
) C
UR
RE
NT
AC
CO
UN
T (
1 to
4)
1. B
alan
za c
om
erci
al
.
..
..
..
..
..
..
..
.17
.3/2
,3,1
222
641
262
367
-39
727
231
525
256
453
-24
928
1. G
oo
ds
2. S
ervi
cio
s .
..
..
..
..
..
..
..
..
..
..
.17
.3/5
,7,4
102
220
67 9
80
34 2
40
109
685
70 1
10
39 5
75
2
. Ser
vice
s
T
uris
mo
y vi
ajes
..
..
..
..
..
..
..
..
..
17.3
/6,8
43 0
26
12 4
22
30 6
04
43 3
06
11 9
06
31 4
00
T
rave
l
Otr
os
.
..
..
..
..
..
..
..
..
..
..
.17
.359
194
55
558
3
636
66 3
79
58 2
04
8 17
4
O
ther
s
3. R
enta
s
.
..
..
..
..
..
..
..
..
..
..
.17
.3/1
0,11
,942
355
68
461
-2
6 10
6 36
449
54
897
-1
8 44
8
3
. In
com
e
4. T
ran
sfer
enci
as
..
..
..
..
..
..
..
..
..
.17
.3/1
3,14
,12
19 6
64
25 5
69
-5 9
04
19 9
55
24 4
12
-4 4
57
4
. Tra
nsf
ers
B)
CU
EN
TA
DE
CA
PIT
AL
..
..
..
..
..
..
..
.17
.3/1
6,17
,15
7 19
0 1
702
5 48
8 7
922
1 35
4 6
569
B
) C
AP
ITA
L A
CC
OU
NT
C)
CU
EN
TA
CO
RR
IEN
TE
MÁ
S C
UE
NT
A D
E C
AP
ITA
L (
A+
B)
17
.1/7
394
070
426
079
-32
009
405
536
407
226
-1 6
89
C)
CU
RR
EN
T A
ND
CA
PIT
AL
AC
CO
UN
T (
A +
B)
Data
rela
ted to D
ecem
ber
2012
EU
R m
illio
ns
17.A
Su
mm
ary
of
sou
rces
(re
ceip
ts a
nd
net
ch
ang
e in
liab
iliti
es)
and
use
s17
. BA
LA
NC
E O
F P
AY
ME
NT
S A
ND
INT
ER
NA
TIO
NA
L IN
VE
ST
ME
NT
PO
SIT
ION
(
pay
men
ts a
nd
net
ch
ang
e in
fin
anci
al a
sset
s). C
urr
ent
acco
un
t an
d C
apit
al a
cco
un
t
A)
Bal
ance
of
pay
men
ts
BANCO DE ESPAÑA 302 BOLETÍN ESTADÍSTICO, FEBRUARY 2013

____
____
____
____
____
____
____
____
____
____
____
____
____
____
____
____
____
____
____
____
____
____
____
____
____
____
____
____
____
____
____
____
____
____
____
____
____
____
____
____
____
____
____
____
____
____
Véa
nse
nota
s al
fina
l del
cap
ítulo
./See
not
es a
t the
end
of t
he c
hapt
er
17.
BA
LA
NZ
A D
E P
AG
OS
Y P
OS
ICIÓ
N D
E IN
VE
RS
IÓN
INT
ER
NA
CIO
NA
L17
.A (
con
t.)
Res
um
en d
e re
curs
os
(in
gre
sos
y va
riac
ión
net
a d
e p
asiv
os)
A)
Bal
anza
de
pag
os
y e
mp
leo
s (p
ago
s y
vari
ació
n n
eta
de
acti
vos
fin
anci
ero
s)
C
uen
ta f
inan
cier
a y
Err
ore
s y
om
isio
nes
Dato
s r
efe
ridos a
Dic
iem
bre
de 2
012
Mill
ones d
e e
uro
s
201
1
2
012
Ser
ies
en
Ene
ro-D
icie
mbr
e
Ene
ro-D
icie
mbr
e
c
uadr
o/co
lum
na J
anuary
-Decem
ber
January
-Dece
mb
er
Tim
e s
eries in
Var
iaci
ón n
eta
Var
iaci
ón n
eta
Sal
do
V
aria
ción
net
a V
aria
ción
net
a
S
aldo
ta
ble
/colu
mn
pa
sivo
s(V
NP
)
activ
os(V
NA
) (
VN
P -
VN
A)
pasi
vos(
VN
P)
act
ivos
(V
NA
) (
VN
P -
VN
A)
N
et changes in
N
et changes in
B
ala
nce
N
et changes in
N
et
cha
ng
es in
Bala
nce
lia
bili
ties
assets
lia
bili
ties
a
ssets
D)
CU
EN
TA
FIN
AN
CIE
RA
(a)
.
..
..
..
..
..
..
.17
.1/8
- -
35 7
60
- -
-5 7
00
D)
FIN
AN
CIA
L A
CC
OU
NT
(a)
D.1
) T
OT
AL
, EX
CE
PT
O B
AN
CO
DE
ES
PA
ÑA
(5
a 8)
..
17.1
/10
- -
-73
393
- -
-179
221
D
.1)
TO
TA
L, E
XC
LU
DIN
G B
AN
CO
DE
ES
PA
ÑA
(5
to 8
)
5
. In
vers
ion
es d
irec
tas
..
..
..
..
..
.17
.2/7
- -
-5 5
96
- -
13 6
96
5.
Dir
ect
inve
stm
ent
De
Esp
aña
en e
l ext
erio
r
..
..
..
..
..
..
17.7
/3-
26 8
00
-26
800
- -2
672
2
672
Spa
nish
inve
stm
ent a
broa
d
D
el e
xter
ior
en E
spañ
a
..
..
..
..
..
..
17.7
/421
204
-
21 2
04
11 0
24
- 11
024
For
eign
inve
stm
ent i
n S
pain
6
. In
vers
ion
es d
e ca
rter
a .
..
..
..
..
..
..
17.2
/8-
- -2
3 07
6 -
- -5
1 41
1
6.
Po
rtfo
lio in
vest
men
t
De
Esp
aña
en e
l ext
erio
r
..
..
..
..
..
..
--
-42
904
42 9
04
- 2
375
-2 3
75
S
pani
sh in
vest
men
t abr
oad
Del
ext
erio
r en
Esp
aña
.
..
..
..
..
..
.-
-65
979
- -6
5 97
9 -4
9 03
5 -
-49
035
For
eign
inve
stm
ent i
n S
pain
7
. O
tras
inve
rsio
nes
(b
) .
..
..
..
..
..
..
.17
.2/9
- -
-44
880
- -
-151
388
7. O
ther
inve
stm
ent
(b)
De
Esp
aña
en e
l ext
erio
r .
..
..
..
..
..
..
.-
- 35
500
-3
5 50
0 -
54 5
10
-54
510
Spa
nish
inve
stm
ent a
broa
d
D
el e
xter
ior
en E
spañ
a
..
..
..
..
..
..
..
--9
380
-
-9 3
80
-96
878
- -9
6 87
8
F
orei
gn in
vest
men
t in
Spa
in
8
. D
eriv
ado
s fi
nan
cier
os
..
..
..
..
..
..
17.2
/10
- -
159
- -
9 88
2
8.
Fin
anci
al d
eriv
ativ
es
D.2
) B
AN
CO
DE
ES
PA
ÑA
(9
a 11
) (c
) .
..
..
..
..
17.1
/9-
- 10
9 15
3 -
- 17
3 52
2
D
.2)
BA
NC
O D
E E
SP
AÑ
A (
9 to
11)
(c)
9
. R
eser
vas
..
..
..
..
..
..
..
.17
.2/1
1-
- -1
0 01
0 -
- -2
205
9. R
eser
ves
1
0. A
ctiv
os
net
os
fren
te a
l Eu
rosi
stem
a
..
..
..
17.2
/12
- -
124
056
- -
162
366
1
0. N
et c
laim
s w
ith
th
e E
uro
syst
em
1
1. O
tro
s ac
tivo
s n
eto
s
.
..
..
..
..
..
..
17.2
/13
- -
-4 8
93
- -
13 3
61
11
. Oth
er n
et a
sset
s
E)
ER
RO
RE
S Y
OM
ISIO
NE
S
..
..
..
..
..
..
..
17.1
/11
- -
-3 7
51
- -
7 38
9
E)
ER
RO
RS
AN
D O
MIS
SIO
NS
Data
rela
ted to D
ecem
ber
2012
EU
R m
illio
ns
17.A
(co
nt.
) S
um
mar
y o
f so
urc
es (
rece
ipts
an
d n
et c
han
ge
in li
abili
ties
) an
d u
ses
17.
BA
LA
NC
E O
F P
AY
ME
NT
S A
ND
INT
ER
NA
CIO
NA
L IN
VE
ST
ME
NT
PO
SIT
ION
(p
aym
ents
an
d n
et c
han
ge
in f
inan
cial
ass
ets)
. Fin
anci
al a
cco
un
t an
d E
rro
rs a
nd
om
issi
on
s
A)
Bal
ance
of
pay
men
ts
BANCO DE ESPAÑA 303 BOLETÍN ESTADÍSTICO, FEBRUARY 2013

Balanza de pagos
Cuentas financieras
1 2 3 4 5 6 7 8
___________________________________________________________________________________________________________________________
17. BALANZA DE PAGOS Y POSICIÓN DE INVERSIÓN INTERNACIONAL 17.B Conciliación entre las operaciones financieras de residentes frente a otros residentes en la zona del euro y al resto del mundo y la balanza de pagos
Datos referidos a 2011
Inversiones de España en el exterior/Spanish investment abroad
Inversión directa/ Inversión de cartera/ Direct investment Portfolio investment Acciones y participaciones/ Bonos y obligaciones/ Instos. mercado monetario/ Financiación Equity securities Bonds and notes Money market instruments
Acciones y entre otras partici- empresas cipaciones/ relacionadas/ Instituciones Otros Instituciones Otros Instituciones Otros Shares Intercompany financieras sectores financieras sectores financieras sectores and other debt monetarias/ residentes/ monetarias/ residentes/ monetarias/ residentes/ equities transactions Monetary Other Monetary Other Monetary Other financial resident financial resident financial resident institutions sectors institutions sectors institutions sectors
AF.1 ORO MONETARIO Y DEG . . . . . . . . . . . . . . . . . . .
EFECTIVO, DEPÓSITOS Y PRÉSTAMOS . . . . . . . . . . . . . . . 4 845
AF.2 EFECTIVO Y DEPÓSITOS . . . . . . . . . . . . . . . . . . .
Instituciones financieras monetarias. . . . . . . . . . . . . . . . . Otros sectores residentes . . . . . . . . . . . . . . . . . . . . . -Instituciones financieras no monetarias . . . . . . . . . . . . . . -Sociedades no financieras . . . . . . . . . . . . . . . . . . . -Hogares e IPSFL . . . . . . . . . . . . . . . . . . . . . . .
AF.4 PRÉSTAMOS . . . . . . . . . . . . . . . . . . . . . . . . .
Instituciones financieras monetarias. . . . . . . . . . . . . . . . . Administraciones Públicas . . . . . . . . . . . . . . . . . . . . . Otros sectores residentes . . . . . . . . . . . . . . . . . . . . . -Instituciones financieras no monetarias . . . . . . . . . . . . . . -Sociedades no financieras . . . . . . . . . . . . . . . . . . .
AF.33 VALORES DISTINTOS DE ACCIONES . . . . . . . . . . . . . -743 -26 239 -558 -981
Instituciones financieras monetarias. . . . . . . . . . . . . . . . . -743 -558 Administraciones Públicas . . . . . . . . . . . . . . . . . . . . . -1 101 Otros sectores residentes . . . . . . . . . . . . . . . . . . . . . -25 138 -981 -Instituciones financieras no monetarias . . . . . . . . . . . . . . -Sociedades no financieras . . . . . . . . . . . . . . . . . . . -Hogares e IPSFL . . . . . . . . . . . . . . . . . . . . . . .
AF.34 DERIVADOS FINANCIEROS . . . . . . . . . . . . . . . . . .
AF.5 ACCIONES Y OTRAS PARTICIPACIONES . . . . . . . . . . . . 21 955 -2 344 -7 309
Instituciones financieras monetarias. . . . . . . . . . . . . . . . . 15 505 -2 344 Administraciones Públicas . . . . . . . . . . . . . . . . . . . . . Otros sectores residentes . . . . . . . . . . . . . . . . . . . . . 6 450 -7 309 -Instituciones financieras no monetarias . . . . . . . . . . . . . . -Sociedades no financieras . . . . . . . . . . . . . . . . . . . -Hogares e IPSFL . . . . . . . . . . . . . . . . . . . . . . .
AF.6 RESERVAS TÉCNICAS DE SEGUROS. . . . . . . . . . . . . .
AF.7 OTRAS CUENTAS PENDIENTE DE COBRO . . . . . . . . . . .
ADQUISICIÓN NETA DE ACTIVOS FINANCIEROS DE SECT.RESIDENTES 21 955 4 845 -2 344 -7 309 -743 -26 239 -558 -981
2011 data
1. Net acquisition of financial assets of domestic sectors (liabilities of other euro area residents and the rest of the world)
BANCO DE ESPAÑA 304 BOLETÍN ESTADÍSTICO, FEBRUARY 2013

Balance of payments
Financial accounts
9 10 11 12 13 14=1a13/1to13 15 16=15-14
___________________________________________________________________________________________________________________________
1. Adquisición neta de activos financieros de los sectores residentes (pasivos de otros residentes en la zona del euro y en el resto del mundo)
Millones de euros
Inversiones de España en el exterior/Spanish investment abroad
Otras inversiones/Other investment Total
Errores y Balanza de Cuentas omisiones/ pagos/ financieras/ Discrepancia/ Depósitos y préstamos /Deposits and loans Reservas/ Errors Total Financial Discrepancy Reserve and Balance of accounts assets omissions payments Instituciones Administraciones Otros financieras públicas/ sectores monetarias/ General residentes/ Monetary government Other financial resident institutions sectors
AF.1 MONETARY GOLD AND SDRs
15 347 6 853 13 458 834 41 337 17 223 -24 114 CURRENCY, DEPOSITS AND LOANS
3 286 AF.2 CURRENCY AND DEPOSITS
1 458 Monetary financial institutions 1 827 Other resident sectors -695 -Non-monetary financial institutions 8 955 -Non-financial corporations -6 432 -Households and non-profit institutions
13 937 AF.4 LOANS
2 454 Monetary financial institutions 6 035 General Government 5 449 Other resident sectors -30 -Non-monetary financial institutions 5 478 -Non-financial corporations
9 208 -19 313 -19 312 1 AF.33 SECURITIES OTHER THAN SHARES
9 208 7 907 -6 093 -14 000 Monetary financial institutions -1 101 -1 013 88 General Government -26 119 -12 206 13 913 Other resident sectors -9 777 -Non-monetary financial institutions -311 -Non-financial corporations -2 119 -Households and non-profit institutions
-33 -33 6 645 6 678 AF.34 FINANCIAL DERIVATIVES
12 302 12 302 -0 AF.5 SHARES AND OTHER EQUITY
13 162 17 285 4 124 Monetary financial institutions 39 39 General Government -859 -5 022 -4 163 Other resident sectors 4 912 -Non-monetary financial institutions -272 -Non-financial corporations -9 663 -Households and non-profit institutions
-422 -422 AF.6 INSURANCE TECHNICAL RESERVES
3 751 3 751 10 060 6 309 AF.7 OTHER ACCOUNTS PAYABLE
15 347 6 853 13 458 10 010 3 751 38 045 26 496 -11 549 NET ACQ. OF FINANCIAL ASSETS OF DOMESTIC SECTORS
Euro millions
17. BALANCE OF PAYMENTS AND INTERNATIONAL INVESTMENT POSITION 17.B Reconciliation between resident’s financial transactions vis-à-vis other euro area residents and the rest of the world and the balance of payments
BANCO DE ESPAÑA 305 BOLETÍN ESTADÍSTICO, FEBRUARY 2013

Balanza de pagos
Cuentas financieras
1 2 3 4 5 6 7 8 9 10
___________________________________________________________________________________________________________________________
17. BALANZA DE PAGOS Y POSICIÓN DE INVERSIÓN INTERNACIONAL 17.B Conciliación entre las operaciones financieras de residentes frente a otros residentes en la zona del euro y al resto del mundo y la balanza de pagos
Datos referidos a 2011
Inversiones del exterior en España/Foreign investment in Spain
Inversión directa/ Inversión de cartera/ Direct investment Portfolio investment Acciones y participaciones/ Bonos y obligaciones/ Instrumentos del mercado monetario/ Financiación Equity securities Bonds and notes Money market instruments
Acciones y entre otras partici- empresas cipaciones/ relacionadas/ Instituciones Otros Instituciones Administra- Otros Instituciones Administra- Otros Shares Intercompany financieras sectores financieras ciones sectores financieras ciones sectores and other debt monetarias/ residentes/ monetarias/ públicas/ residentes/ monetarias/ públicas/ residentes/ equities transactions Monetary Other Monetary General Other Monetary General Other financial resident financial government resident financial government resident institutions sectors institutions sectors institutions sectors
AF.1 ORO MONETARIO Y DEG . . . . . . . . . . . . . . .
AF.2 DEPÓSITOS. . . . . . . . . . . . . . . . . . . . . .
Instituciones financieras monetarias. . . . . . . . . . . . . Otros sectores residentes . . . . . . . . . . . . . . . . . -Instituciones financieras no monetarias . . . . . . . . . .
AF.331 VALORES A CORTO PLAZO DISTINTOS DE ACCIONES -7 441 -6 220 -5 839
Instituciones financieras monetarias. . . . . . . . . . . . . -7 441 Administraciones públicas . . . . . . . . . . . . . . . -6 220 Otros sectores residentes . . . . . . . . . . . . . . . . . -5 839 -Instituciones financieras no monetarias . . . . . . . . . . -Sociedades no financieras. . . . . . . . . . . . . . . .
AF.332 VALORES A LARGO PLAZO DISTINTOS DE ACCIONES -23 179 -6 367 -19 563
Instituciones financieras monetarias. . . . . . . . . . . . . -23 179 Administraciones públicas . . . . . . . . . . . . . . . -6 367 Otros sectores residentes . . . . . . . . . . . . . . . . . -19 563 -Instituciones financieras no monetarias . . . . . . . . . . -Sociedades no financieras . . . . . . . . . . . . . . .
AF.34 DERIVADOS FINANCIEROS . . . . . . . . . . . . . .
AF.4 PRÉSTAMOS . . . . . . . . . . . . . . . . . . . . . -3 340
Administraciones públicas . . . . . . . . . . . . . . . Otros sectores residentes . . . . . . . . . . . . . . . . . -3 340 -Instituciones financieras no monetarias . . . . . . . . . . -Sociedades no financieras . . . . . . . . . . . . . . . -Hogares e IPSFL . . . . . . . . . . . . . . . . . . . .
AF.5 ACCIONES Y OTRAS PARTICIPACIONES . . . . . . . . 24 544 -1 795 4 424
Instituciones financieras monetarias. . . . . . . . . . . . . 1 988 -1 795 Otros sectores residentes . . . . . . . . . . . . . . . . . 22 555 4 424 -Instituciones financieras no monetarias . . . . . . . . . . -Sociedades no financieras . . . . . . . . . . . . . . .
AF.6 RESERVAS TÉCNICAS DE SEGURO . . . . . . . . . .
AF.7 OTRAS CUENTAS PENDIENTES DE PAGO . . . . . . .
CONTRACCIÓN NETA DE PASIVOS DE SECT. RESIDENTES . . 24 544 -3 340 -1 795 4 424 -23 179 -6 367 -19 563 -7 441 -6 220 -5 839
2011 data
2. Net incurrence of liabilities of domestic sectors (financial assets of other euro area residents and the rest of the world)
BANCO DE ESPAÑA 306 BOLETÍN ESTADÍSTICO, FEBRUARY 2013

Balance of payments
Financial accounts
11 12 13 14 15=1a14/1to14 16 17=16-15
___________________________________________________________________________________________________________________________
2. Contracción neta de pasivos de los sectores residentes (activos financieros de otros residentes en la zona del euro y en el resto del mundo)
Millones de euros
Inversiones del exterior en España/Foreign investment in Spain Otras inversiones/Other investment Total Balanza de Cuentas pagos/ financieras/ Discrepancia/ Préstamos/Loans Depósitos/ Derivados Total Financial Discrepancy Deposits financieros Balance of accounts netos/ payments Net Administra- Otros Instituciones financial ciones sectores financieras derivatives públicas/ residentes/ monetarias/ General Other Monetary government resident financial sectors institutions
304 304 AF.1 MONETARY GOLD AND SDRs
104 682 104 682 93 690 -10 992 AF.2 DEPOSITS
104 682 104 682 93 690 -10 992 Monetary financial institutions Other resident sectors -Non-monetary financial institutions
-19 500 -21 008 -1 508 AF.331 SHORT-TERM SECURITIES OTHER THAN SHARES
-7 441 -3 941 3 500 Monetary financial institutions -6 220 -9 241 -3 021 General Government -5 839 -7 826 -1 987 Other resident sectors -7 826 -Non-monetary financial institutions -Non-financial corporations
-49 109 -55 039 -5 930 AF.332 LONG-TERM SECURITIES OTHER THAN SHARES
-23 179 -29 561 -6 381 Monetary financial institutions -6 367 1 097 7 464 General Government -19 563 -26 576 -7 013 Other resident sectors -26 667 -Non-monetary financial institutions 92 -Non-financial corporations
153 153 5 605 5 452 AF.34 FINANCIAL DERIVATIVES
2 574 7 420 6 655 8 183 1 528 AF.4 LOANS
2 574 2 574 3 395 822 General Government 7 420 4 081 4 787 706 Other resident sectors -381 -Non-monetary financial institutions 5 026 -Non-financial corporations 142 -Households and non-profit institutions
27 173 26 941 -232 AF.5 SHARES AND OTHER EQUITY
194 -509 -702 Monetary financial institutions 26 979 27 449 470 Other resident sectors -106 -Non-monetary financial institutions 27 555 -Non-financial corporations
255 255 AF.6 INSURANCE TECHNICAL RESERVES
1 508 1 508 AF.7 OTHER ACCOUNTS RECEIVABLE
2 574 7 420 104 682 153 70 055 60 439 -9 616 NET INCURRENCE OF LIABILITIES OF DOMESTIC SECTORS
Euro millions
17. BALANCE OF PAYMENTS AND INTERNATIONAL INVESTMENT POSITION 17.B Reconciliation between resident’s financial transactions vis-à-vis other euro area residents and the rest of the world and the balance of payments
BANCO DE ESPAÑA 307 BOLETÍN ESTADÍSTICO, FEBRUARY 2013

P P
P P
P P P P
P P P P P P P P P P P P
1=2 to 5 2 3 4 5 6 7=1+6 8=9+10 9 10 11=-(7+8)
17. BALANCE OF PAYMENTS AND INTERNATIONAL INVESTMENT POSITION 17.1 Summary. BalancesA) Balance of payments
EUR millions
Current account (credits less debits) Financial account Capital Current Errors account account and
Total Current (credits plus Total Banco de Other omissions Goods Services Income transfers less capital (NCL-NCA) España sectors debits) account
08 -104 676 -85 594 25 791 -35 483 -9 389 5 475 -99 201 100 222 30 218 70 004 -1 021 09 -50 539 -41 611 25 032 -25 931 -8 030 4 224 -46 315 51 982 10 464 41 517 -5 667 10 -47 427 -47 779 27 514 -19 849 -7 313 6 289 -41 138 43 174 15 696 27 478 -2 036 11 -37 497 -39 727 34 240 -26 106 -5 904 5 488 -32 009 35 760 109 153 -73 393 -3 751
11 J-D -37 497 -39 727 34 240 -26 106 -5 904 5 488 -32 009 35 760 109 153 -73 393 -3 751 12 J-D -8 258 -24 928 39 575 -18 448 -4 457 6 569 -1 689 -5 700 173 521 -179 221 7 389
11 Sep -3 726 -4 550 3 658 -2 325 -509 -19 -3 745 2 356 10 264 -7 908 1 389 Oct -1 363 -3 023 3 646 -1 465 -521 280 -1 083 3 448 18 845 -15 397 -2 366 Nov -1 926 -1 791 2 054 -2 568 379 869 -1 058 5 234 22 469 -17 235 -4 177 Dec -3 911 -3 915 1 693 -2 768 1 078 165 -3 746 1 530 33 984 -32 454 2 216
12 Jan -5 677 -3 291 1 749 -2 998 -1 137 84 -5 593 3 767 9 533 -5 766 1 826 Feb -6 085 -3 175 1 518 -1 847 -2 582 116 -5 969 6 783 29 305 -22 523 -813 Mar -3 265 -2 645 2 001 -1 858 -763 485 -2 780 108 66 734 -66 625 2 672 Apr -1 600 -2 931 2 558 -914 -313 314 -1 286 425 28 990 -28 565 861 May -277 -1 400 3 238 -1 414 -702 702 425 1 827 42 051 -40 224 -2 252 Jun -805 -2 303 4 162 -2 318 -346 711 -94 1 627 60 177 -58 550 -1 533 Jul 877 -1 171 5 209 -2 703 -458 80 957 1 275 18 879 -17 605 -2 231 Aug 1 353 -2 629 5 719 -811 -926 636 1 989 -139 11 764 -11 903 -1 850 Sep -296 -2 708 4 239 -808 -1 020 792 496 -5 313 -33 911 28 597 4 817 Oct 865 -955 4 198 -1 853 -524 1 008 1 873 -5 911 -18 000 12 089 4 038 Nov 1 777 -776 2 400 -1 750 1 903 878 2 655 -1 428 -14 606 13 178 -1 227 Dec 4 875 -943 2 583 825 2 410 764 5 639 -8 719 -27 395 18 676 3 080
P P
P P
P P P P
P P P P P P P P P P P P
1=2+3=7to13 2 3=4 to 6 4 5 6 7 8 9 10 11 12 13
17. BALANCE OF PAYMENTS AND INTERNATIONAL INVESTMENT POSITION 17.2 Summary of the financial account. Net change inA) Balance of payments liabilities less net change in assets
EUR millions Institutional sectors Components
Total financial Banco Other institutional sectors BE net account de Direct Portfolio Other Financial claims Other net
(NCL-NCA) España investment investment investment deriva- Reserves with assets Total Other General Other excluding excluding tives the of BE MFIs Govern- resident BE BE excluding Eurosys- ment sectors BE tem
08 100 222 30 218 70 004 38 389 16 057 15 558 1 553 -203 75 717 -7 064 -645 31 713 -850 09 51 982 10 464 41 517 1 976 69 813 -30 272 -1 917 44 824 4 665 -6 054 -1 563 6 146 5 882 10 43 174 15 696 27 478 14 049 22 116 -8 688 1 827 27 671 -10 610 8 589 -814 9 788 6 722 11 35 760 109 153 -73 393 -70 823 -15 912 13 342 -5 596 -23 076 -44 880 159 -10 010 124 056 -4 893
11 J-D 35 760 109 153 -73 393 -70 823 -15 912 13 342 -5 596 -23 076 -44 880 159 -10 010 124 056 -4 893 12 J-D -5 700 173 521 -179 221 -221 135 46 990 -5 076 13 696 -51 411 -151 388 9 882 -2 205 162 366 13 361
11 Sep 2 356 10 264 -7 908 -9 474 2 777 -1 212 2 516 -3 152 -7 682 410 -92 10 396 -40 Oct 3 448 18 845 -15 397 -12 503 -3 342 447 1 532 -5 634 -11 363 68 -948 19 867 -73 Nov 5 234 22 469 -17 235 -18 691 -399 1 854 1 082 6 673 -26 348 1 358 -3 694 28 690 -2 527 Dec 1 530 33 984 -32 454 -22 795 -14 548 4 889 659 -12 460 -19 657 -996 -3 142 37 801 -675
12 Jan 3 767 9 533 -5 766 -7 445 -6 574 8 253 2 934 -6 321 -2 194 -185 -71 8 808 797 Feb 6 783 29 305 -22 523 -31 782 -193 9 452 2 347 -6 166 -21 383 2 679 -111 27 639 1 777 Mar 108 66 734 -66 625 -50 018 -12 048 -4 559 2 427 -24 693 -44 613 253 -30 64 608 2 156 Apr 425 28 990 -28 565 -9 907 -13 289 -5 368 1 148 -22 137 -6 513 -1 063 -152 26 807 2 334 May 1 827 42 051 -40 224 -34 969 1 868 -7 122 -1 312 -9 509 -29 713 311 -243 42 265 29 Jun 1 627 60 177 -58 550 -41 744 -1 301 -15 506 -3 052 -13 853 -42 267 622 -3 502 63 314 364 Jul 1 275 18 879 -17 605 -9 595 -282 -7 728 -1 243 -4 454 -15 018 3 111 2 025 14 853 2 001 Aug -139 11 764 -11 903 -14 007 7 756 -5 653 -502 775 -11 934 -242 -122 11 155 731 Sep -5 313 -33 911 28 597 14 235 9 861 4 502 3 070 10 293 14 529 704 -14 -34 287 390 Oct -5 911 -18 000 12 089 3 856 707 7 526 825 15 292 -5 638 1 610 2 -19 704 1 702 Nov -1 428 -14 606 13 178 -9 440 12 198 10 420 873 32 319 -22 434 2 420 -6 -14 388 -211 Dec -8 719 -27 395 18 676 -30 319 48 288 707 6 181 -22 956 35 790 -339 18 -28 704 1 291
BANCO DE ESPAÑA 308 BOLETÍN ESTADÍSTICO, FEBRUARY 2013

P P
P P
P P P P
P P P P P P P P P P P P
1=2-3 2 3 4=5-7 5 6 7 8 9=10-11 10 11 12=13-14 13 14 15=16-17 16 17
17. BALANCE OF PAYMENTS AND INTERNATIONAL INVESTMENT POSITION 17.3 Current account and capital account. BreakdownA) Balance of payments
EUR millions
Goods Services Income Current transfers Capital account Of which: Of which:
Balance Credits Debits Balance Credits Debits Balance Credits Debits Balance Credits Debits Balance Credits Debits Travel Travel
08 -85 594 193 007 278 601 25 791 97 651 41 901 71 861 13 834 -35 483 53 050 88 533 -9 389 17 352 26 741 5 475 6 892 1 417 09 -41 611 164 083 205 693 25 032 88 754 38 125 63 722 12 086 -25 931 45 338 71 269 -8 030 18 152 26 182 4 224 6 478 2 254 10 -47 779 193 666 241 445 27 514 93 870 39 621 66 356 12 663 -19 849 46 051 65 901 -7 313 18 234 25 547 6 289 7 934 1 645 11 -39 727 222 641 262 367 34 240 102 220 43 026 67 980 12 422 -26 106 42 355 68 461 -5 904 19 664 25 569 5 488 7 190 1 702
11 J-D -39 727 222 641 262 367 34 240 102 220 43 026 67 980 12 422 -26 106 42 355 68 461 -5 904 19 664 25 569 5 488 7 190 1 702 12 J-D -24 928 231 525 256 453 39 575 109 685 43 306 70 110 11 906 -18 448 36 449 54 897 -4 457 19 955 24 412 6 569 7 922 1 354
11 Sep -4 550 18 721 23 271 3 658 9 589 4 653 5 931 1 237 -2 325 3 369 5 694 -509 1 559 2 068 -19 152 171 Oct -3 023 19 860 22 883 3 646 9 474 4 154 5 829 1 172 -1 465 3 521 4 986 -521 1 508 2 029 280 387 106 Nov -1 791 20 531 22 323 2 054 7 667 2 606 5 613 1 103 -2 568 3 223 5 791 379 2 701 2 322 869 968 99 Dec -3 915 17 425 21 340 1 693 7 979 2 156 6 286 974 -2 768 5 379 8 147 1 078 3 753 2 675 165 611 446
12 Jan -3 291 17 047 20 338 1 749 7 191 2 677 5 442 832 -2 998 2 878 5 875 -1 137 1 125 2 262 84 194 110 Feb -3 175 18 544 21 719 1 518 7 034 2 243 5 515 881 -1 847 2 437 4 284 -2 582 1 108 3 689 116 199 83 Mar -2 645 20 869 23 515 2 001 7 687 2 687 5 686 832 -1 858 3 027 4 885 -763 1 184 1 947 485 592 107 Apr -2 931 17 565 20 497 2 558 7 874 2 733 5 315 844 -914 2 952 3 866 -313 1 680 1 993 314 407 93 May -1 400 19 911 21 310 3 238 8 645 3 550 5 407 685 -1 414 3 857 5 271 -702 1 124 1 826 702 794 93 Jun -2 303 19 575 21 878 4 162 10 320 4 380 6 159 1 133 -2 318 3 415 5 733 -346 1 289 1 634 711 820 109 Jul -1 171 20 252 21 423 5 209 11 797 5 607 6 588 1 211 -2 703 2 725 5 428 -458 1 363 1 821 80 221 141 Aug -2 629 17 176 19 804 5 719 11 395 5 814 5 676 1 272 -811 2 334 3 145 -926 983 1 910 636 746 110 Sep -2 708 18 923 21 631 4 239 10 081 4 820 5 842 1 183 -808 2 964 3 772 -1 020 1 118 2 137 792 892 100 Oct -955 21 860 22 815 4 198 9 914 4 084 5 716 1 099 -1 853 2 241 4 093 -524 1 385 1 909 1 008 1 132 124 Nov -776 20 778 21 554 2 400 8 783 2 569 6 383 1 052 -1 750 2 139 3 889 1 903 3 479 1 576 878 1 021 144 Dec -943 19 025 19 968 2 583 8 966 2 141 6 383 882 825 5 480 4 655 2 410 4 117 1 707 764 904 140
P P
P P P P
P P P P
P P P
1=2-8 2=3+7 3=4 to 6 4 5 6 7 8=9+13 9=10 to 12 10 11 12 13
17. BALANCE OF PAYMENTS AND INTERNATIONAL INVESTMENT POSITION 17.4 Current account. IncomeA) Balance of payments
EUR millions Credits Debits Investment Investment
Balance Total Labour Total Labour Monetary General Other Total Monetary General Other Total financial government resident financial government resident institutions sectors institutions sectors
07 -30 055 57 961 56 495 20 191 712 35 592 1 466 88 016 86 273 32 812 8 723 44 738 1 744 08 -35 483 53 050 51 525 21 992 830 28 703 1 525 88 533 86 956 36 975 8 416 41 565 1 577 09 -25 931 45 338 43 979 15 578 639 27 762 1 359 71 269 69 780 25 296 9 571 34 913 1 488 10 -19 849 46 051 44 555 14 568 425 29 562 1 496 65 901 64 365 19 457 10 472 34 437 1 535 11 -26 106 42 355 40 953 14 811 455 25 687 1 402 68 461 66 923 21 825 11 165 33 933 1 538
08 Q4 -9 471 13 774 13 415 5 421 238 7 756 359 23 245 22 862 8 956 2 228 11 678 383
09 Q1 -9 622 10 617 10 250 4 633 195 5 422 367 20 239 19 871 7 839 2 204 9 828 368 Q2 -6 007 11 888 11 566 3 361 176 8 030 322 17 895 17 493 6 656 2 428 8 408 402 Q3 -4 911 11 004 10 686 4 702 137 5 846 319 15 915 15 560 5 686 2 425 7 449 355 Q4 -5 392 11 828 11 477 2 882 131 8 464 351 17 220 16 857 5 115 2 514 9 228 363
10 Q1 -4 241 9 114 8 733 3 793 112 4 828 381 13 355 12 971 4 861 2 492 5 619 384 Q2 -5 772 12 274 11 900 2 901 108 8 892 374 18 046 17 604 5 332 2 610 9 661 443 Q3 -5 296 10 013 9 632 4 176 99 5 356 381 15 308 14 959 4 836 2 654 7 469 350 Q4 -4 541 14 650 14 290 3 699 105 10 486 360 19 191 18 832 4 428 2 716 11 689 359
11 Q1 -5 868 8 280 7 919 3 552 103 4 263 361 14 148 13 727 4 639 2 689 6 399 422 Q2 -5 950 12 253 11 897 3 754 119 8 024 357 18 203 17 802 5 682 2 762 9 358 401 Q3 -7 487 9 698 9 356 3 523 115 5 718 342 17 185 16 839 6 364 2 840 7 635 346 Q4 -6 801 12 124 11 781 3 982 118 7 682 343 18 925 18 555 5 141 2 874 10 541 369
12 Q1 -6 703 8 342 7 952 4 419 121 3 412 390 15 045 14 655 5 538 2 646 6 471 390 Q2 -4 646 10 224 9 827 4 137 42 5 648 398 14 870 14 462 3 956 2 429 8 078 408 Q3 -4 322 8 023 7 606 3 657 34 3 915 417 12 345 11 942 3 876 2 453 5 613 403
BANCO DE ESPAÑA 309 BOLETÍN ESTADÍSTICO, FEBRUARY 2013

P P
P P P P
P P P P
P P P
1=2-9 2=3+5 3 4 5=6+7 6 7 8 9=10+12 10 11 12=13+14 13 14
17. BALANCE OF PAYMENTS AND INTERNATIONAL INVESTMENT POSITION 17.5 Current account. Current transfersA) Balance of payments
EUR millions Credits Debits General Other sectors General Other sectors government government
Balance Total Of which Workers’ Of which Total Of which Workers’ remit- remit- Total Total tances Other Total Total tances Other From EU From EU To EU
07 -7 146 18 530 3 671 1 791 14 859 5 311 9 549 6 215 25 677 12 342 10 314 13 335 8 449 4 886 08 -9 389 17 352 2 477 864 14 876 5 360 9 515 5 639 26 741 13 701 10 634 13 040 7 948 5 092 09 -8 030 18 152 3 057 1 084 15 095 5 061 10 034 6 674 26 182 14 591 11 440 11 591 7 214 4 377 10 -7 313 18 234 2 946 669 15 287 5 385 9 902 6 309 25 547 13 451 10 801 12 096 7 208 4 888 11 -5 904 19 664 3 851 1 743 15 813 5 711 10 102 6 073 25 569 13 048 11 366 12 520 7 256 5 265
08 Q4 -843 6 865 853 335 6 012 1 242 4 770 3 669 7 708 4 431 2 713 3 277 1 906 1 370
09 Q1 -3 360 3 511 707 285 2 804 1 148 1 656 791 6 871 4 118 3 692 2 753 1 688 1 065 Q2 -1 933 3 873 560 241 3 313 1 264 2 050 1 180 5 807 3 071 2 538 2 736 1 692 1 044 Q3 -2 113 3 289 656 85 2 633 1 422 1 211 451 5 402 2 417 1 931 2 986 1 901 1 084 Q4 -624 7 478 1 134 473 6 344 1 227 5 117 4 252 8 102 4 985 3 279 3 117 1 933 1 184
10 Q1 -4 250 3 110 653 158 2 458 1 217 1 240 476 7 360 4 640 3 998 2 720 1 584 1 136 Q2 -1 018 3 887 584 38 3 303 1 410 1 893 920 4 905 2 112 1 827 2 793 1 633 1 161 Q3 -2 850 3 661 876 208 2 786 1 470 1 316 337 6 511 3 189 2 714 3 322 1 969 1 353 Q4 805 7 575 834 264 6 741 1 288 5 453 4 576 6 770 3 509 2 263 3 261 2 023 1 238
11 Q1 -4 057 3 251 593 32 2 658 1 351 1 308 380 7 308 4 249 3 986 3 059 1 852 1 207 Q2 -1 503 3 734 502 74 3 232 1 445 1 787 700 5 238 2 195 1 832 3 042 1 745 1 297 Q3 -1 280 4 717 1 899 1 317 2 818 1 610 1 208 248 5 998 2 836 2 475 3 161 1 861 1 300 Q4 935 7 961 857 321 7 105 1 305 5 799 4 744 7 026 3 768 3 072 3 258 1 797 1 460
12 Q1 -4 481 3 417 715 319 2 702 1 346 1 355 423 7 898 4 863 4 678 3 035 1 583 1 452 Q2 -1 361 4 092 1 143 617 2 949 1 372 1 577 579 5 453 2 530 2 336 2 923 1 586 1 337 Q3 -2 404 3 465 921 289 2 543 1 456 1 087 127 5 868 2 874 2 339 2 994 1 656 1 339
P P
P P P P
P P P P
P P P
1=2-8 2=3+4 3 4=5+7 5 6 7 8=9+10 9 10=11+12 11 12
17. BALANCE OF PAYMENTS AND INTERNATIONAL INVESTMENT POSITION 17.6 Capital account.A) Balance of payments Summary by component and institutional sector
See notes at the end of the chapter
EUR millions Credits Debits Capital transfers Capital transfers General Disposal government Acquisition
Balance of Total of Total intangible intangible non-produced Of which Other non-produced General Other assets Total sectors assets Total government sectors Total From EU (a) (a)
07 4 577 6 419 148 6 271 4 947 4 598 1 324 1 843 631 1 211 96 1 115 08 5 475 6 892 423 6 469 5 163 4 912 1 305 1 417 585 833 96 737 09 4 224 6 478 1 138 5 340 4 175 3 965 1 165 2 254 1 553 701 153 547 10 6 289 7 934 1 058 6 876 5 560 5 402 1 317 1 645 925 720 71 649 11 5 488 7 190 615 6 575 5 139 5 022 1 436 1 702 981 721 140 581
08 Q4 661 1 097 142 955 638 616 316 436 174 261 22 239
09 Q1 1 058 1 393 155 1 239 975 877 263 335 188 147 12 135 Q2 1 311 2 010 371 1 639 1 278 1 239 362 699 533 167 35 131 Q3 700 1 411 446 965 712 683 253 711 470 241 87 154 Q4 1 155 1 664 167 1 497 1 210 1 166 287 509 362 147 19 128
10 Q1 1 896 2 265 189 2 076 1 769 1 692 307 369 174 195 19 175 Q2 1 710 2 120 180 1 940 1 600 1 576 340 410 235 175 17 158 Q3 1 363 1 831 521 1 309 1 023 990 286 468 287 181 23 158 Q4 1 320 1 719 167 1 551 1 167 1 143 384 399 230 169 12 157
11 Q1 1 563 1 873 183 1 690 1 391 1 360 299 310 148 162 9 153 Q2 1 343 1 619 229 1 390 1 036 1 025 354 276 149 127 4 123 Q3 1 267 1 733 144 1 589 1 237 1 206 351 466 310 156 7 148 Q4 1 314 1 965 59 1 906 1 475 1 430 431 651 375 276 120 156
12 Q1 684 984 90 895 545 509 350 300 163 137 11 126 Q2 1 727 2 021 78 1 943 1 667 1 645 276 295 129 165 12 154 Q3 1 508 1 859 154 1 705 1 405 1 358 300 351 178 173 14 158
BANCO DE ESPAÑA 310 BOLETÍN ESTADÍSTICO, FEBRUARY 2013

P P
P P
P P P P
P P P P P P P P P P P P
11+12 2=4-3 3 4 5=7-6 6 7 8=10-9 9 10 11 12
17. BALANCE OF PAYMENTS AND INTERNATIONAL INVESTMENT POSITION 17.7 Financial account.A) Balance of payments Breakdown by component
EUR millions Direct investment Portfolio investment Other investment including Banco de España including Banco de España Financial
Total derivatives Reserves including Total Abroad In Total Abroad In Total Abroad In Banco de Spain Spain Spain España
1=2+5+8+
08 100 222 1 553 51 008 52 561 -546 -21 418 -21 964 107 787 11 880 119 667 -7 927 -645 09 51 982 -1 917 9 409 7 491 50 761 -2 446 48 315 10 426 4 394 14 820 -5 724 -1 563 10 43 174 1 827 28 949 30 776 34 380 -70 420 -36 040 -825 17 442 16 617 8 606 -814 11 35 760 -5 596 26 800 21 204 -27 805 -38 174 -65 979 79 018 35 658 114 676 153 -10 010
11 J-D 35 760 -5 596 26 800 21 204 -27 805 -38 174 -65 979 79 018 35 658 114 676 153 -10 010 12 J-D -5 700 13 696 -2 672 11 024 -37 791 -11 245 -49 035 10 602 54 886 65 488 9 998 -2 205
11 Sep 2 356 2 516 1 439 3 955 -3 192 -1 861 -5 052 2 713 -877 1 836 410 -92 Oct 3 448 1 532 3 728 5 260 -5 701 -3 599 -9 301 8 498 5 134 13 632 68 -948 Nov 5 234 1 082 1 992 3 073 4 119 -5 925 -1 806 2 370 7 774 10 144 1 358 -3 694 Dec 1 530 659 4 990 5 649 -12 951 -5 067 -18 019 17 965 -1 044 16 921 -1 001 -3 142
12 Jan 3 767 2 934 -1 116 1 818 -5 664 -706 -6 370 6 767 -1 847 4 920 -198 -71 Feb 6 783 2 347 -104 2 243 -4 359 350 -4 009 6 227 9 215 15 441 2 679 -111 Mar 108 2 427 -3 2 424 -22 493 -1 512 -24 006 19 953 21 050 41 003 252 -30 Apr 425 1 148 1 255 2 404 -19 771 -6 607 -26 379 20 274 4 382 24 656 -1 074 -152 May 1 827 -1 312 1 703 391 -9 320 -2 813 -12 133 12 392 17 984 30 376 311 -243 Jun 1 627 -3 052 2 466 -587 -13 492 -2 482 -15 974 21 040 16 647 37 687 633 -3 502 Jul 1 275 -1 243 418 -826 -2 940 -8 185 -11 125 399 -9 146 -8 748 3 034 2 025 Aug -139 -502 1 264 763 1 924 -605 1 319 -1 294 -7 066 -8 359 -146 -122 Sep -5 313 3 070 -3 199 -129 10 633 -1 619 9 013 -19 766 -8 139 -27 905 763 -14 Oct -5 911 825 1 782 2 608 17 084 -10 522 6 562 -25 461 1 845 -23 616 1 638 2 Nov -1 428 873 934 1 807 32 150 -13 092 19 058 -36 854 5 741 -31 113 2 409 -6 Dec -8 719 6 181 -8 073 -1 891 -21 542 36 549 15 007 6 926 4 219 11 146 -302 18
P P
P P
P P P P
P P P P P P P P P P P P
1=2+3 2 3 4=5 to 8 5 6 7 8 9=10 to 13 10 11 12 13
17. BALANCE OF PAYMENTS AND INTERNATIONAL INVESTMENT POSITION 17.8 Spanish investment abroad.A) Balance of payments Breakdown by institutional sector
EUR millions
Direct Portfolio Other investment Other Other Other Other monetary resident Banco monetary General Other Banco monetary General Other
Total financial sectors Total de financial government resident Total de financial government resident institutions España institutions sectors España institutions sectors
08 51 008 6 436 44 571 -21 418 344 7 590 2 626 -31 977 11 880 -451 7 168 747 4 415 09 9 409 6 201 3 208 -2 446 -5 937 8 639 -12 202 7 055 4 394 385 3 482 1 314 -788 10 28 949 -6 480 35 429 -70 420 -6 708 -34 076 -5 956 -23 680 17 442 3 8 340 3 217 5 883 11 26 800 15 505 11 295 -38 174 4 730 -8 375 -1 101 -33 428 35 658 158 15 189 6 853 13 458
11 J-D 26 800 15 505 11 295 -38 174 4 730 -8 375 -1 101 -33 428 35 658 158 15 189 6 853 13 458 12 J-D -2 672 -1 794 -879 -11 245 -13 620 22 416 -4 860 -15 181 54 886 375 22 199 19 922 12 390
11 Sep 1 439 119 1 320 -1 861 40 485 15 -2 400 -877 1 -4 578 -11 3 711 Oct 3 728 80 3 648 -3 599 67 -821 -14 -2 831 5 134 6 4 065 120 943 Nov 1 992 170 1 822 -5 925 2 555 -6 705 14 -1 788 7 774 -28 5 014 2 374 414 Dec 4 990 429 4 562 -5 067 492 -1 898 29 -3 691 -1 044 178 -3 873 3 493 -842
12 Jan -1 116 1 435 -2 551 -706 -657 2 333 -362 -2 020 -1 847 -153 33 -1 360 -367 Feb -104 88 -192 350 -1 806 4 591 13 -2 447 9 215 29 11 685 -2 512 13 Mar -3 -457 454 -1 512 -2 199 1 373 8 -694 21 050 42 15 033 4 981 995 Apr 1 255 69 1 186 -6 607 -2 365 -1 811 -527 -1 904 4 382 20 -578 4 374 566 May 1 703 120 1 583 -2 813 -189 -2 252 11 -382 17 984 160 15 267 1 018 1 539 Jun 2 466 -61 2 526 -2 482 -362 -1 675 4 -449 16 647 8 13 158 399 3 082 Jul 418 103 314 -8 185 -1 514 -3 907 -244 -2 520 -9 146 -564 -11 487 220 2 685 Aug 1 264 -129 1 394 -605 -1 149 381 -578 743 -7 066 515 -8 967 -327 1 713 Sep -3 199 -2 894 -304 -1 619 -339 1 360 -1 527 -1 113 -8 139 8 -8 401 104 150 Oct 1 782 103 1 680 -10 522 -1 792 -5 895 -1 605 -1 230 1 845 119 -3 461 3 958 1 229 Nov 934 27 907 -13 092 168 -8 954 -800 -3 506 5 741 32 2 202 2 262 1 245 Dec -8 073 -197 -7 875 36 549 -1 414 36 872 749 342 4 219 160 -2 285 6 805 -459
BANCO DE ESPAÑA 311 BOLETÍN ESTADÍSTICO, FEBRUARY 2013

P P
P P P P
P P P P
P P P
1=2 a 4 2 3 4 5=6+10 6=7 a 9 7 8 9 10=11 a13 11 12 13
17. BALANCE OF PAYMENTS AND INTERNATIONAL INVESTMENT POSITION 17.9 Spanish direct and portfolio investment abroad,A) Balance of payments including Banco de España.
Monetary financial institutionsEUR millions
Direct investment Portfolio investment Banco de España Other monetary financial institutions Other equity
Total Shares and Real estate Total reinvested Shares Bonds and Money Shares Bonds and Money market earnings Total and mutual notes market Total and mutual notes instruments funds instruments funds
07 30 361 29 348 1 000 14 17 100 14 351 - 11 460 2 891 2 749 3 253 127 -631 08 6 436 5 600 894 -58 7 933 344 - 6 474 -6 131 7 590 -2 518 11 068 -960 09 6 201 4 909 1 322 -30 2 701 -5 937 - -3 997 -1 940 8 639 -1 640 6 983 3 295 10 -6 480 -8 065 1 567 18 -40 784 -6 708 - -6 440 -268 -34 076 -1 975 -28 628 -3 472 11 15 505 14 552 958 -5 -3 645 4 730 - 4 378 352 -8 375 -2 344 -5 122 -909
08 Q4 4 056 3 858 199 -1 249 1 854 - 2 692 -839 -1 605 -210 -956 -439
09 Q1 3 478 2 952 531 -5 -364 -2 928 - -903 -2 025 2 564 -1 297 1 043 2 818 Q2 559 311 254 -6 8 332 -3 355 - -3 554 199 11 687 -323 7 589 4 421 Q3 1 373 1 141 239 -7 -1 167 113 - 62 52 -1 280 -184 -141 -955 Q4 791 505 297 -12 -4 100 233 - 398 -166 -4 332 164 -1 508 -2 988
10 Q1 -6 577 -7 293 751 -35 -4 626 -975 - -976 1 -3 651 539 -3 511 -679 Q2 750 467 270 12 -21 326 -6 164 - -5 798 -366 -15 162 -1 420 -12 473 -1 270 Q3 252 -15 240 28 -6 984 -1 445 - -1 445 - -5 539 604 -5 786 -357 Q4 -905 -1 224 306 13 -7 847 1 875 - 1 778 97 -9 722 -1 698 -6 858 -1 166
11 Q1 4 408 4 189 220 -0 1 134 -110 - -601 492 1 243 -495 233 1 506 Q2 9 454 9 293 161 -0 166 -942 - -1 349 408 1 108 -923 2 259 -229 Q3 965 506 456 4 1 365 2 668 - 3 093 -426 -1 302 -731 531 -1 103 Q4 678 565 121 -8 -6 310 3 113 - 3 236 -122 -9 424 -195 -8 145 -1 084
12 Q1 1 066 687 379 0 3 635 -4 663 - -4 195 -468 8 298 489 7 664 145 Q2 129 -142 271 1 -8 654 -2 916 - -2 916 - -5 738 -534 -4 353 -852 Q3 -2 920 -3 245 328 -3 -5 169 -3 003 - -3 003 - -2 166 -350 -4 698 2 883
P P
P P P P
P P P P
P P P
1=2+3 2 3 4=5a8 5 6 7 8 9=10a12 10 11 12
17. BALANCE OF PAYMENTS AND INTERNATIONAL INVESTMENT POSITION 17.10 Spanish direct and portfolio investment abroad.A) Balance of payments General government and other resident sector
EUR millions
General government Other resident sectors
Portfolio Direct Portfolio Bonds and Other Inter- Shares Bonds and Money
Total notes Rest Total Shares equity and company Real Total and notes market reinvested debt estate mutual funds instruments earnings transactions
07 6 107 6 114 -6 69 774 48 357 13 286 4 765 3 365 -17 602 -9 962 -5 338 -2 302 08 2 626 2 638 -11 44 571 27 309 11 075 4 399 1 789 -31 977 -25 181 -9 575 2 779 09 -12 202 -12 201 -1 3 208 -6 574 8 799 -4 987 7 055 9 261 2 913 -5 118 10 -5 956 -5 956 -0 35 429 17 764 12 127 4 731 807 -23 680 11 210 -31 944 -2 946 11 -1 101 -1 100 -1 11 295 -633 6 465 4 845 618 -33 428 -7 309 -25 138 -981
08 Q4 -274 -269 -4 14 069 12 426 1 363 -59 339 -8 132 -6 809 -947 -376
09 Q1 -6 959 -6 959 -0 5 471 2 487 2 023 765 195 -2 546 -1 614 -958 26 Q2 -1 546 -1 546 -0 1 411 -3 402 273 4 464 76 1 198 1 909 -740 30 Q3 -3 086 -3 086 -0 -1 044 -1 520 2 266 -2 074 284 4 235 4 274 2 299 -2 338 Q4 -610 -610 -0 -2 631 -4 140 4 236 -3 159 431 4 167 4 692 2 312 -2 837
10 Q1 -882 -884 1 2 793 325 3 940 -1 721 249 4 065 6 956 -2 404 -488 Q2 -3 543 -3 548 5 4 406 -162 4 499 -249 317 -5 759 2 258 -10 578 2 560 Q3 -1 139 -1 134 -5 18 864 12 015 1 658 5 010 181 -11 764 288 -7 896 -4 157 Q4 -391 -391 -1 9 367 5 587 2 029 1 690 61 -10 221 1 707 -11 065 -862
11 Q1 -620 -620 -0 6 747 4 249 2 259 54 186 -9 035 1 219 -10 541 287 Q2 -27 -27 -0 -7 009 -5 962 -1 984 806 130 -9 609 -590 -7 995 -1 024 Q3 -483 -482 -1 1 525 -1 489 1 975 884 155 -6 474 -3 608 -3 499 633 Q4 29 29 -0 10 032 2 569 4 216 3 100 147 -8 310 -4 331 -3 104 -876
12 Q1 -341 -341 -0 -2 289 -2 337 854 -903 96 -5 162 1 844 -6 395 -611 Q2 -513 -513 0 5 295 -775 2 436 3 506 129 -2 735 1 926 -4 979 318 Q3 -2 350 -2 348 -1 1 404 296 1 145 -201 164 -2 891 926 -3 264 -553
BANCO DE ESPAÑA 312 BOLETÍN ESTADÍSTICO, FEBRUARY 2013

P P
P P P P
P P P P
P P P
1=2+5+8 2=3+4 3 4 5=6+7 6 7 8=9+10 9 10=11+12 11 12=13+14 13 14 15
17. BALANCE OF PAYMENTS AND INTERNATIONAL INVESTMENT POSITION 17.11 Other Spanish investment abroad,A) Balance of payments including Banco de España
Breakdown by institutional sectorEUR millions
General government Other resident sectors Monetary financial institutions, including Banco de España Other monetary financial institutions
Total Banco Total Long- Short- Total Long- Short- Total de Short-term Memo: term term term term España Long- Net change Total term Deposits in and deposits Total Loans others
07 37 405 1 236 668 568 4 284 111 4 173 31 885 -18 730 50 614 11 411 39 203 6 389 32 814 38 528 08 11 880 747 806 -60 4 415 817 3 598 6 718 -451 7 168 17 446 -10 278 2 329 -12 607 78 493 09 4 394 1 314 873 441 -788 704 -1 492 3 868 385 3 482 10 647 -7 164 -5 294 -1 870 2 124 10 17 442 3 217 2 947 270 5 883 378 5 504 8 343 3 8 340 9 719 -1 380 -4 296 2 916 -15 201 11 35 658 6 853 6 711 142 13 458 85 13 373 15 347 158 15 189 26 592 -11 403 -3 606 -7 797 -31 226
08 Q4 -32 681 3 473 139 3 334 -2 532 341 -2 873 -33 622 64 -33 686 5 846 -39 533 -2 358 -37 175 28 959
09 Q1 -12 527 -2 875 459 -3 334 -2 037 -6 -2 031 -7 616 331 -7 947 -1 916 -6 031 -5 553 -478 10 430 Q2 1 906 774 54 720 681 1 292 -611 451 -16 467 2 776 -2 309 -4 143 1 834 938 Q3 7 639 -702 84 -786 1 463 -646 2 108 6 878 177 6 701 1 146 5 555 5 910 -355 -13 060 Q4 7 377 4 117 275 3 842 -895 63 -958 4 154 -107 4 261 8 640 -4 379 -1 507 -2 872 3 816
10 Q1 -7 332 -3 719 102 -3 821 -349 20 -369 -3 264 -102 -3 161 4 798 -7 960 -224 -7 736 4 826 Q2 12 903 2 608 2 110 497 1 181 94 1 087 9 114 53 9 061 6 014 3 047 -2 669 5 716 -49 507 Q3 -8 234 120 744 -624 1 346 78 1 268 -9 701 -33 -9 668 -1 680 -7 988 -2 679 -5 308 30 698 Q4 20 105 4 208 -10 4 218 3 705 186 3 519 12 193 85 12 108 587 11 521 1 276 10 245 -1 218
11 Q1 9 846 -699 3 394 -4 093 4 081 66 4 015 6 464 -237 6 701 12 536 -5 835 -1 713 -4 121 1 761 Q2 13 976 1 112 1 066 46 2 828 20 2 808 10 037 267 9 770 6 341 3 429 1 496 1 933 36 613 Q3 -28 454 644 -190 6 034 81 5 953 -6 516 -27 -6 488 5 959 -12 447 -5 325 -7 122 -20 742 Q4 11 864 5 986 1 608 4 379 516 -82 597 5 362 156 5 206 1 757 3 449 1 936 1 513 -48 858
12 Q1 28 418 1 109 5 275 -4 166 641 -232 872 26 669 -82 26 751 10 618 16 133 -1 030 17 163 -74 440 Q2 39 013 5 791 5 775 16 5 187 -375 5 562 28 035 187 27 847 9 635 18 213 307 17 905 -70 995 Q3 -24 351 -3 302 -305 4 548 -258 4 805 -28 896 -41 -28 855 9 714 -38 568 3 483 -42 051 -4 092
P P
P P
P P P P
P P P P P P P P P P P P
1=2+3 2 3 4=5+6+7 5 6 7 8=9 a 12 9 10 11 12
17. BALANCE OF PAYMENTS AND INTERNATIONAL INVESTMENT POSITION 17.12 Foreign investment in Spain.A) Balance of payments Breakdown by institutional sector
EUR millions
Direct Portfolio Other investment Other Other Other General Other Banco Other General Other
Total monetary resident Total monetary Government resident Total de financial Government resident financial sector financial sectors España monetary sector institutions institutions institutions
08 52 561 961 51 599 -21 964 -13 957 16 934 -24 940 119 667 31 619 75 345 2 970 9 733 09 7 491 1 491 6 000 48 315 16 360 56 886 -24 931 14 820 6 146 7 185 2 317 -828 10 30 776 2 380 28 396 -36 040 -21 207 14 321 -29 154 16 617 9 788 -7 466 5 096 9 199 11 21 204 1 988 19 216 -65 979 -32 415 -12 587 -20 978 114 676 124 056 -19 374 2 574 7 420
11 J-D 21 204 1 988 19 216 -65 979 -32 415 -12 587 -20 978 114 676 124 056 -19 374 2 574 7 420 12 J-D 11 024 1 825 9 198 -49 035 -41 713 7 015 -14 338 65 488 162 366 -148 958 55 023 -2 942
11 Sep 3 955 0 3 954 -5 052 -4 149 2 494 -3 398 1 836 10 396 -9 464 255 649 Oct 5 260 185 5 075 -9 301 -3 203 -3 951 -2 147 13 632 19 867 -6 172 735 -798 Nov 3 073 99 2 975 -1 806 -3 625 2 049 -230 10 144 28 690 -18 534 41 -53 Dec 5 649 54 5 595 -18 019 -5 112 -11 091 -1 816 16 921 37 801 -22 123 121 1 122
12 Jan 1 818 -7 1 825 -6 370 930 -8 927 1 628 4 920 8 808 -4 727 662 177 Feb 2 243 115 2 128 -4 009 -3 328 -2 871 2 190 15 441 27 639 -14 882 221 2 464 Mar 2 424 748 1 677 -24 006 -8 180 -11 596 -4 230 41 003 64 608 -27 582 4 580 -603 Apr 2 404 -28 2 431 -26 379 -5 426 -13 857 -7 096 24 656 26 807 -6 026 4 399 -525 May 391 -7 397 -12 133 -8 125 1 450 -5 457 30 376 42 265 -14 292 1 458 945 Jun -587 37 -623 -15 974 -7 894 -714 -7 366 37 687 63 314 -23 141 -209 -2 277 Jul -826 65 -891 -11 125 -5 198 -81 -5 847 -8 748 14 853 -20 899 -220 -2 482 Aug 763 3 759 1 319 -2 243 6 639 -3 078 -8 359 11 155 -20 844 291 1 038 Sep -129 225 -354 9 013 -2 276 7 912 3 377 -27 905 -34 287 5 644 296 442 Oct 2 608 -274 2 881 6 562 -2 225 3 407 5 380 -23 616 -19 704 -4 123 -329 540 Nov 1 807 352 1 455 19 058 -931 13 799 6 190 -31 113 -14 388 -17 804 -124 1 203 Dec -1 891 596 -2 487 15 007 3 182 11 854 -29 11 146 -28 704 -284 43 998 -3 864
BANCO DE ESPAÑA 313 BOLETÍN ESTADÍSTICO, FEBRUARY 2013

P P
P P P P
P P P P
P P P
1=2+3 2 3 4=5a7 5 6 7
17. BALANCE OF PAYMENTS AND INTERNATIONAL INVESTMENT POSITION 17.13 Foreign direct and portfolio investment in SpainA) Balance of payments Monetary financial institutions
EUR millions
Direct Portfolio Other equity Bonds and Money
Total Shares and reinvested Total Shares notes market earnings instruments
07 1 072 85 987 38 154 -3 347 27 305 14 196 08 961 1 139 -177 -13 957 4 898 -10 652 -8 203 09 1 491 590 901 16 360 9 147 5 033 2 180 10 2 380 891 1 489 -21 207 -1 786 -14 463 -4 958 11 1 988 904 1 084 -32 415 -1 795 -23 179 -7 441
08 Q4 -1 7 -8 -15 205 3 520 -9 400 -9 324
09 Q1 394 343 51 -956 228 -3 771 2 587 Q2 479 180 299 4 051 2 621 2 236 -806 Q3 268 151 118 8 434 4 663 3 881 -109 Q4 349 -84 434 4 830 1 635 2 687 509
10 Q1 107 -4 111 -5 395 -761 -6 332 1 698 Q2 423 260 162 -17 088 -1 286 -11 410 -4 392 Q3 755 90 665 926 308 2 257 -1 639 Q4 1 096 545 551 350 -47 1 022 -625
11 Q1 143 -2 144 1 191 2 144 -655 -298 Q2 527 295 233 -10 312 -1 937 -5 368 -3 008 Q3 980 500 480 -11 354 -1 694 -8 456 -1 205 Q4 338 110 227 -11 939 -309 -8 700 -2 931
12 Q1 855 815 41 -10 578 1 455 -11 927 -106 Q2 2 -2 4 -21 445 -2 431 -18 411 -604 Q3 294 67 227 -9 716 2 639 -11 326 -1 029
P P
P P P P
P P P P
P P P
1=2 to 4 2 3 4 5=6 to 9 6 7 8 9 10=11 to 13 11 12 13
17. BALANCE OF PAYMENTS AND INTERNATIONAL INVESTMENT POSITION 17.14 Foreign direct and portfolio investment in Spain.A) Balance of payments General government and other resident sectors
EUR millions
General government Other resident sectors D i r e c t Portfolio Money
Total Bonds and market Rest Other Inter- Shares notes instru- Total Shares equity and company Real Total amd Bonds and Money ments reinvested debt estate mutual notes markets earnings transactions funds instruments
07 -16 460 -15 907 -553 - 45 882 16 706 11 715 12 120 5 341 73 823 15 292 62 784 -4 253 08 16 934 9 717 7 217 - 51 599 11 560 14 270 20 438 5 331 -24 940 -6 050 -30 051 11 161 09 56 886 25 672 31 214 - 6 000 -29 2 836 -461 3 654 -24 931 -2 780 -27 186 5 035 10 14 321 15 146 -831 7 28 396 7 564 14 401 2 688 3 744 -29 154 -1 670 -21 190 -6 295 11 -12 587 -6 367 -6 220 -0 19 216 1 926 15 888 -3 340 4 741 -20 978 4 424 -19 563 -5 839
08 Q4 4 635 1 436 3 199 - 10 953 -4 009 4 552 9 258 1 153 -15 841 590 -11 148 -5 283
09 Q1 6 700 3 268 3 433 - -948 -3 121 2 243 -1 022 953 -5 421 -821 -10 898 6 298 Q2 12 651 6 968 5 683 - 10 976 -486 1 157 9 453 852 -13 517 -1 335 -11 765 -417 Q3 14 363 4 977 9 385 - 2 239 3 623 414 -2 738 941 -4 340 1 716 -945 -5 112 Q4 23 172 10 459 12 713 - -6 267 -44 -978 -6 153 908 -1 652 -2 340 -3 578 4 267
10 Q1 10 920 3 446 7 475 -1 3 898 520 4 574 -2 074 878 -12 202 -856 -7 752 -3 595 Q2 -3 828 4 141 -7 980 11 1 176 -868 2 386 -1 310 968 -15 487 -1 692 -11 562 -2 233 Q3 3 478 2 560 918 - 8 291 1 504 3 056 2 756 975 6 583 3 504 1 537 1 543 Q4 3 751 4 998 -1 244 -3 15 032 6 409 4 385 3 315 923 -8 048 -2 626 -3 412 -2 010
11 Q1 8 373 8 752 -379 - 7 492 4 802 3 228 -1 674 1 135 4 841 8 438 -3 395 -203 Q2 -5 889 -6 461 571 - -5 594 -6 409 3 962 -4 452 1 305 -12 196 -4 704 -8 402 910 Q3 -2 078 -2 351 273 - 3 672 3 485 2 364 -3 339 1 163 -9 430 -766 -4 284 -4 380 Q4 -12 993 -6 307 -6 686 -0 13 645 47 6 334 6 125 1 138 -4 193 1 454 -3 482 -2 166
12 Q1 -23 394 -18 174 -5 219 -1 5 629 110 4 290 71 1 158 -412 -569 -2 946 3 104 Q2 -13 122 -7 238 -5 884 -0 2 205 460 4 220 -3 765 1 291 -19 919 892 -18 098 -2 714 Q3 14 471 9 656 4 813 2 -485 -1 317 4 090 -4 588 1 330 -5 548 1 724 -6 027 -1 245
BANCO DE ESPAÑA 314 BOLETÍN ESTADÍSTICO, FEBRUARY 2013

P P
P P P P
P P P P
P P P
1 2 3 4 5 6 7 8 9 10 11 12
17. BALANCE OF PAYMENTS AND INTERNATIONAL INVESTMENT POSITION 17.15 Other foreign investment in Spain,A) Balance of payments including Banco de España
Breakdown by institutional sectorEUR millions
General government Other resident sector Monetary financial institutions, including Banco de España Other monetary financial institutions
Total Long-term Short-term Long-term Short-term Banco Total loans loans Total loans loans Total de Long-term Short-term España loans loans Total
07 105 935 502 817 -315 19 897 21 890 -1 993 85 536 10 108 75 428 3 947 71 481 08 119 667 2 970 1 760 1 210 9 733 8 247 1 486 106 964 31 619 75 345 1 234 74 111 09 14 820 2 317 3 882 -1 565 -828 9 969 -10 797 13 331 6 146 7 185 24 149 -16 964 10 16 617 5 096 4 647 449 9 199 5 873 3 326 2 322 9 788 -7 466 2 987 -10 453 11 114 676 2 574 3 130 -556 7 420 3 523 3 897 104 682 124 056 -19 374 26 167 -45 541
08 Q4 9 043 2 470 866 1 604 -310 1 589 -1 899 6 884 11 019 -4 135 -1 194 -2 941
09 Q1 6 917 -721 897 -1 618 4 149 8 486 -4 337 3 489 -2 849 6 338 4 773 1 565 Q2 6 216 996 1 154 -157 -728 1 760 -2 487 5 947 3 120 2 828 -3 290 6 118 Q3 1 968 1 918 1 530 388 337 1 202 -865 -286 12 116 -12 402 -1 879 -10 523 Q4 -281 124 302 -177 -4 586 -1 478 -3 108 4 181 -6 241 10 422 24 545 -14 123
10 Q1 3 148 506 921 -415 -203 -836 633 2 846 2 170 675 2 377 -1 702 Q2 27 371 1 681 1 601 80 2 075 -651 2 726 23 615 62 313 -38 698 5 591 -44 289 Q3 -17 221 1 458 719 739 6 588 6 515 73 -25 267 -46 488 21 220 -1 119 22 339 Q4 3 319 1 450 1 406 45 740 845 -105 1 128 -8 208 9 336 -3 862 13 198
11 Q1 -1 970 123 611 -488 137 -750 887 -2 231 -10 895 8 664 17 883 -9 219 Q2 50 042 914 1 402 -488 1 584 953 630 47 545 5 333 42 212 8 255 33 957 Q3 25 907 641 142 499 5 427 3 286 2 141 19 839 43 260 -23 421 5 823 -29 244 Q4 40 697 896 975 -79 272 33 239 39 529 86 358 -46 829 -5 794 -41 035
12 Q1 61 365 5 462 5 885 -423 2 039 2 052 -13 53 864 101 055 -47 191 1 395 -48 586 Q2 92 719 5 648 5 435 213 -1 858 139 -1 997 88 928 132 386 -43 458 1 831 -45 289 Q3 -45 012 368 112 256 -1 002 -642 -360 -44 377 -8 279 -36 098 -2 486 -33 613
BANCO DE ESPAÑA 315 BOLETÍN ESTADÍSTICO, FEBRUARY 2013

Véanse notas al final del capítulo
___________________________________________________________________________________________________________________________
17. BALANZA DE PAGOS Y POSICION DE INVERSION INTERNACIONAL A) Balanza de pagos
2004 2005 2006 2007 2008 2009 2010 2011
SERVICIOS: INGRESOS 69 355 76 247 84 761 93 306 97 651 88 754 93 870 102 220
Turismo y viajes 36 376 38 558 40 715 42 061 41 901 38 125 39 621 43 026
Transportes 11 529 12 983 14 414 15 312 16 767 14 271 15 964 17 148Fletes 4 314 4 956 5 394 5 302 5 471 4 694 5 479 6 356Pasajes 3 971 4 249 4 966 5 310 5 745 4 593 5 176 5 337
Aéreos 3 855 4 129 4 796 5 071 5 535 4 462 5 063 5 242Terrestres y otros 36 45 42 45 23 20 24 26Marítimos 80 74 128 194 187 111 89 68
Otros (a) 3 245 3 778 4 054 4 700 5 551 4 985 5 309 5 456
Comunicaciones 982 1 188 1 148 1 244 1 511 1 505 1 600 1 653
Construcción 1 065 1 340 1 741 3 003 3 661 3 013 3 117 3 057
Seguros 619 647 648 1 110 960 1 266 812 986
Servicios financieros 1 670 2 266 3 165 4 298 3 840 3 099 3 452 3 805
Servicios informáticos 2 384 2 908 3 165 3 909 4 174 4 370 4 862 4 818
Servicios prestados a las empresas 12 929 14 393 17 398 20 113 22 432 20 824 21 778 24 717Comerciales (b) 1 613 1 928 1 650 1 383 1 640 1 825 1 493 1 395Leasing operativo (c) 246 340 440 861 737 805 774 915Otros servicios prestados a las empresas 11 071 12 125 15 308 17 870 20 055 18 193 19 511 22 407
Servicios personales, culturales y recreativos 777 866 986 1 165 1 198 1 198 1 339 1 563Audiovisuales 341 371 438 524 512 547 545 683Otros servicos culturales y recreativos 436 495 549 641 687 652 794 880
Servicios gubernamentales 622 651 633 700 668 584 657 683
Royalties y rentas de la propiedad inmaterial 402 447 749 390 539 498 668 765
SERVICIOS: PAGOS 47 602 54 008 62 525 70 255 71 861 63 722 66 356 67 980
Turismo y viajes 9 772 12 125 13 266 14 360 13 834 12 086 12 663 12 422
Transportes 12 952 14 876 16 370 16 314 18 014 14 520 16 478 17 117Fletes 8 585 9 780 10 890 9 840 10 158 7 839 9 166 10 007Pasajes 2 179 2 743 2 899 3 368 4 633 4 208 4 499 4 272
Aéreos 2 138 2 672 2 794 3 259 4 531 4 122 4 417 4 184Terrestres y otros 14 20 37 29 12 13 23 25Marítimos 27 51 68 81 91 73 58 63
Otros (a) 2 188 2 353 2 582 3 106 3 223 2 474 2 813 2 838
Comunicaciones 1 270 1 387 1 873 2 172 2 267 2 154 2 017 2 031
Construcción 692 860 1 049 1 415 2 071 1 677 1 353 1 088
Seguros 967 978 1 539 1 943 1 484 1 585 1 489 1 484
Servicios financieros 1 623 2 218 3 231 3 700 3 580 3 244 3 518 3 601
Servicios informáticos 1 359 1 626 1 683 1 916 1 934 1 777 2 133 2 230
Servicios prestados a las empresas 14 696 16 101 19 651 23 701 24 351 22 626 22 790 24 205Comerciales (b) 1 233 1 132 1 477 1 521 1 589 1 142 1 107 1 042Leasing operativo (c) 1 039 1 154 1 192 1 375 866 456 379 365Otros servicios prestados a las empresas 12 424 13 816 16 982 20 806 21 895 21 028 21 304 22 799
Servicios personales, culturales y recreativos 1 535 1 402 1 526 1 764 1 778 1 435 1 579 1 520Audiovisuales 1 023 915 917 1 012 1 018 766 883 884Otros servicos culturales y recreativos 511 487 609 753 761 669 696 636
Servicios gubernamentales 293 313 332 342 270 334 279 281
Royalties y rentas de la propiedad inmaterial 2 443 2 121 2 005 2 626 2 276 2 283 2 056 2 000
17.16. Transactions in services:By type of service
BANCO DE ESPAÑA 316 BOLETÍN ESTADÍSTICO, FEBRUARY 2013

See notes at the end of the chapter
___________________________________________________________________________________________________________________________
17.16 Balanza de servicios Detalle por tipo de servicio
Millones de euros
2010-IV 2011-I 2011-II 2011-III 2011-IV 2012-I 2012-II 2012-III
22 442 20 939 25 524 30 636 25 121 21 911 26 839 33 272 SERVICES: CREDITS
8 434 7 567 10 674 15 868 8 917 7 606 10 664 16 242 Travel
4 148 4 016 4 369 4 398 4 365 4 290 4 735 4 752 Transportation1 423 1 617 1 593 1 539 1 606 1 693 1 669 1 608 Freight1 313 1 229 1 430 1 324 1 353 1 378 1 549 1 529 Passenger transport1 288 1 214 1 406 1 298 1 325 1 357 1 520 1 489 Air transport
6 5 6 7 8 5 7 7 Overland and other transport18 11 19 20 19 16 23 33 Sea transport
1 412 1 170 1 346 1 535 1 406 1 220 1 517 1 616 Other(a)
486 379 348 480 445 351 390 436 Communication services
758 674 939 700 744 806 1 148 1 024 Construction services
181 136 223 315 311 250 234 323 Insurance services
1 008 942 991 891 981 811 836 889 Financial services
1 220 1 060 1 234 1 221 1 303 1 152 1 330 1 233 Computer and information services
5 485 5 504 5 934 6 063 7 216 5 886 6 693 7 530 Other business services-15 90 508 399 398 253 1 055 1 218 Merchanting (b)236 210 212 177 317 70 209 278 Operational leasing (c)
5 265 5 204 5 215 5 487 6 501 5 563 5 429 6 034 Miscellaneous business, professional and technical
365 358 423 366 416 346 452 512 Personal, cultural and recreational services148 156 201 147 180 160 232 239 Audiovisual217 202 222 219 237 186 220 273 Other cultural and recreational services
182 167 167 146 203 166 150 141 Government services
173 135 221 188 220 246 207 191 Royalties and licence fees
17 201 16 730 15 983 17 539 17 728 16 643 16 881 18 105 SERVICES: DEBITS
3 276 2 689 2 608 3 877 3 249 2 545 2 661 3 667 Travel
4 348 4 185 4 110 4 346 4 476 4 383 4 645 4 445 Transportation2 424 2 653 2 437 2 337 2 580 2 665 2 417 2 311 Freight1 189 857 966 1 275 1 174 1 013 1 451 1 322 Passenger transport1 173 843 943 1 241 1 158 1 001 1 436 1 298 Air transport
4 5 7 8 5 5 7 5 Overland and other transport12 9 16 27 10 8 8 18 Sea transport
735 674 708 734 722 705 777 812 Other (a)
501 504 512 512 504 495 566 470 Communication services
284 267 289 254 277 281 273 233 Construction services
404 393 443 286 362 331 446 420 Insurance services
972 923 889 884 904 825 1 006 1 109 Financial services
616 519 646 566 498 588 583 637 Computer and information services
5 951 6 259 5 691 5 675 6 581 6 252 5 816 6 162 Other business services272 285 245 248 264 254 267 255 Merchanting (b)
97 89 100 88 88 71 61 144 Operational leasing (c)5 581 5 884 5 346 5 339 6 230 5 927 5 488 5 763 Miscellaneous business, professional and technical
322 447 337 404 331 418 346 441 Personal, cultural and recreational services180 299 201 216 168 274 159 265 Audiovisual and related services143 148 136 189 163 144 188 176 Other cultural and recreational services
66 90 62 70 59 59 72 61 Government services
461 454 396 664 487 465 467 459 Royalties and licence fees
EUR millions
17. BALANCE OF PAYMENTS AND INTERNATIONAL INVESTMENT POSITION A) Balance of payments
BANCO DE ESPAÑA 317 BOLETÍN ESTADÍSTICO, FEBRUARY 2013

Véanse notas al final del capítulo
___________________________________________________________________________________________________________________________
17. BALANZA DE PAGOS Y POSICION DE INVERSION INTERNACIONAL A) Balanza de pagos
2004 2005 2006 2007 2008 2009 2010 2011
SERVICIOS: INGRESOS 69 355 76 247 84 761 93 306 97 651 88 754 93 870 102 220
TOTAL MUNDIAL 69 355 76 247 84 761 93 306 97 651 88 754 93 870 102 220EUROPA 58 135 63 101 71 713 77 645 80 460 70 800 74 249 80 540
Unión Europea 52 846 57 500 64 323 68 300 70 481 62 231 64 782 70 456Área del euro 30 262 33 725 40 501 41 866 44 275 40 930 42 915 46 610Reino Unido 20 355 21 115 20 389 22 482 22 216 17 818 17 949 19 145Suecia 1 018 1 065 1 128 1 434 1 348 1 197 1 349 1 578Dinamarca 472 694 1 167 1 149 1 232 1 013 1 004 1 096Instituciones europeas 350 401 446 459 497 375 412 424Países de nueva incorporación 389 499 691 911 912 898 1 153 1 603del cual:
República Checa 88 95 138 155 123 194 180 185Hungría 79 99 97 100 148 80 67 317Polonia 118 145 199 266 377 421 488 646
Resto de Europa 5 289 5 601 7 390 9 345 9 979 8 569 9 467 10 084del cual:
Suiza 3 402 3 262 4 561 5 956 6 320 5 351 5 732 5 286Noruega 996 1 095 1 168 1 349 1 633 1 117 1 207 1 520Rusia 206 303 454 658 989 911 1 228 1 686Turquía 138 228 232 269 222 333 509 690
AMÉRICA DEL NORTE Y CENTRAL 6 928 8 143 6 971 7 624 7 844 7 760 9 738 10 327Estados Unidos 5 209 5 985 4 117 5 222 5 536 5 155 6 612 7 005Canadá 414 659 759 602 563 846 905 1 048México 830 912 1 094 1 092 1 141 1 152 1 517 1 462
AMÉRICA DEL SUR 1 460 1 872 2 615 2 689 3 341 3 324 4 020 5 060Argentina 297 395 518 574 652 519 778 843Brasil 328 382 579 587 702 925 1 405 1 589Chile 210 242 301 344 323 303 ... 436Colombia 113 143 197 254 269 247 348 336Venezuela 176 328 622 608 839 634 730 875
ÁFRICA 700 796 923 1 354 2 042 2 311 1 579 1 729Egipto 99 91 83 102 103 113 94 68Magreb 364 402 469 631 1 096 1 242 864 835
ASIA 1 285 1 417 1 779 2 866 2 729 3 169 2 835 3 345Japón 361 325 388 434 417 415 395 444China 96 129 142 201 215 310 311 491Hong-Kong 68 90 93 106 53 72 146 186Singapur 101 78 97 179 197 156 209 231Próximo y Medio Oriente 407 495 702 1 527 1 507 1 813 1 272 1 334
Israel 142 144 177 175 175 156 208 254Países del Golfo 208 285 457 1 281 1 253 1 552 963 956
OCEANÍA Y REGIONES POLARES 178 190 242 313 309 431 507 553Australia 155 161 205 266 293 418 495 538
INSTITUCIONES INTERNACIONALES DISTINTAS DE LAS DE LA UE 564 567 373 704 828 786 794 498
INDETERMINADOS 105 163 143 112 98 172 147 168
Pro memoriaOCDE 64 361 70 104 76 747 83 142 86 328 76 665 81 997 88 761NAFTA 6 453 7 557 5 969 6 916 7 240 7 154 9 034 9 515EFTA 4 528 4 522 5 943 7 487 8 102 6 539 6 995 6 889OPEP 512 785 1 244 2 402 3 206 3 594 2 408 2 675Nuevos países industrializados (NICS) 268 268 307 426 375 330 569 709ASEAN 163 182 220 305 290 243 332 394Comunidad de estados independientes 233 347 519 755 1 065 1 020 1 277 1 784Paraísos fiscales 823 1 027 1 337 1 505 1 131 1 373 1 475 1 648MERCOSUR 686 839 1 178 1 263 1 699 1 744 2 461 3 051Latinoamérica 2 514 3 045 4 055 4 107 4 749 4 744 5 888 7 002
17.17 Transactions in services:Geographical breakdown
BANCO DE ESPAÑA 318 BOLETÍN ESTADÍSTICO, FEBRUARY 2013

See notes at the end of the chapter
___________________________________________________________________________________________________________________________
17.17 Balanza de servicios Detalle geográfico de servicios
Millones de euros
2010-IV 2011-I 2011-II 2011-III 2011-IV 2012-I 2012-II 2012-III
22 442 20 939 25 524 30 636 25 121 21 911 26 839 33 272 SERVICES: CREDITS
22 442 20 939 25 524 30 636 25 121 21 911 26 839 33 272 TOTAL WORLD17 676 16 592 19 688 24 938 19 322 17 159 20 144 25 784 EUROPE15 335 14 230 17 115 22 104 17 007 15 255 18 043 23 148 European Union10 193 9 434 11 227 14 850 11 098 9 882 11 384 14 877 Euro area4 104 3 631 4 825 6 039 4 650 4 189 5 523 6 952 United Kingdom
388 433 389 340 416 421 366 400 Sweden219 300 242 295 260 252 291 333 Denmark122 101 121 92 109 107 117 109 EU Institutions309 331 311 488 473 404 362 477 New EU member states
of wich:... ... ... 68 ... ... ... ... Czech Republic... ... 61 96 119 68 84 94 Hungary
109 138 126 221 161 115 113 233 Poland2 341 2 362 2 573 2 834 2 315 1 905 2 102 2 635 Rest of Europe
of wich:1 475 1 297 1 498 1 397 1 094 777 958 965 Switzerland
321 405 309 377 429 424 324 407 Norway231 345 401 622 318 361 449 773 Russia137 105 136 183 266 144 153 210 Turkey
2 409 2 060 2 686 2 545 3 036 2 525 3 486 3 685 CENTRAL AND NORTH AMERICA1 726 1 376 1 920 1 757 1 952 1 612 2 617 2 750 United States
169 170 222 194 461 261 197 230 Canada384 308 359 418 378 395 431 460 Mexico
861 841 1 559 1 360 1 300 851 1 580 1 644 SOUTH AMERICA184 145 274 238 186 160 261 256 Argentine398 354 380 438 417 317 411 398 Brazil
... 105 55 133 142 128 102 141 Chile81 ... 110 94 92 86 114 103 Colombia
162 151 408 179 137 100 265 240 Venezuela
394 315 372 545 496 460 426 444 AFRICA... ... ... ... ... ... ... ... Egypt
194 162 212 236 225 247 209 217 Maghreb
749 842 820 848 834 780 921 1 404 ASIA102 94 98 147 106 86 138 127 Japan
91 178 84 93 136 74 128 135 China53 ... ... ... ... 56 62 74 Hong-Kong51 ... ... 77 77 76 99 58 Singapore
315 320 360 357 297 314 354 855 Near and Middle East... 63 61 69 61 60 62 81 Israel
241 221 273 261 201 228 266 746 Gulf Countries
94 70 182 213 88 87 239 283 OCEANIA AND POLAR REGIONS91 65 176 210 87 83 235 274 Australia
217 183 177 134 ... ... ... ... INTERNATIONAL ORGANISATIONS DIFFERENT FROM EU INSTITUTIONS
... ... ... 52 ... ... ... ... UNCLASSIFIED
Memorandum items19 638 18 143 21 936 26 858 21 825 19 085 23 138 28 684 OECD2 279 1 855 2 501 2 368 2 791 2 267 3 245 3 440 NAFTA1 806 1 728 1 820 1 800 1 541 1 222 1 299 1 385 EFTA
551 491 843 759 582 575 739 1 189 OPEC148 160 195 161 193 215 221 179 Nuevos países industrializados (NICS)101 69 71 118 136 121 133 108 ASEAN242 360 420 660 344 387 493 849 Independent states community331 395 383 436 433 437 469 460 Offshore financial centres575 489 904 853 806 407 897 894 MERCOSUR
1 308 1 251 2 027 1 887 1 836 1 382 2 169 2 272 Latin America
EUR millions
17. BALANCE OF PAYMENTS AND INTERNATIONAL INVESTMENT POSITION A) Balance of payments
BANCO DE ESPAÑA 319 BOLETÍN ESTADÍSTICO, FEBRUARY 2013

Véanse notas al final del capítulo
___________________________________________________________________________________________________________________________
17. BALANZA DE PAGOS Y POSICION DE INVERSION INTERNACIONAL B) Balanza de pagos
2004 2005 2006 2007 2008 2009 2010 2011
SERVICIOS: PAGOS 47 602 54 008 62 525 70 255 71 861 63 722 66 356 67 980
TOTAL MUNDIAL 47 602 54 008 62 525 70 255 71 861 63 722 66 356 67 980EUROPA 34 756 39 636 46 532 53 353 54 259 48 007 49 484 50 573
Unión Europea 30 456 35 449 41 426 47 332 48 286 43 132 44 225 45 582Área del euro 20 775 23 698 27 745 31 043 33 050 29 002 29 231 30 374Reino Unido 8 176 10 081 11 525 13 836 12 940 12 189 13 103 12 581Suecia 482 483 719 731 651 569 552 528Dinamarca 292 288 358 449 455 359 341 373Instituciones europeas ... ... ... ... ... ... ... ...Países de nueva incorporación 702 861 1 074 1 269 1 175 991 986 1 695del cual:
República Checa 136 169 210 229 230 189 187 207Hungría 274 299 318 363 339 314 292 810Polonia 136 167 216 309 298 239 243 353
Resto de Europa 4 299 4 188 5 106 6 021 5 973 4 876 5 259 4 991del cual:Suiza 2 741 2 286 2 821 3 629 3 809 2 887 3 093 2 451Noruega 266 256 260 268 255 260 256 364Rusia 265 368 507 477 482 324 439 520Turquía 245 341 433 469 360 333 392 352
AMÉRICA DEL NORTE Y CENTRAL 7 067 7 303 7 849 8 678 9 123 8 017 8 301 8 413Estados Unidos 5 218 5 393 5 713 6 322 6 834 6 361 6 517 6 807Canadá 461 537 663 964 989 577 457 412México 483 587 637 672 661 510 557 579
AMÉRICA DEL SUR 1 141 1 453 1 799 2 070 2 085 1 811 2 067 2 313Argentina 318 396 445 486 535 444 423 418Brasil 292 373 421 469 455 427 541 573Chile 127 152 190 231 250 182 273 328Colombia 106 142 163 203 223 192 256 333Venezuela ... 95 199 159 131 162 105 133
ÁFRICA 1 515 1 835 2 130 2 061 2 170 1 887 2 034 1 917Egipto 203 239 249 247 224 159 185 102Magreb 731 868 978 1 045 1 012 909 1 009 965
ASIA 2 633 3 248 3 916 3 838 3 946 3 648 4 135 4 340Japón 492 529 507 539 419 357 364 416China 565 809 1 038 995 1 020 876 1 172 1 108Hong-Kong 105 157 269 195 198 179 170 262Singapur 117 58 121 151 206 123 163 154Próximo y Medio Oriente 514 687 800 799 1 153 1 257 1 351 1 360
Israel 96 130 175 177 186 175 210 191Países del Golfo 300 358 449 458 747 891 864 834
OCEANÍA Y REGIONES POLARES 140 150 181 205 187 138 157 203Australia 111 109 134 144 155 114 115 139
INSTITUCIONES INTERNACIONALES DISTINTAS DE LAS DE LA UE 209 131 ... 84 ... 98 ... ...
INDETERMINADOS 142 252 108 ... ... 116 170 193
Pro memoriaOCDE 40 512 45 460 52 463 60 074 61 341 54 127 56 118 57 204NAFTA 6 162 6 517 7 013 7 958 8 484 7 448 7 531 7 798EFTA 3 053 2 617 3 151 3 953 4 109 3 182 3 374 2 843OPEP 947 1 237 1 573 1 473 2 186 2 073 2 101 2 141Nuevos países industrializados (NICS) 499 495 715 658 648 526 529 665ASEAN 455 482 632 625 563 423 524 529Comunidad de estados independientes 347 488 633 606 615 421 525 658Paraísos fiscales 1 139 1 311 1 698 1 661 1 511 1 321 1 616 1 576MERCOSUR 696 865 974 1 106 1 140 1 001 1 107 1 145Latinoamérica 1 884 2 361 2 792 3 078 3 048 2 615 2 910 3 182
17.17 (Continued) Transactions in services:Geographical breakdown
BANCO DE ESPAÑA 320 BOLETÍN ESTADÍSTICO, FEBRUARY 2013

See notes at the end of the chapter
___________________________________________________________________________________________________________________________
17.17 (Continuación) Balanza de servicios Detalle geográfico de servicios
Millones de euros
2010-IV 2011-I 2011-II 2011-III 2011-IV 2012-I 2012-II 2012-III
17 201 16 730 15 983 17 539 17 728 16 643 16 881 18 105 SERVICES: DEBITS
17 201 16 730 15 983 17 539 17 728 16 643 16 881 18 105 TOTAL WORLD12 813 12 316 11 987 13 036 13 234 12 214 12 352 13 534 EUROPE11 528 10 871 10 832 11 842 12 038 10 860 11 211 12 304 European Union7 525 7 146 7 196 7 910 8 123 7 011 7 290 7 763 Euro area3 498 3 118 2 986 3 270 3 207 3 253 3 302 3 847 United Kingdom
140 122 138 126 142 136 160 122 Sweden90 80 96 106 92 93 81 159 Denmark... ... ... ... ... ... ... ... EU Institutions
273 403 391 427 474 363 368 404 New EU member statesof wich:
51 ... ... ... 69 ... ... ... Czech Republic97 201 189 224 196 171 182 204 Hungary55 83 85 69 116 78 70 71 Poland
1 284 1 445 1 155 1 194 1 196 1 355 1 142 1 231 Rest of Europeof wich:
763 726 594 609 523 731 546 590 Switzerland69 130 65 96 73 93 111 79 Norway
123 127 146 139 108 121 139 154 Russia104 82 91 97 83 71 86 87 Turkey
2 187 2 065 1 914 2 201 2 234 2 066 2 359 2 309 CENTRAL AND NORTH AMERICA1 795 1 660 1 516 1 791 1 841 1 617 1 903 1 849 United States
83 81 95 115 120 104 88 111 Canada150 164 119 152 144 161 164 186 Mexico
539 546 548 595 624 572 572 591 SOUTH AMERICA115 105 99 98 115 102 102 81 Argentine128 150 135 137 151 135 124 137 Brazil
76 69 84 84 91 64 70 59 Chile69 75 88 83 88 115 93 95 Colombia... ... ... ... ... ... ... 72 Venezuela
518 514 461 452 491 620 513 475 AFRICA... ... ... ... ... ... ... ... Egypt
243 249 229 230 258 252 210 197 Maghreb
1 065 1 167 979 1 151 1 043 1 068 954 1 089 ASIA86 188 75 75 78 72 94 76 Japan
319 283 277 290 258 275 256 286 China... 60 50 62 89 66 ... 95 Hong-Kong... ... ... ... ... ... ... ... Singapore
326 329 293 408 329 356 292 296 Near and Middle East60 59 ... 53 ... 71 ... ... Israel
199 196 187 224 227 243 217 235 Gulf Countries
... 55 ... 52 53 68 66 65 OCEANIA AND POLAR REGIONS
... ... ... ... ... 52 ... 56 Australia
... ... ... ... ... ... ... ... INTERNATIONAL ORGANISATIONS DIFFERENT FROM EU INSTITUTIONS
... ... ... 51 ... ... 63 ... UNCLASSIFIED
Memorandum items14 677 13 943 13 445 14 837 14 979 13 836 14 289 15 334 OECD2 028 1 905 1 730 2 059 2 105 1 882 2 155 2 146 NAFTA
838 859 662 713 608 831 660 676 EFTA513 543 467 602 529 585 537 602 OPEC139 159 150 166 191 151 139 197 New industrialized countries(NICS)138 135 120 148 125 130 121 151 ASEAN147 152 179 172 155 163 178 194 Independent states community372 422 343 384 426 429 381 444 Offshore financial centres291 283 278 277 308 274 257 247 MERCOSUR758 777 740 817 848 825 812 851 Latin America
EUR millions
17. BALANCE OF PAYMENTS AND INTERNATIONAL INVESTMENT POSITION B) Balance of payments
BANCO DE ESPAÑA 321 BOLETÍN ESTADÍSTICO, FEBRUARY 2013

Posición de Inversión Internacional
Cuentas financieras
1 2 3 4 5 6 7 8 9 10 11
___________________________________________________________________________________________________________________________
17. BALANZA DE PAGOS Y POSICIÓN DE INVERSIÓN INTERNACIONAL 17.C Conciliación entre los activos financieros y pasivos frente a otros residentes en la zona del euro y al resto del mundo y la Posición de Inversión Internacional
Datos referidos a 2011-IV
Inversiones de España en el exterior/Spanish investment abroad
Inversión directa/ Inversión de cartera/ Otras inversiones/ Direct investment Portfolio investment Other investment Acciones y participaciones/ Bonos y obligaciones/ Instos. mercado monetario/ Préstamos/ Financiación Equity securities Bonds and notes Money market instruments Loans
Acciones y entre otras partici- empresas paciones/ relacionadas/ Instituciones Otros Instituciones Otros Instituciones Otros Instituciones Otros Shares Intercompany financieras sectores financieras sectores financieras sectores financieras Adminis- sectores and other debt monetarias/ residentes/ monetarias/ residentes/ monetarias/ residentes/ monetarias/ traciones residentes/ equities transactions Monetary Other Monetary Other Monetary Other Monetary Públicas/ Other financial resident financial resident financial resident financial General resident institutions sectors institutions sectors institutions sectors institutions government sectors
AF.1 ORO MONETARIO Y DEG . . . . . . . . . . . . .
AF.2 EFECTIVO Y DEPÓSITOS . . . . . . . . . . . . . .
Instituciones financieras monetarias. . . . . . . . . . . Otros sectores residentes . . . . . . . . . . . . . . . Instituciones financieras no monetarias . . . . . . . .
Sociedades no financieras . . . . . . . . . . . . . .
Hogares e instituciones sin fines de lucro . . . . . . .
AF.3 VALORES DISTINTOS DE ACCIONES (EXCEPTO AF.34) 111 040 115 613 2 215 2 419
Instituciones financieras monetarias. . . . . . . . . . . 111 040 2 215 Administraciones Públicas . . . . . . . . . . . . . . . 7 688 Otros sectores residentes . . . . . . . . . . . . . . . 107 925 2 419 Instituciones financieras no monetarias . . . . . . . .
Sociedades no financieras . . . . . . . . . . . . . .
Hogares e instituciones sin fines de lucro . . . . . . .
AF.34 DERIVADOS FINANCIEROS . . . . . . . . . . . .
AF.4 PRÉSTAMOS . . . . . . . . . . . . . . . . . . . 49 947 69 652 19 810 3 414
Instituciones financieras monetarias. . . . . . . . . . . 69 652 Administraciones Públicas . . . . . . . . . . . . . . . 19 810 Otros sectores residentes . . . . . . . . . . . . . . . 49 947 3 414 Instituciones financieras no monetarias . . . . . . . .
Sociedades no financieras . . . . . . . . . . . . . .
AF.5 ACCIONES Y OTRAS PARTICIPACIONES . . . . . . 446 546 4 275 73 467
Instituciones financieras monetarias. . . . . . . . . . . 85 076 4 275 Administraciones Públicas . . . . . . . . . . . . . . . Otros sectores residentes . . . . . . . . . . . . . . . 361 470 73 467 Instituciones financieras no monetarias . . . . . . . .
Sociedades no financieras . . . . . . . . . . . . . .
Hogares e instituciones sin fines de lucro . . . . . . .
AF.6 RESERVAS TÉCNICAS DE SEGURO . . . . . . . .
AF.7 OTRAS CUENTAS PENDIENTES DE COBRO . . . .
TOTAL ACTIVOS FINANCIEROS DE SECT. RESIDENTES . 446 546 49 947 4 275 73 467 111 040 115 613 2 215 2 419 69 652 19 810 3 414
2011 Q4 data
1. Financial assets of domestic sectors (liabilities of other euro area residents and the rest of the world)
BANCO DE ESPAÑA 322 BOLETÍN ESTADÍSTICO, FEBRUARY 2013

International Investment Position
Financial accounts
12 13 14 15 16 17 18 19=1 a 18 20 21=20-19
___________________________________________________________________________________________________________________________
1. Activos financieros de los sectores residentes (pasivos de otros residentes en la zona del euro y en el resto del mundo)
Millones de euros
Inversiones de España en el exterior/Spanish investment abroad
Otras inversiones/Other investment Total
Posición de Cuentas Inversión financieras/ Discrepancia/ Depósitos/Deposits Otros activos/Other assets Internacional/ Financial Discrepancy Derivados Reservas/ Total accounts financieros/ Reserve International Financial assets Investment Instituciones Otros Instituciones Administraciones Otros derivatives Position financieras sectores financieras Públicas/ sectores monetarias/ residentes/ monetarias/ General residentes/ Monetary Other Monetary government Other financial resident financial resident institutions sectors institutions sectors
14 180 14 180 -14 180 AF.1 MONETARY GOLD AND SDRs
165 999 122 935 2 748 291 682 259 426 -32 256 AF.2 CURRENCY AND DEPOSITS
165 999 2 748 168 747 168 429 -319 Monetary financial institutions 122 935 122 935 90 998 -31 937 Other resident sector 11 945 Non-monetary financial institutions
35 841 Non-financial corporations
43 211 Households and non-profit institutions
19 474 250 762 253 779 3 017 AF.3 SECURITIES OTHER THAN SHARES (EXCEPT AF.34)
19 474 132 729 120 527 -12 202 Monetary financial institutions 7 688 7 405 -283 General Government 110 344 125 847 15 503 Other resident sector 118 339 Non-monetary financial institutions
2 464 Non-financial corporations
5 044 Households and non-profit institutions
140 225 140 225 28 217 -112 009 AF.34 FINANCIAL DERIVATIVES
142 823 189 707 46 884 AF.4 LOANS
69 652 69 860 208 Monetary financial institutions 19 810 14 471 -5 339 General Government 53 361 105 376 52 015 Other resident sector 1 272 Non-monetary financial institutions
104 103 Non-financial corporations
7 808 5 240 4 501 541 837 540 289 -1 548 AF.5 SHARES AND OTHER EQUITY
7 808 97 158 96 165 -993 Monetary financial institutions 5 240 5 240 2 632 -2 608 General Government 4 501 439 438 441 491 2 053 Other resident sector 45 519 Non-monetary financial institutions
386 277 Non-financial corporations
9 695 Households and non-profit institutions
4 711 4 711 5 250 539 AF.6 INSURANCE TECHNICAL RESERVES
54 762 54 762 AF.7 OTHER ACCOUNTS PAYABLE
165 999 122 935 7 808 5 240 9 213 140 225 36 402 1 386 240 1 331 429 -54 810 FINANCIAL ASSETS OF DOMESTIC SECTORS. TOTAL
EUR millions
17. BALANCE OF PAYMENTS AND INTERNATIONAL INVESTMENT POSITION 17.C Reconciliation between financial assets and liabilities vis-à-vis other euro area residents and the rest of the world and the International Investment Position
BANCO DE ESPAÑA 323 BOLETÍN ESTADÍSTICO, FEBRUARY 2013

Posición de Inversión Internacional
Cuentas financieras
1 2 3 4 5 6 7 8 9 10
___________________________________________________________________________________________________________________________
17. BALANZA DE PAGOS Y POSICIÓN DE INVERSIÓN INTERNACIONAL 17.C Conciliación entre los activos financieros y pasivos frente a otros residentes en la zona del euro y al resto del mundo y la Posición de Inversión Internacional
Datos referidos a 2011-IV
Inversiones del exterior en España/Foreign investment in Spain
Inversión directa/ Inversión de cartera/ Direct investment Portfolio investment Acciones y participaciones/ Bonos y obligaciones/ Instrumentos del mercado monetario/ Financiación Equity securities Bonds and notes Money market instruments
Acciones y entre otras partici- empresas paciones/ relacionadas/ Instituciones Otros Instituciones Otros Instituciones Otros Shares Intercompany financieras sectores financieras Administra- sectores financieras Administra- sectores and other debt monetarias/ residentes/ monetarias/ ciones residentes/ monetarias/ ciones residentes/ equities transactions Monetary Other Monetary Públicas/ Other Monetary Públicas/ Other financial resident financial General resident financial General resident institutions sectors institutions government sectors institutions government sectors
AF.1 ORO MONETARIO Y DEG . . . . . . . . . . . . . . .
AF.22 DEPÓSITOS TRANSFERIBLES . . . . . . . . . . . . . Instituciones financieras monetarias. . . . . . . . . . . . .
AF.29 OTROS DEPÓSITOS . . . . . . . . . . . . . . . . .
Instituciones financieras monetarias. . . . . . . . . . . . . Otros sectores residentes . . . . . . . . . . . . . . . . . Instituciones financieras no monetarias . . . . . . . . . .
AF.331 VALORES DISTINTOS DE ACCIONES A CORTO PLAZO 3 494 28 545 5 300
Instituciones financieras monetarias. . . . . . . . . . . . . 3 494 Administraciones Públicas . . . . . . . . . . . . . . . . . 28 545 Otros sectores residentes . . . . . . . . . . . . . . . . . 5 300 Instituciones financieras no monetarias . . . . . . . . . .
Sociedades no financieras . . . . . . . . . . . . . . . .
AF.332 VALORES DISTINTOS DE ACCIONES A LARGO PLAZO 218 539 211 918 224 068
Instituciones financieras monetarias. . . . . . . . . . . . . 218 539 Administraciones Públicas . . . . . . . . . . . . . . . . . 211 918 Otros sectores residentes . . . . . . . . . . . . . . . . . 224 068 Instituciones financieras no monetarias . . . . . . . . . .
Sociedades no financieras . . . . . . . . . . . . . . . .
AF.34 DERIVADOS FINANCIEROS . . . . . . . . . . . . . .
AF.4 PRÉSTAMOS . . . . . . . . . . . . . . . . . . . . . 119 550
Administraciones Públicas . . . . . . . . . . . . . . . . . Otros sectores residentes . . . . . . . . . . . . . . . . . 119 550 Instituciones financieras no monetarias . . . . . . . . . .
Sociedades no financieras . . . . . . . . . . . . . . . .
Hogares e instituciones sin fines de lucro . . . . . . . . .
AF.5 ACCIONES Y OTRAS PARTICIPACIONES . . . . . . . . 364 196 50 283 113 931
Instituciones financieras monetarias . . . . . . . . . . . . 50 283 Otros sectores residentes. . . . . . . . . . . . . . . . . 113 931 Instituciones financieras no monetarias . . . . . . . . . .
Sociedades no financieras . . . . . . . . . . . . . . . .
AF.6 RESERVAS TÉCNICAS DE SEGURO . . . . . . . . . .
AF.7 OTRAS CUENTAS PENDIENTES DE PAGO . . . . . . .
TOTAL PASIVOS DE LOS SECTORES RESIDENTES. . . . . . 364 196 119 550 50 283 113 931 218 539 211 918 224 068 3 494 28 545 5 300
2011 Q4 data
2. Liabilities of domestic sectors (financial assets of other euro area residents and the rest of the world)
BANCO DE ESPAÑA 324 BOLETÍN ESTADÍSTICO, FEBRUARY 2013

International Investment Position
Financial accounts
11 12 13 14 15 16 17 18=1 a 17 19 20=19-18
___________________________________________________________________________________________________________________________
2. Pasivos de los sectores residentes (activos financieros de otros residentes en la zona del euro y en el resto del mundo)
Millones de euros
Inversiones del exterior en España/Foreign investment in Spain Otras inversiones/Other investment Total Posición de Cuentas Derivados Inversión financieras/ Discrepancia/ Préstamos/Loans Depósitos/Deposits Otros pasivos/Other liabilities financieros/ Internacional/ Financial Discrepancy Financial Total accounts derivatives International Investment Administra- Otros Instituciones Instituciones Administra- Otros Position ciones sectores financieras financieras ciones sectores Públicas/ residentes/ monetarias/ monetarias/ Públicas/ residentes/ General Other Monetary Monetary General Other government resident financial financial government resident sectors institutions institutions sectors
-14 180 -14 180 AF.1 MONETARY GOLD AND SDRs
11 969 11 969 AF.22 TRANSFERABLE DEPOSITS 11 969 11 969 Monetary financial institutions
668 647 7 451 676 097 630 425 -45 673 AF.29 OTHER DEPOSITS
668 647 668 647 630 425 -38 222 Monetary financial institutions 7 451 7 451 -7 451 Other resident sector Non-monetary financial institutions
37 339 36 201 -1 138 AF.331 SECURITIES OTHER THAN SHARES. SHORT-TERM
3 494 1 804 -1 690 Monetary financial institutions 28 545 34 211 5 666 General Government 5 300 186 -5 114 Other resident sector 186 Non-monetary financial institutions
... Non-financial corporations
654 525 630 166 -24 360 AF.332 SECURITIES OTHER THAN SHARES. LONG-TERM
218 539 202 539 -16 000 Monetary financial institutions 211 918 210 545 -1 374 General Government 224 068 217 082 -6 986 Other resident sector 215 725 Non-monetary financial institutions
1 357 Non-financial corporations
134 415 134 415 22 336 -112 080 AF.34 FINANCIAL DERIVATIVES
34 982 177 288 184 332 004 389 033 57 029 AF.4 LOANS
34 982 184 35 166 34 600 -566 General Government 177 288 296 838 354 433 57 595 Other resident sector 2 706 Non-monetary financial institutions
349 024 Non-financial corporations
2 703 Households and non-profit institutions
528 410 528 944 534 AF.5 SHARES AND OTHER EQUITY
70 072 Monetary financial institutions 458 871 Other resident sector 11 651 Non-monetary financial institutions
447 221 Non-financial corporations
4 630 4 630 AF.6 INSURANCE TECHNICAL RESERVES
50 549 50 549 AF.7 OTHER ACCOUNTS RECEIVABLE
34 982 177 288 668 647 184 7 451 134 415 2 362 791 2 290 071 -72 720 LIABILITIES OF DOMESTIC SECTORS. TOTAL
EUR millions
17. BALANCE OF PAYMENTS AND INTERNATIONAL INVESTMENT POSITION 17.C Reconciliation between financial assets and liabilities vis-à-vis other euro area residents and the rest of the world and the International Investment Position
BANCO DE ESPAÑA 325 BOLETÍN ESTADÍSTICO, FEBRUARY 2013

1=2+13 9+12 3=4-5 4 5 6=7-8 7 8 9=10-11 10 11 12 14 to 16 14 15 16
17. BALANCE OF PAYMENTS AND INTERNATIONAL INVESTMENT POSITION 17.21 SummaryB) International investment position
See notes at the end of the chapter
End-of-period positions EUR billions Total, excluding Banco de España Banco de España
Net interna- tional Net Direct investment Portfolio investment (a) Other investment Financial Banco Net invest- position derivat- de Claims Other ment excluding ives España with net position Banco de Net Spanish Foreign Net Spanish Foreign Net Spanish Foreign Net Net Reserves the assets (assets- España position invest- invest- position invest- invest- position invest- invest- position position Euro- (assets- liabil.) (assets - (assets- ment ment in (assets- ment ment in (assets- ment ment in (assets- (assets- system liabil.) liabil.) liabil.) abroad Spain liabil.) abroad Spain liabil.) abroad Spain liabil.) liabil.) (assets) (liabil.) (assets) (liabil.) (assets) (liabil.) (b) 2=3+6+ 13=
04 -436.4 -504.5 -91.9 207.2 299.1 -203.2 359.3 562.5 -209.4 222.2 431.6 ... 68.1 14.5 31.9 21.7 05 -505.5 -577.2 -67.1 258.9 326.0 -273.6 454.7 728.4 -236.5 268.2 504.7 ... 71.7 14.6 17.1 40.1 06 -648.2 -743.9 -19.3 331.1 350.4 -508.9 455.7 964.6 -206.1 324.9 530.9 -9.6 95.7 14.7 29.4 51.6 07 -822.8 -901.7 -2.6 395.4 398.0 -648.5 438.4 1 086.9 -231.8 379.5 611.3 -18.8 78.9 12.9 1.1 64.9
08 Q3 -861.3 -918.4 1.7 422.6 420.9 -633.6 380.5 1 014.1 -274.8 423.1 697.9 -11.7 57.0 13.8 -19.6 62.8 Q4 -863.1 -914.0 1.3 424.4 423.2 -603.7 354.2 958.0 -305.1 386.6 691.8 -6.4 50.9 14.5 -30.6 67.0
09 Q1 -883.2 -935.4 3.3 415.8 412.5 -601.9 337.0 938.8 -336.9 374.6 711.6 0.0 52.3 15.7 -27.4 64.0 Q2 -939.2 -984.6 -16.5 425.4 441.9 -619.5 357.9 977.4 -341.4 370.4 711.8 -7.3 45.4 15.1 -30.5 60.7 Q3 -973.2 -1 010.1 -14.7 430.7 445.4 -663.2 371.4 1 034.6 -327.3 364.4 691.7 -4.9 36.9 18.3 -42.6 61.2 Q4 -982.2 -1 026.3 -4.5 434.4 438.9 -693.7 374.3 1 068.1 -327.1 369.6 696.8 -1.0 44.1 19.6 -36.4 60.9
10 Q1 -971.9 -1 014.3 -7.0 442.0 449.0 -667.9 380.6 1 048.4 -345.2 362.4 707.5 5.7 42.4 20.9 -38.5 60.0 Q2 -920.5 -897.1 11.4 461.7 450.3 -604.0 352.9 956.9 -316.5 370.9 687.5 12.0 -23.4 24.4 -100.8 53.1 Q3 -977.5 -997.7 14.0 469.7 455.6 -661.9 334.3 996.1 -354.1 354.3 708.4 4.3 20.2 22.6 -54.3 51.9 Q4 -932.0 -962.3 18.1 488.8 470.7 -637.0 312.2 949.2 -346.1 372.8 718.9 2.7 30.3 23.9 -46.1 52.5
11 Q1 -970.5 -1 009.9 6.5 485.1 478.6 -672.4 302.2 974.6 -342.5 379.1 721.6 -1.5 39.5 23.2 -35.2 51.5 Q2 -982.1 -1 014.2 14.7 486.8 472.1 -648.8 293.2 942.0 -379.8 382.5 762.2 -0.3 32.2 23.5 -40.6 49.3 Q3 -979.3 -974.2 9.8 480.1 470.3 -622.3 273.5 895.7 -369.3 387.8 757.0 7.6 -5.2 27.6 -83.8 51.1 Q4 -976.6 -895.6 12.7 496.5 483.7 -599.4 256.7 856.1 -314.8 398.3 713.2 5.9 -81.0 36.4 -170.2 52.8
12 Q1 -967.4 -782.5 13.8 495.8 481.9 -541.4 270.9 812.3 -257.9 416.7 674.6 2.9 -184.8 36.0 -271.2 50.5 Q2 -957.6 -642.7 9.6 494.8 485.2 -460.4 255.6 715.9 -196.6 444.8 641.4 4.6 -314.9 41.4 -403.6 47.3 Q3 -955.7 -646.4 13.3 498.1 484.9 -485.7 254.8 740.5 -176.7 423.1 599.9 2.8 -309.3 40.2 -395.4 45.9
15+16 2=3+4 3 4 5=6to8 6 7 8 9 11to13 11 12 13 14 15 16
17. BALANCE OF PAYMENTS AND INTERNATIONAL INVESTMENT POSITION 17.22 Spanish investment abroadB) International investment position
See notes at the end of the chapter
End-of-period positions EUR billions Direct investment Portfolio investment, including Banco de España Other investment, including Banco de España Finan- cial deriv-
Total Inter- Total, excluding Banco de España (a) Banco Total, excluding Banco de España Banco atives Reserves Total Equity company de de debt España España transaction Total Shares Bonds Money Total Loans Deposits Other and and market assets
1=2+5+9+ mutual notes instru- 10+14+ funds ments 10=
04 856.9 207.2 189.6 17.6 359.3 78.1 271.4 9.9 20.8 222.2 38.6 175.8 7.8 32.8 - 14.5 05 1 053.7 258.9 236.8 22.1 454.7 104.2 338.3 12.3 37.9 268.2 46.1 212.8 9.3 19.4 - 14.6 06 1 240.6 331.1 307.9 23.2 455.7 133.2 311.9 10.5 50.5 324.9 63.4 249.7 11.8 30.8 33.0 14.7 07 1 340.4 395.4 368.3 27.1 438.4 133.0 298.6 6.8 64.3 379.5 69.0 294.0 16.5 5.2 44.6 12.9
08 Q3 1 377.6 422.6 391.9 30.7 380.5 82.7 286.4 11.4 62.7 423.1 70.3 334.1 18.7 4.8 70.1 13.8 Q4 1 359.1 424.4 393.4 31.0 354.2 63.1 280.1 11.0 66.2 386.6 74.1 292.6 20.0 4.8 108.3 14.5
09 Q1 1 323.7 415.8 383.8 32.0 337.0 52.3 270.3 14.4 63.5 374.6 71.6 283.7 19.3 5.5 111.7 15.7 Q2 1 327.4 425.4 389.7 35.7 357.9 60.0 278.8 19.1 60.3 370.4 75.1 275.7 19.7 5.4 92.9 15.1 Q3 1 336.1 430.7 397.7 33.1 371.4 71.2 284.3 15.9 60.7 364.4 74.5 270.8 19.0 5.5 85.2 18.3 Q4 1 341.5 434.4 404.2 30.2 374.3 78.6 285.2 10.6 60.6 369.6 76.4 274.2 19.1 5.4 77.4 19.6
10 Q1 1 365.0 442.0 410.9 31.1 380.6 89.3 280.8 10.5 59.8 362.4 76.3 267.2 18.9 5.4 93.9 20.9 Q2 1 386.5 461.7 428.4 33.3 352.9 87.3 253.5 12.0 52.9 370.9 79.3 272.7 18.9 5.4 118.3 24.4 Q3 1 359.2 469.7 432.3 37.4 334.3 88.7 238.1 7.5 51.5 354.3 79.1 256.8 18.3 5.4 121.4 22.6 Q4 1 350.6 488.8 450.0 38.8 312.2 92.4 214.4 5.4 52.2 372.8 83.5 269.4 19.9 5.6 95.1 23.9
11 Q1 1 327.2 485.1 446.7 38.4 302.2 92.8 202.1 7.3 51.3 379.1 79.0 281.3 18.9 5.6 80.7 23.2 Q2 1 324.0 486.8 447.7 39.1 293.2 91.9 195.1 6.2 48.8 382.5 82.8 281.0 18.7 5.6 83.7 23.5 Q3 1 359.9 480.1 435.1 45.0 273.5 78.3 189.3 5.9 50.7 387.8 85.1 282.8 19.9 5.6 134.8 27.6 Q4 1 386.2 496.5 446.5 49.9 256.7 77.7 174.7 4.2 52.4 398.3 92.9 284.1 21.3 5.7 140.2 36.4
12 Q1 1 408.2 495.8 447.0 48.8 270.9 84.3 182.8 3.7 49.9 416.7 92.5 303.3 21.0 5.7 133.2 36.0 Q2 1 442.2 494.8 441.6 53.1 255.6 82.2 170.1 3.3 46.7 444.8 111.3 311.7 21.9 5.7 153.3 41.4 Q3 1 424.4 498.1 444.9 53.2 254.8 86.4 162.9 5.4 45.2 423.1 97.3 301.8 24.0 5.7 157.2 40.2
BANCO DE ESPAÑA 326 BOLETÍN ESTADÍSTICO, FEBRUARY 2013

1=2 to 5 2 3 4 5 6=7 to 10 7 8 9 10 11=12 to 15 12 13 14 15
17. BALANCE OF PAYMENTS AND INTERNATIONAL INVESTMENT POSITION 17.23 Spanish investment abroadB) International investment position Portfolio investment, including Banco de España
Breakdown by institutional sector
See notes at the end of the chapter
End-of-period data EUR millions
Shares and mutual funds Bonds and notes Money market instruments Banco Other General Other Banco Other General Other Banco Other General Other
Total de monetary govern- resident Total de monetary govern- resident Total de monetary bovern- resident España financial ment sectors España financial ment sectors España financial ment sectors institutions institutions institutions
04 78 053 - 5 507 - 72 546 290 133 18 761 95 227 895 175 251 11 934 2 053 6 421 - 3 460 05 104 156 - 7 729 - 96 428 369 336 31 086 135 717 5 653 196 880 19 136 6 808 7 645 - 4 683 06 133 193 - 11 594 - 121 599 357 939 45 991 83 707 15 981 212 260 15 063 4 518 2 809 7 7 728 07 132 954 - 15 425 - 117 530 355 065 56 448 84 238 22 003 192 376 14 693 7 848 2 728 - 4 118
08 Q3 82 732 - 12 938 - 69 794 345 963 59 566 88 488 25 292 172 617 14 560 3 144 2 837 - 8 579 Q4 63 146 - 11 114 - 52 032 343 914 63 858 83 804 26 225 170 026 13 315 2 309 2 231 - 8 775
09 Q1 52 268 - 7 618 - 44 649 333 559 63 259 85 990 19 368 164 943 14 667 281 5 160 0 9 226 Q2 59 963 - 7 894 - 52 069 338 630 59 814 90 750 17 736 170 330 19 557 480 8 334 0 10 743 Q3 71 192 - 8 542 - 62 650 344 490 60 141 95 490 14 744 174 116 16 389 532 8 076 0 7 780 Q4 78 591 - 8 834 - 69 756 345 388 60 233 93 325 14 113 177 717 10 952 366 5 562 0 5 024
10 Q1 89 281 - 9 542 - 79 739 340 209 59 455 90 220 13 373 177 161 10 888 366 5 052 0 5 470 Q2 87 320 - 7 413 - 79 907 306 373 52 883 77 324 10 046 166 121 12 047 - 3 932 0 8 115 Q3 88 694 - 8 229 - 80 465 289 553 51 456 70 526 9 000 158 571 7 476 - 3 559 0 3 917 Q4 92 373 - 6 552 - 85 821 266 476 52 076 62 756 8 421 143 223 5 518 97 2 429 0 2 992
11 Q1 92 824 - 6 357 - 86 468 252 797 50 699 63 984 8 212 129 903 7 899 588 3 959 0 3 351 Q2 91 874 - 5 177 - 86 697 242 927 47 836 65 931 8 068 121 091 7 214 994 3 693 - 2 527 Q3 78 257 - 3 880 - 74 377 239 362 50 104 65 927 7 835 115 497 6 524 589 2 812 - 3 123 Q4 77 741 - 4 275 - 73 467 226 653 51 920 59 120 7 688 107 925 4 654 468 1 747 19 2 419
12 Q1 84 338 - 5 132 - 79 206 232 724 49 878 67 021 7 444 108 382 3 703 - 1 970 - 1 734 Q2 82 246 - 4 235 - 78 011 216 719 46 665 62 699 6 780 100 576 3 252 - 1 091 - 2 161 Q3 86 409 - 4 288 - 82 121 208 149 45 242 58 796 4 625 99 485 5 445 - 3 980 7 1 459
1=2 to 4 2 3 4 5=6 to 8 6 7 8 9 10
17. BALANCE OF PAYMENTS AND INTERNATIONAL INVESTMENT POSITION 17.24 Spanish investment abroadB) International investment position Other investment, including Banco de España
Breakdown by institutional sector End-of-period data EUR millions
Loans Deposits Other financial assets Monetary General Other Banco Other Other of which:
Total financial Government resident Total de monetary resident institutions sectors España financial sectors Total Other institutions resident sectors
04 38 554 27 451 9 222 1 881 208 164 32 350 92 422 83 392 8 274 5 220 05 46 070 34 787 9 522 1 760 231 716 18 918 123 621 89 176 9 766 6 511 06 63 394 52 777 8 798 1 819 280 018 30 333 154 144 95 541 12 210 7 156 07 68 954 58 030 8 917 2 006 298 836 4 793 194 931 99 112 16 924 9 806
08 Q3 70 340 61 775 5 993 2 572 338 430 4 352 228 558 105 520 19 119 11 040 Q4 74 084 61 742 9 440 2 903 296 908 4 352 189 955 102 601 20 422 11 736
09 Q1 71 613 62 386 6 457 2 770 288 499 4 787 181 457 102 256 19 947 10 719 Q2 75 078 63 900 7 013 4 164 280 453 4 786 174 853 100 814 20 359 10 659 Q3 74 540 64 888 6 183 3 469 275 610 4 790 167 706 103 114 19 706 10 090 Q4 76 379 62 768 10 295 3 316 278 989 4 786 171 638 102 565 19 724 9 995
10 Q1 76 281 66 152 6 784 3 345 271 937 4 785 164 140 103 011 19 590 9 221 Q2 79 320 66 411 9 494 3 415 277 513 4 785 167 849 104 879 19 556 9 767 Q3 79 087 66 523 9 134 3 429 261 609 4 786 151 476 105 347 19 009 9 149 Q4 83 505 66 519 13 373 3 612 274 230 4 786 160 101 109 343 20 656 9 371
11 Q1 79 020 63 317 12 326 3 377 286 038 4 786 168 387 112 866 19 675 9 185 Q2 82 767 66 339 13 187 3 241 285 787 4 786 165 713 115 287 19 499 8 892 Q3 85 062 67 833 13 913 3 316 287 586 4 786 161 146 121 653 20 722 9 343 Q4 92 876 69 652 19 810 3 414 288 934 4 787 161 212 122 935 22 261 9 213
12 Q1 92 460 68 470 20 798 3 193 308 067 4 786 179 600 123 680 21 921 9 360 Q2 111 255 81 225 26 753 3 277 316 448 4 786 181 842 129 821 22 827 9 708 Q3 97 253 67 269 26 662 3 321 306 613 4 785 167 781 134 047 24 981 9 518
BANCO DE ESPAÑA 327 BOLETÍN ESTADÍSTICO, FEBRUARY 2013

1 2 3 4 5 6 7 8 9 10 11 12
17. BALANCE OF PAYMENTS AND INTERNATIONAL INVESTMENT POSITION 17.25 Spanish investment abroad.B) International investment position International reserves and
foreign currency liquidity
See notes at the end of the chapter
End-of-month positions EUR millions
Official reserve assets and other foreign currency assets Net drains on foreign currency assets (a) Approximate market value (operations with residual maturity up to one year)
Nominal value Banco de España Central government Banco de España Central government
Total Total Reserve Other Foreign Total assets foreign currency Total Predeter- Contingent Total Predeter- Contingent currency assets mined drains liabilities mined drains liabilities (b) assets
08 24 743 24 743 14 546 10 197 - -9 698 -8 320 -8 320 - -1 378 -1 378 - 09 19 657 19 657 19 578 79 - -2 801 -2 708 -2 708 - -93 -87 -6 10 23 875 23 875 23 905 -30 - -2 927 -2 919 -2 919 - -8 - -8 11 40 536 40 536 36 402 4 134 - -4 611 -4 253 -4 253 - -358 - -358
11 Jul 25 954 25 954 25 955 -1 - -329 -1 -1 - -328 - -328 Aug 27 003 27 003 27 004 -1 - -329 -1 -1 - -328 - -328 Sep 27 563 27 563 27 566 -3 - 1 504 1 1 - 1 503 1 851 -349 Oct 28 194 28 194 28 197 -2 - 25 356 356 - -331 - -331 Nov 33 157 33 157 33 157 0 - 0 348 348 - -348 - -348 Dec 40 536 40 536 36 402 4 134 - -4 611 -4 253 -4 253 - -358 - -358
12 Jan 41 225 41 225 37 017 4 209 - -4 602 -4 245 -4 245 - -356 - -356 Feb 40 864 40 864 36 582 4 282 - -4 493 -4 161 -4 161 - -332 - -332 Mar 37 349 37 349 35 977 1 372 - -1 301 -974 -974 - -326 - -326 Apr 36 865 36 865 36 540 325 - -633 -296 -296 - -338 - -338 May 38 710 38 710 38 440 270 - -488 -122 -122 - -366 - -366 Jun 44 195 44 195 41 430 2 765 - -2 419 -2 419 -2 419 - - - - Jul 48 141 48 141 40 879 7 262 - -5 238 -5 238 -5 238 - - - - Aug 47 465 47 465 40 184 7 281 - -4 921 -4 921 -4 921 - - - - Sep 44 095 44 095 40 193 3 902 - -1 588 -1 588 -1 588 - - - - Oct 44 712 44 712 39 492 5 220 - -2 867 -2 867 -2 867 - - - - Nov 44 173 44 173 39 463 4 710 - -2 312 -2 312 -2 312 - - - - Dec 41 053 41 053 38 347 2 706 - -304 -304 -304 - - - -
13 Jan 40 822 40 822 38 177 2 645 - -1 034 -1 034 -1 034 - - - -
1=2+5to8 2=3+4 3 4 5 6 7 8 9 10= 11= 12 13 14 15= 16 17 18
17. BALANCE OF PAYMENTS AND INTERNATIONAL INVESTMENT POSITION 17.26 Spanish investmest abroadB) International investment position International reserves
See notes at the end of the chapter
End-of-month positions
Reserve assets Memorandum item
Millions of euro Millions of SDRs Convertible currencies Reserve position in the IMF SDR holdings Reserve Finan- Monetary Other
Total position Monet- cial gold Reserve tranche Acquisi- receiv- in the SDRs ary deriva in Arrange- Alloc- tions ables Total Securities Deposits IMF gold tives million Total ments Total ated (+) from of troy Domestic to uses the ounces Total Quota currency borrow (-) IMF in IMF 11+14 12-13 16+17
08 14 546 8 292 7 951 340 467 160 5 627 - 9.05 422 422 3 049 2 627 - 145 352 -207 222 09 19 578 8 876 8 379 497 541 3 222 6 938 - 9.05 497 497 3 049 2 552 - 2 960 2 828 133 329 10 23 905 9 958 9 424 534 995 3 396 9 555 - 9.05 860 599 3 049 2 450 261 2 935 2 828 107 341 11 36 402 19 972 19 474 498 2 251 3 163 11 017 - 9.05 1 896 1 197 4 023 2 826 699 2 665 2 828 -163 332
11 Sep 27 566 11 619 10 986 632 1 953 3 072 10 922 - 9.05 1 688 1 137 4 023 2 886 551 2 656 2 828 -171 339 Oct 28 197 12 124 11 585 539 1 913 3 010 11 150 - 9.05 1 688 1 137 4 023 2 886 551 2 657 2 828 -170 339 Nov 33 157 16 393 15 879 514 1 952 3 072 11 740 - 9.05 1 688 1 137 4 023 2 886 551 2 656 2 828 -171 340 Dec 36 402 19 972 19 474 498 2 251 3 163 11 017 - 9.05 1 896 1 197 4 023 2 826 699 2 665 2 828 -163 332
12 Jan 37 017 19 620 19 091 529 2 233 3 139 12 025 - 9.05 1 896 1 197 4 023 2 826 699 2 667 2 828 -161 331 Feb 36 582 19 242 18 649 593 2 305 3 087 11 949 - 9.05 1 991 1 237 4 023 2 786 754 2 667 2 828 -161 331 Mar 35 977 19 312 18 791 521 2 312 3 095 11 258 - 9.05 1 991 1 237 4 023 2 786 754 2 667 2 828 -161 331 Apr 36 540 19 708 19 205 503 2 402 3 130 11 300 - 9.05 2 047 1 281 4 023 2 742 766 2 667 2 828 -160 331 May 38 440 21 308 20 741 567 2 492 3 248 11 392 - 9.05 2 047 1 281 4 023 2 742 765 2 667 2 828 -160 331 Jun 41 430 24 409 23 877 532 2 508 3 226 11 287 - 9.05 2 080 1 301 4 023 2 723 779 2 676 2 828 -152 323 Jul 40 879 23 071 22 108 963 2 560 3 287 11 961 - 9.05 2 085 1 301 4 023 2 723 784 2 677 2 828 -150 322 Aug 40 184 22 459 21 895 564 2 619 3 232 11 875 - 9.05 2 170 1 387 4 023 2 637 784 2 678 2 828 -150 322 Sep 40 193 21 948 21 405 543 2 583 3 195 12 471 -3 9.05 2 164 1 371 4 023 2 653 794 2 678 2 828 -150 322 Oct 39 492 21 820 20 979 841 2 491 3 175 12 002 4 9.05 2 100 1 307 4 023 2 717 794 2 678 2 828 -150 322 Nov 39 463 21 791 21 323 467 2 479 3 166 12 011 16 9.05 2 098 1 307 4 023 2 717 791 2 678 2 828 -149 322 Dec 38 347 21 349 20 848 501 2 412 3 132 11 418 35 9.05 2 069 1 267 4 023 2 757 802 2 687 2 828 -141 314
13 Jan 38 177 21 548 21 074 474 2 411 3 057 11 109 51 9.05 2 120 1 284 4 023 2 740 836 2 688 2 828 -140 313
BANCO DE ESPAÑA 328 BOLETÍN ESTADÍSTICO, FEBRUARY 2013

13+14 2=3+4 3 4 5=6 to 8 6 7 8 9=10 to 12 10 11 12 13 14
17. BALANCE OF PAYMENTS AND INTERNATIONAL INVESTMENT POSITION 17.27 Foreign investment in SpainB) International investment position
See notes at the end of the chapter
End-of-period positions EUR millions Direct investment Portfolio investment (a) Other investment, including Banco de España
Total Financial derivatives Shares Inter- Money Total, excluding Banco de España and company Shares and Bonds and market Banco Total other debt Total mutual notes instru- de equity transactions funds ments Total Loans Deposits Other España liabili-
1=2+5+9+ ties (b)
04 1 293 290 299 150 231 649 67 501 562 490 183 210 372 159 7 120 431 635 103 662 326 316 1 657 16 - 05 1 559 176 325 963 250 641 75 322 728 382 197 347 524 209 6 826 504 705 119 729 383 453 1 524 126 - 06 1 888 798 350 438 271 313 79 125 964 580 245 683 703 023 15 874 530 930 149 128 380 546 1 257 281 42 569 07 2 163 230 397 974 307 278 90 696 1 086 940 282 331 778 008 26 601 611 279 167 701 441 691 1 888 3 550 63 487
08 Q3 2 238 983 420 907 323 994 96 913 1 014 111 200 218 764 809 49 084 697 932 181 896 512 829 3 207 24 276 81 757 Q4 2 222 121 423 152 320 664 102 489 957 955 170 143 749 779 38 033 691 754 182 431 504 878 4 445 35 233 114 027
09 Q1 2 206 886 412 496 309 053 103 443 938 810 142 042 745 696 51 071 711 552 186 496 520 142 4 914 32 491 111 538 Q2 2 266 685 441 873 321 139 120 734 977 371 177 535 745 542 54 294 711 813 187 676 520 054 4 083 35 596 100 032 Q3 2 309 314 445 378 327 808 117 569 1 034 641 218 231 757 938 58 472 691 659 188 791 498 795 4 073 47 538 90 098 Q4 2 323 607 438 877 327 215 111 662 1 068 050 222 619 767 989 77 441 696 782 185 287 507 666 3 829 41 400 78 498
10 Q1 2 336 879 448 961 329 495 119 466 1 048 410 198 588 766 527 83 295 707 549 186 207 516 890 4 453 43 673 88 286 Q2 2 307 003 450 251 330 794 119 457 956 862 169 657 722 635 64 569 687 488 191 377 490 477 5 634 105 881 106 522 Q3 2 336 671 455 616 334 435 121 181 996 127 194 290 737 442 64 395 708 401 198 223 504 282 5 896 59 477 117 049 Q4 2 282 587 470 668 346 360 124 308 949 219 181 491 709 260 58 468 718 918 201 740 511 662 5 515 51 323 92 459
11 Q1 2 297 661 478 591 356 795 121 796 974 615 204 976 709 399 60 240 721 619 202 032 514 314 5 273 40 665 82 170 Q2 2 306 128 472 102 355 071 117 030 942 033 194 526 690 867 56 640 762 221 203 529 553 302 5 390 45 732 84 040 Q3 2 339 261 470 257 356 366 113 891 895 749 159 665 685 801 50 283 757 045 210 944 538 479 7 622 89 019 127 191 Q4 2 362 791 483 746 364 196 119 550 856 078 164 215 654 525 37 339 713 191 212 270 493 287 7 634 175 360 134 415
12 Q1 2 375 560 481 946 363 117 118 829 812 312 159 815 616 894 35 603 674 596 219 449 447 078 8 069 276 496 130 209 Q2 2 399 855 485 211 369 632 115 579 715 916 146 541 544 573 24 802 641 356 224 242 408 926 8 189 408 695 148 677 Q3 2 380 040 484 855 374 085 110 771 740 503 165 906 547 682 26 915 599 852 222 696 368 414 8 742 400 455 154 374
1=2+3 2 3 4=5 to 7 5 6 7 8=9 to 11 9 10 11
17. BALANCE OF PAYMENTS AND INTERNATIONAL INVESTMENT POSITION 17.28 Foreign investment in SpainB) International investment position Portfolio investment.
Breakdown by institutional sector
See notes at the end of the chapter
End-of-period positions EUR millions
Shares and mutual funds Bonds and notes Money market instruments Monetary Other General Monetary Other General Monetary Other
Total financial resident Total government financial resident Total government financial resident institutions sectors institutions sectors institutions sectors
04 183 210 65 571 117 640 372 159 181 878 104 720 85 561 7 120 2 776 301 4 043 05 197 347 74 882 122 465 524 209 192 798 164 457 166 954 6 826 2 465 981 3 380 06 245 683 95 784 149 899 703 023 191 871 236 038 275 114 15 874 4 836 6 252 4 786 07 282 331 95 561 186 769 778 008 173 266 261 177 343 564 26 601 4 653 21 248 701
08 Q3 200 218 68 479 131 739 764 809 187 624 258 393 318 792 49 084 9 722 21 269 18 093 Q4 170 143 53 871 116 272 749 779 198 366 249 209 302 204 38 033 12 480 12 224 13 329
09 Q1 142 042 41 387 100 656 745 696 204 677 248 803 292 216 51 071 15 801 15 149 20 122 Q2 177 535 66 664 110 872 745 542 211 224 251 975 282 343 54 294 21 125 14 200 18 969 Q3 218 231 90 700 127 531 757 938 219 260 257 026 281 652 58 472 31 005 14 217 13 249 Q4 222 619 94 782 127 838 767 989 229 085 260 304 278 601 77 441 44 479 14 903 18 059
10 Q1 198 588 79 583 119 001 766 527 238 846 256 338 271 344 83 295 51 896 16 641 14 758 Q2 169 657 68 428 101 218 722 635 224 769 239 162 258 705 64 569 39 698 12 157 12 714 Q3 194 290 74 341 119 949 737 442 234 437 242 943 260 062 64 395 39 437 10 926 14 032 Q4 181 491 62 916 118 573 709 260 220 521 238 061 250 678 58 468 36 629 9 910 11 929
11 Q1 204 976 69 602 135 374 709 399 221 838 239 222 248 339 60 240 37 875 10 640 11 724 Q2 194 526 67 295 127 231 690 867 215 762 234 487 240 618 56 640 37 245 7 554 11 840 Q3 159 665 51 853 107 811 685 801 222 641 227 294 235 866 50 283 36 605 6 211 7 466 Q4 164 215 50 283 113 931 654 525 211 918 218 539 224 068 37 339 28 545 3 494 5 300
12 Q1 159 815 49 869 109 945 616 894 192 006 205 088 219 800 35 603 23 731 3 341 8 530 Q2 146 541 43 481 103 059 544 573 175 944 178 630 189 999 24 802 16 369 2 749 5 684 Q3 165 906 51 553 114 350 547 682 187 980 171 721 187 981 26 915 20 961 1 677 4 276
BANCO DE ESPAÑA 329 BOLETÍN ESTADÍSTICO, FEBRUARY 2013

1=2+3 2 3 4=5+6 5 6 7 8
17. BALANCE OF PAYMENTS AND INTERNATIONAL INVESTMENT POSITION 17.29 Foreign investment in Spain.B) International investment position Other investment, including Banco de España.
Breakdown by institutional sector End-of-period positions EUR millions
Loans Deposits Other liabilities Monetary financial institutions of which General Other
Total government resident Total Banco Other monetary Total Other sectors de financial resident España institutions (a) sectors
04 103 662 17 568 86 094 326 332 16 326 316 1 657 1 657 05 119 729 18 149 101 579 383 579 126 383 453 1 524 1 524 06 149 128 18 878 130 251 380 826 281 380 546 1 257 1 257 07 167 701 19 916 147 785 445 241 3 550 441 691 1 888 1 888
08 Q3 181 896 20 401 161 495 537 106 24 276 512 829 3 207 3 207 Q4 182 431 22 909 159 522 540 111 35 233 504 878 4 445 4 445
09 Q1 186 496 23 155 163 341 552 633 32 491 520 142 4 914 4 914 Q2 187 676 24 803 162 873 555 650 35 596 520 054 4 083 4 083 Q3 188 791 26 068 162 723 546 333 47 538 498 795 4 073 4 073 Q4 185 287 26 207 159 081 549 066 41 400 507 666 3 829 3 829
10 Q1 186 207 26 754 159 453 560 562 43 673 516 890 4 453 4 453 Q2 191 377 28 504 162 873 596 358 105 881 490 477 5 634 5 634 Q3 198 223 29 963 168 260 563 760 59 477 504 282 5 896 5 896 Q4 201 740 32 197 169 543 562 985 51 323 511 662 5 515 5 515
11 Q1 202 032 32 259 169 774 554 979 40 665 514 314 5 273 5 209 Q2 203 529 33 007 170 522 599 034 45 732 553 302 5 390 5 189 Q3 210 944 34 081 176 863 627 498 89 019 538 479 7 622 7 430 Q4 212 270 34 982 177 288 668 647 175 360 493 287 7 634 7 451
12 Q1 219 449 40 664 178 785 723 575 276 496 447 078 8 069 7 893 Q2 224 242 46 167 178 075 817 620 408 695 408 926 8 189 8 022 Q3 222 696 46 532 176 164 768 869 400 455 368 414 8 742 8 584
1=2+7 2=3to6 3 4 5 6 15-16 8 9 10=11to14 11 12 13 14 15 16
17. BALANCE OF PAYMENTS AND INTERNATIONAL INVESTMENT POSITION 17.30 Foreign investment in Spain. Other investmentB) International investment position Loans received by General government and Other
resident sectors. Breakdown by borrower End-of-period positions EUR millions
General government Other resident sectors Central Insur- Portfolio Non-financial corporations Inter-
Total Regional Local govern- ance cor- investment company Total State govern- govern- ment Total porations institu- House- debt ment ment agencies and tions and Large Other Motor- Other holds transac- and pension securities Total public electric way con- compa- tions social funds dealer enter- utilities cession- nies (a) security companies prises aires funds 7=8to10+
04 103 662 17 568 5 304 10 399 1 269 597 86 094 79 2 884 178 830 52 13 715 944 164 118 861 96 560 05 119 729 18 149 3 261 12 369 1 916 604 101 579 101 3 582 205 191 100 12 596 672 191 823 927 108 223 06 149 128 18 878 3 254 12 679 2 520 424 130 251 86 4 179 243 178 73 11 067 779 231 259 1 175 118 702 07 167 701 19 916 2 473 14 125 3 046 272 147 785 70 5 915 282 597 73 12 939 842 268 744 1 778 142 576
See notes at the end of the chapter
08 Q3 181 896 20 401 1 778 15 282 2 956 385 161 495 796 3 266 307 828 71 15 131 1 044 291 582 2 308 152 704 Q4 182 431 22 909 3 383 16 186 2 945 395 159 522 867 2 365 314 652 71 15 800 1 099 297 682 2 366 160 727
09 Q1 186 496 23 155 1 867 17 400 3 482 405 163 341 811 2 511 321 035 69 16 812 1 166 302 989 2 134 163 152 Q2 187 676 24 803 2 366 18 637 3 400 400 162 873 811 2 245 337 236 69 17 002 1 256 318 910 2 167 179 587 Q3 188 791 26 068 2 047 20 149 3 472 400 162 723 931 2 398 337 603 63 18 763 1 250 317 527 2 196 180 406 Q4 185 287 26 207 1 872 20 453 3 513 368 159 081 1 161 2 020 331 333 63 18 271 955 312 044 2 212 177 645
10 Q1 186 207 26 754 1 407 21 961 2 955 432 159 453 979 2 493 339 171 61 19 163 960 318 987 2 242 185 432 Q2 191 377 28 504 1 485 23 603 2 988 427 162 873 981 2 565 343 463 61 19 015 1 150 323 237 2 266 186 402 Q3 198 223 29 963 2 306 24 255 2 979 424 168 260 967 2 818 345 085 55 17 162 1 150 326 719 2 323 182 933 Q4 201 740 32 197 2 838 25 873 3 008 478 169 543 1 487 2 760 348 218 55 15 331 928 331 905 2 323 185 246
11 Q1 202 032 32 259 2 823 25 921 3 013 502 169 774 1 082 2 196 347 942 53 14 161 1 521 332 207 2 363 183 809 Q2 203 529 33 007 3 218 26 363 2 929 497 170 522 836 2 266 348 089 53 13 745 997 333 294 2 408 183 078 Q3 210 944 34 081 3 668 27 001 2 921 490 176 863 837 1 831 354 272 47 13 631 1 250 339 345 2 427 182 504 Q4 212 270 34 982 4 224 27 464 2 829 466 177 288 832 1 920 354 362 47 13 519 949 339 847 2 126 181 951
12 Q1 219 449 40 664 9 076 28 194 2 935 458 178 785 800 2 013 355 615 47 13 484 1 021 341 062 2 153 181 795 Q2 224 242 46 167 14 819 28 013 2 858 476 178 075 801 2 000 352 351 47 12 383 1 182 338 740 2 198 179 275 Q3 222 696 46 532 15 358 27 863 2 844 467 176 164 803 2 440 349 421 47 12 646 954 335 775 2 225 178 726
BANCO DE ESPAÑA 330 BOLETÍN ESTADÍSTICO, FEBRUARY 2013

1=2+7-11 2=3 to 6 3 4 5 6 7=8 to 10 8 9 10 11
17 BALANCE OF PAYMENTS AND INTERNATIONAL INVESTMENT POSITION 17.31 Foreign investment in Spain. Other investment.B) International investment position Loans received by General government and Other
resident sectors. Breakdown by lender End-of-period positions EUR millions
Official lenders Other lenders Inter-
Total company Total General European Total Credit Non-finan- Households debt government Investment Eurofima Others institutions cial transactions Bank corporations (a)
04 103 662 22 338 191 20 422 1 378 348 177 884 90 259 87 511 114 96 560 05 119 729 26 131 312 23 809 1 668 341 201 821 105 541 96 131 150 108 223 06 149 128 29 298 474 26 622 1 868 333 238 533 127 690 110 620 223 118 702 07 167 701 31 944 929 28 927 1 806 282 278 333 146 563 131 586 184 142 576
See notes at the end of the chapter
08 Q3 181 896 33 787 420 31 243 1 856 268 300 813 152 227 148 400 186 152 704 Q4 182 431 38 184 2 025 33 734 2 176 249 304 974 149 513 155 267 194 160 727
09 Q1 186 496 37 946 557 34 971 2 176 242 311 701 154 081 157 395 225 163 152 Q2 187 676 39 921 1 055 36 482 2 175 209 327 342 153 869 173 181 291 179 587 Q3 188 791 41 481 786 38 314 2 175 206 327 716 153 843 173 582 291 180 406 Q4 185 287 42 794 610 39 533 2 463 187 320 139 150 747 169 094 297 177 645
10 Q1 186 207 43 434 192 40 644 2 463 135 328 204 152 383 175 498 322 185 432 Q2 191 377 45 891 270 42 965 2 462 195 331 887 154 277 177 282 329 186 402 Q3 198 223 47 551 1 011 43 905 2 445 190 333 604 155 010 178 262 332 182 933 Q4 201 740 49 956 1 056 46 337 2 388 175 337 030 156 534 180 146 351 185 246
11 Q1 202 032 51 199 1 088 47 553 2 388 170 334 643 156 224 178 064 355 183 809 Q2 203 529 52 122 1 525 48 027 2 388 183 334 485 156 078 178 046 361 183 078 Q3 210 944 53 732 2 025 49 091 2 388 228 339 716 159 343 179 984 389 182 504 Q4 212 270 55 585 2 586 50 339 2 388 273 338 636 160 980 177 249 407 181 951
12 Q1 219 449 62 261 7 516 52 076 2 388 280 338 984 160 085 178 515 384 181 795 Q2 224 242 68 388 13 299 52 426 2 388 275 335 129 158 669 175 923 537 179 275 Q3 222 696 69 986 13 873 53 421 2 388 304 331 436 156 708 174 185 543 178 726
BANCO DE ESPAÑA 331 BOLETÍN ESTADÍSTICO, FEBRUARY 2013

BANCO DE ESPAÑA / BOLETÍN ESTADÍSTICO
NOTES TO THE TABLES OF CHAPTER 17
Table 17.A
Source: Banco de España. Data compiled in accordance with the IMF Balance of Payments Manual (5th edition, 1993). a. Changes in assets and liabilities are both net of repayments. b. Mainly loans, deposits, sell/buy back transactions and repurchase agreements. c. A negative (positive) sign indicates an increase (decrease) in the Banco de Españ:a's claims on the rest of the world. Table 17.6
a. Patents, copyrights, trademarks, leases and other transferable contracts. Table 17.16
a. Includes transport support and ancillary services. b. Includes merchanting. c. Includes leases of means of transport without crew. Table 17.17
Note: The Spanish Balance of Payments services data continue to be calculated largely on the basis of the general system of information on external receipts and payments (see the annual publication "The Spanish Balance of Payments and the International Investment Position 2006", Chapter 5.2). Accordingly, the geographical breakdown may be distorted insofar as it reflects the countries involved in receipts and payments, which do not always coincide with the countries of residence of the parties providing or enjoying the service. European Union: International institutions of the European Union, European Central Bank, France, Belgium, Netherlands, Germany, Italy, United Kingdom, Ireland, Denmark, Greece, Portugal, Luxembourg, Austria, Finland, Sweden, Cyprus, Czech Republic, Estonia, Hungary, Lithuania, Latvia, Malta, Poland, Slovenia, Slovakia, Bulgaria and Romania and the corresponding dependencies of their economic territory. New EU Member States: Czech Republic, Hungary, Lithuania, Latvia, Poland, Bulgaria and Romania. Euro area: France, Belgium, Luxembourg, Netherlands, Germany, Italy, Ireland, Portugal, Austria, Finland, Greece, Slovenia, Malta, Cyprus, Slovakia, Estonia and European Central Bank. Rest of Europe: Countries not included in the European Union. Maghreb: Algeria, Morocco and Tunisia. Near and Middle East: Saudi Arabia, Armenia, Azerbaijan, Bahrain, United Arab Emirates, Georgia, Iran, Iraq, Israel, Jordan, Kuwait, Oman, Qatar, Lebanon, Palestinian Territory Occupied, Syrian Arab Republic and Yemen. Gulf countries: Saudi Arabia, Bahrain, United Arab Emirates, Iraq, Kuwait, Oman, Qatar and Yemen. OECD: International Institutions of the European Union, European Central Bank, France, Belgium, Netherlands, Germany, Italy, United Kingdom, Ireland, Denmark, Greece, Portugal, Luxembourg, Iceland, Norway, Sweden, Finland, Switzerland, Austria, Turkey, United States, Canada, Japan, Australia, New Zealand, Mexico, Czech Republic, Hungary, Poland, Republic of Korea and Slovakia, Israel, Slovenia, Chile, and Estonia and the corresponding dependencies of their economic territory. NAFTA: Canada, United States and Mexico. EFTA: Iceland, Liechtenstein, Norway and Switzerland. OPEC: Saudi Arabia, Algeria, United Arab Emirates, Iraq, Iran, Kuwait, Libya, Nigeria, Qatar, Angola, Ecuador and Venezuela. Newly industrialised countries (NICs): Singapore, Republic of Korea, Taiwan and Hong Kong. ASEAN: Brunei Darussalam, Cambodia, Indonesia, Philippines, Laos, Myanmar (Burma), Malaysia, Singapore, Thailand and Vietnam. Commonwealth of Independent States: Russia, Ukraine, Belarus, Moldova, Armenia, Azerbaijan, Kazakhstan, Turkmenistan, Uzbekistan, Tajikistan and Kyrgyzstan. Offshore financial centres: Andorra, Antigua and Barbuda, Anguilla, Netherlands Antilles, Barbados, Bahrain, Bermuda, Bahamas, Belize, Cook Islands, Dominica, Grenada, Guernsey, Gibraltar, Hong Kong, Isle of Man, Jersey, Jamaica, St. Kitts and Nevis, Cayman Islands, Lebanon, St. Lucia, Liechtenstein, Liberia, Marshall Islands, Montserrat, Maldives, Nauru, Niue, Panama, Philippines, Singapore, Turk and Caicos Islands, St. Vincent and the Grenadines, British Virgin Islands, American Virgin Islands, Vanuatu and Samoa. MERCOSUR: Argentina, Brazil, Paraguay and Uruguay. Latin America: Argentina, Bolivia, Brazil, Chile, Colombia, Costa Rica, Cuba, Ecuador, Guatemala, Honduras, Mexico, Nicaragua, Panama, Peru, Paraguay, El Salvador, Uruguay and Venezuela. Table 17.21
a. From December 2002, portfolio investment data have been calculated using a new information system (see Banco de España Circular 2/2001 and note on changes introduced in the economic indicators). The incorporation of the new data under the heading 'shares and mutual funds' of other resident sectors entails a very significant break in the time series, both in the financial assets and the liabilities, so that the series have been revised back to 1992. This methodological change introduced by the new system also affects the rest of the headings, to some extent, but does not justify a complete revision of the series.
BANCO DE ESPAÑA 332 BOLETÍN ESTADÍSTICO, FEBRUARY 2013

BANCO DE ESPAÑA / BOLETÍN ESTADÍSTICO
b. The counterpart entry of allocations of SDRs by the IMF is not included. These allocations (whose amounts, for Spain's case, may be deduced from table 17.26) have been recorded following the methodology laid down in the Fifth Edition of the IMF's Balance of Payments Manual, which is currently used for the compilation of the Balance of Payments (BP) and IIP statistics. The allocations of SDRs have therefore been recorded in the IIP as an increase in reserve assets, with no counterpart in any other caption, and they have not been recorded as transactions in the BP. The Sixth Edition of the above-mentioned Manual, which was recently completed and which countries will progressively adopt according to their national plans, establishes, on the contrary, that the allocations of SDRs will entail, in addition to increases in reserve assets, an increase in the long-term liabilities of the recipient country. Therefore, according to this Manual, the allocations of SDRs shall be recorded under reserve assets and, moreover, under other investment liabilities, whereby the country's net IIP will not be affected. Furthermore, both the change in reserve assets and in other investment liabilities shall be recorded as transactions in the BP. The IMF has decided to apply, in its publications, the new methodological standard for SDR allocations following the August and September 2009 allocation. Conversely, in order to adopt the new methodological criteria for accounting laid down in the Sixth Edition of the Manual, European Union countries must await the amendment of the Community and ECB regulations governing the co-ordinated compilation and dissemination of statistics. This amendment is expected to be made as from 2014, meaning that until that date the IMF data published on Spain will differ from those disseminated in national data. Table 17.22
Note: See footnote a to Table 17.21 Table 17.23
Note: See footnote a to Table 17.21. Table 17.25
a. A minus (plus) sign denotes a decrease (increase) in liquidity. b. The amounts in this column coincide with those in column 1 of Table 17.26. Table 17.26
Note: From January 1999 reserve assets do not include claims denominated in euro or claims on residents in euro area countries denominated in foreign currencies (these headings appear in Tables 7A, 7.5 and 7.11). The data in pesetas to December 1998 were translated into euro using the irrevocable exchange rate. Since January 1999, all reserve assets have been valued at market prices. Since January 2000 the reserve assets data have been compiled in accordance with the IMF's "International Reserves and Foreign Currency Liquidity Guidelines for a Data Template" , of October 2001. Under this new definition, the total amount of reserve assets as at 31 December 1999 would have been EUR 37,835 million, and not EUR 37,288 million included in the series. The main items of reserve assets are updated the first week of each month with reference to the end of the previous month and are disseminated in the economic indicator 7.8. Table 17.27
a. See footnote a to Table 17.21. b. See footnote b to Table 17.21. Table 17.28
Note: See footnote a to Table 17.21. Table 17.29
a. See footnote b to Table 17.21. Table 17.30
a. This adjustment to column 7 is required because loans from foreign parent companies and indirectly related foreign companies are included as direct investment in column 4 of Table 17.27 and loans from foreign subsidiaries reduce the figures for direct investment in column 4 of Table 17.22 and it has not been possible to deduct these items from the series by type of firm (columns 8 to 14). Table 17.31
a. These amounts are deducted from column 1 but not from the other columns (see note to Table 17.30).
BANCO DE ESPAÑA 333 BOLETÍN ESTADÍSTICO, FEBRUARY 2013


CHAPTER 18 CUSTOMS STATISTICS

1=2+3 2 3 4=5+6 5 6 7=4-1 8=5-2 9=6-3
18. CUSTOMS STATISTICS 18.1 Imports/arrivals and exports/dispatches
Ministerio de Hacienda y Administraciones Públicas EUR millions
Imports/arrivals Exports/dispatches Trade balance
Total Energy Non-energy Total Energy Non-energy Total Energy Non-energy
05 232 954 32 922 200 032 155 005 6 381 148 623 -77 950 -26 541 -51 409 06 262 687 41 464 221 223 170 439 7 483 162 956 -92 249 -33 981 -58 267 07 285 038 42 772 242 266 185 023 8 238 176 786 -100 015 -34 535 -65 481 08 283 388 55 480 227 908 189 228 12 032 177 196 -94 160 -43 448 -50 712 09 206 116 34 356 171 761 159 890 6 940 152 950 -46 227 -27 416 -18 811 10 240 056 44 565 195 491 186 780 9 188 177 592 -53 276 -35 377 -17 898 11 263 141 56 835 206 306 215 230 12 919 202 312 -47 910 -43 916 -3 995
P P P P
P P P P P P P P P P P P
11 Sep 22 633 5 111 17 522 17 780 1 108 16 672 -4 853 -4 003 -850 Oct 23 026 4 276 18 750 19 394 2 163 17 232 -3 632 -2 114 -1 518 Nov 22 540 5 010 17 530 19 866 2 144 17 722 -2 674 -2 866 192 Dec 21 552 5 284 16 269 17 004 1 012 15 991 -4 549 -4 271 -277
12 Jan 20 234 4 941 15 294 16 579 1 060 15 519 -3 655 -3 880 225 Feb 21 737 5 578 16 158 17 978 1 273 16 705 -3 759 -4 306 547 Mar 23 134 5 590 17 544 19 889 1 380 18 509 -3 245 -4 210 965 Apr 20 554 5 282 15 273 17 198 1 009 16 189 -3 356 -4 273 917 May 21 388 4 810 16 578 19 462 1 184 18 278 -1 926 -3 626 1 700 Jun 21 569 5 171 16 398 18 869 1 166 17 702 -2 700 -4 005 1 305 Jul 21 293 4 901 16 392 19 600 1 521 18 079 -1 693 -3 380 1 687 Aug 19 732 5 851 13 881 16 587 1 304 15 283 -3 145 -4 547 1 402 Sep 20 951 5 429 15 521 17 866 1 413 16 453 -3 085 -4 016 931 Oct 22 570 5 226 17 345 21 078 1 736 19 342 -1 492 -3 489 1 997 Nov 21 157 4 970 16 187 19 750 1 322 18 428 -1 407 -3 648 2 241 Dec 19 083 4 680 14 403 17 789 1 513 16 276 -1 294 -3 167 1 873
1=2+5 2=3+4 3 4 5=6+9+14 6=7+8 7 8 9=10to12 10 11 12 13 14 15 16
18. CUSTOMS STATISTICS 18.2 By productA) Imports/arrivals
Ministerio de Hacienda y Administraciones Públicas EUR millions Energy Non-energy products Intermediate goods Consumer goods Capital goods
Total Interme- Consu- Durables of which Total diate mer Total Agricul- Indus- Food Non- Total tural trial Total durables Total Total of which Ma- Trans- passeng. chinery port cars
05 232 954 32 922 32 768 154 200 032 105 653 4 367 101 285 67 499 14 122 21 967 31 410 18 520 26 881 16 125 7 593 06 262 687 41 464 41 242 222 221 223 120 921 4 066 116 855 72 292 14 815 24 034 33 443 19 246 28 010 18 082 6 206 07 285 038 42 772 42 444 329 242 266 134 999 5 059 129 940 77 921 16 192 26 383 35 346 21 205 29 346 20 163 5 075 08 283 388 55 480 55 237 243 227 908 130 023 5 914 124 110 72 143 16 089 28 403 27 652 15 016 25 741 18 306 3 836 09 206 116 34 356 34 278 77 171 761 93 907 4 716 89 191 61 249 14 590 26 974 19 685 9 264 16 605 12 299 1 253 10 240 056 44 565 44 563 3 195 491 117 423 5 151 112 273 59 555 15 766 21 766 22 024 8 767 18 512 13 289 1 898 11 263 141 56 835 56 813 21 206 306 127 784 6 441 121 343 61 005 16 567 22 544 21 893 9 878 17 517 12 637 1 976
P P P P
P P P P P P P P P P P P
11 Sep 22 633 5 111 5 111 0 17 522 10 690 540 10 149 5 392 1 413 2 236 1 743 760 1 440 1 023 158 Oct 23 026 4 276 4 269 7 18 750 10 334 540 9 794 6 790 1 493 2 621 2 676 1 429 1 626 1 094 188 Nov 22 540 5 010 5 010 0 17 530 10 681 524 10 157 5 020 1 494 1 632 1 894 823 1 830 1 155 412 Dec 21 552 5 284 5 284 0 16 269 9 862 538 9 323 4 821 1 548 1 571 1 703 782 1 585 1 183 149
12 Jan 20 234 4 941 4 940 0 15 294 9 503 565 8 938 4 602 1 162 1 805 1 635 774 1 189 855 106 Feb 21 737 5 578 5 578 0 16 158 10 276 509 9 767 4 719 1 203 1 846 1 671 835 1 163 843 99 Mar 23 134 5 590 5 564 26 17 544 10 741 613 10 128 5 372 1 298 1 669 2 405 832 1 431 1 068 116 Apr 20 554 5 282 5 281 0 15 273 9 823 549 9 275 4 220 1 234 1 449 1 537 727 1 229 910 97 May 21 388 4 810 4 810 0 16 578 10 953 641 10 312 4 348 1 387 1 504 1 456 621 1 277 969 90 Jun 21 569 5 171 5 171 0 16 398 10 492 574 9 918 4 567 1 369 1 687 1 510 634 1 338 960 131 Jul 21 293 4 901 4 901 0 16 392 10 368 490 9 877 4 848 1 385 2 029 1 434 658 1 176 864 80 Aug 19 732 5 851 5 851 0 13 881 8 219 602 7 617 4 620 1 384 2 140 1 097 388 1 041 770 66 Sep 20 951 5 429 5 429 0 15 521 9 745 594 9 151 4 587 1 333 1 992 1 262 473 1 189 860 112 Oct 22 570 5 226 5 225 1 17 345 10 613 620 9 993 5 249 1 477 2 121 1 650 639 1 483 1 034 206 Nov 21 157 4 970 4 969 0 16 187 10 198 694 9 504 4 628 1 430 1 709 1 490 549 1 361 1 014 102 Dec 19 083 4 680 4 679 1 14 403 8 465 546 7 919 4 511 1 392 1 570 1 549 703 1 426 1 073 104
BANCO DE ESPAÑA 336 BOLETÍN ESTADÍSTICO, FEBRUARY 2013

1 2=3+7 3 4 5 6 7 8 9 10 11 12 13 14 15
18. CUSTOMS STATISTICS 18.3 Geographical breakdownA) Imports/arrivals
Ministerio de Hacienda y Administraciones Públicas EUR millions European Union (EU 27) OECD Euro area Other EU 27 Of which: Other Newly
World American indus- total Total OPEC coun- China trialised tries countries Of which: Of which: Total United Japan Total Total States Germany France Italy United Kingdom
05 232 954 142 821 119 524 34 357 32 851 19 891 23 297 13 236 172 364 7 484 5 923 17 142 8 077 11 709 4 905 06 262 687 154 753 129 312 37 281 33 520 21 712 25 441 13 285 187 479 8 587 5 918 21 486 10 026 14 370 6 306 07 285 038 171 037 143 578 43 645 35 001 24 850 27 459 14 146 205 697 9 996 6 082 20 131 9 348 18 493 6 074 08 283 388 157 021 131 016 39 509 31 472 21 785 26 005 13 025 190 591 11 283 5 121 27 652 10 901 20 493 5 095 09 206 116 119 572 97 720 27 679 24 136 14 916 21 851 9 904 143 727 8 448 3 171 16 981 7 512 14 457 3 485 10 240 056 131 251 105 524 28 175 26 038 16 965 25 728 10 944 158 761 9 650 3 470 23 096 10 875 18 916 3 733 11 263 141 138 954 112 087 31 136 28 581 17 323 26 866 11 161 169 304 10 869 3 211 27 749 13 161 18 705 3 630
P P P P
P P P P P P P P P P P P
11 Sep 22 633 11 801 9 416 2 665 2 334 1 501 2 385 1 002 14 213 851 281 2 447 1 105 1 747 245 Oct 23 026 13 419 11 112 3 087 2 467 1 517 2 307 947 15 721 859 259 2 021 1 183 1 601 263 Nov 22 540 11 870 9 527 2 673 2 422 1 448 2 343 964 14 593 1 086 295 2 509 1 216 1 493 283 Dec 21 552 11 219 9 055 2 328 2 311 1 407 2 164 846 14 100 788 222 2 555 1 398 1 369 309
12 Jan 20 234 10 050 8 181 2 226 2 247 1 226 1 869 721 12 298 694 287 2 854 1 162 1 666 281 Feb 21 737 11 184 8 914 2 373 2 408 1 358 2 270 876 13 969 910 240 2 647 1 195 1 489 230 Mar 23 134 11 474 9 354 2 539 2 472 1 403 2 120 843 14 084 895 265 2 718 1 910 1 200 323 Apr 20 554 10 264 8 283 2 224 2 238 1 251 1 980 811 13 027 873 260 2 478 1 106 1 294 256 May 21 388 11 081 8 820 2 306 2 230 1 388 2 261 961 13 953 881 291 2 038 1 267 1 438 309 Jun 21 569 10 974 8 905 2 255 2 381 1 293 2 069 778 13 397 845 231 3 133 1 264 1 475 249 Jul 21 293 10 495 8 504 2 308 2 270 1 324 1 991 838 13 151 867 226 2 635 1 261 1 619 271 Aug 19 732 8 944 7 081 1 811 1 690 1 018 1 863 789 10 872 547 181 3 081 1 225 1 619 224 Sep 20 951 10 682 8 486 2 213 2 095 1 317 2 195 842 12 887 770 202 2 636 1 077 1 532 245 Oct 22 570 11 629 9 393 2 445 2 315 1 485 2 236 917 14 198 841 247 2 816 1 065 1 587 288 Nov 21 157 10 807 8 710 2 366 2 249 1 264 2 097 830 13 468 835 322 2 502 1 097 1 385 244 Dec 19 083 9 710 7 855 2 042 2 013 1 238 1 855 831 12 167 809 177 2 328 780 1 326 230
1=2+5 2=3+4 3 4 5=6+9+14 6=7+8 7 8 9=10to12 10 11 12 13 14 15 16
18. CUSTOMS STATISTICS 18.4 By productB) Exports/dispatches
Ministerio de Hacienda y Administraciones Públicas EUR millions Energy Non-energy products Intermediate goods Consumer goods Capital goods
Total Interme- Consu- Non- Durables of which Total diate mer Total Agricul- Indus- Food durables Total tural trial Total Total Total of which Ma- Trans- passeng. chinery port cars
05 155 005 6 381 5 328 1 053 148 623 74 505 713 73 792 59 271 18 806 13 744 26 721 19 366 14 848 6 422 7 403 06 170 439 7 483 5 884 1 599 162 956 83 125 795 82 330 62 737 19 936 14 960 27 840 19 416 17 094 7 182 8 822 07 185 023 8 237 6 643 1 594 176 786 92 536 1 122 91 414 66 493 21 109 16 441 28 944 21 740 17 756 8 051 8 518 08 189 228 12 032 9 989 2 044 177 196 92 383 1 194 91 189 67 976 22 567 18 245 27 165 20 429 16 837 8 745 6 979 09 159 890 6 940 5 417 1 523 152 950 75 494 904 74 590 63 765 22 033 18 360 23 372 18 693 13 691 7 796 4 842 10 186 780 9 188 7 340 1 848 177 592 98 614 1 061 97 553 63 186 24 052 14 503 24 632 19 597 15 792 8 817 5 944 11 215 230 12 919 10 711 2 208 202 312 113 561 1 428 112 133 69 803 26 315 16 238 27 251 22 015 18 948 10 416 7 285
P P P P
P P P P P P P P P P P P
11 Sep 17 780 1 108 951 157 16 672 9 346 135 9 211 5 838 1 812 1 378 2 648 2 188 1 488 829 560 Oct 19 394 2 163 2 040 123 17 232 9 771 160 9 611 5 938 2 179 1 573 2 186 1 710 1 522 859 551 Nov 19 866 2 144 2 036 107 17 722 9 811 125 9 686 6 223 2 462 1 265 2 496 1 952 1 688 941 638 Dec 17 004 1 012 829 184 15 991 9 228 107 9 121 5 213 2 465 1 141 1 607 1 190 1 551 928 517
12 Jan 16 579 1 060 926 134 15 519 8 841 95 8 746 5 433 2 343 1 310 1 780 1 427 1 245 738 427 Feb 17 978 1 273 1 106 167 16 705 9 156 103 9 053 6 154 2 379 1 556 2 219 1 818 1 394 776 538 Mar 19 889 1 380 1 209 171 18 509 10 303 121 10 182 6 521 2 626 1 608 2 287 1 875 1 685 917 665 Apr 17 198 1 009 889 120 16 189 9 254 104 9 150 5 516 2 244 1 222 2 050 1 616 1 419 905 431 May 19 462 1 184 1 064 120 18 278 10 716 111 10 605 5 970 2 447 1 213 2 311 1 879 1 592 932 557 Jun 18 869 1 166 1 007 159 17 702 9 952 121 9 831 6 023 2 255 1 356 2 413 1 949 1 726 1 063 550 Jul 19 600 1 521 1 280 241 18 079 10 339 196 10 143 6 076 2 260 1 523 2 293 1 822 1 663 1 021 517 Aug 16 587 1 304 1 053 251 15 283 9 535 118 9 417 4 672 2 094 1 488 1 090 710 1 076 822 153 Sep 17 866 1 413 1 178 236 16 453 9 927 125 9 802 5 192 1 887 1 575 1 730 1 328 1 334 742 506 Oct 21 078 1 736 1 498 238 19 342 10 959 162 10 797 6 600 2 459 1 684 2 457 1 920 1 783 951 722 Nov 19 750 1 322 1 111 211 18 428 10 070 122 9 948 6 423 2 816 1 357 2 250 1 802 1 935 1 232 594 Dec 17 789 1 513 1 217 296 16 276 8 686 103 8 583 5 948 2 831 1 346 1 771 1 395 1 641 1 031 499
BANCO DE ESPAÑA 337 BOLETÍN ESTADÍSTICO, FEBRUARY 2013

1 2=3+7 3 4 5 6 7 8 9 10 11 12 13 14 15
18. CUSTOMS STATISTICS 18.5 Geographical breakdownA) Exports/dispatches
Ministerio de Hacienda y Administraciones Públicas EUR millions European Union (EU 27) OECD Euro area Other EU 27 Of which: Other Newly
World American indus- total Total OPEC coun- China trialised tries countries Of which: Of which: Total United Japan Total Total States Germany France Italy United Kingdom
05 155 005 112 118 90 273 17 608 29 740 12 954 21 845 13 026 130 503 6 393 1 153 4 204 4 988 1 527 1 494 06 170 439 121 206 97 368 18 592 31 895 14 529 23 838 13 579 141 483 7 526 1 266 4 455 6 710 1 722 1 742 07 185 023 130 861 105 590 19 893 34 787 16 475 25 271 14 279 151 486 7 442 1 304 5 449 5 871 2 127 1 727 08 189 228 130 759 105 148 19 897 34 491 15 177 25 611 13 381 150 862 7 544 1 458 7 091 5 930 2 153 1 799 09 159 890 110 504 91 235 17 700 30 923 13 070 19 269 10 092 128 018 5 706 1 213 6 280 4 870 1 986 1 953 10 186 780 126 291 103 657 19 576 33 942 16 489 22 634 11 541 147 500 6 592 1 416 6 880 6 608 2 663 2 481 11 215 230 142 359 113 533 22 152 37 171 17 542 28 826 14 116 167 553 7 914 1 822 8 683 7 849 3 387 2 514
P P P P
P P P P P P P P P P P P
11 Sep 17 780 11 638 9 250 1 824 3 072 1 498 2 388 1 179 13 730 585 195 640 625 281 224 Oct 19 394 13 288 10 673 1 916 3 962 1 459 2 616 1 136 15 260 569 206 683 636 323 236 Nov 19 866 13 522 11 116 2 115 3 993 1 518 2 406 1 113 15 529 594 173 831 670 321 233 Dec 17 004 10 582 8 308 1 775 2 633 1 213 2 275 1 174 12 572 647 137 1 057 692 288 221
12 Jan 16 579 10 950 8 766 1 886 2 953 1 211 2 183 997 12 918 609 152 645 573 269 220 Feb 17 978 11 651 9 217 1 970 3 110 1 332 2 435 1 202 13 930 680 173 787 640 270 255 Mar 19 889 12 924 10 350 2 117 3 474 1 497 2 574 1 173 15 360 744 160 882 771 325 375 Apr 17 198 11 040 8 827 1 900 3 068 1 290 2 213 1 068 13 169 682 184 827 706 286 214 May 19 462 12 370 9 727 1 970 3 274 1 452 2 643 1 119 14 665 692 175 1 010 797 310 271 Jun 18 869 11 629 9 091 1 979 3 068 1 342 2 538 1 111 13 918 878 194 1 027 939 321 241 Jul 19 600 12 019 9 667 2 068 3 158 1 406 2 353 1 175 14 609 885 225 930 856 376 240 Aug 16 587 9 502 7 439 1 514 2 156 1 227 2 063 965 12 116 726 144 923 828 296 220 Sep 17 866 11 168 8 725 1 721 2 790 1 398 2 442 1 095 13 399 730 141 856 703 241 257 Oct 21 078 12 852 9 995 2 155 3 069 1 548 2 857 1 342 15 691 908 227 1 054 901 402 321 Nov 19 750 12 774 9 996 2 243 3 234 1 508 2 778 1 240 15 061 753 173 942 718 328 272 Dec 17 789 10 983 8 407 1 765 2 725 1 268 2 575 1 379 13 270 726 127 916 795 342 373
1 2 3 4 5 6 7 8 9 10
18. CUSTOMS STATISTICS 18.6 Imports/arrivalsC) Unit value indices
Ministerio de Economía y Competitividad Base 2005 = 100 Consumer goods Intermediate goods
Total Capital Total Food Non-food goods Total Energy Non-energy Total Industrial Agricultural
07 104.9 102.0 99.6 102.5 96.1 107.9 117.4 105.2 104.9 109.4 08 109.1 100.8 102.3 100.3 98.3 114.9 144.4 105.4 104.8 126.7 09 96.2 97.1 95.7 97.5 92.4 96.3 99.5 95.2 96.1 104.4 10 100.7 98.3 100.5 97.4 94.5 102.3 125.2 95.6 96.1 109.1 11 109.2 103.8 106.3 102.8 93.7 113.0 156.8 100.4 100.2 129.3
11 May 104.1 98.8 102.8 97.2 87.6 108.0 156.7 96.5 94.9 129.9 Jun 108.0 98.7 102.2 97.4 93.7 113.0 157.8 100.2 100.0 126.4 Jul 110.5 102.8 103.3 102.6 98.6 114.6 156.9 102.5 102.2 135.2 Aug 110.4 106.7 105.2 107.3 94.0 113.8 154.3 100.4 101.2 128.8 Sep 110.2 104.6 107.0 103.6 86.4 115.2 158.8 101.8 102.1 130.1 Oct 111.1 107.0 107.8 106.4 98.5 114.5 156.6 103.0 102.5 128.2 Nov 113.7 107.3 111.9 105.5 97.8 118.1 163.6 104.5 104.8 128.6 Dec 112.2 110.7 113.9 109.3 94.8 114.9 164.0 99.0 99.7 127.4
12 Jan 113.4 108.3 111.5 107.1 85.3 118.5 172.2 102.0 103.0 127.6 Feb 114.5 105.6 112.4 103.2 91.1 120.3 176.7 102.5 103.9 126.8 Mar 116.5 108.1 111.7 106.7 101.2 121.5 179.7 104.0 104.3 138.1 Apr 113.9 102.8 106.9 101.1 96.3 119.8 174.6 102.5 103.8 128.6 May 111.4 99.4 105.5 96.8 93.6 117.7 173.3 103.1 101.9 129.3 Jun 113.0 105.6 107.5 104.8 96.2 117.7 166.8 102.8 103.4 132.1 Jul 111.6 109.1 108.3 109.4 94.6 114.5 161.7 100.7 100.9 126.5 Aug 116.8 111.2 105.9 113.8 89.6 121.9 178.3 99.5 104.3 134.9 Sep 116.2 109.5 107.9 110.2 92.6 121.4 177.4 103.2 105.0 129.7 Oct 116.3 111.7 108.7 112.9 88.6 121.4 172.6 105.9 106.5 134.8 Nov 112.2 106.6 111.7 104.6 83.0 117.9 166.7 103.1 103.6 133.6 Dec 115.0 108.8 108.9 108.9 87.1 120.9 169.1 104.5 106.8 138.2
BANCO DE ESPAÑA 338 BOLETÍN ESTADÍSTICO, FEBRUARY 2013

1 2 3 4 5 6 7 8 9 10
18. CUSTOMS STATISTICS 18.7 Exports/dispatchesC) Unit value indices
Ministerio de Economía y Competitividad Base 2005 = 100 Consumer goods Intermediate goods
Total Capital Total Food Non-food goods Total Energy Non-energy Total Industrial Agricultural
07 107.3 106.5 103.2 108.0 102.0 108.9 121.8 108.1 108.1 102.4 08 109.0 106.9 107.9 106.4 102.4 111.7 153.9 108.5 108.8 104.6 09 101.6 103.2 104.7 102.5 96.9 101.2 104.2 101.0 101.0 95.1 10 103.2 106.4 109.7 104.7 91.4 103.0 122.4 101.8 101.8 95.1 11 108.2 110.4 108.4 111.8 93.0 109.1 159.3 105.3 105.5 100.6
11 May 106.0 109.4 113.3 107.3 90.3 106.3 156.4 103.1 103.1 98.7 Jun 107.9 108.5 109.0 108.2 91.1 110.1 162.5 106.7 106.7 102.9 Jul 109.7 113.1 108.1 115.6 96.3 109.7 157.8 106.4 106.4 104.3 Aug 107.6 109.2 109.1 109.6 92.6 108.6 152.0 105.3 105.5 100.6 Sep 108.8 114.3 113.1 114.6 90.4 108.5 153.8 105.3 105.4 97.0 Oct 111.7 114.3 112.4 115.6 98.4 112.0 159.5 105.5 106.9 103.6 Nov 110.1 109.5 104.5 113.5 97.8 112.0 173.3 104.3 105.5 104.7 Dec 108.6 109.5 104.3 115.8 100.8 109.0 154.2 106.2 106.1 103.7
12 Jan 108.3 112.0 105.9 116.6 99.0 107.6 159.3 104.1 103.9 105.3 Feb 111.4 115.5 114.0 116.6 103.3 110.2 158.2 106.3 106.8 99.6 Mar 110.7 117.5 116.7 118.2 95.2 109.2 163.2 105.1 105.3 100.2 Apr 108.1 113.7 111.6 115.2 94.7 106.9 163.5 103.5 103.0 92.2 May 108.3 114.2 114.4 114.1 92.5 107.5 162.0 104.0 103.6 95.6 Jun 108.5 115.5 113.6 116.9 95.9 106.4 156.3 103.1 102.8 99.9 Jul 109.6 117.1 113.4 119.4 98.0 107.3 159.2 103.1 103.6 97.4 Aug 109.8 116.1 112.3 118.9 99.3 108.4 163.4 104.5 104.5 97.0 Sep 112.5 120.1 116.1 122.7 102.5 110.3 163.9 106.1 106.5 97.1 Oct 111.8 120.4 115.2 123.8 102.2 108.6 168.9 103.5 104.1 105.4 Nov 112.4 117.6 113.9 120.4 108.5 109.7 170.3 105.5 105.4 97.4 Dec 113.4 120.5 115.5 124.5 101.9 110.9 164.9 106.0 107.0 100.2
BANCO DE ESPAÑA 339 BOLETÍN ESTADÍSTICO, FEBRUARY 2013


CHAPTER 19 INTEREST RATES (EXCLUDING THOSE PUBLISHED IN FINANCIAL MARKETS
CHAPTERS)

M M M
1 2 3 4 5 6 7 8 9 10 11
19. INTEREST RATES 19.1 (1st Part) Legal interest rates, euribor,A) Legal interest rates mibor and other reference rates (a)
(c) These rates are no longer considered official mortgage market reference rates for transactions entered into after the entry into force Order EHA/2899/2011 of 28 October 2011. (b) This rate matches that prepared and published by the European Central Bank with a lag of one month for the purposes of its use as a mortgage market reference rate. are treated as provisional data, and as such they are reported in this table for information purposes only. (a) Official mortgage market reference rates (Order EHA/2899/2011 and BE Circular 5/2012) are official as of their publication in the Spanish Official State Gazette. Until then, they
Percentages
Mortgage market: Other mortgage market Official mortgage market reference rates reference rates
Date of publication
Interbank Average rate on Average rate on BOE rates mortgage loans 5 year IRR on Savings mortgage loans at for house Interest govt.bonds banks’ re- over 3 years for purchase Rate with ference house purchase
Swap residual lending (DGTPF Resolution (IRS) maturity rate of 4.2.91) Interest Rest of
12-month 12-month Over 3 Maturity of 2-6 (CECA in- rates official mibor euribor years 1-5 years years dicator) cols. interest Spanish Euro zone Banks Savings 1,2, 5 rates MFIs MFIs banks and 6 3,4 and (b) (c) (c) 7 to 9
10 1.351 1.351 2.769 ... ... 2.662 4.749 2.509 2.971 ... ... 11 2.030 2.007 3.385 ... ... 4.027 5.295 3.261 3.500 ... ... 12 1.109 1.109 3.414 ... ... 4.338 5.385 3.281 3.612 ... ...
11 Dec 2.004 2.004 3.626 ... ... 4.445 5.125 3.509 3.739 3-01-12 19-01-12
12 Jan 1.837 1.837 3.716 ... ... 4.267 5.375 3.629 3.793 2-02-12 18-02-12 Feb 1.679 1.678 3.737 ... ... 4.109 5.500 3.508 3.946 2-03-12 21-03-12 Mar 1.498 1.499 3.624 ... ... 3.935 5.375 3.475 3.777 3-04-12 19-04-12 Apr 1.368 1.368 3.617 ... ... 3.905 5.625 3.540 3.691 4-05-12 19-05-12 May 1.266 1.266 3.453 ... ... 3.802 5.625 3.294 3.607 2-06-12 20-06-12 Jun 1.219 1.219 3.481 ... ... 4.021 5.750 3.350 3.605 3-07-12 19-07-12 Jul 1.061 1.061 3.488 ... ... 4.389 5.750 3.472 3.504 2-08-12 21-08-12 Aug 0.877 0.877 3.430 ... ... 4.705 5.625 3.236 3.724 4-09-12 20-09-12 Sep 0.740 0.740 3.347 ... ... 4.896 5.250 3.199 3.573 2-10-12 18-10-12 Oct 0.650 0.650 3.078 3.270 0.971 4.849 5.375 2.888 3.498 3-11-12 23-11-12 Nov 0.588 0.588 2.992 3.240 0.887 4.725 4.875 2.861 3.336 4-12-12 20-12-12 Dec 0.549 0.549 3.023 3.180 0.806 4.450 4.500 2.927 3.304 3-01-13 19-01-13
13 Jan 0.575 0.575 3.216 3.240 0.992 3.992 5.750 3.094 3.572 2-02-13 21-02-13 Feb 0.594 0.594 ... ... 1.083 3.667 ... ... ... 2-03-13 ...
M M M
12 13 14 15 16 17 18 19 20 21 22 23 24 25 26
19. INTEREST RATES 19.1 (Cont.) Legal interest rates, euribor,A) Legal interest rates mibor and other reference rates
(d) This rate, along with that in column 3, is used for calculating the spread to be applied in the event of early loan repayments. Gazette. (c) These reference rates (Order EHA/2899/2011 and BE Circular 5/2012) are disseminated exclusively for information purposes until its publication in the Spanish Official State
Percentages Indices or reference rates
Legally established rates for the calculation of the market value Date in the offsetting of mortgage loan interest rate risk (c) of
publi- cation
Legal Judgment Tax Default Interes Rate Swap (IRS) BOE inte- debt debt interest rest rate rate rate on rate business transac- one two three four five seven ten fifteen twenty thirty Interest tions year years years years years years years years years years rates Law 3/04 cols. (d) 16-25
10 4.00 6.00 5.00 8.00 ... ... ... ... ... ... ... ... ... ... ... 11 4.00 6.00 5.00 8.13 ... ... ... ... ... ... ... ... ... ... ... 12 4.00 6.00 5.00 8.00 ... ... ... ... ... ... ... ... ... ... ...
11 Dec 4.00 6.00 5.00 8.25 ... ... ... ... ... ... ... ... ... ... ...
12 Jan 4.00 6.00 5.00 8.00 ... ... ... ... ... ... ... ... ... ... ... Feb 4.00 6.00 5.00 8.00 ... ... ... ... ... ... ... ... ... ... ... Mar 4.00 6.00 5.00 8.00 ... ... ... ... ... ... ... ... ... ... ... Apr 4.00 6.00 5.00 8.00 ... ... ... ... ... ... ... ... ... ... ... May 4.00 6.00 5.00 8.00 ... ... ... ... ... ... ... ... ... ... ... Jun 4.00 6.00 5.00 8.00 ... ... ... ... ... ... ... ... ... ... ... Jul 4.00 6.00 5.00 8.00 ... ... ... ... ... ... ... ... ... ... ... Aug 4.00 6.00 5.00 8.00 ... ... ... ... ... ... ... ... ... ... ... Sep 4.00 6.00 5.00 8.00 ... ... ... ... ... ... ... ... ... ... ... Oct 4.00 6.00 5.00 8.00 0.223 0.480 0.602 0.772 0.971 1.358 1.794 2.222 2.343 2.387 8-11-12 Nov 4.00 6.00 5.00 8.00 0.191 0.415 0.527 0.691 0.887 1.270 1.709 2.140 2.265 2.302 6-12-12 Dec 4.00 6.00 5.00 8.00 0.169 0.365 0.471 0.624 0.806 1.176 1.620 2.068 2.216 2.281 4-01-13
13 Jan 4.00 6.00 5.00 7.75 0.287 0.531 0.662 0.818 0.992 1.340 1.765 2.188 2.334 2.398 4-02-13 Feb ... ... ... ... ... ... ... ... 1.083 ... ... ... ... ... ...
BANCO DE ESPAÑA 342 BOLETÍN ESTADÍSTICO, FEBRUARY 2013

1 2 3 4 5 6 7 8 9 10 11 12
19. INTEREST RATES 19.2 Unofficial mortgage market and otherA) Legal interest rates interest rates
Percentages per annum
Mortgage market reference Govt.Bonds Prime rates Other reference rates Tax regime for financial rates Nominal assets. Mixed yield Art.3
DGTPF Resolution of 20.6.1986 index for Law 14/1985 half- Consumer credit Savings
yearly Banks Savings banks’ payments banks borrowing Maturity Maturity Maturity
Quarterly Rates at issue (R.DGTPF Banks Savings rate up to 4 4-7 years 7-10 years average 5/12/89) banks (CECA years rate indicator) Mortgage Domestic certifi- govt.bonds cat 3-6 years
07 4.500 4.867 4.120 4.138 5.46 5.09 9.01 8.48 3.875 - 3.352 -08 5.000 5.983 3.857 3.922 5.53 5.31 9.54 8.80 4.000 3.464 3.884 3.665 09 1.750 3.093 2.563 2.358 5.13 4.74 9.34 8.80 1.875 1.626 2.229 3.092 10 1.750 3.473 3.093 3.098 5.11 4.82 9.80 9.15 2.500 1.821 2.371 3.315 11 2.750 4.187 4.519 4.397 5.27 5.39 9.92 11.19 2.500 3.850 3.591 4.125 12 2.250 4.423 4.334 4.402 ... ... ... ... ... 3.076 3.682 4.533
11 Sep 2.500 4.420 4.290 4.228 5.24 5.11 9.84 10.85 2.250 2.874 3.511 4.130 Oct ... 4.164 4.296 4.241 5.24 5.23 9.84 11.19 2.375 3.850 3.591 4.125 Nov ... 4.205 4.330 4.410 5.27 5.23 9.84 11.19 2.500 3.850 3.591 4.125 Dec 2.750 4.187 4.519 4.397 5.27 5.39 9.92 11.19 2.500 3.850 3.591 4.125
12 Jan ... 4.436 4.236 4.222 5.28 5.45 9.92 11.52 2.500 4.150 4.435 4.436 Feb ... 4.372 3.981 4.067 5.28 5.27 9.92 11.45 2.375 4.150 4.435 4.436 Mar 2.750 4.271 3.800 3.897 5.29 5.27 9.96 11.49 2.375 4.150 4.435 4.436 Apr ... 4.419 3.785 3.868 ... ... ... ... 2.125 1.952 2.701 4.322 May ... 4.507 3.828 3.766 ... ... ... ... 2.000 1.952 2.701 4.322 Jun 2.250 4.623 3.747 3.981 ... ... ... ... 2.125 1.952 2.701 4.322 Jul ... 4.482 4.007 4.342 ... ... ... ... 2.125 4.366 4.858 4.835 Aug ... 4.529 4.465 4.651 ... ... ... ... 1.750 4.366 4.858 4.835 Sep 2.250 4.606 4.755 4.838 ... ... ... ... 2.125 4.366 4.858 4.835 Oct ... 4.586 4.727 4.791 ... ... ... ... ... 3.076 3.682 4.533 Nov ... 4.513 4.582 4.670 ... ... ... ... ... 3.076 3.682 4.533 Dec 2.250 4.423 4.334 4.402 ... ... ... ... ... 3.076 3.682 4.533
13 Jan ... 3.988 4.100 3.953 ... ... ... ... ... 2.686 3.744 4.232 Feb ... ... ... ... ... ... ... ... ... - - -
R
P
1 2 3 4 5 6 7 8 9 10 11 12 13 14 15 16 17
19. INTEREST RATES 19.3 Interest rates (APRC and NDER) on new businessB) Interest rates applied by Loans to households and NPISHMFI to euro area residents Credit institutions (a)
c. Up to the reference month May 2010, this column includes credit granted through credit cards (see the ’Changes’ note in the July-August 2010 Boletín Estadístico). b. Up to the reference month May 2010, this column includes only current account overdrafts (see the ’Changes’ note in the July-August 2010 Boletín Estadístico). a. APRC: annual percentage rate of charge. NDER: narrowly defined effective rate, which is the same as the APRC without including commissions. Note: The terms refer to the initial period of fixation of the rate. For example, a 15-year loan at an annually revisable rate is classified under the term ’Up to one year’.
Percentages
N D E R A P R C
Bank Lending for house purchase Consumer credit Other lending House For Other over- purcha- con- len- draft Weigh- Up to se sump- ding Weigh- Up to Over 1 Over 5 Over ted 1 Weigh- tion (b) ted 1 and up and up 10 avera- year Over 1 Over ted Up to Over 1 Over 5 avera- year to 5 to 10 years ge ra- (c) and up 5 years avera- 1 and up years ge ra- years years te to 5 ge ra- year to 5 te (c) years te years
08 13.43 5.65 5.63 5.71 8.05 5.64 10.48 10.94 9.51 9.89 6.51 6.48 6.43 7.53 5.83 10.99 7.03 09 12.34 2.53 2.45 3.06 7.17 4.03 9.28 9.72 8.08 9.08 4.48 4.25 4.84 7.19 2.62 9.72 4.95 10 4.72 2.60 2.52 2.94 7.07 2.87 6.92 5.06 8.07 8.97 5.16 4.92 5.42 7.46 2.66 7.47 5.64 11 5.28 3.58 3.47 3.97 8.99 4.85 8.57 6.87 10.13 9.38 5.94 5.61 6.33 8.22 3.66 9.11 6.29 12 4.92 2.81 2.66 3.05 5.82 4.86 7.76 5.72 9.39 9.16 5.81 5.78 5.19 7.70 2.93 8.31 6.23
11 Nov 5.27 3.63 3.48 4.01 8.43 4.86 8.23 6.18 10.00 9.34 6.02 5.78 6.02 8.02 3.72 8.74 6.42 Dec 5.28 3.58 3.47 3.97 8.99 4.85 8.57 6.87 10.13 9.38 5.94 5.61 6.33 8.22 3.66 9.11 6.29
12 Jan 5.31 3.71 3.57 4.16 9.48 4.06 9.56 8.39 10.80 9.76 6.25 6.00 6.37 8.08 3.80 10.07 6.67 Feb 5.26 3.72 3.54 4.16 8.97 4.58 9.24 7.73 10.29 9.81 6.15 5.90 6.06 7.90 3.82 9.77 6.60 Mar 5.30 3.62 3.47 4.06 7.98 5.19 8.82 7.28 9.79 9.73 5.90 5.66 5.82 7.72 3.74 9.37 6.37 Apr 5.27 3.45 3.32 3.86 8.71 4.72 8.64 6.75 9.97 9.59 6.07 5.86 6.15 7.53 3.53 9.13 6.61 May 5.29 3.36 3.21 3.71 8.32 4.77 8.56 6.53 10.03 9.56 6.18 5.88 6.80 7.39 3.47 9.08 6.63 Jun 5.21 3.31 3.22 3.44 6.28 3.88 7.59 5.73 9.56 8.73 6.07 5.90 5.89 7.86 3.40 8.00 6.56 Jul 5.12 3.26 3.13 3.48 7.54 4.80 8.53 7.32 9.91 8.93 5.98 5.78 5.92 7.84 3.34 8.99 6.46 Aug 5.11 3.21 3.07 3.50 7.01 4.16 8.86 7.77 9.83 9.17 6.40 6.23 6.29 8.24 3.31 9.35 6.94 Sep 5.07 3.10 2.94 3.32 7.07 5.70 8.74 7.28 9.91 9.50 6.14 6.04 5.57 8.50 3.18 9.34 6.57 Oct 4.94 3.07 2.88 3.28 6.88 5.08 8.56 6.54 10.16 9.34 6.00 5.95 5.44 8.03 3.18 9.11 6.45 Nov 4.86 2.97 2.82 3.14 6.42 5.53 8.45 6.46 10.10 9.28 5.61 5.71 5.20 5.79 3.06 8.95 6.04 Dec 4.92 2.81 2.66 3.05 5.82 4.86 7.76 5.72 9.39 9.16 5.81 5.78 5.19 7.70 2.93 8.31 6.23
13 Jan 4.91 3.03 2.91 3.09 6.36 4.81 8.82 7.21 10.26 9.18 5.89 5.83 5.42 7.65 3.16 9.43 6.39
BANCO DE ESPAÑA 343 BOLETÍN ESTADÍSTICO, FEBRUARY 2013

R
P
1 2 3 4 5 6 7 8 9 10 11 12 13 14 15 16 17
19. INTEREST RATES 19.4 Interest rates (APRC and NDER) on new businessB) Interest rates applied by Loans to households and NPISHMFI to euro area residents Deposit-taking institutions (a)
c. Up to the reference month May 2010, this column includes credit granted through credit cards (see the ’Changes’ note in the July-August 2010 Boletín Estadístico). b. Up to the reference month May 2010, this column includes only current account overdrafts (see the ’Changes’ note in the July-August 2010 Boletín Estadístico). a. APRC: annual percentage rate of charge. NDER: narrowly defined effective rate, which is the same as the APRC without including commissions. Note: The terms refer to the initial period of fixation of the rate. For example, a 15-year loan at an annually revisable rate is classified under the term ’Up to one year’.
Percentages
N D E R A P R C
Bank Lending for house purchase Consumer credit Other lending House For Other over- purcha- con- len- draft Weigh- Up to se sump- ding Weigh- Up to Over 1 Over 5 Over ted 1 Weigh- tion (b) ted 1 and up and up 10 avera- year Over 1 Over ted Up to Over 1 Over 5 avera- year to 5 to 10 years ge ra- (c) and up 5 years avera- 1 and up years ge ra- years years te to 5 ge ra- year to 5 te (c) years te years
08 13.43 5.65 5.63 5.73 8.05 5.64 11.39 12.31 9.60 9.99 6.49 6.48 6.37 7.30 5.84 11.95 7.01 09 12.34 2.52 2.44 2.99 7.17 4.03 10.28 11.08 8.61 9.28 4.45 4.25 4.75 7.14 2.61 10.79 4.92 10 4.74 2.62 2.52 2.93 7.04 2.86 7.49 5.90 8.38 9.17 5.11 4.90 5.32 7.21 2.70 8.14 5.59 11 5.28 3.56 3.46 3.93 8.98 4.88 8.32 6.26 9.93 9.49 5.87 5.59 6.16 8.06 3.65 9.08 6.22 12 4.92 2.81 2.66 3.02 5.82 4.86 7.34 4.85 9.08 9.15 5.75 5.76 4.95 7.70 2.92 8.06 6.18
11 Nov 5.27 3.59 3.47 3.96 8.41 4.86 8.01 5.84 9.69 9.48 5.93 5.76 5.78 7.83 3.70 8.66 6.34 Dec 5.28 3.56 3.46 3.93 8.98 4.88 8.32 6.26 9.93 9.49 5.87 5.59 6.16 8.06 3.65 9.08 6.22
12 Jan 5.31 3.70 3.55 4.10 9.46 4.06 8.98 6.85 10.34 9.86 6.15 5.97 6.13 7.92 3.78 9.68 6.58 Feb 5.26 3.70 3.52 4.09 8.96 4.58 8.74 6.80 9.59 9.95 6.04 5.87 5.83 7.74 3.79 9.43 6.50 Mar 5.30 3.58 3.46 4.01 7.97 5.19 8.64 6.92 9.53 9.92 5.81 5.63 5.60 7.57 3.72 9.32 6.28 Apr 5.27 3.43 3.32 3.81 8.70 4.84 8.68 6.73 9.79 9.69 5.99 5.83 5.88 7.40 3.52 9.31 6.53 May 5.29 3.33 3.21 3.67 8.31 4.77 8.56 6.53 9.83 9.70 6.09 5.86 6.52 7.22 3.45 9.22 6.54 Jun 5.21 3.29 3.21 3.41 6.27 3.89 7.30 5.50 9.34 8.53 6.00 5.88 5.62 7.74 3.39 7.81 6.49 Jul 5.12 3.22 3.12 3.44 7.53 4.81 8.15 6.65 9.79 8.83 5.89 5.76 5.64 7.69 3.33 8.77 6.38 Aug 5.11 3.18 3.05 3.46 6.99 4.16 8.39 6.76 9.44 9.14 6.30 6.20 5.93 8.07 3.29 9.07 6.85 Sep 5.07 3.06 2.93 3.28 7.05 5.75 8.45 6.76 9.49 9.53 6.05 6.01 5.27 8.39 3.16 9.19 6.48 Oct 4.94 3.07 2.88 3.24 6.86 5.10 8.41 6.26 9.99 9.34 5.92 5.92 5.15 7.97 3.17 9.09 6.37 Nov 4.86 2.95 2.82 3.10 6.40 5.55 8.25 6.16 9.97 9.22 5.53 5.68 4.93 5.69 3.05 8.88 5.96 Dec 4.92 2.81 2.66 3.02 5.82 4.86 7.34 4.85 9.08 9.15 5.75 5.76 4.95 7.70 2.92 8.06 6.18
13 Jan 4.91 3.01 2.90 3.06 6.36 4.81 8.48 6.05 10.04 9.14 5.79 5.79 5.06 7.65 3.15 9.31 6.30
R
P
1 2 3 4 5 6 7 8 9 10 11
19. INTEREST RATES 19.6 Interest rates (APRC and NDER) on new businessB) Interest rates applied by Loans to non-financial corporationsMFI to euro area residents Credit institutions (a)
b. Up to the reference month May 2010, this column includes only current account overdrafts (see the ’Changes’ note in the July-August 2010 Boletín Estadístico). a. APRC: annual percentage rate of charge. NEDR: narrowly defined effective rate, which is the same as the APRC without including commissions. Note: The terms refer to the initial period of fixation of the rate. For example, a 15-year loan at an annually revisable rate is classified under the term ’Up to one year’.
Percentages
N D E R A P R C
Bank Other loans up to EUR 1 million Other loans over EUR 1 million Up to Over over- EUR 1 EUR 1 draft million million and Weighted Weighted revol- average Up to Over 1 Over 5 average Up to Over 1 Over 5 ving rate 1 year and up to years rate 1 year and up to years loans 5 years 5 years (b)
08 20.66 5.52 5.51 6.01 5.95 4.30 4.30 4.15 4.44 5.91 4.43 09 19.99 3.69 3.63 4.79 3.86 2.32 2.16 3.10 3.09 4.24 2.41 10 3.42 3.88 3.78 5.31 5.14 2.58 2.57 2.41 2.95 4.40 2.71 11 4.15 5.02 4.95 6.19 6.63 3.36 3.36 3.07 4.26 5.39 3.53 12 3.52 4.93 4.91 5.65 4.43 2.72 2.61 4.59 3.08 5.35 3.00
11 Nov 4.23 4.97 4.91 6.08 6.53 3.00 2.95 3.77 3.78 5.36 3.21 Dec 4.15 5.02 4.95 6.19 6.63 3.36 3.36 3.07 4.26 5.39 3.53
12 Jan 4.12 5.11 5.07 6.23 5.52 2.79 2.90 2.98 2.23 5.52 3.06 Feb 4.05 5.04 4.96 6.04 6.55 2.96 2.90 4.15 3.70 5.42 3.21 Mar 4.02 5.10 5.02 6.09 6.46 2.77 2.75 2.92 3.18 5.49 3.00 Apr 3.92 5.36 5.32 5.97 6.20 3.02 2.97 4.30 3.47 5.82 3.19 May 3.79 5.17 5.14 5.79 5.91 3.41 3.38 4.73 3.91 5.56 3.70 Jun 3.68 5.24 5.17 6.28 6.57 3.16 3.10 5.33 3.70 5.58 3.42 Jul 3.62 5.29 5.26 6.50 5.17 2.77 2.70 3.99 3.73 5.70 3.10 Aug 3.51 5.38 5.35 6.61 5.18 2.51 2.47 3.63 3.38 5.81 2.74 Sep 3.51 5.09 5.06 5.97 5.76 2.33 2.30 2.89 2.99 5.51 2.59 Oct 3.52 5.14 5.10 6.16 6.24 2.46 2.39 3.90 3.52 5.61 2.79 Nov 3.59 5.13 5.09 6.06 6.00 2.48 2.42 3.73 2.90 5.58 2.72 Dec 3.52 4.93 4.91 5.65 4.43 2.72 2.61 4.59 3.08 5.35 3.00
13 Jan 3.60 5.15 5.12 5.97 5.99 2.67 2.42 5.49 3.54 5.67 2.95
BANCO DE ESPAÑA 344 BOLETÍN ESTADÍSTICO, FEBRUARY 2013

R
P
1 2 3 4 5 6 7 8 9 10 11
19. INTEREST RATES 19.7 Interest rates (APRC and NDER) on new businessB) Interest rates applied by Loans to non-financial corporationsMFI to euro area residents Deposit-taking institutions (a)
b. Up to the reference month May 2010, this column includes only current account overdrafts (see the ’Changes’ note in the July-August 2010 Boletín Estadístico). a. APRC: annual percentage rate of charge. NEDR: narrowly defined effective rate, which is the same as the APRC without including commissions. Note: The terms refer to the initial period of fixation of the rate. For example, a 15-year loan at an annually revisable rate is classified under the term ’Up to one year’.
Percentages
N D E R A P R C
Bank Other loans up to EUR 1 million Other loans over EUR 1 million Up to Over over- EUR 1 EUR 1 draft million million and Weighted Weighted revol- average Up to Over 1 Over 5 average Up to Over 1 Over 5 ving rate 1 year and up to years rate 1 year and up to years loans 5 years 5 years (b)
08 20.66 5.58 5.57 5.95 5.95 4.30 4.31 4.11 4.43 5.58 4.30 09 19.99 3.71 3.66 4.75 3.81 2.32 2.16 3.10 3.09 3.71 2.32 10 3.42 3.91 3.81 5.29 5.12 2.59 2.58 2.39 2.95 3.91 2.59 11 4.15 5.08 5.02 6.05 6.61 3.31 3.31 3.07 4.26 5.08 3.31 12 3.52 5.05 5.04 5.52 4.39 2.71 2.60 4.59 2.87 5.05 2.71
11 Nov 4.23 5.00 4.94 6.00 6.52 2.97 2.91 3.76 3.78 5.00 2.97 Dec 4.15 5.08 5.02 6.05 6.61 3.31 3.31 3.07 4.26 5.08 3.31
12 Jan 4.12 5.18 5.15 6.14 5.49 2.79 2.90 2.98 2.23 5.18 2.79 Feb 4.05 5.10 5.03 5.98 6.54 2.89 2.82 4.15 3.70 5.10 2.89 Mar 4.02 5.16 5.09 6.02 6.45 2.76 2.74 2.91 3.18 5.16 2.76 Apr 3.92 5.44 5.41 5.90 6.18 2.89 2.83 4.30 3.47 5.44 2.89 May 3.79 5.25 5.22 5.68 5.89 3.02 2.97 4.71 3.90 5.25 3.02 Jun 3.68 5.33 5.27 6.18 6.55 2.78 2.70 5.33 3.70 5.33 2.78 Jul 3.62 5.39 5.36 6.43 5.15 2.68 2.61 3.99 3.73 5.39 2.68 Aug 3.52 5.51 5.49 6.53 5.15 2.51 2.47 3.62 3.38 5.51 2.51 Sep 3.51 5.22 5.19 5.86 5.72 2.33 2.29 2.87 2.99 5.22 2.33 Oct 3.52 5.26 5.22 6.12 6.23 2.46 2.39 3.90 3.52 5.26 2.46 Nov 3.59 5.25 5.21 5.98 5.98 2.48 2.42 3.73 2.88 5.25 2.48 Dec 3.52 5.05 5.04 5.52 4.39 2.71 2.60 4.59 2.87 5.05 2.71
13 Jan 3.60 5.27 5.25 5.86 5.94 2.67 2.41 5.49 3.54 5.27 2.67
P
1 2 3 4 5 6 7 8 9 10 11 12 13 14 15
19. INTEREST RATES 19.9 Interest rates (NDER) on new businessB) Interest rates applied by Deposits from households and non-financial corporationsMFI to euro area residents Credit institutions. (a)
c. Includes non financial corportions b. For these deposits new business is the same as the outstanding amounts, and therefore these interest rates are the same as those in Table 19.15. a. APRC: annual percentage rate of charge. NEDR: narrowly defined effective rate, which is the same as the APRC without including commissions.
Percentages
Households and NPISH Non-financial corporations Households and NPISH and non-
Over- Redeemable at With agreed maturity Repos Over- With agreed maturity Repos financial night notice (b) (B) night corpora- (b) (b) tions. Weighted Up to Over 1 Over 2 Repos Up to 3 Over 3 Weighted Up to Over 1 Over 2 average 1 year and up to years months months average 1 and up to years rate 2 years rate year 2 years
08 0.69 - 5.03 4.18 4.17 4.40 3.48 2.20 1.77 3.47 3.45 4.32 3.41 2.29 2.28 09 0.36 - 0.93 2.21 2.15 2.60 2.19 0.33 0.55 1.44 1.41 2.00 1.79 0.41 0.40 10 0.27 - 0.86 2.74 2.68 3.08 2.80 1.21 0.68 1.98 1.94 3.32 2.72 0.79 0.84 11 0.28 - - 2.79 2.73 3.11 2.64 0.86 0.61 2.13 2.10 3.09 2.41 1.00 0.99 12 0.21 - - 2.83 2.97 2.69 1.96 1.39 0.37 2.08 2.05 3.00 2.24 1.32 1.32
11 Nov 0.29 - - 2.77 2.74 2.97 2.66 1.16 0.63 2.13 2.10 3.13 2.65 1.19 1.18 Dec 0.28 - - 2.79 2.73 3.11 2.64 0.86 0.61 2.13 2.10 3.09 2.41 1.00 0.99
12 Jan 0.27 - - 2.78 2.73 3.11 2.40 0.51 0.60 1.91 1.85 3.57 3.75 0.49 0.49 Feb 0.26 - - 2.66 2.64 2.86 2.49 0.49 0.60 1.94 1.89 3.03 3.48 0.50 0.50 Mar 0.28 - - 2.53 2.56 2.29 2.35 0.39 0.56 1.88 1.86 2.77 2.61 0.51 0.49 Apr 0.27 - - 2.37 2.38 2.23 2.37 0.58 0.54 1.68 1.64 2.84 2.93 0.60 0.59 May 0.26 - - 2.26 2.32 1.97 2.08 0.64 0.51 1.69 1.66 2.64 2.40 0.48 0.49 Jun 0.26 - - 2.31 2.38 1.97 2.08 0.77 0.52 1.79 1.76 2.76 2.35 0.64 0.65 Jul 0.24 - - 2.44 2.50 2.14 2.19 0.72 0.49 1.77 1.75 2.28 2.28 0.58 0.60 Aug 0.25 - - 2.47 2.53 2.24 2.12 0.75 0.46 1.81 1.80 2.24 2.15 0.48 0.52 Sep 0.26 - - 2.84 2.90 2.68 1.83 1.14 0.44 1.93 1.90 3.33 1.87 0.95 0.98 Oct 0.25 - - 2.77 2.83 2.55 2.46 1.11 0.43 2.26 2.24 2.78 2.06 0.72 0.77 Nov 0.22 - - 2.91 3.01 2.51 2.42 1.29 0.40 2.11 2.08 2.74 2.66 0.51 0.59 Dec 0.21 - - 2.83 2.97 2.69 1.96 1.39 0.37 2.08 2.05 3.00 2.24 1.32 1.32
13 Jan 0.23 - - 2.37 2.43 2.25 2.38 0.62 0.43 1.95 1.90 2.45 2.62 0.89 0.86
BANCO DE ESPAÑA 345 BOLETÍN ESTADÍSTICO, FEBRUARY 2013

P
1 2 3 4 5 6 7 8 9 10 11 12 13 14 15
19. INTEREST RATES 19.10 Interest rates (NDER) on new businessB) Interest rates applied by Deposits from households and non-financial corporationsMFI to euro area residents Deposit-taking institutions. (a)
c. Includes non financial corportions b. For these deposits new business is the same as the outstanding amounts, and therefore these interest rates are the same as those in Table 19.15. a. APRC: annual percentage rate of charge. NEDR: narrowly defined effective rate, which is the same as the APRC without including commissions.
Percentages
Households and NPISH Non-financial corporations Households and NPISH and non-
Over- Redeemable at With agreed maturity Repos Over- With agreed maturity Repos financial night notice (b) (B) night corpora- (b) (b) tions. Weighted Up to Over 1 Over 2 Repos Up to 3 Over 3 Weighted Up to Over 1 Over 2 average 1 year and up to years months months average 1 and up to years rate 2 years rate year 2 years
08 0.69 - - 4.18 4.17 4.40 3.48 2.20 1.77 3.47 3.45 4.32 4.39 2.29 2.28 09 0.36 - - 2.21 2.15 2.60 2.19 0.33 0.54 1.44 1.41 2.00 1.81 0.41 0.41 10 0.27 - - 2.74 2.68 3.08 2.80 1.21 0.56 1.98 1.94 3.32 2.86 0.79 0.83 11 0.28 - - 2.79 2.73 3.11 2.64 0.86 0.61 2.12 2.09 3.09 2.41 1.00 0.99 12 0.21 - - 2.83 2.97 2.69 1.96 1.39 0.37 2.07 2.04 3.00 2.24 1.32 1.32
11 Nov 0.29 - - 2.77 2.74 2.97 2.66 1.16 0.63 2.13 2.10 3.13 2.65 1.19 1.18 Dec 0.28 - - 2.79 2.73 3.11 2.64 0.86 0.61 2.12 2.09 3.09 2.41 1.00 0.99
12 Jan 0.27 - - 2.78 2.73 3.11 2.40 0.51 0.60 1.91 1.85 3.57 3.75 0.49 0.49 Feb 0.26 - - 2.66 2.64 2.86 2.49 0.49 0.60 1.94 1.89 3.03 3.48 0.50 0.50 Mar 0.28 - - 2.53 2.56 2.29 2.35 0.39 0.56 1.88 1.86 2.77 2.61 0.51 0.50 Apr 0.27 - - 2.37 2.38 2.23 2.37 0.58 0.53 1.68 1.64 2.84 2.93 0.60 0.59 May 0.26 - - 2.26 2.32 1.97 2.08 0.64 0.51 1.68 1.66 2.64 2.40 0.48 0.49 Jun 0.26 - - 2.31 2.38 1.97 2.08 0.77 0.52 1.79 1.76 2.76 2.35 0.64 0.65 Jul 0.24 - - 2.44 2.50 2.14 2.19 0.72 0.49 1.77 1.75 2.28 2.28 0.58 0.59 Aug 0.25 - - 2.47 2.53 2.24 2.12 0.75 0.46 1.81 1.80 2.24 2.15 0.48 0.51 Sep 0.26 - - 2.84 2.90 2.68 1.83 1.14 0.44 1.93 1.90 3.33 1.87 0.95 0.97 Oct 0.25 - - 2.77 2.83 2.55 2.46 1.11 0.43 2.26 2.24 2.78 2.06 0.72 0.75 Nov 0.22 - - 2.91 3.01 2.51 2.42 1.29 0.40 2.11 2.08 2.74 2.66 0.51 0.56 Dec 0.21 - - 2.83 2.97 2.69 1.96 1.39 0.37 2.07 2.04 3.00 2.24 1.32 1.32
13 Jan 0.23 - - 2.37 2.43 2.25 2.38 0.62 0.43 1.95 1.90 2.45 2.62 0.89 0.87
P
1 2 3 4 5 6 7 8 9 10 11 12
19. INTEREST RATES 19.12 Interest rates (NDER) on outstanding amountsB) Interest rates applied by Loans to households and non-financial corporationsMFI to euro area residents Credit institutions (a)
a. NEDR: narrowly defined effective rate, which is the same as the APRC without including commissions. Note: The terms refer to the original loan maturity period. For example, a 15-year loan at an annually revisable rate is classified under the term ’Over 5 years’.
Percentages
Households and NPISH Non-financial corporations
Lending for house purchase Consumer credit and other loans
Weighted Up to Over 1 Over 5 Weighted Up to Over 1 Over 5 Weighted Up to Over 1 Over 5 average 1 year and up to years average 1 year and up to years average 1 year and up to years rate 5 years rate 5 years rate 5 years
08 5.65 5.56 5.99 5.65 7.07 7.50 7.74 6.69 5.55 5.64 5.52 5.53 09 3.35 4.34 4.37 3.34 5.62 6.70 6.84 4.96 3.32 3.32 3.56 3.21 10 2.74 3.97 5.09 2.72 5.36 7.52 7.13 4.45 3.31 3.51 3.44 3.19 11 3.12 4.91 5.81 3.11 5.73 8.24 7.71 4.75 3.90 4.48 4.03 3.66 12 2.61 4.94 6.15 2.59 5.78 9.46 8.34 4.41 3.47 3.92 3.64 3.23
11 Nov 3.10 4.82 5.81 3.08 5.70 7.84 7.71 4.72 3.90 4.43 4.05 3.68 Dec 3.12 4.91 5.81 3.11 5.73 8.24 7.71 4.75 3.90 4.48 4.03 3.66
12 Jan 3.14 4.90 5.85 3.12 5.78 8.47 7.79 4.75 3.87 4.43 3.99 3.65 Feb 3.13 5.05 5.85 3.11 5.78 8.56 7.81 4.75 3.85 4.40 3.96 3.63 Mar 3.11 5.01 5.87 3.09 5.77 8.49 7.82 4.74 3.81 4.44 3.87 3.60 Apr 3.06 4.95 6.05 3.04 5.72 8.11 7.81 4.74 3.80 4.31 3.89 3.60 May 3.01 4.95 6.01 2.99 5.70 8.18 7.79 4.70 3.73 4.18 3.80 3.56 Jun 2.97 5.03 6.39 2.96 5.65 7.51 7.89 4.68 3.71 4.17 3.80 3.52 Jul 2.93 5.02 6.39 2.92 5.66 8.10 7.89 4.62 3.67 4.09 3.79 3.47 Aug 2.87 4.98 6.40 2.85 5.67 8.23 7.91 4.61 3.62 4.03 3.75 3.42 Sep 2.81 5.03 6.34 2.80 5.70 8.35 8.40 4.54 3.68 4.07 3.81 3.49 Oct 2.74 4.99 6.27 2.72 5.68 8.45 8.40 4.49 3.51 3.99 3.63 3.30 Nov 2.68 4.96 6.12 2.66 5.58 7.71 8.38 4.43 3.49 3.95 3.66 3.26 Dec 2.61 4.94 6.15 2.59 5.78 9.46 8.34 4.41 3.47 3.92 3.64 3.23
13 Jan 2.71 4.92 5.79 2.69 5.80 9.48 8.30 4.45 3.61 4.14 3.69 3.40
BANCO DE ESPAÑA 346 BOLETÍN ESTADÍSTICO, FEBRUARY 2013

P
1 2 3 4 5 6 7 8 9 10 11 12
19. INTEREST RATES 19.13 Interest rates (NDER) on outstanding amountsB) Interest rates applied by Loans to households and non-financial corporationsMFI to euro area residents Deposit-taking institutions (a)
a. NEDR: narrowly defined effective rate, which is the same as the APRC without including commissions. Note: The terms refer to the original loan maturity period. For example, a 15-year loan at an annually revisable rate is classified under the term ’Over 5 years’.
Percentages
Households and NPISH Non-financial corporations
Lending for house purchase Consumer credit and other loans
Weighted Up to Over 1 Over 5 Weighted Up to Over 1 Over 5 Weighted Up to Over 1 Over 5 average 1 year and up to years average 1 year and up to years average 1 year and up to years rate 5 years rate 5 years rate 5 years
08 5.66 5.63 5.97 5.65 6.25 7.72 7.73 6.64 5.65 5.67 5.52 5.52 09 3.33 4.32 4.33 3.32 4.81 6.90 6.73 4.81 3.41 3.37 3.54 3.21 10 2.72 4.01 5.06 2.70 4.42 7.40 6.89 4.31 3.38 3.55 3.43 3.15 11 3.09 4.93 5.78 3.08 5.51 8.11 7.48 4.60 4.02 4.51 4.03 3.68 12 2.57 4.92 6.10 2.55 5.41 8.43 8.28 4.30 3.60 3.94 3.64 3.24
11 Nov 3.08 4.84 5.78 3.06 5.48 7.66 7.46 4.58 4.01 4.45 4.04 3.66 Dec 3.09 4.93 5.78 3.08 5.51 8.11 7.48 4.60 4.02 4.51 4.03 3.68
12 Jan 3.10 4.93 5.82 3.09 5.55 8.30 7.53 4.62 4.00 4.45 3.99 3.66 Feb 3.10 5.07 5.82 3.08 5.55 8.33 7.54 4.62 3.97 4.44 3.97 3.64 Mar 3.07 5.05 5.84 3.06 5.54 8.27 7.54 4.61 3.94 4.47 3.87 3.61 Apr 3.03 4.97 6.02 3.01 5.48 7.89 7.53 4.59 3.93 4.34 3.89 3.61 May 2.98 4.98 5.97 2.96 5.47 7.97 7.51 4.56 3.86 4.21 3.80 3.57 Jun 2.94 5.06 6.34 2.92 5.42 7.30 7.62 4.54 3.84 4.21 3.80 3.53 Jul 2.90 5.04 6.34 2.88 5.42 7.88 7.61 4.48 3.79 4.12 3.80 3.48 Aug 2.83 5.00 6.35 2.82 5.42 7.99 7.62 4.47 3.74 4.06 3.76 3.43 Sep 2.78 5.06 6.29 2.76 5.45 8.09 8.19 4.40 3.80 4.09 3.81 3.50 Oct 2.70 5.00 6.22 2.68 5.44 8.23 8.18 4.36 3.64 4.02 3.64 3.31 Nov 2.64 4.95 6.07 2.62 5.36 7.52 8.16 4.30 3.62 3.98 3.66 3.27 Dec 2.57 4.92 6.10 2.55 5.41 8.43 8.28 4.30 3.60 3.94 3.64 3.24
13 Jan 2.67 4.89 5.75 2.66 5.42 8.43 8.23 4.34 3.75 4.16 3.69 3.41
P
1 2 3 4 5 6 7 8 9 10 11 12 13
19. INTEREST RATES 19.15 Interest rates (NDER) on outstanding amountsB) Interest rates applied by Deposits from households and non-financial corporationsMFI to euro area residents Credit institutions (a)
b. For these deposits new business is the same as the outstanding amounts, and therefore these interest rates are the same as those in Table 19.9 a. NEDR: narrowly defined effective rate , which is the same as the APRC without including commissions.
Percentages
Households and NPISH Non-financial corporations Households and NPISH and non-
Overnight Redeemable at With agreed maturity Repos Over- With agreed maturity Repos financial (b) notice (b) night corpora- (b) tions. Weigthed Up to 2 Over 2 Weigthed Up to 2 Over 2 Repos Up to 3 Over 3 average years years average years years months months rate rate
08 0.69 - 5.03 4.41 4.60 2.91 2.68 1.77 4.38 4.45 3.82 2.47 2.52 09 0.36 - 0.93 2.49 2.56 2.08 0.86 0.55 2.21 2.16 2.63 0.57 0.60 10 0.27 - 0.86 2.54 2.60 2.26 1.37 0.68 2.56 2.52 2.86 1.28 1.29 11 0.28 - - 2.76 2.79 2.67 2.15 0.61 2.68 2.64 3.02 2.04 2.07 12 0.21 - - 2.72 2.70 2.79 2.51 0.37 2.64 2.63 2.77 2.36 2.39
11 Nov 0.29 - - 2.76 2.80 2.66 2.35 0.63 2.71 2.67 3.05 1.90 2.00 Dec 0.28 - - 2.76 2.79 2.67 2.15 0.61 2.68 2.64 3.02 2.04 2.07
12 Jan 0.27 - - 2.77 2.80 2.69 2.06 0.60 2.65 2.61 3.04 1.87 1.91 Feb 0.26 - - 2.78 2.80 2.70 2.31 0.60 2.60 2.54 3.06 2.08 2.14 Mar 0.28 - - 2.78 2.79 2.73 2.43 0.56 2.55 2.50 2.98 1.94 2.06 Apr 0.27 - - 2.75 2.76 2.74 2.57 0.54 2.54 2.50 2.94 2.00 2.15 May 0.26 - - 2.73 2.72 2.75 2.12 0.51 2.53 2.48 2.92 2.01 2.03 Jun 0.26 - - 2.70 2.68 2.78 1.95 0.52 2.45 2.43 2.60 2.01 2.00 Jul 0.24 - - 2.68 2.65 2.76 1.63 0.49 2.46 2.41 2.81 2.37 2.16 Aug 0.25 - - 2.67 2.64 2.76 1.60 0.46 2.48 2.44 2.80 2.27 2.09 Sep 0.26 - - 2.67 2.65 2.75 2.05 0.44 2.48 2.45 2.75 2.35 2.28 Oct 0.25 - - 2.69 2.67 2.76 2.21 0.43 2.57 2.55 2.74 2.33 2.30 Nov 0.22 - - 2.70 2.69 2.72 2.25 0.40 2.65 2.64 2.77 2.31 2.30 Dec 0.21 - - 2.72 2.70 2.79 2.51 0.37 2.64 2.63 2.77 2.36 2.39
13 Jan 0.23 - - 2.63 2.64 2.58 2.53 0.43 2.59 2.59 2.53 2.14 2.21
BANCO DE ESPAÑA 347 BOLETÍN ESTADÍSTICO, FEBRUARY 2013

P
1 2 3 4 5 6 7 8 9 10 11 12 13
19. INTEREST RATES 19.16 Interest rates (NDER) on outstanding amountsB) Interest rates applied by Deposits from households and non-financial corporationsMFI to euro area residents Deposit-taking institutions (a)
b. For these deposits new business is the same as the outstanding amounts, and therefore these interest rates are the same as those in Table 19.9 a. NEDR: narrowly defined effective rate , which is the same as the APRC without including commissions.
Percentages
Households and NPISH Non-financial corporations Households and NPISH and non-
Overnight Redeemable at With agreed maturity Repos Over- With agreed maturity Repos financial (b) notice (b) night corpora- (b) tions. Weigthed Up to 2 Over 2 Weigthed Up to 2 Over 2 Repos Up to 3 Over 3 average years years average years years months months rate rate
08 0.69 - - 4.40 4.60 2.87 2.60 1.77 4.39 4.45 3.82 2.47 2.50 09 0.36 - - 2.48 2.56 2.08 0.77 0.54 2.21 2.14 2.66 0.56 0.59 10 0.27 - - 2.54 2.61 2.26 1.24 0.56 2.56 2.53 2.85 1.28 1.28 11 0.28 - - 2.76 2.79 2.67 1.83 0.61 2.68 2.64 3.01 2.05 2.00 12 0.21 - - 2.72 2.70 2.79 2.71 0.37 2.64 2.63 2.78 2.36 2.44
11 Nov 0.29 - - 2.77 2.80 2.66 2.07 0.63 2.71 2.67 3.03 1.90 1.94 Dec 0.28 - - 2.76 2.79 2.67 1.83 0.61 2.68 2.64 3.01 2.05 2.00
12 Jan 0.27 - - 2.77 2.80 2.69 1.81 0.60 2.65 2.61 3.02 1.88 1.86 Feb 0.26 - - 2.78 2.80 2.70 2.13 0.60 2.60 2.55 3.05 2.09 2.10 Mar 0.28 - - 2.77 2.79 2.72 2.22 0.56 2.55 2.51 2.97 1.95 2.02 Apr 0.27 - - 2.75 2.76 2.73 2.36 0.53 2.54 2.49 2.93 2.01 2.10 May 0.26 - - 2.73 2.72 2.74 2.22 0.51 2.53 2.48 2.91 2.01 2.07 Jun 0.26 - - 2.70 2.68 2.77 2.17 0.52 2.45 2.43 2.59 2.02 2.05 Jul 0.24 - - 2.68 2.65 2.75 1.97 0.49 2.46 2.41 2.80 2.37 2.26 Aug 0.25 - - 2.67 2.64 2.75 1.91 0.46 2.48 2.44 2.81 2.27 2.17 Sep 0.26 - - 2.67 2.65 2.74 2.34 0.44 2.48 2.46 2.75 2.36 2.36 Oct 0.25 - - 2.69 2.67 2.76 2.48 0.43 2.57 2.57 2.75 2.34 2.37 Nov 0.22 - - 2.70 2.69 2.72 2.50 0.40 2.65 2.65 2.79 2.32 2.36 Dec 0.21 - - 2.72 2.70 2.79 2.71 0.37 2.64 2.63 2.78 2.36 2.44
13 Jan 0.23 - - 2.63 2.64 2.58 2.76 0.43 2.59 2.60 2.54 2.14 2.24
R
P
1 2 3 4 5 6 7 8 9 10 11 12 13 14
19. INTEREST RATES 19.18 Volumes of new businessB) Interest rates applied by Loans to households and NPISHMFI to euro area residents Credit institutions (a)
b. Up to the reference month May 2010, this column includes credit granted through credit cards (see the ’Changes’ note in the July-August 2010 Boletín Estadístico). a. Up to the reference month May 2010, this column includes only current account overdrafts (see the ’Changes’ note in the July-August 2010 Boletín Estadístico). Note: The terms refer to the initial period of fixation of the rate. For example, a 15-year loan at an annually revisable rate is classified under the term ’Up to one year’.
EUR millions
Bank Lending for house purchase Consumer credit Other lending over- draft and revol- Total Up to Over 1 Over 5 Over Total Up to Over 1 Over Total Up to Over 1 Over 5 ving 1 and up and up 10 (b) 1 and up 5 years 1 and up years loans year to 5 to 10 years year to 5 year to 5 (a) years years (b) years years
08 579 87 093 79 224 5 408 700 1 761 41 960 22 568 8 963 10 429 56 857 49 244 4 817 2 797 09 503 73 154 65 274 6 927 287 667 31 777 19 492 6 329 5 956 45 673 36 353 7 138 2 183 10 13 164 69 479 60 039 8 376 336 728 23 116 11 754 6 011 5 351 30 762 24 205 4 487 2 070 11 10 435 37 502 30 667 6 084 436 315 15 142 5 731 5 259 4 152 21 616 15 914 4 015 1 687 12 9 229 32 276 25 108 6 515 350 304 12 811 5 104 4 221 3 487 18 231 12 882 3 738 1 611
11 Nov 10 434 3 075 2 532 493 34 16 1 223 513 403 307 1 828 1 298 383 148 Dec 10 435 4 078 3 458 582 23 16 1 070 450 348 272 2 071 1 482 451 138
12 Jan 10 114 1 976 1 631 306 17 22 904 361 309 234 1 443 982 349 111 Feb 9 974 2 126 1 731 339 25 32 1 032 371 377 285 1 644 1 049 428 167 Mar 9 767 2 732 2 236 451 32 14 1 185 451 416 319 1 842 1 207 453 182 Apr 9 824 2 563 2 153 377 20 12 940 356 325 258 1 494 1 067 286 140 May 10 777 2 675 2 151 483 26 15 1 105 419 365 321 1 664 1 220 277 167 Jun 9 327 3 249 2 516 659 43 31 1 300 594 364 342 1 819 1 359 299 161 Jul 9 208 2 899 2 263 590 31 15 1 197 513 357 326 1 543 1 116 301 126 Aug 9 046 1 718 1 348 334 22 14 978 374 336 268 1 064 781 199 85 Sep 9 392 1 740 1 287 420 23 9 902 363 294 245 1 096 785 223 89 Oct 9 819 2 397 1 726 596 34 41 1 045 391 341 313 1 507 1 087 307 113 Nov 9 758 2 910 2 195 646 36 33 1 082 422 352 308 1 571 1 093 323 155 Dec 9 229 5 292 3 872 1 314 42 66 1 141 489 384 268 1 543 1 137 291 115
13 Jan 9 235 1 585 1 142 397 24 23 927 344 321 263 1 197 852 250 95
BANCO DE ESPAÑA 348 BOLETÍN ESTADÍSTICO, FEBRUARY 2013

R
P
1 2 3 4 5 6 7 8 9 10 11 12 13 14
19. INTEREST RATES 19.19 Volumes of new businessB) Interest rates applied by Loans to households and NPISHMFI to euro area residents Deposit-taking institutions (a)
b. Up to the reference month May 2010, this column includes credit granted through credit cards (see the ’Changes’ note in the July-August 2010 Boletín Estadístico). a. Up to the reference month May 2010, this column includes only current account overdrafts (see the ’Changes’ note in the July-August 2010 Boletín Estadístico). Note: The terms refer to the initial period of fixation of the rate. For example, a 15-year loan at an annually revisable rate is classified under the term ’Up to one year’.
EUR millions
Bank Lending for house purchase Consumer credit Other lending over- draft and revol- Total Up to Over 1 Over 5 Over Total Up to Over 1 Over Total Up to Over 1 Over 5 ving 1 and up and up 10 (b) 1 and up 5 years 1 and up years loans year to 5 to 10 years year to 5 year to 5 (a) years years (b) years years
08 541 83 322 75 635 5 277 686 1 725 32 203 18 256 6 755 7 192 51 207 44 923 4 161 2 123 09 470 70 559 63 269 6 356 281 652 24 231 15 299 4 607 4 325 41 359 33 170 6 365 1 823 10 12 506 67 306 58 343 7 933 325 704 16 434 8 615 3 940 3 880 27 581 21 941 3 864 1 776 11 9 938 36 064 29 826 5 564 367 307 9 646 3 539 3 367 2 740 19 838 14 790 3 552 1 496 12 8 874 31 242 24 513 6 091 342 296 7 926 3 091 2 581 2 253 16 939 12 116 3 363 1 460
11 Nov 9 938 2 973 2 462 462 33 16 802 338 254 210 1 679 1 209 340 130 Dec 9 938 3 963 3 375 550 23 15 644 261 205 178 1 909 1 382 405 121
12 Jan 9 725 1 909 1 583 287 17 22 527 184 188 154 1 338 923 316 100 Feb 9 590 2 050 1 681 314 24 31 650 222 237 191 1 526 986 389 151 Mar 9 391 2 645 2 183 418 31 13 780 299 265 216 1 710 1 134 411 165 Apr 9 446 2 489 2 107 351 20 11 587 207 203 177 1 388 1 004 257 128 May 10 363 2 587 2 105 443 25 15 668 249 219 200 1 544 1 147 246 151 Jun 8 968 3 153 2 461 620 42 30 821 389 209 222 1 693 1 279 267 147 Jul 8 854 2 805 2 211 549 31 14 725 315 205 205 1 432 1 050 269 113 Aug 8 698 1 662 1 314 313 21 14 534 193 190 150 983 735 174 74 Sep 9 031 1 683 1 257 394 22 9 569 220 192 157 1 020 738 202 80 Oct 9 441 2 317 1 687 556 33 40 657 243 209 206 1 403 1 022 277 103 Nov 9 382 2 811 2 142 602 35 32 687 270 216 201 1 463 1 028 293 142 Dec 8 874 5 131 3 780 1 245 41 64 722 300 249 173 1 440 1 071 262 106
13 Jan 8 712 1 554 1 126 382 24 22 550 176 201 173 1 113 801 224 87
R
P
1 2 3 4 5 6 7 8 9
19. INTEREST RATES 19.21 Volumes of new businessB) Interest rates applied by Loans to non-financial corporationsMFI to euro area residents Credit institutions (a)
a. Up to the reference month May 2010, this column includes only current account overdrafts (see the ’Changes’ note in the July-August 2010 Boletín Estadístico). Note: The terms refer to the initial period of fixation of the rate. For example, a 15-year loan at an annually revisable rate is classified under the term ’Up to one year’.
EUR millions
Bank Other loans up to EUR 1 million Other loans over EUR 1 million over- draft and Total Total revol- Up to Over 1 Over 5 Up to Over 1 Over 5 ving 1 year and up to years 1 year and up to years loans 5 years 5 years (a)
08 1 707 356 775 345 991 7 644 3 140 572 409 520 127 32 095 20 187 09 1 126 262 767 246 194 13 199 3 373 604 975 535 142 48 642 21 190 10 143 822 210 304 196 480 9 715 4 109 454 723 414 796 25 664 14 263 11 127 506 174 069 165 608 5 887 2 574 353 423 324 556 15 428 13 439 12 119 702 145 954 138 908 4 562 2 484 338 860 313 235 13 312 12 313
11 Nov 131 787 13 924 13 222 473 229 26 837 25 127 1 363 347 Dec 127 506 15 544 14 772 517 256 41 270 37 888 2 588 794
12 Jan 128 246 11 992 11 497 307 187 32 205 23 234 3 184 5 788 Feb 125 782 12 587 11 889 431 267 25 891 24 487 894 510 Mar 125 078 13 846 12 967 554 325 30 217 27 663 1 802 753 Apr 126 020 12 907 12 236 420 251 26 774 25 475 782 517 May 124 036 13 545 12 814 459 272 34 467 33 379 600 488 Jun 125 174 12 927 12 197 440 289 39 171 37 355 686 1 130 Jul 127 097 13 359 12 739 363 257 31 122 29 382 948 792 Aug 123 225 9 163 8 790 223 150 20 509 19 702 485 322 Sep 125 001 10 661 10 285 263 113 20 932 19 770 778 384 Oct 123 697 12 259 11 824 335 99 25 808 24 519 711 578 Nov 123 788 11 054 10 601 340 113 22 484 21 155 926 403 Dec 119 702 11 656 11 069 426 160 29 278 27 116 1 515 648
13 Jan 122 140 10 458 10 102 286 70 21 468 19 288 1 529 651
BANCO DE ESPAÑA 349 BOLETÍN ESTADÍSTICO, FEBRUARY 2013

R
P
1 2 3 4 5 6 7 8 9
19. INTEREST RATES 19.22 Volumes of new businessB) Interest rates applied by Loans to non-financial corporationsMFI to euro area residents Deposit-taking institutions (a)
a. Up to the reference month May 2010, this column includes only current account overdrafts (see the ’Changes’ note in the July-August 2010 Boletín Estadístico). Note: The terms refer to the initial period of fixation of the rate. For example, a 15-year loan at an annually revisable rate is classified under the term ’Up to one year’.
EUR millions
Bank Other loans up to EUR 1 million Other loans over EUR 1 million over- draft and Total Total revol- Up to Over 1 Over 5 Up to Over 1 Over 5 ving 1 year and up to years 1 year and up to years loans 5 years 5 years (a)
08 1 595 312 241 303 109 6 338 2 794 527 845 479 340 29 693 18 812 09 1 053 229 047 214 494 11 818 2 735 558 235 493 359 45 118 19 758 10 138 287 187 036 174 504 8 805 3 727 421 178 384 140 23 962 13 076 11 121 199 158 173 150 327 5 381 2 465 335 701 307 874 14 805 13 021 12 114 836 132 201 125 620 4 194 2 386 313 664 288 903 12 894 11 867
11 Nov 125 292 12 587 11 931 435 221 25 454 23 796 1 321 337 Dec 121 199 13 903 13 202 457 244 38 827 35 546 2 510 771
12 Jan 123 069 10 859 10 399 280 180 30 895 22 185 3 091 5 619 Feb 120 698 11 478 10 822 399 256 24 213 22 852 866 495 Mar 120 047 12 533 11 719 500 313 28 934 26 462 1 741 731 Apr 120 938 11 747 11 116 389 242 24 361 23 100 759 502 May 119 001 12 282 11 600 420 262 28 551 27 504 575 472 Jun 120 124 11 637 10 960 399 278 32 853 31 090 666 1 097 Jul 121 987 12 093 11 509 335 248 29 266 27 578 920 767 Aug 118 283 8 281 7 932 206 144 19 723 18 940 471 313 Sep 119 977 9 596 9 245 242 108 20 109 18 991 745 373 Oct 118 705 11 123 10 717 313 94 24 896 23 645 689 561 Nov 118 773 10 063 9 638 318 107 21 671 20 386 899 386 Dec 114 836 10 510 9 964 394 152 28 192 26 169 1 471 552
13 Jan 114 954 9 460 9 128 266 67 20 605 18 489 1 485 632
P
1 2 3 4 5 6 7 8 9 10 11 12 13 14 15
19. INTEREST RATES 19.24 Volumes of new businessB) Interest rates applied by Deposits from households and non-financial corporationsMFI to euro area residents Credit institutions. (a)
b. Includes non-financial corporations. a. For these deposits new business is the same as the outstanding amounts.
EUR millions
Households and NPISH Non-financial corporations Households and NPISH and non-
Over- Redeemable at With agreed maturity Repos Over- With agreed maturity Repos financial night notice (a) (b) night corpora- (a) (a) tions. Total Up to Over 1 Over 2 Repos Up to 3 Over 3 Total Up to Over 1 Over 2 1 year and up to years months months 1 and up t years 2 years year 2 years
08 269 486 - 574 612 518 556 632 44 172 11 715 48 397 112 352 368 984 356 932 10 139 1 913 511 467 559 864 09 310 798 - 389 531 402 436 092 49 644 45 665 40 205 111 903 364 328 349 437 8 301 6 589 417 802 458 006 10 309 097 - 338 486 090 382 876 48 983 54 232 23 373 113 504 324 867 307 234 9 276 8 356 228 185 251 558 11 308 827 - 315 390 799 275 972 70 131 44 697 23 570 104 907 311 567 292 780 13 817 4 970 177 053 200 623 12 308 664 - 387 369 268 300 574 46 948 21 746 14 948 103 288 279 750 269 640 7 216 2 894 91 715 106 663
11 Nov 301 776 - 304 26 857 20 633 4 523 1 701 1 603 104 408 19 754 19 126 426 202 11 817 13 420 Dec 308 827 - 315 27 821 21 904 4 675 1 242 1 609 104 907 25 070 24 134 703 233 14 685 16 294
12 Jan 300 325 - 323 29 965 24 327 4 347 1 291 1 953 99 307 24 811 24 061 549 200 13 109 15 062 Feb 298 393 - 331 26 052 21 160 3 476 1 417 2 393 99 791 23 395 22 477 738 180 11 790 14 183 Mar 301 914 - 339 26 034 22 099 2 436 1 500 2 685 101 659 23 882 23 239 471 173 10 356 13 041 Apr 298 936 - 354 23 663 20 017 2 064 1 582 1 025 95 722 20 968 20 255 550 163 7 317 8 342 May 302 271 - 369 26 786 21 192 2 874 2 719 827 101 850 22 512 21 797 419 296 8 429 9 256 Jun 316 665 - 384 27 067 21 975 2 843 2 249 965 106 281 22 823 21 924 452 446 7 739 8 704 Jul 309 416 - 391 33 264 27 753 3 084 2 427 1 585 95 421 25 756 24 924 474 359 7 637 9 223 Aug 307 953 - 397 26 564 22 158 2 795 1 611 928 97 862 16 844 16 366 277 200 5 533 6 460 Sep 306 949 - 404 32 290 28 076 3 193 1 021 852 99 168 24 156 23 384 635 137 5 312 6 164 Oct 302 429 - 398 39 089 31 391 6 466 1 231 687 94 030 24 771 23 494 994 283 4 790 5 476 Nov 306 811 - 393 36 959 29 384 6 591 984 509 97 855 22 290 21 224 873 193 4 556 5 065 Dec 308 664 - 387 41 535 31 043 6 780 3 713 540 103 288 27 543 26 494 785 264 5 146 5 687
13 Jan 304 678 - 387 39 469 23 778 11 530 4 161 1 011 98 277 24 191 21 994 1 584 613 6 272 7 283
BANCO DE ESPAÑA 350 BOLETÍN ESTADÍSTICO, FEBRUARY 2013

P
1 2 3 4 5 6 7 8 9 10 11 12 13 14 15
19. INTEREST RATES 19.25 Volumes of new businessB) Interest rates applied by Deposits from households and non-financial corporationsMFI to euro area residents Deposit-taking institutions. (a)
b. Includes non-financial corporations. a. For these deposits new business is the same as the outstanding amounts.
EUR millions
Households and NPISH Non-financial corporations Households and NPISH and non-
Over- Redeemable at With agreed maturity Repos Over- With agreed maturity Repos financial night notice (a) (b) night corpora- (a) (a) tions. Total Up to Over 1 Over 2 Repos Up to 3 Over 3 Total Up to Over 1 Over 2 1 year and up to years months months 1 and up t years 2 years year 2 years
08 269 482 - - 588 959 535 222 42 473 11 264 42 085 112 326 340 791 329 955 9 204 1 631 485 075 527 159 09 310 794 - - 510 962 419 319 47 735 43 909 32 851 111 882 343 220 329 940 7 844 5 435 397 465 430 316 10 309 092 - - 462 556 364 296 46 629 51 631 18 202 113 464 299 472 283 812 8 612 7 048 214 300 232 502 11 308 824 - - 375 136 264 865 67 365 42 906 16 753 104 861 300 455 282 449 13 383 4 624 169 690 186 442 12 308 658 - - 355 066 289 013 45 142 20 910 9 582 103 230 271 336 261 520 7 006 2 809 88 187 97 769
11 Nov 301 772 - - 25 824 19 839 4 349 1 635 1 137 104 375 19 179 18 569 414 196 11 362 12 499 Dec 308 824 - - 26 751 21 062 4 495 1 195 1 141 104 861 24 219 23 310 682 226 14 120 15 261
12 Jan 300 323 - - 28 812 23 391 4 180 1 242 1 252 99 275 24 088 23 361 533 194 12 605 13 857 Feb 298 390 - - 25 050 20 346 3 342 1 362 1 534 99 747 22 714 21 822 717 175 11 336 12 870 Mar 301 911 - - 25 033 21 249 2 342 1 442 1 721 101 444 23 159 22 534 457 168 9 958 11 679 Apr 298 933 - - 22 753 19 247 1 985 1 521 657 95 697 20 356 19 664 534 158 7 035 7 692 May 302 267 - - 25 756 20 377 2 764 2 615 530 101 830 21 744 21 050 407 288 8 105 8 635 Jun 316 662 - - 26 026 21 130 2 734 2 163 618 106 267 22 157 21 285 439 433 7 442 8 060 Jul 309 413 - - 31 985 26 685 2 965 2 334 1 016 95 299 25 006 24 198 460 348 7 343 8 360 Aug 307 950 - - 25 542 21 305 2 687 1 549 595 97 826 16 353 15 890 269 194 5 320 5 914 Sep 306 946 - - 31 048 26 996 3 070 982 546 99 120 23 452 22 703 617 133 5 108 5 654 Oct 302 426 - - 37 585 30 184 6 218 1 184 440 93 984 24 049 22 810 965 274 4 605 5 046 Nov 306 809 - - 35 538 28 254 6 337 946 326 97 803 21 640 20 606 847 188 4 381 4 707 Dec 308 658 - - 39 937 29 849 6 519 3 570 346 103 230 26 616 25 597 762 256 4 948 5 295
13 Jan 304 675 - - 38 320 23 086 11 194 4 040 588 98 234 23 467 21 353 1 520 595 6 089 6 677
P
1 2 3 4 5 6 7 8 9 10 11 12
19. INTEREST RATES 19.27 Volumes of outstanding amountsB) Interest rates applied by Loans to households and NPISHMFI to euro area residents Credit institutions (a)
Note: The terms refer to the original loan maturity period. For example, a 15-year loan at an annually revisable rate is classified under the term ’Over 5 years’.
EUR millions
Households and NPISH Non-financial corporations
Lending for house purchase Consumer credit and other loans
Total Up to Over 1 Over 5 Total Up to Over 1 Over 5 Total Up to Over 1 Over 5 1 year and up years 1 year and up years 1 year and up years to 5 to 5 to 5 years years years
08 649 714 1 773 7 824 640 117 224 935 40 702 50 443 133 791 950 724 220 446 258 776 471 502 09 649 557 1 946 6 444 641 168 218 595 36 634 43 170 138 791 921 318 178 666 247 652 495 000 10 656 854 1 875 2 937 652 041 212 468 31 961 35 068 145 439 902 130 165 780 237 667 498 683 11 650 473 1 641 2 433 646 399 199 174 29 909 30 921 138 345 848 598 149 951 210 633 488 015 12 628 667 1 671 1 708 625 288 186 820 29 656 26 923 130 241 717 755 138 497 178 676 400 582
11 Nov 646 877 1 624 2 449 642 804 204 807 34 274 31 503 139 031 856 548 153 597 212 509 490 443 Dec 650 473 1 641 2 433 646 399 199 174 29 909 30 921 138 345 848 598 149 951 210 633 488 015
12 Jan 647 511 1 648 2 371 643 492 197 467 29 392 30 861 137 214 842 692 147 701 210 636 484 355 Feb 645 257 1 580 2 322 641 354 195 624 28 549 30 442 136 634 838 257 143 414 212 885 481 958 Mar 644 410 1 619 2 292 640 499 194 531 28 604 30 200 135 727 835 385 144 905 211 703 478 777 Apr 644 617 1 634 2 458 640 525 191 276 28 690 30 400 132 185 833 452 148 400 215 872 469 180 May 641 261 1 591 2 420 637 250 192 120 28 822 30 090 133 208 826 648 148 766 213 805 464 077 Jun 638 353 1 504 2 052 634 798 197 207 34 101 29 649 133 457 820 856 150 040 209 336 461 480 Jul 637 797 1 504 2 005 634 288 191 224 29 908 29 171 132 145 813 340 148 142 207 921 457 277 Aug 635 654 1 547 1 957 632 150 190 016 29 429 28 760 131 826 801 855 144 793 203 584 453 478 Sep 633 891 1 608 1 914 630 369 188 275 28 712 28 368 131 194 801 161 144 708 201 026 455 427 Oct 631 659 1 649 1 876 628 134 188 114 28 768 28 180 131 167 792 663 144 649 198 795 449 219 Nov 630 044 1 669 1 743 626 632 193 570 35 056 27 433 131 080 786 414 143 905 194 601 447 908 Dec 628 667 1 671 1 708 625 288 186 820 29 656 26 923 130 241 717 755 138 497 178 676 400 582
13 Jan 625 738 1 677 1 655 622 407 185 704 29 603 26 224 129 878 708 807 136 136 175 315 397 356
BANCO DE ESPAÑA 351 BOLETÍN ESTADÍSTICO, FEBRUARY 2013

P
1 2 3 4 5 6 7 8 9 10 11 12
19. INTEREST RATES 19.28 Volumes of outstanding amountsB) Interest rates applied by Loans to households and NPISHMFI to euro area residents Deposit-taking institutions (a)
Note: The terms refer to the original loan maturity period. For example, a 15-year loan at an annually revisable rate is classified under the term ’Over 5 years’.
EUR millions
Households and NPISH Non-financial corporations
Lending for house purchase Consumer credit and other loans
Total Up to Over 1 Over 5 Total Up to Over 1 Over 5 Total Up to Over 1 Over 5 1 year and up years 1 year and up years 1 year and up years to 5 to 5 to 5 years years years
08 641 239 1 765 7 777 631 697 204 543 35 905 42 927 125 711 905 976 206 380 246 869 452 726 09 641 102 1 937 6 418 632 747 201 280 32 229 37 393 131 658 887 441 172 459 239 016 475 967 10 648 281 1 871 2 908 643 502 196 131 27 816 28 898 139 417 867 741 159 588 229 992 478 161 11 637 549 1 637 2 410 633 501 184 765 26 578 25 836 132 351 815 275 143 990 203 599 467 685 12 616 086 1 667 1 683 612 736 172 837 24 732 22 386 125 719 688 963 133 661 172 896 382 406
11 Nov 638 261 1 621 2 426 634 215 190 310 30 906 25 997 133 407 823 280 148 009 204 898 470 373 Dec 637 549 1 637 2 410 633 501 184 765 26 578 25 836 132 351 815 275 143 990 203 599 467 685
12 Jan 634 603 1 645 2 349 630 609 183 308 26 182 25 432 131 694 810 585 142 545 203 505 464 535 Feb 632 389 1 577 2 301 628 511 181 768 25 554 25 070 131 143 806 377 138 370 205 823 462 184 Mar 631 565 1 616 2 272 627 677 180 768 25 628 24 863 130 278 803 546 139 352 204 071 460 123 Apr 631 782 1 631 2 434 627 718 177 687 25 761 25 108 126 818 801 813 143 233 209 007 449 574 May 628 438 1 587 2 391 624 460 178 549 25 832 24 825 127 892 795 703 143 288 207 416 444 998 Jun 625 574 1 500 2 020 622 054 183 715 31 088 24 418 128 209 789 897 144 591 202 774 442 533 Jul 625 023 1 500 1 973 621 550 177 644 26 807 23 955 126 882 782 958 142 998 201 579 438 382 Aug 622 937 1 543 1 925 619 469 176 557 26 397 23 579 126 581 771 946 139 954 197 357 434 635 Sep 621 178 1 604 1 883 617 691 175 055 25 761 23 272 126 022 771 475 140 025 194 807 436 642 Oct 618 977 1 645 1 845 615 487 175 016 25 788 23 114 126 113 763 342 140 103 192 704 430 535 Nov 617 380 1 665 1 713 614 003 180 588 32 075 22 650 125 863 757 703 139 601 188 672 429 430 Dec 616 086 1 667 1 683 612 736 172 837 24 732 22 386 125 719 688 963 133 661 172 896 382 406
13 Jan 613 199 1 673 1 631 609 895 171 941 24 823 21 711 125 408 680 095 131 447 170 174 378 474
P
1 2 3 4 5 6 7 8 9 10 11 12 13
19. INTEREST RATES 19.30 Volumes of outstanding amountsB) Interest rates applied by Deposits from households and non-financial corporationsMFI to euro area residents Credit institutions (a)
a. Includes non-financial corporations.
EUR millions
Households and NPISH Non-financial corporations Households and NPISH and non-
Overnight Redeemable at With agreed maturity Repos Over- With agreed maturity Repos financial notice night corpora- tions. Total Up to 2 Over 2 Total Up to 2 Over 2 Repos Up to 3 Over 3 years years years years months months
08 269 486 - 574 409 418 363 025 46 393 4 454 112 352 88 430 78 803 9 627 15 887 20 341 09 310 798 - 389 395 108 334 746 60 363 1 815 111 903 94 884 85 618 9 266 12 627 14 443 10 309 097 - 338 420 553 338 500 82 053 1 238 113 504 105 710 95 470 10 240 8 819 10 057 11 308 827 - 315 418 957 319 483 99 474 1 500 104 907 93 174 83 187 9 987 5 344 6 844 12 308 664 - 387 423 694 331 658 92 036 1 531 103 288 82 527 75 420 7 108 5 257 6 788
11 Nov 301 776 - 304 420 410 320 230 100 179 1 253 104 408 92 949 82 890 10 058 4 677 5 931 Dec 308 827 - 315 418 957 319 483 99 474 1 500 104 907 93 174 83 187 9 987 5 344 6 844
12 Jan 300 325 - 323 418 534 319 312 99 222 1 475 99 307 90 603 80 690 9 913 4 833 6 307 Feb 298 393 - 331 420 120 320 856 99 264 1 536 99 791 92 920 83 057 9 863 4 567 6 103 Mar 301 914 - 339 418 913 320 746 98 167 1 552 101 659 89 276 80 688 8 588 4 731 6 283 Apr 298 936 - 354 415 299 317 169 98 130 1 490 95 722 86 957 78 459 8 498 4 443 5 933 May 302 271 - 369 408 962 310 668 98 295 1 241 101 850 81 845 73 487 8 358 4 149 5 390 Jun 316 665 - 384 404 016 306 385 97 631 1 209 106 281 79 667 71 341 8 326 4 507 5 716 Jul 309 416 - 391 400 416 302 833 97 582 1 533 95 421 75 887 67 496 8 391 4 042 5 575 Aug 307 953 - 397 399 081 301 368 97 713 1 593 97 862 76 488 68 288 8 201 4 273 5 866 Sep 306 949 - 404 401 507 305 645 95 862 1 423 99 168 76 582 68 728 7 854 4 757 6 180 Oct 302 429 - 398 409 214 314 570 94 644 1 508 94 030 75 758 68 042 7 717 4 866 6 374 Nov 306 811 - 393 415 582 322 952 92 631 1 575 97 855 78 506 71 117 7 389 4 716 6 291 Dec 308 664 - 387 423 694 331 658 92 036 1 531 103 288 82 527 75 420 7 108 5 257 6 788
13 Jan 304 678 - 387 428 773 334 810 93 964 1 467 98 277 83 710 76 162 7 547 6 963 8 431
BANCO DE ESPAÑA 352 BOLETÍN ESTADÍSTICO, FEBRUARY 2013

P
1 2 3 4 5 6 7 8 9 10 11 12 13
19. INTEREST RATES 19.31 Volumes of outstanding amountsB) Interest rates applied by Deposits from households and non-financial corporationsMFI to euro area residents Deposit-taking institutions (a)
a. Includes non-financial corporations.
EUR millions
Households and NPISH Non-financial corporations Households and NPISH and non-
Overnight Redeemable at With agreed maturity Repos Over- With agreed maturity Repos financial notice night corpora- tions. Total Up to 2 Over 2 Total Up to 2 Over 2 Repos Up to 3 Over 3 years years years years months months
08 269 482 - - 409 416 363 024 46 392 4 454 112 326 86 123 78 159 7 964 15 887 20 341 09 310 794 - - 395 107 334 745 60 362 1 815 111 882 93 307 85 349 7 958 12 627 14 443 10 309 092 - - 420 552 338 499 82 053 1 238 113 464 104 157 95 133 9 024 8 819 10 057 11 308 824 - - 418 956 319 483 99 474 1 500 104 861 91 575 82 664 8 911 5 344 6 844 12 308 658 - - 423 693 331 658 92 035 1 531 103 230 81 621 74 915 6 705 5 257 6 788
11 Nov 301 772 - - 420 409 320 230 100 179 1 253 104 375 91 435 82 466 8 969 4 677 5 931 Dec 308 824 - - 418 956 319 483 99 474 1 500 104 861 91 575 82 664 8 911 5 344 6 844
12 Jan 300 323 - - 418 534 319 312 99 222 1 475 99 275 89 137 80 293 8 844 4 833 6 307 Feb 298 390 - - 420 120 320 856 99 263 1 536 99 747 91 458 82 666 8 792 4 567 6 103 Mar 301 911 - - 418 913 320 746 98 167 1 552 101 444 87 793 80 276 7 517 4 731 6 283 Apr 298 933 - - 415 299 317 169 98 130 1 490 95 697 85 514 78 058 7 456 4 443 5 933 May 302 267 - - 408 962 310 668 98 294 1 241 101 830 80 310 72 973 7 337 4 149 5 390 Jun 316 662 - - 404 015 306 385 97 631 1 209 106 267 78 147 70 826 7 321 4 507 5 716 Jul 309 413 - - 400 415 302 833 97 582 1 533 95 299 74 412 67 004 7 409 4 042 5 575 Aug 307 950 - - 399 080 301 368 97 712 1 593 97 826 75 060 67 818 7 242 4 273 5 866 Sep 306 946 - - 401 506 305 645 95 861 1 423 99 120 75 203 68 281 6 922 4 757 6 180 Oct 302 426 - - 409 214 314 570 94 644 1 508 93 984 74 551 67 616 6 935 4 866 6 374 Nov 306 809 - - 415 582 322 952 92 630 1 575 97 803 77 530 70 713 6 816 4 716 6 291 Dec 308 658 - - 423 693 331 658 92 035 1 531 103 230 81 621 74 915 6 705 5 257 6 788
13 Jan 304 675 - - 428 773 334 810 93 963 1 467 98 234 82 928 75 783 7 145 6 963 8 431
BANCO DE ESPAÑA 353 BOLETÍN ESTADÍSTICO, FEBRUARY 2013


CHAPTER 20 EXCHANGE RATES AND COMPETITIVENESS INDICES

1 2 3 4 5 6 7 8 9 10 11
20. EXCHANGE RATES AND COMPETITIVENESS INDICES 20.1 Exchange rates for the euro (a)A) Exchange rates
European Central Bank and IMF for XDR Units of national currency per euro. Average daily data
US Japanese Swiss Pound Swedish Danish Norwegian Canadian Australian New Zealand Memorandum dollar yen franc sterling krona krone krone dollar dollar dollar item: SDR
(USD) (JPY) (CHF) (GBP) (SEK) (DKK) (NOK) (CAD) (AUD) (NZD) (XDR)
07 1.3705 161.25 1.6427 0.68434 9.2501 7.4506 8.0165 1.4678 1.6348 1.8627 0.8948 08 1.4708 152.45 1.5874 0.79628 9.6152 7.4560 8.2237 1.5594 1.7416 2.0770 0.9292 09 1.3948 130.34 1.5100 0.89094 10.6191 7.4462 8.7278 1.5850 1.7727 2.2121 0.9036 10 1.3257 116.24 1.3803 0.85784 9.5373 7.4473 8.0043 1.3651 1.4423 1.8377 0.8687 11 1.3920 110.96 1.2326 0.86788 9.0298 7.4506 7.7934 1.3761 1.3484 1.7600 0.8813 12 1.2848 102.49 1.2053 0.81087 8.7041 7.4437 7.4751 1.2842 1.2407 1.5867 0.8390
See notes at the end of the chapter
11 Sep 1.3770 105.75 1.2005 0.87172 9.1343 7.4462 7.7243 1.3794 1.3458 1.6932 0.8742 Oct 1.3706 105.06 1.2295 0.87036 9.1138 7.4442 7.7474 1.3981 1.3525 1.7361 0.8711 Nov 1.3556 105.02 1.2307 0.85740 9.1387 7.4412 7.7868 1.3897 1.3414 1.7584 0.8664 Dec 1.3179 102.55 1.2276 0.84405 9.0184 7.4341 7.7451 1.3481 1.3003 1.7102 0.8524
12 Jan 1.2905 99.33 1.2108 0.83210 8.8503 7.4353 7.6752 1.3073 1.2405 1.6132 0.8406 Feb 1.3224 103.77 1.2071 0.83696 8.8196 7.4341 7.5522 1.3193 1.2327 1.5845 0.8534 Mar 1.3201 108.88 1.2061 0.83448 8.8873 7.4354 7.5315 1.3121 1.2538 1.6104 0.8568 Apr 1.3162 107.00 1.2023 0.82188 8.8650 7.4393 7.5698 1.3068 1.2718 1.6095 0.8527 May 1.2789 101.97 1.2012 0.80371 8.9924 7.4335 7.5655 1.2916 1.2825 1.6538 0.8361 Jun 1.2526 99.26 1.2011 0.80579 8.8743 7.4325 7.5401 1.2874 1.2550 1.6062 0.8266 Jul 1.2288 97.07 1.2011 0.78827 8.5451 7.4384 7.4579 1.2461 1.1931 1.5390 0.8156 Aug 1.2400 97.58 1.2011 0.78884 8.2805 7.4454 7.3239 1.2315 1.1841 1.5306 0.8198 Sep 1.2856 100.49 1.2089 0.79821 8.4929 7.4539 7.3945 1.2583 1.2372 1.5721 0.8363 Oct 1.2974 102.47 1.2098 0.80665 8.6145 7.4582 7.4076 1.2801 1.2596 1.5817 0.8423 Nov 1.2828 103.94 1.2052 0.80389 8.6076 7.4587 7.3371 1.2787 1.2331 1.5660 0.8383 Dec 1.3119 109.71 1.2091 0.81237 8.6512 7.4604 7.3503 1.2984 1.2527 1.5777 0.8527
13 Jan 1.3288 118.34 1.2288 0.83271 8.6217 7.4614 7.3821 1.3189 1.2658 1.5877 0.8654 Feb 1.3359 124.40 1.2298 0.86250 8.5083 7.4598 7.4232 1.3477 1.2951 1.5929 0.8751
1 2 3 4 5 6 7 8 9
20. EXCHANGE RATES AND COMPETITIVENESS INDICES 20.2 Exchange rates for the euro (a)A) Exchange rates
European Central Bank Units of national currency per euro. Average daily data
Cyprus Czech Hungarian Polish Slovenian Estonian Slovakian Icelandic Latvian pound koruna forint zloty tolar kroon koruna krona lats (b)(CYP) (CZK) (HUF) (PLN) (c)(SIT) (e)(EEK) (d)(SKK) (ISK) (LVL)
07 0.5826 27.766 251.35 3.7837 ... 15.6466 33.775 87.63 0.7001 08 ... 24.946 251.51 3.5121 ... 15.6466 31.262 143.83 0.7027 09 ... 26.435 280.33 4.3276 ... 15.6466 ... ... 0.7057 10 ... 25.284 275.48 3.9947 ... 15.6466 ... ... 0.7087 11 ... 24.590 279.37 4.1206 ... ... ... ... 0.7063 12 ... 25.149 289.25 4.1847 ... ... ... ... 0.6973
See notes at the end of the chapter
11 Sep ... 24.556 285.05 4.3379 ... ... ... ... 0.7093 Oct ... 24.841 296.79 4.3516 ... ... ... ... 0.7061 Nov ... 25.464 309.15 4.4324 ... ... ... ... 0.7015 Dec ... 25.514 304.19 4.4774 ... ... ... ... 0.6975
12 Jan ... 25.531 307.33 4.3760 ... ... ... ... 0.6990 Feb ... 25.042 290.68 4.1835 ... ... ... ... 0.6988 Mar ... 24.676 292.26 4.1370 ... ... ... ... 0.6977 Apr ... 24.809 294.81 4.1782 ... ... ... ... 0.6993 May ... 25.313 293.67 4.2937 ... ... ... ... 0.6981 Jun ... 25.640 293.57 4.2973 ... ... ... ... 0.6969 Jul ... 25.447 286.28 4.1837 ... ... ... ... 0.6963 Aug ... 25.021 278.93 4.0934 ... ... ... ... 0.6963 Sep ... 24.752 284.22 4.1345 ... ... ... ... 0.6962 Oct ... 24.939 282.09 4.1071 ... ... ... ... 0.6962 Nov ... 25.365 282.26 4.1321 ... ... ... ... 0.6962 Dec ... 25.214 285.79 4.0956 ... ... ... ... 0.6965
13 Jan ... 25.563 294.01 4.1424 ... ... ... ... 0.6978 Feb ... 25.475 292.73 4.1700 ... ... ... ... 0.6999
BANCO DE ESPAÑA 356 BOLETÍN ESTADÍSTICO, FEBRUARY 2013

1 2 3 4 5 6 7 8 9
20. EXCHANGE RATES AND COMPETITIVENESS INDICES 20.3 Exchange rates for the euro (a)A) Exchange rates
European Central Bank Units of national currency per euro. Average daily data
Romanian Bulgarian Maltese Turkish Lithuanian Hong Kong Singaporean South African South Korean leu (b) lev lira (c) lira (d) litas dollar dollar rand won
(ROL/RON) (BGN) (MTL) (TRL/TRY) (LTL) (HKD) (SGD) (ZAR) (KRW)
07 3.3375 1.9558 0.4293 1.7865 3.4528 10.6912 2.0636 9.6596 1 272.99 08 3.6842 1.9558 ... 1.9064 3.4528 11.4541 2.0762 12.0590 1 606.09 09 4.2393 1.9558 ... 2.1631 3.4528 10.8114 2.0241 11.6737 1 772.90 10 4.2111 1.9558 ... 1.9965 3.4528 10.2994 1.8055 9.6984 1 531.82 11 4.2386 1.9558 ... 2.3378 3.4528 10.8362 1.7489 10.0970 1 541.23 12 4.4585 1.9558 ... 2.3135 3.4528 9.9663 1.6055 10.5511 1 447.69
See notes at the end of the chapter
11 Sep 4.2838 1.9558 ... 2.4736 3.4528 10.7333 1.7229 10.3956 1 544.04 Oct 4.3244 1.9558 ... 2.5089 3.4528 10.6616 1.7493 10.9188 1 578.17 Nov 4.3560 1.9558 ... 2.4565 3.4528 10.5495 1.7476 11.0547 1 537.42 Dec 4.3282 1.9558 ... 2.4632 3.4528 10.2496 1.7070 10.7829 1 513.26
12 Jan 4.3417 1.9558 ... 2.3759 3.4528 10.0187 1.6510 10.3405 1 474.96 Feb 4.3513 1.9558 ... 2.3264 3.4528 10.2553 1.6585 10.1289 1 485.58 Mar 4.3668 1.9558 ... 2.3631 3.4528 10.2474 1.6624 10.0475 1 487.83 Apr 4.3789 1.9558 ... 2.3520 3.4528 10.2163 1.6459 10.3060 1 495.40 May 4.4412 1.9558 ... 2.3149 3.4528 9.9291 1.6152 10.4412 1 481.36 Jun 4.4626 1.9558 ... 2.2837 3.4528 9.7192 1.6016 10.5050 1 458.61 Jul 4.5549 1.9558 ... 2.2281 3.4528 9.5308 1.5494 10.1379 1 404.11 Aug 4.5176 1.9558 ... 2.2291 3.4528 9.6177 1.5480 10.2585 1 403.93 Sep 4.5022 1.9558 ... 2.3177 3.4528 9.9686 1.5837 10.6512 1 444.65 Oct 4.5624 1.9558 ... 2.3384 3.4528 10.0574 1.5879 11.2215 1 435.37 Nov 4.5273 1.9558 ... 2.3010 3.4528 9.9423 1.5695 11.2986 1 395.13 Dec 4.4899 1.9558 ... 2.3439 3.4528 10.1679 1.6009 11.3179 1 411.41
13 Jan 4.3835 1.9558 ... 2.3543 3.4528 10.3027 1.6326 11.6957 1 417.69 Feb 4.3839 1.9558 ... 2.3738 3.4528 10.3608 1.6546 11.8796 1 452.82
1 2 3 4 5 6 7 8 9 10
20. EXCHANGE RATES AND COMPETITIVENESS INDICES 20.4 Exchange rates for the euro (a)A) Exchange rates
European Central Bank Units of national currency per euro. Average daily data
Chinese yuan Croatian Indonesian Malaysian Philippine Russian Thai Mexican Brazilian Indian renminbi kuna rupiah ringgit peso rouble baht peso real rupee (CNY) (HRK) (IDR) (MYR) (PHP) (RUB) (THB) (MXN) (BRL) (INR)
07 10.4178 7.3376 12 528.33 4.7076 63.026 35.018 44.214 14.974 2.659 56.419 08 10.2236 7.2239 14 165.16 4.8893 65.172 36.421 48.475 16.291 2.674 63.614 09 9.5277 7.3400 14 443.74 4.9079 66.338 44.138 47.804 18.799 2.767 67.361 10 8.9712 7.2891 12 041.70 4.2668 59.739 40.263 42.014 16.737 2.331 60.588 11 8.9960 7.4390 12 206.51 4.2558 60.260 40.885 42.429 17.288 2.327 64.886 12 8.1052 7.5217 12 045.73 3.9672 54.246 39.926 39.928 16.903 2.508 68.597
See notes at the end of the chapter
11 Sep 8.7994 7.4936 12 118.5 4.2456 59.322 42.324 41.902 17.937 2.395 65.596 Oct 8.7308 7.4849 12 150.5 4.2963 59.412 42.857 42.297 18.432 2.434 67.552 Nov 8.6154 7.4923 12 215.0 4.2756 58.743 41.808 41.969 18.565 2.421 68.833 Dec 8.3563 7.5136 11 965.4 4.1639 57.537 41.569 41.099 18.117 2.418 69.207
12 Jan 8.1465 7.5543 11 709.2 4.0151 56.208 40.439 40.718 17.314 2.308 66.060 Feb 8.3314 7.5815 11 913.8 3.9978 56.419 39.423 40.614 16.916 2.273 65.059 Mar 8.3326 7.5358 12 082.5 4.0229 56.634 38.780 40.557 16.824 2.367 66.540 Apr 8.2921 7.4991 12 068.7 4.0277 56.145 38.809 40.639 17.190 2.441 68.194 May 8.0806 7.5383 11 913.5 3.9688 54.908 39.559 40.077 17.424 2.536 69.641 Jun 7.9676 7.5434 11 830.2 3.9836 53.510 41.177 39.640 17.453 2.566 70.167 Jul 7.8288 7.5006 11 605.2 3.8914 51.452 39.947 38.873 16.426 2.491 68.106 Aug 7.8864 7.4853 11 777.5 3.8643 52.173 39.633 38.974 16.360 2.517 68.863 Sep 8.1273 7.4291 12 287.9 3.9599 53.629 40.401 39.842 16.641 2.607 70.045 Oct 8.1390 7.5140 12 457.3 3.9649 53.691 40.356 39.811 16.721 2.633 68.859 Nov 7.9998 7.5410 12 343.8 3.9230 52.716 40.250 39.391 16.769 2.651 70.325 Dec 8.1809 7.5334 12 643.4 4.0075 53.796 40.311 40.187 16.866 2.726 71.695
13 Jan 8.2698 7.5746 12 838.0 4.0413 54.105 40.185 39.924 16.876 2.699 72.072 Feb 8.3282 7.5868 12 933.7 4.1403 54.355 40.334 39.839 16.987 2.635 71.934
BANCO DE ESPAÑA 357 BOLETÍN ESTADÍSTICO, FEBRUARY 2013

1 2 3 4 5 6 7 8 9 10 11
20. EXCHANGE RATES AND COMPETITIVENESS INDICES 20.5 US dollar exchange rates (a)A) Exchange rates
European Central Bank Units of national currency per US dollar. Average daily data
Euro Japanese Swiss Pound Swedish Danish Norwegian Canadian Australian New Zealand Memorandum yen franc sterling krona krone krone dollar dollar dollar item: SDR
(EUR) (JPY) (CHF) (GBP) (SEK) (DKK) (NOK) (CAD) (AUD) (NZD) (XDR)
07 0.731 117.8 1.200 0.500 6.76 5.44 5.86 1.074 1.195 1.361 0.653 08 0.683 103.5 1.084 0.545 6.59 5.10 5.64 1.066 1.197 1.425 0.633 09 0.719 93.5 1.085 0.641 7.64 5.35 6.28 1.140 1.279 1.596 0.649 10 0.756 87.7 1.043 0.648 7.21 5.63 6.05 1.030 1.090 1.387 0.656 11 0.719 79.7 0.887 0.624 6.50 5.36 5.61 0.989 0.970 1.266 0.633 12 0.779 79.7 0.939 0.631 6.78 5.80 5.82 1.000 0.966 1.236 0.653
See notes at the end of the chapter
11 Sep 0.726 76.8 0.872 0.633 6.64 5.41 5.61 1.002 0.978 1.230 0.635 Oct 0.730 76.7 0.897 0.635 6.65 5.43 5.66 1.020 0.987 1.267 0.636 Nov 0.738 77.5 0.908 0.633 6.74 5.49 5.75 1.025 0.990 1.297 0.639 Dec 0.759 77.8 0.932 0.640 6.84 5.64 5.88 1.023 0.987 1.298 0.647
12 Jan 0.775 77.0 0.938 0.645 6.86 5.76 5.95 1.013 0.961 1.250 0.652 Feb 0.756 78.5 0.913 0.633 6.67 5.62 5.71 0.998 0.932 1.198 0.645 Mar 0.758 82.5 0.914 0.632 6.73 5.63 5.71 0.994 0.950 1.220 0.649 Apr 0.760 81.3 0.914 0.624 6.74 5.65 5.75 0.993 0.966 1.223 0.648 May 0.782 79.7 0.940 0.629 7.03 5.81 5.92 1.010 1.003 1.294 0.654 Jun 0.798 79.2 0.959 0.643 7.09 5.93 6.02 1.028 1.002 1.282 0.660 Jul 0.814 79.0 0.978 0.641 6.95 6.05 6.07 1.014 0.971 1.252 0.664 Aug 0.806 78.7 0.969 0.636 6.68 6.00 5.91 0.993 0.955 1.234 0.661 Sep 0.778 78.2 0.940 0.621 6.61 5.80 5.75 0.979 0.962 1.223 0.651 Oct 0.771 79.0 0.932 0.622 6.64 5.75 5.71 0.987 0.971 1.219 0.649 Nov 0.780 81.0 0.940 0.627 6.71 5.81 5.72 0.997 0.961 1.221 0.654 Dec 0.762 83.6 0.922 0.619 6.59 5.69 5.60 0.990 0.955 1.203 0.650
13 Jan 0.753 89.0 0.925 0.627 6.49 5.62 5.56 0.992 0.953 1.195 0.651 Feb 0.749 93.1 0.921 0.646 6.37 5.58 5.56 1.009 0.970 1.192 0.655
1 2 3 4 5 1 2 3 4 5 6 7 8 9
20. EXCHANGE RATES AND COMPETITIVENESS INDICES 20.6 Indices of Spanish competitiveness vis-à-visB) Competitiveness indices the euro area and the EU-27 (a) (b)
See notes at the end of the chapter
Base 1999 QI = 100
Vis-à-vis the euro area Vis-à-vis the EU-27
Based on Based on Based on Based on Based on Total (c) Price component (e) consumer producer total unit manufactu- export Nominal
prices prices labour ring unit unit component (HICP) (PPI) costs labour values Based on Based on Based on Based on (d) Based on Based on Based on Based on
(ULCT)(f) costs (EUVI) consumer producer total unit export consumer producer total unit export (ULCM)(f) prices prices labour unit prices prices labour unit (HICP) (PPI) costs values (HICP) (PPI) costs values (ULCT)(f) (EUVI) (ULCT)(f) (EUVI)
06 108.4 106.2 109.4 114.6 103.9 107.7 105.7 107.7 102.2 100.0 107.6 105.7 107.7 102.1 07 108.9 106.4 112.7 119.9 104.6 107.5 105.3 110.1 103.0 99.8 107.7 105.5 110.3 103.3 08 109.9 107.6 115.0 121.8 104.8 109.4 107.4 113.3 103.1 100.8 108.5 106.6 112.4 102.3 09 109.4 107.6 111.8 112.8 103.3 110.5 108.0 112.2 102.1 102.6 107.6 105.2 109.3 99.5 10 110.0 107.4 110.3 111.6 104.2 110.0 107.3 109.6 102.3 101.9 108.0 105.4 107.6 100.5 11 110.4 107.8 107.5 109.5 104.1 110.2 107.5 106.9 102.1 101.9 108.2 105.5 104.9 100.2 12 110.4 108.1 103.4 109.2 104.6 109.6 107.3 102.1 102.3 101.4 108.0 105.8 100.6 100.9
11 Nov 110.7 107.8 ... ... 103.9 110.8 107.6 ... 102.0 102.2 108.4 105.3 ... 99.9 Dec 110.4 107.7 106.1 112.3 102.5 110.3 107.3 105.7 100.6 102.0 108.1 105.2 103.5 98.6
12 Jan 109.2 107.9 ... ... 104.7 108.8 107.4 ... 102.5 101.8 106.8 105.4 ... 100.6 Feb 108.4 107.8 ... ... 104.8 107.9 107.2 ... 102.6 101.7 106.1 105.4 ... 100.9 Mar 109.7 108.1 105.0 108.7 105.2 109.2 107.5 103.9 102.7 101.6 107.4 105.7 102.1 101.0 Apr 110.5 108.2 ... ... 103.9 109.9 107.4 ... 101.6 101.6 108.2 105.7 ... 100.0 May 110.4 108.1 ... ... 104.3 109.7 107.3 ... 102.2 101.5 108.1 105.7 ... 100.7 Jun 110.3 107.8 103.3 109.1 104.6 109.6 107.0 102.0 102.3 101.5 108.0 105.5 100.5 100.8 Jul 109.7 108.2 ... ... 103.7 108.7 107.0 ... 101.4 101.2 107.4 105.8 ... 100.3 Aug 109.8 108.4 ... ... 104.9 108.6 107.2 ... 102.4 101.0 107.5 106.1 ... 101.4 Sep 111.5 108.5 102.0 109.9 105.1 110.4 107.4 100.3 102.8 101.2 109.1 106.2 99.2 101.6 Oct 111.7 108.3 ... ... 105.1 110.8 107.3 ... 102.9 101.3 109.4 106.0 ... 101.6 Nov 111.7 108.2 ... ... ... 110.7 107.2 ... ... 101.3 109.3 105.8 ... ... Dec 111.3 108.0 ... ... ... 110.4 107.1 ... ... 101.4 108.9 105.7 ... ...
13 Jan 110.2 ... ... ... ... 109.5 ... ... ... 101.6 107.7 ... ... ... Feb ... ... ... ... ... ... ... ... ... 101.9 ... ... ... ...
BANCO DE ESPAÑA 358 BOLETÍN ESTADÍSTICO, FEBRUARY 2013

1 2 3 4 5 6 7 8 9 10 11 12 13 14 15 16 17 18 19
20. EXCHANGE RATES AND COMPETITIVENESS INDICES 20.7 Indices of Spanish competitiveness vis-à-vis theB) Competitiveness indices developed countries,industrialised countries and
newly industrialised Asian countries (a) (b)
Véanse notas al final del capítulo
Base 1999 QI = 100 Vis-à-vis newly industrialised
Vis-à-vis developed countries Vis-à-vis industrialised countries Asian countries Prices Prices
Total (c) Prices component (e) Total (c) component (e) Total (c) component (e) Nominal Nominal Nominal compon- compon- compon-
Based Based Based Based ent Based Based Based Based Based Based ent Based Based Based Based ent Based Based on on on on (d) on on on on on on (d) on on on on (d) on on CPI PPI ULCM (f) EUVI CPI PPI ULCM (f) EUVI CPI PPI CPI PPI CPI PPI CPI PPI
06 110.3 108.5 117.4 103.7 100.8 109.5 107.7 116.5 102.9 111.3 109.0 101.4 109.8 107.5 119.6 112.6 106.4 112.4 105.8 07 111.9 109.6 123.9 105.7 101.9 109.8 107.6 121.6 103.8 113.7 110.7 102.9 110.5 107.6 126.0 118.3 111.5 112.9 106.1 08 114.5 112.2 128.5 105.9 103.3 110.9 108.6 124.4 102.6 116.2 113.2 104.6 111.1 108.2 128.0 120.1 115.5 110.8 103.9 09 114.0 111.0 120.1 104.2 103.4 110.2 107.3 116.1 100.7 115.0 111.5 104.4 110.2 106.8 121.3 114.5 112.2 108.1 102.1 10 112.9 109.6 116.4 103.7 101.9 110.8 107.6 114.2 101.8 112.7 108.7 101.9 110.6 106.7 111.1 103.1 103.3 107.5 99.8 11 113.1 109.8 113.3 103.6 101.7 111.2 107.9 111.4 101.9 112.7 109.3 101.8 110.7 107.3 110.1 105.7 104.1 105.8 101.5 12 111.7 108.8 111.6 103.1 100.3 111.3 108.5 111.2 102.8 110.1 107.3 99.5 110.6 107.8 100.2 98.2 96.2 104.2 102.1
11 Nov 113.1 109.4 ... 103.1 101.4 111.6 107.9 ... 101.7 112.2 108.5 101.2 110.9 107.2 106.9 103.1 101.8 105.0 101.3 Dec 112.3 108.9 115.8 101.6 100.9 111.3 107.9 114.3 100.6 111.2 107.7 100.5 110.6 107.1 104.2 100.4 99.3 104.9 101.1
12 Jan 110.5 108.7 ... 103.2 100.5 110.0 108.1 ... 102.7 108.9 107.2 99.8 109.2 107.5 99.3 98.2 96.7 102.7 101.6 Feb 110.1 109.0 ... 103.7 100.8 109.3 108.1 ... 102.9 108.8 107.7 100.2 108.6 107.5 100.5 99.9 98.1 102.5 101.9 Mar 111.7 109.4 111.5 103.8 100.9 110.7 108.4 110.7 102.9 110.4 108.2 100.4 110.0 107.8 102.7 100.6 98.3 104.5 102.4 Apr 112.3 109.2 ... 102.7 100.7 111.5 108.4 ... 101.9 111.1 108.0 100.2 110.9 107.8 103.3 100.4 98.2 105.2 102.3 May 111.7 108.7 ... 102.9 100.3 111.4 108.4 ... 102.6 110.2 107.2 99.5 110.7 107.7 100.8 98.2 96.3 104.7 101.9 Jun 111.4 108.2 111.5 103.0 100.0 111.3 108.1 111.1 102.9 109.7 106.5 99.2 110.6 107.4 99.2 96.4 95.2 104.2 101.3 Jul 110.2 108.1 ... 101.8 99.6 110.7 108.5 ... 102.2 108.2 106.2 98.5 109.9 107.8 96.1 94.8 93.2 103.1 101.7 Aug 110.3 108.4 ... 103.1 99.6 110.8 108.9 ... 103.5 108.4 106.7 98.6 110.0 108.2 96.9 96.2 93.8 103.4 102.6 Sep 112.6 109.0 111.6 103.6 100.1 112.5 108.9 111.9 103.5 111.0 107.7 99.4 111.7 108.3 101.4 99.2 96.5 105.1 102.8 Oct 113.1 109.1 ... 103.5 100.3 112.8 108.7 ... 103.2 111.5 107.6 99.6 112.0 108.1 101.4 98.8 96.4 105.2 102.5 Nov 113.0 108.9 ... ... 100.2 112.7 108.7 ... ... 111.1 107.3 99.3 111.9 108.0 99.7 97.1 95.0 104.9 102.2 Dec 113.1 109.2 ... ... 100.7 112.4 108.5 ... ... 111.5 107.7 99.9 111.6 107.8 101.6 98.8 97.0 104.7 101.9
13 Jan 112.4 ... ... ... 101.2 111.1 ... ... ... 110.7 ... 100.5 110.1 ... 100.3 ... 97.9 102.5 ... Feb ... ... ... ... 101.6 ... ... ... ... ... ... 101.0 ... ... ... ... 98.7 ... ...
1 2 3 4 5 6 7 8 9 10 11 12 13 14 15 16 17 18
20. EXCHANGE RATES AND COMPETITIVENESS INDICES 20.8 Effective exchange rates of the main currenciesB) Competitiveness indices vis-à-vis developed countries (a)
See notes at the end of the chapter
European Central Bank (euro) and Banco de España Base 1999 QI=100
Nominal effective exchange rates Real effective exchange rates with consumer prices
Euro US Pound Japanese Canadian Danish Swedish Norvegian Swiss Euro US Pound Japanese Canadian Danish Swedish Norwegian Swiss dollar sterling yen dollar krone krona krone franc dollar sterling yen dollar krone krona krone franc
06 102.8 86.6 102.8 93.1 130.8 100.7 97.9 108.9 103.2 103.8 93.9 98.5 76.1 130.0 100.9 95.2 108.1 95.3 07 106.2 81.7 104.4 87.5 136.2 101.8 98.8 110.9 100.4 106.5 89.3 100.1 70.0 135.0 101.6 95.7 108.7 91.3 08 109.4 77.8 90.8 97.7 135.1 104.0 97.0 110.8 105.7 108.6 85.9 87.3 76.5 132.4 104.1 94.1 108.7 95.3 09 110.6 80.8 79.9 111.7 127.1 106.0 88.1 105.5 110.6 109.2 88.9 78.4 86.1 125.1 106.5 86.6 105.3 99.0 10 103.7 78.6 80.9 119.9 140.4 102.5 95.8 111.1 118.9 101.6 86.7 80.8 90.2 138.6 103.5 94.3 111.6 105.4 11 103.4 74.0 79.9 127.5 143.8 101.6 101.1 113.3 133.6 100.7 82.4 81.4 92.8 142.0 102.7 98.3 112.3 115.5 12 97.9 76.8 83.8 131.7 144.0 99.5 102.7 115.3 133.8 95.6 85.8 85.9 93.9 141.5 101.0 98.7 112.5 112.4
11 Nov 102.6 75.4 80.4 133.0 139.1 101.5 99.3 112.9 132.8 99.9 83.7 82.3 95.9 137.8 102.3 96.2 111.1 113.3 Dec 100.8 76.3 81.1 134.1 140.1 101.0 100.0 112.6 132.3 98.1 84.7 83.2 96.6 138.0 101.5 96.7 110.7 112.4
12 Jan 98.9 76.6 81.7 136.5 141.8 100.2 101.3 112.7 133.4 96.3 85.5 83.8 98.7 140.0 101.8 97.8 110.8 113.5 Feb 99.6 75.5 81.7 132.1 143.4 100.4 102.0 115.0 134.5 97.2 84.4 83.8 95.3 141.6 102.4 98.7 113.9 114.2 Mar 99.8 76.3 82.1 125.8 144.5 100.6 101.4 115.7 134.9 97.3 85.2 83.7 90.4 142.1 102.2 97.6 113.4 113.9 Apr 99.5 76.1 83.3 127.8 144.5 100.3 101.4 114.8 135.0 97.2 84.9 85.0 91.6 142.4 101.6 97.5 112.1 113.6 May 98.0 77.3 84.6 132.3 142.6 100.1 99.3 114.3 134.2 95.7 86.2 86.4 94.6 140.5 101.5 95.6 111.7 113.1 Jun 97.2 78.3 83.9 134.5 140.6 99.7 100.4 114.1 133.7 94.9 87.6 85.5 95.9 138.2 101.1 96.4 111.1 112.5 Jul 95.3 78.5 85.2 135.8 142.9 98.6 103.6 114.1 132.9 93.2 87.8 87.3 96.7 140.6 100.3 99.5 110.9 111.7 Aug 95.2 77.6 85.2 135.4 145.5 98.1 106.9 115.7 133.0 93.2 87.1 87.4 96.1 142.9 99.9 102.4 111.5 111.3 Sep 97.2 75.9 84.9 134.0 146.7 98.8 104.9 115.8 133.1 94.9 85.2 86.9 94.8 143.6 100.2 100.6 112.2 111.1 Oct 97.8 75.9 84.3 132.2 145.5 99.2 103.7 116.2 133.4 95.5 85.0 86.6 93.5 142.6 100.3 99.4 113.0 111.2 Nov 97.2 76.9 84.5 129.6 144.5 99.0 103.6 117.2 133.8 95.3 85.9 87.1 91.5 141.8 100.2 99.3 114.3 111.4 Dec 98.7 76.4 84.2 124.2 145.2 99.5 103.7 117.8 134.2 96.6 85.1 87.1 87.8 142.0 100.1 99.3 115.0 111.2
13 Jan 100.4 77.0 82.7 116.2 145.2 100.0 104.8 118.1 132.9 98.2 ... ... ... ... ... ... ... ... Feb 101.6 78.1 80.2 111.1 143.2 100.3 106.9 117.9 133.5 ... ... ... ... ... ... ... ... ...
BANCO DE ESPAÑA 359 BOLETÍN ESTADÍSTICO, FEBRUARY 2013

BANCO DE ESPAÑA / BOLETÍN ESTADÍSTICO
NOTES TO THE TABLES OF CHAPTER 20
Table 20.1
a. Daily exchange rates disseminated by the European Central Bank are available on the Internet at http://www.bde.es/webbde/es/estadis/infoest/tc_1_1e.pdf. Table 20.2
a. Daily exchange rates disseminated by the European Central Bank are available on the Internet at http://www.bde.es/webbde/es/estadis/infoest/tc_1_1e.pdf. b. The euro has replaced the Cyprus pound in January 2008. c. The euro has replaced the Slovenian tolar in January 2007. d. The euro has replaced the Slovak koruna in January 2009. e. The euro has replaced the Estonian kroon in January 2011. Table 20.3
a. Daily exchange rates disseminated by the European Central Bank are available on the Internet at http://www.bde.es/webbde/es/estadis/infoest/tc_1_1e.pdf. b. As of 1 July 2005 the currency of Romania is the new Romanian leu (RON). 1 RON equals 10,000 old Romanian lei (ROL). The average annual data corresponding to 2005 has been calculated applying this relationship to the period January-June 2005. c. The euro has replaced the Maltese lira in January 2008. d. As of 1 January 2005 the currency of the Republic of Turkey is the new Turkish lira (TRY). 1 TRY equals 1,000,000 Turkish liras (TRL). Table 20.4
a. Daily exchange rates disseminated by the European Central Bank are available on the Internet at http://www.bde.es/webbde/es/estadis/infoest/tc_1_1e.pdf. Table 20.5
a. From January 1999, equivalence in US dollars is obtained using the euro exchange rates. Table 20.6
a. The countries making up EU-27 are as follows: Austria, Belgium, Bulgaria, Cyprus, Czech Republic, Denmark, Estonia, Finland, France, Germany, Greece, Hungary, Ireland, Italy, Latvia, Lithuania, Luxembourg, Malta, Netherlands, Poland, Portugal, Romania, Slovakia, Slovenia, Sweden and United Kingdom. The countries making up euro area are as follows: Australia, Belgium, Cyprus, Finland, France, Germany, Greece, Ireland, Italy, Luxembourg, Malta, Netherlands, Portugal, Slovakia, Slovenia and Estonia. b. Abbreviations: HICP (Harmonised Index of Consumer Prices), PPI (Producer Prices Index), ULCT (Unit Labour Costs Total), ULCM (Unit Labour Costs Manufacturing), EUVI (Export Unit Values Index). c. Outcome of multiplying nominal and price components. A decline in the index denotes an improvement in the competitiveness of Spanish products. d. Indices calculated as geometrical means of bilateral exchange rates in which the weights are based on manufacturing trade with trading partners from the counterpart aggregate and capture the effects of third markets. e. Relationship between the Spanish price index and that of the related grouping calculated as the geometrical mean of the price indices of the countries comprising the counterpart grouping, weighted as indicated in the preceding note. f. Quarterly series. Indices for Spain have been calculated using data for Unit Labour Costs (total and manufacturing) compiled from Quarterly Spanish National Accounts. Base 2008. Source INE. Table 20.7
a. Developed countries: Australia, Austria, Belgium, Canada, Cyprus, Denmark, Finland, France, Germany, Greece, Ireland, Italy, Japan, Luxemburg, Malta, Netherlands, New Zealand Norway, Portugal, Slovakia, Slovenia, Estonia, Sweden, Switzerland, United Kingdom and United States. Industrialised countries: The developed countries members and South Korea, Hong kong, Singapore, China, India, Indonesia, Malaysia, Philippines, Taiwan and Thailand. Newly industrialised Asian countries: South Korea, Hong kong, Singapore, China, India, Indonesia, Malaysia, Philippines, Taiwan and Thailand. b. Abbreviations: CPI (Consumer Prices Index), PPI (Producer Prices Index), ULCM (Unit Labour Costs Manufacturing), EUVI (Export Unit Values Index). c. Outcome of multiplying nominal and price components. A decline in the index denotes an improvement in the competitiveness of Spanish products. d. Indices calculated as geometrical means of bilateral exchange rates in which the weights are based on manufacturing trade with trading partners from the counterpart aggregate and capture the effects of third markets.
BANCO DE ESPAÑA 360 BOLETÍN ESTADÍSTICO, FEBRUARY 2013

BANCO DE ESPAÑA / BOLETÍN ESTADÍSTICO
e. Relationship between the Spanish price index and that of the related grouping calculated as the geometrical mean of the price indices of the countries comprising the counterpart grouping, weighted as indicated in the preceding note. f. Quarterly series. Indices for Spain have been calculated using data for Unit Labour Costs (total and manufacturing) compiled from Quarterly Spanish National Accounts. Base 2008. Source INE. Table 20.8
a. The group of developed countries is made up of the countries listed in footnote (a) to Table 20.7, including Spain and excluding the country of the currency in question. For the euro, see note (b) to table 1.16. b. Indices calculated as geometrical means of bilateral exchange rates in which the weights are based on manufacturing trade with trading partners from the counterpart aggregate and capture the effects of third markets. Real effective exchange rates are the outcome of multiplying nominal and price components. A decline in the index denotes an improvement in the competitiveness of Spanish products.
BANCO DE ESPAÑA 361 BOLETÍN ESTADÍSTICO, FEBRUARY 2013


CHAPTER 21 PRIMARY MARKET FOR SECURITIES

1 2 3 4 5 6 7 8 9 10 11 12 13 14
21.PRIMARY MARKET FOR SECURITIES 21.1 Securities other than shares, excluding financial derivativesA) Total economy Shares
By sector and subsector of the issuer. Net issues and public offeringsEUR millions
Securities other than shares, excluding financial derivatives Quoted and unquoted shares, excluding Mutual funds Nominal values mutual funds shares shares
Net capital increases Effective amount paid Public
offer- Share subscrip- Financial corporations General government ings tions net of Non-finan- Total Financial Non-fi- redemptions
Total cial corpora- nancial Total MFIs Non- Total Central Regional Local corpora- tions corpora- mone- government (autono- gov- tions tions tary mous) ern- govern- ment ment
07 222 374 225 110 78 192 146 918 -4 362 -4 716 223 131 1 626 45 970 15 446 30 524 2 068 -22 008 08 131 104 77 860 -26 920 104 780 51 580 50 208 1 386 -14 1 665 14 803 11 443 3 360 - -69 535 09 189 597 61 471 39 562 21 910 128 017 119 397 8 760 -139 108 10 209 3 364 6 845 13 ... 10 70 538 -5 266 6 895 -12 161 76 551 63 228 13 437 -114 -747 15 474 7 396 8 077 538 ... 11 91 010 12 381 72 973 -60 592 77 588 69 927 8 083 -421 1 040 33 531 27 090 6 441 - ... 12 56 752 -9 482 59 130 -68 611 63 646 63 819 202 -374 2 588 30 169 29 120 1 049 - ...
12 J-J 24 938 9 160 19 437 -10 278 15 707 15 779 -72 - 71 956 635 321 - ... 13 J-J 1 181 -10 625 -7 725 -2 900 11 385 8 667 2 718 - 421 281 231 50 - ...
11 Nov 18 548 7 851 6 046 1 805 10 729 9 834 944 -48 -32 -43 -1 -42 - ... Dec 23 304 7 653 18 455 -10 802 15 575 16 152 -369 -208 76 6 483 6 489 -6 - ...
12 Jan 24 938 9 160 19 437 -10 278 15 707 15 779 -72 - 71 956 635 321 - ... Feb 37 717 26 888 30 445 -3 557 10 430 9 996 434 - 399 1 272 1 271 2 - ... Mar 12 821 4 889 4 450 439 7 580 5 418 2 162 - 352 2 016 2 113 -98 - ... Apr -25 680 -12 567 -3 656 -8 911 -13 074 -12 998 14 -90 -38 1 320 1 287 33 - ... May -5 561 -7 620 2 483 -10 102 2 282 3 512 -1 230 - -224 402 - 402 - ... Jun 6 263 3 648 26 875 -23 227 2 096 1 966 159 -30 519 7 146 6 909 237 - ... Jul -15 717 -8 411 15 088 -23 499 -7 095 -6 162 -933 - -210 5 443 5 306 137 - ... Aug -12 171 -14 182 3 452 -17 634 2 094 2 320 -226 - -83 670 796 -126 - ... Sep 11 237 -9 822 -9 703 -119 21 155 19 260 1 895 - -96 4 748 4 730 18 - ... Oct -7 851 -3 016 -3 374 358 -5 639 -4 755 -704 -180 805 2 847 2 794 52 - ... Nov 12 175 -6 746 -5 753 -992 17 698 18 022 -346 21 1 223 2 597 2 496 100 - ... Dec 18 582 8 299 -20 612 28 911 10 413 11 461 -952 -96 -131 753 783 -30 - ...
13 Jan 1 181 -10 625 -7 725 -2 900 11 385 8 667 2 718 - 421 281 231 50 - ...
1 2 3 4 5 6 7 8 9 10 11 12 13 14
21.PRIMARY MARKET FOR SECURITIES 21.2 Securities other than shares, excluding financial derivativesA) Total economy Shares
By sector and subsector of the issuer. Outstanding amountsEUR millions
Securities other than shares, excluding financial derivatives Quoted shares: excluding mutual Mutual funds Alternative Nominal values funds shares: Capitalisation shares equity
market: capitali-
Net asset sation Financial corporations General government value Non-finan- Total Financial Non-finan-
Total cial corpora- cial Total MFIs Non- Total Central Regional Local corpora- tions corpora- mone- government (autono- gov- tions tions tary mous) ern- govern- ment ment
07 1 291 346 940 533 431 124 509 409 337 995 304 103 31 299 2 593 12 818 788 974 218 695 570 279 256 054 31 635 08 1 420 630 1 016 076 402 661 613 415 390 102 354 739 32 785 2 579 14 452 478 594 124 369 354 225 180 835 24 735 09 1 611 052 1 078 573 442 673 635 901 517 914 473 897 41 577 2 440 14 565 547 900 180 811 367 089 ... 26 364 10 1 688 536 1 079 176 452 832 626 344 595 505 537 697 55 483 2 326 13 855 472 351 127 477 344 873 ... 27 421 11 1 781 276 1 093 055 526 380 566 675 673 303 607 717 63 682 1 904 14 918 421 585 132 917 288 668 ... 24 260 12 1 837 381 1 083 118 585 438 497 680 737 010 671 442 64 038 1 530 17 252 437 236 139 228 298 008 ... 24 356
11 Aug 1 715 431 1 059 738 475 387 584 351 641 098 576 797 62 106 2 196 14 595 429 846 132 334 297 512 ... 25 299 Sep 1 728 485 1 063 769 482 667 581 102 649 969 585 553 62 221 2 196 14 747 418 530 127 542 290 988 ... 25 106 Oct 1 735 236 1 073 894 500 431 573 463 646 500 581 350 62 990 2 160 14 843 438 578 132 539 306 038 ... 25 451 Nov 1 755 920 1 083 610 507 210 576 401 657 482 591 386 63 984 2 112 14 828 415 210 124 999 290 210 ... 24 243 Dec 1 781 276 1 093 055 526 380 566 675 673 303 607 717 63 682 1 904 14 918 421 585 132 917 288 668 ... 24 260
12 Jan 1 805 618 1 101 700 545 685 556 014 688 933 623 417 63 612 1 904 14 985 420 523 135 715 284 808 ... 24 753 Feb 1 842 108 1 127 559 575 723 551 837 699 182 633 287 63 990 1 904 15 367 421 330 136 458 284 871 ... 25 108 Mar 1 855 199 1 132 694 580 177 552 518 706 786 638 735 66 147 1 904 15 718 400 825 123 305 277 520 ... 25 091 Apr 1 830 453 1 120 956 576 830 544 126 693 809 625 799 66 195 1 814 15 688 358 120 108 476 249 644 ... 24 588 May 1 827 906 1 115 961 580 276 535 685 696 455 629 586 65 055 1 814 15 490 312 514 90 875 221 638 ... 23 863 Jun 1 833 393 1 118 939 606 927 512 013 698 451 631 481 65 186 1 784 16 002 363 360 109 832 253 528 ... 23 867 Jul 1 819 326 1 111 991 622 540 489 451 691 530 625 440 64 306 1 784 15 805 352 972 108 655 244 317 ... 24 189 Aug 1 805 792 1 096 610 625 599 471 012 693 470 627 644 64 043 1 784 15 711 385 733 128 148 257 585 ... 24 393 Sep 1 815 979 1 085 864 615 593 470 271 714 506 646 821 65 901 1 784 15 608 404 201 129 372 274 829 ... 24 748 Oct 1 807 662 1 082 445 612 081 470 364 708 811 642 036 65 171 1 604 16 406 415 573 131 877 283 696 ... 24 731 Nov 1 819 680 1 075 585 606 280 469 305 726 473 660 038 64 809 1 625 17 623 421 741 136 032 285 709 ... 24 821 Dec 1 837 381 1 083 118 585 438 497 680 737 010 671 442 64 038 1 530 17 252 437 236 139 228 298 008 ... 24 356
13 Jan 1 836 677 1 070 814 577 253 493 561 748 208 680 017 66 662 1 530 17 655 450 759 145 565 305 194 ... 24 891
BANCO DE ESPAÑA 364 BOLETÍN ESTADÍSTICO, FEBRUARY 2013

1 2 3 4 5 6 7 8 9 10 11 12
21.PRIMARY MARKET FOR SECURITIES 21.3 Securities other than shares, excluding financial derivativesA) Total economy Breakdown by sector of the issuer and maturity
Net issues Nominal values EUR millions
Total economy Financial corporations General government Non-financial corporations
Total Short- Long- Total Short- Long- Total Short- Long- Total Short- Long- term term term term term term term term
07 222 374 33 898 188 476 225 110 32 618 192 492 -4 362 1 427 -5 788 1 626 -146 1 772 08 131 104 -1 120 132 223 77 860 -21 503 99 362 51 580 20 059 31 520 1 665 323 1 341 09 189 597 17 806 171 791 61 471 -13 431 74 903 128 017 33 270 94 747 108 -2 033 2 141 10 70 538 -26 096 96 634 -5 266 -28 858 23 592 76 551 4 328 72 222 -747 -1 566 819 11 91 010 4 411 86 599 12 381 -2 241 14 623 77 588 6 417 71 171 1 040 236 805 12 56 752 8 002 48 750 -9 482 17 923 -27 405 63 646 -9 904 73 551 2 588 -17 2 605
12 J-J 24 938 5 167 19 771 9 160 6 184 2 976 15 707 -1 059 16 766 71 41 30 13 J-J 1 181 -1 876 3 057 -10 625 -4 697 -5 929 11 385 2 700 8 685 421 121 300
11 Nov 18 548 3 969 14 579 7 851 1 144 6 706 10 729 2 859 7 871 -32 -35 3 Dec 23 304 5 717 17 587 7 653 2 502 5 151 15 575 3 209 12 366 76 6 70
12 Jan 24 938 5 167 19 771 9 160 6 184 2 976 15 707 -1 059 16 766 71 41 30 Feb 37 717 1 313 36 403 26 888 5 549 21 339 10 430 -4 528 14 959 399 292 106 Mar 12 821 2 813 10 008 4 889 4 358 531 7 580 -1 773 9 353 352 228 124 Apr -25 680 -6 469 -19 211 -12 567 -735 -11 832 -13 074 -5 715 -7 359 -38 -18 -21 May -5 561 -4 021 -1 540 -7 620 -633 -6 987 2 282 -3 352 5 634 -224 -37 -187 Jun 6 263 -1 526 7 789 3 648 1 165 2 482 2 096 -2 569 4 665 519 -122 642 Jul -15 717 4 592 -20 308 -8 411 3 946 -12 357 -7 095 760 -7 855 -210 -114 -96 Aug -12 171 -2 965 -9 206 -14 182 -1 533 -12 649 2 094 -1 354 3 448 -83 -78 -5 Sep 11 237 4 811 6 426 -9 822 -3 464 -6 358 21 155 8 371 12 784 -96 -96 - Oct -7 851 -2 105 -5 745 -3 016 -2 535 -481 -5 639 476 -6 115 805 -46 851 Nov 12 175 857 11 317 -6 746 -1 692 -5 054 17 698 2 492 15 206 1 223 58 1 165 Dec 18 582 5 536 13 046 8 299 7 314 985 10 413 -1 651 12 065 -131 -126 -5
13 Jan 1 181 -1 876 3 057 -10 625 -4 697 -5 929 11 385 2 700 8 685 421 121 300
1 2 3 4 5 6 7 8 9 10 11 12
21.PRIMARY MARKET FOR SECURITIES 21.4 Securities other than shares, excluding financial derivativesA) Total economy Breakdown by sector of the issuer and maturity
Outstanding amounts Nominal values EUR millions
Total economy Financial corporations General government Non-financial corporations
Total Short- Long- Total Short- Long- Total Short- Long- Total Short- Long- term term term term term term term term
07 1 291 346 138 991 1 152 355 940 533 100 839 839 694 337 995 34 196 303 799 12 818 3 956 8 862 08 1 420 630 138 069 1 282 561 1 016 076 79 471 936 605 390 102 54 319 335 783 14 452 4 279 10 173 09 1 611 052 155 764 1 455 288 1 078 573 65 914 1 012 660 517 914 87 604 430 310 14 565 2 246 12 319 10 1 688 536 130 560 1 557 976 1 079 176 37 895 1 041 281 595 505 91 985 503 520 13 855 681 13 175 11 1 781 276 135 025 1 646 251 1 093 055 35 711 1 057 344 673 303 98 398 574 906 14 918 916 14 001 12 1 837 381 143 040 1 694 340 1 083 118 53 647 1 029 472 737 010 88 494 648 516 17 252 899 16 353
11 Aug 1 715 431 123 110 1 592 321 1 059 738 29 098 1 030 641 641 098 93 336 547 762 14 595 677 13 918 Sep 1 728 485 121 715 1 606 770 1 063 769 26 836 1 036 932 649 969 94 072 555 897 14 747 807 13 941 Oct 1 735 236 125 154 1 610 082 1 073 894 31 879 1 042 015 646 500 92 330 554 169 14 843 945 13 898 Nov 1 755 920 129 218 1 626 702 1 083 610 33 119 1 050 491 657 482 95 188 562 294 14 828 910 13 917 Dec 1 781 276 135 025 1 646 251 1 093 055 35 711 1 057 344 673 303 98 398 574 906 14 918 916 14 001
12 Jan 1 805 618 140 175 1 665 443 1 101 700 41 878 1 059 821 688 933 97 339 591 594 14 985 958 14 028 Feb 1 842 108 141 468 1 700 641 1 127 559 47 407 1 080 153 699 182 92 811 606 371 15 367 1 250 14 117 Mar 1 855 199 144 292 1 710 906 1 132 694 51 777 1 080 918 706 786 91 038 615 749 15 718 1 478 14 240 Apr 1 830 453 137 846 1 692 606 1 120 956 51 063 1 069 893 693 809 85 322 608 486 15 688 1 461 14 227 May 1 827 906 133 897 1 694 009 1 115 961 50 502 1 065 458 696 455 81 971 614 484 15 490 1 424 14 066 Jun 1 833 393 132 355 1 701 038 1 118 939 51 651 1 067 288 698 451 79 402 619 049 16 002 1 302 14 700 Jul 1 819 326 136 971 1 682 355 1 111 991 55 622 1 056 370 691 530 80 162 611 369 15 805 1 188 14 617 Aug 1 805 792 133 988 1 671 804 1 096 610 54 071 1 042 540 693 470 78 808 614 663 15 711 1 109 14 602 Sep 1 815 979 138 793 1 677 185 1 085 864 50 602 1 035 262 714 506 87 178 627 328 15 608 1 014 14 595 Oct 1 807 662 136 684 1 670 979 1 082 445 48 062 1 034 383 708 811 87 654 621 157 16 406 967 15 439 Nov 1 819 680 137 542 1 682 139 1 075 585 46 371 1 029 214 726 473 90 146 636 327 17 623 1 025 16 597 Dec 1 837 381 143 040 1 694 340 1 083 118 53 647 1 029 472 737 010 88 494 648 516 17 252 899 16 353
13 Jan 1 836 677 141 094 1 695 583 1 070 814 48 879 1 021 935 748 208 91 194 657 014 17 655 1 021 16 635
BANCO DE ESPAÑA 365 BOLETÍN ESTADÍSTICO, FEBRUARY 2013

1 2 3 4 5 6 7 8 9 10 11 12
21.PRIMARY MARKET FOR SECURITIES 21.5 Securities other than shares, excluding financial derivativesA) Total economy Long-term issues by sector of the issuer and type of coupon
Outstanding amounts Nominal values except zero coupon bonds, which are valued at effective amount paid EUR millions
of which
Total Financial corporations General government
Total Fixed Floating Zero Total Fixed Floating Zero Total Fixed Floating Zero coupon rate coupon coupon rate coupon coupon rate coupon
07 1 152 355 609 368 529 649 13 338 839 694 306 829 519 560 13 305 303 799 295 467 8 331 - 08 1 282 561 681 334 588 151 13 076 936 605 346 415 578 458 11 732 335 783 327 880 7 903 - 09 1 455 288 872 268 573 539 9 482 1 012 660 444 698 559 923 8 038 430 310 418 202 12 108 - 10 1 557 976 1 006 047 543 097 8 832 1 041 281 505 731 526 758 8 791 503 520 489 338 14 176 7 11 1 646 251 1 129 510 503 547 13 194 1 057 344 557 079 487 315 12 950 574 906 560 517 14 179 210 12 1 694 340 1 217 594 447 920 28 826 1 029 472 564 309 436 427 28 736 648 516 638 681 9 803 32
11 Aug 1 592 321 1 073 751 511 537 7 033 1 030 641 528 898 494 954 6 789 547 762 533 043 14 509 210 Sep 1 606 770 1 087 384 512 006 7 379 1 036 932 534 469 495 328 7 135 555 897 541 083 14 604 210 Oct 1 610 082 1 096 497 504 346 9 239 1 042 015 545 085 487 935 8 995 554 169 539 622 14 337 210 Nov 1 626 702 1 106 850 508 799 11 054 1 050 491 547 312 492 369 10 810 562 294 547 729 14 355 210 Dec 1 646 251 1 129 510 503 547 13 194 1 057 344 557 079 487 315 12 950 574 906 560 517 14 179 210
12 Jan 1 665 443 1 158 690 490 878 15 875 1 059 821 569 427 474 764 15 631 591 594 577 323 14 061 210 Feb 1 700 641 1 196 993 485 851 17 797 1 080 153 592 661 469 737 17 755 606 371 592 301 14 061 9 Mar 1 710 906 1 202 709 486 753 21 444 1 080 918 588 930 470 614 21 374 615 749 601 626 14 086 37 Apr 1 692 606 1 185 965 483 870 22 771 1 069 893 579 353 467 838 22 701 608 486 594 453 13 997 37 May 1 694 009 1 189 823 480 087 24 098 1 065 458 577 375 464 055 24 028 614 484 600 451 13 997 37 Jun 1 701 038 1 193 001 482 171 25 866 1 067 288 574 595 466 893 25 800 619 049 605 031 13 986 32 Jul 1 682 355 1 183 024 471 776 27 555 1 056 370 572 690 456 189 27 490 611 369 597 446 13 891 32 Aug 1 671 804 1 183 531 459 608 28 665 1 042 540 569 819 444 121 28 600 614 663 600 836 13 795 32 Sep 1 677 185 1 192 429 455 293 29 463 1 035 262 566 857 439 008 29 398 627 328 612 702 14 594 32 Oct 1 670 979 1 194 324 447 606 29 048 1 034 383 568 836 436 589 28 958 621 157 611 799 9 325 32 Nov 1 682 139 1 206 983 446 446 28 709 1 029 214 565 176 435 419 28 619 636 327 626 960 9 336 32 Dec 1 694 340 1 217 594 447 920 28 826 1 029 472 564 309 436 427 28 736 648 516 638 681 9 803 32
13 Jan 1 695 583 1 231 559 435 492 28 532 1 021 935 569 505 423 988 28 442 657 014 647 168 9 814 32
1 2 3 4 5 6 7 8 9 10 11 12 13 14
21.PRIMARY MARKET FOR SECURITIES 21.6 Securities other than shares, excluding financial derivativesB) Financial corporations Breakdown by sector of the issuer and maturity
Net issues
Greek drachma-denominated issues have been included under euro since January 2001. Note: Euro-denominated issues include, historically, all issues denominated in euro or national denominations of the euro.
Nominal values EUR millions Other financial intermediaries, Monetary financial institutions except insurance corporations and Insur- pension funds ance corpora-
Total Short-term Long-term of which tions Total Total Short- Long- and term term Financial Prefer. pension Total Euro Other Total Euro Other Vehicle shares funds curren- curren- Corporation and cies cies (securi- bonds Law tization) 19/2003
07 225 110 78 192 36 065 30 416 5 650 42 127 34 391 7 736 146 918 -3 447 150 365 111 671 36 413 - 08 77 860 -26 920 -33 842 -31 058 -2 783 6 921 4 500 2 422 104 810 12 339 92 471 92 288 -945 -30 09 61 471 39 562 -18 849 -19 755 906 58 411 58 034 377 21 925 5 418 16 507 15 633 678 -15 10 -5 266 6 895 -21 593 -19 234 -2 359 28 488 30 838 -2 350 -12 161 -7 265 -4 895 -6 282 1 468 - 11 12 381 72 973 6 475 8 100 -1 625 66 498 73 522 -7 023 -60 592 -8 717 -51 875 -44 872 -6 064 - 12 -9 482 59 130 7 416 8 176 -759 51 713 58 643 -6 930 -68 461 10 507 -78 969 -99 038 -11 184 -150
12 J-J 9 160 19 437 4 149 4 206 -58 15 289 15 535 -247 -10 278 2 035 -12 313 -12 011 -1 227 - 13 J-J -10 625 -7 725 -4 747 -4 771 23 -2 978 -2 535 -443 -2 900 51 -2 951 -4 030 1 379 -
11 Nov 7 851 6 046 2 306 2 291 15 3 740 4 867 -1 128 1 805 -1 162 2 967 2 774 193 - Dec 7 653 18 455 3 786 4 919 -1 133 14 669 15 743 -1 073 -10 802 -1 284 -9 518 -4 558 -6 025 -
12 Jan 9 160 19 437 4 149 4 206 -58 15 289 15 535 -247 -10 278 2 035 -12 313 -12 011 -1 227 - Feb 26 888 30 445 4 475 4 150 325 25 970 26 117 -147 -3 557 1 074 -4 631 -4 736 105 - Mar 4 889 4 450 4 519 4 456 63 -69 425 -495 439 -161 600 -2 319 1 018 - Apr -12 567 -3 656 -492 -222 -270 -3 164 -2 952 -212 -8 911 -243 -8 668 -4 831 -3 737 - May -7 620 2 483 702 878 -176 1 780 2 343 -562 -9 952 -1 335 -8 617 -6 516 -1 926 -150 Jun 3 648 26 875 2 380 2 607 -227 24 495 25 957 -1 462 -23 227 -1 215 -22 013 -16 890 -5 423 - Jul -8 411 15 088 4 590 4 797 -207 10 498 11 786 -1 288 -23 499 -644 -22 855 -17 573 -5 282 - Aug -14 182 3 452 -810 -399 -411 4 262 4 266 -4 -17 634 -723 -16 911 -12 845 -4 066 - Sep -9 822 -9 703 -3 386 -3 573 187 -6 317 -4 852 -1 465 -119 -78 -41 -5 310 5 269 - Oct -3 016 -3 374 -3 665 -3 650 -15 291 1 296 -1 005 358 1 130 -772 -3 146 2 648 - Nov -6 746 -5 753 -1 622 -1 637 15 -4 131 -4 131 - -992 -70 -922 -2 173 450 - Dec 8 299 -20 612 -3 422 -3 437 15 -17 190 -17 148 -42 28 911 10 736 18 175 -10 689 986 -
13 Jan -10 625 -7 725 -4 747 -4 771 23 -2 978 -2 535 -443 -2 900 51 -2 951 -4 030 1 379 -
BANCO DE ESPAÑA 366 BOLETÍN ESTADÍSTICO, FEBRUARY 2013

1 2 3 4 5 6 7 8 9 10 11 12 13 14
21.PRIMARY MARKET FOR SECURITIES 21.7 Securities other than shares, excluding financial derivativesB) Financial corporations Breakdown by sector of the issuer and maturity
Outstanding amounts
Greek drachma-denominated issues have been included under euro since January 2001. Note: Euro-denominated issues include, historically, all issues denominated in euro or national denominations of the euro.
Nominal values EUR millions Other financial intermediaries, Monetary financial institutions except insurance corporations and Insur- pension funds ance corpora-
Total Short-term Long-term of which tions Total Total Short- Long- and term term Financial Prefer. pension Total Euro Other Total Euro Other Vehicle shares funds curren- curren- Corporation and bonds cies cies (securi- Law tization) 19/2003
07 940 533 431 124 97 471 91 063 6 408 333 652 308 627 25 025 509 068 3 368 505 701 349 814 151 255 341 08 1 016 076 402 661 63 593 60 005 3 588 339 068 313 124 25 944 613 104 15 878 597 227 442 106 149 361 311 09 1 078 573 442 673 44 576 40 250 4 326 398 096 371 157 26 939 635 605 21 337 614 268 457 736 150 575 296 10 1 079 176 452 832 23 492 21 016 2 476 429 340 401 995 27 345 626 048 14 403 611 645 451 458 154 312 296 11 1 093 055 526 380 30 055 29 117 938 496 325 475 516 20 809 566 379 5 656 560 723 406 587 149 201 296 12 1 083 118 585 438 37 513 37 292 221 547 925 534 159 13 766 497 534 16 134 481 400 307 548 137 664 146
11 Aug 1 059 738 475 387 19 755 18 048 1 707 455 632 433 932 21 700 584 055 9 343 574 713 418 022 152 868 296 Sep 1 063 769 482 667 18 547 16 768 1 779 464 119 441 655 22 464 580 806 8 289 572 517 413 770 154 902 296 Oct 1 073 894 500 431 23 814 21 907 1 907 476 617 454 907 21 710 573 167 8 065 565 102 408 369 152 863 296 Nov 1 083 610 507 210 26 197 24 198 1 999 481 013 459 774 21 239 576 105 6 922 569 183 411 144 154 169 296 Dec 1 093 055 526 380 30 055 29 117 938 496 325 475 516 20 809 566 379 5 656 560 723 406 587 149 201 296
12 Jan 1 101 700 545 685 34 192 33 323 868 511 494 491 052 20 442 555 718 7 687 548 032 394 575 147 596 296 Feb 1 127 559 575 723 38 652 37 473 1 178 537 071 517 169 19 902 551 541 8 755 542 786 389 838 147 087 296 Mar 1 132 694 580 177 43 180 41 929 1 251 536 996 517 594 19 402 552 222 8 596 543 625 387 520 148 345 296 Apr 1 120 956 576 830 42 705 41 707 997 534 125 514 643 19 482 543 830 8 359 535 471 382 689 145 122 296 May 1 115 961 580 276 43 461 42 585 876 536 814 516 985 19 829 535 539 7 041 528 498 376 175 144 838 146 Jun 1 118 939 606 927 45 829 45 192 637 561 098 542 942 18 156 511 867 5 822 506 045 359 285 138 975 146 Jul 1 111 991 622 540 50 436 49 989 446 572 104 554 728 17 376 489 305 5 186 484 119 341 712 134 622 146 Aug 1 096 610 625 599 49 614 49 590 24 575 985 558 994 16 991 470 866 4 457 466 409 328 867 129 757 146 Sep 1 085 864 615 593 46 227 46 017 210 569 365 554 142 15 223 470 125 4 374 465 751 323 556 134 410 146 Oct 1 082 445 612 081 42 560 42 367 194 569 520 555 438 14 082 470 218 5 502 464 716 320 410 136 796 146 Nov 1 075 585 606 280 40 938 40 729 209 565 342 551 307 14 035 469 159 5 432 463 726 318 237 137 179 146 Dec 1 083 118 585 438 37 513 37 292 221 547 925 534 159 13 766 497 534 16 134 481 400 307 548 137 664 146
13 Jan 1 070 814 577 253 32 760 32 521 239 544 493 531 625 12 869 493 415 16 119 477 295 303 517 137 890 146
1 2 3 4 5 6 7 8 9 10 11 12 13 14 15
21.PRIMARY MARKET FOR SECURITIES 21.8 Euro-denominated securities other than shares, excluding financialB) Financial corporations derivatives. Monetary financial institutions. Breakdown by instrument
Net issues, gross issues and redemptions
Greek drachma-denominated issues have been included under euro since January 2001. Note: Euro-denominated issues include, historically, all issues denominated in euro or national denominations of the euro.
Nominal values EUR millions Long-term
Short-term Total Mortgage backed securities Subordinated bonds Other securities
Net Gross Redemp- Net Gross Redemp- Net Gross Redemp- Net Gross Redemp- Net Gross Redemp- issues issues tions issues issues tions issues issues tions issues issues tions issues issues tions
06 14 037 320 687 306 650 75 589 95 854 20 265 43 149 44 249 1 100 5 769 6 852 1 083 26 671 44 753 18 083 07 30 416 428 631 398 216 34 391 67 387 32 996 19 323 25 347 6 024 -513 1 823 2 336 15 581 40 217 24 636 08 -31 058 310 989 342 047 4 500 39 918 35 418 16 703 19 547 2 844 -902 1 577 2 478 -11 302 18 794 30 096 09 -19 755 197 675 217 430 58 034 109 094 51 060 17 171 29 881 12 710 10 534 13 410 2 877 30 329 65 803 35 474 10 -19 234 118 573 137 807 30 838 89 535 58 697 13 263 35 824 22 561 9 862 14 202 4 339 7 713 39 509 31 797 11 8 100 109 249 101 149 73 522 143 974 70 452 42 512 66 741 24 229 -452 7 234 7 687 31 462 69 998 38 537
11 J-D 8 100 109 249 101 149 73 522 143 974 70 452 42 512 66 741 24 229 -452 7 234 7 687 31 462 69 998 38 537 12 J-D 8 176 111 651 103 475 58 643 205 698 147 055 54 118 103 370 49 252 -12 828 7 778 20 606 17 353 94 550 77 198
11 Nov 2 291 9 212 6 921 4 867 8 533 3 666 4 785 5 005 220 203 242 39 -121 3 286 3 407 Dec 4 919 14 297 9 378 15 743 25 767 10 024 2 293 8 164 5 872 4 462 4 938 476 8 988 12 665 3 676
12 Jan 4 206 14 628 10 421 15 535 23 050 7 514 10 090 10 150 60 -691 - 691 6 137 12 900 6 763 Feb 4 150 11 938 7 787 26 117 45 078 18 960 3 354 10 342 6 987 2 834 4 820 1 986 19 929 29 916 9 987 Mar 4 456 14 029 9 573 425 16 039 15 614 2 796 6 108 3 313 -76 - 76 -2 294 9 931 12 225 Apr -222 11 069 11 291 -2 952 11 770 14 722 500 1 000 500 -1 574 1 109 2 684 -1 877 9 661 11 538 May 878 8 166 7 288 2 343 13 765 11 422 5 900 8 100 2 200 -154 657 810 -3 404 5 008 8 412 Jun 2 607 11 840 9 233 25 957 43 155 17 199 29 180 29 650 470 -6 137 1 192 7 329 2 913 12 313 9 400 Jul 4 797 12 654 7 856 11 786 17 799 6 012 13 971 14 500 529 -387 - 387 -1 798 3 299 5 097 Aug -399 5 932 6 331 4 266 8 054 3 788 6 500 6 500 - -1 365 - 1 365 -868 1 554 2 422 Sep -3 573 4 941 8 514 -4 852 5 425 10 277 -2 850 3 400 6 250 -672 - 672 -1 330 2 025 3 355 Oct -3 650 6 569 10 218 1 296 6 535 5 239 1 990 3 920 1 930 -548 - 548 -147 2 615 2 761 Nov -1 637 5 187 6 824 -4 131 5 637 9 768 -2 950 3 650 6 600 -761 - 761 -420 1 987 2 407 Dec -3 437 4 701 8 138 -17 148 9 392 26 540 -14 363 6 050 20 413 -3 297 - 3 297 513 3 342 2 830
BANCO DE ESPAÑA 367 BOLETÍN ESTADÍSTICO, FEBRUARY 2013

1 2 3 4 5 6 7 8
21.PRIMARY MARKET FOR SECURITIES 21.9 Euro-denominated securites other than shares,B) Financial corporations excluding financial derivatives. Monetary financial institutions
Breakdown by instrument. Outstanding amounts
(a) Including official credit entities until June 1994, when their status was changed to that of banks. Since that date they have been included in banks. Greek drachma-denominated issues have been included under euro since January 2001. Nota: Euro-denominated issues include, historically, all issues denominated in euro or national denominations of the euro.
Nominal values EUR millions Long-term
Total Short-term of which Total Mortgage Subordinated backed bonds Other securities securities Territorial Official covered credit bonds institute (a)
06 334 884 60 646 274 238 132 353 28 546 113 339 12 245 7 637 07 399 690 91 063 308 627 151 676 28 033 128 918 17 005 11 475 08 373 129 60 005 313 124 168 379 27 131 117 613 17 130 13 844 09 411 408 40 250 371 157 185 550 37 665 147 943 16 216 17 388 10 423 011 21 016 401 995 198 813 47 527 155 655 18 536 28 584 11 504 633 29 117 475 516 241 325 47 075 187 117 34 553 47 317
11 Jul 450 129 19 123 431 005 222 735 44 143 164 128 21 654 42 356 Aug 451 979 18 048 433 932 222 735 44 108 167 089 24 318 42 573 Sep 458 423 16 768 441 655 224 775 44 098 172 782 30 081 42 935 Oct 476 813 21 907 454 907 234 247 42 410 178 249 33 253 44 867 Nov 483 971 24 198 459 774 239 032 42 613 178 129 32 053 45 367 Dec 504 633 29 117 475 516 241 325 47 075 187 117 34 553 47 317
12 Jan 524 375 33 323 491 052 251 415 46 384 193 254 31 811 53 478 Feb 554 642 37 473 517 169 254 769 49 217 213 183 32 486 57 182 Mar 559 524 41 929 517 594 257 565 49 141 210 888 33 186 56 807 Apr 556 350 41 707 514 643 258 065 47 567 209 011 33 551 56 832 May 559 571 42 585 516 985 263 965 47 413 205 608 33 936 55 682 Jun 588 134 45 192 542 942 293 145 41 276 208 521 36 010 56 022 Jul 604 717 49 989 554 728 307 116 40 889 206 723 37 458 54 387 Aug 608 584 49 590 558 994 313 616 39 524 205 854 35 658 54 658 Sep 600 160 46 017 554 142 310 766 38 852 204 524 33 580 55 576 Oct 597 805 42 367 555 438 312 756 38 305 204 377 33 522 57 205 Nov 592 036 40 729 551 307 309 806 37 544 203 957 33 397 57 705 Dec 571 451 37 292 534 159 295 443 34 247 204 470 33 314 59 255
1 2 3 4 5 6 7 8 9 10 11 12 13 14
21.PRIMARY MARKET FOR SECURITIES 21.10 SharesB) Financial corporations Breakdown by sector of the issuer
Net issues, public offerings and outstanding amountsEUR millions
Net issues Outstanding amounts (market prices) Public offerings
Shares, excluding mutual funds shares Mutual funds Quoted shares, Mutual funds shares excluding mutual shares Quoted Unquoted funds shares
Total of which of which of which of which of which of which of which Total Total Total Total Total Total OMFIs OMFIs OMFIs OMFIs OMFIs OMFIs OMFIs
07 15 446 11 957 7 146 3 698 8 299 8 258 -22 008 -106 - - 218 695 205 201 256 054 - 08 11 443 10 048 10 668 9 292 775 756 -69 535 -8 995 - - 124 369 114 502 180 835 ... 09 3 364 3 000 2 648 2 328 716 672 ... ... - - 180 811 168 497 ... ... 10 7 396 7 306 5 784 5 605 1 612 1 701 ... ... - - 127 477 118 176 ... ... 11 27 090 26 885 10 526 10 335 16 564 16 550 ... ... - - 132 917 122 130 ... ... 12 29 120 29 129 19 802 19 802 9 548 9 557 ... ... - - 139 228 128 813 ... ...
11 Aug 2 722 2 714 - - 2 722 2 714 ... ... - - 132 334 121 522 ... ... Sep 2 695 2 702 2 2 2 694 2 700 ... ... - - 127 542 117 171 ... ... Oct 2 461 2 461 8 8 2 453 2 453 ... ... - - 132 539 121 005 ... ... Nov -1 - - - -1 - ... ... - - 124 999 114 247 ... ... Dec 6 489 6 498 1 949 1 949 4 540 4 549 ... ... - - 132 917 122 130 ... ...
12 Jan 635 636 636 636 -1 - ... ... - - 135 715 124 500 ... ... Feb 1 271 1 271 1 271 1 271 - - ... ... - - 136 458 125 265 ... ... Mar 2 113 2 117 1 807 1 807 306 310 ... ... - - 123 305 112 713 ... ... Apr 1 287 1 287 1 287 1 287 - - ... ... - - 108 476 98 999 ... ... May - - - - - - ... ... - - 90 875 83 732 ... ... Jun 6 909 6 909 3 672 3 672 4 474 4 474 ... ... - - 109 832 102 170 ... ... Jul 5 306 5 307 4 071 4 071 -1 - ... ... - - 108 655 101 479 ... ... Aug 796 798 798 798 -3 - ... ... - - 128 148 119 162 ... ... Sep 4 730 4 733 190 190 4 540 4 543 ... ... - - 129 372 119 795 ... ... Oct 2 794 2 801 2 801 2 801 223 230 ... ... - - 131 877 122 304 ... ... Nov 2 496 2 501 2 501 2 501 -4 - ... ... - - 136 032 126 449 ... ... Dec 783 769 769 769 14 - ... ... - - 139 228 128 813 ... ...
13 Jan 231 231 231 231 - - ... ... - - 145 565 134 870 ... ...
BANCO DE ESPAÑA 368 BOLETÍN ESTADÍSTICO, FEBRUARY 2013

1 2 3 4 5 6 7 8 9 10 11 12 13 14
21.PRIMARY MARKET FOR SECURITIES 21.11 Securities other than shares, excluding financial derivativesC) General government Central government
Breakdown by instrument. Net issues
(b) Includes securities issued before 1977 and perpetual debt redeemed or exchanged in 1998. (a) Includes debt qualifying for tax relief issued as from 1977 and redeemed in 1991. Note: Euro-denominated issues include, historically, all issues denominated in euro or national denominations of the euro.
Nominal values EUR millions Short-term Long-term
Total Euro Other currencies Total Treasury Commer- Assu- Total bills cial med and paper debt Total Medium- Long- Euro- Assumed Total Bonds Euro- notes term term notes debt notes bonds bonds (a) (b)
07 -4 716 1 144 1 144 - - -5 860 -5 737 -15 853 10 116 - - -123 - -123 08 50 208 19 630 19 630 - - 30 578 29 363 10 652 19 011 - -301 1 215 -951 2 166 09 119 397 33 439 33 439 - - 85 958 84 487 38 926 45 620 - -60 1 472 - 1 472 10 63 228 4 244 4 244 - - 58 984 59 652 25 858 33 831 - -36 -668 -67 -601 11 69 927 851 851 - - 69 076 70 478 41 653 28 825 - - -1 402 - -1 402 12 63 819 -5 995 -5 995 - - 69 814 72 520 45 564 26 955 - - -2 706 - -2 706
12 J-J 15 779 -1 025 -1 025 - - 16 804 16 804 11 495 5 309 - - - - - 13 J-J 8 667 3 333 3 333 - - 5 334 5 334 11 547 -6 213 - - - - -
11 Nov 9 834 223 223 - - 9 611 9 611 5 280 4 330 - - - - - Dec 16 152 2 244 2 244 - - 13 908 13 908 3 442 10 466 - - - - -
12 Jan 15 779 -1 025 -1 025 - - 16 804 16 804 11 495 5 309 - - - - - Feb 9 996 -4 554 -4 554 - - 14 550 14 550 8 622 5 929 - - - - - Mar 5 418 -2 179 -2 179 - - 7 597 8 355 6 322 2 033 - - -758 - -758 Apr -12 998 -5 578 -5 578 - - -7 419 -7 419 -9 850 2 431 - - - - - May 3 512 -1 958 -1 958 - - 5 470 5 470 3 374 2 096 - - - - - Jun 1 966 -2 869 -2 869 - - 4 835 4 835 3 518 1 317 - - - - - Jul -6 162 768 768 - - -6 930 -6 930 3 573 -10 504 - - - - - Aug 2 320 -1 223 -1 223 - - 3 544 3 544 1 226 2 318 - - - - - Sep 19 260 7 376 7 376 - - 11 884 13 833 10 401 3 432 - - -1 949 - -1 949 Oct -4 755 494 494 - - -5 249 -5 249 -9 581 4 332 - - - - - Nov 18 022 5 227 5 227 - - 12 795 12 795 9 537 3 258 - - - - - Dec 11 461 -472 -472 - - 11 933 11 933 6 929 5 004 - - - - -
13 Jan 8 667 3 333 3 333 - - 5 334 5 334 11 547 -6 213 - - - - -
1 2 3 4 5 6 7 8 9 10 11 12 13 14
21.PRIMARY MARKET FOR SECURITIES 21.12 Securities other than shares, excluding financial derivativesC) General government Central government
Breakdown by instrument. Outstanding amounts
(b) Includes securities issued before 1977 and perpetual debt redeemed or exchanged in 1998. (a) Includes debt qualifying for tax relief issued as from 1977 and redeemed in 1991. according to the methodology of the excessive-deficit procedure, and the data in this table. See note to table 12.9. This note explains the relationship between debt in securities other than shares issued by Central Government compiled, Note: Euro-denominated issues include, historically, all issues denominated in euro or national denominations of the euro.
Nominal values EUR millions Short-term Long-term
Total Euro Other currencies Total Treasury Commer- Assu- Total bills cial med and paper debt Total Medium- Long- Euro- Assumed Total Bonds Euro- notes term term notes debt notes bonds bonds (a) (b)
07 304 103 32 444 32 444 - - 271 659 268 041 51 524 215 964 - 553 3 617 1 101 2 517 08 354 739 52 074 52 074 - - 302 665 297 404 62 176 234 976 - 252 5 261 63 5 198 09 473 897 85 513 85 513 - - 388 384 381 890 101 102 280 596 - 192 6 493 68 6 426 10 537 697 89 756 89 756 - - 447 940 441 543 126 960 314 427 - 156 6 398 - 6 398 11 607 717 90 608 90 608 - - 517 109 512 020 168 613 343 252 - 156 5 089 - 5 089 12 671 442 84 613 84 613 - - 586 829 584 540 214 177 370 207 - 156 2 289 - 2 289
11 Aug 576 797 89 056 89 056 - - 487 741 483 166 148 458 334 552 - 156 4 575 - 4 575 Sep 585 553 89 793 89 793 - - 495 760 490 878 152 079 338 642 - 156 4 882 - 4 882 Oct 581 350 88 141 88 141 - - 493 209 488 502 159 890 328 455 - 156 4 707 - 4 707 Nov 591 386 88 364 88 364 - - 503 022 498 113 165 171 332 786 - 156 4 910 - 4 910 Dec 607 717 90 608 90 608 - - 517 109 512 020 168 613 343 252 - 156 5 089 - 5 089
12 Jan 623 417 89 582 89 582 - - 533 835 528 825 180 107 348 561 - 156 5 010 - 5 010 Feb 633 287 85 028 85 028 - - 548 259 543 375 188 729 354 490 - 156 4 884 - 4 884 Mar 638 735 82 849 82 849 - - 555 886 551 730 195 050 356 523 - 156 4 157 - 4 157 Apr 625 799 77 270 77 270 - - 548 529 544 311 185 200 358 954 - 156 4 218 - 4 218 May 629 586 75 312 75 312 - - 554 273 549 781 188 574 361 050 - 156 4 493 - 4 493 Jun 631 481 72 444 72 444 - - 559 037 554 616 192 093 362 367 - 156 4 421 - 4 421 Jul 625 440 73 212 73 212 - - 552 229 547 685 195 666 351 863 - 156 4 543 - 4 543 Aug 627 644 71 988 71 988 - - 555 655 551 229 196 892 354 181 - 156 4 426 - 4 426 Sep 646 821 79 364 79 364 - - 567 457 565 062 207 293 357 613 - 156 2 395 - 2 395 Oct 642 036 79 858 79 858 - - 562 178 559 813 197 712 361 945 - 156 2 365 - 2 365 Nov 660 038 85 085 85 085 - - 574 953 572 608 207 248 365 203 - 156 2 346 - 2 346 Dec 671 442 84 613 84 613 - - 586 829 584 540 214 177 370 207 - 156 2 289 - 2 289
13 Jan 680 017 87 946 87 946 - - 592 070 589 875 225 724 363 995 - 156 2 196 - 2 196
BANCO DE ESPAÑA 369 BOLETÍN ESTADÍSTICO, FEBRUARY 2013

1 2 3 4 5 6 7 8 9 10 11 12 13
21.PRIMARY MARKET FOR SECURITIES 21.13 Securities other than shares, excluding financial derivativesC) General governmet Central government
Outstanding amounts by term to maturity Nominal values EUR millions
Term to maturity
Total Up to 1 year 1- 2 years out- 2 - 3 3 - 4 4 - 5 5 -10 Over Perpe- stand- Total Treasury Total Treasury years years years years years tual ing bills,notes, Bonds bills and Bonds debt
amounts commercial and notes and and paper and euronotes commercial euronotes assumed debt paper
01 298 404 53 382 28 526 24 856 45 970 7 058 38 912 29 060 29 581 17 012 81 799 41 600 - 02 304 684 65 661 29 473 36 189 38 335 6 358 31 977 29 670 20 956 11 277 92 204 46 580 - 03 303 802 63 436 32 520 30 915 35 370 6 246 29 124 31 287 17 847 22 473 93 224 40 165 - 04 310 083 58 565 30 015 28 550 39 444 7 097 32 347 26 706 21 307 29 927 86 636 47 498 - 05 314 504 57 756 26 907 30 850 39 104 6 387 32 717 21 157 32 159 23 312 88 457 52 559 - 06 309 205 56 062 25 077 30 985 36 587 6 224 30 363 32 536 28 524 24 962 74 356 56 178 - 07 304 103 64 357 32 444 31 912 32 416 - 32 416 29 899 24 962 23 596 86 948 41 925 - 08 354 739 84 549 52 074 32 475 35 713 - 35 713 41 941 25 386 28 246 87 650 51 253 -
09 Q1 385 035 95 784 63 339 32 446 18 471 - 18 471 46 935 43 874 25 158 85 393 69 419 - Q2 418 327 103 000 70 675 32 326 32 469 - 32 469 41 696 42 259 27 597 87 530 83 775 - Q3 441 052 115 248 78 544 36 704 32 402 - 32 402 43 243 48 569 26 624 94 521 80 445 - Q4 473 897 121 206 85 513 35 693 46 517 - 46 517 49 455 39 198 41 075 101 941 74 505 -
10 Q1 485 008 97 384 78 923 18 461 53 558 4 866 48 692 61 829 40 655 49 260 90 407 91 916 - Q2 503 336 105 253 72 677 32 576 56 000 10 082 45 918 66 032 31 500 56 694 101 307 86 550 - Q3 515 952 110 770 78 269 32 501 54 281 10 364 43 917 65 907 34 027 49 528 101 292 100 147 - Q4 537 697 129 101 82 475 46 626 57 547 7 281 50 265 59 965 41 205 34 948 117 786 97 146 -
11 Q1 573 002 129 160 80 582 48 578 70 281 8 087 62 194 62 131 50 406 35 504 113 235 112 286 - Q2 584 040 130 012 84 463 45 549 72 866 6 928 65 938 56 187 68 074 28 652 121 294 106 955 - Q3 585 553 126 336 82 431 43 905 73 284 7 362 65 922 59 088 55 828 31 898 131 161 107 957 - Q4 607 717 134 601 84 711 49 890 72 020 5 897 66 123 67 582 39 508 43 583 137 870 112 553 -
12 Q1 638 735 135 601 73 616 61 985 80 756 9 232 71 523 70 451 53 246 50 893 138 506 109 281 - Q2 631 481 131 887 65 809 66 078 76 335 6 634 69 700 81 146 53 926 36 600 142 281 109 306 - Q3 646 821 141 712 73 658 68 054 75 610 5 706 69 904 86 138 46 947 56 718 130 387 109 309 - Q4 671 442 144 086 77 993 66 093 83 604 6 620 76 983 80 863 65 798 46 863 139 555 110 674 -
1 2 3 4 5 6 7 8 9 10 11
21.PRIMARY MARKET FOR SECURITIES 21.14 Securities other than shares, excluding financial derivativesC) General government Central government
Average outstanding term
(a) Euronotes and commercial paper are not included until 1996 Q1. Note: Euro-denominated issues include, historically, all issues denominated in euro or national denominations of the euro.
Years Long-term Short-term In euro In other currencies
Total Total Issued by the Central Goverment Issued by the Central Government Total Treasury Commer- Assum- Assumed bills and cial ed debt notes paper debt Bonds Euronotes Bonds Euronotes (a) (a) (a)
01 5.88 0.65 0.65 - ... 6.59 6.70 - 2.82 3.64 8.45 02 5.91 0.64 0.64 - ... 6.61 6.72 - 2.66 3.01 7.76 03 6.00 0.61 0.61 - ... 6.79 6.92 - 3.33 1.99 7.26 04 6.16 0.69 0.69 - 0.50 6.90 6.98 - 6.12 1.58 7.81 05 6.61 0.69 0.69 - - 7.31 7.38 - 5.59 1.69 6.10 06 6.69 0.71 0.71 - - 7.36 7.41 - 6.27 1.65 5.32 07 6.82 0.50 0.50 - - 7.58 7.64 - 5.58 0.65 4.59 08 6.58 0.53 0.53 - - 7.62 7.69 - 10.19 1.50 3.59
09 Q1 6.79 0.51 0.51 - - 8.03 8.12 - 9.94 0.50 3.43 Q2 6.67 0.46 0.46 - - 7.93 8.01 - 12.73 0.50 3.19 Q3 6.74 0.44 0.44 - - 8.11 8.22 - 12.48 0.50 2.75 Q4 6.44 0.42 0.42 - - 7.77 7.85 - 12.23 0.50 3.11
10 Q1 6.79 0.49 0.49 - - 8.10 8.19 - 11.98 ... 2.84 Q2 6.67 0.55 0.55 - - 7.88 7.97 - 11.73 ... 2.60 Q3 6.75 0.56 0.56 - - 8.04 8.11 - 14.18 ... 2.70 Q4 6.62 0.53 0.53 - - 7.84 7.91 - 13.93 ... 2.94
11 Q1 6.58 0.55 0.55 - - 7.69 7.75 - 13.68 ... 2.70 Q2 6.57 0.55 0.55 - - 7.69 7.75 - 13.43 ... 2.48 Q3 6.55 0.52 0.52 - - 7.64 7.69 - 13.18 ... 2.98 Q4 6.42 0.48 0.48 - - 7.46 7.51 - 12.93 ... 2.71
12 Q1 6.26 0.52 0.52 - - 7.12 7.15 - 12.68 ... 2.89 Q2 6.21 0.52 0.52 - - 6.95 6.98 - 12.43 ... 2.65 Q3 6.01 0.51 0.51 - - 6.78 6.79 - 12.18 ... 4.46 Q4 5.88 0.51 0.51 - - 6.66 6.67 - 11.92 ... 4.09
BANCO DE ESPAÑA 370 BOLETÍN ESTADÍSTICO, FEBRUARY 2013

1 2 3 4 5 6 7 8 9 10 11 12 13 14 15
21.PRIMARY MARKET FOR SECURITIES 21.15 Euro-denominated securities other than sharesC) General government excluding financial derivatives. Central government
Net issues, gross issues and redemptions
(b) Includes securities issued before 1977 and perpetual debt redeemed or exchanged in 1998. (a) Includes debt qualifying for tax relief issued as from 1977 and redeemed in 1991. Note: Euro-denominated issues include, historically, all issues denominated in euro or national denominations of the euro.
Nominal values EUR millions Long-term
Short-term Treasury bills and notes, of which commercial paper and Total
assumed debt Medium-term bonds (a) Long-term bonds (b) Assumed debt
Net Gross Redemp- Net Gross Redemp- Net Gross Redemp- Net Gross Redemp- Net Gross Redemp- issues issues tions issues issues tions issues issues tions issues issues tions issues issues tions
07 1 144 26 971 25 827 -5 737 25 120 30 857 -15 853 10 460 26 313 10 116 14 660 4 544 - - - 08 19 630 52 657 33 027 29 363 59 953 30 590 10 652 23 647 12 995 19 011 36 306 17 294 -301 - 301 09 33 439 109 999 76 560 84 487 115 884 31 397 38 926 53 534 14 608 45 620 62 349 16 729 -60 - 60 10 4 244 114 660 110 417 59 652 94 963 35 311 25 858 43 921 18 063 33 831 51 042 17 212 -36 - 36 11 851 101 843 100 992 70 478 116 067 45 589 41 653 57 656 16 003 28 825 58 411 29 587 - - - 12 -5 995 99 499 105 494 72 520 119 705 47 185 45 564 77 929 32 364 26 955 41 776 14 821 - - -
12 J-J -1 025 7 586 8 611 16 804 16 824 20 11 495 11 515 20 5 309 5 309 - - - - 13 J-J 3 333 8 889 5 556 5 334 19 620 14 286 11 547 11 547 - -6 213 8 073 14 286 - - -
11 Nov 223 6 427 6 204 9 611 9 611 - 5 280 5 280 - 4 330 4 330 - - - - Dec 2 244 11 526 9 282 13 908 13 928 20 3 442 3 462 20 10 466 10 466 - - - -
12 Jan -1 025 7 586 8 611 16 804 16 824 20 11 495 11 515 20 5 309 5 309 - - - - Feb -4 554 8 482 13 036 14 550 15 888 1 338 8 622 8 622 - 5 929 7 267 1 338 - - - Mar -2 179 7 635 9 815 8 355 8 355 - 6 322 6 322 - 2 033 2 033 - - - - Apr -5 578 5 492 11 070 -7 419 5 130 12 549 -9 850 2 089 11 939 2 431 3 041 610 - - - May -1 958 5 577 7 535 5 470 5 470 - 3 374 3 374 - 2 096 2 096 - - - - Jun -2 869 6 409 9 277 4 835 4 835 - 3 518 3 518 - 1 317 1 317 - - - - Jul 768 6 856 6 087 -6 930 5 982 12 913 3 573 3 613 39 -10 504 2 369 12 873 - - - Aug -1 223 8 592 9 815 3 544 3 544 - 1 226 1 226 - 2 318 2 318 - - - - Sep 7 376 13 970 6 595 13 833 13 933 100 10 401 10 501 100 3 432 3 432 - - - - Oct 494 9 648 9 154 -5 249 15 017 20 266 -9 581 10 685 20 266 4 332 4 332 - - - - Nov 5 227 10 798 5 571 12 795 12 795 - 9 537 9 537 - 3 258 3 258 - - - - Dec -472 8 455 8 927 11 933 11 933 - 6 929 6 929 - 5 004 5 004 - - - -
13 Jan 3 333 8 889 5 556 5 334 19 620 14 286 11 547 11 547 - -6 213 8 073 14 286 - - -
1 2 3 4 5 6 7 8 9 10 11 12 13 14 15 16
21.PRIMARY MARKET FOR SECURITIES 21.16 Securities other than shares, excluding financial derivativesC) General government Central government
Interest rates at issue: tendersPercentages
Long-term
Short-term
3-year 5-year 10-year 15-year 30-year 6-month 1-year 18-month bonds bonds bonds bonds bonds Treasury Treasury Treasury
bills bills bills
Ave- Mar- Ave- Mar- Ave- Mar- Ave- Mar- Ave- Margi- Ave- Margi- Ave- Margi- Ave- Margi- rage ginal rage ginal rage ginal rate ginal rage nal rage nal rage nal rage nal weight- rate weight- rate weight- rate weight- rate weight- rate weight- rate weight- rate weight- rate ed ed ed ed ed ed ed ed rate rate rate rate rate rate rate rate
07 3.99 4.00 4.16 4.16 4.24 4.24 - - 4.62 4.63 4.03 4.04 4.09 4.11 3.90 3.90 08 3.90 3.93 4.09 4.10 4.46 4.47 4.92 4.92 4.75 4.76 2.95 2.99 3.74 3.78 - - 09 2.27 2.30 2.97 2.99 3.98 3.99 4.44 4.45 4.82 4.83 0.81 0.83 1.02 1.04 - - 10 2.75 2.79 3.23 3.27 4.49 4.51 4.94 4.96 5.09 5.11 1.19 1.24 1.74 1.80 2.11 2.17 11 4.06 4.10 4.61 4.64 5.51 5.55 5.97 5.99 5.95 5.96 2.37 2.42 3.23 3.30 3.58 3.64 12 3.86 3.93 4.74 4.79 5.67 5.72 - - 6.11 6.15 1.91 1.98 2.84 2.93 3.12 3.22
11 Aug 4.81 4.90 - - 4.99 5.05 - - - - 2.19 2.22 3.34 3.40 3.59 3.65 Sep - - 4.49 4.52 5.16 5.20 - - - - 2.66 2.73 3.59 3.65 3.81 3.90 Oct 3.50 3.52 - - 5.43 5.45 - - - - 3.30 3.35 3.61 3.69 3.80 3.86 Nov 4.27 4.36 4.85 4.89 6.98 7.09 - - - - 5.23 5.33 5.03 5.20 5.16 5.32 Dec 5.19 5.20 5.55 5.56 5.55 5.57 - - - - 2.43 2.53 4.05 4.09 4.23 4.25
12 Jan 3.38 3.58 3.91 3.95 5.40 5.47 - - - - 1.85 1.90 2.05 2.15 2.40 2.49 Feb 2.97 3.13 3.57 3.70 4.83 4.90 - - - - 0.76 0.78 1.90 1.95 2.31 2.39 Mar 2.44 2.52 4.19 4.24 - - - - - - 0.84 0.87 1.42 1.47 1.71 1.77 Apr 3.46 3.52 4.32 4.37 5.74 5.78 - - - - 1.58 1.63 2.62 2.74 3.11 3.20 May 5.11 5.13 4.96 4.98 - - - - - - 1.74 1.79 2.99 3.10 3.30 3.40 Jun 5.46 5.51 6.07 6.20 6.04 6.12 - - - - 3.24 3.37 5.07 5.20 5.11 5.35 Jul 5.20 5.30 6.46 6.54 6.70 6.80 - - - - 3.69 3.95 3.92 3.99 4.24 4.35 Aug 4.77 4.85 5.97 6.06 6.65 6.71 - - - - 2.03 2.10 3.07 3.21 3.33 3.45 Sep 3.55 3.55 4.58 4.58 5.67 5.70 - - - - 1.89 1.92 2.83 2.98 3.07 3.15 Oct 3.23 3.27 3.98 4.00 5.46 5.47 - - - - 2.02 2.10 2.82 2.86 3.02 3.07 Nov 3.62 3.66 4.79 4.79 5.52 5.56 - - 6.33 6.37 1.67 1.71 2.80 2.85 3.03 3.08 Dec 3.16 3.16 4.08 4.08 4.67 4.67 - - 5.89 5.93 1.61 1.69 2.56 2.65 2.78 2.89
13 Jan 2.71 2.77 3.77 3.81 5.40 5.40 5.56 5.57 5.70 5.71 0.89 0.92 1.47 1.52 1.69 1.79
BANCO DE ESPAÑA 371 BOLETÍN ESTADÍSTICO, FEBRUARY 2013

1 2 3 4 5 6 7 8 9 10 11 12
21.PRIMARY MARKET FOR SECURITIES 21.17 Securities other than shares, excluding financial derivativesC) General government Regional (autonomous) government and local government
Breakdown by instrument. Net issues
Note: Euro-denominated issues include, historically, all issues denominated in euro or national denominations of the euro.
Nominal values EUR millions
Regional (autonomous) government Local government Short-term Long-term Long-term
Total Total Short- term Total Euro Other Total Euro Other Total Euro Other curren- curren- curren- cies cies cies
07 223 283 251 32 -60 357 -417 131 - 131 131 - 08 1 386 430 209 221 956 540 417 -14 - -14 -14 - 09 8 760 -168 -158 -10 8 928 7 917 1 011 -139 - -139 -139 - 10 13 437 85 619 -534 13 352 13 127 225 -114 - -114 -114 - 11 8 083 5 566 5 743 -177 2 517 2 886 -370 -421 - -421 -421 - 12 202 -3 910 -3 909 -1 4 111 4 207 -96 -374 - -374 -374 -
12 J-J -72 -33 -33 - -39 -39 - - - - - - 13 J-J 2 718 -633 -633 - 3 351 3 351 - - - - - -
11 Nov 944 2 636 2 747 -111 -1 692 -1 692 - -48 - -48 -48 - Dec -369 965 1 045 -81 -1 334 -1 229 -105 -208 - -208 -208 -
12 Jan -72 -33 -33 - -39 -39 - - - - - - Feb 434 26 26 - 408 408 - - - - - - Mar 2 162 406 406 - 1 756 1 756 - - - - - - Apr 14 -137 -145 8 151 151 - -90 - -90 -90 - May -1 230 -1 394 -1 396 2 164 164 - - - - - - Jun 159 299 310 -10 -140 -140 - -30 - -30 -30 - Jul -933 -8 -8 - -925 -925 - - - - - - Aug -226 -131 -131 - -96 - -96 - - - - - Sep 1 895 995 995 - 900 900 - - - - - - Oct -704 -18 -18 - -686 -686 - -180 - -180 -180 - Nov -346 -2 735 -2 735 - 2 390 2 390 - 21 - 21 21 - Dec -952 -1 180 -1 180 - 228 228 - -96 - -96 -96 -
13 Jan 2 718 -633 -633 - 3 351 3 351 - - - - - -
1 2 3 4 5 6 7 8 9 10 11 12
21.PRIMARY MARKET FOR SECURITIES 21.18 Securities other than shares, excluding financial derivativesC) General government Regional (autonomous) government and local government
Breakdown by instrument. Outstanding amounts
compiled according to the methodology of the excessive-deficit procedure, and the data in this table. See notes to tables 13.18 and 13.28. These notes explain the relationship between debt in securities other than shares issued by regional and local governments, Note: Euro-denominated issues include, historically, all issues denominated in euro or national denominations of the euro.
Nominal values EUR millions
Regional (autonomous) government Local government Short-term Long-term Long-term
Total Total Short- term Total Euro Other Total Euro Other Total Euro Other curren- curren- curren- cies cies cies
07 31 299 1 752 1 378 374 29 547 28 594 953 2 593 - 2 593 2 593 - 08 32 785 2 245 1 587 658 30 540 29 134 1 405 2 579 - 2 579 2 579 - 09 41 577 2 091 1 429 663 39 486 37 051 2 435 2 440 - 2 440 2 440 - 10 55 483 2 228 2 047 181 53 255 50 178 3 077 2 326 - 2 326 2 326 - 11 63 682 7 790 7 790 - 55 892 53 064 2 828 1 904 - 1 904 1 904 - 12 63 811 3 881 3 881 - 59 929 57 271 2 658 1 530 - 1 530 1 530 -
11 Aug 62 106 4 280 4 080 199 57 826 54 974 2 852 2 196 - 2 196 2 196 - Sep 62 221 4 280 4 087 192 57 941 55 072 2 869 2 196 - 2 196 2 196 - Oct 62 990 4 189 3 998 191 58 801 55 985 2 815 2 160 - 2 160 2 160 - Nov 63 984 6 825 6 745 80 57 160 54 294 2 866 2 112 - 2 112 2 112 - Dec 63 682 7 790 7 790 - 55 892 53 064 2 828 1 904 - 1 904 1 904 -
12 Jan 63 612 7 757 7 757 - 55 855 53 026 2 829 1 904 - 1 904 1 904 - Feb 63 990 7 783 7 783 - 56 207 53 434 2 773 1 904 - 1 904 1 904 - Mar 66 147 8 189 8 189 - 57 958 55 190 2 768 1 904 - 1 904 1 904 - Apr 66 195 8 052 8 044 8 58 143 55 341 2 803 1 814 - 1 814 1 814 - May 65 055 6 659 6 649 10 58 397 55 504 2 892 1 814 - 1 814 1 814 - Jun 65 186 6 958 6 958 - 58 228 55 364 2 863 1 784 - 1 784 1 784 - Jul 64 306 6 950 6 950 - 57 356 54 440 2 916 1 784 - 1 784 1 784 - Aug 64 043 6 819 6 819 - 57 223 54 440 2 784 1 784 - 1 784 1 784 - Sep 65 901 7 814 7 814 - 58 087 55 340 2 747 1 784 - 1 784 1 784 - Oct 65 171 7 796 7 796 - 57 374 54 654 2 721 1 604 - 1 604 1 604 - Nov 64 809 5 061 5 061 - 59 748 57 044 2 705 1 625 - 1 625 1 625 - Dec 63 811 3 881 3 881 - 59 929 57 271 2 658 1 530 - 1 530 1 530 -
13 Jan 66 434 3 248 3 248 - 63 186 60 622 2 564 1 530 - 1 530 1 530 -
BANCO DE ESPAÑA 372 BOLETÍN ESTADÍSTICO, FEBRUARY 2013

1 2 3 4 5 6 7 8 9 10
21.PRIMARY MARKET FOR SECURITIES 21.19 Securities other than shares in euro, except financial derivativesC) General government Regional (autonomous) government and local government
Net issues, gross issues and redemptions
Note: Euro-denominated issues include, historically, all issues denominated in euro or national denominations of the euro.
Nominal values EUR millions
Regional (autonomous) government Local government
Short-term Long-term Short-term Long-term
Net Gross Redemp- Net Gross Redemp- Net Net Gross Redemp- issues issues tions issues issues tions issues issues issues tions
07 251 2 859 2 608 357 3 381 3 024 - 131 496 364 08 209 3 297 3 088 540 3 329 2 789 - -14 208 222 09 -158 3 678 3 837 7 917 11 544 3 627 - -139 51 190 10 619 4 988 4 369 13 127 18 223 5 096 - -114 - 114 11 5 743 11 046 5 304 2 886 11 000 8 113 - -421 - 421 12 -3 909 6 481 10 390 4 207 9 499 5 292 - -374 21 396
12 J-J -33 224 257 -39 87 125 - - - - 13 J-J -633 17 650 3 351 3 501 150 - - - -
11 Nov 2 747 2 770 24 -1 692 2 006 3 698 - -48 - 48 Dec 1 045 1 086 40 -1 229 601 1 830 - -208 - 208
12 Jan -33 224 257 -39 87 125 - - - - Feb 26 28 3 408 1 424 1 016 - - - - Mar 406 407 1 1 756 1 756 - - - - - Apr -145 69 213 151 301 150 - -90 - 90 May -1 396 2 159 3 554 164 1 027 863 - - - - Jun 310 323 13 -140 5 145 - -30 - 30 Jul -8 312 321 -925 21 946 - - - - Aug -131 305 436 - - - - - - - Sep 995 1 311 316 900 1 000 100 - - - - Oct -18 307 325 -686 673 1 359 - -180 - 180 Nov -2 735 521 3 256 2 390 2 469 79 - 21 21 - Dec -1 180 516 1 696 228 738 510 - -96 - 96
13 Jan -633 17 650 3 351 3 501 150 - - - -
1 2 3 4 5 6 7 8 9 10 11 12 13
21.PRIMARY MARKET FOR SECURITIES 21.20 Securities other than shares, excluding financial derivativesD) Non-financial corporations Breakdown by instrument
Net issues and outstanding amounts
Note: Euro-denominated issues include, historically, all issues denominated in euro or national denominations of the euro.
Nominal values EUR millions
Net issues Outstanding amounts Short-term Long-term Euro Total Other
Total Euro currencies Total Gross Redemp- Total Other Short- Long- issues tions currencies term term Total Gross Redemp- issues tions
07 1 626 -146 6 454 6 600 1 772 1 630 2 215 585 142 12 818 3 956 8 730 132 08 1 665 323 7 108 6 785 1 341 1 341 2 101 760 - 14 452 4 279 10 071 102 09 108 -2 033 6 697 8 730 2 141 1 989 3 798 1 809 153 14 565 2 246 12 059 259 10 -747 -1 566 3 401 4 967 819 732 2 360 1 628 86 13 855 681 12 792 383 11 1 040 236 1 167 932 805 832 1 325 494 -27 14 918 916 13 623 378 12 2 588 -17 2 964 2 981 2 605 2 623 4 512 1 889 -19 17 252 899 16 019 333
11 Aug -37 -37 10 47 - - - - - 14 595 677 13 551 367 Sep 130 130 187 57 - - - - - 14 747 807 13 551 390 Oct 111 138 309 171 -27 -27 - 27 - 14 843 945 13 524 374 Nov -32 -35 22 57 3 3 3 - - 14 828 910 13 526 391 Dec 76 6 172 166 70 97 124 27 -27 14 918 916 13 623 378
12 Jan 71 41 365 324 30 30 30 - - 14 985 958 13 653 374 Feb 399 292 416 124 106 106 160 54 - 15 367 1 250 13 760 358 Mar 352 228 416 188 124 124 300 176 - 15 718 1 478 13 884 356 Apr -38 -18 315 333 -21 -2 - 2 -19 15 688 1 461 13 881 346 May -224 -37 268 304 -187 -187 181 368 - 15 490 1 424 13 694 372 Jun 519 -122 40 162 642 642 1 392 750 - 16 002 1 302 14 336 365 Jul -210 -114 53 167 -96 -96 434 530 - 15 805 1 188 14 240 377 Aug -83 -78 190 269 -5 -5 - 5 - 15 711 1 109 14 235 367 Sep -96 -96 70 165 - - - - - 15 608 1 014 14 235 360 Oct 805 -46 121 168 851 851 851 - - 16 406 967 15 087 352 Nov 1 223 58 373 315 1 165 1 165 1 165 - - 17 623 1 025 16 251 346 Dec -131 -126 336 462 -5 -5 - 5 - 17 252 899 16 019 333
13 Jan 421 121 386 265 300 300 400 100 - 17 655 1 021 16 319 315
BANCO DE ESPAÑA 373 BOLETÍN ESTADÍSTICO, FEBRUARY 2013

P P P P P P
P P P P P
P P P P P P P P P P P P
P
1 2 3 4 5 6 7 8 9 10 11 12
21.PRIMARY MARKET FOR SECURITIES 21.21 Securities other than shares, excluding financial derivativesE) Rest of the world Breakdown by sector of the issuer
Net issues, gross issues, redemptions and outstanding amounts Nominal values EUR millions
Subsidiaries of Spanish corporations resident in the rest of the world Non-residents Issues in Spain
Matador bonds
Subsidiaries of financial corporations Subsidiaries of non-financial corporations
Net Gross Redemp- Outstand- Net Gross Redemp- Outstand- Net Gross Redemp- Outstand- issues issues tions ing issues issues tions ing issues issues tions ing
amounts amounts amounts
07 8 221 28 992 20 770 48 156 1 252 11 299 10 047 31 596 -1 178 428 1 606 1 846 08 14 312 138 101 123 790 62 032 -1 406 13 142 14 548 30 302 -385 185 570 1 462 09 -3 435 119 566 123 001 58 957 1 426 18 470 17 043 31 648 -168 70 238 1 294 10 -10 626 161 906 172 532 50 265 1 961 29 369 27 408 34 037 -3 - 3 1 291 11 -19 913 79 208 99 121 30 472 763 28 897 28 134 35 086 -3 - 3 1 288 12 -1 305 18 326 19 631 28 718 2 105 30 730 28 625 37 060 -207 - 207 1 081
11 Aug -4 979 2 289 7 269 36 792 -271 1 383 1 654 33 967 - - - 1 289 Sep -2 422 2 591 5 013 35 258 -591 1 127 1 718 33 812 -1 - 1 1 289 Oct -2 352 2 793 5 146 32 425 222 2 555 2 333 33 783 - - - 1 289 Nov -1 652 1 870 3 522 31 341 180 2 618 2 439 34 256 - - - 1 289 Dec -1 389 3 083 4 471 30 472 565 3 420 2 855 35 086 -1 - 1 1 288
12 Jan 5 2 928 2 922 30 291 2 303 4 389 2 086 37 275 - - - 1 288 Feb 1 877 3 250 1 373 31 843 1 217 4 494 3 277 38 310 - - - 1 288 Mar -377 1 535 1 912 31 524 799 2 731 1 932 39 150 -1 - 1 1 287 Apr -2 311 1 372 3 684 29 399 829 3 114 2 286 40 092 - - - 1 287 May -1 966 746 2 712 28 376 -702 2 049 2 752 39 950 - - - 1 287 Jun -320 803 1 123 27 811 -1 197 960 2 157 38 620 - - - 1 287 Jul -132 1 155 1 287 28 112 -1 951 640 2 591 36 917 - - - 1 287 Aug 304 804 500 27 985 -723 1 791 2 515 35 956 - - - 1 287 Sep 1 905 2 879 973 29 493 2 322 4 459 2 137 38 061 -1 - 1 1 286 Oct 237 1 176 938 29 609 1 130 2 580 1 450 39 137 - - - 1 286 Nov 821 1 180 359 30 391 -594 2 778 3 372 38 546 - - - 1 286 Dec -1 347 499 1 846 28 718 -1 326 745 2 071 37 060 -205 - 205 1 081
13 Jan -1 341 468 1 809 26 838 2 345 3 293 948 39 137 - - - 1 081
1 2 3 4 5 6 7 8 9 10
21.PRIMARY MARKET FOR SECURITIES 21.22 Securities other than shares, excluding financial derivativesF) Euro area Breakdown by sector and subsector of the issuer. Net issues
The Spanish contribution to euro area amounts can be consulted in columns 1 to 9 of table 21.1. Greek drachma-denominated issues have been included under euro since January 2001. Note: Euro-denominated issues include, historically, all issues denominated in euro or national denominations of the euro.
Source: ECB EUR millions
Euro Other currencies
Total Financial corporations General government Non-financial Total of which corporations Central Total Monetary MFIs Total Central Other government government general government
06 664 256 519 665 318 899 200 766 125 719 98 488 27 231 18 867 143 777 -14 331 07 895 383 720 259 418 499 301 760 136 328 121 381 14 948 38 801 107 562 -4 473 08 1 131 822 722 417 279 051 443 366 371 122 360 495 10 627 38 283 21 912 19 706 09 953 590 300 904 101 197 199 707 579 485 548 162 31 322 73 201 90 860 6 299 10 495 774 5 179 -28 638 33 817 447 259 389 855 57 403 43 336 54 259 -7 829 11 568 578 216 715 280 973 -64 258 312 855 264 948 47 907 39 008 50 409 13 220
11 J-N 511 060 148 106 218 301 -70 194 319 871 278 256 41 615 43 083 51 965 15 531 12 J-N 322 625 -59 164 11 230 -70 395 287 115 247 854 39 261 94 674 92 295 7 531
11 Sep 4 801 9 067 28 928 -19 861 -7 015 -9 055 2 040 2 749 1 653 80 Oct 79 367 52 900 12 273 40 626 20 324 19 352 972 6 143 -9 430 3 870 Nov 92 555 26 786 31 905 -5 119 61 196 42 390 18 806 4 573 8 208 2 744 Dec 57 518 68 609 62 673 5 936 -7 016 -13 309 6 292 -4 075 -1 556 -2 312
12 Jan 89 650 26 087 26 833 -745 57 039 49 570 7 469 6 524 -7 377 5 553 Feb 144 448 80 554 73 730 6 824 55 819 42 607 13 212 8 075 16 570 2 143 Mar 42 731 31 370 17 531 13 840 -704 -12 744 12 039 12 065 36 448 1 776 Apr -8 355 -8 826 -32 774 23 948 -12 546 -6 302 -6 243 13 017 6 507 -1 855 May 42 566 -32 551 -19 494 -13 057 62 609 62 766 -157 12 508 16 996 -3 100 Jun -1 445 -40 971 6 656 -47 627 38 322 30 923 7 399 1 204 -17 168 1 012 Jul -8 314 1 310 32 878 -31 568 -17 370 -20 710 3 340 7 746 37 251 6 357 Aug -13 663 -25 317 6 651 -31 968 7 880 7 646 234 3 775 -23 222 -5 876 Sep -10 606 -59 932 -49 196 -10 736 34 082 28 159 5 922 15 244 -13 459 -2 620 Oct 16 257 -10 710 -27 361 16 651 18 325 18 810 -485 8 642 19 696 -1 074 Nov 29 354 -20 179 -24 223 4 044 43 658 47 127 -3 469 5 875 20 053 5 213
BANCO DE ESPAÑA 374 BOLETÍN ESTADÍSTICO, FEBRUARY 2013

1 2 3 4 5 6 7 8 9 10
21.PRIMARY MARKET FOR SECURITIES 21.23 Securities other than shares, excluding financial derivativesF) Euro area Breakdown by sector and subsector of the issuer. Outstanding amounts
The Spanish contribution to euro area amounts can be consulted in columns 1 to 9 of table 21.1. Greek drachma-denominated issues have been included under euro since January 2001. Note: Euro-denominated issues include, historically, all issues denominated in euro or national denominations of the euro.
Source: ECB EUR millions
Euro Other currencies
Total Financial corporations General government Non-financial Total of which corporations Central Total Monetary MFIs Total Central Other government government general government
06 9 856 718 4 721 673 3 665 686 1 055 986 4 597 619 4 297 412 300 207 537 426 1 217 317 96 618 07 10 764 570 5 445 929 4 097 544 1 348 385 4 741 774 4 426 621 315 153 576 866 1 282 400 83 425 08 12 089 291 6 339 421 4 384 393 1 955 028 5 135 247 4 809 433 325 814 614 623 1 350 262 111 791 09 13 645 492 7 223 133 4 492 730 2 730 403 5 741 856 5 385 006 356 851 680 502 1 629 971 123 418 10 14 111 048 7 071 559 4 309 625 2 761 934 6 336 337 5 840 300 496 037 703 153 1 760 399 95 305 11 14 681 416 7 316 531 4 588 866 2 727 666 6 649 955 6 105 809 544 147 714 930 1 840 648 111 286
11 Jun 14 426 291 7 148 136 4 429 573 2 718 564 6 586 467 6 070 854 515 613 691 687 1 772 401 96 191 Jul 14 416 157 7 143 337 4 422 437 2 720 900 6 570 067 6 062 570 507 497 702 754 1 795 879 99 224 Aug 14 447 456 7 159 650 4 453 559 2 706 090 6 582 351 6 066 317 516 034 705 455 1 772 564 99 375 Sep 14 451 737 7 168 347 4 482 118 2 686 229 6 575 220 6 057 148 518 072 708 170 1 812 063 103 609 Oct 14 530 438 7 220 547 4 493 694 2 726 853 6 595 576 6 076 529 519 047 714 314 1 777 296 105 024 Nov 14 623 845 7 248 041 4 526 308 2 721 733 6 656 909 6 119 055 537 854 718 895 1 813 896 110 713 Dec 14 681 416 7 316 531 4 588 866 2 727 666 6 649 955 6 105 809 544 147 714 930 1 840 648 111 286
12 Jan 14 770 853 7 342 612 4 615 459 2 727 154 6 707 011 6 155 397 551 615 721 229 1 824 101 115 760 Feb 14 914 832 7 422 612 4 688 635 2 733 977 6 762 890 6 198 063 564 827 729 331 1 822 683 116 154 Mar 14 863 324 7 454 583 4 706 769 2 747 814 6 667 338 6 090 472 576 866 741 403 1 863 644 118 140 Apr 14 844 381 7 445 325 4 673 566 2 771 759 6 644 643 6 074 021 570 621 754 413 1 883 139 116 336 May 14 885 734 7 411 557 4 652 855 2 758 702 6 707 268 6 136 803 570 464 766 909 1 944 868 117 366 Jun 14 883 637 7 353 688 4 658 840 2 694 848 6 766 325 6 167 736 598 589 763 624 1 915 546 117 302 Jul 14 874 927 7 354 586 4 691 308 2 663 279 6 748 953 6 147 023 601 930 771 387 1 975 905 125 354 Aug 14 863 709 7 329 662 4 698 353 2 631 309 6 758 865 6 156 702 602 163 775 182 1 933 390 118 284 Sep 14 844 008 7 260 116 4 639 541 2 620 575 6 792 940 6 184 854 608 086 790 953 1 904 780 114 267 Oct 14 858 683 7 246 459 4 609 233 2 637 226 6 812 609 6 203 668 608 942 799 614 1 917 378 112 530 Nov 14 890 310 7 228 525 4 587 254 2 641 271 6 856 276 6 250 803 605 473 805 509 1 934 000 117 399
BANCO DE ESPAÑA 375 BOLETÍN ESTADÍSTICO, FEBRUARY 2013


CHAPTER 22 DOMESTIC SECONDARY MARKETS FOR SECURITIES

1 2 3 4 5 6 7 8 9 10 11 12 13
22. DOMESTIC SECONDARY MARKETS FOR SECURITIES 22.1 Nominal outstanding amounts recordedA) Book-entry debt market in the book-entry system
EUR millions State debt Other resident issuers Securities of other Unstripped debt Stripped debt Other general euro area
Total government countries Total Treasury Unstripped Principal Interest Rest bills bonds components components Regional Regional Total (a) Total of stripped of stripped Total government government bonds bonds notes bonds
06 343 914 305 834 282 715 31 301 251 414 23 119 13 160 9 958 17 586 330 15 613 1 644 20 493 07 350 350 304 785 279 446 32 444 247 001 25 339 14 420 10 919 16 961 319 15 629 1 013 28 605 08 400 647 357 285 331 992 52 074 279 917 25 293 13 624 11 669 16 497 342 15 588 567 26 865 09 511 212 474 415 448 092 85 513 362 579 26 323 14 010 12 314 22 747 303 17 767 4 677 14 050 10 580 687 545 005 507 368 89 756 417 611 37 638 19 545 18 092 27 865 77 23 157 4 631 7 816 11 646 316 600 529 557 527 90 608 466 920 43 002 22 989 20 012 39 167 172 26 568 12 426 6 621
11 Jun 623 382 583 374 541 189 91 391 449 798 42 185 22 363 19 822 32 922 170 25 121 7 631 7 086 Jul 631 308 589 977 547 429 91 770 455 659 42 548 22 584 19 964 34 649 172 25 096 9 381 6 683 Aug 616 655 575 376 533 508 89 056 444 452 41 868 22 402 19 465 34 617 170 25 066 9 381 6 662 Sep 625 376 583 890 541 876 89 793 452 083 42 014 22 484 19 530 34 843 178 25 284 9 381 6 643 Oct 621 036 576 862 535 328 88 141 447 187 41 534 21 950 19 584 37 454 193 26 044 11 216 6 721 Nov 630 656 586 093 543 865 88 364 455 501 42 228 22 476 19 752 37 826 184 26 106 11 536 6 736 Dec 646 316 600 529 557 527 90 608 466 920 43 002 22 989 20 012 39 167 172 26 568 12 426 6 621
12 Jan 661 200 615 792 573 348 89 582 483 766 42 445 22 967 19 477 39 152 172 26 554 12 426 6 255 Feb 670 165 623 629 580 235 85 028 495 207 43 394 23 712 19 683 39 932 194 27 311 12 426 6 604 Mar 677 853 629 358 585 032 82 849 502 183 44 326 24 246 20 080 41 890 231 29 232 12 426 6 605 Apr 665 112 617 080 572 061 77 270 494 791 45 019 24 830 20 190 41 883 237 29 219 12 426 6 149 May 668 085 620 701 575 068 75 312 499 756 45 633 25 335 20 298 41 235 77 28 731 12 426 6 150 Jun 670 022 622 753 576 817 72 444 504 373 45 936 25 552 20 384 41 118 83 28 609 12 426 6 152 Jul 662 560 616 345 570 691 73 212 497 479 45 654 25 555 20 099 40 246 84 27 735 12 426 5 969 Aug 664 472 618 786 572 885 71 988 500 897 45 901 25 681 20 220 40 235 69 27 740 12 426 5 451 Sep 684 699 640 381 593 965 79 364 514 601 46 416 25 910 20 506 40 231 64 27 740 12 426 4 087 Oct 677 723 635 459 589 130 79 858 509 272 46 329 25 867 20 463 39 620 77 27 297 12 246 2 644 Nov 696 766 653 345 606 637 85 085 521 552 46 708 26 121 20 588 41 494 101 29 147 12 246 1 927 Dec 706 450 662 339 614 998 84 613 530 385 47 341 26 463 20 878 42 483 249 29 235 12 999 1 628
13 Jan 716 854 669 439 623 033 87 946 535 087 46 406 25 936 20 470 45 787 328 32 460 12 999 1 628
1 2 3 4 5 6 7 8 9 10 11 12 13
22. DOMESTIC SECONDARY MARKETS FOR SECURITIES 22.2 Nominal outstanding amounts recorded in costumerA) Book-entry debt market accounts in the book-entry system
EUR millions State debt Other resident issuers Securities of other Unstripped debt Stripped debt Other general euro area
Total government countries Total Treasury Unstripped Principal Interest Rest bills bonds components components Regional Regional Total (a) Total of stripped of stripped Total government government bonds bonds notes bonds
06 253 909 240 884 222 451 22 892 199 559 18 433 11 823 6 610 12 989 224 11 506 1 259 35 07 245 799 233 303 212 161 25 308 186 852 21 142 12 975 8 167 12 261 215 11 289 757 235 08 277 052 265 791 244 820 39 218 205 602 20 971 11 074 9 897 11 026 271 10 325 429 235 09 323 709 306 507 285 550 62 946 222 604 20 957 11 099 9 858 16 937 273 13 042 3 622 265 10 412 094 391 121 362 708 69 504 293 204 28 413 13 524 14 889 20 738 61 16 937 3 741 235 11 424 487 395 708 362 018 65 325 296 693 33 690 16 251 17 439 28 730 135 19 513 9 082 50
11 Jun 438 662 414 187 378 715 66 906 311 809 35 472 18 737 16 735 24 375 141 17 810 6 423 101 Jul 444 997 419 502 383 817 69 823 313 994 35 685 19 043 16 642 25 381 143 17 617 7 621 114 Aug 440 044 414 433 378 980 68 444 310 536 35 453 18 833 16 620 25 518 141 17 749 7 628 93 Sep 452 104 426 335 393 682 71 110 322 573 32 652 15 679 16 973 25 695 140 17 969 7 586 74 Oct 438 311 410 564 378 309 71 694 306 615 32 255 15 262 16 992 27 609 156 18 680 8 773 138 Nov 443 863 415 501 382 119 70 849 311 270 33 382 16 086 17 296 28 194 147 18 915 9 132 168 Dec 424 487 395 708 362 018 65 325 296 693 33 690 16 251 17 439 28 730 135 19 513 9 082 50
12 Jan 416 786 388 176 354 714 61 854 292 861 33 461 16 452 17 009 28 602 134 19 555 8 913 8 Feb 392 916 364 553 330 320 52 567 277 753 34 233 16 971 17 262 28 357 157 19 578 8 622 7 Mar 370 624 341 281 306 867 47 059 259 808 34 414 17 195 17 219 29 335 194 20 697 8 445 8 Apr 361 984 332 699 297 176 44 623 252 553 35 523 17 883 17 640 29 278 199 20 636 8 442 8 May 356 834 327 961 292 592 43 180 249 412 35 369 18 270 17 099 28 865 77 20 277 8 511 8 Jun 343 723 316 265 280 046 39 560 240 486 36 220 18 595 17 625 27 448 83 19 446 7 920 10 Jul 341 622 314 928 278 621 41 674 236 947 36 308 18 721 17 587 26 694 84 18 836 7 774 - Aug 334 963 308 424 271 830 42 114 229 716 36 594 18 900 17 694 26 539 69 18 891 7 579 - Sep 349 556 322 986 286 041 43 491 242 550 36 945 18 985 17 959 26 570 64 18 879 7 627 - Oct 345 682 319 504 282 497 46 979 235 517 37 007 19 072 17 935 26 178 77 18 584 7 517 - Nov 353 069 324 518 287 277 50 257 237 020 37 241 19 280 17 961 28 551 101 20 901 7 549 - Dec 365 604 336 818 299 025 53 696 245 329 37 793 19 550 18 242 28 786 249 21 032 7 504 -
13 Jan 376 770 344 491 307 105 54 084 253 021 37 387 19 315 18 071 32 279 328 24 083 7 868 -
BANCO DE ESPAÑA 378 BOLETÍN ESTADÍSTICO, FEBRUARY 2013

1 2 3 4 5 6 7 8 9 10 11 12
22. DOMESTIC SECONDARY MARKETS FOR SECURITIES 22.3 Treasury billsA) Book-entry debt market Nominal outstanding amounts. Registered portfolio
EUR millions Monetary financial institutions (MFIs) excluding money market Money market funds and other funds (MMFs) financial intermediaries
Amounts Households General Rest outstanding Non-financial and government of the
corporations NPISHs world Banco de Other MFIs Collective Insurance Total España excluding Total investment corporations Rest MMFs undertakings and pension (a) funds
07 32 444 3 246 1 666 1 580 13 871 7 549 3 306 3 016 3 937 5 126 2 125 4 140 08 52 074 7 686 3 032 4 653 17 936 11 863 3 036 3 037 5 303 6 501 3 791 10 857 09 85 513 14 624 445 14 179 16 014 10 150 3 948 1 916 5 846 2 876 4 538 41 616 10 89 756 8 049 737 7 313 19 073 9 085 5 845 4 142 4 870 1 976 6 320 49 468 11 90 608 18 305 3 422 14 883 20 609 11 146 8 100 1 363 3 552 3 603 3 765 40 774
11 Jun 91 391 9 940 2 861 7 079 24 529 11 083 8 356 5 090 4 461 2 039 4 648 45 774 Jul 91 770 6 852 2 661 4 190 23 125 11 443 7 358 4 324 4 570 2 100 5 389 49 734 Aug 89 056 8 644 2 951 5 693 22 102 10 576 7 469 4 057 3 861 2 166 3 806 48 478 Sep 89 793 7 089 2 953 4 136 21 155 10 280 7 567 3 308 3 969 2 316 4 196 51 069 Oct 88 141 7 514 3 553 3 961 22 452 11 291 7 575 3 587 3 604 2 624 2 910 49 037 Nov 88 364 8 864 3 505 5 359 23 859 12 413 7 904 3 543 4 681 3 044 2 424 45 492 Dec 90 608 18 305 3 422 14 883 20 609 11 146 8 100 1 363 3 552 3 603 3 765 40 774
12 Jan 89 582 19 282 3 108 16 174 22 881 12 615 7 991 2 276 3 676 3 694 4 876 35 172 Feb 85 028 21 256 2 285 18 971 20 062 10 185 6 787 3 090 3 273 3 429 7 351 29 656 Mar 82 849 21 968 1 046 20 922 19 743 10 182 5 983 3 578 3 427 3 198 9 845 24 668 Apr 77 270 20 990 1 006 19 984 16 287 8 756 5 554 1 978 3 076 3 164 8 878 24 876 May 75 312 18 823 1 006 17 817 16 343 9 219 5 752 1 372 2 744 3 103 9 105 25 194 Jun 72 444 18 465 2 038 16 427 17 353 9 140 6 667 1 546 3 312 3 103 9 033 21 177 Jul 73 212 18 422 591 17 831 18 451 9 065 6 583 2 804 3 000 3 425 8 422 21 492 Aug 71 988 16 264 413 15 852 18 894 9 641 7 689 1 564 3 267 3 512 7 809 22 242 Sep 79 364 19 774 248 19 526 20 020 10 215 7 196 2 609 3 322 3 486 8 577 24 186 Oct 79 858 20 054 153 19 902 21 494 10 372 7 730 3 393 3 238 3 456 4 919 26 696 Nov 85 085 23 672 283 23 389 20 990 10 857 7 576 2 557 3 645 3 194 4 060 29 524 Dec 84 613 19 019 4 19 014 19 626 10 289 7 620 1 717 2 938 2 957 7 026 33 048
13 Jan 87 946 21 929 4 21 925 18 974 9 293 7 317 2 364 2 774 2 872 7 780 33 618
P P P P P P P P P P P P
1 2 3 4 5 6 7 8 9 10 11 12
22. DOMESTIC SECONDARY MARKETS FOR SECURITIES 22.4 Treasury billsA) Book-entry debt market Nominal outstanding amounts. Portfolio to maturity
EUR millions Monetary financial institutions (MFIs) excluding money market Money market funds and other funds (MMFs) financial intermediaries
Amounts Households General Rest outstanding Non-financial and government of the
corporations NPISHs world Banco de Other MFIs Collective Insurance Total España excluding Total investment corporations Rest MMFs undertakings and pension (a) funds
06 31 301 17 152 2 186 14 966 5 846 2 786 884 2 176 449 2 923 212 4 719 07 32 444 18 147 1 666 16 481 5 132 2 072 648 2 412 545 3 559 833 4 228 08 52 074 23 113 3 032 20 081 9 598 5 949 1 002 2 647 1 877 4 730 1 606 11 150 09 85 513 30 416 445 29 971 6 870 4 710 772 1 387 1 179 2 287 1 497 43 265 10 89 756 26 210 667 25 543 10 883 5 820 3 474 1 590 1 771 1 617 4 049 45 226
11 May 88 903 33 144 2 661 30 483 14 062 6 761 5 257 2 043 2 205 1 742 4 724 33 026 Jun 91 391 35 774 2 661 33 113 13 587 6 501 5 048 2 038 2 162 1 736 4 141 33 991 Jul 91 770 37 852 2 661 35 191 14 312 7 324 4 902 2 086 2 142 1 786 3 384 32 293 Aug 89 056 34 735 2 851 31 884 15 617 7 386 5 996 2 235 1 849 1 853 3 392 31 610 Sep 89 793 33 308 2 853 30 456 16 585 8 118 6 175 2 291 2 005 2 059 3 137 32 699 Oct 88 141 31 316 2 933 28 383 17 164 8 671 6 223 2 269 2 115 2 349 2 685 32 512 Nov 88 364 32 179 2 933 29 246 19 522 10 278 6 933 2 311 2 850 2 820 2 323 28 670 Dec 90 608 37 773 3 001 34 772 18 074 9 828 7 424 822 2 411 3 352 2 826 26 171
12 Jan 89 582 35 755 3 001 32 754 16 758 9 392 6 686 680 2 422 3 415 3 703 27 529 Feb 85 028 38 278 2 052 36 227 13 518 7 706 5 377 434 2 120 3 169 3 620 24 324 Mar 82 849 35 457 1 046 34 411 11 698 7 040 3 855 803 1 813 2 968 5 496 25 417 Apr 77 270 32 584 1 006 31 578 11 995 7 053 4 555 387 1 820 2 927 5 246 22 698 May 75 312 30 687 1 006 29 681 12 632 7 254 4 984 394 1 723 2 899 6 506 20 866 Jun 72 444 29 022 1 102 27 919 13 237 7 278 5 562 398 1 741 2 958 7 150 18 336 Jul 73 212 28 065 550 27 514 13 739 7 761 5 816 162 2 183 3 260 6 669 19 296 Aug 71 988 25 378 165 25 213 14 788 8 164 6 421 202 2 148 3 354 7 084 19 238 Sep 79 364 29 225 225 29 000 15 518 8 673 6 653 192 2 164 3 341 7 759 21 357 Oct 79 858 28 473 130 28 343 15 827 8 770 6 902 155 2 153 3 253 4 707 25 445 Nov 85 085 29 410 - 29 410 16 132 9 160 6 862 110 2 043 3 079 2 999 31 422 Dec 84 613 23 362 4 23 358 16 412 9 026 7 015 371 1 989 2 844 6 343 33 663
BANCO DE ESPAÑA 379 BOLETÍN ESTADÍSTICO, FEBRUARY 2013

P P P P P P P P P P P P
1 2 3 4 5 6 7 8 9 10 11
22. DOMESTIC SECONDARY MARKETS FOR SECURITIES 22.5 Treasury billsA) Book-entry debt market Sell/buy-back transactions and repurchase agreements
EUR millions
Monetary financial institutions (MFIs) excluding money market Money market funds and other
funds (MMFs) financial intermediaries Households General Rest
Non-financial and government of the corporations NPISHs world Banco de Other MFIs Collective Insurance
Total España excluding Total investment corporations Rest MMFs undertakings and pension (a) funds
06 -12 453 0 -12 454 6 314 4 501 1 512 302 3 440 1 755 1 737 -792 07 -14 901 - -14 901 8 739 5 477 2 658 604 3 392 1 566 1 292 -89 08 -15 427 0 -15 428 8 338 5 914 2 034 390 3 426 1 771 2 186 -294 09 -15 792 - -15 792 9 144 5 439 3 176 529 4 667 589 3 041 -1 649 10 -18 161 70 -18 231 8 189 3 265 2 372 2 552 3 099 359 2 271 4 242
11 May -22 195 200 -22 395 7 646 3 764 1 688 2 194 2 181 311 1 942 10 116 Jun -25 834 200 -26 034 10 942 4 582 3 308 3 052 2 299 303 507 11 783 Jul -31 001 - -31 001 8 813 4 119 2 456 2 238 2 428 314 2 005 17 441 Aug -26 091 100 -26 191 6 484 3 189 1 473 1 822 2 012 313 414 16 868 Sep -26 220 100 -26 320 4 570 2 161 1 392 1 017 1 964 257 1 059 18 370 Oct -23 802 620 -24 422 5 288 2 619 1 351 1 318 1 490 276 224 16 525 Nov -23 315 572 -23 887 4 337 2 134 971 1 232 1 830 224 102 16 822 Dec -19 468 421 -19 889 2 535 1 318 675 541 1 141 251 938 14 603
12 Jan -16 473 107 -16 580 6 124 3 223 1 305 1 596 1 254 279 1 173 7 644 Feb -17 022 233 -17 255 6 544 2 478 1 410 2 656 1 154 260 3 732 5 332 Mar -13 490 - -13 490 8 045 3 142 2 127 2 775 1 614 231 4 349 -749 Apr -11 594 - -11 594 4 292 1 703 999 1 590 1 256 237 3 632 2 178 May -11 863 - -11 863 3 711 1 965 768 978 1 021 205 2 599 4 328 Jun -10 556 936 -11 492 4 116 1 862 1 105 1 148 1 570 145 1 884 2 841 Jul -9 643 41 -9 684 4 712 1 304 767 2 641 817 164 1 753 2 196 Aug -16 224 248 -16 472 4 106 1 477 1 268 1 361 1 119 159 725 10 115 Sep -9 451 23 -9 474 4 502 1 542 543 2 417 1 158 145 817 2 829 Oct -8 419 23 -8 441 5 667 1 601 828 3 239 1 085 203 212 1 251 Nov -5 738 283 -6 020 4 858 1 697 714 2 447 1 602 116 1 061 -1 898 Dec -4 344 - -4 344 3 215 1 264 604 1 347 950 112 682 -616
1 2 3 4 5 6 7 8 9 10 11 12
22. DOMESTIC SECONDARY MARKETS FOR SECURITIES 22.6 Unstripped bonds and principal components ofA) Book-entry debt market stripped bonds
Nominal outstanding amounts. Registered portfolioEUR millions
Monetary financial institutions (MFIs) excluding money market Money market funds and other funds (MMFs) financial intermediaries
Amounts Households General Rest outstanding Non-financial and government of the
corporations NPISHs world Banco de Other MFIs Collective Insurance Total España excluding Total investment corporations Rest MMFs undertakings and pension (a) funds
07 261 421 16 152 7 538 8 614 73 520 33 359 32 550 7 610 20 565 4 704 34 805 111 675 08 293 542 26 710 11 941 14 769 60 201 25 501 27 532 7 168 19 592 4 383 42 837 139 819 09 376 588 75 416 14 163 61 253 54 166 19 762 29 662 4 742 14 539 3 122 55 733 173 612 10 437 157 57 032 18 022 39 011 67 154 23 918 40 206 3 030 14 948 2 330 60 024 235 668 11 489 909 80 676 26 170 54 507 79 700 24 631 49 951 5 118 12 502 3 660 65 811 247 560
11 Jun 472 161 59 539 18 369 41 170 71 985 23 493 45 822 2 670 11 666 2 207 63 398 263 366 Jul 478 243 54 288 19 001 35 287 78 288 23 781 50 887 3 621 13 320 2 199 69 445 260 704 Aug 466 855 59 670 20 827 38 843 73 803 23 896 46 216 3 691 13 077 2 235 60 767 257 303 Sep 474 567 49 867 22 107 27 760 76 307 25 258 46 569 4 480 12 130 3 756 66 617 265 889 Oct 469 137 63 078 30 924 32 154 75 904 23 911 47 285 4 708 12 237 3 345 59 877 254 696 Nov 477 977 65 765 35 955 29 811 77 063 24 888 47 724 4 450 12 256 3 442 60 007 259 445 Dec 489 909 80 676 26 170 54 507 79 700 24 631 49 951 5 118 12 502 3 660 65 811 247 560
12 Jan 506 733 104 228 26 229 77 999 78 386 23 587 51 009 3 791 13 789 2 857 66 393 241 081 Feb 518 919 125 350 27 967 97 383 83 825 25 147 53 528 5 150 12 605 2 803 72 702 221 634 Mar 526 430 153 062 26 744 126 318 84 238 24 685 55 331 4 222 12 043 2 478 72 815 201 793 Apr 519 620 152 370 26 969 125 401 85 396 26 007 53 953 5 436 13 135 2 220 71 214 195 284 May 525 091 149 633 33 802 115 832 87 217 26 032 54 923 6 261 13 152 2 294 78 750 194 044 Jun 529 926 165 801 49 541 116 260 84 850 26 148 54 208 4 493 13 273 2 506 74 744 188 751 Jul 523 034 172 002 46 158 125 843 84 353 26 459 55 326 2 567 15 125 2 485 69 564 179 506 Aug 526 578 184 738 44 857 139 880 82 633 26 031 53 651 2 952 13 626 2 579 67 061 175 941 Sep 540 511 178 202 45 340 132 862 82 100 25 028 54 824 2 248 13 360 2 733 72 098 192 019 Oct 535 139 177 710 39 523 138 186 80 653 24 032 54 713 1 909 14 435 2 569 71 032 188 740 Nov 547 673 181 506 37 948 143 558 81 782 22 914 56 193 2 675 13 612 2 686 77 371 190 716 Dec 556 848 179 322 37 783 141 539 83 582 23 674 57 144 2 765 14 449 2 827 79 009 197 659
13 Jan 561 022 184 082 28 610 155 472 82 969 23 756 57 292 1 921 15 387 2 655 73 437 202 492
BANCO DE ESPAÑA 380 BOLETÍN ESTADÍSTICO, FEBRUARY 2013

P P P P P P P P P P P P
1 2 3 4 5 6 7 8 9 10 11 12
22. DOMESTIC SECONDARY MARKETS FOR SECURITIES 22.7 Unstripped bonds and principal componentsA) Book-entry debt market of stripped bonds
Nominal outstanding amounts. Portfolio to maturityEUR millions
Monetary financial institutions (MFIs) excluding money market Money market funds and other funds (MMFs) financial intermediaries
Amounts Households General Rest outstanding Non-financial and government of the
corporations NPISHs world Banco de Other MFIs Collective Insurance Total España excluding Total investment corporations Rest MMFs undertakings and pension (a) funds
06 264 574 60 175 6 329 53 846 35 641 8 983 23 802 2 856 9 351 2 351 18 285 138 771 07 261 421 64 414 7 395 57 019 35 745 7 859 23 990 3 896 7 446 2 588 21 906 129 321 08 293 542 78 178 11 937 66 242 31 266 5 640 21 124 4 502 4 905 2 176 32 635 144 382 09 376 588 118 262 14 142 104 120 39 418 9 526 26 438 3 454 6 354 2 433 44 578 165 543 10 437 157 116 957 17 863 99 095 59 377 15 431 41 945 2 000 8 957 1 952 57 247 192 666
11 May 464 272 135 548 17 827 117 721 70 899 17 647 51 374 1 878 8 914 1 967 61 419 185 525 Jun 472 161 140 808 18 361 122 447 71 389 17 753 51 779 1 858 7 827 1 956 61 426 188 756 Jul 478 243 142 819 18 905 123 914 75 076 18 543 54 632 1 901 9 325 1 990 61 286 187 747 Aug 466 855 141 165 20 705 120 461 73 995 17 826 54 336 1 833 8 291 2 021 60 507 180 875 Sep 474 567 143 393 22 078 121 315 74 560 17 926 54 733 1 901 8 246 3 510 61 959 182 899 Oct 469 137 144 063 22 656 121 406 73 902 17 098 54 995 1 809 8 500 3 143 59 435 180 095 Nov 477 977 146 920 24 216 122 704 76 094 18 157 56 019 1 918 8 854 3 204 59 324 183 580 Dec 489 909 166 216 24 670 141 546 77 642 18 270 57 970 1 402 8 753 3 115 60 618 173 564
12 Jan 506 733 185 711 25 123 160 588 78 947 18 318 59 178 1 451 10 149 2 675 60 758 168 493 Feb 518 919 194 001 26 033 167 968 80 662 18 426 60 971 1 265 9 253 2 585 60 991 171 427 Mar 526 430 205 336 26 694 178 642 83 086 18 364 63 523 1 199 9 464 2 172 61 254 165 118 Apr 519 620 202 577 26 919 175 658 84 141 18 518 64 441 1 182 10 142 2 094 59 444 161 222 May 525 091 202 399 26 919 175 480 85 590 19 342 65 034 1 214 10 423 2 157 59 559 164 961 Jun 529 926 205 701 27 712 177 989 86 075 19 632 65 540 903 11 256 2 306 58 332 166 256 Jul 523 034 202 024 28 829 173 195 86 146 19 443 65 791 912 12 803 2 375 54 967 164 720 Aug 526 578 201 594 29 433 172 161 86 783 20 395 65 644 744 11 378 2 451 56 547 167 826 Sep 540 511 203 325 29 970 173 354 86 396 19 499 66 239 658 11 408 2 513 59 763 177 106 Oct 535 139 199 305 29 690 169 615 84 684 18 238 65 686 760 12 519 2 450 56 685 179 495 Nov 547 673 200 300 29 615 170 684 85 463 17 914 66 766 782 12 293 2 595 61 237 185 785 Dec 556 848 202 711 29 625 173 086 86 444 18 563 67 021 860 12 719 2 606 62 291 190 078
P P P P P P P P P P P P
1 2 3 4 5 6 7 8 9 10 11
22. DOMESTIC SECONDARY MARKETS FOR SECURITIES 22.8 Unstripped bonds and principal componentsA) Book-entry debt market of stripped bonds
Sell/buy-back transactions and repurchase agreementsEUR millions
Monetary financial institutions (MFIs) excluding money market Money market funds and other
funds (MMFs) financial intermediaries Households General Rest
Non-financial and government of the corporations NPISHs world Banco de Other MFIs Collective Insurance
Total España excluding Total investment corporations Rest MMFs undertakings and pension (a) funds
06 -48 672 34 -48 706 39 657 26 882 9 686 3 090 15 190 3 007 12 048 -21 230 07 -48 262 143 -48 405 37 774 25 500 8 559 3 715 13 119 2 117 12 898 -17 647 08 -51 468 4 -51 473 28 935 19 861 6 408 2 666 14 687 2 207 10 202 -4 563 09 -42 846 21 -42 867 14 748 10 236 3 224 1 288 8 185 690 11 155 8 069 10 -59 925 159 -60 084 7 777 8 487 -1 740 1 030 5 991 378 2 777 43 002
11 May -73 468 8 -73 475 2 150 6 158 -5 302 1 293 4 406 241 6 136 60 534 Jun -81 268 9 -81 277 596 5 741 -5 956 812 3 839 251 1 972 74 611 Jul -88 531 96 -88 627 3 212 5 237 -3 745 1 720 3 995 209 8 159 72 956 Aug -81 495 122 -81 618 -192 6 070 -8 120 1 859 4 785 214 260 76 428 Sep -93 527 28 -93 555 1 747 7 332 -8 164 2 579 3 884 246 4 659 82 990 Oct -80 985 8 268 -89 252 2 002 6 812 -7 710 2 899 3 738 202 442 74 601 Nov -81 155 11 738 -92 894 969 6 731 -8 295 2 532 3 401 238 683 75 864 Dec -85 540 1 499 -87 039 2 058 6 362 -8 019 3 715 3 748 545 5 193 73 996
12 Jan -81 483 1 106 -82 589 -561 5 269 -8 170 2 340 3 640 181 5 635 72 587 Feb -68 651 1 934 -70 584 3 163 6 721 -7 443 3 885 3 352 218 11 711 50 207 Mar -52 274 50 -52 324 1 152 6 321 -8 192 3 023 2 579 307 11 561 36 675 Apr -50 207 50 -50 257 1 255 7 489 -10 488 4 254 2 993 126 11 770 34 062 May -52 766 6 882 -59 648 1 627 6 690 -10 111 5 047 2 729 137 19 192 29 083 Jun -39 900 21 829 -61 730 -1 225 6 516 -11 332 3 590 2 017 200 16 412 22 496 Jul -30 022 17 329 -47 352 -1 794 7 016 -10 465 1 656 2 323 110 14 597 14 786 Aug -16 857 15 425 -32 281 -4 150 5 637 -11 993 2 207 2 249 128 10 513 8 115 Sep -25 123 15 370 -40 492 -4 296 5 529 -11 415 1 590 1 952 220 12 334 14 913 Oct -21 596 9 833 -31 429 -4 031 5 793 -10 974 1 149 1 916 119 14 347 9 245 Nov -18 794 8 332 -27 126 -3 681 4 999 -10 573 1 893 1 319 91 16 134 4 931 Dec -23 389 8 157 -31 547 -2 862 5 111 -9 878 1 905 1 730 221 16 718 7 582
BANCO DE ESPAÑA 381 BOLETÍN ESTADÍSTICO, FEBRUARY 2013

1 2 3 4 5 6 7 8 9 10 11 12
22. DOMESTIC SECONDARY MARKETS FOR SECURITIES 22.9 Treasury billsA) Book-entry debt market Turnover
EUR millions
Whole market Between account holders Outright Outright Repurchase Spot sell/ Forward sell Outright Outright Repurchase Spot sell/ Forward sell
Total spot forward agreements buy-back buy-back Total spot forward agreements buy-back buy-back transactions transactions transactions transactions transactions transactions transactions transactions
07 1 594 556 57 363 561 1 230 166 306 466 - 339 956 35 868 27 - 304 062 - 08 2 222 278 114 611 701 1 635 437 471 477 52 534 919 63 915 44 - 470 907 52 09 3 091 844 197 502 5 087 2 107 507 780 623 1 125 862 448 81 441 2 060 - 777 823 1 125 10 3 319 700 420 292 10 249 1 594 756 1 291 687 2 716 1 362 121 88 218 45 - 1 271 289 2 569 11 3 692 347 876 841 24 004 1 213 816 1 571 021 6 665 1 651 528 138 749 3 476 - 1 502 638 6 665 12 2 954 645 815 335 16 281 682 733 1 436 523 3 773 1 597 312 180 854 1 913 - 1 410 772 3 773
11 Jun 344 881 78 785 856 114 287 147 916 3 038 158 700 13 496 - - 142 166 3 038 Jul 368 221 63 539 1 462 129 448 173 585 188 177 635 8 704 - - 168 744 188 Aug 413 385 78 538 1 009 116 911 216 478 449 222 294 13 998 - - 207 847 449 Sep 339 949 85 909 331 98 361 155 155 192 159 880 10 945 - - 148 743 192 Oct 279 702 74 931 3 577 77 396 123 247 551 132 302 12 538 57 - 119 157 551 Nov 272 740 80 935 2 314 64 828 124 518 145 129 607 12 771 133 - 116 558 145 Dec 226 727 63 035 252 51 188 112 250 - 123 963 14 841 - - 109 122 -
12 Jan 244 508 67 293 1 551 52 286 123 328 50 134 846 15 742 - - 119 054 50 Feb 313 069 72 548 1 703 78 234 160 139 445 182 313 24 359 200 - 157 309 445 Mar 231 333 71 756 1 663 77 990 77 426 2 498 106 770 28 146 468 - 75 658 2 498 Apr 198 563 47 443 44 63 331 87 610 135 96 439 10 071 - - 86 234 135 May 208 381 47 657 413 65 520 94 791 - 108 979 14 964 - - 94 015 - Jun 234 491 49 725 1 538 62 914 120 315 - 129 435 9 443 - - 119 992 - Jul 229 671 52 251 263 47 702 129 398 56 138 803 10 079 0 - 128 668 56 Aug 225 324 55 630 1 229 44 134 124 330 - 131 838 8 281 10 - 123 546 - Sep 224 749 66 977 1 046 43 758 112 903 65 125 605 14 032 - - 111 508 65 Oct 291 977 106 304 2 529 46 487 136 518 139 147 077 15 737 10 - 131 190 139 Nov 295 605 102 616 2 301 56 115 134 188 384 148 924 17 130 466 - 130 943 384 Dec 256 974 75 137 2 000 44 262 135 575 - 146 283 12 869 758 - 132 655 -
13 Jan 271 282 109 240 1 073 40 206 120 612 150 143 225 25 092 341 - 117 642 150
1 2 3 4 5 6 7 8 9 10 11 12 13 14 15 16
22. DOMESTIC SECONDARY MARKETS FOR SECURITIES 22.10 Treasury billsA) Book-entry debt market Outright spot transactions
Turnover and interest ratesEUR millions and percentages
Turnover Interest rates
Whole market Whole market Between account holders
Up to Over Up to Over Up to Over 3 3 - 6 6 - 12 12 3 3 - 6 6 6 - 12 12 12 3 3 - 6 6 6 - 12 12 12
months months months months months months months months months months months months months months months months
07 12 031 10 497 29 736 5 099 3.84 3.95 4.01 4.04 4.06 4.06 3.80 3.92 3.99 4.03 4.07 4.06 08 20 301 26 546 67 764 - 3.67 3.73 3.69 3.73 3.73 - 3.64 3.71 3.70 3.73 3.71 - 09 47 755 69 841 79 906 - 0.69 0.77 0.87 0.95 0.95 - 0.67 0.77 0.80 1.00 0.99 - 10 104 481 90 573 177 620 47 617 0.69 1.08 1.17 1.47 1.63 2.01 0.68 1.01 1.25 1.49 1.69 2.06 11 204 213 185 694 388 302 98 632 1.58 2.20 2.51 2.85 3.16 3.35 1.58 2.09 2.35 2.70 3.04 3.25 12 194 383 201 575 334 563 84 814 0.62 1.45 1.76 2.34 2.74 2.88 0.84 1.47 1.81 2.31 2.67 2.83
11 Jun 15 809 13 651 36 266 13 059 1.40 1.83 1.67 2.31 2.69 2.89 1.41 1.68 1.79 2.26 2.69 2.96 Jul 15 195 7 835 34 020 6 490 1.77 2.00 2.54 2.67 3.52 3.53 1.80 1.86 2.45 2.59 3.29 3.51 Aug 19 100 17 237 29 408 12 793 1.48 2.16 2.55 2.85 3.34 3.43 1.39 2.06 2.33 2.94 3.25 3.44 Sep 15 805 23 739 34 466 11 899 1.32 2.35 2.70 3.18 3.62 3.19 1.45 2.10 2.59 2.88 3.33 3.56 Oct 18 617 18 511 29 824 7 979 1.63 2.74 3.50 3.78 3.63 3.74 1.69 2.59 2.97 3.27 3.47 3.49 Nov 25 759 17 865 29 414 7 896 2.79 4.22 4.76 4.21 4.68 4.77 3.54 4.29 4.59 4.58 4.75 4.88 Dec 18 423 16 694 23 489 4 430 2.49 3.56 2.94 3.70 3.66 4.42 2.05 3.00 2.87 3.40 3.45 3.52
12 Jan 18 651 24 068 17 003 7 571 0.70 2.00 2.17 2.50 2.30 2.21 0.99 1.74 1.87 2.15 2.04 2.34 Feb 15 817 16 360 30 349 10 022 0.37 0.64 0.89 1.18 1.68 1.86 0.53 0.80 0.94 1.31 1.63 1.87 Mar 14 750 16 778 28 747 11 481 0.21 0.43 0.39 0.81 1.38 1.62 0.39 0.56 0.67 1.03 1.43 1.57 Apr 12 503 9 412 20 727 4 800 0.30 0.49 1.27 1.96 2.45 2.56 0.53 0.97 1.52 2.03 2.42 2.58 May 10 161 9 986 20 204 7 307 0.32 1.05 1.59 2.51 3.10 3.27 0.56 1.29 1.78 2.50 3.27 3.30 Jun 10 383 13 272 20 524 5 544 1.13 2.41 2.33 3.59 4.49 4.19 1.50 2.40 2.54 3.56 4.18 4.17 Jul 17 180 13 719 16 260 5 092 1.13 1.93 3.07 3.28 4.02 4.41 1.42 2.03 3.11 3.26 4.05 4.14 Aug 12 141 17 547 20 592 5 350 0.43 1.55 1.97 2.56 3.20 3.37 0.70 1.39 2.00 2.55 3.09 3.19 Sep 14 209 17 150 28 295 7 323 0.76 1.64 1.86 2.51 2.67 2.88 0.79 1.62 1.73 2.44 2.63 2.86 Oct 25 324 25 186 47 549 8 244 0.66 1.86 2.02 2.45 2.60 2.81 0.76 1.72 1.97 2.44 2.54 2.73 Nov 22 566 21 572 50 618 7 860 0.58 1.69 1.90 2.49 2.64 2.79 1.00 1.59 1.90 2.38 2.42 2.75 Dec 20 698 16 522 33 696 4 220 0.81 1.62 1.66 2.17 2.36 2.52 0.94 1.49 1.65 2.08 2.26 2.48
13 Jan 24 798 19 970 53 085 11 387 0.27 0.47 0.59 1.17 1.48 1.71 0.39 0.82 0.89 1.25 1.43 1.79
BANCO DE ESPAÑA 382 BOLETÍN ESTADÍSTICO, FEBRUARY 2013

1 2 3 4 5 6 7 8 9 10 11 12 13 14 15 16
22. DOMESTIC SECONDARY MARKETS FOR SECURITIES 22.11 Treasury billsA) Book-entry debt market Spot sell/buy-back transactions
Turnover and interest ratesEUR millions and percentages
Turnover Interest rates
Whole market Whole market Between account holders
Up to
Over- 1 1 - 3 3 - 6 6 - 12 Over 12 Over- 1 1 3 6 Over- 1 1 3 6 night month months months months months night week month months months night week month months months
07 265 524 38 847 1 294 634 164 3 3.78 3.74 3.82 3.87 3.98 3.78 3.74 3.82 3.87 3.98 08 417 714 50 318 2 129 1 239 77 - 3.70 3.67 3.71 3.65 3.89 3.70 3.67 3.71 3.65 3.89 09 677 290 97 669 2 904 2 298 463 - 0.62 0.59 0.58 0.63 0.65 0.62 0.59 0.58 0.63 0.65 10 1 147 826 138 977 2 143 1 880 861 1 0.41 0.40 0.49 0.56 0.59 0.41 0.40 0.49 0.56 0.59 11 1 385 024 154 686 17 431 2 263 7 636 3 982 0.89 0.97 1.17 1.19 1.18 0.89 0.97 1.15 1.19 1.18 12 1 285 656 138 672 5 088 5 288 1 819 - 0.19 0.32 0.37 0.42 0.46 0.19 0.32 0.37 0.43 0.46
11 Jun 129 353 13 835 2 057 326 292 2 053 1.14 1.09 1.27 1.37 - 1.14 1.09 1.25 1.37 - Jul 155 142 15 272 2 640 2 432 96 1.01 1.19 1.40 1.45 1.70 1.01 1.18 1.40 1.45 1.70 Aug 198 961 16 475 667 332 43 - 0.94 1.16 1.40 1.09 - 0.95 1.16 1.40 1.09 - Sep 145 853 8 764 196 0 342 - 1.03 1.14 1.26 1.39 1.40 1.04 1.15 1.28 1.39 1.40 Oct 102 826 18 486 1 183 579 173 0 1.09 1.24 1.29 1.83 - 1.09 1.22 1.31 1.83 - Nov 111 577 11 146 382 161 250 1 003 1.01 1.11 1.51 0.87 - 1.02 1.14 1.51 0.87 - Dec 100 337 10 570 1 014 84 246 - 0.64 0.66 1.13 0.98 - 0.64 0.67 1.06 0.98 -
12 Jan 107 768 14 325 876 213 146 - 0.25 0.35 0.33 0.24 0.75 0.25 0.35 0.33 0.24 0.75 Feb 147 494 10 310 931 218 1 186 - 0.28 0.26 0.30 0.33 0.56 0.28 0.25 0.31 0.33 0.56 Mar 69 126 7 749 403 6 142 - 0.18 0.18 0.20 0.26 0.28 0.18 0.18 0.22 0.26 0.28 Apr 76 138 11 043 229 32 169 - 0.23 0.24 0.23 0.25 - 0.23 0.24 0.23 0.25 - May 81 152 13 193 89 193 164 - 0.25 0.25 0.32 0.27 0.27 0.25 0.26 0.34 0.27 0.27 Jun 111 674 8 623 16 - 1 - 0.33 0.43 0.72 0.45 - 0.33 0.44 0.72 0.45 - Jul 123 329 5 725 339 - 5 - 0.20 0.33 0.32 1.00 - 0.20 0.34 0.32 1.00 - Aug 114 696 9 360 274 - 1 - 0.16 0.35 0.41 - - 0.16 0.35 0.41 - - Sep 99 566 8 616 95 4 626 - - 0.10 0.37 0.32 0.73 - 0.10 0.37 0.34 0.73 - Oct 120 794 15 184 540 - - - 0.14 0.34 0.34 0.28 - 0.14 0.35 0.34 - - Nov 119 883 13 406 899 - - - 0.06 0.37 0.45 0.37 - 0.06 0.37 0.45 0.37 - Dec 114 036 21 139 395 - 5 - 0.13 0.36 0.45 - - 0.13 0.36 0.45 - -
13 Jan 111 246 9 005 360 - - - 0.03 0.13 0.24 0.45 - 0.03 0.13 0.24 0.45 -
1 2 3 4 5 6 7 8 9 10 11 12 13 14 15 16
22. DOMESTIC SECONDARY MARKETS FOR SECURITIES 22.12 Treasury billsA) Book-entry debt market Repurchase agreements
Turnover and interest ratesEUR millions and percentages
Turnover Interest rates
Whole market Whole market Between account holders
Up to
Over- 1 1 - 3 3 - 6 6 - 12 Over 12 Over- 1 1 3 6 Over- 1 1 3 6 night month months months months months night week month months months night week month months months
07 1 109 217 108 566 8 267 2 462 1 614 40 3.73 3.71 3.71 3.66 3.84 - - - - - 08 1 491 943 133 258 6 200 2 216 1 820 - 3.68 3.68 3.62 3.66 3.61 - - - - - 09 1 938 564 157 095 7 676 3 631 540 - 0.60 0.57 0.59 0.75 0.79 - - - - - 10 1 459 209 128 646 3 331 2 332 1 134 104 0.41 0.43 0.53 0.77 1.21 - - - - - 11 1 109 877 100 581 2 218 476 620 43 0.94 0.96 1.08 1.20 1.80 - - - - - 12 634 696 45 946 1 194 461 417 19 0.20 0.28 0.39 0.80 1.45 - - - - -
11 Jun 103 183 10 782 236 51 33 2 1.17 1.07 1.22 1.48 1.51 - - - - - Jul 119 614 9 088 664 50 29 2 1.03 1.11 1.33 1.34 1.53 - - - - - Aug 108 156 8 529 118 4 102 2 0.99 1.02 1.25 1.27 1.62 - - - - - Sep 91 129 6 949 222 18 39 4 1.07 1.05 1.20 1.48 1.69 - - - - - Oct 64 536 12 598 107 95 56 4 1.19 1.14 1.28 1.64 2.86 - - - - - Nov 57 874 6 868 62 5 17 2 1.17 1.10 1.24 1.62 2.91 - - - - - Dec 43 557 7 424 75 63 66 4 0.76 0.88 0.92 0.88 2.67 - - - - -
12 Jan 46 645 5 525 74 11 31 0 0.28 0.34 0.58 1.94 0.96 - - - - - Feb 74 059 4 081 49 24 20 1 0.29 0.30 0.36 0.49 0.68 - - - - - Mar 72 585 5 284 88 23 10 0 0.22 0.20 0.22 0.46 0.36 - - - - - Apr 56 179 6 821 191 37 103 0 0.25 0.24 0.33 0.66 0.42 - - - - - May 61 004 4 342 80 39 55 0 0.26 0.27 0.31 0.60 0.67 - - - - - Jun 60 543 2 230 54 71 14 1 0.34 0.37 0.48 0.41 2.88 - - - - - Jul 45 223 2 176 216 26 61 1 0.23 0.28 0.39 0.73 3.16 - - - - - Aug 40 845 3 167 73 40 10 1 0.15 0.25 0.45 0.70 2.11 - - - - - Sep 42 070 1 387 104 158 39 - 0.10 0.27 0.44 1.54 2.27 - - - - - Oct 41 383 4 939 110 12 29 14 0.17 0.32 0.39 0.42 1.62 - - - - - Nov 53 569 2 450 64 2 29 0 0.08 0.31 0.35 0.73 1.48 - - - - - Dec 40 591 3 544 91 20 16 0 0.08 0.23 0.44 0.86 0.75 - - - - -
13 Jan 37 624 2 475 82 7 19 - 0.05 0.17 0.27 0.52 0.40 - - - - -
BANCO DE ESPAÑA 383 BOLETÍN ESTADÍSTICO, FEBRUARY 2013

1 2 3 4 5 6 7 8 9 10 11 12
22. DOMESTIC SECONDARY MARKETS FOR SECURITIES 22.13 Unstripped State bondsA) Book-entry debt market Turnover
EUR millions
Whole market Between account holders Outright Outright Repurchase Spot sell/ Forward sell Outright Outright Repurchase Spot sell/ Forward sell
Total spot forward agreements buy-back buy-back Total spot forward agreements buy-back buy-back transactions transactions transactions transactions transactions transactions transactions transactions
07 20 745 323 3 102 825 289 719 9 446 704 7 881 970 24 106 7 132 867 414 132 875 - 6 695 946 21 914 08 17 177 609 2 063 699 256 723 7 977 282 6 854 146 25 758 6 448 129 356 611 1 151 - 6 066 296 24 072 09 14 959 220 2 250 988 137 327 6 098 191 6 452 021 20 693 6 514 750 549 774 5 048 - 5 939 748 20 179 10 14 969 687 4 178 095 135 317 3 967 325 6 628 567 60 383 7 056 407 867 166 6 935 - 6 125 074 57 600 11 16 286 745 6 034 597 176 136 2 740 862 7 286 806 48 343 7 494 864 807 646 10 925 - 6 629 648 46 646 12 11 049 008 3 907 739 131 860 1 922 506 5 048 414 38 489 5 443 583 657 874 10 478 - 4 738 052 37 179
11 Jun 1 448 475 588 501 19 623 234 163 603 546 2 643 618 673 78 898 336 - 537 418 2 022 Jul 1 432 831 554 378 15 133 203 839 649 055 10 426 663 994 64 200 547 - 588 888 10 359 Aug 1 470 778 555 254 13 579 193 354 706 807 1 784 695 467 57 891 306 - 635 487 1 784 Sep 1 471 466 531 242 16 493 204 555 713 848 5 328 704 592 52 095 1 908 - 645 333 5 256 Oct 1 338 397 489 431 17 326 191 160 637 246 3 235 634 870 53 823 613 - 577 200 3 235 Nov 1 318 350 464 616 15 773 190 503 646 038 1 420 644 162 56 912 290 - 585 575 1 386 Dec 1 136 010 378 889 11 774 179 472 563 435 2 440 581 725 60 299 164 - 519 723 1 539
12 Jan 1 210 187 407 973 10 000 195 725 594 544 1 945 625 625 73 749 246 - 549 685 1 945 Feb 1 251 463 436 682 11 557 191 424 608 940 2 859 659 619 92 491 1 549 - 562 720 2 859 Mar 1 089 496 448 623 8 714 195 137 436 137 885 513 778 115 789 382 - 396 721 885 Apr 857 059 327 667 19 679 151 687 349 266 8 761 377 342 45 956 172 - 322 453 8 761 May 951 279 331 604 19 041 175 659 423 898 1 076 446 886 47 627 264 - 398 361 634 Jun 814 520 285 398 9 453 157 325 361 549 794 389 245 41 749 127 - 346 589 780 Jul 850 647 287 299 8 359 166 142 379 076 9 770 403 415 35 213 216 - 358 963 9 023 Aug 844 555 287 332 4 787 171 342 380 702 392 392 329 27 081 17 - 364 946 285 Sep 803 411 289 685 7 844 144 178 361 160 545 386 944 45 581 1 254 - 339 564 545 Oct 915 479 327 611 9 934 147 131 423 244 7 558 463 047 55 899 879 - 398 711 7 558 Nov 796 743 253 875 12 002 125 026 404 061 1 779 435 643 45 714 2 252 - 385 898 1 779 Dec 664 170 223 990 10 488 101 730 325 837 2 125 349 712 31 026 3 122 - 313 439 2 125
13 Jan 930 937 363 874 6 824 144 118 390 995 25 126 499 853 99 119 2 139 - 373 469 25 126
1 2 3 4 5 6 7 8 9 10 11 12 13 14 15 16 17 18
22. DOMESTIC SECONDARY MARKETS FOR SECURITIES 22.14 Unstripped State bondsA) Book-entry debt market Outright spot transactions
Turnover and interest ratesEUR millions and percentages
Turnover Interest rates
Whole market Whole market Between account holders
Up to 1 - 2 2 - 3 3 - 4 4 - 6 6 - 10 10 - 20 20 - 30 3 5 10 15 30 3 5 10 15 30 1 year years years years years years years years years years years years years years years years years years
07 312 883 247 187 332 310 111 958 535 053 807 231 117 467 638 736 4.24 4.31 4.33 4.04 4.58 4.13 4.19 4.31 4.04 4.51 08 154 908 181 844 171 118 184 830 352 943 577 967 113 752 326 338 3.95 4.12 4.36 4.64 4.81 3.89 4.02 4.36 4.55 4.83 09 101 698 137 232 260 180 267 654 419 197 528 438 322 416 214 173 2.32 3.11 4.02 4.49 4.77 2.23 2.98 3.97 4.39 4.58 10 236 799 376 261 560 366 367 223 756 500 1 000 134 546 995 333 818 2.60 3.30 4.26 4.75 5.03 2.64 3.28 4.25 4.77 5.11 11 377 179 600 353 779 458 546 895 930 519 1 734 464 688 138 377 591 4.04 4.37 5.43 5.68 5.75 3.97 4.64 5.44 5.90 6.05 12 321 147 454 236 556 696 411 603 635 557 990 089 332 998 205 414 3.97 4.86 5.86 5.94 6.23 3.98 4.84 5.85 6.31 6.39
11 Jun 29 955 69 032 63 901 65 842 86 394 176 330 62 202 34 844 3.94 4.29 5.47 5.59 5.80 4.07 4.70 5.48 5.85 6.00 Jul 43 355 50 998 62 764 54 855 92 008 173 752 45 310 31 338 4.45 4.59 5.71 5.80 5.83 4.50 5.07 5.82 6.12 6.18 Aug 31 112 60 844 61 809 44 646 102 653 175 911 51 249 27 031 4.23 4.24 5.59 5.63 5.55 3.98 4.52 5.25 5.73 5.83 Sep 32 230 46 790 56 015 53 080 93 024 169 085 52 930 28 088 4.19 4.26 5.20 5.69 5.67 3.76 4.40 5.20 5.88 6.05 Oct 32 830 43 145 68 349 43 469 73 525 164 525 42 682 20 906 4.12 4.62 5.26 5.71 5.97 3.89 4.46 5.25 5.95 6.10 Nov 37 122 50 723 65 462 22 513 79 039 133 591 47 757 28 410 4.84 4.91 6.24 5.94 6.33 5.07 5.49 6.19 6.73 6.73 Dec 28 849 43 884 48 774 26 029 64 917 105 625 34 816 25 996 4.54 4.88 5.53 5.93 5.70 4.02 4.63 5.50 5.94 6.08
12 Jan 23 432 39 550 51 966 38 637 79 420 108 067 41 707 25 194 3.61 4.34 5.40 5.79 6.08 3.34 4.12 5.40 5.92 6.10 Feb 37 722 48 066 52 833 48 536 67 293 132 212 28 345 21 675 3.15 3.92 5.46 5.49 5.85 2.95 3.80 5.11 5.71 5.79 Mar 41 993 43 841 66 903 49 325 77 377 119 267 26 312 23 605 3.10 3.93 5.28 5.58 5.65 2.76 3.83 5.17 5.71 5.87 Apr 19 256 27 007 40 565 33 194 71 214 99 618 19 784 17 030 3.78 4.76 5.92 5.94 6.21 3.62 4.70 5.79 6.20 6.33 May 24 709 28 131 48 878 34 949 53 277 96 952 25 908 18 800 4.17 5.23 6.08 5.99 6.14 4.52 5.32 6.13 6.48 6.46 Jun 22 572 31 307 36 125 32 088 46 449 79 044 23 318 14 495 5.04 5.95 6.40 6.09 6.84 5.39 6.05 6.59 6.94 6.75 Jul 29 141 31 105 32 611 31 711 36 100 82 558 26 848 17 226 5.15 6.23 6.59 6.26 7.01 5.61 6.29 6.79 7.19 7.09 Aug 23 734 38 452 42 059 16 240 48 307 68 121 35 641 14 776 4.45 5.44 6.62 6.04 6.66 4.82 5.78 6.58 6.92 6.99 Sep 23 014 47 783 42 508 26 837 42 034 61 780 33 000 12 729 3.88 4.79 5.92 6.45 5.79 3.88 4.80 5.92 6.53 6.62 Oct 39 905 49 506 55 949 42 853 43 078 53 942 29 191 13 187 3.79 4.50 5.65 5.89 6.34 3.66 4.49 5.65 6.21 6.36 Nov 18 397 37 029 44 179 28 794 37 323 49 115 26 207 12 831 3.78 4.69 5.69 5.89 6.35 3.73 4.61 5.69 6.18 6.38 Dec 17 273 32 459 42 120 28 439 33 683 39 414 16 737 13 865 3.76 4.46 5.34 5.83 5.82 3.44 4.26 5.34 5.70 5.91
13 Jan 34 482 37 414 80 314 33 743 55 990 76 894 30 501 14 536 3.50 4.04 5.41 5.73 5.37 2.92 3.80 5.05 5.51 5.70
BANCO DE ESPAÑA 384 BOLETÍN ESTADÍSTICO, FEBRUARY 2013

1 2 3 4 5 6 7 8 9 10 11 12 13 14 15 16
22. DOMESTIC SECONDARY MARKETS FOR SECURITIES 22.15 Unstripped State bondsA) Book-entry debt market Spot sell/buy-back transactions
Turnover and interest ratesEUR millions and percentages
Turnover Interest rates
Whole market Whole market Between account holders
Over- Up to 1 - 3 3 - 6 6 - 12 Over 12 Over- 1 1 3 6 Over- 1 1 3 6 night 1 month months months months months night week month months months night week month months months
07 6 914 141 853 471 78 397 28 855 7 068 37 3.78 3.80 3.85 3.91 3.99 3.78 3.80 3.85 3.90 3.99 08 6 006 329 738 021 81 285 20 154 8 342 16 3.71 3.71 3.74 3.71 3.70 3.71 3.71 3.74 3.71 3.71 09 5 636 474 740 135 54 073 15 212 6 025 102 0.61 0.61 0.63 0.67 0.74 0.61 0.61 0.63 0.67 0.73 10 5 654 693 885 793 70 140 13 452 4 489 - 0.39 0.49 0.56 0.72 0.80 0.39 0.50 0.57 0.74 0.83 11 6 217 405 843 509 199 119 18 485 5 897 2 392 0.87 1.01 1.15 1.35 1.79 0.87 1.03 1.17 1.35 1.78 12 4 218 743 729 470 94 008 5 916 225 51 0.18 0.37 0.41 0.58 0.57 0.18 0.37 0.41 0.56 0.68
11 Jun 514 474 61 386 22 662 1 894 884 2 247 1.11 1.11 1.25 1.44 1.67 1.12 1.14 1.25 1.44 1.62 Jul 538 657 76 925 28 517 3 425 1 523 7 1.00 1.24 1.46 1.68 1.88 1.00 1.26 1.48 1.67 1.88 Aug 615 631 73 876 16 390 904 6 - 0.91 1.23 1.35 1.48 - 0.92 1.25 1.37 1.49 - Sep 607 523 86 338 15 809 4 148 30 - 0.99 1.13 1.18 1.42 - 0.99 1.17 1.23 1.37 - Oct 521 581 87 385 27 177 1 052 51 - 1.06 1.24 1.28 1.44 2.45 1.06 1.32 1.30 1.44 2.45 Nov 563 347 66 270 14 608 334 1 445 35 0.99 1.06 1.28 1.60 - 1.01 1.11 1.28 1.65 - Dec 444 388 109 890 8 764 371 23 - 0.63 0.82 1.04 1.51 - 0.64 0.84 1.08 1.33 -
12 Jan 469 684 92 008 32 751 101 - - 0.24 0.33 0.36 0.51 0.50 0.24 0.34 0.37 0.50 - Feb 527 314 70 413 10 308 902 4 - 0.27 0.29 0.28 0.53 0.39 0.27 0.29 0.28 0.53 0.39 Mar 385 353 42 176 6 764 1 792 - 51 0.17 0.17 0.16 0.60 - 0.17 0.18 0.16 0.60 - Apr 303 323 39 060 6 735 147 - - 0.20 0.20 0.21 0.45 - 0.20 0.21 0.21 0.45 - May 377 158 41 631 4 540 569 - - 0.24 0.27 0.31 0.61 0.55 0.25 0.29 0.32 0.61 0.55 Jun 320 118 38 631 2 568 232 - - 0.32 0.51 0.76 0.97 - 0.32 0.52 0.77 0.93 - Jul 338 244 36 043 4 477 142 171 - 0.20 0.38 0.44 0.53 1.00 0.20 0.38 0.44 0.15 1.00 Aug 318 676 58 524 3 483 10 9 - 0.14 0.45 0.45 - 0.45 0.14 0.45 0.45 - - Sep 312 125 44 302 3 627 1 065 41 - 0.09 0.41 0.43 0.47 - 0.10 0.42 0.43 0.46 - Oct 330 066 83 367 9 292 519 - - 0.14 0.47 0.51 0.44 0.35 0.15 0.47 0.51 0.67 - Nov 299 943 97 080 6 716 322 - - 0.06 0.49 0.51 0.64 0.76 0.06 0.49 0.53 0.64 0.76 Dec 236 739 86 235 2 747 117 - - 0.09 0.44 0.46 0.58 - 0.09 0.45 0.46 0.58 -
13 Jan 325 831 52 199 12 318 639 8 - 0.03 0.09 0.25 0.32 0.07 0.03 0.09 0.25 0.30 -
1 2 3 4 5 6 7 8 9 10 11 12 13 14 15 16
22. DOMESTIC SECONDARY MARKETS FOR SECURITIES 22.16 Unstripped State bondsA) Book-entry debt market Repurchase agreements
Turnover and interest ratesEUR millions and percentages
Turnover Interest rates
Whole market Whole market Between account holders
Over- Up to 1 - 3 3 - 6 6 - 12 Over 12 Over- 1 1 3 6 Over- 1 1 3 6 night 1 month months months months months night week month months months night week month months months
07 8 786 896 616 721 26 777 13 949 2 036 324 3.73 3.72 3.78 3.87 4.01 - - - - - 08 7 444 969 492 913 26 976 11 241 1 116 66 3.67 3.66 3.66 3.76 3.85 - - - - - 09 5 697 686 382 468 13 316 3 418 1 240 63 0.60 0.60 0.61 0.77 0.83 - - - - - 10 3 728 173 228 746 7 864 1 940 602 - 0.42 0.50 0.62 0.83 1.00 - - - - - 11 2 558 669 176 745 4 081 832 528 7 0.93 1.02 1.17 1.67 2.04 - - - - - 12 1 796 173 123 419 2 280 487 147 - 0.22 0.28 0.38 0.84 1.35 - - - - -
11 Jun 220 043 13 720 252 81 67 - 1.15 1.18 1.25 1.63 1.52 - - - - - Jul 191 144 12 026 559 76 26 7 1.05 1.22 1.39 1.94 1.85 - - - - - Aug 180 430 12 645 213 13 53 - 1.02 1.16 1.44 1.77 2.08 - - - - - Sep 192 801 10 956 728 68 2 - 1.11 1.17 1.40 1.55 2.16 - - - - - Oct 168 123 22 727 258 36 15 - 1.18 1.25 1.36 1.87 1.85 - - - - - Nov 177 428 12 714 325 27 9 - 1.15 1.16 1.26 2.21 4.47 - - - - - Dec 154 877 24 215 305 74 1 - 0.72 0.84 1.07 1.74 2.38 - - - - -
12 Jan 179 944 15 523 168 78 12 - 0.27 0.32 0.49 1.34 0.82 - - - - - Feb 182 673 8 551 159 31 10 - 0.30 0.31 0.35 0.67 1.03 - - - - - Mar 182 233 12 480 279 135 11 - 0.21 0.21 0.27 0.29 0.43 - - - - - Apr 138 258 13 284 119 3 23 - 0.25 0.24 0.25 1.49 0.32 - - - - - May 166 958 8 464 191 31 15 - 0.29 0.26 0.30 0.93 1.36 - - - - - Jun 150 758 6 376 104 84 3 - 0.36 0.36 0.54 0.75 1.57 - - - - - Jul 159 897 5 759 410 46 30 - 0.26 0.31 0.50 0.58 2.64 - - - - - Aug 160 968 10 230 134 3 7 - 0.19 0.27 0.42 2.19 3.16 - - - - - Sep 136 683 7 369 96 2 29 - 0.13 0.30 0.28 0.57 - - - - - - Oct 129 974 16 869 254 26 8 - 0.18 0.29 0.30 0.40 - - - - - - Nov 115 981 8 940 100 4 0 - 0.09 0.27 0.38 0.51 - - - - - - Dec 91 845 9 574 266 45 - - 0.10 0.20 0.40 0.32 0.72 - - - - -
13 Jan 134 826 8 732 370 47 142 - 0.07 0.11 0.22 0.39 1.88 - - - - -
BANCO DE ESPAÑA 385 BOLETÍN ESTADÍSTICO, FEBRUARY 2013

1 2 3 4 5 6 7 8
22. DOMESTIC SECONDARY MARKETS FOR SECURITIES 22.17 Unstripped State bondsA) Book-entry debt market Yield indices and supplementary statistics
Base December 1987 = 100 Expected risk statistics
Return indices Maturity Semielasticities
Volatility
Total Price Interest Average Duration Sensitivity Convexity return return return remaining index index index maturity
06 577.02 136.02 424.23 7.77 5.74 -6.49 -5.52 0.636 07 588.78 131.83 446.62 7.02 3.86 -4.05 -3.70 0.368 08 643.51 136.64 470.96 7.30 5.40 -6.14 -5.21 0.582 09 674.29 136.52 493.92 7.12 5.18 -5.81 -5.00 0.561 10 647.73 124.72 519.33 7.69 5.31 -5.24 -5.04 0.573 11 684.35 125.17 546.75 7.49 5.13 -5.07 -4.87 0.568
11 Jun 657.66 123.45 532.71 7.05 4.83 -4.73 -4.58 0.518 Jul 653.51 122.11 535.17 7.84 5.46 -5.09 -5.17 0.592 Aug 680.81 126.69 537.40 7.92 5.55 -5.51 -5.28 0.622 Sep 679.43 125.88 539.74 7.77 5.40 -5.32 -5.14 0.600 Oct 672.63 124.03 542.29 7.66 5.28 -5.12 -5.01 0.582 Nov 634.95 116.38 545.57 7.34 4.93 -4.35 -4.62 0.514 Dec 684.35 125.17 546.75 7.49 5.13 -5.07 -4.87 0.568
12 Jan 693.90 126.40 548.99 7.32 5.11 -5.00 -4.87 0.565 Feb 705.22 127.98 551.02 8.59 5.94 -5.95 -5.66 0.686 Mar 699.70 126.43 553.41 8.44 5.78 -5.71 -5.50 0.660 Apr 687.73 123.67 556.11 8.33 5.64 -5.42 -5.34 0.637 May 666.75 119.23 559.22 8.11 5.41 -4.96 -5.09 0.594 Jun 653.96 116.34 562.09 7.86 5.17 -4.58 -4.84 0.550 Jul 641.68 113.47 565.49 9.72 6.47 -5.36 -6.03 0.705 Aug 684.85 120.59 567.92 9.47 6.39 -5.70 -6.01 0.709 Sep 706.51 123.92 570.11 9.52 6.46 -6.03 -6.10 0.732 Oct 719.51 125.62 572.75 9.39 6.38 -6.08 -6.04 0.722 Nov 735.54 127.92 575.01 9.49 6.43 -6.23 -6.09 0.736 Dec 751.05 130.10 577.29 9.42 6.44 -6.55 -6.13 0.748
13 Jan 762.41 131.54 579.60 9.24 6.44 -6.51 -6.14 0.749
1 2 3 4 5 6 7 8 9 10 11 12
22. DOMESTIC SECONDARY MARKETS FOR SECURITIES 22.18 Principal and interest components of stripped State debtA) Book-entry debt market Turnover
EUR millions
Whole market Between account holders Outright Outright Repurchase Spot sell/ Forward sell Outright Outright Repurchase Spot sell/ Forward sell
Total spot forward agreements buy-back buy-back Total spot forward agreements buy-back buy-back transactions transactions transactions transactions transactions transactions transactions transactions
09 471 395 21 793 7 157 439 645 2 490 309 4 978 2 100 117 - 2 452 309 10 262 782 36 635 10 383 213 778 1 737 250 12 997 8 530 2 537 - 1 679 250 11 316 997 46 462 5 538 252 348 11 614 1 035 19 560 5 171 1 912 - 11 447 1 031 12 369 689 24 545 783 337 036 3 523 3 802 12 509 5 312 3 - 3 392 3 802
11 Jun 25 425 5 323 393 19 695 14 - 427 396 17 - 14 - Jul 30 241 8 445 347 19 923 1 526 - 2 029 375 129 - 1 526 - Aug 22 399 2 002 35 20 233 129 - 271 157 - - 114 - Sep 23 597 4 611 664 17 692 626 4 1 124 205 293 - 626 - Oct 30 117 1 894 262 23 985 3 976 - 4 778 672 145 - 3 961 - Nov 30 307 2 728 159 27 114 306 - 898 482 115 - 301 - Dec 30 036 1 582 72 28 100 282 - 430 148 - - 282 -
12 Jan 30 891 2 506 96 27 057 1 232 - 1 491 331 2 - 1 158 - Feb 18 810 2 360 35 16 253 146 16 463 322 - - 124 16 Mar 30 382 2 749 11 27 485 137 - 800 664 - - 137 - Apr 27 988 2 796 123 23 456 339 1 275 2 134 540 - - 319 1 275 May 31 072 2 051 165 28 280 576 - 773 197 - - 576 - Jun 29 240 1 477 72 27 339 352 - 666 316 - - 350 - Jul 35 592 2 029 29 32 187 177 1 171 2 025 677 - - 177 1 171 Aug 32 360 1 156 35 31 130 39 - 141 102 - - 39 - Sep 31 632 3 229 20 28 315 68 - 1 138 1 082 0 - 56 - Oct 36 987 1 661 73 33 849 66 1 339 1 828 424 - - 66 1 339 Nov 33 445 1 114 84 32 173 75 - 461 387 - - 75 - Dec 31 288 1 417 41 29 512 318 - 588 269 1 - 318 -
13 Jan 37 263 2 379 22 33 170 128 1 564 2 143 449 5 - 126 1 564
BANCO DE ESPAÑA 386 BOLETÍN ESTADÍSTICO, FEBRUARY 2013

1 2 3 4 5 6 7 8 9 10 11 12 13 14 15 16 17 18
22. DOMESTIC SECONDARY MARKETS FOR SECURITIES 22.19 Principal and interest components of stripped State debtA) Book-entry debt market Outright spot transactions
Turnover and interest ratesEUR millions and percentages
Turnover Interest rates
Whole market Whole market Between account holders
Up to 1 - 2 2 - 3 3 - 4 4 - 6 6 - 10 10 - 20 20 - 30 3 5 10 15 30 3 5 10 15 30 1 year years years years years years years years years years years years years years years years years years
09 934 861 1 846 1 948 1 176 4 653 5 665 4 710 2.24 3.14 4.16 4.64 4.65 2.25 3.05 4.11 4.55 4.62 10 1 642 3 035 2 215 2 782 2 956 5 544 7 580 10 882 2.69 3.41 4.47 5.00 5.22 2.63 3.41 4.48 5.27 5.26 11 2 111 4 723 1 902 2 114 3 520 5 379 7 017 19 695 3.96 4.78 5.60 6.15 6.04 3.92 4.75 5.51 6.15 6.13 12 1 393 1 226 1 131 1 327 3 165 3 885 5 209 7 209 4.06 4.96 6.19 6.58 6.42 3.86 5.02 6.11 6.38 6.64
11 Jun 101 146 106 101 242 738 454 3 435 4.12 4.68 - 6.07 6.03 3.98 4.61 - 6.00 6.07 Jul 195 130 283 160 390 507 233 6 547 4.50 5.06 5.59 6.09 5.94 4.24 5.29 5.89 6.35 - Aug 47 127 70 108 81 97 1 121 351 4.33 4.68 5.81 6.17 5.73 4.03 - - - 6.04 Sep 120 101 238 116 159 110 602 3 166 4.21 4.50 5.42 6.05 5.85 3.99 - - - 6.25 Oct 88 184 57 38 254 423 523 328 3.93 4.59 5.37 6.01 6.07 3.92 4.54 - - 6.17 Nov 104 991 28 67 381 277 329 551 4.48 5.96 6.96 6.65 6.57 - 4.80 - 7.20 6.58 Dec 92 629 16 82 153 141 181 287 3.87 5.03 5.49 6.56 6.24 4.28 5.03 - 6.00 5.83
12 Jan 46 119 33 34 145 673 517 939 3.64 4.58 5.63 6.07 5.92 3.51 4.35 - 6.07 5.98 Feb 100 134 85 121 317 729 326 548 2.82 3.88 5.47 6.27 5.99 2.81 3.88 5.53 - - Mar 260 177 228 114 235 417 547 770 2.61 4.05 5.53 6.13 6.10 2.78 3.98 5.42 6.01 - Apr 120 143 43 85 548 468 869 520 3.69 4.82 6.16 6.79 6.48 3.72 4.81 6.21 - 6.54 May 104 94 199 257 34 283 386 693 3.88 5.53 6.14 6.47 6.43 - 5.95 6.17 6.64 6.84 Jun 153 79 42 110 380 176 217 320 5.59 5.92 6.55 6.99 6.52 5.66 5.87 6.83 6.99 7.09 Jul 149 51 132 214 247 144 357 736 5.52 5.92 6.68 7.50 7.01 - 5.96 6.54 - 6.79 Aug 149 45 30 107 89 173 86 478 5.23 6.03 7.03 7.15 7.01 5.21 5.93 - - - Sep 57 84 128 99 454 166 901 1 339 4.13 5.02 6.65 6.51 6.87 3.82 5.33 - 6.52 - Oct 132 123 103 58 339 318 438 149 4.11 4.71 6.39 6.64 6.32 3.77 4.63 6.10 - - Nov 35 72 72 58 230 104 136 406 3.82 4.48 6.11 6.46 6.52 3.70 5.02 - 6.52 - Dec 87 104 35 70 147 234 428 312 3.66 4.48 5.86 6.01 5.85 3.62 4.52 - 5.96 -
13 Jan 106 105 85 103 313 132 949 586 3.07 3.94 5.80 6.03 5.78 2.93 3.78 - - -
1 2 3 4 5 6 7 8 9 10 11 12 13 14 15 16
22. DOMESTIC SECONDARY MARKETS FOR SECURITIES 22.20 Principal and interest components of stripped State debtA) Book-entry debt market Spot sell/buy-back transactions
Turnover and interest ratesEUR millions and percentages
Turnover Interest rates
Whole market Whole market Between account holders
Over- Up to 1 - 3 3 - 6 6 - 12 Over 12 Over- 1 1 3 6 Over- 1 1 3 6 night 1 month months months months months night week month months months night week month months months
09 5 764 924 318 478 - 0.36 0.34 0.26 0.45 0.90 0.36 0.34 0.26 0.45 0.90 10 278 297 657 472 - 34 0.18 0.26 0.31 1.34 0.72 0.18 0.26 0.31 1.34 0.72 11 3 798 3 838 3 668 14 6 290 0.81 0.67 1.08 1.45 - 0.78 0.67 1.08 1.45 - 12 418 1 486 1 183 68 32 337 0.11 0.19 0.92 - - 0.11 0.19 0.92 - -
11 Jun 2 12 - - - - 0.25 0.50 0.85 - - 0.25 0.50 0.85 - - Jul 39 8 1 462 - - 16 0.97 0.70 - - - 0.97 0.70 - - - Aug 34 33 14 - - 48 1.09 0.70 - - - 1.09 0.70 - - - Sep 543 39 - - - 43 1.41 0.76 - - - 1.41 0.76 - - - Oct 2 731 188 1 046 - - 11 1.19 0.96 - - - 1.19 0.96 - - - Nov 190 74 42 - - - 1.25 0.86 - - - 1.25 0.86 - - - Dec 20 87 - 5 0 170 0.63 0.41 1.25 - - 0.63 0.41 1.25 - -
12 Jan 21 131 1 069 - - 11 0.10 0.23 - - - 0.10 0.23 - - - Feb 25 53 23 - 23 23 0.22 0.24 - - - 0.22 0.24 - - - Mar 17 72 - - 0 47 0.08 0.11 - - - 0.08 0.11 - - - Apr 167 138 34 - - - 0.03 0.13 - - - 0.03 0.13 - - - May 127 353 - - - 95 0.11 0.15 - - - 0.11 0.15 - - - Jun 12 339 0 - 1 0 0.25 0.30 1.38 - - 0.25 0.30 1.38 - - Jul 10 158 8 - - 0 0.20 0.16 1.37 - - 0.20 0.16 1.37 - - Aug 5 33 - - - - 0.12 0.25 1.14 - - 0.12 0.25 1.14 - - Sep 11 34 23 - - - 0.06 0.21 - - - 0.06 0.21 - - - Oct 2 56 8 - 0 - 0.07 0.21 0.35 - - 0.07 0.21 0.35 - - Nov 2 67 1 - 0 4 0.02 0.15 1.11 - - 0.02 0.15 1.11 - - Dec 17 51 17 68 8 156 0.03 0.12 1.11 - - 0.03 0.12 1.11 - -
13 Jan 41 83 4 - - - 0.02 0.04 1.11 - - 0.02 0.04 1.11 - -
BANCO DE ESPAÑA 387 BOLETÍN ESTADÍSTICO, FEBRUARY 2013

1 2 3 4 5 6 7 8 9 10 11 12 13 14 15 16
22. DOMESTIC SECONDARY MARKETS FOR SECURITIES 22.21 Principal and interest components of stripped State debtA) Book-entry debt market Repurchase agreements
Turnover and interest ratesEUR millions and percentages
Turnover Interest rates
Whole market Whole market Between account holders
Over- Up to 1 - 3 3 - 6 6 - 12 Over 12 Over- 1 1 3 6 Over- 1 1 3 6 night 1 month months months months months night week month months months night week month months months
09 424 973 14 255 74 17 39 288 0.61 0.61 0.64 0.66 0.87 - - - - - 10 203 617 9 910 71 17 39 123 0.43 0.55 0.58 0.71 1.52 - - - - - 11 240 966 11 116 71 24 22 149 0.93 1.09 1.21 1.45 1.96 - - - - - 12 320 531 16 131 65 36 50 223 0.21 0.29 0.62 0.83 1.27 - - - - -
11 Jun 18 703 980 1 10 2 - 1.21 1.23 1.24 - - - - - - - Jul 19 764 144 7 2 0 6 1.04 1.14 1.47 1.71 3.70 - - - - - Aug 19 188 984 10 4 - 48 1.01 1.20 1.40 1.74 - - - - - - Sep 17 088 604 - - - - 1.06 1.34 1.40 - - - - - - - Oct 21 501 2 440 10 - 8 26 1.10 1.27 1.46 1.65 - - - - - - Nov 26 613 493 7 - - - 1.10 1.20 1.48 1.83 - - - - - - Dec 25 218 2 828 2 - 7 44 0.76 0.97 1.21 - - - - - - -
12 Jan 25 943 1 098 5 - - 11 0.30 0.33 0.56 0.64 - - - - - - Feb 16 093 111 6 0 22 21 0.30 0.32 0.40 0.79 0.50 - - - - - Mar 26 018 1 414 4 0 0 49 0.21 0.20 0.36 - 0.35 - - - - - Apr 21 016 2 433 7 - - - 0.25 0.25 0.32 0.41 - - - - - - May 26 968 1 307 2 1 1 1 0.29 0.29 0.40 0.60 - - - - - - Jun 26 916 419 2 - 2 - 0.39 0.37 0.99 - - - - - - - Jul 31 683 477 15 - 8 4 0.24 0.27 0.76 1.00 - - - - - - Aug 29 565 1 562 2 - 1 - 0.16 0.37 0.74 0.80 - - - - - - Sep 27 999 313 1 0 2 - 0.11 0.32 0.80 - - - - - - - Oct 30 816 3 010 11 1 8 4 0.17 0.30 0.44 1.02 - - - - - - Nov 30 452 1 707 9 2 2 1 0.07 0.23 0.70 1.39 2.10 - - - - - Dec 27 063 2 279 1 32 4 132 0.07 0.29 0.92 - 2.11 - - - - -
13 Jan 31 573 1 595 2 - 0 - 0.04 0.08 0.82 - - - - - - -
1 2 3 4 5 6 7 8 9 10 11 12 13 14 15 16
22. DOMESTIC SECONDARY MARKETS FOR SECURITIES 22.22 Unstripped State debtA) Book-entry debt market Turnover ratios
(Turnover / Outstanding amounts) * 100
Short-term State debt: Treasury bills Medium and long-term State debt: Unstripped State bonds
Outright Forward Repurchase Spot Outright Forward Repurchase Spot spot spot agreements Sell/buy-back spot spot agreements Sell/buy-back
transactions transactions transactions transactions transactions transactions
Whole Between Whole Between Whole Between Whole Between Whole Between Whole Between Whole Between Whole Between market account market account market account market account market account market account market account market account
holders holders holders holders holders holders holders holders
07 15.43 9.64 0.23 0.03 329.23 - 81.99 81.34 101.64 13.54 9.49 0.04 309.46 - 258.23 219.43 08 26.15 15.00 0.23 0.06 378.46 - 110.39 110.24 67.79 11.70 8.44 0.05 261.47 - 224.58 198.62 09 22.54 9.51 0.82 0.85 245.10 - 88.88 88.58 57.74 14.08 3.54 0.13 159.69 - 166.68 153.47 10 40.50 8.58 1.17 0.02 154.88 - 124.55 122.61 88.91 18.56 2.91 0.15 84.95 - 141.43 130.65 11 81.64 12.90 2.22 0.75 112.73 - 146.48 140.11 112.58 15.08 3.29 0.20 51.20 - 135.85 123.60 12 84.67 18.65 1.67 0.32 71.41 - 150.30 147.69 64.76 10.90 2.18 0.17 31.89 - 83.59 78.44
11 Jun 86.21 14.77 0.94 - 125.05 - 161.85 155.56 130.84 17.54 4.36 0.07 52.06 - 134.18 119.48 Jul 69.24 9.48 1.59 - 141.06 - 189.15 183.88 121.67 14.09 3.32 0.12 44.73 - 142.44 129.24 Aug 88.19 15.72 1.13 - 131.28 - 243.08 233.39 124.93 13.03 3.06 0.07 43.50 - 159.03 142.98 Sep 95.68 12.19 0.37 - 109.54 - 172.79 165.65 117.51 11.52 3.65 0.42 45.25 - 157.90 142.75 Oct 85.01 14.22 4.06 0.06 87.81 - 139.83 135.19 109.45 12.04 3.87 0.14 42.75 - 142.50 129.07 Nov 91.59 14.45 2.62 0.15 73.36 - 140.92 131.91 102.00 12.49 3.46 0.06 41.82 - 141.83 128.56 Dec 69.57 16.38 0.28 - 56.49 - 123.89 120.43 81.15 12.91 2.52 0.04 38.44 - 120.67 111.31
12 Jan 75.12 17.57 1.73 - 58.37 - 137.67 132.90 84.33 15.24 2.07 0.05 40.46 - 122.90 113.63 Feb 85.32 28.65 2.00 0.24 92.01 - 188.34 185.01 88.18 18.68 2.33 0.31 38.66 - 122.97 113.63 Mar 86.61 33.97 2.01 0.56 94.13 - 93.45 91.32 89.33 23.06 1.74 0.08 38.86 - 86.85 79.00 Apr 61.40 13.03 0.06 - 81.96 - 113.38 111.60 66.22 9.29 3.98 0.03 30.66 - 70.59 65.17 May 63.28 19.87 0.55 - 87.00 - 125.86 124.83 66.35 9.53 3.81 0.05 35.15 - 84.82 79.71 Jun 68.64 13.04 2.12 - 86.85 - 166.08 165.63 56.58 8.28 1.87 0.03 31.19 - 71.68 68.72 Jul 71.37 13.77 0.36 0.00 65.16 - 176.75 175.75 57.75 7.08 1.68 0.04 33.40 - 76.20 72.16 Aug 77.28 11.50 1.71 0.01 61.31 - 172.71 171.62 57.36 5.41 0.96 0.00 34.21 - 76.00 72.86 Sep 84.39 17.68 1.32 - 55.14 - 142.26 140.50 56.29 8.86 1.52 0.24 28.02 - 70.18 65.99 Oct 133.12 19.71 3.17 0.01 58.21 - 170.95 164.28 64.33 10.98 1.95 0.17 28.89 - 83.11 78.29 Nov 120.60 20.13 2.70 0.55 65.95 - 157.71 153.90 48.68 8.76 2.30 0.43 23.97 - 77.47 73.99 Dec 88.80 15.21 2.36 0.90 52.31 - 160.23 156.78 42.23 5.85 1.98 0.59 19.18 - 61.43 59.10
13 Jan 124.21 28.53 1.22 0.39 45.72 - 137.14 133.77 68.00 18.52 1.28 0.40 26.93 - 73.07 69.80
BANCO DE ESPAÑA 388 BOLETÍN ESTADÍSTICO, FEBRUARY 2013

1 = 2 a 7 2 3 4 5 6 7 8 9 10
22. DOMESTIC SECONDARY MARKETS FOR SECURITIES 22.23 Shares. Capitalisation on the Bolsa de MadridB) Stock exchanges
Sociedad Rectora de la Bolsa de Madrid EUR million
Resident corporations Non-resident corporations
Total Oil Basic Materials, Consumer Consumer Technology and Financial and real state and industry and goods services telecommunications services energy construction of which of which Total Alternative equity Total Latibex market
07 810 483 212 333 88 015 58 314 48 314 110 417 293 090 31 635 561 505 426 334 08 496 263 148 589 43 787 31 684 23 628 77 785 170 788 24 735 273 519 212 233 09 567 989 129 535 54 282 40 398 23 826 92 395 227 553 26 364 510 330 415 402 10 494 798 112 875 45 821 47 832 25 249 86 939 176 082 27 421 573 389 438 001 11 442 034 95 475 40 216 55 063 20 883 68 687 161 710 24 260 521 321 406 499 12 459 336 85 491 36 445 87 112 22 840 56 945 170 503 24 356 484 930 352 262
11 Aug 451 888 94 785 43 011 52 437 21 379 74 903 165 374 25 299 517 607 407 992 Sep 442 458 93 564 39 957 55 009 20 865 73 364 159 699 25 106 475 479 371 789 Oct 462 027 97 733 42 413 56 528 21 855 78 662 164 837 25 451 525 982 412 072 Nov 437 790 94 433 40 919 54 183 20 737 71 441 156 076 24 243 515 947 402 957 Dec 442 034 95 475 40 216 55 063 20 883 68 687 161 710 24 260 521 321 406 499
12 Jan 444 107 89 437 39 950 57 791 22 494 68 732 165 703 24 753 574 051 450 026 Feb 444 875 88 310 39 437 60 378 22 258 66 824 167 668 25 108 574 039 445 778 Mar 424 219 84 651 36 141 62 078 22 845 64 291 154 214 25 091 547 510 421 971 Apr 379 399 71 171 31 704 60 039 21 073 58 824 136 588 24 588 516 546 394 436 May 334 741 61 793 28 771 58 350 18 242 48 208 119 377 23 863 462 203 350 177 Jun 384 039 70 622 31 466 68 490 19 468 56 224 137 769 23 867 480 701 362 070 Jul 370 748 66 188 29 117 71 703 16 890 51 390 135 461 24 189 504 342 377 540 Aug 408 650 70 420 31 617 74 071 19 878 55 243 157 421 24 393 491 471 364 949 Sep 426 824 76 289 33 459 80 161 20 412 56 961 159 542 24 748 493 597 371 442 Oct 437 148 81 930 34 545 82 302 21 139 56 650 160 582 24 731 486 133 361 601 Nov 440 694 81 120 34 557 85 985 21 166 55 832 162 035 24 821 462 591 335 616 Dec 459 336 85 491 36 445 87 112 22 840 56 945 170 503 24 356 484 930 352 262
13 Jan 478 255 89 167 37 275 87 390 27 782 58 945 177 696 24 891 489 017 348 824
1 2=3 a 7 3 4 5 6 7 8= 9 a 12 9 10 11 12 13
22. DOMESTIC SECONDARY MARKETS FOR SECURITIES 22.24 Shares. Turnover.B) Stock exchanges
Sociedad de Bolsas and Sociedades Rectoras de las Bolsas de Valores EUR million Trading on the Stock Exchange Interconnection System Rest of trading Turnover Memorandum item:
Total public Bolsa Bolsa Bolsa Bolsa offerings Cons- Commu- Total de de de de Total Banks Electricity truction nications Rest Madrid Barcelona Bilbao Valencia
07 1 670 178 1 665 873 592 074 299 902 76 591 298 718 398 588 4 306 3 700 453 15 137 26 284 08 1 245 129 1 243 167 500 142 175 606 49 891 241 240 276 289 1 962 1 483 471 0 8 17 461 09 898 195 897 187 368 613 128 162 26 556 208 076 165 780 1 008 912 87 1 8 7 189 10 1 038 259 1 037 283 463 005 94 111 33 120 253 550 193 498 975 788 181 4 3 39 11 926 265 925 330 337 426 90 109 35 024 211 433 251 339 935 725 210 - 0 3 872 12 696 262 695 752 284 446 78 071 24 996 111 282 196 956 510 416 94 - 0 1
12 J-J 70 057 69 996 27 260 8 024 2 094 7 975 24 643 60 46 14 - 0 1 13 J-J 67 086 67 044 34 284 8 522 2 298 6 317 15 622 42 31 11 - - -
11 Oct 78 397 78 305 24 038 5 025 2 525 24 331 22 387 91 73 18 - 0 - Nov 68 702 68 616 14 298 5 976 2 988 28 183 17 171 86 67 19 - 0 - Dec 59 425 59 368 16 267 8 078 2 035 13 020 19 968 57 45 13 - 0 -
12 Jan 70 057 69 996 27 260 8 024 2 094 7 975 24 643 60 46 14 - 0 1 Feb 45 692 45 637 16 553 4 376 2 269 8 856 13 583 55 44 11 - 0 - Mar 61 373 61 315 25 652 6 504 1 971 9 921 17 267 59 46 13 - 0 - Apr 65 798 65 760 29 880 5 672 2 442 8 804 18 962 38 30 8 - 0 - May 70 119 70 077 17 289 4 988 3 379 29 301 15 121 41 33 9 - 0 - Jun 62 049 62 006 21 771 10 310 1 959 10 914 17 052 43 34 9 - 0 - Jul 70 446 70 404 36 258 12 288 1 891 5 929 14 037 42 34 8 - 0 - Aug 33 630 33 585 13 715 3 785 1 059 4 416 10 611 45 34 11 - 0 - Sep 48 788 48 745 25 558 4 991 1 234 6 803 10 159 43 38 4 - 0 - Oct 69 931 69 899 40 871 5 109 1 091 4 708 18 119 32 29 3 - - - Nov 41 854 41 825 10 819 3 455 1 394 4 807 21 351 29 26 3 - - - Dec 56 525 56 501 18 820 8 570 4 213 8 846 16 053 23 21 2 - - -
13 Jan 67 086 67 044 34 284 8 522 2 298 6 317 15 622 42 31 11 - - -
BANCO DE ESPAÑA 389 BOLETÍN ESTADÍSTICO, FEBRUARY 2013

1 2 3 4 5 6 7 8 9
22. DOMESTIC SECONDARY MARKETS FOR SECURITIES 22.25 Share price index.B) Stock exchanges
Sociedad de Bolsas and Sociedad Rectora de la Bolsa de Madrid
Madrid Stock Exchange
Dec85=100 December 2004 = 1000 IBEX-35 Index of which December Oil and Basic materials, Consumer Consumer Financial Technology and 1989 = 3000
General energy industry and goods services and real state telecommunications construction services Banks
07 1 642.01 1 928.53 2 246.78 1 738.77 1 210.90 1 564.06 1 463.31 1 610.50 14 894.2 08 975.97 1 285.55 1 112.39 1 292.13 664.52 794.88 745.96 1 146.55 11 742.7 09 1 241.72 1 250.53 1 362.39 1 632.37 879.32 1 170.75 1 119.05 1 408.16 10 092.7 10 1 003.73 1 142.42 1 155.41 1 910.66 878.81 800.18 749.12 1 227.54 10 200.7 11 857.65 1 111.65 989.76 2 019.69 665.86 649.01 596.99 971.29 9 734.6 12 824.70 933.94 910.28 3 142.23 750.17 618.38 568.30 793.86 7 583.2
12 Jan 855.17 1 036.45 987.59 2 110.51 726.97 652.06 599.03 971.86 8 509.2 Feb 852.45 1 015.10 982.09 2 208.21 712.20 658.91 605.91 942.00 8 465.9 Mar 807.46 972.11 905.46 2 264.98 737.56 599.29 549.66 907.69 8 008.0 Apr 707.48 803.78 798.00 2 192.69 689.00 505.49 462.03 827.22 7 011.0 May 617.23 697.95 719.51 2 127.64 593.06 438.08 402.96 684.04 6 089.8 Jun 718.49 798.33 799.74 2 473.07 648.32 526.43 486.85 787.50 7 102.2 Jul 680.53 727.86 748.53 2 589.06 630.92 499.22 461.60 716.17 6 738.1 Aug 749.84 783.93 800.84 2 671.80 642.69 581.25 537.12 771.57 7 420.5 Sep 777.05 844.42 836.65 2 880.67 664.15 586.94 541.16 795.87 7 708.5 Oct 790.12 899.86 862.93 2 960.65 690.19 587.81 542.31 790.02 7 842.9 Nov 798.04 899.23 862.26 3 086.71 690.54 597.68 551.71 780.14 7 934.6 Dec 824.70 933.94 910.28 3 142.23 750.17 618.38 568.30 793.86 8 167.5
13 Jan 848.79 956.25 934.27 3 099.31 806.97 640.57 588.58 822.00 8 362.3
13 Jan 1S 853.93 949.77 954.68 3 173.93 794.10 648.46 595.67 814.48 8 435.8 2S 880.56 962.33 973.84 3 140.68 805.82 681.62 626.42 843.60 8 664.7 3S 874.32 970.60 956.24 3 134.20 805.54 672.93 618.67 837.19 8 604.0 4S 885.86 993.31 967.48 3 195.95 828.38 679.72 625.52 840.28 8 724.6
1 2 3 4 5 6 7
22. DOMESTIC SECONDARY MARKETS FOR SECURITIES 22.26 Price earning ratioB) Stock exchanges Bolsa de Madrid
Sociedad Rectora de la Bolsa de Madrid
Price earning ratio Oil Basic Materials, Consumer Consumer Financial Technology and
General and industry and goods services and real state telecommunications energy construction services
06 15.04 12.56 16.92 30.25 28.20 13.71 13.53 07 12.08 14.16 9.11 25.46 19.18 10.16 12.38 08 8.16 7.49 6.09 16.65 12.28 7.60 11.52 09 14.38 13.00 18.70 25.40 33.58 13.56 11.92 10 9.83 10.22 9.81 19.06 22.86 8.84 7.68 11 9.75 7.46 7.70 20.30 12.78 8.81 15.13
11 Jul 9.41 8.30 7.66 19.30 17.02 9.69 7.79 Aug 8.55 7.54 6.97 18.08 13.82 8.70 7.34 Sep 8.59 7.45 6.47 18.63 13.27 9.16 7.20 Oct 8.95 7.75 7.29 21.07 13.29 9.01 7.74 Nov 9.64 7.38 7.60 20.37 12.71 8.41 15.76 Dec 9.75 7.46 7.70 20.30 12.78 8.81 15.13
12 Jan 10.66 6.84 7.43 21.08 14.14 11.80 15.17 Feb 12.86 10.40 13.96 22.52 18.69 12.80 10.72 Mar 12.30 9.97 12.78 22.43 19.24 11.87 10.34 Apr 11.35 8.37 11.24 21.28 27.42 11.18 9.48 May 10.28 6.68 12.14 20.49 25.45 9.93 9.16 Jun 11.76 7.63 13.27 24.55 16.88 11.89 10.49 Jul 13.22 7.37 21.65 25.34 15.80 16.66 9.88 Aug 16.38 7.85 ... 25.67 19.89 21.92 11.16 Sep 17.14 8.50 ... 26.68 20.43 22.66 11.50 Oct 18.79 9.10 ... 26.90 21.54 31.88 11.43 Nov 17.50 8.77 ... 27.49 21.18 35.50 8.32 Dec 18.16 9.24 ... 27.86 22.94 36.92 8.48
BANCO DE ESPAÑA 390 BOLETÍN ESTADÍSTICO, FEBRUARY 2013

1 2 3 4 5 6 7 8 9 10 11 12
22. DOMESTIC SECONDARY MARKETS FOR SECURITIES 22.27 Bonds. TurnoverB) Stock exchanges
Sociedades Rectoras de las Bolsas de Valores EUR million
Turnover Breakdown by Stock market Breakdown by instruments Public Funds Others debentures
Total Bolsa Bolsa Bolsa Bolsa de de de de Madrid Barcelona Bilbao Valencia Total Treasury Other Total Banks Electrics Other notes and Finance
07 89 600 482 85 259 3 747 113 86 352 33 86 319 3 248 446 1 2 802 08 79 578 1 161 76 749 1 470 198 71 827 46 71 781 7 751 1 525 0 6 226 09 75 103 603 67 675 6 642 183 71 736 54 71 681 3 367 641 0 2 727 10 67 454 414 62 580 4 082 377 63 741 340 63 401 3 713 327 0 3 386 11 70 978 832 67 875 2 145 125 66 967 791 66 177 4 010 1 769 0 2 242 12 60 247 1 796 56 609 1 534 309 57 370 1 184 56 186 2 877 1 268 0 1 609
12 J-J 4 595 82 4 395 115 4 4 490 108 4 382 105 13 - 92 13 J-J 2 883 14 2 652 210 6 2 853 3 2 851 30 21 - 8
11 Oct 4 071 8 3 938 118 8 4 057 3 4 054 15 13 0 2 Nov 13 191 93 12 843 249 6 12 308 120 12 187 883 14 - 869 Dec 4 652 100 4 281 253 17 4 474 97 4 377 177 35 - 142
12 Jan 4 595 82 4 395 115 4 4 490 108 4 382 105 13 - 92 Feb 5 239 133 4 783 317 5 5 040 150 4 890 199 31 - 168 Mar 5 458 133 4 955 149 221 4 865 150 4 715 593 226 - 367 Apr 5 699 11 5 556 129 3 5 684 2 5 682 15 12 0 3 May 6 897 780 5 970 143 4 6 112 139 5 973 786 681 - 104 Jun 3 875 160 3 624 88 3 3 829 177 3 651 47 23 0 24 Jul 5 057 217 4 734 84 22 4 374 278 4 097 683 55 - 628 Aug 3 945 43 3 799 82 21 3 879 3 3 877 66 64 - 3 Sep 6 081 143 5 875 61 1 6 045 171 5 874 36 27 - 9 Oct 4 267 19 4 140 106 1 4 044 2 4 042 223 50 0 173 Nov 6 008 11 5 920 74 3 5 975 3 5 972 33 16 - 17 Dec 3 124 63 2 856 184 21 3 034 2 3 032 90 70 - 20
13 Jan 2 883 14 2 652 210 6 2 853 3 2 851 30 21 - 8
1 2 3 4 5 6 7 8 9 10
22. DOMESTIC SECONDARY MARKETS FOR SECURITIES 22.28 AIAF fixed-income marketC) Other securities markets Commercial paper
EUR millions and percentages Turnover Interest rates
Outstanding amount Of wich: Up to Over
6 1 1 3 6 12 18 Total Between months year year months months months months members
07 99 250 557 018 40 271 329 505 187 602 39 911 4.12 4.35 4.49 4.49 08 73 105 577 692 83 640 372 693 84 214 120 785 4.43 4.81 4.89 4.94 09 42 090 529 013 127 692 445 348 46 787 36 878 1.00 1.50 1.67 0.99 10 23 580 383 282 98 273 291 629 53 399 38 253 0.84 1.36 1.62 0.31 11 37 549 225 414 49 235 177 447 16 704 31 263 1.92 2.47 3.11 2.82 12 65 291 193 216 71 745 128 808 49 442 14 966 2.37 2.74 3.24 3.45
11 Jun 22 123 18 622 4 312 11 806 1 705 5 112 1.94 2.03 2.80 3.35 Jul 21 920 17 481 3 360 13 311 1 329 2 841 2.01 2.42 3.10 - Aug 21 667 13 093 2 385 7 827 1 394 3 872 1.55 2.74 3.50 3.35 Sep 18 814 18 699 5 508 13 686 1 327 3 686 2.22 2.36 3.34 3.55 Oct 26 450 16 360 4 013 11 748 1 883 2 728 2.22 2.59 3.44 3.46 Nov 31 970 14 608 3 136 11 652 1 269 1 687 2.17 3.27 3.53 3.65 Dec 37 549 21 605 3 547 18 219 1 520 1 866 2.70 3.38 3.66 3.71
12 Jan 44 048 17 899 4 576 12 741 1 911 3 247 2.64 3.12 3.65 3.81 Feb 52 646 19 285 5 074 13 867 3 212 2 206 2.71 2.98 3.42 3.67 Mar 62 371 20 073 7 288 15 145 3 313 1 615 2.19 2.61 3.23 3.55 Apr 61 379 14 941 4 673 10 601 3 088 1 253 2.01 2.56 3.08 3.37 May 64 905 12 761 2 131 8 402 3 792 567 2.32 2.55 3.05 3.17 Jun 66 983 14 749 5 001 9 927 4 288 534 2.17 2.55 3.18 3.23 Jul 76 546 28 533 19 721 11 021 16 791 721 2.03 2.37 2.52 3.16 Aug 78 335 10 448 4 032 5 800 3 997 651 1.93 2.28 2.74 3.01 Sep 75 778 13 059 4 309 10 210 1 859 990 1.95 2.16 2.92 2.93 Oct 69 985 12 972 4 438 9 753 2 451 768 2.81 3.26 3.76 3.88 Nov 69 393 14 126 4 331 9 657 3 670 799 2.63 3.21 3.72 3.84 Dec 65 291 14 369 6 170 11 685 1 069 1 616 3.00 3.22 3.63 3.82
13 Jan 61 142 13 351 4 840 11 042 467 1 842 2.74 3.12 3.37 3.52
BANCO DE ESPAÑA 391 BOLETÍN ESTADÍSTICO, FEBRUARY 2013

1 2 3 4 5 6 7 8 9 10 11 12 13 14 15 16 17 18
22. DOMESTIC SECONDARY MARKETS FOR SECURITIES 22.29 AIAF fixed-income marketC) Other securities markets Bonds
EUR millions and percentages Non-residents: Issues in Spain (Matador bonds) Mortgage bonds Other bonds Maturity breakdown Of wich: Over 2 years Of wich: Over 2 years
Turnover Turnover Over 2 years Over 6 years Turnover Turnover Between Turnover Interest Average Between Turnover Interest Average members rate maturity members rate maturity Turnover Interest Average Turnover Interest Average rate maturity rate maturity
07 558 690 1 404 1 0.79 2.0 1 0.79 2.0 80 283 13 746 74 965 4.76 8.5 477 003 229 166 437 029 4.67 25.6 08 1 825 468 15 14 1.62 4.4 6 1.28 3.2 123 592 77 712 98 700 4.98 6.8 1 701 861 1 512 552 1 546 705 5.25 21.6 09 3 169 995 62 62 0.75 2.7 8 - 1.0 246 563 192 625 199 936 3.84 8.6 2 923 370 2 704 080 2 616 889 3.46 23.7 10 3 277 590 183 183 0.66 3.6 41 0.72 3.1 265 969 199 518 193 553 3.78 5.1 3 011 438 2 817 980 2 342 408 3.74 20.2 11 5 223 087 133 126 2.92 4.8 71 1.89 5.9 601 058 514 645 474 298 4.65 5.1 4 621 897 4 405 259 4 071 167 5.00 29.1 12 2 375 540 525 437 1.65 6.8 102 1.13 6.3 929 332 792 894 572 093 4.70 5.1 1 445 684 1 255 878 1 128 477 5.80 19.2
11 Jun 435 465 12 12 3.52 6.7 5 3.84 10.4 34 006 31 127 9 211 4.79 5.8 401 447 382 258 357 686 5.03 29.9 Jul 375 846 5 5 3.83 4.0 2 4.58 6.9 40 664 36 672 27 297 4.81 4.5 335 178 321 128 299 185 5.23 27.6 Aug 459 970 33 33 3.43 7.2 13 3.43 10.2 24 265 20 516 17 754 4.72 5.3 435 672 421 543 404 690 4.56 34.5 Sep 305 165 20 14 2.51 7.7 9 2.87 10.1 31 686 26 417 27 066 4.52 6.7 273 459 255 003 255 290 4.12 34.3 Oct 447 410 17 17 3.35 10.0 17 3.35 10.0 81 530 69 709 73 826 3.73 4.5 365 864 342 788 316 804 4.13 21.6 Nov 362 395 5 5 1.80 3.0 - - - 73 126 69 063 59 827 5.33 5.0 289 264 274 984 255 783 5.78 21.0 Dec 363 783 1 1 8.78 4.9 - - - 89 625 77 726 71 336 4.07 4.6 274 157 253 169 245 855 5.21 27.2
12 Jan 374 436 - - - - - - - 75 183 68 462 39 257 6.03 4.4 299 253 272 996 249 916 5.95 26.1 Feb 177 974 2 2 - 4.7 - - - 75 593 57 186 60 209 3.93 4.8 102 380 79 912 83 711 4.79 19.0 Mar 146 532 10 6 - 6.1 3 - 8.0 77 780 64 338 72 352 4.01 6.5 68 742 39 765 59 846 4.43 19.6 Apr 64 740 27 27 3.22 9.5 27 3.22 9.5 26 946 22 649 21 416 4.17 5.7 37 768 20 417 30 193 5.26 19.1 May 128 138 276 199 1.86 4.7 3 3.35 6.1 31 378 20 475 23 812 5.01 5.1 96 483 77 817 76 129 5.36 13.1 Jun 263 119 5 5 2.09 4.1 0 - 6.1 99 923 65 932 79 844 5.60 5.7 163 190 151 218 117 930 6.24 8.5 Jul 138 496 22 22 - 14.6 22 - 14.6 73 476 59 503 41 062 5.67 4.9 64 997 53 734 45 738 7.92 14.2 Aug 182 292 21 21 2.32 12.6 21 2.32 12.6 90 851 82 580 43 225 5.81 3.8 91 420 77 847 69 744 8.30 14.4 Sep 198 947 118 118 2.94 4.3 - - - 119 091 115 242 50 588 4.80 3.6 79 738 72 377 60 894 7.06 18.2 Oct 334 827 21 21 2.81 7.7 17 2.29 9.0 133 408 126 082 45 894 4.29 4.3 201 398 191 212 150 771 5.12 25.2 Nov 160 763 13 7 2.62 4.1 - - - 31 909 26 013 15 083 3.59 3.9 128 840 122 625 106 203 4.86 33.0 Dec 205 275 9 9 2.05 8.8 9 2.05 8.8 93 793 84 432 79 348 3.38 9.0 111 473 95 957 77 402 4.25 19.6
13 Jan 140 150 - - - - - - - 65 550 54 773 60 101 3.23 6.4 74 600 61 939 50 431 4.14 12.4
1 2 3 4 5 6 7 8 9 10 11 12
22. DOMESTIC SECONDARY MARKETS FOR SECURITIES 22.30 Official options and futures marketsC) Other securities markets Equities and fixed-income
Traded volume and open interestThounsands of contracts
Equities Fixed-income: 10-year bond
Financial futures Financial options
Ibex-35 Stocks Ibex-35 Stocks Financial futures Financial options
Traded Open Traded Open Traded Posiciones Traded Open Traded Opne Traded Open volume interest volume interest volume abiertas volume interest volume interest volume interest
07 8 722 64 21 294 1 820 567 131 13 593 4 312 - - - - 08 7 605 60 46 238 1 620 829 168 18 317 4 669 - - - - 09 5 752 55 44 587 799 436 94 33 510 7 728 - - - - 10 6 639 43 19 684 1 679 297 54 37 607 8 553 - - - - 11 5 591 48 27 579 1 948 220 37 29 410 8 898 - - - - 12 4 988 51 21 246 1 307 421 57 34 507 8 261 - - - -
11 Jun 495 50 5 659 2 152 19 63 2 559 9 799 - - - - Jul 524 52 890 1 833 20 70 1 272 10 449 - - - - Aug 602 47 178 1 778 18 73 1 505 11 204 - - - - Sep 441 42 4 162 1 488 22 68 3 008 11 402 - - - - Oct 356 42 642 1 220 13 70 1 981 12 395 - - - - Nov 367 42 1 876 1 853 20 75 2 929 13 393 - - - - Dec 283 48 3 387 1 948 28 37 4 183 8 898 - - - -
12 Jan 304 49 2 006 2 122 10 40 2 979 10 750 - - - - Feb 327 48 765 2 221 13 45 1 964 11 960 - - - - Mar 441 55 4 318 1 739 25 52 4 502 11 069 - - - - Apr 587 61 1 518 1 855 29 64 1 681 11 822 - - - - May 626 53 1 731 1 324 39 79 2 380 13 369 - - - - Jun 566 51 3 109 1 056 37 70 4 209 11 082 - - - - Jul 515 45 942 860 40 80 2 099 12 250 - - - - Aug 374 45 51 850 33 87 2 011 13 395 - - - - Sep 357 49 2 404 1 661 49 87 4 888 12 822 - - - - Oct 338 52 1 951 1 108 44 96 1 776 13 172 - - - - Nov 289 47 524 1 107 42 107 1 857 13 905 - - - - Dec 264 51 1 926 1 307 57 57 4 163 8 261 - - - -
13 Jan 329 64 1 860 1 105 40 63 2 088 9 177 - - - -
BANCO DE ESPAÑA 392 BOLETÍN ESTADÍSTICO, FEBRUARY 2013

CHAPTER 23 OUTPUT AND DEMAND

M PM PM PM PM PM P
M PM P
P P P P
P P P P P P P P P P P P
1 2 3 4 5 6 7 8 9 10
23. OUTPUT AND DEMAND 23.1 Summary tableA) Industrial production index
Instituto Nacional de Estadística 2005 = 100 Breakdown by industry (NACE 2009) Breakdown by market sector
Total Mining Manufac- Electricity, Energy Capital Inter- Consumer goods index and turing gas, steam goods mediate quarrying and air goods conditioning Total Durable Non-durable supply consumer goods
06 103.7 102.9 104.0 100.6 101.0 107.7 103.6 102.1 108.3 100.9 07 106.2 103.7 106.6 102.7 101.8 113.0 105.3 104.4 112.0 103.0 08 98.6 89.5 98.3 103.8 103.5 103.2 93.7 99.6 93.6 100.7 09 82.6 67.8 81.5 95.9 94.6 79.9 73.7 90.8 67.1 95.2 10 83.4 70.8 82.0 98.7 97.0 77.3 75.7 91.6 62.1 97.0 11 81.9 60.4 80.9 95.1 93.5 77.6 73.7 90.3 55.3 96.7
11 J-D 81.9 60.4 80.9 95.1 93.5 77.6 73.7 90.3 55.3 96.7 12 J-D 77.0 48.9 75.8 95.0 94.3 69.3 68.4 86.2 49.1 92.9
11 Sep 84.9 64.8 84.4 93.0 91.7 83.4 75.7 94.8 61.2 101.0 Oct 81.1 61.5 80.6 89.5 88.0 77.5 73.9 90.0 54.9 96.4 Nov 84.0 58.4 83.5 93.7 93.1 80.9 74.7 94.3 56.7 101.1 Dec 74.2 46.0 72.2 99.7 97.3 68.0 61.1 85.5 48.0 92.4
12 Jan 78.4 55.2 76.0 106.4 102.7 65.4 68.6 89.7 47.2 97.5 Feb 80.8 57.2 78.7 105.6 100.0 73.4 73.3 87.3 51.1 93.9 Mar 82.7 59.5 81.6 98.2 95.5 76.9 75.3 90.8 54.8 97.4 Apr 72.3 57.8 70.9 89.5 87.7 64.5 67.0 78.1 44.4 84.2 May 82.0 56.2 81.7 90.4 89.1 76.6 75.3 91.6 55.7 98.1 Jun 80.7 39.9 80.7 88.5 87.9 75.4 73.6 90.8 52.3 97.8 Jul 82.5 41.6 82.1 94.9 98.8 77.2 72.8 91.9 54.8 98.6 Aug 62.5 39.4 59.5 95.4 97.3 44.2 51.6 74.1 35.1 81.2 Sep 74.6 47.5 73.7 88.9 90.0 67.5 66.5 83.4 48.4 89.8 Oct 81.8 51.7 81.5 91.3 93.0 75.8 73.2 92.4 55.3 99.2 Nov 78.1 44.7 77.3 92.5 92.3 70.5 69.2 88.9 50.6 95.9 Dec 67.9 35.9 65.4 98.2 97.4 63.9 54.7 74.8 39.8 81.2
M PM PM PM PM PM P
M PM P
P P P P
P P P P P P P P P P P P
1 2 3 4 5 6 7 8 9 10
23. OUTPUT AND DEMAND 23.2 Breakdown by industry (NACE 2009)A) Industrial production index Mining and quarrying and manufacturing
Instituto Nacional de Estadística 2005 = 100
Mining and quarrying Manufacturing
Total Mining of Other Total Food Beverages Tobacco Textiles Wearing Leather coal and mining products products apparel and lignite and related quarrying products
06 102.9 102.0 103.9 104.0 100.3 101.3 84.9 96.6 97.5 94.1 07 103.7 97.4 106.5 106.6 102.4 101.6 86.8 92.3 96.0 85.7 08 89.5 91.4 89.8 98.3 101.4 102.5 84.5 76.6 87.9 79.3 09 67.8 76.0 65.5 81.5 100.7 97.3 74.4 60.6 70.6 63.2 10 70.8 82.6 67.2 82.0 102.8 91.7 70.8 65.0 63.5 64.6 11 60.4 56.2 60.5 80.9 102.7 89.8 67.3 63.4 55.7 67.8
11 J-D 60.4 56.2 60.5 80.9 102.7 89.8 67.3 63.4 55.7 67.8 12 J-D 48.9 45.4 47.5 75.8 98.6 89.3 66.8 60.8 53.4 64.2
11 Sep 64.8 68.8 63.0 84.4 104.8 96.1 67.1 73.0 59.6 76.4 Oct 61.5 73.1 57.2 80.6 101.0 88.4 91.0 64.0 47.1 63.7 Nov 58.4 64.9 55.6 83.5 106.6 99.6 81.5 63.7 44.9 61.3 Dec 46.0 44.3 44.7 72.2 111.1 90.4 58.0 53.7 43.1 55.6
12 Jan 55.2 77.9 48.4 76.0 110.6 70.8 61.2 59.1 59.5 75.9 Feb 57.2 76.4 51.5 78.7 96.6 70.7 69.7 66.5 67.4 82.7 Mar 59.5 71.7 55.5 81.6 99.6 85.6 71.2 67.0 59.3 71.1 Apr 57.8 60.8 49.3 70.9 86.6 82.2 59.7 58.6 50.2 52.6 May 56.2 50.4 56.9 81.7 100.4 100.5 81.5 69.5 48.8 62.7 Jun 39.9 6.9 47.3 80.7 98.6 104.1 80.1 66.7 53.6 69.0 Jul 41.6 8.4 49.5 82.1 99.0 107.0 70.1 64.9 63.3 76.7 Aug 39.4 41.8 38.2 59.5 95.5 91.9 37.5 30.5 55.9 54.6 Sep 47.5 42.2 48.2 73.7 93.4 87.0 67.0 61.4 53.3 59.3 Oct 51.7 51.0 49.9 81.5 106.4 91.2 80.4 70.0 50.4 57.6 Nov 44.7 36.4 41.2 77.3 102.1 99.5 71.6 63.8 41.6 54.9 Dec 35.9 21.4 34.3 65.4 94.5 80.6 51.6 51.2 37.3 53.2
BANCO DE ESPAÑA 394 BOLETÍN ESTADÍSTICO, FEBRUARY 2013

M PM PM PM PM PM P
M PM P
P P P P
P P P P P P P P P P P P
1 2 3 4 5 6 7 8 9 10
23. OUTPUT AND DEMAND 23.3 Breakdown by industryA) Industrial production index Manufacturing (continued I)
Instituto Nacional de Estadística 5000 = 100
Manufacturing
Wood and pro- Paper Printing Coke and Chemicals Basic phar- Rubber Other non- Basic Fabricated ducts of wood and and repro- refined and maceutical and plastic metallic metals metal prod- and cork, ex- paper duction of petroleum chemical products products mineral ucts, ex- except furni- products recorded products products and pharma- products cept ma- ture; articles media ceutical chinery and
of straw and prepara- equipment plaiting tions
materials
06 101.9 101.2 100.7 101.9 101.4 109.8 102.1 104.0 106.1 104.5 07 98.8 102.9 106.0 100.2 103.7 117.7 104.2 102.7 106.9 109.1 08 77.5 101.1 94.4 104.1 98.3 126.9 93.1 81.1 99.8 98.6 09 58.2 91.8 82.5 93.3 96.4 126.9 77.4 57.5 75.5 75.7 10 54.0 96.5 83.1 94.1 101.0 138.9 83.7 54.6 84.1 70.8 11 51.1 97.1 86.2 93.4 101.2 137.1 82.4 49.9 84.5 69.9
11 J-D 51.1 97.1 86.2 93.4 101.2 137.1 82.4 49.9 84.5 69.9 12 J-D 44.0 97.3 74.0 97.7 100.5 139.6 74.9 41.6 77.3 59.6
11 Sep 47.4 98.9 78.6 91.2 105.3 150.1 86.3 50.3 86.3 74.2 Oct 52.7 97.9 87.8 85.7 98.4 143.4 83.1 50.1 87.7 68.8 Nov 56.9 98.8 91.0 94.8 98.0 148.9 82.9 48.0 83.5 70.2 Dec 48.8 84.0 75.2 96.8 91.2 115.7 64.0 36.2 61.9 52.0
12 Jan 43.0 99.2 75.3 96.0 95.3 146.3 80.3 40.9 80.9 58.6 Feb 49.0 100.7 75.3 88.0 108.1 150.5 80.3 44.9 84.2 63.1 Mar 50.7 106.4 84.5 91.3 107.3 157.0 84.4 46.1 89.5 61.9 Apr 44.1 94.4 73.9 85.8 100.4 127.4 74.6 41.2 75.9 55.0 May 49.7 104.1 80.0 90.0 109.4 153.4 79.2 47.0 85.5 66.8 Jun 47.1 101.1 72.3 94.9 109.5 154.2 77.1 46.0 83.1 66.3 Jul 47.2 105.6 65.3 119.0 108.9 155.4 81.7 45.7 77.5 65.5 Aug 25.2 80.8 71.0 108.5 85.9 77.7 61.0 32.2 54.8 42.5 Sep 36.2 93.3 70.4 98.2 89.3 138.7 73.8 41.1 79.9 57.9 Oct 46.4 101.1 77.9 101.9 108.1 155.7 78.0 44.0 82.5 67.0 Nov 49.6 97.8 76.6 96.3 101.5 150.4 70.6 39.5 77.9 60.9 Dec 40.1 83.6 65.7 102.2 82.1 108.9 58.2 30.6 55.6 49.2
M PM PM PM PM PM P
M PM P
P P P P
P P P P P P P P P P P P
1 2 3 4 5 6 7 8 9
23. OUTPUT AND DEMAND 23.4 Breakdown by industryA) Industrial production index Manufacturing (continued II) and others
Instituto Nacional de Estadística 2005 = 100
Manufacturing Electricity, gas, steam and air
Computer, Electrical Machinery Motor vehicles Other Furniture Other Repair and conditioning electronic equipment and trailers and transport manufac- installation supply and optical equipment semi-trailers equipment turing of products n.e.c. machinery
and equipment
06 103.8 111.2 114.7 105.0 100.4 108.7 103.5 153.4 100.6 07 111.0 114.2 125.5 108.8 107.5 113.9 103.7 145.0 102.7 08 114.2 107.0 114.6 92.8 113.8 91.4 95.6 157.7 103.8 09 84.2 78.1 84.0 66.8 99.7 63.6 80.0 131.2 95.9 10 86.7 76.0 80.4 75.0 88.2 58.1 84.4 106.3 98.7 11 69.8 75.0 85.3 78.6 75.0 52.6 84.3 100.8 95.1
11 J-D 69.8 75.0 85.3 78.6 75.0 52.6 84.3 100.8 95.1 12 J-D 58.7 74.0 84.3 70.4 65.3 45.1 78.6 93.8 95.0
11 Sep 75.8 78.1 87.1 90.2 75.9 57.0 90.8 101.3 93.0 Oct 65.7 74.5 85.4 81.8 72.7 52.0 86.8 106.2 89.5 Nov 69.2 87.4 92.3 84.6 77.9 53.3 91.0 104.1 93.7 Dec 70.5 72.5 98.1 53.7 65.4 45.6 63.7 129.9 99.7
12 Jan 52.5 75.2 74.1 72.0 61.9 41.9 80.9 75.0 106.4 Feb 60.8 79.7 81.2 80.0 75.8 46.5 87.1 95.7 105.6 Mar 71.2 79.7 91.4 81.7 77.7 50.3 88.2 94.3 98.2 Apr 53.2 65.8 75.8 67.7 61.7 43.1 76.1 87.4 89.5 May 67.4 78.9 89.7 79.8 73.8 51.6 89.0 97.5 90.4 Jun 67.7 77.2 92.5 76.2 70.7 48.6 82.2 104.8 88.5 Jul 62.3 78.1 93.8 77.3 69.8 53.3 87.2 99.9 94.9 Aug 42.1 53.0 56.4 35.4 42.3 31.9 44.2 85.1 95.4 Sep 52.4 75.5 82.3 73.1 62.9 43.7 79.7 87.8 88.9 Oct 59.8 81.8 92.6 76.3 71.4 49.4 84.6 95.2 91.3 Nov 57.8 79.8 86.0 73.0 64.6 44.5 84.0 100.4 92.5 Dec 56.6 63.0 95.2 51.7 51.2 36.5 59.6 102.8 98.2
BANCO DE ESPAÑA 395 BOLETÍN ESTADÍSTICO, FEBRUARY 2013

P
1 2 3 4 5 6 7 8 9 10 11 12 13 14 15
23. OUTPUT AND DEMAND 23.5 Gross domestic production and consumptionB) Energy indicators of primary energy
Quarterly Energy Bulletin, Ministerio de Industria, Energía y Turismo Thousands of equivalent tons of oil and percentage
Gross domestic production Gross domestic consumption Primary electricity Natural Renewable Natural Primary Renewable Degree
Total Oil Coal gas energies Total Oil Coal gas electricity energies of self- Total Hydroelec- Nuclear (a) (a) sufficiency tric (%)
08 30 349 129 4 193 14 17 378 2 009 15 369 8 634 142 026 68 342 13 487 34 903 16 428 8 866 21.3 09 29 968 107 3 627 12 16 021 2 271 13 750 10 201 129 764 63 283 9 556 31 219 15 324 10 381 23.1 10 34 325 126 3 033 51 19 791 3 636 16 155 11 324 130 133 60 993 7 156 31 182 19 074 11 727 26.4 11 30 929 101 2 287 46 17 655 2 631 15 024 10 841 129 340 58 317 12 456 28 930 17 131 12 506 23.9
P P
P P P P P P P P
P P P P P P
over the year.
Note: For all the monthly data, the annual figures do not always coincide with the annual addition of the monthly figures, in which case the difference is distributed evenly
each month in the annual total in the series not included in consumption for final use.
from April 2008. Accordingly, from January 2005 to March 2008, the montly data were estimated by applying to the available annual totals the percentage accounted for by
the inclusion for the first time of consumption for the final use of these energies. The change affects these series from January 2005. The monthly series are only available
(Renewable energies)". In 2010 Q2 there was a methodological change in the series relating to the production and consumption of "Renewable energies". This involves
a. To December 2002 this includes:"Wind energy, urban solid waste and other solid fuels". From January 2003:"Wind energy, solar energy, biomass and residues
11 J-J 15 414 55 972 20 8 877 1 762 7 115 5 490 64 393 29 186 5 211 15 094 8 581 6 322 24.0 12 J-J 16 006 45 1 111 24 8 786 893 7 894 6 040 64 647 27 416 7 188 14 783 8 309 6 951 24.8
11 May 2 308 11 213 2 1 231 243 988 852 10 119 4 698 973 2 240 1 211 998 22.8 Jun 2 559 11 218 4 1 463 180 1 283 863 10 372 4 802 874 2 264 1 428 1 004 24.7 Jul 2 618 8 224 4 1 461 143 1 318 920 10 970 5 093 1 256 2 188 1 420 1 012 23.9 Aug 2 619 7 212 4 1 573 133 1 440 823 10 668 4 907 1 188 2 038 1 556 979 24.6 Sep 2 522 6 237 4 1 469 108 1 361 805 10 767 4 829 1 369 2 194 1 422 953 23.4 Oct 2 479 8 261 4 1 338 109 1 229 868 10 544 4 728 1 245 2 256 1 305 1 010 23.5 Nov 2 559 8 216 5 1 426 187 1 239 905 10 722 4 772 1 096 2 431 1 376 1 048 23.9 Dec 2 717 8 164 5 1 511 190 1 321 1 030 11 276 4 803 1 091 2 729 1 471 1 182 24.1
12 Jan 2 786 8 251 3 1 549 142 1 408 974 11 686 4 710 1 320 3 042 1 504 1 110 23.8 Feb 2 836 7 236 4 1 504 102 1 402 1 084 11 971 4 734 1 571 3 061 1 386 1 219 23.7 Mar 2 864 8 231 4 1 601 110 1 491 1 020 11 233 4 751 1 309 2 482 1 526 1 165 25.5 Apr 2 750 7 165 4 1 558 142 1 416 1 016 9 829 4 374 632 2 189 1 453 1 180 28.0 May 2 622 7 199 5 1 438 217 1 221 973 10 069 4 383 1 179 2 014 1 357 1 137 26.0 Jun 2 148 7 28 3 1 137 180 957 973 9 858 4 464 1 177 1 994 1 083 1 139 21.8
P
P P
P P P P
P P P P P P P P P P P
1=2+3+4+5 2 3 4 5 6 7=1-6 8 9=7-8
23. OUTPUT AND DEMAND 23.6 Electricity: production and consumptionB) Energy indicators
unit using autochtonous coal as fuel, in the resolution of restrictions to supply guarantees. a. From 1 January 2011 GICC (Elcogás) has been included owing to the fact that, according to Royal Decree 134/2010, this power station is obliged to participate, as a selling
Red Eléctrica de España (REE) Millions of KWH
Domestic production Consumption Conventional Hydro- Special Export Gross Generation Net
Total thermal power Nuclear regime -Import domestic and domestic power consump- pumping consump- (a) tion consump- tion tion
06 288 384 150 598 25 330 60 126 52 330 3 273 285 111 15 093 270 018 07 297 843 158 120 26 352 55 102 58 269 5 750 292 093 14 067 278 026 08 305 175 155 867 21 428 58 973 68 907 11 040 294 135 13 059 281 076 09 288 057 129 607 23 862 52 761 81 827 8 086 279 971 11 793 268 177 10 296 059 103 626 38 653 61 990 91 790 8 333 287 726 12 030 275 696 11 287 252 109 138 27 571 57 731 92 811 6 090 281 161 11 344 269 818
11 J-N 262 700 100 434 25 527 52 659 84 080 5 624 257 076 10 252 246 824 12 J-N 267 276 99 898 17 047 56 907 93 424 10 120 257 157 12 583 244 574
11 Sep 23 810 10 919 1 142 5 233 6 515 549 23 261 965 22 296 Oct 22 948 9 655 1 293 4 727 7 272 382 22 566 1 026 21 540 Nov 23 268 8 755 1 977 4 761 7 775 580 22 689 1 009 21 679 Dec 24 552 8 704 2 044 5 073 8 731 466 24 086 1 092 22 993
12 Jan 26 153 11 125 1 634 5 413 7 981 525 25 628 1 255 24 372 Feb 26 823 10 828 1 179 5 389 9 427 1 376 25 447 1 194 24 253 Mar 24 600 9 084 1 274 5 728 8 515 870 23 730 1 177 22 553 Apr 22 963 6 080 1 606 5 442 9 835 1 212 21 751 1 303 20 448 May 23 320 7 674 2 147 4 692 8 806 940 22 380 1 010 21 370 Jun 23 704 9 814 1 889 3 682 8 319 625 23 079 1 026 22 053 Jul 24 776 9 771 1 552 5 352 8 100 630 24 146 1 069 23 077 Aug 24 763 10 114 1 346 5 731 7 572 646 24 116 1 164 22 953 Sep 23 305 8 284 1 124 5 563 8 335 1 047 22 258 1 163 21 095 Oct 23 642 8 837 1 422 5 657 7 726 1 457 22 185 1 185 21 000 Nov 23 228 8 286 1 875 4 258 8 809 791 22 437 1 036 21 401
BANCO DE ESPAÑA 396 BOLETÍN ESTADÍSTICO, FEBRUARY 2013

1=3+6 2 3=4+5 4 5 6 7 8=9+12 9=10+11 10 11 12 13 14 15 16
23. OUTPUT AND DEMAND 23.7 Building and housing.C) Construction, steel and cement indicators Official construction permits
Ministerio de Fomento Units, 000s of m²
New Buildings Refur- Demolition Memo- bishing work randum work Surface area item
Buildings to be constructed (units) Surface area (000s of m²) (000s of m²) Increase in Residential Non Land or Of buildings Surface number
Total resi- sites Totally Partly of den- for demol- demol- dwell- Number Total Housing Com- tial residen- Total Residential Non- (000s ished ished ings of buildings munal tial resi- of m²) dwell- buildings dential (units) ings Total Housing Com- munal
08 93 678 268 435 79 752 79 467 285 13 926 51 368 66 085 48 205 46 738 1 467 17 880 3 582 4 407 1 569 269 577 09 51 744 130 546 39 564 39 349 215 12 180 34 976 37 433 24 419 23 729 690 13 014 2 495 2 689 1 660 134 117 10 44 781 91 645 35 110 34 317 793 9 671 30 426 26 706 18 488 17 752 736 8 218 2 761 2 180 1 440 94 633 11 38 973 76 005 30 194 30 052 142 8 779 27 679 22 323 15 245 14 809 436 7 078 1 740 4 509 1 380 77 725
11 J-S 29 076 57 059 22 141 22 029 112 6 935 18 312 16 790 11 356 10 975 381 5 434 1 260 4 026 952 58 038 12 J-S 21 714 42 695 16 140 16 062 78 5 574 12 510 13 644 8 603 8 424 179 5 041 1 088 1 447 1 478 42 223
11 Jun 3 590 5 616 2 394 2 382 12 1 196 1 782 1 930 1 166 1 153 13 764 113 149 138 5 727 Jul 3 172 5 562 2 317 2 303 14 855 1 633 1 613 1 064 1 024 40 549 104 99 112 5 718 Aug 3 040 4 998 2 298 2 277 21 742 4 043 1 447 953 921 32 494 103 130 86 4 985 Sep 3 290 5 891 2 758 2 749 9 532 1 725 1 508 1 131 1 113 18 377 112 116 108 6 032 Oct 2 797 5 411 2 103 2 095 8 694 4 629 1 648 1 071 1 055 16 577 150 172 135 5 529 Nov 3 605 7 311 3 108 3 096 12 497 1 849 2 235 1 501 1 472 29 734 163 110 159 7 716 Dec 3 495 6 224 2 842 2 832 10 653 2 889 1 650 1 317 1 307 10 333 167 201 134 6 442
12 Jan 2 176 4 745 1 727 1 714 13 449 1 385 1 241 948 918 30 293 156 133 83 4 629 Feb 2 316 4 358 1 731 1 715 16 585 1 295 1 404 967 938 29 437 92 114 70 4 409 Mar 2 406 5 078 1 690 1 687 3 716 1 162 1 549 1 023 1 016 7 526 116 174 102 4 863 Apr 2 261 4 858 1 647 1 646 1 614 1 165 1 707 941 939 2 766 89 183 96 4 874 May 2 728 4 978 2 014 2 003 11 714 1 465 1 714 915 905 10 799 173 185 93 4 958 Jun 2 415 3 864 1 879 1 875 4 536 1 570 1 160 852 850 2 308 105 140 107 3 615 Jul 2 666 5 882 1 935 1 930 5 731 1 991 1 800 1 116 1 115 1 684 93 233 88 5 869 Aug 2 456 3 634 1 882 1 868 14 574 1 113 1 505 858 775 83 647 87 112 88 3 770 Sep 2 290 5 298 1 635 1 624 11 655 1 364 1 564 983 968 15 581 177 173 751 5 236
1 2 3 4 5 6 7 8 9 10 11 12 13 14 15 16
23. OUTPUT AND DEMAND 23.8 Ongoing building workC) Construction, steel and cement indicators
Ministerio de Fomento Units, 000s of m², EUR millions
Project approvals Certification of completion
Number of buildings (units) Surface areas (000s of m²) Value Budget for Number of buildings of works execution of (units) executed
New Extensions Reforms New Extensions works (EURm) (incl. over- heads
Of which: Of which: Of which: Of which: Of which: New Memo- Total Number and VAT work, randum of (EURm)
Total Total Total Total Total exten- item: dwellings Intended Number Inten- Intended Intended Inten- sions included for of ded for for for ded for and housing dwellings housing housing housing housing reforms Reform included of pre- mises, devel- opments and other
09 39 638 31 500 110 849 4 886 3 498 40 758 31 789 29 169 19 399 1 596 516 16 612 1 291 114 705 387 075 32 807 10 35 763 28 349 91 662 4 334 3 068 40 448 32 597 24 507 16 278 1 297 460 14 323 1 064 81 543 257 443 23 585 11 28 623 23 076 78 286 3 777 2 833 34 498 28 610 19 958 14 129 1 119 416 11 321 820 65 123 167 914 17 955
11 J-D 28 623 23 076 78 286 3 777 2 833 34 498 28 610 19 958 14 129 1 119 416 11 321 820 65 123 167 914 17 955 12 J-D 20 758 16 207 44 162 3 263 2 423 27 674 22 934 12 525 8 498 1 032 349 7 376 566 52 791 119 980 14 612
11 Dec 1 903 1 531 5 414 275 207 2 217 1 822 1 380 973 70 27 779 65 5 488 12 282 1 498
12 Jan 1 776 1 369 4 771 255 182 2 179 1 830 1 240 850 213 29 720 45 4 195 10 087 1 124 Feb 1 983 1 598 4 599 263 183 2 456 2 050 1 175 909 95 27 703 66 4 497 9 433 1 362 Mar 2 080 1 646 4 846 381 309 2 584 2 145 1 420 947 76 42 828 41 5 138 10 631 1 280 Apr 1 781 1 394 3 797 339 244 2 103 1 733 1 038 722 90 28 593 37 3 754 8 111 1 044 May 1 869 1 439 3 945 240 176 2 825 2 344 1 047 754 77 30 686 64 4 594 10 759 1 367 Jun 1 946 1 492 3 498 355 268 2 704 2 194 1 042 683 89 36 628 45 5 190 13 269 1 459 Jul 1 994 1 493 4 038 370 279 2 781 2 289 1 210 793 88 35 705 59 5 463 11 354 1 438 Aug 1 214 944 2 639 194 134 1 641 1 352 676 498 62 21 400 34 2 661 5 512 661 Sep 1 522 1 221 3 155 228 175 2 058 1 742 871 621 53 25 501 31 3 873 9 591 1 121 Oct 1 690 1 327 3 181 274 198 2 378 1 984 931 613 81 33 545 43 4 707 12 054 1 342 Nov 1 580 1 228 3 106 179 121 2 219 1 869 983 607 64 18 568 64 4 195 9 776 1 274 Dec 1 323 1 056 2 587 185 154 1 746 1 402 892 501 42 23 499 37 4 524 9 403 1 140
BANCO DE ESPAÑA 397 BOLETÍN ESTADÍSTICO, FEBRUARY 2013

1=2+9 2=3+8 3=4+7 4=5+6 5 6 7 8 9=10+11 10 11
23. OUTPUT AND DEMAND 23.9 Public works procurement by type of workC) Construction, steel and cement indicators
Ministerio de Fomento EUR millions General government (S.13) State-owned entities (S.11)
Total Building Total Civil Total Building Civil Residential engineering engineering Non-resi- works works Total dential Total Houses Communal establish- ments
07 37 399 28 474 9 604 2 169 1 195 974 7 435 18 870 8 925 1 288 7 638 08 38 495 27 728 8 878 2 354 1 355 999 6 524 18 850 10 767 1 197 9 570 09 35 354 27 097 9 619 2 442 1 086 1 356 7 177 17 477 8 258 568 7 690 10 21 909 18 936 7 667 1 501 666 836 6 166 11 268 2 973 449 2 524 11 11 776 7 990 3 224 784 326 458 2 441 4 766 3 786 299 3 487
11 J-J 6 882 4 574 1 896 457 209 249 1 439 2 678 2 308 171 2 137 12 J-J 3 658 2 334 885 87 48 39 798 1 449 1 323 58 1 265
11 Mar 1 023 788 357 126 12 114 231 431 235 41 194 Apr 867 669 260 98 74 24 162 409 197 53 145 May 2 005 883 314 46 23 23 268 569 1 123 6 1 116 Jun 845 498 257 92 32 59 165 241 347 14 332 Jul 835 716 243 77 54 23 166 473 119 40 78 Aug 879 682 283 53 26 27 230 399 197 5 193 Sep 999 736 195 50 16 34 145 541 262 10 252 Oct 570 469 302 105 5 100 197 167 100 43 58 Nov 1 069 400 144 21 5 16 122 256 670 17 652 Dec 542 412 161 20 10 10 141 251 130 13 117
12 Jan 339 276 131 10 6 4 121 145 63 2 61 Feb 896 882 222 6 5 0 217 659 14 1 13 Mar 328 281 126 34 13 21 91 156 46 1 45 Apr 375 235 81 12 7 5 69 154 140 47 94 May 1 302 307 176 12 10 2 164 131 995 6 989 Jun 417 353 149 13 6 7 137 204 64 1 63
P P P
1 2 3 4 5 6 7 8 9 10 11 12 13 14 15 16
23. OUTPUT AND DEMAND 23.10 Construction industry production indicesC) Construction, steel and cement indicators
Note: This statistic replaces the previous ECIC (Construction Industry Survey) figures.
Ministerio de Fomento Base 100 = January 1st 2009
Value of new orders Value of work done Operating revenue Subcontracts to other companies
Total Building Civil Other Total Building Civil Other Total Building Civil Other Total Building Civil Other Engi- acti- Engi- acti- Engi- acti- Engi- acti- neering vi- neering vi- neering vi- neering vi- ties ties ties ties
09 67.6 56.3 93.8 143.3 84.0 80.5 99.7 79.4 80.6 76.1 99.5 78.3 68.7 60.6 98.8 70.1 10 60.2 52.4 74.0 424.6 68.3 67.8 69.1 95.4 64.1 62.4 69.4 112.9 49.5 43.1 70.1 234.8 11 54.0 50.7 58.7 305.6 60.5 59.3 61.3 165.6 56.4 54.3 61.3 167.4 42.4 36.6 61.5 179.8
11 Jan 43.4 33.9 64.0 217.4 52.8 52.6 51.0 114.8 48.0 47.1 49.0 119.3 31.3 27.6 43.0 150.5 Feb 41.2 37.8 47.4 199.5 52.5 52.2 51.8 103.4 49.1 47.6 52.5 128.7 37.0 30.9 54.7 305.3 Mar 61.2 55.9 72.0 205.4 61.4 61.6 57.0 134.9 57.1 55.9 58.8 150.2 42.4 35.6 64.1 256.6 Apr 57.6 56.6 57.5 244.6 61.7 58.5 72.2 146.6 59.3 55.9 70.4 150.5 51.1 46.7 64.9 177.6 May 61.7 62.5 55.7 358.5 64.6 63.0 65.8 202.0 61.0 58.5 66.3 206.5 48.3 42.1 67.7 237.9 Jun 57.2 42.6 86.4 514.3 62.8 59.9 69.4 199.2 59.5 55.3 72.1 198.8 48.0 38.7 80.3 195.7 Jul 68.5 73.3 50.5 536.0 64.5 63.0 65.1 203.2 59.5 56.8 66.1 195.1 42.3 34.6 69.2 138.4 Aug 43.7 41.0 44.7 451.8 51.7 48.0 62.6 176.8 48.6 44.6 61.1 170.6 37.9 32.5 56.3 127.3 Sep 46.9 46.9 45.3 175.1 61.3 60.5 62.3 119.8 58.1 56.4 63.1 129.4 47.2 41.6 65.5 196.1 Oct 58.8 60.7 51.1 308.9 57.0 55.6 58.6 170.5 53.0 50.8 58.5 164.0 39.1 33.7 58.2 118.6 Nov 48.9 46.6 51.7 246.9 61.5 60.8 58.9 200.2 55.8 54.5 56.6 189.4 36.1 32.1 49.7 114.5 Dec 59.1 50.3 78.6 208.5 73.9 75.9 60.4 216.1 68.3 68.7 61.5 206.5 48.6 42.9 64.8 139.6
12 Jan 41.3 40.2 42.8 128.8 51.7 50.8 50.0 180.7 46.6 45.4 47.1 167.3 28.8 26.0 38.3 73.8 Feb 53.3 38.1 89.4 97.9 49.6 50.8 40.3 147.5 45.3 45.4 41.6 140.9 30.6 26.2 45.8 95.1 Mar 39.3 40.0 36.2 148.9 52.7 53.1 44.5 212.4 48.4 48.3 43.7 193.3 33.5 31.2 41.5 60.3 Apr 62.1 37.0 120.7 227.8 50.8 48.9 51.6 222.5 48.2 46.1 51.2 213.3 39.4 36.0 50.2 149.4 May 42.1 44.4 34.8 174.8 50.3 48.5 50.0 245.6 47.6 45.4 50.4 234.5 38.5 34.5 51.4 157.2 Jun 45.3 41.5 52.1 216.2 59.9 59.4 57.0 181.8 55.1 54.1 55.1 175.9 38.7 35.3 49.4 135.0 Jul 41.5 35.1 54.9 192.7 57.5 57.7 52.0 159.5 52.7 51.9 51.8 164.5 35.9 31.1 50.9 199.7 Aug 38.4 37.4 40.5 64.1 53.7 53.3 52.8 119.6 49.9 48.5 52.6 134.8 36.6 31.5 52.0 240.8 Sep 49.6 48.0 52.5 119.0 56.2 55.6 55.3 138.4 52.0 51.0 52.9 145.0 37.4 34.4 45.6 190.5 Oct 52.5 44.4 71.3 111.6 62.7 64.7 53.1 86.4 57.1 58.3 50.5 99.9 37.4 35.2 42.6 193.6 Nov 49.0 43.8 61.1 92.8 63.5 64.1 56.7 168.4 57.5 58.0 51.7 160.6 36.7 36.4 36.5 106.4 Dec 54.0 54.1 52.2 181.3 77.2 79.2 62.8 219.4 70.6 71.4 62.1 215.5 47.4 43.3 60.1 188.2
BANCO DE ESPAÑA 398 BOLETÍN ESTADÍSTICO, FEBRUARY 2013

P
P
P P P P P P P P P P P
P
1 2 3 4=1-2+3 5 6 7 8 9
23. OUTPUT AND DEMAND 23.11 Production and apparent consumption of steel and cementC) Construction, steel and cement indicators
Unión de Empresas Siderúrgicas (UNESID) and Asociación de Fabricantes de Cemento de España (OFICEMEN) Thousands of tons
Steel Cement
Production Exports Imports Supplies Production Increase Exports Imports Apparent in stocks consumption
07 18 999 7 770 14 984 26 213 54 720 486 1 091 2 854 55 997 08 18 640 9 276 11 770 21 134 42 083 -218 1 350 1 744 42 696 09 14 362 8 170 6 993 13 184 29 505 -162 1 482 729 28 913 10 16 343 9 696 8 689 15 336 26 166 -164 2 528 654 24 456 11 15 504 9 876 8 871 14 499 22 178 -119 2 323 466 20 441 12 ... ... ... ... 15 807 24 2 693 400 13 490
12 J-J 1 165 659 618 1 123 1 369 70 197 36 1 138 13 J-J ... ... ... ... 948 -57 138 25 893
11 May 1 501 818 905 1 588 2 147 19 190 70 2 009 Jun 1 399 947 691 1 143 1 961 -71 200 44 1 876 Jul 948 743 823 1 027 2 102 94 246 52 1 813 Aug 1 161 592 534 1 103 1 838 11 154 28 1 701 Sep 1 289 735 782 1 336 1 739 -133 207 22 1 687 Oct 1 335 810 736 1 261 1 839 132 224 31 1 513 Nov 1 223 869 633 987 1 474 -137 159 40 1 491 Dec 818 849 602 572 1 311 -19 148 24 1 206
12 Jan 1 165 659 618 1 123 1 369 70 197 36 1 138 Feb 1 207 778 789 1 218 1 374 -1 208 32 1 199 Mar 1 376 1 027 767 1 116 1 523 7 239 31 1 308 Apr 1 256 693 673 1 236 1 380 81 255 30 1 074 May 1 315 919 668 1 064 1 403 -127 299 31 1 260 Jun 1 228 788 708 1 148 1 473 34 256 35 1 218 Jul 994 772 548 771 1 477 6 280 33 1 225 Aug 934 602 620 952 1 321 17 214 39 1 129 Sep 1 196 875 597 918 1 272 47 221 43 1 047 Oct 1 097 - - 1 097 1 233 -60 189 36 1 140 Nov ... ... ... ... 1 062 -98 202 30 989 Dec ... ... ... ... 920 48 134 26 763
13 Jan ... ... ... ... 948 -57 138 25 893
P P
P P
P P P P P P P P P
P
1 2 3 4= 5 6 7 8= 9 10 11 12 13= 14 15 16= 17
23. OUTPUT AND DEMAND 23.12 Supplies and uses ofD) Motor vehicle indicators commercial vehicles and buses
do not exist for buses). c. Includes ordinary registrations of domestically manufactured second-hand vehicles and special, diplomatic and tourist registrations of imported vehicles (special registrations
b. Dirección General de Tráfico.
a. Asociación Española de Fabricantes de Automóviles.
Dirección General de Tráfico and Asociación Española de Fabricantes de Automóviles Number of vehicles
Commercial motor vehicles Buses and coaches
Supplies Supplies Uses Estima- Supplies Supplies Uses Esti- = ted = mated uses total uses total
Produc- Ordinary Other Exports Ordinary Spe- Estima- number Produc- Ordi- Other Exports Ordi- Estima- number tion registra- regis- (a) registra- cial ted of tion nary regis- (a) nary ted of (a) tions of tra- tions diplo- change regis- (a) regis- tra- regis- change regis- imports tions (b) matic in tered trations tions trations in tered (b) of and stocks vehicles of of im- (b) stocks vehi- imports tou- (BE) (thou- imports ports (BE) cles (b) rist sands) (b) (b) (thou- regis- (b) sands) (c) tra- (c) tions =10+11+ =10+11+ (b) =1+2+3= (b) =1+2+3- +12=14+ +12-14- =5+6+7+8 -5-6-7 +15+16 -15
08 598 595 188 815 322 787 732 524 771 239 934 179 22 848 5 406 1 384 3 065 5 4 454 927 3 869 -344 62 09 356 838 112 649 240 469 727 327 524 144 729 132 -2 658 5 343 552 2 246 2 2 800 567 2 967 -734 63 10 474 149 120 837 183 595 169 421 083 155 176 86 19 340 5 303 244 1 876 3 2 123 358 2 593 -828 62 11 533 848 111 016 188 645 052 477 560 143 702 90 23 700 5 184 411 2 014 2 2 427 351 2 862 -787 62 12 439 499 ... ... ... 402 268 ... ... ... ... - ... ... ... 127 ... ... ...
12 J-J 38 378 6 919 8 45 305 34 529 8 655 3 2 118 5 177 - 113 8 121 28 162 -69 62 13 J-J 41 030 ... ... ... 37 965 ... ... ... ... - ... ... ... - ... ... ...
12 Apr 36 935 7 215 8 44 158 33 546 8 993 1 1 618 5 144 - 74 1 75 6 151 -82 62 May 38 515 7 699 14 46 228 35 806 9 534 8 880 5 130 - 148 - 148 - 227 -79 62 Jun 36 158 7 555 28 43 741 34 116 10 027 10 -412 5 117 - 104 3 107 - 189 -82 61 Jul 45 365 7 078 39 52 482 41 517 9 535 14 1 416 5 106 - 70 - 70 - 94 -24 61 Aug 9 253 4 835 22 14 110 8 297 6 303 4 -494 5 096 - 29 - 29 - 49 -20 61 Sep 42 337 4 999 16 47 352 39 173 6 842 2 1 335 5 083 - 140 1 141 - 267 -127 61 Oct 40 290 ... ... ... 37 306 ... ... ... ... - ... ... ... - ... ... ... Nov 39 657 ... ... ... 38 390 ... ... ... ... - ... ... ... 28 ... ... ... Dec 26 314 ... ... ... 22 641 ... ... ... ... - ... ... ... 2 ... ... ...
13 Jan 41 030 ... ... ... 37 965 ... ... ... ... - ... ... ... - ... ... ...
BANCO DE ESPAÑA 399 BOLETÍN ESTADÍSTICO, FEBRUARY 2013

P P
P P
P P P P P P P P P
P
1 2 3 4 5= 6 7 8 9 10 11 12= 13 14 15 16 17
23. OUTPUT AND DEMAND 23.13 Supplies and uses ofD) Motor-vehicle indicators passengers cars and motorcycles
d. Ministerio de Industria, Energía y Turismo.
c. Includes ordinary registrations of domestically manufactured second-hand vehicles and special, diplomatic and tourist registrations of imported vehicles.
b. Dirección General de Tráfico.
a. Asociación Española de Fabricantes de Automóviles.
Dirección General de Tráfico, Asociación Española de Fabricantes de Automóviles and Ministerio de Industria, Energía y Turismo. Thousands of vehicles
Passenger cars Motorcycles
Supplies Supplies Uses Estimated Of which Estimated = total total uses registered Produc- Ordina- regis-
Produc- Ordinary Of which Other Exports Ordinary registrations (b) Tou- Estima- vehicles tion ry re- Domes- tered tion registra- regis- (a) rist ted (b) gistra- tica- vehicles tions of tra- and change (d) tions lly (a) imported Second tions Of which Private Com- diplo- in manu- (b) passen- -hand of im- purposes mer- matic stocks (b) factu- ger cars ported cial regis- red passen- Total Auc- purpo- tra- (BE) (b) ger tion ses tions cars (b) (c) (b) =1+2+4=6 =1+2+4- +7+11+12 -6-7-11
08 1 943.1 919.2 53.4 1.8 2 864.1 1 655.2 1 185.4 0.4 988.8 196.6 1.0 22.5 22 145.4 115.7 221.8 24.0 2 500.8 09 1 812.7 719.0 32.2 1.6 2 533.2 1 557.3 971.2 0.3 882.6 88.6 1.0 3.7 21 983.5 60.7 139.9 16.8 2 606.7 10 1 913.5 754.4 30.7 1.7 2 669.6 1 658.3 1 000.0 0.2 ... ... 0.9 10.1 22 147.5 70.7 141.0 16.8 2 707.5 11 1 819.5 635.1 25.7 1.0 2 455.5 1 642.6 816.6 0.4 ... ... 0.7 -4.3 21 978.6 43.0 125.0 16.5 2 774.1 12 1 539.6 ... ... ... ... 1 326.8 ... ... ... ... ... ... ... 27.1 ... ... ...
12 J-J 121.8 46.6 1.8 0.1 168.5 100.3 55.5 0.0 ... ... 0.1 12.7 21 976.3 3.3 6.5 0.8 2 777.2 13 J-J 138.1 ... ... ... ... 113.2 ... ... ... ... ... ... ... 0.8 ... ... ...
12 Apr 117.5 45.5 2.0 0.1 163.1 98.8 56.8 0.0 ... ... 0.1 7.4 21 944.2 2.9 8.4 1.1 2 787.6 May 161.1 59.2 2.2 0.1 220.5 135.5 73.5 0.0 ... ... 0.0 11.4 21 930.4 4.6 10.8 1.4 2 793.5 Jun 141.1 58.7 2.2 0.1 199.9 124.1 74.2 0.0 ... ... 0.1 1.6 21 920.0 2.7 12.1 1.7 2 800.5 Jul 137.2 51.9 2.1 0.2 189.2 117.9 66.3 0.0 ... ... 0.1 5.0 21 908.6 2.0 12.9 2.0 2 808.9 Aug 45.1 40.7 1.9 0.2 86.0 45.0 50.3 0.0 ... ... 0.1 -9.4 21 891.6 0.3 10.5 1.5 2 815.4 Sep 119.7 29.6 1.7 0.1 149.4 104.5 36.0 0.0 ... ... 0.0 8.9 21 847.3 1.6 7.8 1.2 2 818.5 Oct 140.2 ... ... ... ... 125.0 ... ... ... ... ... ... ... 0.7 ... ... ... Nov 145.3 ... ... ... ... 125.8 ... ... ... ... ... ... ... 0.6 ... ... ... Dec 92.3 ... ... ... ... 83.3 ... ... ... ... ... ... ... 0.2 ... ... ...
13 Jan 138.1 ... ... ... ... 113.2 ... ... ... ... ... ... ... 0.8 ... ... ...
P P
P P
P P P P P P P P P P
P P
1 2 3 4 5 6 7 8 9 10 11 12 13 14 15 16 17 18
23. OUTPUT AND DEMAND 23.14 Retail trade and hotelsE) Services indicators
hotel establishments in Canarias has been updated; the directory of those in Navarra in January 2011 and the directory of those in Extremadura in March 2011 and February 2012.
Since January 2006, the directories have been updated and the information-collection period extended to every day of the month. In June 2009 and July 2010 the directory of
b. From January 2003, the information for Galicia is based on total figures for hotel stays and overnight stays for the month. The directory of hotels has been reviewed thoroughly.
a. 1 = (2 + 4 - 5) / 3
Instituto Nacional de Estadística and European Commission (European Economy. Supplement B)
Business surveys in the retail trade Retail trade indices Hotel business (b) (balances) (2005=100, NACE 2009) (thousands)
Business Inten- Volume General General index without petrol stations Hotel stays Overnight stays
Retail situation tions of retail trade of stocks trade confi- plac- index Of which Large Large Small Single- Total Foreign- Resi- Total Foreign- Resi-
dence Pres- Ex- ing retail chain chain outlet ers dents ers dents indi- ent pec- orders Total outlets stores stores retail- cator ted Food ers (a)
09 -28.2 -58.9 -13.1 -24.0 1.9 101.1 101.0 110.1 101.5 124.2 96.4 92.7 77 140 32 002 45 138 250 985 141 228 109 757 10 -21.8 -49.3 -5.7 -19.3 -3.2 101.8 100.7 110.4 100.3 127.5 94.0 91.5 81 889 35 656 46 233 267 164 153 927 113 236 11 -23.0 -49.6 -8.6 -18.3 1.2 99.9 97.8 110.7 95.7 130.1 89.7 87.5 85 367 39 542 45 825 286 761 175 237 111 524 12 -24.1 -46.1 -12.4 -20.5 5.6 96.1 93.8 111.0 89.1 131.0 83.9 82.6 83 181 40 139 43 042 281 361 179 219 102 142
12 J-F -24.9 -47.6 -20.2 -24.5 2.5 93.8 91.6 101.3 91.3 121.3 83.9 81.2 8 814 3 518 5 295 26 753 15 510 11 242 13 J-F -21.6 -41.1 -11.3 -20.7 3.0 ... ... ... ... ... ... ... ... ... ... ... ... ...
12 Mar -23.7 -48.8 -17.0 -21.6 0.8 95.8 93.3 112.4 82.2 130.7 81.9 84.9 5 796 2 458 3 339 17 450 9 937 7 513 Apr -23.9 -46.3 -13.5 -21.7 3.8 90.8 88.4 107.2 78.1 123.0 78.7 80.6 7 129 3 243 3 886 21 543 12 161 9 383 May -26.7 -52.6 -11.2 -20.2 7.4 95.7 93.4 109.2 81.6 128.5 84.2 85.8 7 765 4 136 3 629 24 766 16 875 7 890 Jun -21.1 -44.5 -1.7 -12.1 6.6 98.1 96.3 114.0 87.3 134.5 87.4 86.0 8 604 4 442 4 162 30 313 20 652 9 661 Jul -23.3 -41.7 -9.8 -16.8 11.4 103.1 101.0 114.6 99.3 139.9 92.0 87.5 9 681 5 105 4 576 37 463 24 909 12 554 Aug -26.9 -48.1 -10.8 -20.5 12.1 96.7 94.0 115.7 94.7 135.4 83.0 78.9 10 267 5 045 5 222 40 811 25 251 15 560 Sep -27.2 -51.5 -18.1 -23.0 7.1 88.7 86.3 107.0 78.0 124.2 74.9 76.4 8 761 4 738 4 023 32 081 22 107 9 974 Oct -23.0 -45.5 -14.5 -22.1 1.5 95.0 92.6 111.9 81.0 134.3 81.7 82.2 7 261 3 713 3 548 23 875 16 306 7 569 Nov -20.8 -37.2 -5.1 -19.2 5.9 90.6 88.2 107.0 81.4 124.7 76.7 78.5 4 769 2 048 2 721 13 929 8 426 5 502 Dec -22.4 -42.0 -6.3 -19.8 5.5 110.5 109.7 129.7 123.2 153.8 98.5 88.3 4 333 1 692 2 641 12 377 7 084 5 293
13 Jan -22.9 -40.1 -15.8 -23.6 5.0 ... ... ... ... ... ... ... 3 718 1 607 2 111 11 943 7 497 4 446 Feb -20.3 -42.1 -6.7 -17.8 0.9 ... ... ... ... ... ... ... ... ... ... ... ... ...
BANCO DE ESPAÑA 400 BOLETÍN ESTADÍSTICO, FEBRUARY 2013

P P P P
P P
P P P P P P P P P P
P
1 2 3 4 5 6 7 8 9 10= 11= 12 13 14 15 16
23. OUTPUT AND DEMAND 23.15 Transport and tourismE) Services indicators
Estadístico de Hidrocarburos" of the Ministerio de Industria, Turismo y Comercio and the Oil Product Strategic Reserves Corporation (CORES).
Note : The sources of the datas for consumption of petrol and diesel oil are, up to December 1999, the Oil Operators Association and, from January 2000, the "Boletín
c. Includes interurban, special and charter services. b. RENFE. a. RENFE, FEVE and regional railways.
Instituto Nacional de Estadística, Ministerio de Industria, Turismo y Comercio, CORES e Instituto de Estudios Turísticos
Transport Visitors entering Spain (thousands) Consumption (thousands of
Land (thousands) Sea (thousands) Air metric tons) Tourists Total
Rail transport Buses Petrol Diesel By means of access Day-trip- Passen- Metric Passen- Metric oil Total pers gers tons gers tons
Passen- MT Passen- Road Airports Rail Sea- gers gers ports (a) (b) (c) =11+16 =12 a 15
07 620 660 24 534 1 336 437 11 738 233 986 208 510 607 129 6 696 36 831 98 907 58 666 12 739 44 324 146 1 456 40 241 08 616 225 22 014 1 305 434 11 815 229 189 202 233 607 346 6 296 35 378 97 670 57 192 11 200 44 397 143 1 452 40 478 09 582 342 16 563 1 252 154 11 335 199 556 186 000 549 237 6 013 33 345 91 899 52 178 10 407 40 233 139 1 398 39 722 10 566 170 16 065 1 214 181 11 653 208 647 191 552 635 765 5 677 33 227 93 744 52 677 10 505 40 559 172 1 442 41 067 11 580 978 17 327 1 176 802 11 029 220 834 203 291 649 820 5 282 31 019 99 187 56 177 10 007 44 614 140 1 416 43 010 12 569 511 ... 1 155 139 ... ... ... ... ... ... 99 069 57 734 10 243 46 159 128 1 203 41 336
12 J-J 47 625 1 327 94 159 591 18 392 11 672 46 980 387 2 578 5 527 2 811 431 2 313 7 60 2 716 13 J-J ... ... ... ... ... ... ... ... ... 5 290 2 738 454 2 235 5 44 2 552
12 Mar 52 539 1 478 108 684 657 19 149 14 135 55 359 422 2 534 6 509 3 597 589 2 928 8 71 2 912 Apr 46 791 1 354 94 771 831 19 018 16 037 49 678 395 2 317 7 741 4 533 805 3 599 12 117 3 208 May 50 627 1 646 112 734 812 19 365 17 124 51 869 411 2 353 8 626 5 432 856 4 452 11 113 3 194 Jun 48 985 1 497 103 403 1 037 19 778 19 103 52 107 444 2 385 9 215 6 003 870 5 025 12 96 3 212 Jul 46 200 1 451 81 217 1 440 19 619 21 972 52 979 449 2 381 12 500 7 714 1 624 5 924 19 146 4 786 Aug 34 723 1 336 69 756 1 610 19 169 22 056 43 273 477 2 460 14 355 7 863 1 872 5 724 19 248 6 493 Sep 44 811 1 412 94 405 1 217 18 849 19 527 52 665 390 2 110 10 025 6 238 1 001 5 089 12 136 3 787 Oct 53 043 1 584 109 796 909 19 537 16 913 56 949 404 2 460 8 189 5 088 781 4 229 9 69 3 101 Nov 49 482 1 486 100 314 655 18 801 11 745 53 899 369 2 409 5 567 3 009 452 2 490 6 61 2 558 Dec 45 651 ... 86 081 ... ... ... ... ... ... 5 428 2 638 513 2 075 6 44 2 790
13 Jan ... ... ... ... ... ... ... ... ... 5 290 2 738 454 2 235 5 44 2 552
M M M M M M
1= 2 3 4 5 6 7 8 9 10 11 12 13 14 15 16 17
23. OUTPUT AND DEMAND 23.16 Total industry and investment goods (NACE 2009)F) Business sentiment
a. Seasonally adjusted
Business survey of the Ministerio de Industria, Energía y Turismo Percentage balances
Total industry Investment goods
Industrial confidence indicator Stocks of Stocks of Expected and components (a) Produc- Order books finished Expected trend in Pro- Order books finished trend in
tion products duc- products tion
Industrial Total Stocks of Expected Total Foreign Pro- Employ- Prices Total Foreign Pro- Prices confidence order finished trend in orders duc- ment orders duc- indicator books products produc- tion tion
tion =(2-3+4)/3
07 -0 4 9 6 7 3 -0 9 5 -0 11 13 16 6 4 7 4 08 -17 -23 21 -8 -16 -24 -17 21 -8 -14 5 -6 -5 -4 10 -8 4 09 -30 -55 23 -11 -34 -55 -52 23 -12 -25 -13 -34 -51 -47 18 -11 -12 10 -16 -37 11 -1 -8 -37 -29 11 -1 -12 -3 -7 -31 -33 4 -8 -9 11 -15 -31 11 -3 -12 -31 -24 11 -3 -10 2 -13 -23 -25 3 -9 -8 12 -17 -37 9 -4 -20 -37 -26 9 -5 -16 -3 -28 -39 -29 0 -6 -8
11 Jul -15 -28 12 -4 -6 -25 -20 13 -9 -7 4 -7 -21 -20 -1 -23 -7 Aug -14 -32 10 1 -7 -30 -24 10 -2 -11 -5 -0 -17 -30 3 3 -13 Sep -16 -33 11 -3 -11 -33 -28 12 -5 -16 -1 -10 -32 -27 5 -6 -3 Oct -15 -33 11 -2 -19 -29 -23 11 -8 -21 -10 -18 -11 -19 13 -7 -22 Nov -18 -37 10 -6 -26 -39 -29 9 -15 -17 -12 -30 -30 -35 2 -30 -15 Dec -20 -38 14 -7 -30 -41 -30 16 -13 -23 -6 -38 -37 -32 21 -24 -19
12 Jan -15 -36 6 -2 -25 -39 -26 4 -1 -17 -0 -37 -35 -32 -8 -16 -12 Feb -16 -33 10 -4 -26 -35 -26 10 2 -15 5 -28 -28 -31 5 -6 -5 Mar -16 -32 9 -8 -19 -33 -19 8 -2 -13 3 -27 -32 -23 -2 -10 -8 Apr -16 -34 9 -4 -19 -32 -22 9 5 -10 1 -38 -32 -27 0 6 1 May -15 -36 8 -2 -18 -36 -25 7 3 -14 -7 -26 -47 -33 -2 4 -8 Jun -19 -39 9 -9 -15 -38 -28 9 -9 -15 -12 -9 -33 -18 2 -15 -13 Jul -17 -41 9 -3 -18 -39 -27 9 -6 -15 -9 -28 -37 -25 -5 -0 -7 Aug -20 -41 10 -8 -22 -39 -27 10 -12 -22 -6 -35 -43 -28 8 -14 -25 Sep -18 -39 12 -4 -17 -38 -25 13 -7 -20 4 -32 -53 -38 5 2 -4 Oct -18 -39 8 -7 -22 -38 -26 9 -13 -17 -4 -26 -37 -28 0 -16 -10 Nov -16 -38 7 -2 -18 -39 -29 7 -12 -18 -5 -24 -42 -38 -0 -10 -4 Dec -16 -38 8 -1 -27 -40 -29 9 -7 -21 -1 -33 -45 -32 -0 3 -5
13 Jan -17 -37 8 -5 -24 -41 -30 7 -3 -18 -3 -33 -45 -32 -1 3 -6 Feb -14 -32 8 -3 -18 -33 -20 8 4 -10 -4 -23 -35 -23 -5 -14 -15
BANCO DE ESPAÑA 401 BOLETÍN ESTADÍSTICO, FEBRUARY 2013

M M M M M M
1 2 3 4 5 6 7 8 9 10 11 12 13 14 15 16 17 18
23. OUTPUT AND DEMAND 23.17 Consumer goods, intermediate goods and other sectors (NACE 2009)F) Business sentiment
a.Includes mining and quarrying, manufacture of coke and refined petroleum products, and nuclear fuels.
Business survey of the Ministerio de Industria, Energía y Turismo Percentage balances
Consumer goods Intermediate goods Other sectors (a) Stocks of Expected Stocks of Expected Stocks of Expected
Pro- Order books finished trend in Pro- Order books finished trend in Pro- Order books finished trend in duc- products duc- products duc- products tion tion tion Total Foreign Pro- Prices Total Foreign Pro- Prices Total Foreign Pro- Prices orders duc- orders duc- orders duc- tion tion tion
07 5 -3 -11 10 7 9 6 2 3 12 4 15 -4 -2 -0 2 -0 7 08 -10 -21 -19 16 1 8 -26 -37 -25 31 -15 5 -3 -7 -4 1 -2 1 09 -22 -40 -37 12 -4 -6 -40 -65 -62 32 -15 -19 -55 -74 -68 30 -27 1 10 -7 -27 -18 6 3 -5 -6 -41 -31 14 1 0 -54 -87 -61 65 -4 8 11 -6 -22 -15 8 1 3 -11 -36 -25 14 -2 7 -60 -84 -64 40 -11 5 12 -10 -24 -15 7 1 1 -26 -46 -33 14 -8 -2 6 -27 -6 13 -4 4
11 Jul -0 -20 -18 10 4 3 -3 -26 -16 22 -8 9 -69 -90 -66 22 -24 18 Aug 4 -21 -7 12 -6 -11 -11 -37 -27 12 -2 4 -85 -86 -94 11 -6 -3 Sep 0 -16 -10 13 1 -3 -11 -40 -35 16 -10 1 -81 -86 -83 6 8 - Oct -4 -10 -3 5 -4 3 -22 -45 -33 15 -12 -13 -85 -87 -79 10 -6 - Nov -10 -23 -15 5 -2 -3 -28 -49 -36 15 -18 -16 -86 -85 -5 5 2 0 Dec -10 -20 -16 8 -12 10 -34 -53 -40 19 -8 -11 -89 -87 -1 10 -6 -0
12 Jan -14 -36 -23 4 - 9 -29 -45 -28 10 8 0 -9 -10 - 11 -9 - Feb -24 -34 -24 13 4 5 -28 -42 -27 11 7 11 -6 -7 - 7 -3 - Mar -17 -26 -7 7 7 1 -17 -41 -27 13 -3 10 -6 -6 -2 7 -9 - Apr -8 -23 -15 2 12 3 -17 -41 -27 19 1 0 -5 -5 - 6 -16 1 May -13 -23 -15 5 10 0 -18 -41 -29 12 -1 -5 -5 -16 1 18 -16 -75 Jun -3 -20 -19 5 9 -4 -26 -46 -41 14 -19 -18 -18 -96 -12 10 3 11 Jul -0 -21 -20 7 -0 -5 -24 -48 -36 19 -15 -12 -17 -79 - 3 9 -1 Aug -4 -18 -8 8 -5 -1 -26 -46 -35 13 -18 -4 -18 -89 -56 9 6 42 Sep 1 -22 -10 5 -4 3 -23 -43 -30 17 -12 1 2 -5 - 81 -2 76 Oct -8 -20 -11 7 -8 -2 -39 -53 -36 14 -15 -4 82 -3 -1 3 -9 - Nov -15 -24 -15 8 -3 1 -26 -50 -37 10 -19 -10 79 -3 - 2 -0 -1 Dec -12 -26 -17 9 -12 - -34 -51 -38 13 -9 1 -11 -3 -1 3 -3 -
13 Jan -17 -34 -21 6 -9 -3 -27 -48 -37 13 -3 -1 0 -5 - 4 1 -1 Feb -16 -22 -17 10 10 -0 -17 -37 -24 14 10 -2 2 -47 - 4 -2 -1
M M M M M M
1 2 3 4 5 6 7 8 9 10 11 12
23. OUTPUT AND DEMAND 23.18 Construction industry (NACE 2009)F) Business sentiment
Business survey of Ministerio de Industria, Energía y Turismo Percentage balances
Total Industrial construction Housing Public works Miscellaneous services
Level of Level of Expected trend for production orders next three months Production Orders Production Orders Production Orders Production Orders compared compared
with with preceding preceding Production Orders quarter quarter
07 20 11 18 21 20 7 0 -4 33 34 38 -0 08 -2 -20 -16 -16 -2 -20 -33 -60 23 22 19 -19 09 -20 -32 -13 -19 -14 -25 -51 -79 7 17 -3 -28 10 -19 -31 -26 -33 -12 -26 -25 -59 -15 -4 -17 -32 11 -23 -48 -46 -45 -8 -16 -34 -77 -17 -25 -15 -41 12 -21 -47 -45 -59 -18 -49 -24 -69 -16 -32 -27 -33
11 Jul -9 -40 -62 -65 -3 -14 -37 -74 4 -18 24 -20 Aug -10 -45 -47 -49 -5 -13 -17 -83 -13 -10 7 -48 Sep -38 -46 -51 -56 -5 -15 -57 -56 -19 -49 -49 -25 Oct -12 -46 -31 -54 -5 -19 -27 -73 -9 -24 14 -46 Nov -37 -33 -71 -74 -21 -12 -45 -69 -27 -8 -48 -16 Dec -19 -43 -65 -62 -3 -5 -17 -73 -11 -23 -44 -31
12 Jan -14 -50 -67 -66 -17 -43 -22 -71 -16 -31 8 -50 Feb -40 -46 -49 -51 -7 -8 -32 -58 -51 -41 -43 -40 Mar -29 -31 -34 -61 -65 -19 -39 -71 -20 -1 -20 -13 Apr 7 -33 -31 -67 -3 -51 5 -70 9 -3 9 -16 May -26 -52 -42 -65 -8 -71 -42 -90 -14 -26 -24 -22 Jun -14 -43 -45 -63 -2 -75 -42 -81 9 -14 -8 -17 Jul -14 -43 -17 -47 -9 -66 -11 -57 -5 -37 -45 -18 Aug -27 -60 -56 -62 -5 -76 -16 -80 -46 -47 -16 -41 Sep -43 -58 -24 -38 -69 -76 -42 -78 -38 -44 -48 -42 Oct -25 -32 -55 -55 -11 -15 -34 -58 -13 -17 -37 -16 Nov -10 -63 -43 -73 -9 -72 7 -63 -1 -65 -63 -59 Dec -19 -56 -71 -62 -9 -14 -20 -58 -11 -58 -36 -60
13 Jan -27 -41 -58 -56 -5 -8 -24 -34 -42 -56 -5 -32 Feb -23 -52 -49 -50 -9 -19 -17 -55 -32 -50 -22 -58
BANCO DE ESPAÑA 402 BOLETÍN ESTADÍSTICO, FEBRUARY 2013

M M M M M
1 2 3 4 5 6 7 8 9 10 11 12 13
23. OUTPUT AND DEMAND 23.19 Capacity utilisation and factors limiting production.F) Business sentiment Total industry (excluding construction) (NACE 2009)
Business survey of the Ministerio de Industria, Turismo y Comercio Percentages and percentage balances Capacity utilisation Factors limiting production in the last three months Memorandum items
Installed capacity In the Domestic Insuffic- Insuffic- Labour Insuffic- Cash Guaran- Stocks
last demand ient ient shortage ient flow Other teed of raw three Planned None weak- exports installed raw difficul- produc- materials months ness plant materials ties tion (days)
08 7 80.1 80.4 36 39 9 3 2 2 1 8 122 6 09 26 71.2 71.4 21 52 18 0 0 1 2 5 95 10 10 22 72.0 72.8 22 51 17 1 1 1 3 5 106 4 11 18 73.3 73.7 26 49 13 1 1 2 3 5 67 5 12 21 72.9 73.6 20 52 15 1 0 2 4 6 54 3
08 Q3 6 80.4 80.8 34 41 9 3 2 3 1 7 126 5 Q4 12 77.6 76.5 27 49 13 2 1 2 1 6 115 11
09 Q1 22 73.4 72.9 21 51 17 0 1 1 2 8 118 11 Q2 26 70.9 71.4 21 51 20 1 0 1 3 4 85 13 Q3 30 69.8 70.7 23 49 20 1 0 1 3 4 94 10 Q4 24 70.6 70.4 20 55 17 0 1 1 2 5 83 6
10 Q1 25 69.5 70.7 21 50 19 0 0 1 2 7 103 8 Q2 21 71.8 73.9 22 51 17 0 1 1 3 6 110 4 Q3 15 73.9 74.6 25 49 17 1 0 2 2 4 117 2 Q4 26 72.9 72.1 20 53 15 1 1 2 3 6 96 3
11 Q1 16 72.6 73.4 23 51 13 1 1 2 3 5 79 3 Q2 17 74.7 75.8 28 48 11 1 1 3 3 5 69 7 Q3 20 73.3 73.4 27 49 12 1 1 3 3 6 62 6 Q4 21 72.7 72.0 26 48 16 1 0 2 4 4 57 6
12 Q1 23 72.5 73.4 20 51 18 1 1 2 3 4 53 -0 Q2 21 73.4 74.6 25 52 13 1 0 1 3 5 56 5 Q3 21 71.6 72.3 18 55 14 1 0 3 4 6 59 4 Q4 21 74.1 73.9 18 52 14 1 0 1 4 9 49 3
13 Q1 24 68.9 70.1 21 52 15 0 0 1 4 6 49 -1
BANCO DE ESPAÑA 403 BOLETÍN ESTADÍSTICO, FEBRUARY 2013


CHAPTER 24 EMPLOYMENT AND WAGES

M M M M M M
M M
1=2+9 2=3+8 3=4+5 4 5=6+7 6 7 8 9=10+11 10 11 12=12/1 13=8/2 14=3/1
24. EMPLOYMENT AND WAGES 24.1 Population aged 16 years and over: summaryA) Labour force survey
further information, see www.ine.es.
procedure for telephone interviews has been set in place and the questionnaire has been modified. Thus, in 2005 Q1, there is a break in the series of some variables. For
Q1 the new obligatory variables referred to in Regulation (EC) 2257/2003 (on the adaptation of the list of labour force survey characteristics) have been included, a centralised
General note to the tables: As a result of the change in the population base (2001 Census), all the series in this table have been revised as from 1996. In addition, since 2005
a. The new definition of unemployment applies from 2001 Q1 onwards, entailing a break in the series.(See www.ine.es).
Instituto Nacional de Estadística Thousands
Population of 16 years and over Memorandum items: rates Labour force Non-working (a) Employed Un- Parti- Unem- Employ-
Total Non- Wage-earners emplo- cipa- ploy- ment Total Total wage yed Total Men Women tion ment earners (a) Total Private Public (a) sector sector (a) (a)
06 37 008 21 585 19 748 3 540 16 208 13 326 2 882 1 837 15 423 5 599 9 824 58.33 8.51 53.36 07 37 663 22 190 20 356 3 596 16 760 13 847 2 913 1 834 15 473 5 678 9 795 58.92 8.26 54.05 08 38 208 22 848 20 258 3 576 16 681 13 723 2 959 2 591 15 360 5 720 9 639 59.80 11.33 53.02 09 38 432 23 037 18 888 3 207 15 681 12 619 3 062 4 150 15 394 5 910 9 484 59.95 18.01 49.15 10 38 479 23 089 18 457 3 110 15 347 12 217 3 130 4 632 15 390 6 010 9 380 60.00 20.07 47.97 11 38 497 23 104 18 105 2 999 15 105 11 915 3 190 4 999 15 394 6 120 9 274 60.01 21.64 47.03
11 Q1-Q4 38 497 23 104 18 105 2 999 15 105 11 915 3 190 4 999 15 394 6 120 9 274 60.01 21.64 47.03 12 Q1-Q4 38 429 23 051 17 282 3 040 14 242 11 228 3 014 5 769 15 378 6 192 9 186 59.99 25.03 44.97
10 Q4 38 512 23 105 18 408 3 094 15 314 12 146 3 169 4 697 15 408 6 080 9 328 59.99 20.33 47.80
11 Q1 38 512 23 062 18 152 3 031 15 121 11 935 3 186 4 910 15 450 6 133 9 318 59.88 21.29 47.13 Q2 38 481 23 137 18 303 3 011 15 292 12 075 3 218 4 834 15 345 6 120 9 225 60.12 20.89 47.56 Q3 38 488 23 135 18 156 2 977 15 179 11 959 3 221 4 978 15 353 6 080 9 273 60.11 21.52 47.17 Q4 38 508 23 081 17 808 2 978 14 829 11 693 3 136 5 274 15 427 6 146 9 281 59.94 22.85 46.24
12 Q1 38 494 23 073 17 433 3 022 14 411 11 307 3 104 5 640 15 421 6 222 9 199 59.94 24.44 45.29 Q2 38 467 23 110 17 417 3 020 14 397 11 356 3 041 5 693 15 357 6 159 9 198 60.08 24.63 45.28 Q3 38 420 23 098 17 320 3 087 14 233 11 241 2 992 5 778 15 322 6 141 9 181 60.12 25.02 45.08 Q4 38 333 22 922 16 957 3 032 13 926 11 008 2 917 5 965 15 411 6 245 9 165 59.80 26.02 44.24
M M M M M M
M M
1=2 a 5 2=7+12 3=8+13 4=9+14 5=10+15 6=7 a 10 7 8 9 10 11=12 a 15 12 13 14 15
24. EMPLOYMENT AND WAGES 24.2 Population aged 16 years and overA) Labour force survey Breakdown by age and sex
further information, see www.ine.es.
procedure for telephone interviews has been set in place and the questionnaire has been modified. Thus, in 2005 Q1, there is a break in the series of some variables. For
Q1 the new obligatory variables referred to in Regulation (EC) 2257/2003 (on the adaptation of the list of labour force survey characteristics) have been included, a centralised
General note to the tables: As a result of the change in the population base (2001 Census), all the series in this table have been revised as from 1996. In addition, since 2005
Instituto Nacional de Estadística Thousands
Both sexes Males Females From 16 From 20 From 25 55 From 16 From 20 From 25 55 From 16 From 20 From 25 55
Total to 19 to 24 to 54 years Total to 19 to 24 to 54 years Total to 19 to 24 to 54 years years years years and over years years years and over years years years and over
06 37 008 1 848 2 847 20 461 11 853 18 133 949 1 457 10 397 5 331 18 875 899 1 390 10 064 6 523 07 37 663 1 845 2 798 20 947 12 074 18 481 948 1 431 10 666 5 436 19 182 896 1 366 10 281 6 638 08 38 208 1 841 2 750 21 336 12 282 18 752 946 1 405 10 868 5 534 19 456 895 1 345 10 468 6 748 09 38 432 1 822 2 667 21 468 12 474 18 848 936 1 361 10 926 5 625 19 583 886 1 305 10 542 6 850 10 38 479 1 794 2 572 21 440 12 672 18 830 921 1 309 10 883 5 716 19 650 873 1 263 10 557 6 956 11 38 497 1 767 2 491 21 350 12 889 18 800 906 1 265 10 811 5 817 19 697 860 1 226 10 539 7 072
11 Q1-Q4 38 497 1 767 2 491 21 350 12 889 18 800 906 1 265 10 811 5 817 19 697 860 1 226 10 539 7 072 12 Q1-Q4 38 429 1 740 2 416 21 151 13 121 18 723 892 1 225 10 679 5 927 19 706 848 1 190 10 472 7 194
10 Q4 38 512 1 784 2 543 21 435 12 751 18 835 916 1 293 10 874 5 753 19 678 868 1 250 10 562 6 998
11 Q1 38 512 1 776 2 523 21 410 12 804 18 827 911 1 283 10 855 5 778 19 685 865 1 240 10 555 7 026 Q2 38 481 1 769 2 498 21 356 12 858 18 795 908 1 268 10 816 5 803 19 687 861 1 230 10 540 7 055 Q3 38 488 1 764 2 480 21 328 12 917 18 788 905 1 259 10 794 5 830 19 699 859 1 221 10 534 7 086 Q4 38 508 1 758 2 466 21 307 12 977 18 791 901 1 252 10 780 5 859 19 717 857 1 214 10 528 7 119
12 Q1 38 494 1 751 2 447 21 260 13 036 18 773 898 1 242 10 748 5 886 19 720 853 1 206 10 512 7 150 Q2 38 467 1 745 2 427 21 200 13 095 18 750 894 1 232 10 710 5 914 19 717 851 1 195 10 490 7 181 Q3 38 420 1 737 2 405 21 125 13 154 18 712 890 1 220 10 661 5 942 19 708 847 1 185 10 464 7 212 Q4 38 333 1 729 2 384 21 020 13 201 18 656 886 1 209 10 596 5 966 19 677 843 1 176 10 423 7 235
BANCO DE ESPAÑA 406 BOLETÍN ESTADÍSTICO, FEBRUARY 2013

M M M M M M
M M
1=2+6 2=3 a 5 3 4 5 6=7 a 9 7 8 9 10=11+15 11=12a14 12 13 14 15=16a18 16 17 18
24. EMPLOYMENT AND WAGES 24.3 Population aged 16 years and overA) Labour force survey Labour force and employment by age and sex
further information, see www.ine.es.
procedure for telephone interviews has been set in place and the questionnaire has been modified. Thus, in 2005 Q1, there is a break in the series of some variables. For
Q1 the new obligatory variables referred to in Regulation (EC) 2257/2003 (on the adaptation of the list of labour force survey characteristics) have been included, a centralised
General note to the tables: As a result of the change in the population base (2001 Census), all the series in this table have been revised as from 1996. In addition, since 2005
a. The new definition of unemployment applies from 2001 Q1 onwards, entailing a break in the series.(See www.ine.es).
Instituto Nacional de Estadística Thousands
Labour force (a) Employment Males Females Males Females
Total From From 55 From From 55 Total From From 55 From From 55 Total 16 to 24 25 to 54 years Total 16 to 24 25 to 54 years Total 16 to 24 25 to 54 years Total 16 to 24 25 to 54 years years years and years years and years years and years years and over over over over
06 21 585 12 534 1 374 9 622 1 538 9 051 1 100 7 161 789 19 748 11 743 1 168 9 107 1 467 8 005 863 6 409 733 07 22 190 12 802 1 362 9 879 1 562 9 387 1 072 7 470 845 20 356 11 987 1 154 9 344 1 489 8 369 837 6 749 782 08 22 848 13 032 1 331 10 064 1 637 9 817 1 077 7 822 917 20 258 11 721 1 015 9 168 1 537 8 537 800 6 899 838 09 23 037 12 939 1 221 10 086 1 631 10 099 1 002 8 087 1 010 18 888 10 646 744 8 448 1 455 8 242 638 6 722 882 10 23 089 12 819 1 108 10 066 1 645 10 270 940 8 268 1 062 18 457 10 290 630 8 241 1 419 8 167 566 6 677 924 11 23 104 12 681 1 014 10 007 1 659 10 423 900 8 360 1 163 18 105 9 991 525 8 049 1 417 8 113 500 6 611 1 002
11 Q1-Q4 23 104 12 681 1 014 10 007 1 659 10 423 900 8 360 1 163 18 105 9 991 525 8 049 1 417 8 113 500 6 611 1 002 12 Q1-Q4 23 051 12 531 940 9 895 1 696 10 520 837 8 443 1 239 17 282 9 432 429 7 598 1 405 7 850 404 6 417 1 029
10 Q4 23 105 12 755 1 055 10 050 1 650 10 350 910 8 343 1 098 18 408 10 210 586 8 213 1 411 8 199 538 6 704 957
11 Q1 23 062 12 694 1 019 10 027 1 648 10 368 892 8 358 1 118 18 152 10 059 537 8 104 1 419 8 093 507 6 619 967 Q2 23 137 12 675 1 014 10 007 1 655 10 462 909 8 396 1 158 18 303 10 067 525 8 118 1 423 8 236 511 6 717 1 009 Q3 23 135 12 708 1 058 10 000 1 650 10 427 944 8 298 1 185 18 156 10 034 560 8 063 1 411 8 122 525 6 580 1 018 Q4 23 081 12 646 966 9 995 1 684 10 436 854 8 388 1 193 17 808 9 806 478 7 912 1 416 8 002 459 6 529 1 015
12 Q1 23 073 12 551 932 9 946 1 673 10 522 840 8 479 1 203 17 433 9 527 428 7 706 1 393 7 906 422 6 475 1 009 Q2 23 110 12 591 945 9 942 1 703 10 520 852 8 424 1 244 17 417 9 497 431 7 647 1 419 7 921 409 6 479 1 033 Q3 23 098 12 572 988 9 881 1 703 10 527 866 8 400 1 261 17 320 9 469 465 7 589 1 414 7 852 418 6 387 1 046 Q4 22 922 12 411 896 9 812 1 703 10 511 792 8 470 1 250 16 957 9 237 392 7 448 1 396 7 720 365 6 329 1 026
M M M M M M
M M
1 2 3 4 5 6 7 8 9 10 11 12 13 14 15 16 17 18
24. EMPLOYMENT AND WAGES 24.4 Employment by branch of activity, according to NACE 2009 sections (a)A) Labour force survey
information, see www.ine.es.
procedure for telephone interviews has been set in place and the questionnaire has been modified. Thus, in 2005 Q1, there is a break in the series of some variables. For further
Q1 the new obligatory variables referred to in Regulation (EC) 2257/2003 (on the adaptation of the list of labour force survey characteristics) have been included, a centralised
General note to the tables: As a result of the change in the population base (2001 Census), all the series in this table have been revised as from 1996. In addition, since 2005
a. Series re-calculated drawing on the transition matrix to NACE 2009 published by INE.
Instituto Nacional de Estadística Thousands Industry Services Agricul- Con- ture, struc- forestry Min- Manufacturing Elec., tion Whole- Transp., Finan- Real est., Public Arts, and ing gas, sale and storage, cial profes., admin. house- fishing and steam, retail informa- and technical, and holds quar- Food, Textiles, Refining, Machinery, air trade,re- tion insur- scienti- def.,Soc. as em.
Total rying bever- clothing, chem.,non- optical, IT, con., Total pair of and ance fic, ad- Security ploy., Total ages leather, met.mine- electronics, water, motors com- activi- ministra- edu- extra- Total and footwear rals,basic vehicles sewer- and munica- ties tive and cation terr. tobac- wood, metals, and age cycles, tions support health acti- co paper, rubber various and hotels service and vi- print and and remed. and rest. activities social ties media plastics work A B to E B C 10to 12 13 to 18 19 to 24 25 to 33 D+E F G to U G+I H+J K L to N O to Q R to U
06 19 748 880 3 269 66 2 994 496 557 644 1 297 209 2 584 13 014 4 353 1 459 473 1 756 3 511 1 462 07 20 356 863 3 240 60 2 974 495 502 658 1 319 206 2 740 13 514 4 544 1 505 501 1 887 3 581 1 496 08 20 258 819 3 199 53 2 952 508 478 645 1 320 194 2 453 13 786 4 656 1 525 508 1 921 3 687 1 489 09 18 888 786 2 775 46 2 519 465 392 544 1 119 210 1 888 13 439 4 396 1 427 474 1 842 3 851 1 449 10 18 457 793 2 611 45 2 370 449 375 511 1 036 196 1 651 13 402 4 280 1 416 464 1 830 3 953 1 461 11 18 105 760 2 555 41 2 305 452 352 478 1 023 209 1 393 13 396 4 320 1 392 451 1 818 4 017 1 400
11 Q1-Q4 18 105 760 2 555 41 2 305 452 352 478 1 023 209 1 393 13 396 4 320 1 392 451 1 818 4 017 1 400 12 Q1-Q4 17 282 753 2 431 37 2 176 444 330 446 955 219 1 148 12 950 4 145 1 340 425 1 800 3 861 1 380
10 Q4 18 408 805 2 623 47 2 375 462 387 503 1 023 201 1 573 13 408 4 282 1 439 447 1 822 4 006 1 413
11 Q1 18 152 783 2 541 42 2 300 454 364 486 997 198 1 494 13 334 4 227 1 401 456 1 833 4 027 1 390 Q2 18 303 741 2 578 43 2 324 449 363 474 1 038 211 1 430 13 554 4 368 1 394 461 1 842 4 055 1 435 Q3 18 156 708 2 576 40 2 317 449 344 486 1 039 219 1 371 13 502 4 436 1 389 451 1 799 4 011 1 416 Q4 17 808 809 2 526 39 2 278 455 337 467 1 019 209 1 277 13 196 4 249 1 382 435 1 796 3 975 1 358
12 Q1 17 433 776 2 459 38 2 204 449 345 454 956 217 1 187 13 011 4 104 1 360 439 1 776 3 968 1 364 Q2 17 417 732 2 438 38 2 183 444 335 442 963 217 1 193 13 054 4 190 1 351 428 1 796 3 925 1 363 Q3 17 320 720 2 442 35 2 183 443 323 440 978 224 1 137 13 021 4 246 1 336 414 1 834 3 782 1 410 Q4 16 957 784 2 384 35 2 132 442 320 447 924 216 1 074 12 716 4 040 1 312 419 1 794 3 767 1 384
BANCO DE ESPAÑA 407 BOLETÍN ESTADÍSTICO, FEBRUARY 2013

M M M M M M
M M
1=2+8 2=3 a 7 3 4 5 6 7 8=9+10 9 10=11+16 11=12 a 15 12 13 14 15 16
24. EMPLOYMENT AND WAGES 24.5 Employment by professional categoryA) Labour force survey
further information, see www.ine.es.
procedure for telephone interviews has been set in place and the questionnaire has been modified. Thus, in 2005 Q1, there is a break in the series of some variables. For
Q1 the new obligatory variables referred to in Regulation (EC) 2257/2003 (on the adaptation of the list of labour force survey characteristics) have been included, a centralised
General note to the tables: As a result of the change in the population base (2001 Census), all the series in this table have been revised as from 1996. In addition, since 2005
Instituto Nacional de Estadística Thousands Non-wage earners Wage-earners Public sector
Total General Government Manager Member Fami- Private State- Total Emplo- without of a ly Other Total sector Total owned yer wage coope- help Social Regio- Local enter- earners rative Total Central segurity nal gvt. prises gvt. funds gvt. and other
06 19 748 3 540 1 081 2 085 92 265 17 16 208 13 326 2 882 2 710 474 352 1 231 653 172 07 20 356 3 596 1 118 2 167 80 222 9 16 760 13 847 2 913 2 756 512 57 1 537 651 157 08 20 258 3 576 1 165 2 125 66 208 12 16 681 13 723 2 959 2 813 521 45 1 601 646 145 09 18 888 3 207 1 073 1 918 33 173 11 15 681 12 619 3 062 2 917 527 39 1 675 677 145 10 18 457 3 110 1 026 1 890 32 152 9 15 347 12 217 3 130 2 985 537 38 1 745 666 144 11 18 105 2 999 942 1 879 32 138 8 15 105 11 915 3 190 3 038 548 39 1 784 667 152
11 Q1-Q4 18 105 2 999 942 1 879 32 138 8 15 105 11 915 3 190 3 038 548 39 1 784 667 152 12 Q1-Q4 17 282 3 040 913 1 965 28 125 9 14 242 11 228 3 014 2 864 529 39 1 694 603 149
10 Q4 18 408 3 094 1 013 1 898 36 138 10 15 314 12 146 3 169 3 017 561 40 1 751 664 152
11 Q1 18 152 3 031 974 1 864 33 154 6 15 121 11 935 3 186 3 039 562 42 1 764 671 147 Q2 18 303 3 011 953 1 871 35 144 8 15 292 12 075 3 218 3 068 551 35 1 795 688 149 Q3 18 156 2 977 936 1 878 31 124 8 15 179 11 959 3 221 3 064 546 40 1 808 671 156 Q4 17 808 2 978 904 1 905 30 130 10 14 829 11 693 3 136 2 979 533 39 1 770 638 157
12 Q1 17 433 3 022 910 1 943 34 128 7 14 411 11 307 3 104 2 957 544 37 1 750 626 148 Q2 17 417 3 020 925 1 930 30 128 8 14 397 11 356 3 041 2 899 521 41 1 724 614 142 Q3 17 320 3 087 934 1 987 24 133 10 14 233 11 241 2 992 2 839 533 41 1 680 586 153 Q4 16 957 3 032 885 2 002 24 112 10 13 926 11 008 2 917 2 762 517 38 1 622 585 155
M M M M M M
M M
1 2 3 4 5 6 7 8 9 10 11 12 13 14 15 16 17 18
24. EMPLOYMENT AND WAGES 24.6 Wage-earners by branch of activity, according to NACE 2009 sections (a)A) Labour force survey
further information, see www.ine.es.
procedure for telephone interviews has been set in place and the questionnaire has been modified. Thus, in 2005 Q1, there is a break in the series of some variables. For
Q1 the new obligatory variables referred to in Regulation (EC) 2257/2003 (on the adaptation of the list of labour force survey characteristics) have been included, a centralised
General note to the tables: As a result of the change in the population base (2001 Census), all the series in this table have been revised as from 1996. In addition, since 2005
a. Series re-calculated drawing on the transition matrix to NACE 2009 published by INE.
Instituto Nacional de Estadística Thousands Industry Services Agricul- Con- ture, struc- forestry Min- Manufacturing Elec., tion Whole- Transp., Finan- Real est., Public Arts, and ing gas, sale and storage, cial profes., admin. house- fishing and steam, retail informa- and technical, and holds quar- Food, Textiles, Refining, Machinery, air trade,re- tion insur- scienti- def.,Soc. as em.
Total rying bever- clothing, chem.,non- optical, IT, con., Total pair of and ance fic, ad- Security ploy., Total ages leather, met.mine- electronics, water, motors com- activi- ministra- edu- extra- Total and footwear rals,basic vehicles sewer- and munica- ties tive and cation terr. tobac- wood, metals, and age cycles, tions support health acti- co paper, rubber various and hotels service and vi- print and and remed. and rest. activities social ties media plastics work A B to E B C 10to 12 13 to 18 19 to 24 25 to 33 D+E F G to U G+I H+J K L to N O to Q R to U
06 16 208 453 2 885 63 2 622 435 461 603 1 123 199 2 057 10 818 3 205 1 173 435 1 358 3 368 1 279 07 16 760 462 2 869 56 2 616 431 419 625 1 141 197 2 195 11 235 3 363 1 224 445 1 461 3 442 1 299 08 16 681 425 2 832 49 2 595 445 397 615 1 139 188 1 927 11 497 3 442 1 262 455 1 498 3 552 1 289 09 15 681 425 2 461 43 2 215 412 323 515 965 202 1 446 11 350 3 278 1 208 440 1 444 3 729 1 250 10 15 347 447 2 332 43 2 102 406 308 485 903 187 1 231 11 337 3 195 1 183 426 1 435 3 825 1 273 11 15 105 433 2 286 39 2 047 405 298 451 893 200 1 037 11 349 3 235 1 163 412 1 431 3 891 1 218
11 Q1-Q4 15 105 433 2 286 39 2 047 405 298 451 893 200 1 037 11 349 3 235 1 163 412 1 431 3 891 1 218 12 Q1-Q4 14 242 426 2 152 31 1 914 395 276 420 823 208 803 10 861 3 049 1 119 391 1 405 3 729 1 167
10 Q4 15 314 459 2 352 45 2 114 421 324 475 894 193 1 164 11 340 3 181 1 196 410 1 437 3 875 1 240
11 Q1 15 121 459 2 282 41 2 052 411 304 458 878 190 1 125 11 255 3 134 1 161 418 1 438 3 895 1 208 Q2 15 292 413 2 304 41 2 062 401 305 447 908 202 1 071 11 504 3 272 1 167 422 1 461 3 929 1 253 Q3 15 179 385 2 312 38 2 062 404 295 458 906 211 1 022 11 461 3 349 1 169 407 1 418 3 889 1 229 Q4 14 829 473 2 246 36 2 011 403 287 439 882 199 932 11 178 3 184 1 154 399 1 409 3 850 1 182
12 Q1 14 411 445 2 178 35 1 938 402 288 429 819 206 832 10 957 3 031 1 134 403 1 389 3 824 1 175 Q2 14 397 410 2 154 33 1 914 394 279 415 826 207 847 10 986 3 098 1 132 395 1 416 3 795 1 150 Q3 14 233 389 2 159 27 1 919 393 269 415 842 214 793 10 892 3 114 1 112 380 1 435 3 664 1 188 Q4 13 926 461 2 118 29 1 884 390 269 420 806 205 738 10 608 2 954 1 099 385 1 381 3 634 1 156
BANCO DE ESPAÑA 408 BOLETÍN ESTADÍSTICO, FEBRUARY 2013

M M M M M M
M M
1=2+3= 2=7+12 3=8+13 4=9+14 5=10+15 6=7+8 7 8 9 10 11=12+13 12 13 14 15
24. EMPLOYMENT AND WAGES 24.7 Wage-earners by full-time and part-time employment,A) Labour force survey type of contract and sex
further information, see www.ine.es.
procedure for telephone interviews has been set in place and the questionnaire has been modified. Thus, in 2005 Q1, there is a break in the series of some variables. For
Q1 the new obligatory variables referred to in Regulation (EC) 2257/2003 (on the adaptation of the list of labour force survey characteristics) have been included, a centralised
General note to the tables: As a result of the change in the population base (2001 Census), all the series in this table have been revised as from 1996. In addition, since 2005
Instituto Nacional de Estadística Thousands Duration With permanent contracts With temporary contracts of working day
Total Males Females Full- Part- time time Total Males Females Full- Part- Total Males Females Full- Part- time time time time
6+11 =4+5=
06 16 208 9 314 6 894 14 242 1 966 10 691 6 330 4 361 9 790 902 5 517 2 984 2 533 4 453 1 064 07 16 760 9 522 7 238 14 737 2 023 11 453 6 611 4 842 10 418 1 035 5 307 2 910 2 396 4 319 988 08 16 681 9 279 7 402 14 625 2 056 11 801 6 720 5 081 10 696 1 105 4 880 2 559 2 321 3 929 951 09 15 681 8 494 7 187 13 589 2 092 11 698 6 473 5 226 10 493 1 205 3 982 2 021 1 961 3 096 887 10 15 347 8 195 7 151 13 206 2 141 11 524 6 239 5 284 10 300 1 224 3 823 1 956 1 867 2 906 918 11 15 105 7 994 7 111 12 902 2 204 11 280 6 059 5 221 10 075 1 205 3 826 1 936 1 890 2 827 999
11 Q1-Q4 15 105 7 994 7 111 12 902 2 204 11 280 6 059 5 221 10 075 1 205 3 826 1 936 1 890 2 827 999 12 Q1-Q4 14 242 7 415 6 826 12 014 2 228 10 877 5 762 5 116 9 635 1 243 3 365 1 654 1 711 2 379 986
10 Q4 15 314 8 123 7 191 13 140 2 174 11 514 6 186 5 328 10 282 1 232 3 800 1 937 1 863 2 858 942
11 Q1 15 121 8 029 7 092 12 877 2 243 11 375 6 139 5 236 10 133 1 241 3 746 1 890 1 856 2 744 1 002 Q2 15 292 8 055 7 237 12 998 2 295 11 390 6 107 5 283 10 162 1 228 3 903 1 948 1 955 2 836 1 067 Q3 15 179 8 068 7 112 13 061 2 119 11 229 6 046 5 183 10 079 1 150 3 950 2 022 1 928 2 982 969 Q4 14 829 7 825 7 004 12 671 2 159 11 125 5 943 5 182 9 924 1 200 3 704 1 882 1 823 2 746 958
12 Q1 14 411 7 536 6 875 12 220 2 192 10 986 5 855 5 131 9 777 1 210 3 425 1 681 1 744 2 443 982 Q2 14 397 7 484 6 914 12 113 2 284 10 991 5 813 5 178 9 729 1 261 3 407 1 671 1 736 2 384 1 023 Q3 14 233 7 419 6 814 12 070 2 163 10 811 5 744 5 068 9 617 1 194 3 422 1 676 1 746 2 453 969 Q4 13 926 7 223 6 703 11 652 2 274 10 720 5 635 5 086 9 415 1 305 3 205 1 588 1 617 2 236 969
M M M M M M
M M
1=2+4 2 3 4=6+8+10+ 5=7+9+11+ 6 7 8 9 10 11 12 13 14 15
24. EMPLOYMENT AND WAGES 24.8 Unemployment by branch of activity (NACE 2009) and sex (a)A) Labour force survey
further information, see www.ine.es.
procedure for telephone interviews has been set in place and the questionnaire has been modified. Thus, in 2005 Q1, there is a break in the series of some variables. For
Q1 the new obligatory variables referred to in Regulation (EC) 2257/2003 (on the adaptation of the list of labour force survey characteristics) have been included, a centralised
General note to the tables: As a result of the change in the population base (2001 Census), all the series in this table have been revised as from 1996. In addition, since 2005
b. Series re-calculated drawing on the transition matrix to NACE 2009 published by INE. The series are homogeneous regarding the time since which persons left their last job.
a. The new definition of unemployment applies from 2001 Q1 onwards, entailing a break in the series.(See www.ine.es).
Instituto Nacional de Estadística Thousands Previously employed (b) First-time job-seekers Agriculture Industry Construction Services Unemployed for more than Of which Of which Of which Of which Of which Of which one year (b)
Total Total Females Total Females Total Females Total Females Total Females Total Females Of which Total Females 12+14 13+15
06 1 837 207 131 1 630 914 84 41 148 57 164 7 709 463 525 347 07 1 834 198 121 1 636 897 90 41 137 55 186 9 717 461 506 331 08 2 591 232 139 2 359 1 140 132 61 212 72 424 15 955 586 636 407 09 4 150 300 173 3 849 1 685 193 75 364 108 671 23 1 433 828 1 189 650 10 4 632 355 200 4 277 1 903 219 85 262 75 507 19 1 436 827 1 853 897 11 4 999 421 235 4 578 2 075 233 91 240 65 445 19 1 504 852 2 156 1 048
11 Q1-Q4 4 999 421 235 4 578 2 075 233 91 240 65 445 19 1 504 852 2 156 1 048 12 Q1-Q4 5 769 497 281 5 272 2 389 279 87 305 81 429 20 1 698 965 2 561 1 236
10 Q4 4 697 357 195 4 340 1 956 209 86 232 68 439 15 1 411 804 2 049 984
11 Q1 4 910 374 219 4 536 2 056 226 92 253 66 442 17 1 505 855 2 109 1 027 Q2 4 834 410 230 4 424 1 995 245 93 241 65 430 17 1 432 804 2 077 1 017 Q3 4 978 458 243 4 520 2 061 252 93 218 62 456 20 1 478 851 2 117 1 036 Q4 5 274 443 247 4 831 2 186 210 85 247 67 453 24 1 602 899 2 319 1 112
12 Q1 5 640 456 260 5 184 2 356 269 92 297 77 482 23 1 750 999 2 385 1 165 Q2 5 693 492 277 5 201 2 322 281 81 320 82 442 17 1 666 947 2 493 1 196 Q3 5 778 551 310 5 227 2 364 298 92 309 82 406 20 1 637 933 2 576 1 238 Q4 5 965 488 276 5 477 2 515 267 84 295 85 388 21 1 737 980 2 790 1 346
BANCO DE ESPAÑA 409 BOLETÍN ESTADÍSTICO, FEBRUARY 2013

M M M M M M
M M
1=2+4+6+8= 2 3 4 5 6 7 8 9 10 11 12 13 14 15 16
24. EMPLOYMENT AND WAGES 24.9 Unemployment by level of education and sex,A) Labour force survey family situation and duration of unemployment (a)
further information, see www.ine.es.
procedure for telephone interviews has been set in place and the questionnaire has been modified. Thus, in 2005 Q1, there is a break in the series of some variables. For
Q1 the new obligatory variables referred to in Regulation (EC) 2257/2003 (on the adaptation of the list of labour force survey characteristics) have been included, a centralised
General note to the tables: As a result of the change in the population base (2001 Census), all the series in this table have been revised as from 1996. In addition, since 2005
a. The new definition of unemployment applies from 2001 Q1 onwards, entailing a break in the series.(See www.ine.es).
Instituto Nacional de Estadística Thousands By level of education By family status Search time Illiterate and Primary Secondary and voca- Higher and unqualified tional training pre-university
Total 1 year Have Referen- Spouse of Other Up to 6 and over already Of which Of which Of which Of which ce reference member five to 11 and found person person months months unclassi- work Total Total Total Total fiable Females Females Females Females
13 a 16= 10 a 12=
06 1 837 92 45 265 133 1 204 690 276 178 565 478 794 886 237 471 244 07 1 834 104 48 280 139 1 201 677 249 155 596 477 761 904 236 435 259 08 2 591 156 66 459 180 1 684 857 291 177 890 660 1 041 1 389 383 552 267 09 4 150 229 90 703 256 2 788 1 264 429 247 1 544 1 036 1 570 1 826 899 1 182 243 10 4 632 243 92 782 294 3 089 1 408 518 308 1 721 1 180 1 731 1 514 888 1 970 261 11 4 999 244 102 760 287 3 369 1 554 627 367 1 886 1 271 1 842 1 502 825 2 408 264
11 Q1-Q4 4 999 244 102 760 287 3 369 1 554 627 367 1 886 1 271 1 842 1 502 825 2 408 264 12 Q1-Q4 5 769 236 98 843 334 3 941 1 785 748 454 2 191 1 479 2 099 1 564 920 3 028 257
10 Q4 4 697 238 88 761 292 3 158 1 453 539 320 1 747 1 218 1 733 1 504 790 2 155 248
11 Q1 4 910 228 95 763 292 3 326 1 540 593 348 1 843 1 276 1 792 1 534 828 2 287 262 Q2 4 834 241 102 756 280 3 254 1 499 583 344 1 794 1 234 1 806 1 423 842 2 310 259 Q3 4 978 242 98 751 293 3 328 1 531 658 383 1 886 1 238 1 854 1 451 817 2 399 312 Q4 5 274 264 113 769 283 3 568 1 646 673 391 2 019 1 339 1 916 1 599 814 2 638 223
12 Q1 5 640 263 108 813 320 3 875 1 776 688 412 2 166 1 455 2 019 1 644 946 2 823 228 Q2 5 693 239 97 841 328 3 905 1 745 708 430 2 178 1 440 2 076 1 514 945 2 974 261 Q3 5 778 231 94 855 343 3 921 1 763 772 476 2 162 1 477 2 139 1 509 929 3 034 307 Q4 5 965 213 94 862 344 4 064 1 855 826 498 2 258 1 544 2 164 1 588 862 3 280 234
M M M M M M
M M
1 2 3 4 5 6 7 8 9 10 11 12 13 14 15 16 17
24. EMPLOYMENT AND WAGES 24.10 Unemployed by type of working day in the job sought and sexA) Economically Active Population Survey
the unemployed excluded from the foregoing status.
a. Only the unemployed that are looking for (or have found) a job as wage-earners are classified by type of working day; accordingly, the "Non-classifiable" category is for
Instituto Nacional de Estadística Thousands
Total Males Females Total Full time Part time Whatever Does Non- Total Full time Part time Whatever Does Non- they not class- they not class- find Know ifia- find Know ifia- Full Would Part Would ble Full Would Part Would ble time accept time accept time accept time accept part time full time (a) part time full time (a)
06 1 837 792 315 68 39 5 258 10 98 1 046 273 103 191 25 347 12 95 07 1 834 815 344 73 35 6 247 9 101 1 019 273 96 198 26 323 10 92 08 2 591 1 311 626 125 49 5 460 9 36 1 280 391 120 246 35 453 14 21 09 4 150 2 292 822 273 55 9 1 076 12 45 1 857 423 218 283 41 861 10 21 10 4 632 2 529 748 339 68 10 1 299 13 52 2 103 427 278 266 45 1 048 12 26 11 4 999 2 689 658 400 70 12 1 476 14 59 2 310 391 304 279 59 1 227 13 37
11 Q1-Q4 4 999 2 689 658 400 70 12 1 476 14 59 2 310 391 304 279 59 1 227 13 37 12 Q1-Q4 5 769 3 099 605 440 78 13 1 885 14 65 2 670 352 346 293 65 1 566 11 38
10 Q4 4 697 2 545 700 341 81 11 1 344 12 55 2 151 423 290 276 55 1 067 15 26
11 Q1 4 910 2 635 710 367 62 13 1 414 16 52 2 275 423 300 276 60 1 170 13 35 Q2 4 834 2 608 681 390 61 10 1 390 14 62 2 226 395 300 257 53 1 174 11 36 Q3 4 978 2 674 621 419 74 10 1 481 12 57 2 304 373 313 292 61 1 210 17 39 Q4 5 274 2 840 620 426 83 15 1 617 13 65 2 434 374 306 291 62 1 353 9 38
12 Q1 5 640 3 024 634 432 86 19 1 783 10 60 2 616 364 355 291 68 1 490 10 37 Q2 5 693 3 094 628 436 64 10 1 881 12 64 2 599 376 336 287 59 1 502 7 34 Q3 5 778 3 103 607 428 82 10 1 902 15 60 2 675 356 333 296 61 1 573 18 38 Q4 5 965 3 174 550 462 80 13 1 974 19 77 2 791 312 362 297 72 1 697 11 41
BANCO DE ESPAÑA 410 BOLETÍN ESTADÍSTICO, FEBRUARY 2013

M M M M M M
M M
1 2 3 4 5 6 7 8 9 10 11 12 13 14 15 16 17 18
24. EMPLOYMENT AND WAGES 24.11 Participation rate by age group and sex (a)A) Labour force survey
further information, see www.ine.es.
procedure for telephone interviews has been set in place and the questionnaire has been modified. Thus, in 2005 Q1, there is a break in the series of some variables. For
Q1 the new obligatory variables referred to in Regulation (EC) 2257/2003 (on the adaptation of the list of labour force survey characteristics) have been included, a centralised
General note to the tables: As a result of the change in the population base (2001 Census), all the series in this table have been revised as from 1996. In addition, since 2005
a. The new definition of unemployment applies from 2001 Q1 onwards, entailing a break in the series.(See www.ine.es).
Instituto Nacional de Estadística Percentages
Both sexes Males Females Under 25 Under 25 Under 25
Total 55 Total 55 55 Total 16 - 19 20 - 24 25 - 54 and Total 16 - 19 20 - 24 25 - 54 and Total Total 16 - 19 20 - 24 25 - 54 and over over over
06 58.3 52.7 29.3 67.9 82.0 19.6 69.1 57.1 33.5 72.4 92.6 28.9 47.9 48.1 24.8 63.1 71.2 12.1 07 58.9 52.4 29.7 67.4 82.8 19.9 69.3 57.2 34.7 72.2 92.6 28.7 48.9 47.4 24.5 62.4 72.7 12.7 08 59.8 52.5 29.1 68.1 83.8 20.8 69.5 56.6 32.8 72.7 92.6 29.6 50.5 48.1 25.2 63.3 74.7 13.6 09 59.9 49.5 24.7 66.5 84.7 21.2 68.6 53.1 28.9 69.8 92.3 29.0 51.6 45.7 20.3 63.0 76.7 14.7 10 60.0 46.9 21.5 64.6 85.5 21.4 68.1 49.7 24.5 67.4 92.5 28.8 52.3 44.0 18.4 61.7 78.3 15.3 11 60.0 44.9 19.4 63.1 86.0 21.9 67.5 46.7 21.5 64.8 92.6 28.5 52.9 43.1 17.2 61.3 79.3 16.5
11 Q1-Q4 60.0 44.9 19.4 63.1 86.0 21.9 67.5 46.7 21.5 64.8 92.6 28.5 52.9 43.1 17.2 61.3 79.3 16.5 12 Q1-Q4 60.0 42.8 17.5 61.0 86.7 22.4 66.9 44.4 19.0 62.9 92.7 28.6 53.4 41.1 15.8 59.0 80.6 17.2
10 Q4 60.0 45.4 19.1 63.8 85.8 21.6 67.7 47.7 21.3 66.4 92.4 28.7 52.6 43.0 16.8 61.1 79.0 15.7
11 Q1 59.9 44.5 18.6 62.7 85.9 21.6 67.4 46.4 21.1 64.4 92.4 28.5 52.7 42.4 15.9 60.8 79.2 15.9 Q2 60.1 45.1 19.8 63.0 86.2 21.9 67.4 46.6 21.3 64.7 92.5 28.5 53.1 43.5 18.2 61.2 79.7 16.4 Q3 60.1 47.2 22.1 65.0 85.8 21.9 67.6 48.9 24.4 66.5 92.6 28.3 52.9 45.4 19.7 63.5 78.8 16.7 Q4 59.9 43.1 17.1 61.6 86.3 22.2 67.3 44.9 19.1 63.5 92.7 28.8 52.9 41.3 15.1 59.7 79.7 16.8
12 Q1 59.9 42.2 17.1 60.2 86.7 22.1 66.9 43.6 18.4 61.8 92.5 28.4 53.4 40.8 15.7 58.6 80.7 16.8 Q2 60.1 43.1 18.4 60.8 86.6 22.5 67.2 44.5 20.3 62.1 92.8 28.8 53.4 41.6 16.4 59.6 80.3 17.3 Q3 60.1 44.8 19.3 63.1 86.5 22.5 67.2 46.8 21.0 65.7 92.7 28.7 53.4 42.6 17.5 60.5 80.3 17.5 Q4 59.8 41.0 15.1 59.9 87.0 22.4 66.5 42.8 16.4 62.1 92.6 28.6 53.4 39.2 13.7 57.5 81.3 17.3
M M M M M M
M M
1 2 3 4 5 6 7 8 9 10 11 12 13 14 15 16 17 18
24. EMPLOYMENT AND WAGES 24.12 Unemployment rate by age group and sex (a)A) Labour force survey
further information, see www.ine.es.
procedure for telephone interviews has been set in place and the questionnaire has been modified. Thus, in 2005 Q1, there is a break in the series of some variables. For
Q1 the new obligatory variables referred to in Regulation (EC) 2257/2003 (on the adaptation of the list of labour force survey characteristics) have been included, a centralised
General note to the tables: As a result of the change in the population base (2001 Census), all the series in this table have been revised as from 1996. In addition, since 2005
a. The new definition of unemployment applies from 2001 Q1 onwards, entailing a break in the series.(See www.ine.es).
Instituto Nacional de Estadística Percentages
Both sexes Males Females Under 25 Under 25 Under 25
Total 55 Total 55 55 Total 16 - 19 20 - 24 25 - 54 and Total 16 - 19 20 - 24 25 - 54 and Total Total 16 - 19 20 - 24 25 -54 and over over over
06 8.5 17.9 29.1 14.8 7.6 5.4 6.3 15.0 23.9 12.3 5.4 4.6 11.6 21.6 36.6 17.8 10.5 7.1 07 8.3 18.2 28.8 15.1 7.2 5.6 6.4 15.2 23.9 12.5 5.4 4.6 10.9 22.0 36.1 18.3 9.7 7.4 08 11.3 24.6 39.5 20.4 10.2 7.0 10.1 23.7 36.0 20.0 8.9 6.1 13.0 25.8 44.4 20.8 11.8 8.6 09 18.0 37.9 55.4 33.4 16.5 11.5 17.7 39.1 55.0 34.6 16.2 10.8 18.4 36.4 56.1 32.1 16.9 12.7 10 20.1 41.6 61.5 37.0 18.6 13.4 19.7 43.2 60.4 38.8 18.1 13.7 20.5 39.8 62.9 35.0 19.2 13.0 11 21.6 46.5 64.4 42.6 20.2 14.3 21.2 48.3 64.6 44.4 19.6 14.6 22.2 44.4 64.1 40.6 20.9 13.8
11 Q1-Q4 21.6 46.5 64.4 42.6 20.2 14.3 21.2 48.3 64.6 44.4 19.6 14.6 22.2 44.4 64.1 40.6 20.9 13.8 12 Q1-Q4 25.0 53.2 72.7 49.2 23.6 17.1 24.7 54.4 72.0 50.5 23.2 17.1 25.4 51.8 73.6 47.7 24.0 17.0
10 Q4 20.3 42.8 63.8 38.4 18.9 13.8 20.0 44.5 62.6 40.3 18.3 14.5 20.8 40.9 65.5 36.2 19.6 12.8
11 Q1 21.3 45.4 65.1 41.3 19.9 13.8 20.8 47.3 63.9 43.5 19.2 13.9 21.9 43.2 66.8 38.9 20.8 13.5 Q2 20.9 46.1 62.6 42.5 19.4 13.5 20.6 48.2 64.1 44.4 18.9 14.0 21.3 43.8 60.8 40.3 20.0 12.8 Q3 21.5 45.8 60.5 42.3 20.0 14.3 21.0 47.1 61.2 43.4 19.4 14.5 22.1 44.5 59.5 41.2 20.7 14.1 Q4 22.9 48.6 69.4 44.5 21.4 15.6 22.5 50.6 69.3 46.5 20.8 16.0 23.3 46.3 69.5 42.2 22.2 15.0
12 Q1 24.4 52.0 71.5 48.1 23.0 16.5 24.1 54.0 71.2 50.3 22.5 16.8 24.9 49.8 71.7 45.6 23.6 16.1 Q2 24.6 53.3 73.3 48.9 23.1 16.8 24.6 54.4 72.7 50.1 23.1 16.7 24.7 52.0 74.0 47.7 23.1 17.0 Q3 25.0 52.3 72.0 48.0 23.5 17.0 24.7 52.9 71.2 48.7 23.2 17.0 25.4 51.7 73.1 47.2 24.0 17.0 Q4 26.0 55.1 74.0 51.7 24.6 18.0 25.6 56.2 72.9 53.0 24.1 18.0 26.6 53.9 75.5 50.2 25.3 17.9
BANCO DE ESPAÑA 411 BOLETÍN ESTADÍSTICO, FEBRUARY 2013

M M M M M M
M M
1 2 3 4 5 6 7 8 9 10 11 12 13 14 15 16 17 18 19
24. EMPLOYMENT AND WAGES 24.13 Unemployment rate by region (a)A) Labour force survey
further information, see www.ine.es.
procedure for telephone interviews has been set in place and the questionnaire has been modified. Thus, in 2005 Q1, there is a break in the series of some variables. For
Q1 the new obligatory variables referred to in Regulation (EC) 2257/2003 (on the adaptation of the list of labour force survey characteristics) have been included, a centralised
General note to the tables: As a result of the change in the population base (2001 Census), all the series in this table have been revised as from 1996. In addition, since 2005
a. The new definition of unemployment applies from 2001 Q1 onwards, entailing a break in the series.(See www.ine.es).
Instituto Nacional de Estadística Percentages Comuni- Castilla- dad Ceuta
Total Anda- Aragón Asturias Baleares Canarias Canta- La Castilla- Cataluña Valen- Extre- Galicia Madrid Murcia Navarra País La and lucía bria Mancha León ciana madura Vasco Rioja Melilla
06 8.5 12.7 5.5 9.3 6.5 11.7 6.6 8.8 8.1 6.6 8.4 13.4 8.5 6.4 7.9 5.3 7.0 6.2 17.2 07 8.3 12.8 5.2 8.5 7.0 10.4 5.9 7.6 7.2 6.5 8.8 13.1 7.6 6.3 7.6 4.8 6.1 5.7 19.3 08 11.3 17.8 7.1 8.5 10.2 17.3 7.2 11.6 9.5 9.0 12.1 15.2 8.7 8.7 12.6 6.7 6.4 7.8 18.8 09 18.0 25.4 12.8 13.4 18.1 26.2 12.0 18.8 13.8 16.3 21.2 20.5 12.6 14.0 20.7 10.9 11.0 12.8 21.4 10 20.1 28.0 14.8 16.0 20.4 28.7 13.9 21.0 15.8 17.8 23.3 23.0 15.4 16.1 23.3 11.8 10.5 14.3 23.9 11 21.6 30.4 17.1 17.9 22.0 29.7 15.3 22.9 16.7 19.3 24.5 25.1 17.4 16.7 25.4 12.9 12.0 17.0 27.0
11 Q1-Q4 21.6 30.4 17.1 17.9 22.0 29.7 15.3 22.9 16.7 19.3 24.5 25.1 17.4 16.7 25.4 12.9 12.0 17.0 27.0 12 Q1-Q4 25.0 34.6 18.6 21.8 23.3 33.0 17.7 28.5 19.7 22.7 27.7 33.0 20.7 19.0 27.9 16.2 14.9 20.5 33.6
10 Q4 20.3 28.4 16.1 16.7 22.2 29.0 14.9 21.3 15.8 18.0 22.9 23.9 15.7 15.8 25.0 11.6 10.9 15.7 25.4
11 Q1 21.3 29.7 18.0 18.2 25.4 28.5 16.4 21.8 17.4 19.0 24.1 25.1 17.3 15.4 26.2 13.4 11.6 15.4 24.5 Q2 20.9 29.7 17.4 17.2 19.5 29.8 14.8 23.0 16.3 18.1 23.7 23.1 16.8 16.0 24.5 12.9 11.6 16.5 26.2 Q3 21.5 30.9 16.2 17.2 17.8 29.6 14.1 22.4 16.1 19.4 24.7 23.6 17.3 17.0 24.2 11.7 12.2 17.4 28.5 Q4 22.9 31.2 16.8 18.9 25.2 30.9 15.9 24.5 17.2 20.5 25.5 28.6 18.3 18.5 26.8 13.8 12.6 18.7 28.7
12 Q1 24.4 33.2 18.4 20.4 28.0 32.3 18.6 27.2 19.3 22.2 27.3 32.1 20.2 18.7 27.0 16.3 13.6 20.1 30.4 Q2 24.6 33.9 18.6 21.0 21.3 33.1 17.4 28.7 19.8 22.0 27.1 33.4 21.1 18.9 26.2 16.4 14.6 22.7 35.1 Q3 25.0 35.4 18.8 21.8 19.5 33.6 15.7 28.0 19.1 22.6 28.1 32.7 20.1 18.6 28.8 15.0 15.5 20.3 35.9 Q4 26.0 35.9 18.6 23.8 24.3 33.0 19.2 30.0 20.8 23.9 28.1 34.1 21.3 19.9 29.6 17.2 15.9 18.7 33.1
M M M M M M
M M
1 2 3 4 5 6 7 8 9 10 11 12 13 14 15 16 17
24. EMPLOYMENT AND WAGES 24.14 Employees and working hours by branch of activity (a)B) Labour situation survey
Contribution Accounts File dated 31 January 2009.
a. From January 2009 the data are based on NACE Rev.2. Previous years’ data have been back-calculated using the two-digit economic activity code in the Social Security
Ministerio de Empleo y Seguridad Social Thousands persons, number of hours and percentages
Total Industry Construction Services (excl. gen. gov.) Of Actual Forecast percentage Actual Forecast percentage Actual Forecast percentage Actual Forecast percentage
which average change in employee average change in employee average change in employee average change in employee working numbers working numbers working numbers working numbers
Number hours Number hours Number hours Number hours of With during of during of during of during
employ- remu- quarter For For employ- quarter For For employ- quarter For For employ- quarter For For ees nera- per em- following same ees per following same ees per following same ees per following same tion ployee quarter quarter employee quarter quarter employee quarter quarter employee quarter quarter
(000s) equal following (000s) following (000s) following (000s) following to year year year year NMW
06 12 991 125 407 1.1 2.0 2 413 420 0.7 1.0 1 962 436 1.5 2.9 8 615 397 1.2 2.1 07 13 607 100 405 1.0 1.9 2 486 418 1.1 1.2 1 988 435 0.8 1.9 9 134 395 1.1 2.1 08 13 212 111 403 -0.6 -0.3 2 388 417 -1.3 -1.3 1 658 433 -2.8 -3.5 9 166 394 -0.1 0.6 09 12 193 104 396 -0.6 -0.4 2 109 410 -1.3 -1.5 1 258 430 -3.7 -3.7 8 825 388 -0.0 0.3 10 11 899 115 395 -0.3 0.0 2 021 413 -0.7 -0.6 1 085 428 -2.0 -3.2 8 793 387 0.1 0.6 11 11 663 137 393 -0.4 -0.7 1 963 413 -1.1 -0.8 924 426 -3.0 -4.2 8 776 385 0.4 -0.4
11 Q1-Q3 11 717 136 391 -0.1 -0.6 1 979 411 -0.9 -0.5 962 424 -2.7 -4.2 8 776 382 0.2 -0.3 12 Q1-Q3 11 313 126 388 -0.8 -1.2 1 879 407 -1.2 -1.7 757 418 -4.1 -5.4 8 678 381 -0.4 -0.7
09 Q4 11 976 126 403 -0.5 0.2 2 043 421 -1.3 -1.0 1 110 432 -3.2 -2.2 8 822 395 0.1 0.7
10 Q1 11 861 101 411 0.2 0.5 2 023 433 -0.7 -0.5 1 109 444 -1.3 -1.1 8 729 401 0.7 0.9 Q2 11 970 100 414 0.1 -0.4 2 037 435 -0.5 -0.9 1 140 450 -2.3 -3.5 8 793 405 0.5 0.1 Q3 11 944 124 353 -0.7 - 2 032 361 -0.7 -0.4 1 094 388 -3.0 -4.0 8 819 346 -0.5 0.6 Q4 11 821 137 402 -0.6 0.1 1 993 422 -0.9 -0.6 998 431 -1.2 -4.1 8 830 394 -0.5 0.7
11 Q1 11 743 132 410 0.4 0.2 1 983 435 -0.2 0.7 1 002 442 -1.8 -3.5 8 759 401 0.5 0.5 Q2 11 747 142 411 -0.3 -1.0 1 986 433 -0.8 -0.7 972 447 -2.9 -5.0 8 789 402 0.1 -0.6 Q3 11 660 134 351 -0.5 -1.1 1 968 365 -1.6 -1.6 911 383 -3.4 -4.0 8 781 345 0.1 -0.7 Q4 11 502 142 400 -1.2 -1.0 1 915 420 -1.6 -1.7 812 431 -3.7 -4.2 8 776 393 0.9 -0.6
12 Q1 11 346 135 408 -0.8 -0.8 1 885 432 -1.5 -1.2 790 443 -4.2 -5.7 8 672 400 -0.3 -0.3 Q2 11 364 118 409 -0.5 -1.3 1 886 431 -0.8 -1.9 766 440 -3.8 -5.3 8 712 402 -0.1 -0.9 Q3 11 229 125 347 -1.0 -1.4 1 865 359 -1.2 -1.9 715 373 -4.3 -5.2 8 650 342 -0.7 -1.0
BANCO DE ESPAÑA 412 BOLETÍN ESTADÍSTICO, FEBRUARY 2013

M M M M
M M
1=2+12+13 2=3+11 3=4+5 4 5=6+7 6 7=8+9+10 8 9 10 11 12 13
24. EMPLOYMENT AND WAGES 24.15 Job-seekers and unemploymentC) Registered labour market statistics by branch of activity (a)
d. To December 2008, NACE 1993; from January 2009, NACE 2009.
c. Homogeneous time series published by the INEM begin in February 2001.
b. Homogeneous time series published by the INEM begin in January 1996.
of the new registered unemployment data entails a break in the series in January 1996.
groups that should be excluded from outstanding demand are calculated in another way owing to an improvement in the data cross-checking processes). The inclusion
a. On 3 May 2005, the new SISPE management model came into operation. This has involved a change in the way registered unemployment is obtained (basically, those
Instituto de Empleo Servicio Público de Empleo Estatal (INEM) Thousands Unemployed job-seekers (c)
Demand for Registered unemployment (a) Other Employed Whith limited employment unemployed job-seekers availability (job-seekers) Total (c) (c) job-seekers
(b) First Previously employed (d) (c) time Total job- seekrs Total Agricul- Industries other than agriculture (d) ture Total Industry Construction Services
09 4 983 3 915 3 644 251 3 393 96 3 297 486 715 2 097 271 878 190 10 5 500 4 324 4 061 336 3 725 122 3 603 500 755 2 348 264 958 217 11 5 745 4 562 4 257 378 3 879 141 3 738 494 748 2 497 305 950 234 12 6 284 5 073 4 720 390 4 330 169 4 161 533 779 2 849 352 960 251
12 J-F 6 197 5 011 4 656 394 4 262 158 4 105 530 800 2 775 355 921 264 13 J-F 6 511 5 320 5 011 369 4 641 207 4 434 552 760 3 122 309 934 257
12 Feb 6 274 5 074 4 712 402 4 311 163 4 147 535 808 2 804 362 933 267 Mar 6 317 5 113 4 751 413 4 338 168 4 170 540 810 2 819 362 933 271 Apr 6 286 5 100 4 744 415 4 329 167 4 162 542 809 2 811 355 923 263 May 6 229 5 065 4 714 414 4 300 160 4 140 538 797 2 805 351 911 253 Jun 6 239 4 998 4 615 394 4 222 161 4 060 528 779 2 753 383 988 252 Jul 6 265 4 966 4 587 383 4 204 165 4 040 521 765 2 754 378 1 057 242 Aug 6 254 4 992 4 626 371 4 255 163 4 091 528 767 2 796 366 1 021 241 Sep 6 276 5 063 4 705 378 4 327 161 4 166 527 757 2 882 358 977 236 Oct 6 363 5 187 4 834 379 4 454 185 4 269 536 754 2 980 353 935 241 Nov 6 441 5 225 4 908 382 4 526 191 4 335 540 752 3 043 317 971 245 Dec 6 340 5 141 4 849 368 4 480 188 4 292 543 756 2 993 293 956 243
13 Jan 6 471 5 286 4 981 365 4 616 203 4 413 551 759 3 102 305 932 254 Feb 6 551 5 354 5 040 374 4 667 211 4 455 552 761 3 142 314 937 260
1 2=3+4 3 4 5 6 7=8+9 8 9
24. EMPLOYMENT AND WAGES 24.16 Vacancies and job-seekers,C) Registered labour market statistics and placements (a)
"With intermediation of INEM" (since 1994).
previous one, and this brought about a break in the series from May 2005. Previously placements were classified as "Without intermediation on INEM" (up to 1993) and
d. The entry into operation of the new SISPE management model entailed a change in the classification of placements. The new classification is not homogeneous with the
c. There is a break in May 2005. Only the movements actually registered are compiled. Simultaneous registration and de-registration does not take place for each new contract.
The outstanding vacancies cannot be determined. The number of jobs de-registered may exceed the number initially offered.
b. There was a break in new vacancies and in de-registered vacancies in 1994 (Royal Decree Law 18/1993). Since May 2005, these items relate to jobs offered by employers.
a. On 3 May 2005, the new SISPE management model came into operation.This has involved changes and breaks in the series in this table.
Instituto de Empleo Servicio Público de Empleo Estatal (INEM) Thousands
Vacancies (b) Job-seekers (c) Placements De-registered No vacancy Vacancy
New Newly and De- Total previously previously re-registered registered registered registered Total Filled Other (d) (d)
09 595 505 426 79 8 983 8 143 13 978 13 551 426 10 606 503 434 69 8 443 8 643 14 296 13 867 428 11 512 463 399 64 8 801 8 878 14 561 14 162 399 12 339 317 271 47 8 943 8 973 14 022 13 751 271
12 J-J 25 32 28 4 865 696 1 054 1 026 28 13 J-J 34 27 23 4 909 798 1 112 1 089 23
12 Jan 25 32 28 4 865 696 1 054 1 026 28 Feb 29 25 21 4 726 614 970 949 21 Mar 33 28 25 3 708 700 1 036 1 011 25 Apr 27 26 23 3 654 719 1 023 1 000 23 May 35 31 28 3 718 813 1 221 1 193 28 Jun 31 34 27 7 762 796 1 282 1 255 27 Jul 20 21 16 5 778 817 1 357 1 341 16 Aug 21 18 15 3 637 700 1 035 1 021 15 Sep 29 22 17 4 811 816 1 351 1 334 17 Oct 34 31 27 3 936 879 1 469 1 442 27 Nov 31 27 25 3 767 719 1 153 1 128 25 Dec 24 23 19 3 582 703 1 071 1 052 19
13 Jan 34 27 23 4 909 798 1 112 1 089 23
BANCO DE ESPAÑA 413 BOLETÍN ESTADÍSTICO, FEBRUARY 2013

M M M M M
M M
1 2 3 4 5 6 7 8 9 10 11 12 13 14 15
24. EMPLOYMENT AND WAGES 24.17 Employment contractsC) Registered labour market statistics
c. Until December 1998 corresponds to the part-time contract type. From January 1999 corresponds to part-time working hours. b. From January 2002, stand-in and partial retirement contracts are included in addition to contracts to replace workers retiring at 64. longer a type of contract. a. Before January 2002 the total does not coincide whith the sum of the components shown here as it also includes part-time contracts. which from January 2002 are no
Instituto de Empleo Servicio Público de Empleo Estatal (INEM) Thousands By type of contract By working hours
Total Permanent Fixed-term Full- Part- time time Total Ordi- Employment Converted Total Task Casual Sub - Apprent- Train - Disabled Other nary promoting or owing to stitu- iceship ing and service production tion special requirements retirement (a) (a) (b) (c)
08 1 383 159 73 20 65 1 225 516 553 128 5 7 8 7 1 029 354 09 1 168 109 50 16 43 1 059 456 455 125 4 5 7 7 839 329 10 1 201 102 48 13 41 1 099 469 479 131 4 5 5 6 848 354 11 1 203 93 45 9 38 1 110 467 491 132 4 5 5 6 832 371 12 1 147 90 57 1 33 1 057 449 471 117 3 5 6 5 756 391
12 J-F 999 75 41 5 30 924 392 405 111 3 3 6 4 698 301 13 J-F 1 026 96 63 - 33 930 405 405 99 3 6 4 7 689 337
12 Jan 1 039 76 40 5 30 963 408 423 115 3 3 6 4 733 305 Feb 959 74 41 5 29 885 377 386 107 3 2 5 4 663 296 Mar 1 027 98 62 0 37 928 399 411 101 3 5 5 4 694 333 Apr 1 003 90 56 0 34 913 371 428 97 3 5 5 4 668 336 May 1 204 96 59 0 37 1 108 467 508 111 3 6 5 7 809 395 Jun 1 284 92 57 0 34 1 193 484 567 120 4 6 5 7 838 447 Jul 1 352 91 55 - 37 1 261 483 595 160 4 7 6 7 852 500 Aug 1 022 62 37 - 25 960 372 435 137 2 4 4 6 678 344 Sep 1 241 98 65 - 33 1 143 528 472 121 6 4 7 6 790 451 Oct 1 427 131 92 - 39 1 297 614 538 120 5 7 7 6 884 544 Nov 1 152 100 67 0 33 1 052 478 443 109 3 6 7 5 751 401 Dec 1 059 77 50 - 27 981 407 448 104 2 5 10 6 715 343
13 Jan 1 102 101 65 - 36 1 001 429 443 108 3 7 5 7 749 352 Feb 950 92 61 - 31 858 381 368 90 3 6 4 6 628 322
M M M M M M P
M PM P
P P P P P P P P P P P P
P
1 2 3 4 5 6 7 8 9 10 11 12
24. EMPLOYMENT AND WAGES 24.18 Unemployment benefit recipientsC) Registered labour market statistics
Instituto de Empleo, Servicio Público de Empleo Estatal (INEM) y Ministerio de Empleo y Seguridad Social Thousands and percentages Contributory benefits Non-contributory benefits Insertion Unemploy- scheme ment
Total Total Part- Casual agric. workers income benefit unemployment time receiving benefits system. unemploy- Unem- Gross Total ment Total ployment coverage Of which assis- Total Number of days ratio tance worked in the Total benefit month Lump- sum Up to More than seven seven
07 1 421 780 780 100 0 576 400 175 144 32 66 71.37 08 1 815 1 101 1 101 111 0 646 480 166 136 31 68 73.43 09 2 681 1 625 1 622 102 2 961 802 159 133 26 96 75.44 10 3 043 1 472 1 469 94 3 1 445 1 291 154 130 24 126 78.43 11 2 846 1 328 1 320 87 8 1 331 1 184 147 124 23 186 70.70 12 2 942 1 382 1 364 ... 17 1 327 1 187 140 ... ... 234 65.85
12 J-J 3 012 1 435 1 425 82 11 1 355 1 212 143 112 32 222 69.10 13 J-J 3 062 1 460 1 439 ... 21 1 371 1 237 135 ... ... 231 64.46
11 Dec 2 927 1 390 1 380 83 10 1 321 1 174 147 112 34 217 69.90
12 Jan 3 012 1 435 1 425 82 11 1 355 1 212 143 112 32 222 69.10 Feb 3 023 1 420 1 408 82 12 1 376 1 236 140 118 22 227 67.90 Mar 2 973 1 376 1 362 83 14 1 365 1 228 137 118 19 232 66.40 Apr 2 922 1 349 1 335 83 15 1 339 1 202 136 118 18 234 65.50 May 2 901 1 327 1 311 84 17 1 335 1 197 137 116 22 239 65.40 Jun 2 883 1 330 1 312 83 18 1 310 1 172 138 119 20 242 66.10 Jul 2 923 1 396 1 378 82 18 1 286 1 144 141 129 12 241 67.30 Aug 2 960 1 437 1 418 80 19 1 289 1 145 143 132 11 234 67.30 Sep 2 837 1 326 1 306 81 20 1 278 1 135 143 129 15 232 63.50 Oct 2 917 1 367 1 346 82 21 1 317 1 174 143 123 20 233 63.40 Nov 3 001 1 412 1 390 82 22 1 353 1 211 142 124 18 236 64.30 Dec 2 957 1 403 1 382 ... 21 1 322 1 184 137 ... ... 232 64.05
13 Jan 3 062 1 460 1 439 ... 21 1 371 1 237 135 ... ... 231 64.46
BANCO DE ESPAÑA 414 BOLETÍN ESTADÍSTICO, FEBRUARY 2013

M M M M
M M
1 2 3 4=1-3 5= 6 7 8 9 10 11 12 13 14 15 16 17
24. EMPLOYMENT AND WAGES 24.19 Registrations, deregistrations and totalD) Social Security System: registered workers and pensions paid registered workers by regime
c. From January 2008, self-employed farmers have been included under the Special Self-Employed Regime.
Contribution Accounts File dated 31 January 2009.
b. From January 2009 the data are based on NACE Rev.2. Previous years’ data have been back-calculated using the two-digit economic activity code in the Social Security
issue, a six-month transitional period applies, runnig from 1 January to 30 June 2012.
are incorporated into the General Regime and are known as the Special Agricultural System and the Special Domestic Employee System, respectively. Regarding the latter
a. As from 1 January 2012, in accordance with the provisions of Law 28/2011 and Royal Decree 1620/2011, the special regimes for Agriculture and Domestic Employees
Ministerio de Trabajo e Inmigración (MTIN) Thousands
Registrations: De- Net Total registered workers by regime total regis- regis-
regimes trations tra- total tions Total General and special coal mining regime Special Special Special Special regimes Agri- Mariti- Domestic self- cultu- me workers employed
Of which: Of wich: Spe- Of which,by branch of activity (b) ral cial (a) (c) coal (a) First- General Special Special mining Agri- Indus- Construc- Servi- (c) time Agricultural Domestic cul- try tion ces =6+9+ (a) System System ture +(14to17) (a) (a)
09 1 457 42 1 505 -48 17 917 13 539 ... ... 7 59 2 140 1 293 9 982 802 67 288 3 214 10 1 496 41 1 508 -12 17 582 13 272 ... ... 7 58 2 038 1 109 9 943 819 65 293 3 126 11 1 508 39 1 597 -89 17 326 13 053 ... ... 6 55 1 980 946 9 913 820 63 295 3 089 12 1 711 29 1 654 57 16 739 13 531 812 254 5 51 1 867 746 9 655 ... 62 96 3 046
12 J-F 2 069 20 1 494 575 16 815 13 472 834 40 6 48 1 907 805 9 668 ... 61 243 3 043 13 J-F ... ... ... ... 16 089 ... ... ... ... ... ... ... ... ... ... ... ...
12 Feb 1 275 20 1 341 -66 16 810 13 471 825 61 6 49 1 900 800 9 666 ... 62 227 3 044 Mar 1 423 24 1 434 -11 16 886 13 556 818 97 6 50 1 893 793 9 733 ... 62 211 3 051 Apr 1 439 23 1 350 89 16 863 13 562 818 126 6 50 1 883 776 9 737 ... 60 179 3 057 May 1 655 32 1 668 -13 16 894 13 622 830 159 6 52 1 883 776 9 748 ... 62 142 3 062 Jun 1 879 46 2 149 -270 16 966 13 710 809 232 4 53 1 888 768 9 785 ... 64 119 3 069 Jul 1 927 56 1 661 266 16 875 13 745 791 366 4 55 1 875 747 9 735 ... 65 5 3 057 Aug 1 358 27 1 610 -252 16 682 13 565 789 375 5 54 1 853 721 9 600 ... 64 4 3 045 Sep 1 952 32 1 972 -20 16 794 13 679 812 388 5 56 1 858 717 9 679 ... 63 2 3 044 Oct 1 825 31 1 788 37 16 558 13 457 791 402 5 50 1 831 700 9 517 ... 62 2 3 033 Nov 1 475 24 1 437 38 16 382 13 291 801 410 5 47 1 830 694 9 487 ... 61 1 3 024 Dec 1 465 20 1 796 -331 16 332 13 246 814 415 5 45 1 797 648 9 508 ... 58 1 3 023
13 Jan ... ... ... ... 16 084 13 027 778 416 4 45 1 792 652 9 326 ... 58 - 2 994 Feb ... ... ... ... 16 095 ... ... ... ... ... ... ... ... ... ... ... ...
M M M M M M
M M
1=4 a 8 2 3 4 5 6 7 8 9 10 11 12 13 14 15 16 17 18 19
24. EMPLOYMENT AND WAGES 24.20 Current pensionsD) Social Security System: registered workers and pensions paid
b. Including the beneficiaries of assistance pensions and of the minimum income guarantee payment of the Law for the social integration of the disabled (LISMI).
a. From 1 January 2008, pensioners under the Special Agricultural Regime - Self-Employed will join the Special Regime for the Self-Employed (Law 18/2007 of 4 July 2007).
Instituto Nacional de la Seguridad Social (INSS) and Instituto de Mayores y Servicios Sociales (IMSERSO) Thousands of pensions (first day of the month) By type of pension By Social Security regime Memorandum item: non contributory pensions Termi- Agri- Agri- Work- Compulso-
Total New nated Retire- Inva- Widow- Orphan- Fa- Gene- Coal cultu- cultu- Self- Domes- Mari- place ry old-age ment lidi- hood hood mi- ral mi- ral ral em- tic time accidents and Assistance Retirement ty ly ning self- em- ployed workers workers and invalidity pensions and em- ploy - occupa- insurance and invalidity ployed ees tional (SOVI) LISMI Law (a) (a) diseases (b) 26/1990
=9 a 17
06 8 165 41 30 4 809 860 2 197 260 39 4 637 71 798 657 996 193 131 247 435 66 482 07 8 274 41 31 4 863 889 2 226 258 38 4 746 70 779 652 1 022 190 131 248 435 57 475 08 8 391 44 32 4 937 907 2 250 259 38 4 861 70 - 649 1 812 188 131 249 432 50 465 09 8 532 45 34 5 039 921 2 270 264 38 4 993 69 - 646 1 827 186 131 251 430 43 458 10 8 671 45 33 5 141 934 2 290 269 38 5 124 68 - 642 1 844 183 131 252 427 38 453 11 8 805 44 34 5 246 938 2 309 273 38 5 255 68 - 637 1 860 181 131 251 422 32 449
11 J-N 8 800 46 36 5 242 938 2 308 273 38 5 249 68 - 637 1 859 181 131 251 422 32 449 12 J-N 8 913 ... ... 5 325 943 2 322 284 38 6 003 68 - - 1 871 178 131 251 412 25 ...
11 Oct 8 842 43 32 5 273 940 2 315 275 38 5 292 68 - 636 1 864 180 131 251 419 30 448 Nov 8 853 45 33 5 282 941 2 317 276 38 5 303 68 - 635 1 866 180 131 251 419 30 448 Dec 8 866 19 14 5 290 943 2 319 276 38 5 315 68 - 635 1 867 180 131 251 419 29 448
12 Jan 8 871 62 63 5 297 941 2 320 275 38 5 954 68 - - 1 868 180 131 251 418 29 450 Feb 8 871 51 43 5 297 941 2 318 277 38 5 959 68 - - 1 867 179 131 251 417 28 448 Mar 8 879 50 43 5 301 943 2 318 279 38 5 969 68 - - 1 867 179 131 251 415 28 448 Apr 8 887 44 35 5 304 944 2 319 281 38 5 978 68 - - 1 867 178 131 251 414 27 447 May 8 896 49 35 5 311 944 2 320 283 38 5 988 68 - - 1 868 178 131 251 413 27 447 Jun 8 903 45 31 5 315 945 2 320 285 38 5 997 67 - - 1 869 178 131 250 410 26 446 Jul 8 919 43 29 5 326 945 2 322 287 38 6 011 67 - - 1 871 178 131 250 410 26 445 Aug 8 934 39 32 5 338 945 2 324 288 38 6 025 68 - - 1 873 177 131 250 410 25 445 Sep 8 942 44 30 5 346 943 2 325 290 38 6 033 68 - - 1 874 177 131 250 409 25 445 Oct 8 957 54 31 5 359 942 2 327 291 38 6 048 68 - - 1 876 176 131 250 409 24 445 Nov 8 981 ... ... 5 378 942 2 330 293 38 6 069 68 - - 1 880 176 131 250 408 15 ...
BANCO DE ESPAÑA 415 BOLETÍN ESTADÍSTICO, FEBRUARY 2013

M M M M M M
M M
1=4 a 8 2 3 4 5 6 7 8 9 10 11 12 13 14 15 16 17 18 19
24. EMPLOYMENT AND WAGES 24.21 Average current pensionsD) Social Security System: registered workers and pensions paid
b. Including the beneficiaries of assistance pensions and of the minimum income guarantee payment of the Law for the social integration of the disabled (LISMI).
a. From 1 January 2008, pensioners under the Special Agricultural Regime - Self-Employed will join the Special Regime for the Self-Employed (Law 18/2007 of 4 July 2007).
Instituto Nacional de la Seguridad Social (INSS) and Instituto de Mayores y Servicios Sociales (IMSERSO) Euro/month By type of pension By Social Security regime Memorandum item: non contributory pensions Termi- Agri- Agri- Work- Compulso-
Total New nated Retire- Inva- Widow- Orphan- Fa- Gene- Coal cultu- cultu- Self- Domes- Mari- place ry old-age ment lidi- hood hood mi- ral mi- ral ral em- tic time accidents and Assistance Retirement ty ly ning self- em- ployed workers workers and invalidity pensions and em- ploy - occupa- insurance and invalidity ployed ees tional (SOVI) LISMI Law (a) (a) diseases (b) 26/1990
=9 a 17
06 642 750 574 723 732 477 286 375 772 1 146 420 437 471 408 714 748 306 150 303 07 674 794 612 760 761 498 301 398 808 1 197 438 456 496 425 745 782 319 150 312 08 720 854 663 814 801 529 325 428 861 1 269 - 484 503 449 789 827 336 150 322 09 754 903 703 854 831 554 340 447 900 1 320 - 505 528 465 823 862 349 150 335 10 779 948 731 884 850 572 350 459 927 1 356 - 519 547 476 845 887 359 150 340 11 805 969 752 915 869 586 359 472 955 1 396 - 529 565 485 868 912 366 150 348
11 J-N 804 966 753 915 869 586 359 472 955 1 395 - 529 565 485 867 912 366 150 348 12 J-N 829 ... ... 945 887 601 367 485 935 1 434 - - 583 495 888 933 375 150 358
11 Oct 809 973 762 920 872 588 360 474 959 1 403 - 529 567 484 870 916 366 150 348 Nov 810 961 758 922 872 588 360 474 961 1 405 - 529 568 484 871 917 366 150 348 Dec 811 998 736 923 873 589 360 474 962 1 407 - 529 568 484 872 918 366 150 348
12 Jan 823 1 004 769 936 883 599 368 483 928 1 423 - - 579 496 884 929 375 150 358 Feb 825 964 750 939 884 599 367 484 930 1 426 - - 580 495 886 930 375 150 358 Mar 826 959 762 941 885 600 367 484 931 1 428 - - 581 495 886 931 375 150 358 Apr 827 981 785 942 886 601 367 485 932 1 430 - - 582 495 887 932 375 150 358 May 828 973 794 944 886 601 367 485 933 1 432 - - 582 495 887 933 375 150 358 Jun 830 998 805 946 888 602 367 485 935 1 435 - - 583 495 889 934 375 150 358 Jul 831 1 026 806 947 888 602 367 486 936 1 436 - - 584 495 889 935 375 150 358 Aug 832 1 017 803 949 889 602 367 486 937 1 438 - - 584 495 890 935 375 150 358 Sep 832 1 054 825 950 889 603 366 487 938 1 440 - - 585 495 890 936 375 150 358 Oct 834 1 041 822 952 889 603 366 487 939 1 441 - - 585 494 891 937 375 150 358 Nov 835 ... ... 954 890 603 365 487 941 1 443 - - 586 494 892 938 375 150 358
1 2=3+4 3 4 5 6=7+8 7 8 9 10 11 12 13 14 15 16 17 18 19
24. EMPLOYMENT AND WAGES 24.22 Agreements as per month of effectivenessE) Collective agreements, labour disputes and other labour statistics
Ministerio de Empleo y Seguridad Social
Number of agreements Workers affected Average wage settlement Memorandum item: taking effect (thousands) (percentage) (a) average wage settlement
in agreements as per month registered (cumulative data) (b) Since beginning Since beginning During the month Since beginning of the year of the year of the year Newly signed
During During the Wider Com- the Wider Com- Wider Com- Wider Com- Revi-
month Total than pany month Total than pany Total than pany Total than pany Total sed Total Term Term of company agree- company agree- company agree- company agree- multi- of one more scope ments scope ments scope ments scope ments year year than one year
08 ... 5 987 1 448 4 539 ... 11 968 10 753 1 215 ... ... ... 3.60 3.65 3.09 3.60 3.49 3.79 3.35 3.87 09 ... 5 689 1 366 4 323 ... 11 558 10 443 1 115 ... ... ... 2.24 2.25 2.17 2.24 2.44 1.70 2.53 1.55 10 ... 5 067 1 265 3 802 ... 10 794 9 871 923 ... ... ... 2.16 2.18 1.99 2.16 2.35 1.59 1.98 1.51 11 ... 4 347 1 068 3 279 ... 9 836 8 975 861 ... ... ... 2.43 2.47 2.08 2.43 2.74 1.47 2.13 1.36 12 ... 2 762 646 2 116 ... 6 128 5 456 672 ... ... ... ... ... ... 1.57 1.81 0.92 ... ...
coincide with the annual data.
b. The annual data include agreements registered after the end of the year and inflation-adjustment clauses. Consequenty, the cumulative monthly data to December do not
of the same period a year earlier. The agreements registered to 31 January 2012 included 568 multi-year agreements with economic effects prior to 2012.
a. The information on the number of collective bargaining agreements registered to 31 January 2013 with economic effects in 2013 is not homogeneous with respect to that
11 Oct 13 4 334 1 065 3 269 45 9 830 8 971 859 2.18 2.19 1.36 2.44 2.46 2.08 2.60 2.73 1.73 1.55 1.84 Nov 7 4 341 1 066 3 275 1 9 832 8 971 860 1.73 1.50 1.82 2.44 2.46 2.08 2.51 2.71 1.61 1.55 1.63 Dec 6 4 347 1 068 3 279 5 9 836 8 975 861 2.40 2.42 2.20 2.43 2.47 2.08 2.48 2.68 1.58 1.58 1.58
12 Jan 2 615 2 615 614 2 001 5 685 5 685 5 031 654 1.61 1.58 1.82 1.61 1.58 1.82 2.44 2.45 1.71 -0.06 1.78 Feb 11 2 626 617 2 009 31 5 716 5 061 655 2.26 2.26 2.44 1.61 1.58 1.82 2.31 2.33 1.13 0.44 1.43 Mar 16 2 642 617 2 025 2 5 718 5 061 657 1.35 - 1.35 1.61 1.58 1.82 2.16 2.18 1.05 0.54 1.23 Apr 36 2 678 625 2 053 258 5 976 5 314 663 0.76 0.75 1.19 1.58 1.54 1.81 2.14 2.16 1.15 0.58 1.34 May 16 2 694 630 2 064 7 5 983 5 319 664 2.20 2.58 0.47 1.58 1.55 1.81 1.78 1.92 0.83 1.16 0.72 Jun 22 2 716 635 2 081 22 6 006 5 340 665 0.77 0.76 0.97 1.57 1.54 1.81 1.73 1.86 0.85 1.11 0.76 Jul 22 2 738 640 2 098 12 6 017 5 346 671 0.60 1.05 0.13 1.57 1.54 1.80 1.56 1.66 0.85 1.09 0.75 Aug 5 2 743 640 2 103 0 6 017 5 346 671 -0.53 - -0.53 1.57 1.54 1.79 1.47 1.60 0.87 1.03 0.78 Sep 9 2 752 644 2 108 66 6 083 5 412 672 0.86 0.89 -1.12 1.56 1.53 1.79 1.30 1.53 0.70 1.05 0.59 Oct 7 2 759 646 2 113 44 6 128 5 456 672 2.12 2.13 0.41 1.57 1.54 1.79 1.24 1.50 0.69 0.83 0.63 Nov 3 2 762 646 2 116 0 6 128 5 456 672 1.10 - 1.10 1.57 1.54 1.79 1.29 1.52 0.69 0.83 0.63 Dec - 2 762 646 2 116 - 6 128 5 456 672 - - - 1.57 1.54 1.79 1.31 1.54 0.69 0.82 0.64
13 Jan 80 80 28 52 489 489 477 11 0.37 0.36 0.71 0.37 0.36 0.71 0.37 0.34 1.04 -2.90 1.07
BANCO DE ESPAÑA 416 BOLETÍN ESTADÍSTICO, FEBRUARY 2013

1 2=4 a 7 3 4 5 6 7 8 9 10 11 12 13 14 15 16 17 18
24. EMPLOYMENT AND WAGES 24.23 Agreements as per month registeredE) Collective agreements, labour disputes and other labour statistics and year of effectiveness (a)
Ministerio de Empleo y Seguridad Social Cumulative data Employees affected Average wage settlement Average working hours (thousands ) (percentage) (b) per annum By industry (c) By industry (c) By industry (c) Memoran- Memoran- dum dum
Agree- item: Other than agriculture item: Other than agriculture Other than agriculture ments EPA labour
Total wage- Total cost, Total earners Agricul- Indus- Cons- Servi- wage Agricul- Indus- Cons- Servi- Agricul- Indus- Cons- Servi- ture try truction ces costs ture try truction ces ture try truction ces
08 5 987 11 968 16 681 745 2 805 1 365 7 053 3.60 4.80 3.95 3.39 3.62 3.64 1 749 1 769 1 751 1 745 1 747 09 5 689 11 558 15 681 736 2 828 1 347 6 647 2.24 2.72 1.92 2.15 3.49 2.06 1 751 1 769 1 751 1 738 1 751 10 5 067 10 794 15 347 717 2 696 1 377 6 004 2.16 -0.01 2.20 2.33 1.61 2.21 1 751 1 772 1 753 1 738 1 751 11 4 347 9 836 15 105 555 2 336 1 297 5 587 2.43 1.37 2.25 2.87 2.35 2.29 1 748 1 766 1 751 1 737 1 747 12 2 762 6 128 14 242 392 1 323 417 3 947 1.57 ... ... ... ... ... 1 742 1 752 1 749 1 738 1 742
c. Annual data: to 2004, NACE 1993; from 2005, NACE 2009. Monthly data: to December 2008, NACE 1993; from January 2009, NACE 2009.
of the same period a year earlier. The agreements registered to 31 January 2012 included 568 multi-year agreements with economic effects prior to 2012.
b. The information on the number of collective bargaining agreements registered to 31 January 2013 with economic effects in 2013 is not homogeneous with respect to that
coincide with the annual data.
a. The annual data include agreements registered after the end of the year and inflation-adjustment clauses. Consequently, the cumulative monthly data to December do not
11 Oct 2 292 5 508 14 829 372 1 404 932 2 800 2.60 1.37 2.51 2.99 1.52 2.78 1 758 1 771 1 754 1 737 1 764 Nov 2 411 6 064 14 829 412 1 693 964 2 994 2.51 1.37 2.49 2.76 1.52 2.69 1 758 1 776 1 755 1 737 1 763 Dec 2 532 6 267 14 829 415 1 752 1 026 3 075 2.48 1.37 2.49 2.71 1.52 2.67 1 757 1 776 1 754 1 737 1 763
12 Jan 589 1 240 14 411 162 587 2 490 2.44 1.22 2.45 2.54 2.50 2.32 1 743 1 748 1 755 1 749 1 728 Feb 749 1 671 14 411 164 648 2 856 2.31 1.22 2.47 2.49 2.50 2.14 1 749 1 749 1 754 1 749 1 746 Mar 849 2 105 14 411 164 678 2 1 260 2.16 1.22 2.47 2.46 2.59 1.95 1 753 1 749 1 753 1 748 1 754 Apr 895 2 231 14 397 164 699 2 1 365 2.14 0.05 2.47 2.44 2.59 1.94 1 754 1 749 1 753 1 748 1 755 May 1 021 2 705 14 397 242 724 2 1 737 1.78 0.05 2.15 1.99 2.54 1.63 1 754 1 757 1 753 1 748 1 755 Jun 1 113 2 911 14 397 243 747 21 1 900 1.73 0.05 2.15 1.96 1.20 1.58 1 756 1 757 1 754 1 739 1 756 Jul 1 209 3 257 14 233 243 784 83 2 147 1.56 0.27 2.15 1.73 1.05 1.44 1 752 1 757 1 754 1 738 1 751 Aug 1 302 3 615 14 233 244 881 234 2 256 1.47 0.27 2.15 1.57 1.02 1.40 1 752 1 757 1 754 1 738 1 752 Sep 1 445 4 443 14 233 273 1 062 270 2 838 1.30 0.27 2.09 1.44 1.04 1.19 1 753 1 760 1 754 1 738 1 754 Oct 1 570 4 834 13 926 295 1 100 343 3 096 1.24 ... 1.94 1.42 1.03 1.13 1 755 1 765 1 754 1 738 1 756 Nov 2 002 5 794 13 926 384 1 232 381 3 797 1.29 ... 1.62 1.42 1.04 1.24 1 744 1 751 1 751 1 738 1 742 Dec 2 611 6 078 13 926 392 1 323 417 3 947 1.31 ... 1.81 1.41 1.07 1.25 1 744 1 752 1 749 1 738 1 742
13 Jan 80 489 ... 0 35 ... 453 0.37 ... - 0.71 ... 0.34 1 749 ... ... ... ...
1 2 3 4 5 6 7 8 9 10 11 12 13 14
24. EMPLOYMENT AND WAGES 24.24 Labour disputes and workforce reductionsE) Collective agreements, labour disputes and other labour statistics
Ministerio de Empleo y Seguridad Social
Labour disputes (a) Number of workers affected by workforce reductions Termination and early retirement (b) Suspension and reduction of working hours (b)
Numbers of Partici- Days
strikes pants lost Total in (thousands) (thousands) Total Agricul- Industry Cons- Services Total Agricul- Industry Cons- Services
progress ture truction ture truction
06 779 499 927 51 952 27 169 418 17 219 403 9 129 24 783 2 980 18 108 107 3 588 07 751 492 1 183 58 401 25 742 440 14 481 855 9 966 32 659 6 079 21 684 178 4 718 08 810 543 1 509 148 088 40 572 347 22 816 4 646 12 763 107 516 3 179 91 643 2 661 10 033 09 1 001 653 1 291 549 282 63 476 358 36 497 6 531 20 090 485 806 7 018 393 202 13 692 71 894 10 984 341 671 302 746 52 534 855 24 841 6 775 20 063 250 212 5 097 175 070 19 089 50 956 11 777 222 485 343 629 67 981 736 21 658 9 520 36 067 275 648 4 869 172 059 28 826 69 894
P
11 J-O - - 379 244 225 51 098 625 16 706 6 831 26 936 193 127 3 017 119 900 21 067 49 143 12 J-O - - ... 374 773 61 614 354 19 605 8 850 32 805 313 159 2 948 182 881 30 517 96 813
P P P P P P P P P P
b. To December 2008, NACE 1993; from January 2009, NACE 2009.
Information on the general strike on 29 September 2010 is not provided as figures for the national total are not available.
2,190,769 days lost); 27 January 1994 (4,974,905 participants and the same number of days lost) and 20 June 2002 (3,859,864 participants and the same number of days lost).
a. Not including the general strikes of 14 December 1988 (4,797,711 participants and the same number of days lost); of 28 May 1992 (3,490,987 participants and
11 Aug 50 4 14 20 068 5 222 164 2 043 564 2 451 14 846 366 7 873 2 211 4 396 Sep 80 13 21 21 699 3 543 21 1 148 474 1 900 18 156 586 12 453 1 365 3 752 Oct 98 19 42 27 494 5 617 247 1 371 692 3 307 21 877 401 14 047 2 173 5 256 Nov 107 37 65 34 774 6 676 39 2 447 950 3 240 28 098 1 350 15 739 3 141 7 868 Dec 98 16 41 64 630 10 207 72 2 505 1 739 5 891 54 423 502 36 420 4 618 12 883
12 Jan 67 20 34 29 267 5 636 52 1 923 1 204 2 457 23 631 532 12 689 2 453 7 957 Feb 98 18 25 32 495 5 225 - 2 009 733 2 483 27 270 305 15 769 3 039 8 157 Mar 100 11 21 41 149 8 250 9 2 759 987 4 495 32 899 495 17 592 3 405 11 407 Apr 76 9 21 33 157 5 340 - 1 772 790 2 778 27 817 151 15 484 3 713 8 469 May 94 18 34 40 017 5 393 10 1 652 1 027 2 704 34 624 151 20 656 3 859 9 958 Jun 103 74 179 45 103 5 991 7 2 142 933 2 909 39 112 228 21 941 2 929 14 014 Jul 96 16 222 50 647 7 502 16 2 568 1 251 3 667 43 145 196 27 266 3 313 12 370 Aug 62 12 85 27 186 7 504 151 1 776 761 4 816 19 682 198 11 176 1 709 6 599 Sep 91 50 181 33 821 5 179 60 857 632 3 630 28 642 308 18 841 2 507 6 986 Oct ... ... ... 41 931 5 594 49 2 147 532 2 866 36 337 384 21 467 3 590 10 896
BANCO DE ESPAÑA 417 BOLETÍN ESTADÍSTICO, FEBRUARY 2013

M M M M M M
M M
1 2 3 4 5 6 7 8 9 10 11 12 13 14
24. EMPLOYMENT AND WAGES 24.25 Labour costs. SummaryF) Quarterly labour costs survey
Instituto Nacional de Estadística Euro
Per employee Per hour worked Memorandum item:
Labour costs Labour costs Wage costs Statutory Severance minimum wage for pay- employees Wage costs Other non-wage costs Basic ments
Total Total Overtime Total pay Of which Total Non- Compul- Soc. Euro Euro wage sory Sec. per per income contri- subsidies day month Total Basic pay butions and allowan - ces
06 2 230 1 647 1 428 583 85 517 18 16.47 ... 12.16 10.54 ... 18.03 540.90 07 2 320 1 713 1 488 607 91 536 19 17.22 ... 12.71 11.05 ... 19.02 570.60 08 2 432 1 800 1 561 632 98 552 19 18.01 15.50 13.33 11.58 7 669 20.00 600.00 09 2 517 1 858 1 611 659 113 565 20 19.02 15.61 14.04 12.18 9 751 20.80 624.00 10 2 527 1 875 1 615 652 104 567 20 19.14 15.87 14.20 12.24 9 767 21.11 633.30 11 2 557 1 895 1 631 662 110 573 21 19.56 15.69 14.50 12.48 10 955 21.38 641.40
11 Q1-Q3 2 514 1 853 1 630 661 108 573 20 19.19 15.68 14.14 12.45 11 243 21.38 641.40 12 Q1-Q3 2 521 1 862 1 641 658 104 572 18 19.32 15.76 14.27 12.59 9 405 21.38 641.40
09 Q4 2 649 1 993 1 613 656 111 568 23 19.96 15.78 15.02 12.15 9 590 20.80 624.00
10 Q1 2 466 1 802 1 619 664 115 567 18 18.03 16.34 13.17 11.83 10 204 21.11 633.30 Q2 2 578 1 927 1 614 651 104 567 19 19.05 15.89 14.24 11.93 10 573 21.11 633.30 Q3 2 421 1 779 1 620 642 93 569 19 19.28 15.06 14.17 12.90 7 576 21.11 633.30 Q4 2 642 1 993 1 609 649 107 566 23 20.18 16.18 15.22 12.29 10 714 21.11 633.30
11 Q1 2 487 1 820 1 622 667 115 571 19 18.03 15.98 13.19 11.76 12 119 21.38 641.40 Q2 2 600 1 939 1 627 661 109 572 20 19.34 15.63 14.42 12.10 11 800 21.38 641.40 Q3 2 457 1 801 1 641 656 101 575 20 20.20 15.44 14.81 13.49 9 811 21.38 641.40 Q4 2 684 2 020 1 633 664 115 573 24 20.68 15.71 15.56 12.58 10 090 21.38 641.40
12 Q1 2 515 1 842 1 642 673 119 574 20 18.29 15.95 13.39 11.94 11 286 21.38 641.40 Q2 2 592 1 940 1 636 652 102 571 21 19.47 15.82 14.57 12.29 9 151 21.38 641.40 Q3 2 455 1 806 1 644 650 92 572 14 20.20 15.52 14.85 13.53 7 778 21.38 641.40
M M M M M M
M M
1 2 3 4 5 6 7 8 9 10 11 12 13
24. EMPLOYMENT AND WAGES 24.26 Monthly labour costs per worker.F) Quarterly labour costs survey By branch of activity (NACE 2009)
Instituto Nacional de Estadística y Ministerio de Medio Ambiente y Medio Rural y Marino Euro
Labour costs Wage costs Memoram- dum Total Industry Construction Services item: agri - cultural Of which Of which Of which Of which wage costs
Total Indus - Con- Servi- index try struction ces Total Basic pay Total Basic pay Total Basic pay Total Basic pay 1985=100
06 2 230 2 499 2 192 2 166 1 647 1 428 1 836 1 559 1 532 1 373 1 621 1 404 319.2 07 2 320 2 588 2 298 2 255 1 713 1 488 1 898 1 618 1 602 1 436 1 689 1 465 329.0 08 2 432 2 702 2 443 2 365 1 800 1 561 1 989 1 694 1 703 1 513 1 772 1 538 345.8 09 2 517 2 786 2 576 2 449 1 858 1 611 2 030 1 731 1 791 1 578 1 830 1 589 354.6 10 2 527 2 849 2 579 2 453 1 875 1 615 2 089 1 771 1 805 1 565 1 839 1 589 365.0 11 2 557 2 898 2 650 2 478 1 895 1 631 2 147 1 808 1 850 1 587 1 848 1 599 372.0
11 Q1-Q3 2 514 2 833 2 588 2 441 1 853 1 630 2 086 1 806 1 793 1 589 1 812 1 599 371.5 12 Q1-Q3 2 521 2 899 2 640 2 436 1 862 1 641 2 121 1 831 1 822 1 609 1 815 1 606 ...
09 Q4 2 649 2 970 2 737 2 567 1 993 1 613 2 215 1 741 1 958 1 584 1 950 1 589 362.2
10 Q1 2 466 2 755 2 457 2 406 1 802 1 619 1 971 1 754 1 679 1 568 1 781 1 596 367.1 Q2 2 578 2 867 2 643 2 509 1 927 1 614 2 101 1 765 1 874 1 562 1 897 1 589 362.1 Q3 2 421 2 736 2 472 2 349 1 779 1 620 2 005 1 779 1 695 1 570 1 742 1 593 366.1 Q4 2 642 3 038 2 743 2 547 1 993 1 609 2 277 1 786 1 970 1 561 1 936 1 577 364.9
11 Q1 2 487 2 791 2 526 2 420 1 820 1 622 2 031 1 790 1 718 1 585 1 787 1 591 373.4 Q2 2 600 2 912 2 721 2 523 1 939 1 627 2 166 1 807 1 934 1 583 1 893 1 595 369.0 Q3 2 457 2 797 2 517 2 382 1 801 1 641 2 062 1 820 1 729 1 598 1 755 1 609 372.1 Q4 2 684 3 092 2 835 2 586 2 020 1 633 2 331 1 817 2 018 1 582 1 957 1 600 373.5
12 Q1 2 515 2 864 2 585 2 439 1 842 1 642 2 069 1 827 1 741 1 616 1 805 1 607 374.5 Q2 2 592 2 987 2 791 2 497 1 940 1 636 2 212 1 831 1 975 1 608 1 883 1 600 371.6 Q3 2 455 2 847 2 544 2 371 1 806 1 644 2 082 1 835 1 749 1 605 1 756 1 610 ...
BANCO DE ESPAÑA 418 BOLETÍN ESTADÍSTICO, FEBRUARY 2013

M M M M M M
M M
1 2 3 4 5 6 7 8 9 10 11 12
24. EMPLOYMENT AND WAGES 24.27 Wage costs per hour worked.F) Quarterly labour costs survey By branch of activity (NACE 2009)
Instituto Nacional de Estadística Euro
Total branches of activity Industry Construction Services
Total Full- Part- Total Full- Part- Total Full- Part- Total Full- Part- time time time time time time time time
06 12.16 12.44 8.92 13.10 13.22 9.59 10.45 10.49 8.87 12.30 12.72 8.87 07 12.71 13.03 9.22 13.59 13.72 9.88 10.97 10.99 9.82 12.89 13.37 9.14 08 13.33 13.67 9.69 14.24 14.37 10.40 11.68 11.70 10.65 13.43 13.91 9.58 09 14.04 14.44 10.07 14.95 15.11 10.85 12.39 12.41 11.98 14.10 14.64 9.93 10 14.20 14.68 10.04 15.15 15.33 11.21 12.47 12.51 11.07 14.22 14.85 9.92 11 14.50 15.05 10.19 15.56 15.78 11.21 12.89 12.96 11.08 14.45 15.14 10.09
11 Q1-Q3 14.14 14.67 9.95 15.11 15.31 10.96 12.39 12.45 10.78 14.14 14.81 9.84 12 Q1-Q3 14.27 14.87 9.92 15.44 15.66 11.07 12.70 12.79 10.62 14.18 14.91 9.81
09 Q4 15.02 15.48 10.66 16.05 16.22 11.94 13.69 13.70 13.32 14.98 15.59 10.45
10 Q1 13.17 13.58 9.41 13.70 13.84 10.46 11.22 11.26 9.72 13.32 13.87 9.32 Q2 14.24 14.72 10.02 14.74 14.91 11.03 12.64 12.68 11.35 14.34 14.99 9.90 Q3 14.17 14.65 10.02 15.71 15.91 11.19 12.07 12.10 10.94 14.11 14.74 9.90 Q4 15.22 15.77 10.69 16.46 16.65 12.17 13.94 13.99 12.27 15.11 15.80 10.54
11 Q1 13.19 13.66 9.31 13.75 13.91 10.05 11.37 11.44 9.35 13.29 13.90 9.25 Q2 14.42 14.95 10.24 15.12 15.31 11.26 13.06 13.11 11.70 14.43 15.11 10.12 Q3 14.81 15.40 10.29 16.45 16.71 11.56 12.73 12.79 11.28 14.70 15.43 10.16 Q4 15.56 16.17 10.93 16.93 17.19 11.95 14.41 14.51 11.97 15.39 16.13 10.82
12 Q1 13.39 13.93 9.32 14.05 14.24 10.34 11.54 11.62 9.75 13.43 14.11 9.23 Q2 14.57 15.18 10.15 15.59 15.80 11.23 13.59 13.71 10.97 14.45 15.19 10.05 Q3 14.85 15.50 10.28 16.67 16.94 11.64 12.96 13.05 11.14 14.66 15.42 10.16
M M M M M M
M M
1 2 3 4 5 6 7 8 9 10 11 12 13
24. EMPLOYMENT AND WAGES 24.28 Actual hours worked per employee per month,F) Quarterly labour costs survey by branch of activity (NACE 2009) and type of working day
Instituto Nacional de Estadística Hours
Total branches of activity Industry Construction Services
Of which
Total Full- Part- Total Full- Part- Total Full- Part- Total Full- Part- Overtime time time time time time time time time
06 136 0.81 146 76 141 145 73 147 150 77 132 145 76 07 135 0.78 145 77 140 145 74 147 149 76 131 144 77 08 135 0.75 146 76 140 145 73 146 150 79 132 145 77 09 133 0.62 144 74 136 141 70 145 149 73 130 144 75 10 132 0.64 145 76 138 144 73 145 149 75 129 144 76 11 131 0.62 144 76 138 144 77 144 149 75 128 144 76
11 Q1-Q3 131 0.61 144 77 139 144 76 145 150 76 128 144 77 12 Q1-Q3 131 0.53 145 77 138 144 77 144 150 76 128 144 77
09 Q4 133 0.64 145 75 138 143 71 143 148 73 130 145 75
10 Q1 137 0.62 150 76 144 150 73 150 154 78 134 150 76 Q2 135 0.61 148 77 143 148 76 148 153 78 132 148 77 Q3 126 0.65 136 76 128 132 71 141 145 71 123 136 77 Q4 131 0.66 144 75 138 144 74 141 146 74 128 143 75
11 Q1 138 0.59 152 78 148 154 77 151 156 79 135 151 78 Q2 135 0.61 148 77 143 149 78 148 153 79 131 147 77 Q3 122 0.63 133 75 125 130 74 136 141 70 119 132 75 Q4 130 0.63 144 75 138 143 78 140 146 72 127 143 75
12 Q1 138 0.52 153 79 147 154 81 151 157 80 134 152 79 Q2 133 0.51 148 77 142 148 77 145 151 77 130 147 77 Q3 122 0.55 133 75 125 130 73 135 141 71 120 133 75
BANCO DE ESPAÑA 419 BOLETÍN ESTADÍSTICO, FEBRUARY 2013


CHAPTER 25 PRICES

M M M
1 2 3 4 5 6 7 8 9 10 11 12 13
25. PRICES 25.1 Total index with breakdown by type of expenditureA) Consumer price index
Instituto Nacional de Estadística 2011=100 Food and Alcoholic Clothing Recreation Hotels,
Total non- beverages and Housing Furnish- Health Transport Communi- and Education cafes and Miscel- index alcoholic and footwear ings cations leisure restau- laneous beverages tobacco rants
10 96.9 98.0 90.8 99.8 93.3 98.9 101.3 92.6 100.8 100.1 97.7 98.4 97.2 11 100.0 100.0 100.0 100.0 100.0 100.0 100.0 100.0 100.0 100.0 100.0 100.0 100.0 12 102.5 102.3 105.9 100.3 105.1 100.9 103.6 104.8 96.6 100.7 104.8 100.9 102.3
10 99.0 99.0 98.0 108.6 95.7 99.9 100.6 96.1 100.6 100.0 99.2 98.9 98.1 11 101.4 101.1 102.1 108.9 101.2 101.0 97.8 100.8 99.1 101.4 102.0 100.0 100.7 12 104.3 104.2 107.6 109.2 106.9 102.2 110.8 103.9 96.4 102.1 112.7 100.8 104.0
11 Oct 100.9 100.6 102.0 105.2 101.0 100.5 100.3 100.6 99.1 99.7 101.9 100.2 100.4 Nov 101.3 100.8 102.1 110.4 101.1 100.9 97.7 101.0 99.1 99.2 102.0 99.9 100.5 Dec 101.4 101.1 102.1 108.9 101.2 101.0 97.8 100.8 99.1 101.4 102.0 100.0 100.7
12 Jan 100.3 101.4 102.3 93.2 101.7 100.1 97.6 102.7 97.0 98.9 102.1 99.9 101.2 Feb 100.4 101.5 102.6 91.6 101.9 100.1 97.7 103.5 97.0 99.1 102.1 100.0 101.5 Mar 101.1 101.6 102.7 95.1 102.2 100.3 97.7 105.1 97.2 99.8 102.1 100.2 101.6 Apr 102.5 101.8 105.6 104.5 104.4 100.7 97.6 105.7 96.8 100.9 102.1 100.9 101.8 May 102.3 101.6 106.7 106.8 104.7 101.0 97.6 104.2 96.8 99.3 102.1 100.7 101.7 Jun 102.1 102.1 106.7 105.8 104.5 101.1 97.6 102.7 96.8 99.8 102.1 100.9 101.7 Jul 101.9 101.9 107.0 92.9 106.1 100.0 107.1 104.2 95.0 101.8 102.1 101.5 101.5 Aug 102.5 102.3 107.2 91.9 106.4 100.1 106.4 106.3 95.0 102.8 102.1 102.3 102.0 Sep 103.5 102.8 107.5 95.6 107.8 100.9 110.6 108.0 97.4 101.7 103.0 101.4 102.9 Oct 104.4 103.1 107.6 105.6 107.1 101.8 110.8 107.1 97.4 101.7 112.5 101.2 103.8 Nov 104.2 103.7 107.4 111.0 107.0 102.1 110.9 104.1 96.4 100.3 112.6 100.8 104.0 Dec 104.3 104.2 107.6 109.2 106.9 102.2 110.8 103.9 96.4 102.1 112.7 100.8 104.0
13 Jan 103.0 104.6 110.5 93.1 106.2 101.4 109.4 104.9 95.3 99.9 112.7 100.6 104.3
M M M
1 2 3 4 5 6 7 8 9 10 11 12 13 14
25. PRICES 25.2 Total index and sub-indicesA) Consumer price index
Instituto Nacional de Estadística 2011=100 Food, beverages and tobacco Non-food Other sub-indices Industrial goods Services Relative Total Non- and non- Non-food price of
Total Total Unpro- Processed excluding Services energy energy excluding Durable energy index cessed food foods processed energy goods food Total Energy Other goods 14=7/10
10 96.9 96.9 98.2 96.4 96.9 95.6 86.4 99.4 98.3 98.3 98.3 98.7 99.2 86.4 11 100.0 100.0 100.0 100.0 100.0 100.0 100.0 100.0 100.0 100.0 100.0 100.0 100.0 100.0 12 102.5 102.8 102.3 103.1 102.4 103.2 108.9 100.8 101.5 101.6 101.6 101.3 99.7 108.9
10 99.0 98.9 100.1 98.3 99.1 99.3 91.9 102.4 98.8 100.0 99.9 100.3 100.2 91.9 11 101.4 101.2 100.8 101.4 101.4 102.3 101.4 102.7 100.5 101.4 101.4 101.4 100.4 101.4 12 104.3 104.6 104.7 104.6 104.2 105.7 109.1 104.3 102.7 103.7 103.6 103.4 99.1 109.1
11 Oct 100.9 100.8 100.3 101.0 100.9 101.5 101.1 101.7 100.2 100.8 100.9 100.8 100.3 101.1 Nov 101.3 101.0 100.2 101.3 101.3 102.7 101.7 103.1 100.0 101.2 101.3 101.3 100.5 101.7 Dec 101.4 101.2 100.8 101.4 101.4 102.3 101.4 102.7 100.5 101.4 101.4 101.4 100.4 101.4
12 Jan 100.3 101.5 101.0 101.7 100.0 99.6 103.8 97.9 100.3 99.8 99.7 99.3 99.7 103.8 Feb 100.4 101.6 101.0 101.9 100.0 99.7 104.9 97.5 100.4 99.8 99.7 99.2 99.7 104.9 Mar 101.1 101.7 101.1 102.0 100.9 101.1 107.1 98.6 100.6 100.3 100.2 99.8 99.9 107.1 Apr 102.5 102.3 101.7 102.6 102.5 104.0 110.2 101.3 101.1 101.5 101.5 101.2 99.9 110.2 May 102.3 102.3 101.0 102.9 102.3 103.8 108.1 102.0 100.8 101.6 101.6 101.3 100.1 108.1 Jun 102.1 102.7 102.3 102.9 102.0 102.9 105.6 101.8 101.1 101.7 101.6 101.4 100.1 105.6 Jul 101.9 102.6 101.9 102.9 101.7 101.8 108.9 98.9 101.6 101.0 100.9 100.5 99.3 108.9 Aug 102.5 103.0 102.8 103.1 102.3 102.4 112.2 98.4 102.2 101.2 101.1 100.7 99.1 112.2 Sep 103.5 103.5 103.2 103.6 103.5 104.8 114.6 100.8 102.2 102.1 102.0 101.6 100.3 114.6 Oct 104.4 103.7 103.0 104.1 104.5 106.3 112.5 103.7 102.8 103.3 103.3 103.2 100.3 112.5 Nov 104.2 104.2 103.6 104.4 104.2 106.2 109.4 104.8 102.4 103.6 103.6 103.4 99.2 109.4 Dec 104.3 104.6 104.7 104.6 104.2 105.7 109.1 104.3 102.7 103.7 103.6 103.4 99.1 109.1
13 Jan 103.0 105.4 105.4 105.3 102.3 102.2 109.2 99.2 102.4 102.2 101.9 101.2 98.3 109.2
BANCO DE ESPAÑA 422 BOLETÍN ESTADÍSTICO, FEBRUARY 2013
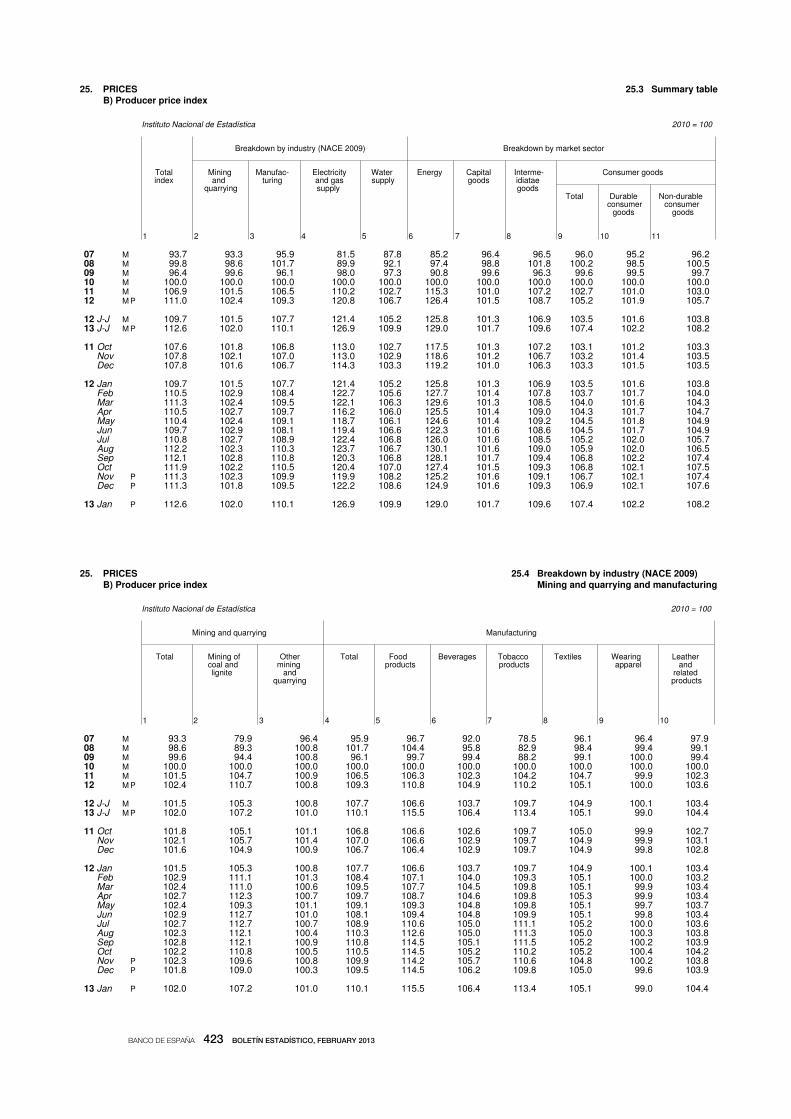
M M M M M M P
M M P
P P
P
1 2 3 4 5 6 7 8 9 10 11
25. PRICES 25.3 Summary tableB) Producer price index
Instituto Nacional de Estadística 2010 = 100 Breakdown by industry (NACE 2009) Breakdown by market sector
Total Mining Manufac- Electricity Water Energy Capital Interme- Consumer goods index and turing and gas supply goods idiatae quarrying supply goods Total Durable Non-durable consumer consumer goods goods
07 93.7 93.3 95.9 81.5 87.8 85.2 96.4 96.5 96.0 95.2 96.2 08 99.8 98.6 101.7 89.9 92.1 97.4 98.8 101.8 100.2 98.5 100.5 09 96.4 99.6 96.1 98.0 97.3 90.8 99.6 96.3 99.6 99.5 99.7 10 100.0 100.0 100.0 100.0 100.0 100.0 100.0 100.0 100.0 100.0 100.0 11 106.9 101.5 106.5 110.2 102.7 115.3 101.0 107.2 102.7 101.0 103.0 12 111.0 102.4 109.3 120.8 106.7 126.4 101.5 108.7 105.2 101.9 105.7
12 J-J 109.7 101.5 107.7 121.4 105.2 125.8 101.3 106.9 103.5 101.6 103.8 13 J-J 112.6 102.0 110.1 126.9 109.9 129.0 101.7 109.6 107.4 102.2 108.2
11 Oct 107.6 101.8 106.8 113.0 102.7 117.5 101.3 107.2 103.1 101.2 103.3 Nov 107.8 102.1 107.0 113.0 102.9 118.6 101.2 106.7 103.2 101.4 103.5 Dec 107.8 101.6 106.7 114.3 103.3 119.2 101.0 106.3 103.3 101.5 103.5
12 Jan 109.7 101.5 107.7 121.4 105.2 125.8 101.3 106.9 103.5 101.6 103.8 Feb 110.5 102.9 108.4 122.7 105.6 127.7 101.4 107.8 103.7 101.7 104.0 Mar 111.3 102.4 109.5 122.1 106.3 129.6 101.3 108.5 104.0 101.6 104.3 Apr 110.5 102.7 109.7 116.2 106.0 125.5 101.4 109.0 104.3 101.7 104.7 May 110.4 102.4 109.1 118.7 106.1 124.6 101.4 109.2 104.5 101.8 104.9 Jun 109.7 102.9 108.1 119.4 106.6 122.3 101.6 108.6 104.5 101.7 104.9 Jul 110.8 102.7 108.9 122.4 106.8 126.0 101.6 108.5 105.2 102.0 105.7 Aug 112.2 102.3 110.3 123.7 106.7 130.1 101.6 109.0 105.9 102.0 106.5 Sep 112.1 102.8 110.8 120.3 106.8 128.1 101.7 109.4 106.8 102.2 107.4 Oct 111.9 102.2 110.5 120.4 107.0 127.4 101.5 109.3 106.8 102.1 107.5 Nov 111.3 102.3 109.9 119.9 108.2 125.2 101.6 109.1 106.7 102.1 107.4 Dec 111.3 101.8 109.5 122.2 108.6 124.9 101.6 109.3 106.9 102.1 107.6
13 Jan 112.6 102.0 110.1 126.9 109.9 129.0 101.7 109.6 107.4 102.2 108.2
M M M M M M P
M M P
P P
P
1 2 3 4 5 6 7 8 9 10
25. PRICES 25.4 Breakdown by industry (NACE 2009)B) Producer price index Mining and quarrying and manufacturing
Instituto Nacional de Estadística 2010 = 100
Mining and quarrying Manufacturing
Total Mining of Other Total Food Beverages Tobacco Textiles Wearing Leather coal and mining products products apparel and lignite and related quarrying products
07 93.3 79.9 96.4 95.9 96.7 92.0 78.5 96.1 96.4 97.9 08 98.6 89.3 100.8 101.7 104.4 95.8 82.9 98.4 99.4 99.1 09 99.6 94.4 100.8 96.1 99.7 99.4 88.2 99.1 100.0 99.4 10 100.0 100.0 100.0 100.0 100.0 100.0 100.0 100.0 100.0 100.0 11 101.5 104.7 100.9 106.5 106.3 102.3 104.2 104.7 99.9 102.3 12 102.4 110.7 100.8 109.3 110.8 104.9 110.2 105.1 100.0 103.6
12 J-J 101.5 105.3 100.8 107.7 106.6 103.7 109.7 104.9 100.1 103.4 13 J-J 102.0 107.2 101.0 110.1 115.5 106.4 113.4 105.1 99.0 104.4
11 Oct 101.8 105.1 101.1 106.8 106.6 102.6 109.7 105.0 99.9 102.7 Nov 102.1 105.7 101.4 107.0 106.6 102.9 109.7 104.9 99.9 103.1 Dec 101.6 104.9 100.9 106.7 106.4 102.9 109.7 104.9 99.8 102.8
12 Jan 101.5 105.3 100.8 107.7 106.6 103.7 109.7 104.9 100.1 103.4 Feb 102.9 111.1 101.3 108.4 107.1 104.0 109.3 105.1 100.0 103.2 Mar 102.4 111.0 100.6 109.5 107.7 104.5 109.8 105.1 99.9 103.4 Apr 102.7 112.3 100.7 109.7 108.7 104.6 109.8 105.3 99.9 103.4 May 102.4 109.3 101.1 109.1 109.3 104.8 109.8 105.1 99.7 103.7 Jun 102.9 112.7 101.0 108.1 109.4 104.8 109.9 105.1 99.8 103.4 Jul 102.7 112.7 100.7 108.9 110.6 105.0 111.1 105.2 100.0 103.6 Aug 102.3 112.1 100.4 110.3 112.6 105.0 111.3 105.0 100.3 103.8 Sep 102.8 112.1 100.9 110.8 114.5 105.1 111.5 105.2 100.2 103.9 Oct 102.2 110.8 100.5 110.5 114.5 105.2 110.2 105.2 100.4 104.2 Nov 102.3 109.6 100.8 109.9 114.2 105.7 110.6 104.8 100.2 103.8 Dec 101.8 109.0 100.3 109.5 114.5 106.2 109.8 105.0 99.6 103.9
13 Jan 102.0 107.2 101.0 110.1 115.5 106.4 113.4 105.1 99.0 104.4
BANCO DE ESPAÑA 423 BOLETÍN ESTADÍSTICO, FEBRUARY 2013

M M M M M M P
M M P
P P
P
1 2 3 4 5 6 7 8 9 10
25. PRICES 25.5 Breakdown by industry (NACE 2009)B) Producer price index Manufacturing (continued I)
Instituto Nacional de Estadística 2010 = 100
Manufacturing
Wood and pro- Paper Printing Coke and Chemicals Basic phar- Rubber Other non- Basic Fabricated ducts of wood and and repro- refined and maceutical and plastic metallic metals metal prod- and cork, ex- paper duction of petroleum chemical products products mineral ucts, ex- except furni- products recorded products products and pharma- products cept ma- ture; articles media ceutical chinery and
of straw and prepara- equipment plaiting tions
materials
07 97.6 96.4 99.2 92.3 91.2 99.8 97.2 99.1 102.1 94.1 08 101.3 98.9 102.4 112.5 97.6 100.8 100.5 102.5 109.2 98.0 09 100.1 95.6 101.4 77.1 93.9 100.2 98.1 101.1 87.6 99.3 10 100.0 100.0 100.0 100.0 100.0 100.0 100.0 100.0 100.0 100.0 11 101.9 105.7 101.5 126.8 109.0 98.9 105.1 101.4 113.2 101.7 12 103.2 105.5 103.7 140.3 113.1 98.2 107.0 102.0 109.3 102.3
12 J-J 103.0 105.2 103.3 137.4 110.0 98.1 105.8 101.8 110.1 102.0 13 J-J 103.6 105.0 104.5 135.9 114.7 98.3 108.3 101.3 107.7 102.9
11 Oct 102.4 106.8 101.7 128.4 109.4 98.4 106.1 101.7 111.4 102.0 Nov 102.5 105.9 102.7 131.6 108.6 98.1 105.7 101.6 110.3 101.7 Dec 102.5 105.3 103.8 130.9 108.0 98.3 105.4 101.6 108.9 101.6
12 Jan 103.0 105.2 103.3 137.4 110.0 98.1 105.8 101.8 110.1 102.0 Feb 103.0 105.0 103.6 140.5 111.6 97.9 106.5 102.0 111.7 102.1 Mar 103.1 106.1 103.5 147.7 113.1 97.7 106.9 102.0 112.6 102.1 Apr 103.3 105.5 103.5 146.2 115.1 97.9 107.4 102.2 110.8 102.3 May 103.2 105.9 103.8 138.8 114.4 98.1 107.1 102.2 110.7 102.3 Jun 103.1 105.6 104.0 130.1 113.3 98.3 106.9 102.2 108.8 102.4 Jul 103.1 106.0 104.0 135.7 111.7 98.4 107.2 102.0 109.0 102.4 Aug 103.3 105.4 103.3 146.1 113.0 98.5 106.8 102.0 108.0 102.4 Sep 103.4 105.2 103.2 146.5 114.1 98.4 107.3 101.9 107.9 102.4 Oct 103.4 105.6 103.3 143.9 113.8 98.3 107.6 101.9 107.3 102.5 Nov 103.4 105.3 104.5 137.9 113.7 98.5 107.5 101.8 107.0 102.4 Dec 103.3 105.4 104.2 132.3 114.0 98.7 107.5 101.7 107.6 102.4
13 Jan 103.6 105.0 104.5 135.9 114.7 98.3 108.3 101.3 107.7 102.9
M M M M M M P
M M P
P P
P
1 2 3 4 5 6 7 8 9
25. PRICES 25.6 Breakdown by industry (NACE 2009)B) Producer price index Manufacturing (continued II) and others
Instituto Nacional de Estadística 2010 = 100
Manufacturing Electricity Water and gas supply supply
Computer, Electrical Machinery Motor vehicles Other Furniture Other electronic equipment and trailers and transport manufac- and optical equipment semi-trailers equipment turing products n.e.c.
07 102.3 99.0 95.6 98.0 96.4 94.6 90.3 81.5 87.8 08 101.7 101.1 98.5 98.9 97.7 98.5 94.4 89.9 92.1 09 101.5 98.1 99.6 100.1 98.8 99.7 98.3 98.0 97.3 10 100.0 100.0 100.0 100.0 100.0 100.0 100.0 100.0 100.0 11 98.6 103.9 100.8 101.0 100.6 100.9 102.8 110.2 102.7 12 96.4 106.3 101.7 101.5 100.9 102.0 104.0 120.8 106.7
12 J-J 97.9 103.9 101.8 101.3 100.8 101.7 103.5 121.4 105.2 13 J-J 93.4 106.8 101.8 101.4 100.6 102.6 104.7 126.9 109.9
11 Oct 97.6 103.9 101.1 101.3 100.6 101.2 103.7 113.0 102.7 Nov 98.1 103.7 101.2 101.4 100.8 101.2 104.3 113.0 102.9 Dec 98.3 103.5 101.2 101.2 100.8 101.4 103.5 114.3 103.3
12 Jan 97.9 103.9 101.8 101.3 100.8 101.7 103.5 121.4 105.2 Feb 98.1 104.7 102.0 101.4 100.8 101.8 103.4 122.7 105.6 Mar 97.5 105.0 102.0 101.2 100.8 101.8 103.3 122.1 106.3 Apr 97.2 105.8 101.7 101.3 101.1 101.8 103.4 116.2 106.0 May 97.6 106.8 101.7 101.3 101.0 101.9 103.7 118.7 106.1 Jun 97.1 106.9 101.8 101.6 101.0 101.8 103.6 119.4 106.6 Jul 97.3 106.9 101.8 101.6 101.1 102.0 104.3 122.4 106.8 Aug 97.3 107.3 101.7 101.6 101.0 102.1 104.3 123.7 106.7 Sep 94.2 107.3 101.4 101.9 101.1 102.1 104.6 120.3 106.8 Oct 94.5 107.1 101.5 101.5 100.7 102.2 104.8 120.4 107.0 Nov 94.0 107.2 101.8 101.5 100.6 102.2 104.7 119.9 108.2 Dec 93.6 107.1 101.8 101.6 100.6 102.2 104.8 122.2 108.6
13 Jan 93.4 106.8 101.8 101.4 100.6 102.6 104.7 126.9 109.9
BANCO DE ESPAÑA 424 BOLETÍN ESTADÍSTICO, FEBRUARY 2013

M M M M M M
1 2 3 4 5 6 7 8 9 10 11 12 13 14 15 16
25. PRICES 25.7 Construction costs index and average priceC) Construction prices per square metre of open-market appraised housing
Ministerio de Fomento January 2005=100 and euro Average price per m2 of open.market appraised housing (quarterly series)
Construction costs index January 2005=100 ( monthly series)
Base 2005
Total Building Civil Regions with Engineering over 2,000,000 inhabitants
Of which Of which Total Less Over Comu- than 2 Anda- Castilla- Cata- nidad Gali- Madrid
Total Labour Inputs Total Total 2 years years lucía León luña Valen- cia Inputs Inputs ciana
06 107.8 104.3 109.7 107.6 109.7 108.5 110.0 1 944 1 913 1 956 1 678 1 417 2 257 1 570 1 394 2 912 07 113.0 106.8 116.6 112.5 116.2 114.7 117.4 2 056 2 032 2 063 1 759 1 502 2 398 1 645 1 512 3 001 08 118.5 112.9 121.7 117.8 120.9 121.8 124.9 2 071 2 069 2 068 1 740 1 495 2 463 1 670 1 552 2 914 09 119.5 118.2 120.2 118.5 118.6 123.8 125.8 1 917 1 923 1 911 1 614 1 397 2 303 1 542 1 452 2 665 10 121.9 119.4 123.3 121.0 122.1 126.0 128.3 1 843 1 848 1 841 1 564 1 384 2 233 1 453 1 455 2 529 11 126.3 121.6 129.0 125.0 127.2 132.1 135.8 1 740 1 758 1 729 1 441 1 305 2 099 1 357 1 394 2 317
M M
11 Q1-Q4 126.3 121.6 129.0 125.0 127.2 132.1 135.8 1 740 1 758 1 729 1 441 1 305 2 099 1 357 1 394 2 317 12 Q1-Q4 125.9 121.9 128.2 124.5 126.2 132.0 135.6 1 588 1 627 1 575 1 289 1 218 1 878 1 213 1 264 2 079
09 Q4 119.6 119.4 119.7 118.8 118.4 123.2 124.5 1 892 1 900 1 879 1 614 1 389 2 286 1 506 1 468 2 620
10 Q1 120.2 119.4 120.7 119.5 119.5 123.6 125.1 1 866 1 870 1 863 1 607 1 396 2 246 1 477 1 460 2 591 Q2 122.4 119.4 124.1 121.4 122.6 127.1 129.8 1 849 1 847 1 855 1 590 1 392 2 253 1 459 1 449 2 552 Q3 122.3 119.4 123.9 121.3 122.6 126.7 129.3 1 832 1 847 1 828 1 561 1 369 2 222 1 434 1 440 2 508 Q4 122.7 119.4 124.6 121.9 123.5 126.5 129.1 1 826 1 830 1 820 1 564 1 380 2 211 1 443 1 470 2 466
11 Q1 125.6 121.0 128.3 124.5 126.8 130.8 134.6 1 778 1 794 1 765 1 523 1 331 2 145 1 384 1 405 2 361 Q2 126.8 121.8 129.6 125.5 127.9 132.5 136.2 1 752 1 771 1 739 1 514 1 312 2 132 1 347 1 402 2 352 Q3 126.9 121.8 129.8 125.6 128.0 133.0 136.9 1 729 1 748 1 719 1 481 1 286 2 077 1 358 1 397 2 295 Q4 125.9 121.9 128.2 124.5 126.2 132.1 135.7 1 702 1 721 1 692 1 441 1 292 2 040 1 340 1 373 2 261
12 Q1 126.2 121.9 128.7 124.9 126.9 131.9 135.4 1 649 1 672 1 638 1 379 1 233 1 960 1 271 1 302 2 182 Q2 126.3 121.9 128.8 124.8 126.7 132.6 136.4 1 606 1 645 1 593 1 345 1 230 1 895 1 226 1 295 2 116 Q3 125.8 121.9 128.0 124.4 125.9 132.0 135.6 1 566 1 604 1 554 1 322 1 207 1 846 1 204 1 256 2 036 Q4 125.4 121.9 127.3 123.9 125.2 131.5 134.9 1 531 1 588 1 515 1 289 1 203 1 811 1 149 1 204 1 981
M M M M
M M P
1 2 3 4 5 6 7 8 9 10 11 12 13 14 15 16 17
25. PRICES 25.8 Total and breakdownD) Price indices of farmers’ inputs and output
Ministerio de Agricultura,Alimentación y Medio Ambiente 2005=100
Prices of farmers’ output Prices of farmers’ inputs
Total Vegetable produce Animal products Goods and regular services Investment goods Agricultural produce Of which Machi- Total Of which Fores- Live - Live - nery Invest- try Total stock stock Total Live- Ferti- Energy Total and ment pro- pro - stock liser and lu- other work Total Vegeta- ducts ducts foods bricants goods Cereals bles Fruit (a) (a) (a) (a) (a) (a)
08 107.0 105.1 105.2 142.5 91.8 114.3 98.5 110.0 104.9 124.9 130.1 133.3 181.8 133.6 115.4 114.0 117.2 09 94.9 88.0 88.0 107.2 82.4 96.0 85.8 105.4 104.0 109.4 115.5 112.0 151.2 106.3 117.3 116.1 118.8 10 100.8 98.8 99.2 122.5 100.5 105.5 81.3 103.8 104.0 103.1 117.9 115.5 133.0 127.0 118.5 116.4 121.4 11 101.5 94.2 94.4 154.5 76.8 96.8 84.6 112.5 114.0 107.9 132.3 133.3 161.4 151.3 120.8 117.4 125.4
11 J-S 101.3 94.6 94.9 157.6 76.8 101.2 84.2 110.8 112.5 105.9 132.4 134.2 159.3 150.1 120.5 117.2 125.0 12 J-S 107.7 98.0 98.4 167.1 75.6 97.8 82.9 121.4 121.4 121.4 138.0 139.9 168.7 162.7 122.7 120.1 126.2
P
product vary from month to month over de course of the year, but are constant for the same month every year.
a. In the case of prices of farmers’ output, for total, vegetable produce, agricultural produce, cereals, vegetables and fruit, the averages given are weighted. The weights for each
11 Sep 102.7 95.1 95.3 152.6 60.6 89.7 83.5 117.3 120.1 109.1 132.6 132.3 165.0 152.5 121.1 117.3 126.4 Oct 103.5 96.8 97.0 147.8 72.6 94.8 85.3 117.2 119.4 111.0 132.1 131.3 168.0 153.0 121.6 118.1 126.6 Nov 101.6 92.7 92.8 148.7 77.4 86.7 86.2 117.6 118.8 114.1 131.8 130.2 166.9 156.2 121.7 118.2 126.6 Dec 100.3 89.2 89.3 148.1 79.6 73.8 85.5 117.0 117.1 116.5 131.9 130.2 167.8 156.0 121.7 118.2 126.6
12 Jan 99.0 86.7 86.7 153.4 87.0 80.5 87.4 115.1 114.3 117.5 133.0 130.5 167.4 159.5 121.4 118.1 126.0 Feb 106.7 97.5 97.8 156.2 107.0 83.6 88.9 117.1 116.1 120.1 134.0 132.1 166.5 162.7 121.5 118.2 126.0 Mar 110.9 102.1 102.5 159.0 110.2 94.0 88.0 120.9 119.4 125.1 135.5 134.9 166.8 163.7 121.5 118.2 126.0 Apr 108.5 96.9 97.1 165.4 93.6 77.6 90.0 121.6 119.8 126.9 136.8 137.2 167.4 162.7 123.6 121.7 126.3 May 109.0 100.3 100.9 163.2 89.0 109.9 78.7 120.0 119.4 121.7 137.0 139.6 168.1 160.8 123.7 121.8 126.3 Jun 110.1 101.4 102.1 163.2 76.8 120.8 76.1 120.9 121.1 120.5 137.9 140.7 169.1 157.3 123.7 121.8 126.3 Jul 100.1 88.1 88.3 165.2 48.6 106.1 75.8 122.1 122.6 120.8 140.0 143.2 170.7 163.0 122.9 120.5 126.3 Aug 105.8 95.1 95.3 174.9 49.7 94.8 80.9 125.5 127.3 120.2 143.2 148.8 170.9 166.4 122.9 120.5 126.3 Sep 118.5 112.9 113.5 177.4 74.6 100.1 79.9 129.2 132.4 119.9 145.2 152.2 171.4 168.6 123.0 120.5 126.3
BANCO DE ESPAÑA 425 BOLETÍN ESTADÍSTICO, FEBRUARY 2013


CHAPTER 26 INTERNATIONAL ECONOMY

1 2 3 4 5 6 7 8 9 10 11 12
26. INTERNATIONAL ECONOMY 26.1 Gross domestic product at current prices (a)A) Macroeconomic aggregates
’Changes to National Accounts in 2005’. Both are dated 30 November 2005. (d) The EU and euro area data are from Eurostat. For further methodological details, see Eurostat News Release no. 151/2005 and the methodological note referred to therein, (c) This series has been converted into US dollars using gross domestic product purchasing power standards in 2000, as per the methodology published by the OECD. constituent countries. aggregate for that period has been obtained applying the respective exchange rates in ECU to the national currency series, this aggregate is not equal to the sum of the (b) The data for the euro area countries up to 1998 Q4 have been obtained applying the irrevocable euro conversion rates to the national currency series. As the euro area (a) Seasonally adjusted series. In the case of countries, except Switzerland, the series are also adjusted for the calendar effect.
OECD, EUROSTAT Eur and other national currencies (b)
OECD EU-27 Euro Germany Spain United France Nether- Italy Japan United Switzer- area States lands Kingdom land
2005 2005 2005 2005 2005 2005 2005 2005 2005 2005 2005 2000 billions billions billions billions billions billions billions billions billions trillions billions billions (c) (d) (d)
06 37 906 11 705 8 568 2 315 986 13 377 1 799 541 1 495 507 1 333 508 07 40 105 12 410 9 033 2 432 1 053 14 029 1 887 572 1 554 513 1 412 541 08 41 374 12 467 9 235 2 471 1 088 14 292 1 932 595 1 575 501 1 441 568 09 40 321 11 752 8 920 2 373 1 048 13 974 1 886 574 1 519 471 1 402 554 10 41 980 12 273 9 169 2 491 1 049 14 499 1 936 589 1 552 482 1 467 574 11 43 602 12 640 9 418 2 589 1 063 15 076 1 995 602 1 580 471 1 516 587
09 Q2 10 015 2 922 2 220 589 262 3 471 470 142 380 118 346 138 Q3 10 091 2 954 2 231 596 261 3 488 470 143 380 117 351 139 Q4 10 206 2 961 2 243 603 260 3 533 474 144 380 119 356 140
10 Q1 10 310 3 002 2 260 609 261 3 568 478 145 384 120 361 141 Q2 10 445 3 062 2 289 622 262 3 603 482 147 389 121 365 143 Q3 10 559 3 101 2 305 628 262 3 644 487 148 389 122 369 144 Q4 10 666 3 108 2 316 633 264 3 684 490 149 390 120 371 146
11 Q1 10 736 3 151 2 341 642 265 3 704 495 150 394 118 377 146 Q2 10 840 3 153 2 353 647 266 3 751 497 150 396 116 377 147 Q3 10 992 3 167 2 364 650 266 3 791 500 151 397 119 380 147 Q4 11 034 3 169 2 361 651 266 3 830 503 151 394 118 382 147
12 Q1 11 169 3 198 2 368 657 264 3 870 504 150 393 120 384 148 Q2 11 210 3 216 2 370 661 263 3 896 506 151 390 120 381 148 Q3 11 296 3 256 2 379 665 263 3 953 509 150 391 119 387 149 Q4 ... ... ... 663 ... 3 957 509 151 ... ... 387 ...
1 2 3 4 5 6 7 8 9 10 11 12
26. INTERNATIONAL ECONOMY 26.2 Gross domestic product at constant prices (a)A) Macroeconomic aggregates
’Changes to National Accounts in 2005’. Both are dated 30 November 2005. (d) The EU and euro area data are from Eurostat. For further methodological details, see Eurostat News Release no. 151/2005 and the methodological note referred to therein, (c) This series has been converted into US dollars using gross domestic product purchasing power standards in 2000, as per the methodology published by the OECD. constituent countries. aggregate for that period has been obtained applying the respective exchange rates in ECU to the national currency series, this aggregate is not equal to the sum of the (b) The data for the euro area countries up to 1998 Q4 have been obtained applying the irrevocable euro conversion rates to the national currency series. As the euro area (a) Seasonally adjusted series. In the case of countries, except Switzerland, the series are also adjusted for the calendar effect.
OECD, EUROSTAT Eur and other national currencies (b)
OECD EU-27 Euro Germany Spain United France Nether- Italy Japan United Switzer- area States lands Kingdom land
2005 2005 2005 2005 2005 2005 2005 2005 2005 2005 2005 2000 billions billions billions billions billions billions billions billions billions trillions billions billions (c) (d) (d)
06 36 472 11 445 8 413 2 308 946 12 958 1 761 531 1 470 512 1 296 497 07 37 490 11 816 8 665 2 386 979 13 206 1 801 552 1 492 524 1 343 516 08 37 553 11 847 8 689 2 405 988 13 162 1 798 562 1 475 518 1 330 527 09 36 202 11 342 8 311 2 283 951 12 758 1 743 541 1 394 489 1 277 517 10 37 282 11 574 8 474 2 375 948 13 063 1 770 550 1 419 512 1 300 533 11 37 973 11 757 8 600 2 448 952 13 299 1 800 556 1 426 509 1 312 543
09 Q2 9 007 2 826 2 070 568 238 3 175 435 134 348 122 318 129 Q3 9 064 2 835 2 078 572 237 3 187 435 135 349 122 319 130 Q4 9 145 2 847 2 087 577 236 3 218 438 136 349 125 321 130
10 Q1 9 212 2 863 2 096 581 237 3 237 439 136 352 126 323 132 Q2 9 298 2 892 2 118 594 237 3 255 442 137 354 128 325 133 Q3 9 360 2 906 2 126 598 237 3 276 444 138 356 129 327 134 Q4 9 411 2 914 2 134 602 237 3 295 446 139 357 129 325 135
11 Q1 9 430 2 933 2 147 609 238 3 296 449 139 357 126 327 135 Q2 9 461 2 940 2 152 612 238 3 316 450 139 358 126 327 136 Q3 9 524 2 946 2 154 614 238 3 327 450 139 357 129 329 136 Q4 9 558 2 938 2 147 613 237 3 360 451 138 355 129 328 136
12 Q1 9 601 2 936 2 146 616 236 3 377 450 138 352 131 328 137 Q2 9 616 2 931 2 142 618 235 3 387 450 139 349 131 327 137 Q3 9 641 2 935 2 141 619 235 3 413 451 137 349 129 330 137 Q4 ... 2 920 2 128 616 ... 3 412 449 137 345 ... 329 ...
BANCO DE ESPAÑA 428 BOLETÍN ESTADÍSTICO, FEBRUARY 2013

M M M M M M
1 2 3 4 5 6 7 8 9 10 11 12 13 14 15 16
26. INTERNATIONAL ECONOMY 26.11 Consumer price indexB) Prices and labour market
OECD 2005 = 100 European Union United Switzer-
OECD Nether- Luxem- United States Japan land Germany Belgium Denmark Spain France Greece lands Ireland Italy bourg Portugal Kingdom
07 105.2 103.9 103.6 103.6 106.4 103.2 106.2 102.8 109.1 104.0 105.0 105.6 104.7 106.2 100.3 101.8 08 109.1 106.6 108.3 107.2 110.7 106.1 110.6 105.4 113.5 107.4 108.6 108.3 108.5 110.2 101.7 104.3 09 109.6 107.0 108.2 108.6 110.4 106.2 111.9 106.6 108.4 108.3 109.0 107.4 110.8 109.9 100.3 103.8 10 111.7 108.2 110.6 111.1 112.4 107.8 117.2 108.0 107.4 109.9 111.5 108.9 114.5 111.7 99.6 104.5 11 114.9 110.7 114.5 114.1 116.0 110.1 121.1 110.5 110.1 113.0 115.3 112.9 119.6 115.2 99.3 104.7 12 117.5 112.9 117.8 116.9 118.8 112.3 122.9 113.2 112.0 116.4 118.4 116.1 123.0 117.6 99.3 104.0
11 Ago 115.3 111.0 114.8 114.2 115.8 110.4 118.6 110.7 110.4 113.5 115.9 112.3 120.1 116.0 99.5 104.2 Sep 115.5 111.1 115.1 114.6 116.1 110.3 122.5 111.5 110.8 113.5 116.1 113.2 120.9 116.2 99.5 104.4 Oct 115.7 111.1 115.3 114.8 117.0 110.6 122.6 111.4 111.1 114.1 116.2 114.4 121.0 115.9 99.6 104.4 Nov 115.8 111.1 115.7 114.7 117.5 110.9 122.8 111.3 111.1 114.0 116.6 114.3 121.2 115.8 99.0 104.2 Dic 115.8 111.9 115.8 114.7 117.6 111.3 122.7 110.8 110.8 114.5 116.5 114.3 121.7 115.6 99.0 104.0
12 Ene 116.1 111.5 116.6 115.0 116.3 111.0 121.7 110.8 110.2 114.8 115.7 114.8 121.1 116.1 99.2 103.6 Feb 116.5 112.3 117.3 116.5 116.4 111.4 119.9 111.6 111.2 115.2 117.7 114.9 121.8 116.6 99.4 103.9 Mar 117.2 112.6 117.6 117.0 117.2 112.3 123.3 112.9 112.3 115.8 118.1 116.3 122.2 117.5 99.9 104.4 Abr 117.6 112.8 117.7 117.0 118.9 112.5 124.3 113.4 112.3 116.3 118.5 116.6 122.9 117.8 100.0 104.5 May 117.5 112.6 117.6 117.0 118.7 112.4 123.9 113.2 112.3 116.3 118.3 116.2 122.8 117.7 99.7 104.5 Jun 117.3 112.5 117.3 116.9 118.5 112.5 123.5 112.7 112.1 116.6 118.2 115.9 122.3 117.5 99.2 104.2 Jul 117.2 112.9 117.6 116.9 118.2 112.0 121.9 113.4 112.0 116.7 117.1 115.9 122.5 117.3 98.9 103.7 Ago 117.7 113.3 118.1 117.2 118.9 112.7 120.6 113.6 112.7 117.1 118.9 115.7 123.1 118.0 99.0 103.7 Sep 118.1 113.3 118.3 117.5 120.0 112.4 123.6 114.0 112.6 117.1 119.4 116.5 123.5 118.5 99.2 104.0 Oct 118.3 113.3 118.5 117.4 121.1 112.6 124.6 114.7 112.4 117.1 119.6 116.8 124.2 118.4 99.2 104.1 Nov 118.0 113.2 118.4 117.3 120.9 112.5 124.0 114.2 112.0 116.9 119.5 116.5 124.4 117.9 98.8 103.8 Dic 118.0 114.2 118.4 116.9 121.0 112.8 123.7 114.1 112.1 117.1 119.2 116.5 125.0 117.6 98.9 103.6
13 Ene ... ... 118.3 ... ... ... ... ... ... 117.3 ... ... ... ... ... ...
M M M M M M
1 2 3 4 5 6 7 8 9 10 11 12 13 14 15 16 17 18
26. INTERNATIONAL ECONOMY 26.12 Producer price indexB) Prices and labour market
OECD, EUROSTAT, INE 2005 = 100 European Union
OECD EU-27 Euro United Japan Switzer- area Germany Belgium Denmark Spain France Greece Nether- Ireland Italy Luxem- Portugal United States land lands bourg Kingdom
07 107.0 108.5 107.9 103.7 109.5 106.7 93.7 104.9 110.7 109.4 98.1 106.7 112.6 106.8 106.2 108.0 103.2 104.5 08 114.3 116.7 114.4 106.3 115.7 111.3 99.8 109.6 120.5 117.4 96.8 111.4 119.5 112.4 116.3 116.6 107.5 107.7 09 109.7 111.6 108.6 103.4 110.9 109.6 96.4 102.8 112.2 105.3 97.5 106.1 107.7 106.0 114.6 110.8 102.3 106.0 10 113.8 115.5 111.7 106.3 119.2 113.6 100.0 105.8 120.6 114.5 97.6 109.6 113.2 109.8 120.8 116.3 101.9 105.7 11 120.9 123.3 118.3 110.5 129.2 117.8 106.9 111.2 131.0 125.8 98.1 115.0 124.2 116.0 130.4 125.4 103.1 104.3 12 123.1 126.6 121.5 112.4 133.6 120.7 111.0 113.2 136.0 130.1 100.9 117.1 126.6 118.5 133.5 128.0 101.3 103.7
11 Aug 121.6 123.6 118.7 110.8 129.3 118.1 107.3 111.5 130.7 125.9 97.2 115.4 123.6 116.3 131.2 126.4 103.4 103.5 Sep 122.1 124.1 119.0 111.1 129.7 118.5 107.5 111.7 131.7 126.6 98.4 115.7 124.5 116.6 131.8 127.0 103.1 103.5 Oct 121.8 124.3 119.2 110.9 129.7 118.6 107.6 111.6 131.7 126.0 98.1 115.6 126.7 116.3 131.8 126.1 102.4 103.3 Nov 121.9 124.8 119.5 111.0 129.7 118.5 107.8 111.8 132.5 126.4 99.0 115.7 125.9 116.6 132.2 126.4 102.3 102.5 Dec 121.6 124.5 119.2 110.9 129.7 118.7 107.8 111.8 132.5 126.2 99.5 115.7 126.8 116.4 131.7 125.7 102.1 102.7
12 Jan 122.3 125.5 120.3 111.6 131.5 119.6 109.7 112.6 135.3 128.4 100.9 116.5 126.6 117.5 132.2 126.7 102.1 102.8 Feb 122.9 126.6 121.1 112.1 132.7 119.6 110.5 113.3 136.5 129.7 100.3 116.8 126.8 118.0 133.1 127.4 102.2 103.6 Mar 123.8 127.2 121.7 112.5 134.2 119.9 111.3 113.9 138.4 130.9 100.3 117.2 127.2 118.6 134.2 128.8 102.7 103.8 Apr 124.0 127.2 121.7 112.7 134.8 120.4 110.5 113.7 137.9 130.9 99.8 117.2 127.1 119.1 134.5 129.1 102.4 103.6 May 123.4 126.3 121.2 112.5 133.9 120.0 110.4 113.1 135.4 129.8 100.4 116.9 127.8 118.4 133.4 128.4 101.9 103.7 Jun 122.4 125.3 120.5 112.1 132.3 120.0 109.7 112.1 132.3 127.5 100.7 116.6 127.8 117.4 132.0 127.1 101.1 103.6 Jul 122.2 125.6 120.9 112.2 132.5 120.4 110.8 112.6 135.4 128.8 102.0 116.9 127.1 117.3 132.2 126.8 100.4 103.5 Aug 123.1 127.0 122.0 112.7 134.4 121.5 112.2 113.7 138.3 131.2 103.0 117.6 126.4 119.0 133.6 128.3 100.4 103.9 Sep 123.9 127.3 122.2 112.9 135.3 122.0 112.1 113.9 137.6 132.0 100.6 117.7 125.9 119.9 134.5 129.5 100.7 104.0 Oct 123.7 127.4 122.3 112.8 134.7 122.0 111.9 113.7 136.0 131.4 100.9 117.6 125.5 119.7 134.6 129.2 100.7 104.0 Nov 122.9 127.2 122.0 112.6 133.9 121.9 111.3 113.3 134.5 130.6 101.7 117.2 124.0 118.9 133.8 127.7 100.5 104.1 Dec 122.6 126.9 121.8 112.4 133.0 121.6 111.3 113.0 134.2 129.7 100.8 117.1 ... 118.4 133.4 127.2 100.8 104.1
13 Jan ... ... ... ... ... ... 112.6 ... ... ... ... ... ... ... ... ... ... ...
BANCO DE ESPAÑA 429 BOLETÍN ESTADÍSTICO, FEBRUARY 2013

M M M M M M
1 2 3 4 5 6 7 8 9 10 11 12 13 14 15 16 17
26. INTERNATIONAL ECONOMY 26.13 Index of unit labour costs in manufacturingB) Prices and labour market
OECD, EUROSTAT 2005 = 100 European Union
OECD EU-27 Euro United Japan area Germany Belgium Luxem- Denmark Spain France Greece Nether- Ireland Italy Portugal United States bourg lands Kingdom
05 100.0 100.0 100.0 100.0 100.0 100.0 100.0 100.0 100.0 100.0 100.0 100.0 100.0 100.0 100.0 100.0 100.0 06 99.5 99.5 98.8 96.1 102.2 109.2 98.8 102.5 101.4 110.1 99.1 100.5 100.4 101.8 102.1 100.1 97.7 07 98.5 99.7 98.4 94.5 102.3 99.1 102.0 106.7 102.4 119.2 97.1 94.1 102.8 101.0 102.2 98.4 92.6 08 102.4 105.5 104.9 102.3 105.5 115.6 101.8 114.2 106.8 130.3 103.1 95.3 110.8 104.0 104.2 103.1 92.9 09 108.3 114.0 114.8 117.8 110.3 147.1 106.1 117.3 115.2 123.2 111.9 84.4 122.0 109.8 117.0 103.4 100.8 10 103.2 108.5 107.9 107.8 106.7 140.0 99.7 112.2 110.4 137.3 103.0 72.6 116.2 106.4 117.2 100.2 92.3
07 Q4 98.4 100.4 99.6 95.4 102.2 99.6 100.8 109.6 103.2 121.0 98.1 90.0 104.0 101.4 104.2 98.6 89.8
08 Q1 99.5 102.2 101.1 98.7 103.2 110.6 100.0 112.7 104.4 126.7 100.1 95.9 105.7 101.2 103.3 100.3 89.3 Q2 100.7 103.6 102.5 98.7 104.1 109.1 101.3 112.9 104.7 129.0 101.7 96.9 107.5 102.9 103.0 102.3 90.8 Q3 102.7 105.1 104.6 101.5 105.8 111.2 101.5 114.8 106.0 130.5 103.2 93.9 113.4 104.4 103.3 104.1 92.9 Q4 106.8 111.1 111.3 110.2 108.9 131.3 104.4 116.2 112.3 135.1 107.5 94.4 116.8 107.4 107.2 105.9 98.5
09 Q1 112.0 117.0 119.9 122.3 110.7 140.4 106.0 118.4 118.7 123.7 116.2 87.1 126.9 113.6 120.9 105.7 106.7 Q2 109.5 115.0 116.2 119.9 111.2 157.1 108.9 118.7 116.4 124.5 115.1 83.7 124.8 109.9 111.9 104.4 101.5 Q3 106.7 112.3 112.3 115.0 109.7 150.6 107.1 116.9 113.6 122.3 109.6 81.7 118.6 107.2 116.0 102.5 99.7 Q4 105.2 111.8 110.9 114.1 109.6 140.2 102.3 115.1 112.3 122.1 106.7 84.9 118.0 108.5 119.3 101.2 95.4
10 Q1 104.2 109.4 109.6 111.6 108.1 150.5 102.6 112.3 111.9 137.1 106.6 74.5 116.2 106.2 118.7 100.6 93.2 Q2 103.0 108.3 108.0 108.5 106.5 136.0 99.9 112.9 110.2 141.4 103.2 75.1 114.8 107.3 116.0 100.6 90.8 Q3 102.9 108.0 107.2 106.9 106.7 137.1 96.9 111.9 109.9 137.3 101.6 70.1 115.6 105.7 116.2 99.9 92.1 Q4 102.7 108.3 106.8 104.3 105.6 136.4 99.3 111.6 109.5 133.3 100.7 70.5 118.2 106.4 117.8 99.8 93.0
11 Q1 102.7 107.9 106.6 102.4 104.7 131.6 99.6 109.6 108.4 129.4 101.4 68.2 122.0 105.4 120.5 99.7 94.0 Q2 ... 109.0 106.5 ... ... 129.5 93.3 108.4 ... 130.7 ... ... ... ... ... 100.3 95.1 Q3 ... ... ... ... ... 132.9 ... ... ... ... ... ... ... ... ... 99.6 94.5
M M M M M M
1 2 3 4 5 6 7 8 9 10 11 12 13 14 15
26. INTERNATIONAL ECONOMY 26.14 Unit value indices of exports (a)B) Prices and labour market
IMF 2000 = 100, USD European Union Euro United
EU-27 area Germany Belgium Denmark Spain France Greece Nether- Ireland Italy United States Japan Switzer- lands Kingdom land
06 145.9 161.5 131.8 149.1 147.0 147.5 123.1 168.5 139.8 123.3 157.7 126.8 110.7 93.9 143.5 07 165.2 182.9 147.1 169.9 159.5 165.2 137.1 189.7 154.9 131.4 180.9 137.1 116.1 94.8 155.8 08 187.3 193.2 158.9 188.9 176.8 180.2 151.8 216.9 174.3 135.5 205.0 144.8 123.1 101.4 178.9 09 160.4 157.0 146.7 168.0 158.6 158.9 136.8 192.8 150.8 129.5 190.2 123.6 117.4 100.3 181.6 10 180.4 162.1 142.8 172.6 157.2 153.7 133.2 199.5 153.1 126.3 192.2 129.9 123.1 104.3 189.0 11 ... 173.4 156.7 194.8 171.5 169.0 145.7 227.8 168.9 130.5 216.0 145.3 133.0 112.2 209.8
(a) Except France, export prices.
11 Jul ... 171.7 160.0 197.1 178.4 175.6 149.4 236.0 174.8 132.1 222.3 148.2 134.0 113.3 220.2 Aug ... 154.5 161.5 203.1 178.0 173.3 150.1 234.9 172.6 131.6 223.2 147.5 134.6 114.5 228.3 Sep ... 182.1 154.9 193.2 172.2 168.0 144.1 226.6 165.9 129.0 215.9 145.8 135.3 114.4 205.7 Oct ... 169.6 156.3 193.6 165.0 172.0 143.6 225.9 166.9 129.1 213.8 144.8 132.6 113.3 203.9 Nov ... 174.1 153.2 195.0 168.5 167.6 141.9 224.8 165.9 130.8 212.4 144.1 132.7 111.8 208.4 Dec ... 149.7 151.1 183.9 163.8 160.8 138.1 218.4 158.3 130.9 207.1 142.3 132.1 111.1 200.6
12 Jan ... 154.7 ... 182.7 164.8 157.0 136.2 218.4 160.9 127.6 208.2 141.7 132.5 111.7 204.2 Feb ... 164.2 ... 189.0 171.4 165.5 ... 225.8 167.2 129.7 213.4 146.4 133.1 111.8 206.5 Mar ... 180.0 ... 191.4 169.3 164.1 ... 228.4 164.7 130.0 213.5 147.3 134.1 110.1 207.1 Apr ... 155.7 ... 190.2 168.4 159.8 ... 227.2 163.0 130.2 210.6 147.2 134.7 110.7 203.6 May ... 160.8 ... 182.1 164.1 155.6 ... 217.5 159.3 127.2 206.2 143.1 134.0 110.4 201.6 Jun ... 158.7 ... 180.5 158.8 152.7 ... 208.5 151.4 127.5 202.6 138.1 131.7 109.5 195.7 Jul ... 151.5 ... 175.3 160.4 151.2 ... 208.7 152.8 123.8 198.6 137.9 132.2 109.0 193.1 Aug ... 131.5 ... 178.7 160.9 152.9 ... 214.3 153.9 126.5 202.9 139.4 133.4 109.6 192.1 Sep ... 154.6 ... 188.0 165.0 162.5 ... 221.4 ... 129.3 209.6 142.9 134.5 110.3 201.1 Oct ... 168.2 ... 186.4 165.6 162.9 ... 221.1 ... 128.5 208.7 143.0 134.5 109.7 203.6 Nov ... ... ... ... 166.6 ... ... 216.5 ... ... ... 141.6 133.6 108.6 203.3 Dec ... ... ... ... ... ... ... ... ... ... ... ... 133.5 ... ...
BANCO DE ESPAÑA 430 BOLETÍN ESTADÍSTICO, FEBRUARY 2013

M M M M M M
1 2 3 4 5 6 7 8 9 10 11 12 13 14 15 16 17
26. INTERNATIONAL ECONOMY 26.15 Harmonised index of consumer prices (a)B) Prices and labour market
(a) See also Table 2.8.
EUROSTAT average 2005 = 100 European Union
EU-27 Euro area Germany Austria Belgium Denmark Spain Finland France Greece Nether- Ireland Italy Luxem- Portugal United Sweden lands bourg Kingdom
07 104.7 104.4 104.1 103.9 104.2 103.5 106.5 102.9 103.6 106.4 103.3 105.6 104.3 105.7 105.5 104.7 103.2 08 108.6 107.8 107.0 107.3 108.9 107.3 110.9 106.9 106.8 110.9 105.5 108.9 108.0 110.0 108.3 108.5 106.7 09 109.6 108.1 107.2 107.7 108.9 108.4 110.6 108.7 106.9 112.4 106.6 107.1 108.8 110.0 107.4 110.8 108.7 10 111.9 109.8 108.4 109.5 111.4 110.8 112.9 110.5 108.8 117.7 107.6 105.4 110.6 113.1 108.9 114.5 110.8 11 115.4 112.8 111.1 113.4 115.1 113.8 116.3 114.2 111.3 121.4 110.2 106.6 113.8 117.3 112.7 119.6 112.3 12 118.4 115.6 113.5 116.3 118.2 116.5 119.2 117.8 113.8 122.6 113.3 108.7 117.5 120.7 115.9 123.0 113.4
11 Sep 116.0 113.5 111.6 114.1 115.9 114.2 117.0 114.6 111.6 122.8 111.2 106.8 115.0 118.2 113.1 120.9 112.7 Oct 116.4 113.9 111.7 114.4 116.0 114.4 117.5 114.8 111.9 123.0 111.3 107.1 116.0 118.3 114.1 121.0 112.6 Nov 116.6 114.0 111.7 114.4 116.5 114.3 117.7 115.0 112.2 123.2 110.8 107.1 115.9 118.7 113.9 121.2 112.8 Dec 117.0 114.4 112.5 114.7 116.8 114.3 117.8 115.0 112.7 123.0 110.5 107.0 116.3 118.6 114.0 121.7 112.8
12 Jan 116.3 113.4 111.9 114.1 115.3 114.8 115.8 115.9 112.2 121.6 110.6 106.6 114.2 118.0 114.4 121.1 112.1 Feb 116.9 114.0 112.9 114.7 118.1 115.9 115.8 116.8 112.8 119.6 111.7 107.8 114.4 119.8 114.6 121.8 112.9 Mar 118.1 115.5 113.4 116.1 118.3 116.6 118.4 117.4 113.8 123.0 113.3 108.9 117.3 120.4 115.9 122.2 113.4 Apr 118.7 116.0 113.5 116.4 118.3 116.6 119.7 117.6 114.0 124.0 113.8 108.9 118.3 120.9 116.3 122.9 113.7 May 118.6 115.8 113.3 116.2 118.2 116.6 119.4 117.6 114.0 123.6 113.6 108.9 118.3 120.7 116.0 122.8 113.7 Jun 118.4 115.8 113.1 116.2 118.1 116.4 119.1 117.7 114.0 123.4 112.9 108.7 118.5 120.5 115.8 122.3 113.3 Jul 118.0 115.2 113.5 115.6 116.5 116.3 118.1 117.4 113.4 121.6 113.4 108.6 116.5 119.5 116.0 122.5 112.8 Aug 118.4 115.6 113.9 116.0 119.0 116.8 118.7 117.8 114.2 120.2 113.4 109.5 116.5 121.4 115.9 123.1 113.0 Sep 119.2 116.4 113.9 117.3 118.9 117.1 121.0 118.5 114.0 123.2 114.0 109.4 118.9 122.0 116.4 123.5 113.8 Oct 119.5 116.7 114.0 117.7 119.1 117.0 121.6 118.8 114.2 124.1 114.9 109.3 119.2 122.1 116.5 124.2 113.9 Nov 119.3 116.5 113.8 117.8 119.0 116.8 121.3 118.7 114.0 123.7 114.4 108.8 118.9 121.9 116.1 124.4 113.7 Dec 119.7 116.9 114.8 118.1 119.2 116.5 121.3 119.0 114.4 123.4 114.2 108.8 119.3 121.5 116.4 125.0 113.9
13 Jan 118.8 115.7 114.0 117.3 117.0 115.9 119.1 119.0 113.8 121.7 114.2 108.2 116.9 120.5 114.9 124.4 112.8 Feb ... 116.1 ... ... ... ... 119.1 ... ... ... ... ... ... ... ... ... ...
M M M M M M
1 2 3 4 5 6 7 8 9 10 11 12 13 14 15 16 17 18 19
26. INTERNATIONAL ECONOMY 26.21 National three-month interbank interest ratesC) Interest rates and yields
Averages of daily data Percentages per annum European Union Euro United
OECD EU-15 area Germany Austria Belgium Denmark Spain Finland France Greece Nether- Ireland Italy Portugal United Sweden States Japan lands Kingdom
07 4.23 4.52 4.28 - - - 4.33 - - - - - - - - 5.93 3.73 5.24 0.71 08 3.45 4.75 4.63 - - - 4.87 - - - - - - - - 5.41 4.57 3.07 0.77 09 0.93 1.19 1.22 - - - 1.80 - - - - - - - - 1.01 0.78 0.83 0.27 10 0.61 0.78 0.81 - - - 0.70 - - - - - - - - 0.57 0.80 0.40 0.11 11 0.81 1.32 1.39 - - - 1.06 - - - - - - - - 0.81 2.33 0.32 0.12 12 0.59 0.75 0.57 - - - 0.38 - - - - - - - - 0.76 1.87 0.34 0.08
11 Sep 0.84 1.46 1.54 - - - 1.17 - - - - - - - - 0.88 2.41 0.28 0.13 Oct 0.88 1.49 1.58 - - - 1.24 - - - - - - - - 0.93 2.39 0.34 0.13 Nov 0.88 1.42 1.48 - - - 1.05 - - - - - - - - 0.97 2.49 0.42 0.11 Dec 0.88 1.38 1.43 - - - 0.76 - - - - - - - - 1.03 2.57 0.48 0.09
12 Jan 0.79 1.21 1.22 - - - 0.80 - - - - - - - - 1.05 2.50 0.42 0.10 Feb 0.71 1.07 1.05 - - - 0.75 - - - - - - - - 1.03 2.33 0.34 0.11 Mar 0.65 0.91 0.86 - - - 0.72 - - - - - - - - 0.99 2.18 0.35 0.11 Apr 0.62 0.81 0.74 - - - 0.73 - - - - - - - - 0.97 2.08 0.35 0.11 May 0.60 0.76 0.68 - - - 0.63 - - - - - - - - 0.96 2.02 0.37 0.10 Jun 0.58 0.72 0.66 - - - 0.15 - - - - - - - - 0.91 2.02 0.36 0.08 Jul 0.53 0.56 0.50 - - - -0.04 - - - - - - - - 0.74 1.98 0.40 0.06 Aug 0.45 0.40 0.33 - - - -0.12 - - - - - - - - 0.62 1.90 0.35 0.05 Sep 0.41 0.32 0.25 - - - -0.19 - - - - - - - - 0.56 1.51 0.32 0.06 Oct - - 0.21 - - - - - - - - - - - - 0.45 1.40 0.27 0.07 Nov - - 0.19 - - - - - - - - - - - - 0.45 1.34 0.27 0.07 Dec - - 0.19 - - - - - - - - - - - - 0.45 1.24 0.30 0.09
13 Jan - - 0.20 - - - - - - - - - - - - - - - - Feb - - 0.22 - - - - - - - - - - - - - - - -
BANCO DE ESPAÑA 431 BOLETÍN ESTADÍSTICO, FEBRUARY 2013

M M M M M M
1 2 3 4 5 6 7 8 9 10 11 12 13 14 15 16 17
26. INTERNATIONAL ECONOMY 26.22 National three-year government bond yieldsC) Interest rates and yields
Average of daily data Percentages per annum European Union Euro United
OECD area Germany Austria Belgium Denmark Spain Finland France Nether- Ireland Italy Portugal United Sweden States Japan lands Kingdom
07 3.85 4.16 4.10 4.14 4.12 4.22 4.13 4.16 4.12 4.12 4.17 4.21 4.18 5.32 4.10 4.39 0.98 08 2.81 3.83 3.55 3.72 3.88 4.06 3.89 3.84 3.69 3.79 4.07 4.05 3.97 4.14 3.75 2.42 0.83 09 1.59 2.09 1.75 1.98 2.00 2.48 2.23 2.26 1.87 2.00 2.86 2.31 2.31 1.94 2.00 1.45 0.49 10 1.33 2.16 1.12 1.60 1.58 1.60 2.64 1.21 1.22 1.19 3.77 2.30 3.59 1.43 1.90 1.10 0.22 11 1.69 4.89 1.31 1.90 2.88 1.50 3.97 1.52 1.70 1.49 10.52 4.20 12.68 1.19 2.10 0.75 0.26 12 1.04 2.85 0.19 0.70 1.11 0.15 3.98 0.41 0.65 0.41 4.56 3.61 10.08 0.39 1.06 0.38 0.13
11 Sep 1.43 5.42 0.67 1.24 2.56 0.86 3.76 0.98 1.17 0.90 9.12 4.64 14.99 0.73 1.35 0.35 0.20 Oct 1.62 6.08 0.77 1.36 2.87 0.88 3.89 1.04 1.37 1.05 8.30 4.83 17.04 0.86 1.44 0.47 0.23 Nov 1.89 8.10 0.56 1.81 3.97 0.70 5.07 0.97 1.75 1.01 9.24 6.77 17.21 0.65 1.16 0.39 0.21 Dec 1.89 6.50 0.43 1.40 3.25 0.34 4.02 0.75 1.32 0.73 8.89 5.80 17.17 0.52 1.03 0.39 0.22
12 Jan 1.78 5.96 0.34 1.64 2.53 0.31 3.34 0.67 1.15 0.58 7.00 4.66 18.29 0.53 1.16 0.36 0.22 Feb 1.75 7.62 0.41 1.29 1.85 0.39 2.95 0.86 1.06 0.76 5.22 3.43 16.59 0.52 1.30 0.38 0.19 Mar 1.90 3.77 0.38 1.13 1.65 0.43 2.76 0.83 1.06 0.72 5.47 2.83 15.62 0.58 1.38 0.50 0.17 Apr 0.97 2.20 0.27 1.09 1.63 0.34 3.62 0.73 1.04 0.72 5.59 3.79 13.92 0.54 1.33 0.43 0.17 May 0.92 2.26 0.16 0.85 1.36 0.21 4.52 0.46 0.83 0.49 6.79 4.04 12.43 0.44 1.06 0.39 0.12 Jun 0.94 2.45 0.18 0.77 1.28 0.01 5.39 0.49 0.72 0.48 7.46 4.87 8.85 0.36 0.98 0.38 0.11 Jul 0.84 2.26 0.05 0.39 0.72 -0.08 5.61 0.23 0.36 0.21 5.14 4.66 8.15 0.24 0.94 0.33 0.11 Aug 0.77 2.07 0.05 0.26 0.60 -0.03 4.82 0.10 0.26 0.12 3.97 3.90 6.67 0.20 1.01 0.37 0.11 Sep 0.68 1.51 0.13 0.32 0.59 0.12 3.88 0.19 0.37 0.23 2.59 3.03 5.09 0.27 0.93 0.33 0.11 Oct 0.68 1.49 0.15 0.31 0.52 0.14 3.66 0.21 0.40 0.27 1.96 2.86 5.07 0.29 0.88 0.37 0.11 Nov 0.65 1.49 0.06 0.20 0.39 -0.02 3.73 0.14 0.31 0.19 1.76 2.71 6.04 0.32 0.85 0.35 0.11 Dec 0.61 1.33 0.05 0.15 0.28 -0.03 3.44 0.09 0.21 0.13 1.82 2.48 4.43 0.39 0.89 0.35 0.11
13 Jan ... 1.31 ... ... ... ... 2.92 ... ... ... ... ... ... ... ... ... ... Feb ... ... ... ... ... ... 3.07 ... ... ... ... ... ... ... ... ... ...
M M M M M M
1 2 3 4 5 6 7 8 9 10 11 12 13 14 15 16
26. INTERNATIONAL ECONOMY 26.23 Long-term government bond yields (a)C) Interest rates and yields
European Central Bank Percentages per annum European Union
Euro area Germany Austria Belgium Denmark Spain Finland France Greece Nether- Ireland Italy Luxem- Portugal United Sweden lands bourg Kingdom
07 4.33 4.22 4.30 4.33 4.29 4.31 4.29 4.30 4.50 4.29 4.31 4.49 4.46 4.42 5.06 4.17 08 4.36 3.98 4.36 4.42 4.28 4.37 4.29 4.23 4.80 4.23 4.53 4.68 4.61 4.52 4.50 3.89 09 4.03 3.22 3.94 3.90 3.59 3.98 3.74 3.65 5.17 3.69 5.23 4.31 4.23 4.21 3.36 3.25 10 3.79 2.74 3.23 3.46 2.93 4.25 3.01 3.12 9.09 2.99 5.74 4.04 3.17 5.40 3.36 2.89 11 4.31 2.61 3.32 4.23 2.73 5.44 3.01 3.32 15.75 2.99 9.60 5.42 2.92 10.24 2.87 2.61 12 3.05 1.50 2.37 3.00 1.40 5.85 1.89 2.54 22.50 1.93 6.17 5.49 1.82 10.55 1.74 1.59
(b) See also column 11 in Table 2.10. (a) Interest rate on ten-year bonds, which is the rate used in the convergence criterion on interest rates Note: See also Table 2.8.
11 Sep 4.04 1.83 2.64 3.88 2.07 5.20 2.35 2.64 17.78 2.34 8.51 5.75 2.27 11.34 2.18 1.83 Oct 4.09 2.00 2.92 4.20 2.23 5.26 2.51 2.99 18.04 2.46 8.10 5.97 2.37 11.72 2.24 1.90 Nov 4.41 1.87 3.36 4.84 2.01 6.20 2.54 3.41 17.92 2.45 8.51 7.06 2.31 11.89 1.96 1.69 Dec 4.11 1.93 3.10 4.35 1.86 5.53 2.52 3.16 21.14 2.38 8.70 6.81 2.27 13.08 1.81 1.68
12 Jan 3.92 1.82 3.27 4.11 1.74 5.41 2.28 3.18 25.91 2.20 7.71 6.54 2.07 13.85 2.04 1.70 Feb 3.75 1.85 3.00 3.70 1.84 5.11 2.34 3.02 29.24 2.24 7.02 5.55 2.03 12.81 2.13 1.89 Mar 3.29 1.83 2.87 3.53 1.89 5.17 2.31 2.95 19.07 2.25 6.90 5.05 2.22 13.01 2.17 1.95 Apr 3.39 1.62 2.83 3.52 1.71 5.79 2.15 2.99 21.48 2.29 6.88 5.68 2.22 12.01 2.03 1.82 May 3.53 1.34 2.49 3.30 1.37 6.12 1.82 2.75 26.90 1.96 7.12 5.78 1.92 11.59 1.78 1.51 Jun 3.41 1.30 2.29 3.17 1.26 6.59 1.76 2.57 27.82 1.93 7.09 5.90 1.82 10.56 1.60 1.45 Jul 3.25 1.24 2.07 2.69 1.10 6.79 1.55 2.28 25.82 1.75 6.12 6.00 1.70 10.49 1.47 1.33 Aug 3.01 1.34 1.97 2.54 1.15 6.58 1.55 2.12 24.34 1.76 5.91 5.82 1.66 9.89 1.49 1.44 Sep 2.43 1.49 2.04 2.61 1.31 5.91 1.82 2.24 20.91 1.84 5.28 5.25 1.65 8.62 1.53 1.51 Oct 2.31 1.47 2.02 2.44 1.29 5.64 1.78 2.19 17.96 1.77 4.77 4.95 1.62 8.17 1.54 1.54 Nov 2.25 1.34 1.85 2.29 1.11 5.69 1.67 2.14 17.20 1.65 4.59 4.85 1.52 8.32 1.55 1.46 Dec 2.10 1.30 1.77 2.10 1.07 5.34 1.60 2.01 13.33 1.56 4.67 4.54 1.43 7.25 1.60 1.51
13 Jan 2.40 1.51 1.92 2.31 1.61 5.05 1.75 2.17 11.10 1.74 4.18 4.21 1.60 6.24 1.82 1.80 Feb ... ... ... ... ... 5.22 1.81 ... ... ... ... ... ... ... ... ...
BANCO DE ESPAÑA 432 BOLETÍN ESTADÍSTICO, FEBRUARY 2013

APPENDIX 1 BANCO DE ESPAÑA. OFFICIAL BALANCE SHEET

BANCO DE ESPAÑA / BOLETÍN ESTADÍSTICO
SUMMARIZED BALANCE SHEET OF THE BANCO DE ESPAÑA
Banco de España balance sheet published pursuant to the Resolution of 28.3.2000 (BOE 6.4.2000)
Acccording to the accouting regime chosen by the Eurosystem on the issue of euro banknotes, a share of 8% of the total value of the euro
banknotes in circulation is allocated to the ECB on a monthly basis. The counterpart of this adjustment is recorded as an Intra-Eurosystem
liability related to banknote issue. The remaining 92% of the value of the euro banknotes in circulation are allocated to the NCBs on a monthly
basis too, whereby each NCB shows in its balance sheet a share of the euro banknotes issued corresponding to its paid-up share in the
ECB´s capital. The difference between the value of the euro banknotes allocated to the NCB according to the aforementioned accouting
regime, and the value of euro banknotes put into circulation, is also recorded as an Intra-Eurosystem claim/liability related to banknote issue.
BANCO DE ESPAÑA 434 BOLETÍN ESTADÍSTICO, FEBRUARY 2013

BANCO DE ESPAÑA / BOLETÍN ESTADÍSTICO
SUMMARIZED BALANCE SHEET OF THE BANCO DE ESPAÑA AS AT 31 DECEMBER 2012
CONCEPTS EUROS
ASSETS
Gold and gold receivables. 11.418.398.715,44
Claims on non-euro area residents denominated in foreign currency. 26.593.157.449,95
Claims on euro area residents denominated in foreign currency. 2.576.944.117,77
Claims on non-euro area residents denominated in euro. 812.809.382,14
Lending to euro area credit institutions related to monetary policy. 361.086.880.502,55
Other claims on euro area credit institutions denominated in euro. 868.848,55
Securities of euro area residents denominated in euro. 96.930.557.329,49
General government debt denominated in euro. 2.915.047.581,26
Intra-Eurosystem claims. 40.078.289.150,92
Items in course of settlement. 1.037.221,22
Other assets. 7.269.061.402,54
TOTAL ASSETS 549.683.051.701,83
LIABILITIES
Banknotes in circulation. 99.641.357.520,00
Liabilities to euro area credit institutions related to monetary policy. 72.004.691.429,93
Other liabilities on euro area credit institutions denominated in euro. 110.013.952,33
Debt certificates issued. 0,00
Liabilities to other euro area residents denominated in euro. 10.951.856.325,72
Liabilities to non-euro area residents denominated in euro. 141.682.820,70
Liabilities to euro area residents denominated foreign currency. 848.373,97
Liabilities to non-euro area residents denominated in foreign currency. 766.931,90
Counterpart of special drawing rights allocated by the IMF. 3.296.082.114,21
Intra-Eurosystem liabilities. 336.831.241.938,49
Items in course of settlement. 183.754.124,53
Other liabilities. 4.195.824.934,69
Provisions. 7.806.339.095,04
Revaluation accounts. 12.568.592.680,32
Capital and reserves. 1.950.000.000,00
TOTAL LIABILITIES 549.683.051.701,83
BANCO DE ESPAÑA 435 BOLETÍN ESTADÍSTICO, FEBRUARY 2013

BANCO DE ESPAÑA / BOLETÍN ESTADÍSTICO
SUMMARIZED BALANCE SHEET OF THE BANCO DE ESPAÑA AS AT 31 JANUARY 2013
CONCEPTS EUROS
ASSETS
Gold and gold receivables. 11.108.660.891,98
Claims on non-euro area residents denominated in foreign currency. 26.733.423.282,24
Claims on euro area residents denominated in foreign currency. 2.509.243.627,30
Claims on non-euro area residents denominated in euro. 813.046.818,56
Lending to euro area credit institutions related to monetary policy. 294.253.845.900,03
Other claims on euro area credit institutions denominated in euro. 1.293.915,08
Securities of euro area residents denominated in euro. 95.879.906.174,06
General government debt denominated in euro. 2.915.047.581,26
Intra-Eurosystem claims. 40.523.408.870,92
Items in course of settlement. 972.359,12
Other assets. 6.799.000.458,21
TOTAL ASSETS 481.537.849.878,76
LIABILITIES
Banknotes in circulation. 96.359.693.160,00
Liabilities to euro area credit institutions related to monetary policy. 34.023.271.436,37
Other liabilities on euro area credit institutions denominated in euro. 118.044.684,13
Debt certificates issued. 0,00
Liabilities to other euro area residents denominated in euro. 11.575.927.911,08
Liabilities to non-euro area residents denominated in euro. 283.009.198,94
Liabilities to euro area residents denominated foreign currency. 859.926,47
Liabilities to non-euro area residents denominated in foreign currency. 746.302,20
Counterpart of special drawing rights allocated by the IMF. 3.216.393.464,74
Intra-Eurosystem liabilities. 309.414.140.231,98
Items in course of settlement. 238.921.854,81
Other liabilities. 4.628.762.794,14
Provisions. 7.761.742.257,56
Revaluation accounts. 11.966.336.656,34
Capital and reserves. 1.950.000.000,00
TOTAL LIABILITIES 481.537.849.878,76
BANCO DE ESPAÑA 436 BOLETÍN ESTADÍSTICO, FEBRUARY 2013

BANCO DE ESPAÑA / BOLETÍN ESTADÍSTICO
SUMMARIZED BALANCE SHEET OF THE BANCO DE ESPAÑA AS AT 28 FEBRUARY 2013
CONCEPTS EUROS
ASSETS
Gold and gold receivables. 10.987.757.121,42
Claims on non-euro area residents denominated in foreign currency. 27.536.388.652,97
Claims on euro area residents denominated in foreign currency. 3.732.211.005,01
Claims on non-euro area residents denominated in euro. 696.272.381,60
Lending to euro area credit institutions related to monetary policy. 277.643.852.179,99
Other claims on euro area credit institutions denominated in euro. 1.689.796,70
Securities of euro area residents denominated in euro. 96.026.711.516,95
General government debt denominated in euro. 2.915.047.581,26
Intra-Eurosystem claims. 41.290.510.260,92
Items in course of settlement. 1.476.545,82
Other assets. 6.799.122.563,95
TOTAL ASSETS 467.631.039.606,59
LIABILITIES
Banknotes in circulation. 96.080.179.560,00
Liabilities to euro area credit institutions related to monetary policy. 30.430.964.219,30
Other liabilities on euro area credit institutions denominated in euro. 71.459,30
Debt certificates issued. 0,00
Liabilities to other euro area residents denominated in euro. 12.279.883.883,86
Liabilities to non-euro area residents denominated in euro. 183.186.683,59
Liabilities to euro area residents denominated foreign currency. 865.493,98
Liabilities to non-euro area residents denominated in foreign currency. 770.242,11
Counterpart of special drawing rights allocated by the IMF. 3.262.448.079,95
Intra-Eurosystem liabilities. 297.127.904.946,16
Items in course of settlement. 893.987.501,92
Other liabilities. 5.002.021.757,94
Provisions. 7.755.094.833,18
Revaluation accounts. 12.663.660.945,30
Capital and reserves. 1.950.000.000,00
TOTAL LIABILITIES 467.631.039.606,59
BANCO DE ESPAÑA 437 BOLETÍN ESTADÍSTICO, FEBRUARY 2013


APPENDIX 2 SECTORISATION SCHEMES
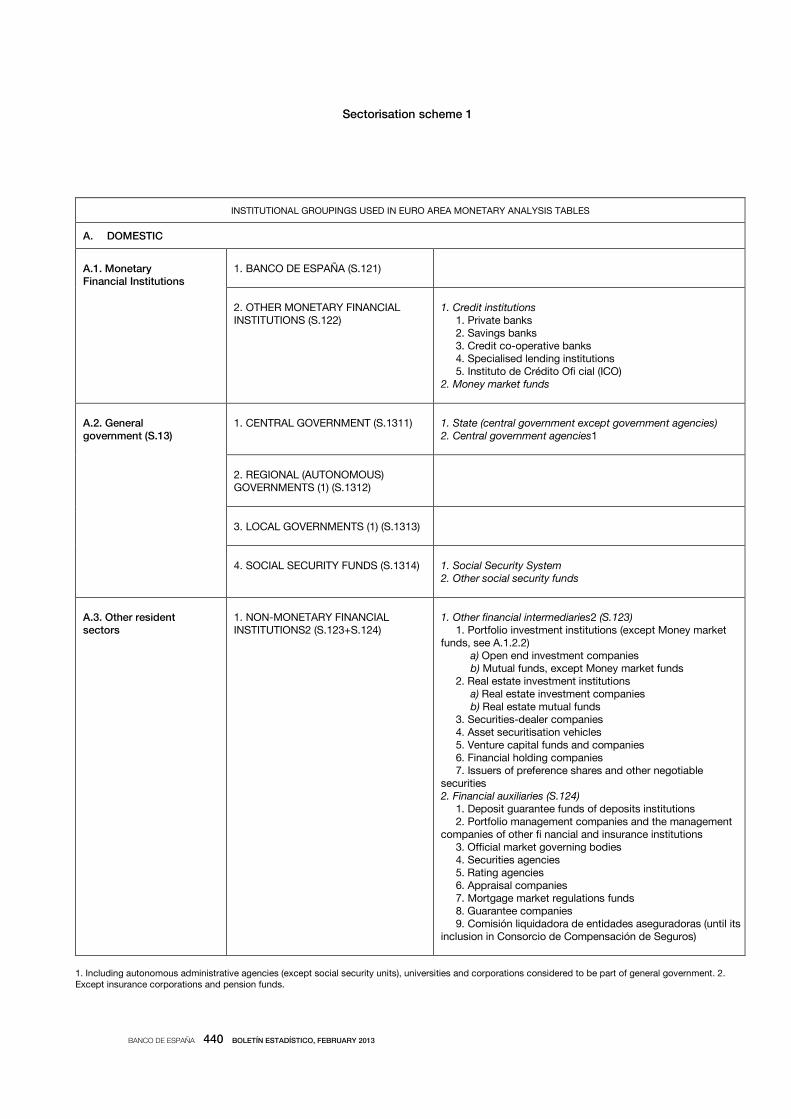
Sectorisation scheme 1
INSTITUTIONAL GROUPINGS USED IN EURO AREA MONETARY ANALYSIS TABLES
A. DOMESTIC
A.1. Monetary
Financial Institutions
1. BANCO DE ESPAÑA (S.121)
2. OTHER MONETARY FINANCIAL INSTITUTIONS (S.122)
1. Credit institutions
1. Private banks 2. Savings banks 3. Credit co-operative banks 4. Specialised lending institutions 5. Instituto de Crédito Ofi cial (ICO) 2. Money market funds
A.2. General
government (S.13)
1. CENTRAL GOVERNMENT (S.1311)
1. State (central government except government agencies)
2. Central government agencies1
2. REGIONAL (AUTONOMOUS) GOVERNMENTS (1) (S.1312)
3. LOCAL GOVERNMENTS (1) (S.1313)
4. SOCIAL SECURITY FUNDS (S.1314)
1. Social Security System
2. Other social security funds
A.3. Other resident
sectors
1. NON-MONETARY FINANCIAL INSTITUTIONS2 (S.123+S.124)
1. Other financial intermediaries2 (S.123) 1. Portfolio investment institutions (except Money market funds, see A.1.2.2) a) Open end investment companies b) Mutual funds, except Money market funds 2. Real estate investment institutions a) Real estate investment companies b) Real estate mutual funds 3. Securities-dealer companies 4. Asset securitisation vehicles 5. Venture capital funds and companies 6. Financial holding companies 7. Issuers of preference shares and other negotiable securities 2. Financial auxiliaries (S.124) 1. Deposit guarantee funds of deposits institutions 2. Portfolio management companies and the management companies of other fi nancial and insurance institutions 3. Official market governing bodies 4. Securities agencies 5. Rating agencies 6. Appraisal companies 7. Mortgage market regulations funds 8. Guarantee companies 9. Comisión liquidadora de entidades aseguradoras (until its inclusion in Consorcio de Compensación de Seguros)
1. Including autonomous administrative agencies (except social security units), universities and corporations considered to be part of general government. 2. Except insurance corporations and pension funds.
BANCO DE ESPAÑA 440 BOLETÍN ESTADÍSTICO, FEBRUARY 2013

Sectorisation scheme 1 (continued)
INSTITUTIONAL GROUPINGS USED IN EURO AREA MONETARY ANALYSIS TABLES
A.3. Other resident
sectors (continued)
10. Currency-exchange bureaux
11. Securities cleaning and settlement
companies
12. Holdings companies that themselves
carry out activities of fi nancial auxiliaries
2. INSURANCE CORPORATIONS
AND PENSION FUNDS (S.125)
1. Life and risk insurance corporations
2. Non-profit insurance institutions
3. Consorcio de Compensación de Seguros
4. Pension funds
3. NON-FINANCIAL CORPORATIONS3 (S.11)
4. HOUSEHOLDS AND NON-PROFIT
INSTITUTIONS4 (S.14+S.15)
A. RESIDENTS IN OTHER EURO AREA COUNTRIES
B.1. Monetary
Financial Institutions
(S.12)
1. EUROSYSTEM5 (except Banco de España)
2. OTHER MONETARY FINANCIAL
INSTITUTIONS
B.2. General
government (S.13)
1. CENTRAL GOVERNMENT (S.1311)
2. OTHER GENERAL GOVERNMENT
1. State government (S.1312)
2. Local government (S.1313)
3. Social security funds (S.1314)
B.3. Other resident
sectors
1. NON-MONETARY FINANCIAL
CORPORATIONS2 (S123+S124)
2. INSURANCE CORPORATIONS AND
PENSION FUNDS (S.125)
3. NON-FINANCIAL CORPORATIONS3 (S.11)
4. HOUSEHOLDS AND NON-PROFIT
INSTITUTIONS4 (S.14+S.15)
B. REST OF THE WORLD
C.1. Banks
C.2. Non-banks
1. GENERAL GOVERNMENT
2. OTHER RESIDENTS
Memorandum ítem
I. Domestic fi nancial institutions (A.1+A.3.1+A.3.2)
II. Financial institutions of other euro area countries (B.1+B.3.1+B.3.2)
GENERAL NOTE: Codes after institutional groupings (S.12, S.13...) refer to the European System of Accounts 1995 (ESA 95), approved by Council Regulation
(EC) No 2223/96 of 25 June 1996. 3. Public and private. 4. NPIs serving households. 5. The eurosystem consists of the ECB and the national central Banks of
the euro area.
BANCO DE ESPAÑA 441 BOLETÍN ESTADÍSTICO, FEBRUARY 2013

Sectorisation scheme 2
INSTITUTIONAL GROUPINGS USED IN SUPERVISORY RETURNS (CHAPTER 4)
A. RESIDENT SECTORS
A.1. Credit system
A.1.1. BANCO DE ESPAÑA
A.1.2. DEPOSIT MONEY INSTITUTIONS
A.1.2.1. Private banks
A.1.2.2. Savings banks
A.1.2.3. Credit Co-operatives
A.1.3. SPECIALISED CREDIT INSTITUTIONS
A.1.4. INSTITUTO DE CRÉDITO OFICIAL (ICO)
A.2. General Government
A.2.1. CENTRAL GOVERNMENT
A.2.1.1. State
A.2.1.2. Administrative and Similar Agencies
A.2.2. TERRITORIAL GOVERNMENTS
A.2.2.1. Regional (Autonomous) Governments
and their agencies
A.2.2.2. Local Governments and their agencies
A.2.3. SOCIAL SECURITY FUNDS
A.3. Other Resident
Sectors
A.3.1. OTHER FINANCIAL INTERMEDIARIARIES INCLUDING INSURANCE CO. AND PENSION FUNDS
A.3.2. FINANCIAL AUXILIARIES
A.3.3. NON-FINANCIAL PUBLIC 1 AND PRIVATE ENTERPRISES
A.3.4. INDIVIDUALS (HOUSEHOLDS)
A.3.5. NON-PROFIT PRIVATE INSTITUTIONS
B. FOREIGN SECTOR
1. Including commercial and similar autonomous agencies.
BANCO DE ESPAÑA 442 BOLETÍN ESTADÍSTICO, FEBRUARY 2013

Sectorisation Scheme 3
INSTITUTIONAL GROUPINGS USED IN NATIONAL ACCOUNTS (INCLUDING THE FINANCIAL ACCOUNTS OF THE SPANISH ECONOMY)
S.1. NATIONAL ECONOMY
S.11. Non-financial
Corporations
S.12. Financial
Corporations
S.121/S.122. MONETARY FINANCIAL
INSTITUTIONS
S.121. Banco de España
S.122. Other Monetary Financial Institutions
S.123/S.125. NON-MONETARY FINANCIAL
INSTITUTIONS
S.123. Other Financial Intermediaries, except
insurance companies and pension funds
S.124. Financial Auxiliaries
S.125. Insurance Corporations and Pension
Funds
S.13. General Government
S.1311. CENTRAL GOVERNMENT
S.1312. REGIONAL (AUTONOMOUS)
GOVERNMENTS
S.1313. LOCAL GOVERNMENTS
S.1314. SOCIAL SECURITY FUNDS
S.14/S.15. Other resident
sectors: Households and
Nonprofi t institutions
serving households
S.14. HOUSEHOLDS
S.15. NON-PROFIT INSTITUTIONS SERVING
HOUSEHOLDS
S.2. REST OF THE WORLD
BANCO DE ESPAÑA 443 BOLETÍN ESTADÍSTICO, FEBRUARY 2013


APPENDIX 3 METHODOLOGICAL NOTES

BANCO DE ESPAÑA / BOLETÍN ESTADÍSTICO
NOTES TO THE TABLES OF CHAPTER 10
INSURANCE CORPORATIONS AND PENSION FUNDS
Introduction
According to the provisions of the ESA 95, insurance corporations and pension funds form a sub-sector within the sector financial institutions. The inclusion of these entities within the sector financial institutions is basically due to the fact that their principal activity, the coverage of risks, involves significant intermediation of financial resources from some sectors to others. In recent years, the activity of this sub-sector has been growing significantly. This can be attributed not only to the increase in the desire of the population to cover the different types of risk that these entities offer but also to the growing use of a certain range of products as vehicles for saving. The following sections of this note describe the various groups of agents that make up this sub-sector (section 2), the sources of information used and availability of the data (section 3); and the specific information contained in the various tables that make up this chapter (section 4). The agents who make up the sub-sector
This sub-sector comprises four different groups of agents: private insurance corporations, mutualidades de previsión social (non-profit insurance entities), the Consorcio de Compensación de Seguros (insurance compensation consortium) and pension funds, all of which come under the supervision of the Directorate General of Insurance and Pension Funds (DGSFP). − Private insurance corporations include the activity of public limited companies whose capital may be entirely
Spanish, entirely foreign or a mixture of the two, private mutual insurance associations, the offices in Spain of foreign insurance corporations and reinsurance corporations resident in Spain (1).
− Mutualidades de previsión social are private beneficent entities generally set up by particular groups as a form of
corporate support (they provide small benefits in the event of death, birth, etc. and grant small loans). They are independent of the body they originate from (companies, associations, etc.) and their purpose is to supplement social security pensions. Their main resources are the direct contributions of the members or other persons or patron entities. Membership of these entities may be voluntary or compulsory (for persons belonging to certain professional associations, groups or companies). This group includes cajas de pensiones sustitutorias (substitute pension funds), which existed until 1984 in the Spanish insurance system. These funds were created by particular groups in order to act as substitutes for the Social Security System. Additional provision five of the 1984 budget law required the groups covered by these funds (both retired and active employees) to be transferred to the Social Security System, so that the role of these entities then became one of supplementing social security, a status that they still have today.
− The Consorcio de Compensación de Seguros (CCS) is a public law entity with its own legal personality. Its object is
to cover extraordinary risks to persons and property. It is basically financed by surcharges on the premiums paid by policyholders of all types of insurance, by State grants and loans and by direct premiums. In addition, it acts as the State’s agent in dealings with the Spanish export credit company (CESCE), the public-sector private insurance corporation of which manages, on behalf of the State, the cover of political risks and certain commercial risks to Spanish exports. This latter activity of the CCS is not included in the series, since it is attributed directly to the State.
− Pension funds sare funds created pursuant to Law 8/1987 of 8 June 1987. They are portfolios of assets separate and
independent from the entities that promote them, but without separate legal status. They are made up of funds earmarked for the purposes laid down in the corresponding pension scheme. Their management is entrusted to a managing entity and a custodian, under the supervision of a control committee. These funds are usually known as "autonomous" or "external pension funds" in contrast to "non-autonomous" or "internal pension funds", which are those created by certain credit institutions and non-financial corporations by means of transfers of funds to provisions or internal reserves. Internal funds appear on the balance sheet of the sector or sub-sectors that have created them (other financial institutions and non-financial corporations) and represent a liability to the workers (households) with interests in them. Normally, the balance sheet does not show any separate assets to cover the aforementioned pension rights.
Sources and availability of information
− Private insurance corporations The main source of data is the annual balance sheets and other supplementary
information that insurance corporations send to the DGSFP, which is published annually in its reports. Annual aggregate data for this group are available from 1962, and relate to three different accounting plans (1962-1982, 1983-
BANCO DE ESPAÑA 446 BOLETÍN ESTADÍSTICO, FEBRUARY 2013

BANCO DE ESPAÑA / BOLETÍN ESTADÍSTICO
1997 and 1998 onwards). As a result, the compilation of time series has required the Banco de España to chain the different series. This has been done by adapting the information of the two plans prior to 1998, without any breaks arising that are worthy of mention. First, the differences attributable to the different coverage in different years, indicated in footnote 1, were small at the time the chaining was carried out and, second, the other differences due to the change in the accounting plan were, likewise, minor. Also, for a sample of entities whose insurance technical provisions account for approximately 98% of the total, quarterly information is available from 1986, although with certain limitations. Specifically, this quarterly information does not include data on reinsurance entities and data are not available for the quarters of 1990 and for the first three quarters of 1998, so that in the time series these quarters are shown as unavailable.
− Mutualidades de previsión social Information is available from 1970, with differing content, and is obtained from the following sources: For the period 1970-1984 the data come from the individual balance sheets of the entities themselves and from the incomplete and heterogeneous information of the Labour and Social Security Ministry (to which they reported until 1984) and the Economy Ministry. The Banco de España has estimated the series on the basis of these data. For the period 1985-1997, inclusive, data are available from the annual statistical reports of the DGSFP, which include information relating to the mutualidades with a national scope, which are supervised by this Directorate General, and the information on entities under the supervision of the regional governments, following the transfer of responsibilities in this area. For 1998 the series only include the data of the mutualidades de previsión social with a national scope, obtained from the quarterly reports of the DGSFP, and of the Catalan and Basque regions' mutualidades for which information is supplied directly by these two regional governments. Since 1999 the series are Banco de España estimates based on the reports of the Spanish Confederation of Mutualidades. These estimates will be replaced by official data as and when they become available.
− Consorcio de Compensación de Seguros The data available for the period 1970-1982 are incomplete and from various sources, primarily the three bodies which in 1982 were merged to form the current CCS: the CCS itself, the Fondo Nacional de Garantía (National Guarantee Fund) and compulsory travel insurance. The Banco de España has estimated the relevant time series using this information. From 1983 the data are from the annual reports of the CCS itself.
− External pension funds Data are available from when these funds began to be created in 1988. The source is the annual statistical reports published by the DGSFP.
The information contained in the tables of the chapter
The chapter begins with a table (10.A) which reconciles the different headings of the annual balance sheet which the various agents that make up the sub-sector send to the DGSFP for supervision purposes and the instruments that, following ESA 95 methodology, are included in the Financial Accounts of the Spanish Economy (FASE). The reconciliation is between the latest balance sheet published by DGSFP and the FASE for the same year. When analysing this table two important issues should be taken into account: − For some headings, the balance sheet figure is not taken as the figure for the FASE, but rather data are taken from
alternative sources available for the same headings, following the order of hierarchisation of statistical sources that governs the preparation of the FASE (the insurance corporations and pension funds figure is subordinated to that obtained from other sources). The difference between these two data is explicitly shown as a "difference due to hierarchisation" in column 9 of the table. This difference arises in the case of deposits and loans vis-à-vis credit institutions, which are taken from the latter, and in that of deposits (for reasons other than reinsurance) vis-à-vis the rest of the world, which are taken from the balance of payments. This item also includes the differences arising from the different scope of the headings other accounts receivable/payable in the FASE and other assets/liabilities in the balance sheet of insurance corporations and pension funds.
− The securities headings of the FASE show market-price data, as laid down by the ESA 95. As this principle is not
applied in the balance sheets of the various agents a "valuation difference" arises which is explicitly shown in column 10 of the table. The other tables include, in the form of time series, the accounting/administrative information obtained from the DGSFP, the regional governments that supply data and the CCS, which corresponds to the first row of Table 10.A (2).
BANCO DE ESPAÑA 447 BOLETÍN ESTADÍSTICO, FEBRUARY 2013

BANCO DE ESPAÑA / BOLETÍN ESTADÍSTICO
The purpose of Table 10.1 is to give an overall view of the relative importance of each of the four groups of entities that make up the sub-sector based on the aggregate balance sheet and the most important item therein: the technical provisions and own funds, in the case of pension funds. Thereafter, Tables 10.2 to 10.6 provide certain details of the assets and liabilities of the aggregated balance sheet of the sub-sector (Table 10.2) and of each of the groups of agents of which it is composed (Tables 10.3 to 10.6). The structure of all these tables is identical so that some minor adaptations have had to be made to the format of the balance sheet which each group of agents sends to the DGSFP.
Footnotes
− Until 1997 (inclusive), the annual series presented include the activity in Spain of corporations resident in Spain (i.e.,
both those of Spanish nationality and the branches of foreign entities). Since then, information on the insurance business in Spain of branches that have their head office in other EU countries is not included, since the current legal framework makes no provision for these branches to submit information. As for the quarterly series, from 1996 Q1 these include the activity both in Spain and abroad of entities of Spanish nationality. In addition, from 1998, as in the case of the annual series and for the same reason, these series do not include the activity in Spain of the branches of entities that have their head office in other EU countries.
− Time series based on the approach of the Financial Accounts of the Spanish Economy (last column of Table 10.A) are
available in the publication Financial Accounts of the Spanish Economy.
BANCO DE ESPAÑA 448 BOLETÍN ESTADÍSTICO, FEBRUARY 2013

BANCO DE ESPAÑA / BOLETÍN ESTADÍSTICO
METHODOLOGICAL NOTE
GENERAL GOVERNMENT DEBT COMPILED ACCORDING TO THE METHODOLOGY OF THE EXCESSIVE DEFICIT
PROCEDURE (EDP)
Introduction
The functions attributed to the Banco de España by Spanish legislation and, specifically, by the Banco de España Law of Autonomy and successive National Statistics Plans include notably, the compilation of a set of statistics, comprising government debt according to the EDP. Thus, the Banco de España regularly publishes on the Internet quarterly information about government debt in its Boletín Estadístico.
This note describes the methodology used to compile EDP debt. The next section presents the various concepts of debt or indebtedness which are habitually used, depending on the context to which they refer. Then section three provides a description of the methodology applied. Lastly, section four details the information published by the Banco de España.
Different concepts of indebtedness
In the framework of any agent's economic activity, expenses (including the net acquisition of financial assets) not financed with current revenue and capital, must be financed through the net contraction of liabilities. This generation of liabilities is usually called debt or indebtedness; however, it is necessary to differentiate between the contraction of liabilities over a period of time (flows) and the outstanding balance of these liabilities at a specific time (stocks). Consequently, flows (operations in the period) are formally called a net change in liabilities and stocks are formally called debt, indebtedness or outstanding liabilities. Several concepts are encompassed within this general definition of indebtedness, which are delimited by the instruments included and the methods used for their valuation, and which, consequently, must be considered together with the general definition itself. This section describes the varying coverage of the frequently used main concepts of indebtedness and Scheme 1 provides a comparison of them.
1. Total liabilities
This is the broadest possible concept of indebtedness and is reflected in the Financial Accounts of the Spanish Economy (FASE), a quarterly publication of the Banco de España with a high degree of detail (http://www.bde.es/webbde/ en/estadis/ccff/ccff.html). Chapter 2 of this publication presents the financial transactions (flows) and financial assets and liabilities (stocks) for all the sectors and subsectors into which the economy is classified, including general government. Thus, in this specific case, the FASE provide information about the financial activity of government in a full and consistent fashion which is integrated with the other sectors and subsectors of the economy and with general government non-financial operations; therefore, they serve as a global framework of reference for analysing general government financial activity as a whole. This publication takes the broadest possible concept of indebtedness because it includes all the liabilities incurred by general government, irrespective of type (issuance of currency, securities other than shares, equity, short and long-term non-commercial loans in euro or in other currencies, trade credits and other outstanding payables). The liabilities included in this concept are valued using the methodology established by the 1995 European System of Integrated Economic Accounts (ESA 95) described in the methodological note of the FASE disseminated on the Banco de España webpage (http://www.bde.es/ webbde/SES/Secciones/Publicaciones/PublicacionesSeriadas/NotasEstadisticas/07/nest05e.pdf) and which uses market values in the valuation of stocks and flows of liabilities held in the form of securities other than shares.
The change in this indebtedness is explained by: a) net borrowing i.e. non-financial expenses less non-financial resources, according to the National Accounts criterion which, in turn, must follow the ESA 95 rules; b) the net acquisitions in financial assets; and, c) adjustments for valuation (which arise, for example, in the case of securities other than shares and liabilities in currencies other than the euro).
2. Debt compiled according to the EDP
This concept of indebtedness is not as broad as the previous one. The Banco de España publishes a detailed breakdown of this debt concept for each of the subsectors comprising general government and it is disseminated with a shorter time lag than the FASE. Likewise, it provides a very complete breakdown by instrument since it distinguishes:
- Currency and deposits (coin issuance) - Securities other than shares
a) In euro, by original maturity: - Short-term - Medium and long-term
b) In currencies other than the euro - Loans and credits
a) Granted by resident credit institutions, in euro and currencies other than the euro, by original maturity. - Short-term (12 months or less) - Medium and long-term (more than 12 months)
b) Granted by non-residents, in euro and currencies other than the euro (rest of the world)
The concept of “Debt compiled according to the EDP” is different to the concept of “Total liabilities” in that it does not include general government liabilities held by other general government units, trade credit and other accounts payable. Furthermore, the valuation methods of the liabilities which are used in debt compiled according to the EDP are those described in Section 3.
BANCO DE ESPAÑA 449 BOLETÍN ESTADÍSTICO, FEBRUARY 2013

BANCO DE ESPAÑA / BOLETÍN ESTADÍSTICO
Scheme 1
General government: different concepts of indebtedness
Percentage structure at 31.12.2010
Instrument Total liabilities Debt compiled
according to the EDP
Currency and deposits 0.4% 0.4 %
Securities other than shares
Securities held by general government units
7.6%
Other securities (short, medium and long-term)
65.6% 65.6%
Long-term non-commercial loans held by general government units
2.1%
Other long-term non-commercial loans 12.1% 12.1%
Short-term non-commercial loans 1.0% 1.0%
Trade credits and other liabilities 11.2%
Percentage of total liabilities 100% 79.1%
These two concepts of indebtedness are not the only ones possible. Other definitions have been defended in order to value this aspect of public finances such as, for example, that it would be necessary to deduct from gross debt, as envisaged in the two concepts included in this section, the stock of financial assets, since a distinction must be made between when an economic agent increases its indebtedness in order to finance a deficit and when it does so to acquire financial assets. Any concept of indebtedness has its own meaning and is valid for economic analysis provided that the area to which it refers is specified in detail. Nevertheless, it is considered of interest to underline that the concept of debt compiled according to the EDP has the virtue of being defined according to uniform binding rules for all EU countries and it is scrutinised in depth by the European Commission (Eurostat), therefore, it is comparable between the various EU Member States. This is not the case for any definition set with the criteria of only one country. Additionally, the concept of debt compiled according to the EDP is useful at a practical level since, on one hand, it is that for which data are published with the shortest time lag and, on the other, changes in it are a good proxy of total liabilities. Total liabilities is the concept of debt used in the financial accounts compiled by all EU Member States.
Debt according to the EDP
The definition of this indebtedness is regulated by Council Regulation EC No 479/2009 of 25 May 2009, which refers, in turn, to the ESA to delimit the main terms used. This regulation amended Regulation 3605/93 of 22 November 1993. Among other things, this regulation requires EU Member States to report to the European Commission and, specifically, to Eurostat, twice per year (at end-March and end-September) the data corresponding to this definition of debt by subsectors and with an ample
breakdown of certain items and transactions. The reporting of these data are called EDP debt Notifications.1
For the purposes of this Note, Regulation No 479/2009, like its predecessor, Regulation 3605/93, defines the concepts of general government and government debt as follows:
1. Institutional scope of general government
Regulation 479/2009 specifies that the general government sector includes the subsectors: central government, regional (autonomous) government, local government, and social security funds, excluding commercial operations as defined in ESA 95. The exclusion of commercial operations means that the general government sector comprises only institutional units producing non-market services as their main activity.
In the case of Spain, the general government sector comprises the following four subsectors:
1 It should be clarified that the second edition of the ESA published in 1979 (ESA 79) was in force until the EDP Notification of September 1999
inclusive. As of the EDP Notification of March 2000, the ESA corresponding to 1995 (ESA 95) has been in force. Interestingly, this new version of
the ESA is the first system of national accounts which has been introduced via a legal text, namely Council Regulation (EC) No 2223/96 of 25
June 1996 (called the ESA 95 Regulation) and it therefore constitutes a legal obligation for EU countries. The previous edition of the ESA was
only a “recommendation” to countries for compiling national accounts which were as uniform as possible.
BANCO DE ESPAÑA 450 BOLETÍN ESTADÍSTICO, FEBRUARY 2013

BANCO DE ESPAÑA / BOLETÍN ESTADÍSTICO
- Central government comprises institutional units which have general powers throughout the country and which, in Spain, include the State, the central government agencies and corporations classified as central government.
- Regional (autonomous) government which includes the governing bodies of the regional (autonomous) government and the regional administrative and similar agencies. The latter group includes the universities in each region and, also, the corporations classified as regional (autonomous) government.
- Local government comprises local (municipal, provincial and island) authorities, associations and groupings of municipalities, autonomous cities (Ceuta and Melilla) and the independent administrative and similar bodies reporting to them.
- Social security funds which include the institutional units of a legal nature and with diverse territorial scope that undertake functions relating to the provision of social benefits. Since 2000 Q1, in accordance with the sectorisation of base year 2000 and base year 2008 of the Spanish National Accounts complied by the INE, the units performing social security functions financed through general taxation (essentially healthcare services) are classified together with the units to which they report in the central government, regional (autonomous) government and local government subsectors, whereas the units performing social security functions financed through social security contributions are classified in the social security fund subsector.
All these subsectors have two basic characteristics: a) they comprise institutional units whose main function is to produce non-market goods and services and/or to undertake operations to redistribute national income and wealth and, b) their principal funds come from compulsory payments made by other institutional units and not from the sale of their production.
In other words, in order to decide whether or not an institutional unit must be included in the general government sector two criteria must be taken into account: the institutional legal criterion (determining whether a unit is a public or private producer) and the economic criterion, according to the nature of the production (determining whether a unit is a market or non-market producer). On the basis of the first criterion, those institutional units controlled by general government are included in public producers. On the basis of the second criterion, those institutional units which cover more than 50% of their production costs with revenue from the sale of their products are considered market producers. The second criterion involves, in fact, subordinating the legal criterion to the economic one when including institutional units in, or excluding them from, the general government sector and its subsectors, since a unit may be of a commercial nature from a legal viewpoint but it does not comply with the 50% rule, in which case it will be sectorised under general government.
2 Concept of government debt
Under Regulation 479/2009 government debt means the total gross debt at nominal value outstanding at the end of the year of the sector of general government with the exception of those liabilities the corresponding financial assets of which are held by the sector of general government. Nominal value corresponds to face value. In the case of index-linked liabilities, the regulation specifies that their nominal value shall correspond to their face value adjusted by the index-related change in the value of the principal accrued to the end of the year.
As for the financial instruments which must be included, government debt shall be constituted by the liabilities of general government in the following categories according to the definitions of ESA 95: currency and deposits, securities other than shares, excluding financial derivatives, and loans.
Under the regulation, liabilities denominated in foreign currencies shall be converted into the national currency on the basis of the representative market exchange rate prevailing on the last working day of each year.
In the case of Spain, the instruments and statistical sources used are included in Scheme 2 below:
BANCO DE ESPAÑA 451 BOLETÍN ESTADÍSTICO, FEBRUARY 2013

BANCO DE ESPAÑA / BOLETÍN ESTADÍSTICO
Scheme 2
Instruments and sources
Instruments (liabilities) Statistical source
Currency and deposits: coin issuance Banco de España.
Securities other than shares: marketable debt securities
Short-term securities issued in euro
Banco de España.
Information compiled by the Banco de España through:
- General Secretariat of the Treasury and Financial Policy
- Official Gazettes of the State and Regional (autonomous) Governments
- National Securities Market Commission.
- IBERCLEAR and stock exchanges
For issues in currencies other than the euro information from the balance of payments and data from specialist agencies, such as Reuters, are used
Long-term securities issued in euro
Securities issued in currencies other than the euro
Loans granted by resident financial institutions Information compiled through the Banco de España's Central Credit Register, obtained from lending credit institutions reporting credit exposures of more than €6,000. For the State and General Secretariat of the Treasury and Financial Policy.
Loans granted by the rest of the world Statistics on credits and loans granted by non-residents based on communications, which for statistical purposes, must be sent to the Banco de España's Statistics Department by the borrowers or resident credit institutions on behalf of the borrowers, when the collections and payments are made through these institutions over the life of the loan. For the State and General Secretariat of the Treasury and Financial Policy.
The valuation rules used are as follows: the short, medium and long-term securities other than shares are recorded at their nominal value; credits only include the part drawn down. In both cases, where the currency in which the securities other than shares are issued or in which the credit is arranged is not the euro, they are converted into euro applying to the currency in which the securities other than shares were originally issued or in which the credit was arranged, the exchange rate of that currency at the end of the period to which the outstanding balance refers.
From the foregoing it can be deduced that the Banco de España's statistics show an estimate of the indebtedness represented by securities other than shares and non-commercial loans based on sources which are mostly external to the governments and bodies whose debt is being calculated. This reason explains why the amounts obtained from each of these governments may not coincide exactly with the amounts in the latter's internal records, which obviously are the best source of the indebtedness of any government. However, in order to compensate for this limitation, monthly tests are performed in the case of the State and quarterly tests are undertaken in the case of the regional (autonomous) communities and main local governments (local authorities with more than 500,000 inhabitants) with information from their own internal records.
Dissemination of information on government debt in the Banco de España's Boletín Estadístico.
In Chapters 11 to 14 of the Boletín Estadístico published on its website, the Banco de España disseminates information about the debt of general government, i.e. of the institutional units classified in the general government sector and, separately, information on the debt of the units reporting to general government (public producers) which are not classified as general government. This set of units is called generically public corporations and their debt is not subject to (i.e. it is not included in the scope of) EDP and, consequently, it is not included in the Notifications to the European Commission which refer to the EDP.
The Banco de España statistics provide general government indebtedness both in absolute figures and in relative terms with respect to GDP. National GDP is used in respect of the total debt of the sector and its subsectors, and regional GDP is used to obtain the ratio corresponding to each regional (autonomous) government. In both cases the source of GDP is the INE's publications of Spanish National Accounts and Spanish Regional Accounts. However, since the regional GDP data are updated with a lag in respect of the national GDP data, for the years in which data on regional GDP were not available, the procedure used to calculate each regional (autonomous) government's debt/GDP ratio comprises distributing national GDP BANCO DE ESPAÑA 452 BOLETÍN ESTADÍSTICO, FEBRUARY 2013

BANCO DE ESPAÑA / BOLETÍN ESTADÍSTICO
according to Spanish National Accounts according to the structure of regional GDP for the last available year. Although, this procedure may generate distortions in regional aggregates since not all regional (autonomous) governments grow at the same rate, it is not considered that this limitation will significantly alter the ratios in respect of the GDP of each regional (autonomous) government.
The tables in the Boletín Estadístico which contain information on government debt are as follows: Chapter 11. General government
11.3. Liabilities outstanding and debt according to the excessive deficit procedure. Absolute values 11.4. Liabilities outstanding and debt according to the excessive deficit procedure. As a percentage of GDP mp 11.8. Debt by instrument 11.9. Debt by counterpart sector and currency 11.10. Public corporations debt by owner government sector
Chapter 12. Central government and social security funds Central government
12.6. Total central government. Debt by instrument 12.7. State. Debt by instrument 12.8. Other units classified as central government. Debt by instrument 12.9. Public corporations debt 12.16. Social security funds debt by instrument
Chapter 13. Regional autonomous governments
13.6. Debt. General summary 13.7. Debt by instrument 13.8. Debt by institutional grouping 13.9. Debt by regional (autonomous) government. Absolute values 13.10. Debt by regional (autonomous) government. Debt/GDP ratio 13.11. Public corporations debt by owner regional (autonomous) government. Absolute values 13.12. Public corporations debt by owner regional (autonomous) government. Debt/GDP ratio
Chapter 14. Local governments
14.6. Debt. General summary 14.7. Debt by instrument 14.8. Debt by type of local government. Absolute values and Debt/GDP ratio
BANCO DE ESPAÑA 453 BOLETÍN ESTADÍSTICO, FEBRUARY 2013