bonding and capital budgeting in ct(1977) and capital budgeting... · bonding and capital budgeting...
TRANSCRIPT

Connecticut General Assembly
Legislative Program Review and Investigations Committee
BONDING AND CAPITAL BUDGETING IN CONNECTICUT
September 1977


BONDING AND CAPITAL BUDGETING
IN CONNECTICUT
September 1977


I.
TABLE OF CONTENTS
SUMJIIIARY
PURPOSE AND SCOPE. . . . . . . . . . . . . . . . . . . . . . . . . • . . . . . . . 1
Background. . . . . . . . . . . . . . . . . . . . . . . . . . . . . . . . . . . . . 1 Purpose. . . . . . . . . . . . . . . . . . . . . . . . . . . . . . . . . . . . . . . . 1 Scope and Organization ......................... 1 Information Sources ............................ 2 Acknowledgements. . . . . . . . . . . . . . . . . . . . . . . . . . . . . . . 2
II. AN INTRODUCTION TO MUNICIPAL BONDS ................ 3
III.
Purposes for Which Bonds Are Issued ............ 3 Types of Governments Issuing Debt .............. 4 Types of Bonds. . . . . . . . . . . . . . . . . . . . . • . . . . . . . . . . . 4 Investment Features.... . . . . . . . . . . . . . . . . . . . . . . . . 6 The Bond Market. • . . . . . . . . . . . . . . . . . . . . . . . . . . . . . . 7 Bond Holders. . . . . . . . . . . . . . . . . . . . . . . . . . . . . . . . . . . 8
CREDIT RATINGS AND INTEREST COSTS ................. 10
Investment Services. . . . . . . . . . . . . . . . . . . . . . . . . . . . 10 Bond Ratings and Interest Rates ................ 10 Criteria Used in the Rating .................... 12 Factors Contributing to Connecticut's
Drop in Rating. . . . . . . . . . . . . . . . . . . . . . . . . . . . . . . 1 3 Market Ratings. . . . . . . . . . . . . . . . . . . . . . . . . . . . . . . . . 15
IV. BOND AUTHORIZATION PROCESS IN CONNECTICUT ......... 18
The Legislative Role ........................... 18 State Bond Commission .......................... 20
v. STRENGTHENING THE LEGISLATIVE ROLE ................ 23
Legislative Membership on the Bond Cornrni s s ion. . . . . . . . . . . . . . . . . . . . . . . . . . . . . . . . . . . 2 3
Prioritizing Projects .......................... 24 Analogy to Balanced Budget Concept ............. 24 "Sunsetting" Project Authorizations ............ 26
VI . DEBT MANAGEMENT ......... o ••••••••••••••• o • • • • • • • • • 2 7
Debt Limits. . . . . . . . . . . . . . . . . . . . . . . . . . . . . . . . . . . . 2 7 Structuring Repayment of Long Term Debt ........ 29 Fiscal Operations ..... o••······· ............... 33

VII. CAPITAL PLANNING. . . . . . . . . . . . . . . . . . . . . . . . . . . . . . . . . . 3 9
Planning in Connecticut, 1955-75 ............... 39 PA 75-425 Strengthens the Process .............. 42
APPENDICES
I-1 II-1 II-2
III-1
III-2
III-3
III-4
Glossary ............................... 46 Taxable Bond Option .................... 48 Direct General Obligation Indebt-
edness, February 28, 1977 ............ 49 Unemployment in Connecticut and the
the U . S . , 1 9 6 0 -7 6 . . . . . . . . . . . . . . . . . . . . 51 Annual Growth Rates in Gross
National Product (GNP) and Gross State Product (GSP) , 1960-76 (in current and constant dollars) ............................. 52
Personal Income Growth, Connecticut, New England and U.S., 1967-75 ........ 53
State Revenue Sources: Connecticut and the National Average, 1975 ....... 54

LEGISLATIVE PROGRAH REVIEW AND INVESTIGATIONS COMMIT·rEE
BONDING AND CAPITAL BUDGETING IN CONNECTICUT
SUHMARY OF PART ONE
CHAPTER I. PURPOSE AND SCOPE
In 1975 and 1976, the two major bond rating services reduced Connecticut's credit status. Moody's Investment Corporation dropped Connecticut from triple A (prime grade) to A 1 (high medium grade). Standard and Poor's reduced Connecticut's rating from triple A to double A (p. 1).
The Legislative Program Review and Investigations Committee asked its staff to analyze the reasons for the credit rating reductions and to recommend ways of improving Connecticut's capital budgeting and debt management procedures (p. 1).
This report is divided into two parts. The first section (Chapters I-IV) is a primer on bonds and includes an introduction to credit ratings, interest rates and the legislature's role in authorizing capital expenditures. Part II (Chapters V-VII) examines various ways to increase the legislative role in capital budgeting, improve management of the state's debt and strengthen the capital project planning process. (Technical appendices, including a glossar~ can be found at the end of the report pp. 1-2) .
CHAPTER II. AN INTRODUCTION TO MUNICIPAL BONDS
A municipal bond is a written promise by a governmental unit to pay a specified sum of money at a specified future date, together with periodic interest at a specified rate (p. 3).
Bonds may be issued for a variety of purposes, usually of a capital or long term nature. There are two main types of bonds, generally differentiated by the source of revenue for "general obligation" bonds, which are repaid from the General Fund and secured by the full faith and credit of the State. The second type is "revenue" or "self-liquidating" bonds which are repaid from revenues generated by the project and may be secured or guaranteed through special earmarked funds (pp. 3-6).
Municipal bonds appeal to a wide variety of investors due to their security, marketability, tax-free status and income producing ability (pp. 6-7).
S-1

CHAPTER III. CREDIT RATINGS AND INTEREST COSTS
The marketability of municipal bonds and the interest rates they bear is dependent, in part, upon the issuer's credit rating. A credit rating is an opinion of an issuer's credit worthiness made by an independent professional investment service (pp. 10-11).
Credit ratings, which reflect bond quality, influence the interest rate (and hence, cost) incurred on a bond issue at the time of its initial sale. Better quality bonds, due to their lower risk, can sell at lower rates of interest than bonds with a higher level of risk (pp. 11-12).
A variety of criteria are used to establish a credit rating. ~veakened economic conditions, a high debt burden and questionable fiscal management led to the deterioration of Connecticut's long standing AAA rating. Connecticut bonds are currently rated A1 by Moody's Investment Corporation and AA by Standard and Poor's (pp. 13-15).
Investor confidence in an issuer's ability to repay debt is an important factor in the marketability of bonds and does not always coincide with investment service credit ratings. While investment service agencies offer advice about the security of bonds through their credit ratings, it is actually investors bidding in the bond market who determine the interest rate the issuer must pay to sell the bonds. Investor confidence in Connecticut bonds remains high, and has resulted in lower interest rates for Connecticut bonds than for other states with the same or even higher credit ratings (pp. 15-17).
CHAPTER IV. BOND AUTHORIZATION PROCESS IN CONNECTICUT
Major capital construction projects in Connecticut are funded only after a lengthy review by a number of legislative and executive bodies (p. 18).
In the General Assembly, responsibility for considering and recommending an overall capital construction program in each fiscal year lies with the Joint Finance Committee. During each session, the Finance Committee reports out one or more bills authorizing specific funding of capital projects (pp. 18-19).
The State Bond Commission, composed solely of executive branch personnel, is responsible for allocating funds for legislatively authorized capital projects. This results in the executive branch having final authority for the state's capital program, within the constraints set by legislation (pp. 20-22).
S-2

SUMMARY OF PART TWO
CHAPTER V. STRENGTHENING THE LEGISLATIVE ROLE
A major weakness in the legislature's role in the bond authorization process is that the Connecticut General Assembly has neither found a reliable way to constrain its capital authorizations to within affordable limits nor does it impact on the selection of projects to be funded once authorizations are made. The General Assembly could increase its control over bonding and capital budgeting in several ways (p. 23).
One option would be to mandate legislative membership on the State Bond Commission. This was attempted in 1971 but was vetoed by former Governor Meskill on the basis that such a measure violated the separation of powers doctrine (pp. 23-24).
The General Assembly does not currently prioritize the projects authorized in the annual Bond Act. Therefore, a second option to strengthen the legislative role would be for the General Assembly to prioritize projects in the order it wished to see them funded (p. 25).
A third approach would help to ensure that legislative bond authorizations were kept within affordable levels by establishing an annual spending limit. Projects could be prioritized within that limit, and the General Assembly could constrain itself not to exceed the limit. The Legislative Program Review and Investigations Committee recommends a statutory change (C.G.S. 3-20) that requires the chairmen of the Joint Appropriations Committee and the Joint Finance Committee to jointly report to the General Assembly within thirty (30) days after the Governor's budget message on a prudent limit for new bond authorizations for that year (p.25). The capital budget spending recommendation should be debated and a limit adopted by both chambers.
The Legislative Program Review and Investigations Committee further recommends that the bond bill(s) as recommended by the Finance Committee and as enacted into law not be allowed to exceed the agreed upon spending limit (p. 25).
In order to determine which projects to authorize within the limit, the Legislative Program Review and Investigations Committee recommends that requests be prioritized using cost/benefit estimates provided by the Office of Policy and Management and the Department of Administrative Services (p. 25) .
In order to assist the Finance and Appropriations Committees in compiling and analyzing the complex data necessary to develop a reliable report and spending limit, and to perform the
S-3

additional analyses on the costs and benefits of various projects, the Legislative Program Review and Investigations Committee recommends that an additional analyst position be created in the Office of Fiscal Analysis (p. 25).
The Legislative Program Review and Investigations Committee further recommends that the legislative authorizations for projects which have received no favorable action by the Bond Commission within five years after authorization, automatically expire. This would further reduce the backlog of authorized but unfunded projects (p. 26).
CHAPTER VI. DEBT MANAGEMENT
Three aspects of fiscal and debt management are evaluated in developing a credit rating. These are: (1) the total level of debt and its impact on the budget; (2) the scheduled retirement or ''organization" of outstanding debts; and (3) the state's general fiscal practices (p. 27).
A majority of states, including Connecticut, use a "debt ceiling" to limit the amount of debt which can be incurred . The debt limit in Connecticut specifies that no bonds, notes or other evidences of debt can be issued to exceed four-and-one-half times the total tax receipts of the state from the previous fiscal year, as certified by the Comptroller. Because the present debt limit (4.5 times the previous years tax receipts) has clearly been ineffective as a means of keeping state debt within a modest range, the Legislative Program Review and Investigations Committee recommends that section 3-21 of the Connecticut General Statutes be amended to reduce the figure from four-andone-half to two or two-and-one-half times the previous year's tax receipts (pp. 27-28).
While it is important to contain the total amount of debt, an even greater emphasis should be placed on controlling annual debt service payments because they directly impact on the annual budget. In fiscal year 1978 approximately two-thirds of Connecticut's budget was committed by prior contract or statute to existing programs or debt service. Because "fixed costs" have already reduced the General Assembly's control over the budget to a significant extent, and because debt service is the third highest fixed cost in the budget and has been climbing steadily as a percent of the total budget, the Leg1slat1ve Program Rev1ew and Investigations Committee recommends that a debt service ceiling be enacted (pp. 28-29).
The structure of a bond issue's retirement schedule is important to keep yearly debt service payments in the affordable
S-4

range. Two types of bonds can be used to organize the repayment schedule to ensure the lowest administrative cost and the smallest annual debt service burden. These are term bonds and serial bonds (pp. 30-31).
Connecticut has issued both term and serial bonds. The 1971 deficit of $244 million was funded by the sale of $146,000,000 in term bonds and $98,000,000 in serial bonds (pp. 31-32).
Another factor to consider in scheduling the maturities of bonds is the relationship between the life of the bond and the useful life of the project being financed. Connecticut presently has a policy limiting bond maturities to twenty years or less. However, a more flexible policy could possibly provide some long range financial benefits (pp. 32-33).
An issuer's fiscal operations are an important consideration in the determination of a credit rating. Connecticut is presently one of only three states that has no statutory or constitutional requirement that the Governor propose a balanced budget (pp. 33-34).
Two practices for which Connecticut is often criticized are the funding of annual budget deficits with long term bonds and the accrual of income but not expenses (pp. 34-36).
Connecticut has used bond revenues on more than one occasion to finance annual operating expenses. In 1969 the state used $55,000,000 in bond revenues to pay operating expenses within the Department of Community Affairs and to meet the state's financial obligation to the Teacher's Retirement Fund . In addition, the 1975 budget deficit was funded by the sale of $70.8 million in three-year obligations. The Legislative Program Review and Investigations Committee believes that long term debt should only be created for capital projects and therefore recommends that the General Assembly enact leg1slation that would prohibit the use of bond revenues to fund annual operating expenses or deficits (p. 36).
Connecticut completed fiscal year 1976 with a surplus of $34 . 7 million. However, a major part of the surplus was derived from a change in accounting procedures that enabled the state to accrue revenue in the twelfth month of 1976 which would have otherwise been counted as income in the first month of FY 1977. The Legislative Program Review and Investigations Committee supports the conclusions of the Gengras Commission with respect to the need for consistent use of the accrual method of accounting and therefore recommends that serious consideration be given to also shifting expenditures to this method of accounting (pp. 35-36).
S-5

Connecticut is also often criticized for manipulating revenues to meet expenditures. From July 1, 1971 to April 1, 1975 the state's sales tax rate was changed six times. Further, the State's Bond Retirement Fund has been used to reduce General Fund appropriations for debt service rather than retiring additional outstanding debt, thereby circumventing the intent of the law. The Legislative Program Review and Investigations Committee therefore recommends that section 3-22 of the Connecticut General Statutes be repealed and that legislation mandating the use of budget surpluses be restricted to funding deficits {deposited in a "budget stabilization fund") or redeeming bonds that are not scheduled to mature in the current or following fiscal year (pp. 36-38) .
CHAPTER VII. CAPITAL PLANNING
Prior to 1975 very little central planning for capital construction was performed in Connecticut (p. 39).
An example of one capital construction program undertaken in 1969 without full awareness of the long run implications was the public school construction program. PA 69-751 mandated the state to finance local school construction through the sale of bonds. Towns were required to repay half of the cost over the life of the bonds in the form of 50% of the debt service payments due each year {p. 39).
By 1975 the state's Department of Education had approved projects totalling more than the statutory authorizations. The result was a moratorium on school construction in effect from 1975 to the passage of Public Act 76-418 (p. 40).
Public Act 76-418 instituted a number of reforms to ensure that public school construction is kept to an affordable level. This included the prioritizing of projects based on such factors as level of need and the town's ability to pay. Further, it created a legislative Committee on School Construction to approve or modify, on an annual basis, the proposed public school construction projects. To aid the Committee on School Construction in determining an appropriate level of school construction, it is recommended that the annual report on affordable debt {see pp. 24-25) contain an analysis of the impact of various levels of new school subsidies on the state's financial position in the current year and over the next 10 years (pp. 40-42).
The 1975 General Assembly strengthened the long range planning and approval process for capital projects. Public Act 75-425 created the Properties Review Board, initiated statewide planning on a long range basis and designated the Commissioner of Public
S-6

Works as the sole state agent for accepting and reviewing bids for individual projects and for purchasing or contracting for real estate (p. 42).
For effective long run capital planning to take place each agency must submit timely and adequate information. Further, each agency's long range capital plans should be related to specific program goals. The Legislative Program Review and Investigations Committee therefore recommends that the Department of Public Works (or its successor) develop a comprehensive format for the submission of long range plans which specifically requires each agency to precisely relate its capital plans to its program goals (p. 43).
The Reorganization Act of 1977 will eliminate the Department of Public Works and transfer its planning and review responsibilities under PA 75-425 to the Department of Administrative Services on October 1, 1977. The Properties Review Board will become part of the Office of Policy and Management, also on October 1, 1977 (p. 43).
Capital projects that require new staff and other operating expenses place new strains on the General Fund and compete with other services and programs. Therefore, capital budgeting should be integrated and coordinated with the operating budget so that the impact new construction on operating costs can be assessed. The Legislative Program Review and Investigations Committee recommends that the Office of Police and Management develop a comprehensive format for agency operating budget requests which identifies estimated increases resulting from new or proposed construction (pp. 43-44).
Capital budgeting also affects the need for funds during the fiscal year. The Department of Finance and Control is developing a computer model to forecast the periodic cash needs of the state. Utilization of budgeting tools such as this model can play an important role in managing the state's finances. The Legislative Program Review and Investigations Committee recommends that the Department of Finance and Control move as rapidly as possible to fully develop this valuable forecasting capability ( pp. 4 4-4 5) .
S-7

CHAPTER ONE
Purpose and Scope
Background Purpose
PART ONE: DESCRIPTION
Scope and Organization Information Sources Acknowledgments


CHAPTER ONE
PURPOSE AND SCOPE
Background
In May 1975, Standard and Poor's Corporation, one of the nation's two largest bond rating agencies, dropped Connecticut's long standing triple A (prime grade) bond rating to double A (high grade). Moody's Investor Service similarly reduced the state's rating from triple A to double A, citing as reasons a variety of fiscal problems that reduced the security of Connecticut bonds. In March 1976, Moody's reevaluated Connecticut's credit rating and reduced it again, this time from double A to A 1 (high medium grade).
By 1976, the state's total bonded indebtedness stood at $2.4 billion and annual debt service costs were approaching $300 million per year--over 14% of General Fund expenditures. Connecticut's per capita debt burden was among the highest in the nation.
Purpose
The Legislative Program Review and Investigations Committee authorized its staff to undertake a study of the state's long term debt, including an examination of the reasons for the reductions in Connecticut's credit rating from triple A to A 1 •
Scope and Organization
This report, encompassing the major issues in capital budgeting, bonding, and long term debt management, is divided into seven chapters--the first four being descriptive (Part One) and the last three containing analyses and recommendations (Part Two). Chapter II provides an introduction to municipal bonds, their use, their investment features and who owns them. Chapter III focuses on credit ratings, interest costs, and factors contributing to Connecticut's drop in ratings. Chapter IV examines the roles of the legislature and the State Bond Commission in authorizing capital construction and bond sales. Chapter V suggests various ways of strengthening the legislature's control over capital decisionmaking. Chapter VI discusses debt management and identifies a number of strategies for easing the financial burden associated with long term debt. Chapter VII provides an examination of the state's planning function and recommends ways of improving it. Appendices containing more detailed information, including a glossary (Appendix I-1), are printed at the end of the report.
1

Information Sources
Staff made use of numerous documents and interviews in the development of this Report. Statistical data were derived mainly from Connecticut's 1977 "Official Statements" on bonds, credit reports by Moody's and Standard and Poor's, the Office of Fiscal Analysis, the Auditors of Public Accounts, the Treasurer. and the Department of Finance and Control. Other sources include publications by the Municipal Finance Officers Association, Maryland's Department of Fiscal Services, the Advisory Commission on Intergovernmental Relations and the Securities Industry Association.
Acknowledgments
The Legislative Program Review and Investigations Committee wishes to thank the many individuals throughout the legislative and executive branches--especially ~~s. Antoinette Bascetta of the Office of Finance and Control, Mr. John Richmond of the Treasurer's Office, and Ms. Lynn Berall and Mr. Robert Harris of the Office of Fiscal Analysis--who gave generously of their time to assist in the preparation of this report. The Committee also extends its appreciation to Ms. Candy Barton, Committee secretary, for her care and patience in typing numerous drafts of this Report.
2

CHAPTER TWO
An Introduction to Municipal Bonds
Purposes for Which Bonds Are Issued Types of Governments Issuing Debt Types of Bonds Investment Features The Bond Market Bond Holders


CHAPTER TWO
INTRODUCTION TO MUNICIPAL BONDS
A "municipal bond" is a written promise by a governmental unit, such as a state, municipality, or school district, to pay a specified sum of money (the face value, principal or par value) at a specified date in the future, together with periodic interest at a specified rate.
Across the nation in 1976, state and local governments financed $55.7 billion 1 in new debt in approximately 7300 issues; of this, $33.8 billion were long term bonds and $21.9 billion were short term notes (maturing in one year or less) .
Since short term notes are basically a routine means of dealing with cash flow problems, including periodic revenue shortfalls or delays, they are not treated in any detail in this report on long term debt.
For a list of definitions pertinent to bonding, see the glossary (Appendix I-1).
Purposes for lvhich Bonds Are Issued
In economic terms, the creation of debt through the issuance of long term bonds (in Connecticut, up to 20 years to mature) is analogous to mortgaging or borrowing against future revenues. The major purposes for which governments issue long term debt are:
• to finance the acquisition of property or major capital equipment, and
• to finance the planning and construction of large capital projects.
Since 1959, the majority of long term debt created by state and local governments has been used to finance schools, utilities and transportation projects. However, as population trends and social priorities have changed, the purposes for which municipal bonds have been issued have also changed. Table II-1 shows that school construction and transportation have decreased as a percent of bond allocations nationally, while pollution control has sprung into prominence since 1973.
1 This was triple the amount marketed in 1966 and over seven times the amount sold in 1956.
3

Table II-1. State and local long term debt classified by major purposes, 1 selected years (United States).
Public Industrial Pollution Year Sch:::>ols Utilities Transp. Housing Aid Control
1959 30% 15% 12% 4% 2 2
1962 35 15 14 4 1 1967 31 14 8 3 9 1970 28 13 8 1 0 1972 23 13 9 4 2 1973 21 15 6 5 1 9 1974 3 22 14 4 2 2 10
1 The remainder was in a category labelled "Other, " which ranged from 39% to 50% of the total.
2 Less than . 5 percent. 3 Comparable figures for each category for 1975 and 1976 are not yet
available.
Source: Significant Features of Fiscal Federalism 1976-77, Vol. II, Advisory Commission on Intergovernmental Relations, p. 72.
Types of Governments Issuing Debt
Similar to the variations in purpose for which debt has been issued, the percentage of debt created by each type of governmental unit has also shifted, with states and counties assuming a larger share while municipalities and school districts have assumed less (see Table II-2).
Types of Bonds
The two major types of municipal bonds are "general obligation" bonds and "revenue" bonds. vJhile the distinction is not always perfect, these two types of bonds are differentiated primarily according to the source of funds from which they are to be repaid and the security pledged to redeem them.
General Obligation. These bonds are issued by a governmental unit with the power to levy taxes and are backed by the "full faith and credit" of the issuing government to redeem them at maturity. The governmental unit must repay a specific amount
4

Table II-2. State and local debt outstanding by type of governmental unit, selected years (United States).
Year
1955 1967 1970 1973 1975
State
23% 28 29 32 33
County
7% 7 8 8 9
Municipality
36% 32 30 30 29
School Special Town District District
2% 17% 13% 2 16 15 2 16 15 2 1 3 15 2 12 15
Source: Significant Features of Fiscal Federalism 1976-77, Vol. II, Advisory Commission on Intergovernmental Relations, p. 81.
of principal and interest each year, which together are referred to as annual "debt service" costs. Because the issuer has pledged its taxing power to repay the debt, these bonds are highly secure. Presently general obligation bonds constitute approximately 80% of Connecticut's long term debt. (See Appendix II-2.)
Revenue bonds. These bonds are generally used to construct projects expected to generate revenue through user fees, such as highway tolls. Although Connecticut has not issued traditional revenue bonds for many years, it does issue "self-liquidating" bonds which are similar in nature to revenue bonds. Selfliquidating bonds can currently be issued by three state authorities to finance revenue-producing projects. These are the Connecticut Resources Recovery Authority, the Connecticut Housing Finance Authority and the Connecticut Development Authority.
In addition to the revenues generated by the project, most "self-liquidating" bonds are secured with reserves or guarantees to improve their marketability. Bonds issued under the Expressway Bond Act, for example, carry an obligation by the State to use all toll receipts from the expressway for retirement of the debt. In addition, the State is bound by statute to maintain an "Expressway Reserve Fund" with a minimum balance equal to two years' debt service on the outstanding bonds. This mandated reserve increases the security of the debt and aids in obtaining a low rate of interest when the bonds are initially sold. Under certain circumstances, these bonds may also be backed by the "full faith and credit" of the State. This was done in two of the seven
5

series of bonds issued to finance the Greenwich-Killingway Expressway. Revenue or self-liquidating bonds presently comprise 20% of Connecticut's long term debt.
"Special tax" or "assessment" bonds are a distinct kind of self-liquidating bond. An example of this kind of bond is those sold to finance college dormitories, which are retired with student fees assessed against those living in the dormitories. Another special type of revenue or self-liquidating bond is the new housing authority bond. In the case of these bonds, not only is the annual net rental revenue pledged against the debt, but it is usually also guaranteed by the Federal Public Housing Administration, which typically carries the unconditional support of the federal government for at least oLe year's debt service. Therefore, these bonds are also considered highly secure. In Connecticut, the Housing Finance Authority has issued $302,545,400 in bonds since 1971 that are classified as "new Housing Authority" issues.
Investment Features
Municipal bonds have four main features which make them attractive to a variety of investors. These are: security, marketability, tax-free status and income production.
Security. The issuer's pledge to levy taxes to pay debt service makes municipal bonds highly secure. Bonds issued without a full faith and credit backing are usually secured by a contingency fund with a minimum of one year's debt service in reserve, as noted above. In 1975 across the nation, 53% of the total outstanding State and local debt was secured as general obligation bonds, and 39% was in "limited liability obligations." 1
The remaining 9% was in the form of short term notes. 2
Marketability. The high degree of investment security associated with municipal bonds enhances their marketability, or desirability in the securities market. After their original sale, municipal bonds remain marketable in what is known as the "secondary market." This enables the investor to liquidate his holdings prior to maturity.
1 These are not secured by a full faith and credit pledge and therefore the issuer's liability is reduced or limited.
2 Numbers add to 101% due to rounding.
6

Tax-free status. Perhaps the most attractive feature of municipal bonds is their exemption from federal and state income taxes. The tax-free status is especially desirable to an investor seeking to maximize the net (after tax) yield of his investment. For example, under 1973 federal income tax rates, an investor in a 32% tax bracket ($10,000 - $12,000 for a single return, $20,000 - $24,000 for a joint return) would have required an investment with a 7.35% rate of return to obtain the same net yield as a 5% tax-free bond. At higher income levels, the advantages are even greater. An individual in a 70% income tax bracket (over $100,000 for a single return; over $200,000 for a joint return) would require an investment with a 16.67% rate of return to enjoy the same net profit as a 5% tax-free bond. Clearly, tax-free bonds enable holders to earn substantially more than their relatively low interest rates would suggest.
Income producing ability. A significant portion of the investors in municipal bonds are interested in a security's ability to provide a stable annual income. In the market at any given time a wide range of returns exist among bond issues depending upon the maturity date, the risk involved and the investor's preference towards risk. Therefore, individuals whose investment criteria emphasize the flow of current income, can select from a variety of issues that will meet this requirement.
The Bond Market
After a governmental unit decides on the appropriate type and quantity of bonds to issue, two groups perform the bulk of the investment banking function. These are security dealers who buy and sell bonds and commercial banks with municipal bond departments. In a usual bond sale, the issuing government solicits bids from groups of dealers organized as "syndicates." Each syndicate's bid specifies the lowest interest rate it would accept in buying the bonds, and the state sells to the lowest bidder. Syndicates often resell blocks of bonds to smaller investors and may or may not retain a portion themselves. When sold to individuals, municipal bonds are usually quoted as, for example, "City of New York, New York State, 5% of 1995 at 4.80%." This means that bonds issued by the City of New York having 5% interest coupons, maturing in 1995 are offered at a price to yield the investor 4.80%. 1
1 The net yield to investors will be greater than the coupon rate if the bond is sold at a "discount" of the par value. Conversely, bonds sold at a price above the par value or at a "premium" will reduce the net yield below the coupon rate of interest. Bonds purchased at par value will yield the investor the coupon rate of interest.
7
Prices in the secondary market. Three principal factors influence the prices of municipal bonds after their initial sale. First, changes in the value of money affect the price of bonds. Since the value at maturity is fixed and the interest rate is fixed, the yield can be changed only if the price of the bond itself changes. Second, over time, the financial position of the issuer may change and result in an increase or decrease in the original level of risk associated with the bond. 1 Third, changes in general economic conditions may affect both the supply and the demand for municipal bonds and thereby influence the price.
Bond Holders
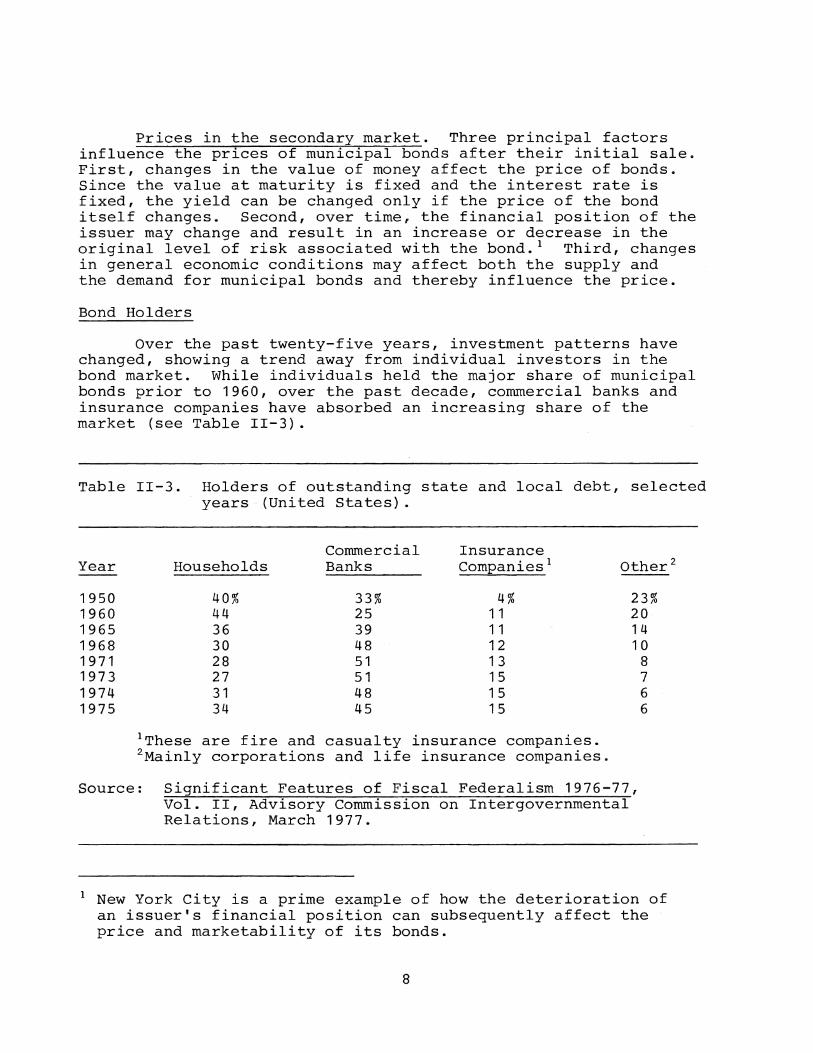
Over the past twenty-five years, investment patterns have changed, showing a trend away from individual investors in the bond market. While individuals held the major share of municipal bonds prior to 1960, over the past decade, commercial banks and insurance companies have absorbed an increasing share of the market (see Table II-3).
Table II-3. Holders of outstanding state and local debt, selected years (United States).
Year
1950 1960 1965 1968 1971 1973 1974 1975
Commercial Insurance Households Banks Companies 1
40% 33% 4% 44 25 11 36 39 11 30 48 12 28 51 1 3 27 51 15 31 48 15 34 45 15
1 These are fire and casualty insurance companies. 2 Mainly corporations and life insurance companies.
Other 2
23% 20 1 4 10
8 7 6 6
Source: Significant Features of Fiscal Federalism 1976-77, Vol. II, Advisory Commission on Intergovernmental Relations, March 1977.
1 New York City is a prime example of how the deterioration of an issuer's financial position can subsequently affect the price and marketability of its bonds.
8
One of the most important influences on the demand for municipal bonds is the current investment preference of the purchaser. Under expanding economic conditions, individuals and corporations seek investments that will reduce their taxable income, making municipal bonds highly attractive. However, if recent losses have reduced an investor's income tax liability, he will be less prone to purchase tax-free investments (see Appendix II-1 on the proposed "Taxable Bond Option''). Other factors influencing the demand for municipal bonds include the investor's desired level of risk, liquidity and rate of return.
9


CHAPTER THREE
Credit Ratings and Interest Costs
Investment Services Bond Ratings and Interest Rates Criteria Used in Rating Factors Contributing to Connecticut's Drop in Rating Market Ratings


CHAPTER THREE
CREDIT RATINGS AND INTEREST COSTS
The marketability of municipal bonds and the interest rate they bear is a function of overall market conditions and the issuer's credit rating. While a state has little control over general market trends or the national economy, it may substantially influence the bond or credit rating it receives from the investment services. Therefore, insight into the components of the credit rating and its influence on interest rates are important to an understanding of Connecticut's long term debt position.
Investment Services
Due to the large volume 1 of new bonds issued across the nation, the investment community relies to a large extent upon "investment services" for concise, factual and analytical reports describing a bond issuer's solvency. Based on an analysis of both financial and nonfinancial criteria, investment services rate individual bond issuers for their credit worthiness. A bond rating, therefore, while only an opinion of the investment quality of a bond issue, simplifies the classification of thousands of highly divergent borrowing units into a small number of credit risk categories.
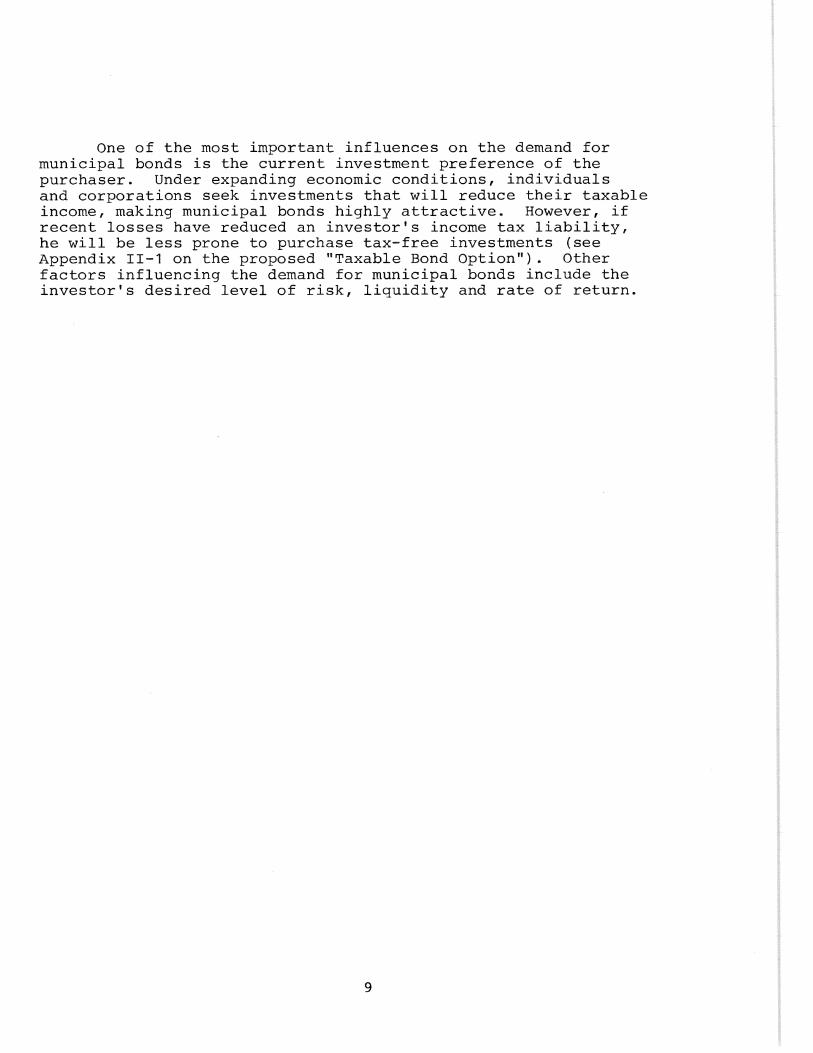
Credit ratings are provided by three investment services. Of these, Moody's Investor Service and Standard and Poor's Corporation have developed a national reputation and following. While the nomenclature used to denote the respective ratings is slightly different, both services' ratings offer comparable meanings. Table III-1 lists the ratings and their interpretations.
In addition to the ratings, bonds in the A or Baa group that possess the strongest investment attributes are designated as A 1 or Baa 1 by Moody's. Standard and Poor's Inc. denotes similar issuers as A+ or BBB+.
Bond Ratings and Interest Rates
Credit ratings, which reflect bond quality, exert a significant influence on the interest costs of an issue. In general, the
1 In 1967 the average weekly sales of municipal bonds (and short term notes) stood at approximately $429 million. By 1976 this figure more than doubled to over $1 billion per week.
1 0
Table III-1. Interpretations of credit ratings.
Moody's
Aaa A a A
Baa Ba B
Caa Ca c
Standard and
Poor's
AAA AA A
BBB BB B
CCC cc c
Interpretation
Best quality, little or no risk High grade, little or no risk High medium grade, favorable
features Hedium grade, some speculation Low medium grade, advise caution Generally lacks characteristics
of a desirable investment High credit risk Very speculative Default by S & P; lowest grade by
Hoody's
Source: Fundamentals of Municipal Bonds, Investment Bankers Association of America, May 1970.
higher or better quality the bond, the lower the interest rate paid by the issuer. As the rating drops, the degree of speculation in an issue increases and will be reflected in the higher yields that must be offered to compensate for the additional risk.
Since a bond rating is not the sole determinant of a bond's price, however, quality distinctions within categories are possible. This produces a range of yields for bonds with the same rating.
Due to the length of time (15 to 20 years, in Connecticut) over which an issue matures and the large amounts in which they are sold, small differences in interest rates can amount to very large differences in interest costs. For this reason, bonds are traded in terms of "basis points" where 100 points represent one percent. On a $100 million issue, an extra 25 basis points in interest (the difference between interest rates of 5.00% and 5.25%, for example) will add about $2.6 million in interest costs over a twenty year maturity. Table III-2 illustrates the relationship between ratings, interest rates and interest costs for three issues of $1 million each maturing in fifteen years.
11

Table III-2. An example of the relationship between ratings, interest rates and interest costs.
Volume Interest and
Issuer Rating Rate Maturity Interest Cost
1 Aaa 5.000% $1,000,000 $484,500 15 yr.
2 A a 5.083% $1,000,000 $492,300 15 yr.
3 A 5.200% $1,000,000 $502,700 15 yr.
Source: Maryland's Long Term Debt 1958-1988, Maryland Fiscal Services, June 1974.
In the above example, issuer 1 with a triple A rating, will pay $18,200 less in interest than the single A rated issuer and $7,800 less than the double A rated issuer. These calculations are based on the typical differences in interest rates associated with each rating. It clearly demonstrates that triple A issuers will be most able to keep interest costs at a minimum.
Criteria Used in the Ratings
Assigning a credit rating to a bond issuer is a complex process involving numerous criteria and a vast amount of data. After reviewing the relevant information, a committee of five or six analysts assigns a rating to the issuer. An issuer may appeal its rating, but seldom is it changed.
The primary indicators utilized by rating agencies may be classified as economic, demographic, and fiscal. Emphasis is placed on trends identified in each of the relevant areas as indicators of what investors might expect in the future with respect to the issuer's ability to repay the debt.
In addition to the analytical data, certain judgmental criteria are employed. A specific example is the perceived willingness of a community to pay for additional debt via increased taxes.
Together, judgmental and factual standards form the rationale for an agency's opinion. It should be remembered
12

that credit ratings are only opinions and that the market may react to a new issue in a variety of ways, not always consistent with the assigned risk (see pp.15-17 on market ratings).
Factors Contributing to Connecticut's Drop in Rating
Until 1975, Connecticut maintained a triple A rating from both Moody's and Standard and Poor's. The high quality rating stemmed from the state's high level of personal income and extensively developed manufacturing and service industries. In recent years various conditions that formerly strengthened the state's ratings have worsened and are now considered liabilities. These were principally in the areas of economic growth and the level of already existing debt.
Economic growth. The 1973-74 recession had a severe impact on Connecticut. State revenues failed to grow adequately to meet operating expenditures and the 1974-75 fiscal year ended with a $70.9 million deficit. The state's manufacturing base was weakened by a decreased demand for defense-related products. (Connecticut has historically ranked between fourth and sixth nationally in defense contracts.) The loss of manufacturing income and a precipitous rise in energy costs, caused by the 1973 oil embargo, compounded the growing unemployment problem in the state. 1 New housing permits dropped from 25,318 in 1971 to 12,114 in 1975, placing an additional drag on the state's economy. From 1971 to 1975 the state's real state product (in constant dollars) increased at a yearly average of only .92%, compared with the national average of 2.34% for the same period. (See Appendix III-2 for a comparison of growth rates for Connecticut and the U.S. from 1960-76.)
According to the "ability of pay" criterion, Connecticut is favorably regarded due to its high per capita income, which was second only to Alaska in 1976 and 18% above the national average of $5902. Recently, however, this high standing has also begun to slip. From 1975 (1st quarter) to 1976 (1st quarter) Connecticut had the lowest rate of growth in personal income among the fifty states. (See Appendix III-3.)
1 The level of unemployment in Connecticut has placed a serious strain on funds available for unemployment compensation. As of September 1, 1977, Connecticut's unemployment fund was $438 million in debt to the federal government. From 1971 to 1976 the average rate of unemployment in the state was 8.1% or nearly one-third higher than the national average of 6.3%. (See Appendix III-1.)
13

In 1976 Connecticut's per capita income increased at a modest 5.6%, well below the national average increase of 9.1%. Connecticut dropped from second to third in per capita income, trailing Alaska and Illinois. While Connecticut still has a high ability to pay, the forementioned economic trends are clearly retarding the growth of income in the state.
Debt burden. Other factors cited as seriously affecting Connecticut's credit rating include the state's high level of outstanding debt. After deducting sinking fund reserves, Connecticut's net debt as of April 15, 1977 was $1,932,885,182 or $620.00 per person. The national median per capita debt at the end of 1976 was only $136.04. Further, Connecticut's debt is equal to approximately 6.1% of the total value of property in the state, compared with the national median of only 1 .4%. Even comparing per capita debt with per capita personal income, Connecticut was 7.3% higher than the U.S. median in 1974.
Debt service as a percent of the operating budget has grown in recent years to comparatively high levels. In fiscal year 1968-69, less than ten years ago, debt service was only 3% of the budget. This grew to 10.7% in fiscal year 1971-72 and to over 14% in fiscal year 1975-76. In fiscal year 1977-78 total debt service payments will peak at $313,585,000 or 16.4% of the operating budget.
Drop in ratings. These trends clearly weakened the state's financial position. Further, because the state's income is primarily dependent upon sales taxes which tend to yield less during periods of economic uncertainty or decline, investor services undertook a reevaluation of Connecticut's long standing triple A rating. This re-assessment was undoutedly also influenced by the New York City financial crisis and the sagging national economy. On May 31, 1975, Standard and Poor's Corporation lowered Connecticut's rating from AAA (prime grade) to AA (high grade). The primary reason cited for the reduction was the continued deterioration of the state's financial stability, and specifically that "state spending increases ... have far out-stripped the economic growth." 1
On September 15, 1975, Moody's Investor Service similarly downgraded Connecticut's rating from Aaa to Aa. Their opinion
1 Fixed Income Investor, Standard and Poor's Corp., May 31, 1975, p. 620.
1 4

emphasized the state's heavy debt burden and reluctance to reform the existing tax structure into one that would be less vulnerable to downturns in the economy.
The state maintained the double A rating assigned by both services until March 5, 1976, when Moody's again downgraded the state's rating--from Aa to A. In its report, Moody's noted, "Chronic budget-balancing difficulties and continual temporizing with revenue and expenditure measures are compounding the State of Connecticut's future problems." As of September, 1977, the State remains rated AA by Standard and Poor's Corp. and A by Moody's Investor Service.
Market Ratings
The growth and diversification of the municipal bond markets have expanded the need for standardized reports by respected investment services on the type and level of risk associated with various issuing units. While rating agency reports have become more comprehensive and reliable, the ultimate rating assigned to a bond issue is still the "market rating," or the lowest rate of interest an investor is willing to accept to buy the bonds. While the market rating is influenced by the credit rating, it is ultimately investor confidence in the issuing governmental unit that determines the interest rate and hence the actual cost of each bond issue.
Despite the reduction of Connecticut's credit rating from prime grade to high medium grade by Moody's, investor confidence, as expressed by the willingness to buy Connecticut bonds at relatively low interest rates, remains considerably high. While during 1975 and 1976 the state was forced to pay higher interest rates on its bond sales, the most recent sale of Connecticut bonds (April 1977) should be noted for its low cost.
Table III-3 summarizes the last five sales of long term bonds by the state, which added a total of $488,100,000 to our long term debt.
The interest costs of the $425 million issued in 1975 and 1976 will amount to $225.6 million over the twenty year life of the bonds, or 60% of the original amount borrowed.
Comparing the sales of bonds in June and September 1975 will illustrate the market rating concept. The difference in interest rates in these two issues was 53 basis points, from 5.63% to 6.16%. The bond buying index for prime grade issues
1 5

Table III-3. Sales of Connecticut bonds, 1975-77.
Size of Interest Issue Interest Cost Ratings
Date (in millions) Rate (in millions) Moody's S&P
06-11-75 $100.0 5.63% $59.9 Aaa AA 09-03-75 1 00. 0 6. 1 6 60.9 A a AA 03-17-76 100.0 6.24 65.5 A AA 10-14-76 125.0 5.27 69.3 A AA 04-15-77 63. 1 5.03 33.2 A AA
Source: Deputy Treasurer's Office for Debt Management, Connecticut.
rose only 35 basis points over the same period. 1 The difference (18 basis points) may be attributed, at least in part, to the change in credit rating, which adversely affected the market rating, and thereby increased interest costs.
The most recent sale of Connecticut bonds occurred on April 15, 1977. At this sale, investor confidence appeared improved, as expressed by the low 5.03% interest rate secured on a sale of $63.1 million. This issue will cost the state $33.2 million in interest or 52% of the original amount borrowed, compared with the 60% noted above.
To emphasize the importance of investor confidence in Connecticut bonds in April, 1977, a comparison is made with a similar bond sale by the State of Hawaii. Presently rated double A by both investor services, Hawaii sold $75 million in general obligation bonds in the same week as Connecticut sold its $63.1 million, yet Hawaii's bonds carried a 5.12% rate of interest. Further, the Bond Buyers Index for prime issues was 5.70% for this period, and although Connecticut and Hawaii were well under the index, Connecticut's bonds performed slightly better. In this instance, investor confidence in Connecticut bonds allowed them to sell at a lower interest rate than Hawaiian bonds, in spite of the lower (A) rating on Connecticut bonds by Moody's.
1 The index referred to is prepared by the Daily Bond Buyer, a major New York bond analysis firm.
16

Connecticut's record with respect to market ratings and bond sales indicates the market's understanding of the state's recent fiscal history. The surpluses (though admittedly somewhat artificial) of fiscal years 1976 and 1977 appear to have restored some belief that Connecticut's tax structure can generate the revenues required to adequately support the present level of governm8nt service. Incurring a deficit at this time or rapidly increasing spending would, however, reinforce a variety of reports that have criticized the state's financial operations and tax structure. 1
1 In December 1976, the Federal Reserve Bank of Boston released Financing Fiscal Reform in Connecticut, which was highly critical of the state's present tax structure. See Appendix III-4 for a comparison of Connecticut's reliance on various taxes and that of all other states.
17

CHAPTER FOUR
Bond Authorization Process in Connecticut
The Legislative Role State Bond Commission


CHAPTER FOUR
BOND AUTHORIZATION PROCESS IN CONNECTICUT
Hajor construction, improvement and acquisitional projects in Connecticut are funded only after a complicated and timeconsuming review by a number of executive and legislative bodies. (See Chapter VII on the capital planning and approval process.) Agency administrators must submit capital requests to the executive Department of Finance and Control by September 1 of each year. 1 Requests involving authorization of funds must also be filed by November 15 with the legislative Office of Fiscal Analysis.
The Budget and Manage~ent Division of the Department of Finance and Control independently estimates each project's capital and operating costs and considers them against the project's estimated benefits. Projects found desirable by Finance and Control are recommended for inclusion in the Governor's capital budget.
The Legislative Role
The Joint Finance Committee. In the General Assembly, responsibility for considering and recommending an overall capital construction program in each fiscal year lies with the Joint Finance Committee. The Committee assesses the capital needs of the state by evaluating the Governor's recommended capital budget, bills submitted by individual legislators and committee raised bills.
To effectively comply with its mandate, the Joint Finance Committee is informally divided into subcommittees on bonding, municipal affairs, education finance, consumer tax and fees, and business taxes. All analytical work for the Committee is performed by the revenue section of the Office of Fiscal Analysis, which serves as direct staff to committee members and issues summaries of bills raised by the committee. In 1976, a full-time clerk was hired to facilitate the committee's work on a year round basis.
During each session, the Finance Committee reports out one or more "bond bills" authorizing specific funding of capital
1 Effective October 1, 1977, the functions of the Department of Finance and Control will be transferred to the Office of Policy and Management created under the Executive Reorganization Act of 1977.
18

projects. In 1977, the Finance Committee recommended, and the General Assembly authorized, $91.2 million for general construction and a supplemental $39.2 million for special projects, such as completion of the Interstate-84 highway exchange in Danbury, and increased funding for elderly housing. In addition to authorizing new spending of $140.4 million, the 1977 Bond Act cancelled or reduced the authorizations of 54 previously authorized projects totalling $27 million. 1
The Bond Act. Inclusion of a project in the Bond Act is a major step in securing either planning or construction funds. Each project contained in the Act is, upon passage, "authorized." However, if the total legislative authorization for bond sales is deemed excessive by the Bond Commission, such that not all authorized projects will be funded, the General Assembly has no control over which projects the Bond Commission will fund (see below).
Table IV-1 lists the total legislative authorizations by program area and the amounts allocated by the Bond Commission.
Table IV-1. Legislative bond autl1orizations and allocations by Bond Commission as of June 30, 1976.
Authorized by Allocated by Bond Program Area Bond Acts Commission Percent
Capital J.mprovements and other Purposes $1,040,695,000 $691,998,201 66.5%
!busing 198,600,000 194,899,400 98.1 Highways 1,127,270,000 956 '414, 134 84.8 Education 571,975,000 435,263,722 76.1 Flood Aid and Water
Pollution 329,200,000 272,346,251 82.7 Other 1 196,209,000 107,029,608 54.5
'IOTAL $3,463,949,000 $2,657,951,316 76.7
1 Includes the following bond funds: Regional f'IJarket (3016), Employment Projects (3753 and 3752), Student Loan Secondary Market (3096), Veteran Bonus (3085), Connecticut Product Developnent (3095), Stooent Loan Foundation (3079), Small Business Loans (3076), and Municipal Redevelopment (3065) .
Source: Annual Report by the Ccmptroller, State of Connecticut, 1976.
1 This was the first year in which the legislature took action to (footnote continues on page 20).
19
State Bond Commission
The State Bond Commission is responsible for allocating funds for legislatively authorized capital projects. The Commission is composed of the Governor, the Treasurer, the Comptroller, the Attorney General, the Commissioner of Finance and Control, and the Commissioner of Public Works (or their designees). The Commission is given substantial discretion by statute:
... whenever a bond act empowers the State Bond Commission to authorize bonds for any projects or purr-oses, and whenever the State Bond Corrrnission finds that the authorization of such bonds will be in the best interest of the State, it shall authorize such bonds ... (emphasis added; C.G.S., Section 3-20(g)).
The Commission also determines the amount and timing of bond sales. (See pp. 4L~-45 on forecasting cash demands.)
The Commissioner of Finance and Control serves as the Secretary of the State Bond Commission and sets the agenda for its meetings. Legislative attempts to gain input into this process through the addition of legislative members to the Commission have consistently failed (see pp. 23-24). Thus, under Section 3-20, the executive has final decisionmaking authority for the state's capital budget and program within the constraints set by legislation.
After the Bond Commission has adopted an agenda (allocating funds for projects), each agency with a listed project may request 1
(footnote continuation from p. 19) reduce the accumlated backlog of authorizations ($800 million). While this was a step in the right direction, it left 96% of the old authorizations in force. An even more affirmative step in future years could substantially reduce the backlog of authorized projects and bring the legislature back into a position of some control over capital budgeting. (see p. 26 on "sunsetting" bond authorizations.)
1 Funding for some projects is never requested by the administering agency. A project that was authorized by the General Assembly and allocated funds by the Bond Commission, but had not been requested by the agency and is not supported by the agency, may never be implemented.
20

Figure IV-1. Flow diagram of process by which funds are authorized, allocated, and allotted to capital projects.
rejects
Fin ante rrodi fies Gov Rec. cap Bgt
Vetoes
reviews reClUest
approves
Fin ante rea:mnends cap program
approves, beCXJ!TieS
Gov allots f1.mds through F&Cand Treasurer
Source: legislative Program Review and Investigations Ccmnittee Staff Analysis, ,June 1977.
21
an allotment of funds from the Governor through Finance and Control and the Treasurer. If the allotment is requested and approved, the project proceeds. Figure IV-1 illustrates the process of authorizing, allocating and allotting funds to capital construction projects.
It is important to remember that the Bond Act authorizes projects which remain in an unfunded pool (currently totalling $800 million) until the Bond Commission decides to fund them. Some may never be funded and others may be activated years after their legislative authorization. A Bond Commission agenda may therefore allocate funds to projects authorized in many different years.
Similarly, the amount of bond sales in any one year is not directly related to bond authorizations, but rather, to the cash flow demands generated by bills corning due on initiated projects. The Bond Commission must therefore anticipate the funding requirements of projects over time, the state's periodic income, and other expenditure obligations in order to determine when to sell bonds and in what amounts.
22


PART TWO: ANALYSES AND RECOMMENDATIONS
CHAPTER FIVE
Strengthening the Legislative Role
Legislative ~1embership on the Bond Commission Prioritizing Projects Analogy to Balanced Budget Concept "Sunsetting" Project Authorizations


CHAPTER FIVE
STRENGTHENING THE LEGISLATIVE ROLE
As noted in Chapter IV, a major weakness in the legislature's role in the bond authorization process is that the Connecticut General Assembly has not found a reliable way to constrain its capital authorizations to within affordable limits. Historically, bond bills, both as recommended by the Finance Committee and as amended on the floor, have included numerous special interest projects which have driven the authorized debt far beyond tolerable levels. Further, since authorizations are without an expiration date, a huge pool of projects has accumulated. As of March 1977, the legislature had authorized capital spending of a staggering $800 million in excess of actual bond sales. Further, since the General Assembly does not prioritize its projects, the Bond Commission has tremendous flexibility to fund the projects of its choice almost independent of legislative control.
The General Assembly could increase its control over bonding and capital budgeting in at least three ways. First, it could change the statutory composition of the Bond Commission to include one or more legislators. Second, it could statutorily require the Bond Commission to allocate funds to projects in accordance with a legislatively established priority listing. And third, the General Assembly could develop a means of constraining its own authorizations so that the Bond Commission did not have as much flexibility in deciding which projects to fund. Each of these alternatives is amplified below.
Legislative Membership on Bond Commission
In 1971, the General Assembly did mandate legislative membership on the State Bond Commission (PA 71-564). Governor Meskill vetoed the Act on the basis that it violated the separation of powers doctrine of the State Constitution (Art. III, Sec. 11) which says:
No member of the C'-.eneral Assembly shall, during the tenn for which he is elected, hold or accept any appointive position or office in the judicial or executive department of the state government ....
Subsequent opinions by the Attorney General have supported this view.
The General Assembly could again attempt to enact legislation which would add one or more legislators to the State Bond Commission. If the measure became law over a Governor's veto,
23

it may have to withstand court adjudication on the separation of powers issue.
Other alternatives include moving the Bond Commission into the legislative branch, since it essentially performs an appropriations function, or eliminating it altogether, as the auditors have recommended. 1
Prioritizing Projects
The General Assembly does not currently prioritize the projects it authorizes in the Bond Act. The Bond Commission therefore has no legislative guidelines or constraint in deciding among a long list of alternative projects. The General Assembly could, however, mandate itself to specify priorities in the Bond Act, and mandate the Bond Commission to honor those priorities within spending limits.
Analogy to Balanced Budget Concept
The General Assembly could make a significant move toward increasing its control over capital budgeting if it would adopt a procedure similar to the budget balancing process for operating budgets: establish a spending limit, prioritize projects within that limit, and restrain itself from authorizing projects in excess of the limit. 2
Bond bill limit. One means of implementing such a goal would be to create a special subcommittee of the Appropriations Committee to work with the bonding subcommittee of the Finance Committee to jointly study the state's capital and operating budgets and recommend to the General Assembly a bond bill limit early in each session.
Input from the Appropriations Committee is important to responsible long range decisionmaking for two reasons. First, general obligation debt service is paid from the General Fund and has recently comprised over 14% of the operating budget.
1 Report of the Auditors of Public Accounts to the 1977 General Assembly of Connecticut, February 1, 1977, p. 22.
2 Although the General Assembly has restrained itself to modest authorizations in each of the past three years (under $150 million) there is no assurance that such restraint will continue. During the late sixties and early seventies, for example, authorizations ranged from $500-880 million per biennium.
24

The amount committed to debt service over the twenty year life of a bond can have substantial impact on the work of the Appropriations Committee. Second, many, if not most, capital projects require annual operating funds after completion, which also must be taken into account when determining affordability and the long range costs and benefits of each project requested.
The Legislative Program Review and Investigations Committee therefore recommends a statutory change (C.G.S., Sec. 3-20) that requires the Chairmen of the Joint Appropriations Committee and the Chairmen of the Joint Finance Committee to jointly report to the General Assembly within thirty (30) days after the Governor's budget message on a prudent limit for new bond authorizations for that year. This annual bond limit determination should be based on econometric simulations of the impact of adding various amounts of new debt to the state's current debt obligation, and should include an analysis of Connecticut's debt trend (increasing, stable, decreasing), debt service trend as a percentage of General Fund revenues projected 5-10 years, state and national economic forecasts, and other relevant factors. (See also pp. 27-29 on debt limits and a "debt service" ceiling.)
Priorities. Once a capital spending limit for the year has been reported by the Finance and Appropriations Committees, it should be debated and adopted by both chambers. The Legislative Program Review and Investigations Committee recommends that the bond bill(s) as recommended by the Finance Committee and as enacted into law not be allowed to exceed the agreed upon spending limit. In order to decide which projects to authorize within the limit, the Program Review and Investigations Committee recommends that project requests be prioritized using cost/benefit estimates, provided by the Office of Policy and Management and the Department of Administrative Services (see pp. 43-44). If this process were adopted by the General Assembly, it would require more work, but it would also substantially increase legislative control over capital budgeting and development.
Staff. In order to assist the Finance and Appropriations Committees in compiling and analyzing the complex data necessary to develop a reliable report and spending limit, and to perform the additional analysis on costs and benefits of various projects, the Legislative Program Review and Investigations Committee recommends that an additional (public finance) analyst position be created in the Office of Fiscal Analysis.
25

"Sunsetting" Project Authorizations
The Program Review and Investigations Committee further recommends that the legislative authorization for projects which have received no favorable action by the Bond Commission within five years after authorization, automatically expire. As projects expired, those that continued to be legislative priorities could be reauthorized in new bond bills.
This mechanism is similar to one passed in 1976, but it goes further in one important way. While the 1976 act provides for a review of authorized projects every five years, the sunset proposal would provide for automatic termination (subject to reauthorization) of those projects having received no Bond Commission support.
It seems clear that authorizing funds for capital projects is a legislative (appropriations) responsibility. To date, the General Assembly has not been able to adequately discharge this responsibility. Implementation of any or all of the above recommendations would strengthen the legislative role in capital budgeting.
26

CHAPTER SIX
Debt Management
Debt Limits Structuring Repayment of Long Term Debt Fiscal Operations


CHAPTER SIX
DEBT MANAGE.HENT
Contemporary debt management is not an exact science. Each state on an individual basis, must determine the level of debt it can afford, and develop a capital construction plan within that limit.
Connecticut, unlike most other states, can create state debt by selling bonds with very little difficulty. Many states have chosen to limit their authority to borrow by either mandating a voter referendum on each issue or requiring an exemption from a constitutional prohibition against long term debt. Only eight states including Connecticut can authorize the sale of bonds by a two-thirds or less majority vote of both houses.
Three aspects of fiscal and debt management are evaluated in developing a credit rating. These are: (1) the total level of debt and its impact on the annual budget; (2) the scheduled retirement or "organization" of outstanding debts; and (3) the state's general fiscal practices.
Connecticut could move toward a restoration of its former triple A rating by pursuing a more aggressive debt management posture. This would necessitate revisions in the General Statutes and avoidance of former practices that were convenient but fiscally unsound.
This chapter reviews some of the factors, which if changed, could help Connecticut regain its former prime rating.
Debt Limits
A majority of states, including Connecticut, use a "debt ceiling" to limit the amount of debt which can be incurred.
The debt limit in Connecticut is set by statute (C.G.S. 3-21) and provides that "no bonds, notes or other evidence of indebtness" may be issued to exceed four-and-one-half times the total tax receipts of the state from the previous year, as certified by the Comptroller. The statute specifically excludes, however, revenue bonds, short term notes, refunded (recalled prior to maturity) bonds and bonds that have guaranteed federal funds earmarked for their retirement. In FY 1975-76, total tax receipts were slightly more than $1.3 billion, yielding a statutory debt limit for FY 1976-77 of $6.1 billion. As of February 28, 1977 the state's net debt subject to the ceiling was $2.3 billion, or less than two times the previous year's tax receipts. Therefore, in spite of Connecticut's already high
27

debt burden (seep. 14), the state legally has a debt margin of $3.8 billion. A debt "ceiling" set so high is of no value in keeping debt to manageable levels. A more meaningful ceiling would be 2 or 2.5 times the previous years tax receipts, which is still higher than our current total indebtedness.
Because the present debt limit (4.5 times the previous year's tax receipts) has clearly been ineffective as a means of keeping state debt within a modest range, the Legislative Program Review and Investigations Committee recommends that section 3-21 of the Connecticut General Statutes be amended to reduce the figure from four-and-one-half to two or two-andone-half times the previous year's tax receipts.
Debt service ceilings. While it is important to contain the total amount of debt, an even greater emphasis should be placed on controlling annual debt service payments which directly impact on the annual budget. In conjunction with other fixed expenditures, large debt service payments contribute to reducing the legislature's ability to adjust spending according to yearly changes in revenue, the increased cost of other prior commitments, and the need to provide new services.
An alternative to the present form of debt ceiling would be a limit on the percentage of the operating budget available for debt service. Such a ceiling would fluctuate in dollar amount as the budget fluctuates but it would limit the state's ability to incur debt beyond some fixed proportion (such as 15%) of annual expenditures.
In fiscal year 1978 approximately two-thirds of Connecticut's budget was committed by prior contract or statute to existing programs or debt service. Excluding self-supporting bonds, debt service accounts for a full 14.6% of the FY 1978 budget, exceeded only by welfare (24.4%} and education (26.8%) . 1
In FY 1978, the state budget grew by 10%, compared to 6.9% for FY 1977 and 4.9% for FY 1976. This rapid increase was caused primarily by large debt service costs and other charges, together with increased appropriations for welfare, education and state employee salaries. Such growth has increased the prospect of a deficit in fiscal year 1978.
Because "fixed costs" have already reduced the General Assembly's control over the budget to a significant extent,
1 1977-78 Governor's Budget, State of Connecticut.
28

and because debt service is the third highest fixed cost in the budget and has been climbing steadily as a percent of the total budget, the Legislative Program Review and Investigations Committee recommends that a debt service ceiling be enacted. Such ceiling should be stated as a maximum allowable percent (such as 15%) of the annual operating budget, and should only be exceeded in times of state emergency, or by an extraordinary (two-thirds) majority vote of both the House of Representatives and the Senate. Further, the ceiling should include all payments necessary to service all outstanding full faith and credit debts of Connecticut net of all short term debt and all self-supporting debt.
Table VI-1 simulates state budget growth rates at 5%, 8%, and 10% per year for the period 1978-88. Debt service commitments already made for that period are shown in the third column, and naturally remain constant for each of the three budget growth rates. The debt service ceiling parameters show how much debt service could be incurred if the ceiling were set at 15%, 13%, 11%, 10%, or 8% of the operating budget, at each of the three projected growth rates.
The table shows that while debt service in 1978 is over 15% of the operating budget, by 1980 the figure could be under 13% even with only a 5% growth in the operating budget, if little additional long term debt were incurred in the meantime.
Structuring Repayment of Long Term Debt
When basic questions such as the amount of total debt to incur, the amount of new debt to incur this year, and the portion of the operating budget to allocate to debt service have been resolved, and the General Assembly has authorized new bond sales, and the Bond Commission has allocated funds to projects, and it is time for the Treasurer to actually sell bonds, other questions arise.
Term or serial? Should the bonds be term or serial bonds, for example? When term bonds are sold, the entire issue matures on the same date and, unless redeemed prior to maturity, will be paid simultaneously. Term bonds issued with a "sinking fund" are considered most secure because the issuer agrees to deposit, according to a regular schedule, a sum of money that when accumulated over the life of the bond is sufficient to repay the debt on its maturity date. Additionally, the sinking fund will generate interest income and help defray the costs of servicing the debt.
29

Table VI-1. Debt service ceiling parameters (all figures are in millions).
Present Debt Debt Service Ceiling Parameters Fiscal Budget with Service Year 5% Growth Cotmnitments 1 15% 13% 11% 10% 8%
1978 $ 1925 $313.5 1979 2021 304.3 $ 303.1 $ 262.7 $222.3 $ 202.1 $ 161.8 1980 2122 269.2 318.3 275.8 233.4 212.2 169.7 1981 2228 260.8 334.2 289.6 240.0 222.8 178.2 1982 2339 252.4 350.8 304.0 257.2 233.9 187.1 1983 2456 208.6 368.4 319.2 270.1 245.6 196.4 1984 2578 201.1 386.7 335.1 283.5 257.3 205.7 1985 2716 193.3 407.4 353.0 298.7 271.6 217.2 1986 2853 185.1 427.9 370.8 313.8 285.3 228.2 1987 2996 174.1 449:4 389.7 329.5 299.6 239.6 1988 3145 158.4 471.7 408.8 345.9 314.5 251.6
Present Debt Debt Service Ceiling Parameters Fiscal Budget with Service Year 8% Growth Commitments 1 15% 13% l1% 10% 8%
1978 $ 1925 $ 313.5 1979 2079 304.3 $ 311.8 $ 270.2 $ 228.6 $ 207.9 $ 166.3 1980 2242 269.2 335.1 291.2 246.6 224.2 179.3 1981 2421 260.8 363.1 314.7 266.3 242.1 193.6 1982 2614 252.4 392.1 339.8 287.5 261.4 209.1 1983 2823 208.6 423.4 368.0 310.5 282.3 225.8 1984 3048 201.1 457.2 396.2 335.2 304.8 243.8 1985 3291 193.3 493.6 427.8 362.0 329.1 263.2 1986 3554 185.1 533.1 462.0 390.0 355.4 284.3 1987 3838 174.1 575.7 498.9 422.1 383.8 307.0 1988 4145 158.4 621.7 538.8 455.9 414.5 331.6
Present Debt Debt Service Ceiling Parameters Fiscal Budget with Service
Year 10% Growth Cotmnitments 1 15% 13% 11% 10%
1978 $ 1925 $313.5 1979 2117 304.3 $317.5 $ 27 5. 2 $ 232.8 $ 211.7 1980 2329 269.2 349.3 302.7 256.1 232.9 1981 2562 260.8 384.3 333.0 281.8 256.2 1982 2818 252.4 422.7 366.3 309.9 281.8 1983 3100 208.6 464.8 402.8 340.8 310.1 1984 3410 201.1 511.3 443.1 374.9 341.0 1985 3750 193.3 562.5 487.5 412.5 375.0 1986 4126 185.1 618.9 536.3 453.8 412.6 1987 4538 174.1 680.7 589.9 499.1 453.8 1988 4992 158.4 748.8 648.9 549.1 499.2
1 Includes self supporting general obligation debt.
Source: Legislative Program Review & Investigations Cotmnittee staff analysis, September 1977.
30
8%
$ 169.3 186.3 204.9 225.4 248.0 272.8 300.0 330.0 363.0 399.3

Serial bonds on the other hand, offer the issuer a variety of options in scheduling repayment of the debt. The state may elect one of three repayment schedule options or any combination. These are:
• Equal Annual Principal Maturity--where equal amounts of the principal are retired each year;
• Level Annual Debt Service--where the sum of the principal and interest payments are approximately equal in each year; and
• Irregular Serial Maturity--where the pattern of re-tirement is arranged to suit the issuer's need.
For issuers active in the bond market, the use of serial bonds is generally a better policy. This is because interest rates on serial bonds are lower, and there is greater flexibility to arrange the maturities. Connecticut has issued both term and serial bonds, although the vast majority have been serials. While not statutorily mandated, state policy has been to use the "equal annual principal maturity" plan for serial issues. The most recent sale of $63,100,000 on April 1977, for example, will mature at the rate of $3,155,000 per year for twenty years. The full annual repayment obligation will be larger, of course, due to interest costs, but will decrease each year.
One example of Connecticut's effective and discriminate use of both term and serial bonds can be seen in the bond issue sold to fund the accumulated deficit at $244,147,475 in June 1971. A special session of the 1971 General Assembly authorized the use of bond revenues to finance the deficit. The state sold $146,000,000 in term bonds due in FY 1982 and $98,000,000 in serial bonds. A sinking fund was established at a local bank, to which $24.4 million is being deposited each year for 10 years to repay the $146 million in 1982, and the serials as they come due.
Although the state made interst payments to bond holders from the General Fund from the date of the sale, the first principal payments on the serial bonds were deferred for three years. The sinking fund thereby accumulated a balance of $73.2 million, which in turn generates interest income from the bank. This revenue is deposited in the General Fund and offsets a portion of the annual debt service payments due on the bonds. In FY 1978, interest income from funds deposited to repay that debt will total approximately $6.4 million.
31

The $98 million in serial bonds matures and is paid from the sinking fund in equal amounts ($14 million per year) over the seven years from FY 1975 to FY 1982. This leaves a net appropriation of $10.4 million per year in the sinking fund for each of the seven years. Therefore in FY 1982 when the $146 million in term bonds become due, the sinking fund will have $73.2 million from the first three years' appropriations and $72.8 million from the last seven years, or $146 million. Further, in 1982 the last outstanding serial will have matured and been retired.
While the use of bond revenues to finance General Fund deficits is in itself a poor practice, this example was given to show how careful long range planning and responsible management of long term debt can minimize the retirement burden and even partially offset the interest costs in an administratively simple and efficient manner.
Life of the bond. Another aspect of scheduling the maturities of bonds is to relate the life of the bond to the useful life of the project being financed. Generally bonds issued to finance a specific project should be retired within the useful life of the project. Some public works projects, however, obviously have very long useful lives. While Connecticut now has a policy limiting long term debt to twenty years or less, it could be more flexible with respect to particular types of projects and possibly derive some long-range financial benefit. School construction bonds could, for example, be issued with 25-year lives and highway construction bonds with 30-year lives. 1 Such a policy would enable the state to spread out the repayment of the debt and reduce the amount of debt service due in any one year. This policy also has the advantage of allowing the state to repay current fixed financial obligations with future (inflated) dollars.
However, the bond market almost always charges a higher interest rate for longer term obligations, and the longer the life
1 Connecticut presently has a $2.4 billion gross general obligation debt. Of this $95.4 million has financed interstate highway projects and $468,225,000 has financed related highway projects such as the Thames River and Greater Hartford Bridges. These bonds all have 20-year maturities, but financed projects with longer useful lives. With respect to transportation projects especially, the 20-year limit has meant that Connecticut has attempted to repay its debt in a substantially shorter time than the useful life of the-projects.
32
of the debt, the more interest would be paid even at the same rate of interest. Therefore, any decision to lengthen the payback period must be carefully assessed. Credit analysts and investors look favorably upon those issuers whose repayment schedule is rapid. There is no doubt that the speed by which Connecticut bonds are scheduled to be retired is considered an asset by both credit rating agencies.
Therefore, while rapidly maturing debt is generally considered a sign of good debt management, flexibility to issue 30-year bonds for very long-range projects could help the state reduce annual debt service costs. Since such an option could be beneficial in limited instances, the General Assembly might consider a change in policy to allow issuance of 30-year bonds. If such a policy were adopted, the following factors should be carefully reviewed before a 30-year bond was issued:
• life of the improvement or project being financed;
• the characteristics of the issuer's outstanding debt, including serial and term maturity dates;
the relative impact of interest costs in short, intermediate and long-run maturities;
allowance for future bond sales in the present debt service pattern;
e the economic prospects of the issuer; and
e the state of the market in which the bonds will be sold.
Fiscal Operations
Connecticut is presently one of only three state that has no statutory or constitutional constraints against operating deficits (see Table VI-2).
Contrary to what one might expect, the absence of a legal requirement that the Governor balance the operating budget is considered an asset by the investment services. Their belief is that when the economy is on a downswing and revenues are declining or stablized, governments without restrictions have greater flexibility to avoid a potential deficit.
On the other hand, the lack of budgetary constraints may be considered a liability when budget practices are questionable.
33

Table VI-2. Limitations on State deficits: summary.
Number of States with deficit limitations
which are
Type of provision t'
Prohibitive Constraining only Total
Constitutional 1
Statutory only None
33 6
6 39 2 8
3
TOTAL 8 50
1 Ten States cited both constitutional and statutory provisions.
Source: Council of State Governments, Limitations on State Deficits, April, 1976, p. 4.
At the time Moody's Investment Service downgraded Connecticut from AAA to AA, it rated the state's financial factors as fair (-). In subsequent opinions by Moody's and Standard and Poor's, Connecticut's financial practices were consistently mentioned as "weak."
The two practices most often criticized are
(1) the funding of annual operating deficits with long term bonds, and
(2) the accrual of income but not expenses.
In addition, the circumvention of C.G.S. Sec. 3-22 regarding the use of budget surpluses and lack of a stable tax base, support the belief that Connecticut's fiscal policies are indeed weak.
Financing budget deficits. Although the manner by which the 1968 to 1971 deficit was bonded can be considered an effective use of debt management options (described on pp. 31-32), the issuance of long term debt for a current expense is nevertheless a poor fiscal practice. Not only did Connecticut use bond revenues to finance the 1968-1971 deficits, but the 1975 deficit of $70,852,000 was funded by the issuance of $70,850,000 in short term obligations.
34

These are being retired in three installments in the fiscal years 1977, 1978 and 1979 at a total interest cost of $6.9 million.
Similarly, the sale of bonds as a means of funding the operating costs of a program or agency in a given year is tantamount to financing a deficit with bond revenues. In 1969 the state used $SS,OOO,OOO in bond revenues to pay the operating expenses of three program within the Department of Community Affairs and to meet the state's financial obligation to the Teachers' Retirement Fund. In each instance, the state had created a long term financial obligation to pay for a current expense. Further, even at modest interest rates, utilization of bond revenues for current expenses increases the cost of providing these services by as much as 50%.
Inappropriate reliance on use of bond revenues can, over time, result in more severe financial problems. For example, in 1975, at the peak of the New York City financial crisis, it was discovered that the City had been deriving up to $700 million in annual operating funds from bonds sold under the City's capital budget authorizations. In response to this practice, the Comptroller General of the United State noted in April 1977 that "Capital budget borrowings should only be used to finance long-range municipal capital improvement projects."
The Legislative Program Review and Investigations Committee believes that long term debt should only be used for capital projects and therefore recommends that the General Assembly enact legislation that would prohibit the use of bond revenues to fund annual operating expenses or deficits.
Accrual of revenue. Connecticut completed fiscal year 1976 with a surplus of $34.7 million. While this might appear to be the result of prudent fiscal management, a major part of the surplus derived from a change in accounting procedures that enabled the state to accrue revenues in the twelfth month of FY 1976 which would have otherwise been counted as income in the first month of FY 1977. This accounted for $27.5 million of the $34.7 million "surplus" as follows:
$20.4 million - gasoline, cigarette and alcoholic beverage taxes
7. 1 million - federal revenue sharing rronies, due June 30, but paid in July
$27.5 million
35
In addition, $5.2 million was transferred from four separate funds, the Banking Fund, the Real Estate Guaranty Fund, the Highway Right-of-~vay Fund, and the Boating Fund, to the General Fund.
The accrual of taxes to one fiscal year which were actually received in the next fiscal year is significantly different in impact than accelerating tax collection schedules to improve cash flow. By accelerating collection of the sales tax from a quarterly to a monthly basis, the state was able to reduce interest costs on temporary notes by an estimated $1.3 million. In the case of accruing revenues, the state has the one-time use of 13 months of revenue to pay for 12 months 1 costs (because liabilities are recorded on a cash basis of accounting).
The Gengras Commission, appointed by Governor Grasso and mandated to develop a plan for more effective financial management, commented on this practice in its May 1977 report:
The rrodified cash accmmting method does not treat revenues and expenses consistently; the method of recognizing revenue may not be applied consistently to all categories of revenue; logical foundations have not been established to support the method; and the meth:::xi has not been documented in accounting literature and has not received authoritative support.
The Legislative Program Review and Investigations Committee supports the conclusions of the Gengras Commission with respect to the need for consistent use of the accrual method of accounting, and therefore recommends that serious consideration be given to also shifting expenditures to this method.
Surpluses. Connecticut is often criticized for manipulating revenues to meet expenditures. From July 1, 1971 to April 1, 1975, the state's sales tax rate was changed six times. It is presently 7%, and the highest in the nation. Each time the rate was lowered or raised it was with the belief that the tax '.vould then generate enough income to meet the current year's anticipated expenses. However, as Figure VI-1 demonstrates this form of revenue estimating is susceptible to extreme variances as shown by the FY 1974 surplus of $49.1 million and the FY 1975 deficit of $70.8 million.
Except for FY 1975, the state has ended each of the last five fiscal years with a budget surplus. Section 3-22 of the General Statutes mandates that any surplus in excess of $1 million, certified by the Comptroller, shall be deposited in a Bond Retirement Fund and be used to retire an equal amount of outstanding debt.
36

Figure VI-1. General Fund year end balances for FY 1971-77.
Dollars
(10UUoos; 25J '" '"
L u s
'"
I
Fiscal Ye~trs
Source: LPR&IC staff analysis, August 1977.
Recent practices have demonstrated that the intent of this law is being circumvented. Whereas in FY 1966, 1967, 1968 and 1969 the state did follow the statute, in fiscal 1972, 1973, 1974 and 1978, special provisions in the Appropriations Act allowed the Governor to use the surpluses to supplement the General Fund appropriation necessary for debt service. This made it appear that the surpluses were being used for retiring debt, when it only freed General Fund monies that otherwise would have been required for debt service. In fiscal year 1978, the surplus applied to debt service rather than early retirement of principal, will total $58. 2 million.
Manipulation of the Bond Retirement Fund and constantly changing tax rates, again, points out the inherent weaknesses in Connecticut's fiscal operations. The State Auditors, in their 1977 annual report to the General Assembly, noted, with respect to budget surpluses, that:
OUr understanding of the intent of this legislation was to preclude the application of surplus as General
37

Fund revenue in the succeeding year. However, by using the Bond Retiranent Fund to meet costs of bonded indebtedness maturing in the succeeding year, the Executive and the General Assembly on a number of occasions have in effect circumvented the intent of the law.
The use of a surplus to call in or redeem existing debt is a desirable practice. However, the manipulative use of the Bond Retirement Fund is not. The Legislative Program Review and Investigations Committee therefore recommends that Section 3-22 of the General Statutes be repealed and that legislation mandating the use of budget surpluses be restricted to funding deficits (deposited in a "budget stabilization fund") or redeeming bonds that are not scheduled to mature in the current or following fiscal year.
3B

CHAPTER SEVEN
Capital Planning
Planning in Connecticut, 1955-75 PA 75-425 Strengthens the Process Planning under the Executive Reorganization The Capital Budget and the Operating Budget Forecasting Cash Demands


CHAPTER SEVEN
CAPITAL PLANNING
A comprehensive planning capability for capital projects is necessary for the proper management of state debt. Without proper planning, forecasting, and coordination, capital development can create undue financial burdens on the state.
Capital Planning in Connecticut, 1955-75
Prior to 1975 very little central planning for capital construction was performed in Connecticut. From 1955 to 1972 the Building Program Commission recommended to the Governor and General Assembly, each biennium, a list of projects deemed necessary and fiscally responsible. These recommendations were only advisory, however, and often went unheeded.
The Public School Construction Program. An example of one capital construction program undertaken without full awareness of the long run implications, was the public school construction program. During 1969, in an effort to aid financially strained towns, the legislature enacted PA 751, which mandated the state to finance the construction of local schools. Towns were required to repay half of the costs over the life of the bonds, in the form of 50% of the debt service due each year. This meant that the State had to borrow funds for the full construction costs for all towns building new schools, whereas prior to 1969 the towns had to take on that large debt with the State reimbursing 50% of the annual debt service costs to each town. Since the State's credit rating in 1969 was significantly better than most towns, PA 751 was expected to reduce the finance charges associated with school construction.
From its inception, PA 69-751 met with difficulties. First, it did not differentiate between towns with severe financial need and those not so strained. Second, the Department of Education was statutorily bound to review plans only for compliance with safety and health codes. If a town submitted plans that were in excess of legitimate need, but met all the necessary regulations, approval could not be denied. Finally, there was a lack of adequate statewide information on projects planned and under way.
A number of steps were taken in 1971 to reduce the state's rapidly increasing liability while retaining for the towns some of the advantages PA 751 had promised. First, the towns would be required to finance (borrow by issuing bonds) their 50% of a project from the start. The State would contribute the other half of construction costs and each would pay its own debt service costs.
39

Second, any town that sold bonds to finance school construction and had to pay more than a 4% rate of interest could receive a subsidy from the State for the amount of interest over 4% but less than six percent.
While the General Assembly had authorized fixed amounts for school construction, by 1975 it became apparent that the Department of Education had approved plans for projects totaling more than the statutory authorizations. The result was a moratorium on school construction in effect from 1975 to the passage of PA 76-418. This Act contained a final authorization of $90 million to complete initiated projects. Table VII-1 lists the authorizations, totaling $504 million, made by the General Assembly to fulfill the state's school construction obligations during the 1969-76 period.
Table VII-1. Bond authorizations for school construction.
Year 1969 1971 1972 1973 1976
TOTAL
Authorization $160,120,000
156,755,000 1
77,125,000 20,000,000 90,000,000
$504,000,000
1 In 1971, the General Assembly originally authorized $81,755,000 but in a special session in June another $75,000,000 was authorized.
Source: Department of Finance and Control, Budget Division, May 1977.
PA 76-418 also returned the State to the pre-1969 method of funding school construction. That is, construction costs must be borrowed by the towns and the State reimburses the towns for 50% of the annual debt service due. Further, only projects which had plans approved for state assistance prior to October 1975 remain eligible for the interest subsidy. Public Act 76-418 also gives the state a variety of mechanisms for controlling the projects that do get funded.
First, it gave the Department of Education authority to refuse or modify plans.
40

Second, it instituted a prioritizing system where school projects are ranked according to factors such as the town's ability to pay for improvements, and the age, condition, and enrollment of the town's schools. A project may then be rated as:
Education Need 1 - project to meet m:mdatory instructional standards;
Education Need 2 - project to meet school accreditation standards, or provide supportive services; and
Education Need 3 - project to expand, enhance or enrich existing school offerings.
Third, PA 76-418 also created a legislative Committee on School Construction to review the Act's regulations and annually approve or modify the proposed construction list. For 1977, the Committee approved a prioritized list of projects totaling $87,796,321. The State will pay an estimated $1,027,268 in principal and interest costs for these projects during the first year and approximately $6 million per year when all the projects are completed.
As Table VII-2 shows, this will drop the state's costs for school construction to about one-seventh of its average costs for the period FY 1973-77. However, if the present level of new authorizations continues (i.e., about $90 million per year), in ten years the state's obligation will have accumulated to approximately $53 million in annual payments to towns for school construction.
Table VII-2. State payments for school construction 1969-1976.
1 Estimated
Year 1969-70 1970-71 1971-72 1972-73 1973-74 1974-75 1975-76 1976-77
TOTAL
Payment $160,120,000
67,013,200 62,060,095 43,333,314 48,172,989 32,340,848 45,768,000 ll0,000,000 1
$498,808,446
Source: Department of Education, School Construction Division.
41

To aid the Committee on School Construction in determining an appropriate yearly level of school construction, it is recommended that the annual report on affordable debt (recommended on p. 25) contain an analysis of the impact of various levels of new school construction subsidies on the state's financial position in the current year and over the next 10 years. The addition of this section to the debt report will further help the General Assembly to maintain control over its long term debt obligations.
PA 75-425 Strengthens the Process
In 1975, the General Assembly significantly strengthened the long range planning and approval process for capital projects. Long range capital planning was assigned to the Department of Public Works, and the Commissioner of Public Works was designated the sole state agent for purchasing or contracting for real estate and for accepting and reviewing bids for individual projects (PA 75-425). In addition, a Properties Review Board was created, composed of six persons selected for their expertise in construction, architecture, engineering and property management.
State agencies were required to submit any requests for real estate, describing the amount of space and the desired geographical location, to the Commissioner of Public Works and the Properties Review Board. The Commissioner is required to analyze the need, cost and feasibility of rental versus acquisition, prior to approving the request.
The Commissioner's decision on each request is forwarded to the Properties Review Board for approval or denial. This process provides a mechanism whereby the capital needs of the state can be expertly evaluated for need and cost. Projects rejected by the Board may be appealed to the Governor.
Long range planning. Public Act 75-425 also initiated a process by which long range capital plans are to be developed, updated and coordinated statewide. Each agency was mandated to submit plans detailing its long range capital needs to the Department of Public Works by December 1975. The Commissioner was to review and coordinate these plans to determine aggregate needs and priorities statewide.
Of the 212 state agencies required to submit long range plans in 1975, only 46 did so. Further, the format and content of the reports varied considerably, some containing substantial information and others very little.
For effective long range capital planning to take place, each agency must assume responsibility for providing timely and adequate
42

information. Further, each agency should relate long range capital plans to specific program goals so that capital requests can be evaluated and prioritized for program impact. When agency capital requests refer only vaguely to ambiguous program goals, neither the Governor nor the General Assembly has adequate information on which to base allocation decisions.
The Legislative Program Review and Investigations Committee therefore recommends that the Department of Public Works (or its successor) develop a comprehensive format for the submission of long range plans which specifically requires each agency to precisely relate its capital plans to its program goals.
Capital Planning under Executive Reorganization
The Reorganization Act of 1977 will eliminate the Department of Public Works and transfer its planning and review responsibilities under PA 75-425 to the Department of Administrative Services on October 1, 1977. The Properties Review Board will become part of the Office of Policy and Management, also on October 1, 1977.
All agencies will be required to submit their capital needs, projected for at least three years and updated annually, to the Secretary of the Office of Policy and Management {OPM) and the Commissioner of Administrative Services. The Commissioner of Administrative Services will review the cost estimates of each project and the technical feasibility of each plan. The Secretary of OPM will review and coordinate agency requests and formulate a statewide master plan for capital development. This process is expected to further improve the evaluation of capital requests.
The development of a capital projects master plan, updated annually, is essential to insure that the state's capital needs are carefully anticipated and evaluated. The Legislative Program Review and Investigations Committee further suggests that longer range plans in which each agency attempts to project its needs over five and even ten year periods be seriously considered.
The ease and effectiveness of long range planning can be increased if each agency submits its plans in a uniform manner and projected over a significant period of time. Since many capital projects become "permanent" fixtures, it makes good sense to assess a project proposal for its long range, as well as its immediate, impact and utility.
Capital Budgeting and the Operating Budget
As previously discussed, bonding for capital construction affects the state budget through annual debt service payments.
43

In addition, capital projects that require new staff and other operating expenses place new strains on the General Fund and compete with other services and programs. Capital budgeting should therefore be integrated and coordinated with the operating budget to determine the full effect of new construction.
Presently, an agency request for a capital project must be submitted on a form (B-100) specifying the project's purpose, the amount of state and federal funds involved, and any expected increases in the agency's operating costs. However, this information has been too limited in scope and detail to be of use for planning purposes.
Under the 1977 Executive Reorganization Act, each agency will be required to submit its updated long range (3-year) plan in conjunction with its annual operating budget request. There is no requirement, however, that the agency project the fiscal impact new construction will have on its operating budget. The Legislative Program Review and Investigations Committee therefOre recommends that the Office of Policy and Management develop a comprehensive format for agency operating budget requests which identifies estimated increases resulting from new or proposed construction. By expanding the operating budget requirement and coordinating it with an agency's long range capital needs, a more meaningful basis for estimating the full fiscal impact of a project will be created. This will also facilitate the determination of a yearly affordable level of new bond issues and the prioritization of projects within that limit.
Forecasting Cash Demands
Capital projects also affect the periodic demand for funds during the fiscal year. The Department of Finance and Control is developing a computer model to forecast the periodic cash needs of the state. Among other things, the model will be able to determine the funds required to continue capital construction in the short run. Also, since the state sells bonds only when it needs cash, any planning tool that can help predict the periodic need for funds would be an asset in determining when to enter the market. Utilization of budgeting tools such as this can play an important role in managing the state's finances.
The Program Review and Investigations Committee therefore recommends that the Department of Finance and Control move as rapidly as vossible to fully develop this valuable forecasting capability. This model could aid in holding down debt service
1 Preliminary estimates of the cost to develop the model range from $7000 to $9000. This includes all necessary computer time and the use of a full-time programmer for 3 to 4 months.
44

costs by enabling the state to anticipate when it will be required to sell bonds. 1 Increasing the ability to monitor cash flow requirements also results in more comprehensive control of the state's finances.
1 In February of 1975, interest rates on 20-year prime grade bonds averaged 6%. This increased to 6.4% by June and to 6.75% by October.
45


APPENDICES


Appendix I-1
GLOSSARY
Bid - the rate of interest a buyer agrees to accept for the use of his capital when purchasing a bond.
Credit Rating - the opinion of a professional service on the credit worthiness of an issuer.
Debt Retirement - the process of paying off the bonds as they come due.
Debt Service - the total amount of money expended for principal and interest payments, in a period of time, to maintain an issuer's outstanding debts.
Discount - the amount, if any, by which the par value exceeds the price.
Face Value - the amount of money due at maturity.
Full Faith and Credit - term used to denote an issuing government's pledge to use its taxing powers to guarantee repayment of the debt.
General Obligation Bonds - a municipal bond secured by the issuer's full faith and credit (taxing power).
Interest Coupon - a detachable certificate on the bond stating the interest payable on a specific date.
Investor Service Agency - financial corporations who rate (evaluate) the credit worthiness of bond issuers.
Long Term Debt - any financial obligation to repay a sum of money over a period of more than one year (typically 10, 15, or 20 years) .
Market Rating - the interest rate at which bonds are actually sold, reflecting the level of investor confidence in the issuer.
Moral Obligation Bond - a (self-liquidating) bond secured with project revenues and the issuer's "moral" pledge to make up any deficiency. The pledge is considered evidence of good faith, but is not legally binding.
Municipal Bond - a bond issued by a state or local government, including special districts and school districts.
46

Appendix I -1 continued
Notes - a debt maturing in one year or less.
Par Value - the amount of money due at maturity; same as face value, and principal value.
Premium - the amount, if any, by which the price exceeds the par value.
Principal Value - the amount of money due at maturity.
Secondary Market - the general market in which daily sales of bonds are made to individual investors, also known as the trading market.
Serial Bond - a bond issue where individual bonds mature annually or semi-annually over a period of years.
Sinking Fund - a fund into which deposits are made to ensure the retirement of a debt.
Term Bond - a bond issue where all the individual bonds mature on one date.
47

Appendix II-1
Taxable Bond Option
To assist states and localities in managing their bonded indebtedness, a variety of creative techniques have been developed. Some of these center on making bonds more attractive to prospective buyers, others focus on reducing debt service costs. One such innovation is to make municipal bonds, taxable, thereby increasing their appeal to investors seeking a taxable investment.
The tax-free status of municipal bonds is considered the major benefit accruing to bond holders. However, many large institutional investors such as pension funds, insurance companies and charitable organizations are usually taxed at special rates that allow them to earn more by purchasing taxable investments. For this reason many such investors avoid tax-free investments and the number of potential purchasers of state bonds is reduced accordingly.
In 1976 the House V.7ays and ~1eans Committee introduced a resolution (HR 12774) which would have given state and local governments the option of issuing taxable bonds. Each state would be permitted to decide, prior to the sale, whether or not the interest income from their bonds would be subject to the federal income tax. The Treasury Department estimates that approximately 16% of the issuers would elect the taxable bond option.
Because taxable investments require higher rates of return to compensate for the tax, the bill required the federal government to pay 35% of the interest cost to the issuer for the higher interest payments it would make. However, despite the interest subsidy, the federal government expects an increase in revenues from the taxable bonds, estimated to be between $600 million and $1,200 million annually.
Supporters of HR 12774 believe that this option will broaden the appeal and increase the demand for municipal bonds. Opponents believe that this could lead to the decline of tax-free bonds and that the federal government might reduce the subsidy making the option no longer attractive to either the issuer or investor. Although the bill failed in the 1976 session, it has been reintroduced in 1977 by Senator Kennedy.
48

Appendix II-2
Direct General Obligation lndebtedness(a) Principal Amount Outstanding as of February 28, 1977
General State Purposes .............................•..•••••••. ·• • Includes Higher Education and Vocational Education Facilities,
Health and Hospitals, State Buildings, Parks and Open Spaces Local School Construction Grants ............................•..... Local Water Pollution Control Grants· ............•................. Interstate Highways .. .. ..... . .........................••...•• •• • Other Highway Purposes ................................••...••.•
Including Thames River and Greater Hartford Bridges Transportation and Mass Transportation Facilities .................. . General Obligation (Deficit Funding) ..........................•... Veterans Bonus ...............................................•. State College Auxiliary Services ..........................•........ University of Connecticut Auxiliary Services .......................• Rental Housing ................................................ . Teachers' Retirement ...........................................• Greenwich-Killingly Expressway ............... .... ...... . ....... . Other, includes Housing for the Elderly and Municipal Redevelopment .. Long-Term Debt-Total ........................................• Short-Term Debt(g) .........................•.........•....••.• GROSS DIRECT DEBT •...•..•.......••••.•••.••..••.••.•••••••••••
Deduct:
State College Auxiliary Services(b) .......................••.. University of Connecticut Auxiliary Services(b) .............•... Greenwich-Killingly Expressway( c) ...............••....•....• General Obligation (Deficit Funding) Sinking Fund (d) .....•....• Rental Housing Sinking Fund( e) ............................ . Various Other(£) ......................................••••• Tax Anticipation Notes(g) .....................•.....•••...•• Interstate Highways(h) ...............................•.•.... Water Pollution Control(i) ..........•..........•......•..•..• Bond Retirement Fund (j) ................................... . Deductions--Total ...................••••••...••.•••••••• , , ,
NET DIRECT DEBT .••...••......•••••••••••••••••••••••••••••••••
$ 492,800,000
333,300,000 174,850,000 95,470,000
468,225,000
52,700,000 263,200,000
11,000,000 25,205,000 18,355,760 88,400,000 37,650,000 77,760,000
102,396,240 2,241,312,000
150,000,000 2,391,312,000
25,205,000 18,355,760 77,760,000 83,616,026 6,822,735 8,285,000
150,000,000 12,161,000 42,092,385 34,128,912
458,426,818 $1,932,885,182
(a) The table does not include soch limited or contingent liabilities of the State more particularly described under "Bond Authorizations on which the State has Limited or Contingent Liability" or the following obligations which, although not in the form of bonds and notes, constitute, in the opinion of the State Auditors, long-term indebtedness of the State:
Obligations of the State to towns for participation in the construction and alteration of school buildings, in the amount of $87.~,575 (aggregate installment payments) and in the amount of $19,926,415 (aggregate interest subsidy) . See "Expenditures Required by Contract or Statute" and Table 16, second and third paragraphs of footnote (b) ; and
The obligation of the State to members of the State Employees' Retirement Fund to protect their vested interest in the Fund. (At June 30, 1976, total resources of the Fund exceeded employees' equity by $437,499.) See "State Employees' Retirement Fund".
49

Appendix II-2 continued
(b) Considered self-liquidating. The proceeds of such bonds have been used to build dormitories, dining facilities, student centers .and related facilities for the State College System and the University of Connecticut, respectively. Student fees. other than tuition, for use of such projects, are deposited into working capital funds and are used for the operation of such facilities and for deposit annually into a sinking fund maintained by the Treasurer for payment of debt service on such bonds. During fiscal year 1977 and in all prior years that such bonds have been outstanding, no monies from the General Fund have been necessary to pay debt service. However, it should be noted that there are annual appropriations from the General Fund for the general support of the State College System and the University to supplement the in-State and out-of-State student tuition and other fees.
(c) Although general obligation bonds, self-liquidating from the tolls and concession rentals received from operation of the Connecticut Expressway. For complete discussion of the full financing of such expressway including expressway revenue and motor fuels tax bonds issued therefor, see "Expressway Bonds."
(d) The State has established a contractual trust fund with bondholders in connection with the issuance of term bonds into which the State is required to make equal annual sinking fund installments for payment of the term bonds at maturity in June, 1982. As of February 28, 1977, all required payments to that date had been made, resulting in a pledged fund balance, the amount of which has been deducted.
(e) The State has established a contractual trust fund with the bondholders in which there is a pledged fund balance, the amount of which has been deducted.
(f) Self-liquidating from various fees and charges under Working Capital Funds arrangements.
(g) $100,000,000 will mature April 15, 1977; $50,000,000 will mature June 30, 1977. See "Temporary Borrowing." Certain other obligations of one to three-year maturities, technically denominated notes, have been treated as bonds and have not been deducted for the purpose of arriving at net direct debt.
(h) In connection with the construction of the interstate highway system in Connecticut, the State issued bonds to pre-finance the federal share (payable out of the federal highway trust fund) which share is equal to 86% of the cost thereof. The federal monies have been regularly received substantially as anticipated. As of February 28, 1977, the sum of the remaining federal amount receivable and .the fund balance was $12,161,00\J, which is the amount of bonds deducted.
(i) In connection with the municipal construction of water pollution control facilities, the State issued bonds to finance grants for such .purpose to the municipalities and to pre-finance the federal share which was equal to 5'5% of the cost thereof. By contract with the municipalities, the State has been receiving the federal reimbursement regularly. As of February 28, 1977, the sum of the remaining federal amount receivable and the fund balance was $42,092,385, which is the amount. of bonds deducted.
(j) This amount represents the surplus reported by the Comptroller for the fiscal year ended June 30, 1976 in excess of $1,000,000, transferred to the Bond Retirement Fund in accordance with Section 3-22 of the General Statutes and is expected to be applied to debt service for fisca11977-1978.
50

Appendix III-1
Unemployment in Connecticut and the u • s • 1 1960-76
Annual Change3 in Annual Average Total Conn. Nonagricultural Unemployment Nonagricultural Establishments
Rates (b) Establishments Employm~nt~--Empkyment
u.s. Conn. (Thousands) u.s. Conn. -----1960 • I I I 0 I I e I I I I I I I I I I I I 5.5% 5.6'/'o 915.4 1.7% 1.9% 1961 o I I I I I I I I I I I o I I I 0 I It I 6.7 6.7 922.6 ~.4 0.8 1962 I I I I I 0 I I I .0 I I I 0 I I I 111 5.5 5.1 949.8 2.9 2.9 1963 I o I I I I o o I o I I o o 1 I I I 11 5.7 4.9 969.3 2.0 2.0 1964 .................... 5.2 4.7 991.2 2.9 2.3 1965 .................... 4.5 3.9 1032.9 4.3 4.2 1966 .................... 3.8 3.2 1095.4 5.2 6.1 1967 .................. '. 3.8 3.4 1130.1 3.0 3.2 1968 .................... 3.6 3.8 1158.0 3.2 2.5 1%9 .................... 3.5 3.8 1194.1 3.7 3.1 1970 I I I I I I I I I I I I 0 I I I I I I I 4.9 5.6 1197.5 0.7 0.3 1971 .................... 5.9 8.9 1164.3 0.4 -2.8 1972 ..... ' .............. 5.6 8.2 1189.6 3.5 2.2 197.~ I I I I I I I I I I I I 0 0 I I I I I I 4.9 5.7 1237.9 4.3 4.1 1974 I I I I I I o o I I I I I I I I I II I 5.6 6.2 1264.1 2.0 2.1 1975 I I I I I I .. I I I I I I I I I I I If 8.5 10.1 1220.4 -1.7 --3.5 1976 I I I •••••• I. t. I 0 ••• t 1 7.7 2.5 N.A. 3.1 N.A.
(a) Percentages derived. (b) Unemployment rates are seasonally unadjusted and are eleven month averages,
January through November. N.A.=Not available.
United States Deparbnent of Labor, Bureau of Labor Statistics, Employrrent and Earnings, States and Areas 1939-74, ~1ang::>wer Reg::>rt of the President for 1969, 1974 and 1975; EmplQYIDei1t and Training Report of the President for 1976; EhlPlovment and Earnings, May, 1976, February, 1977; and unpublished 1976 data for Connecticut.
Source: "Official Statement," State of Connecticut, April 15, 1977.
51
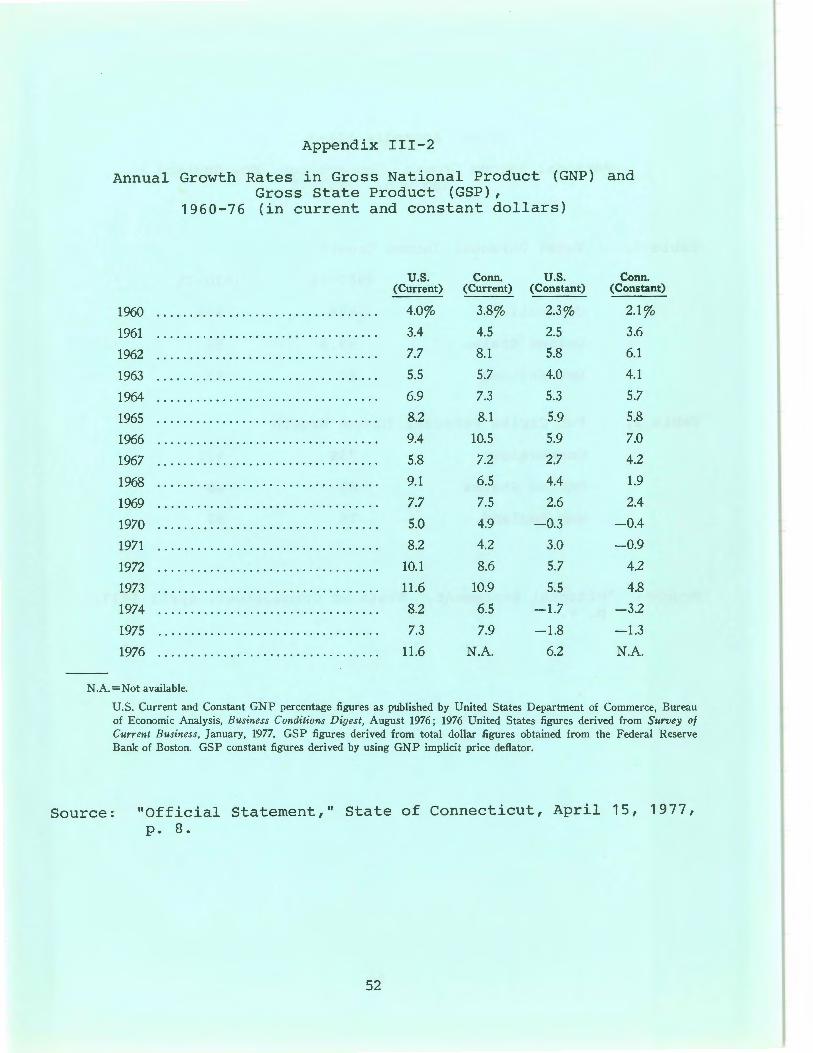
Appendix III-2
Annual Growth Rates in Gross National Product (GNP) and Gross State Product (GSP) ,
1960-76 (in current and constant dollars)
u.s. Conn. u.s. Conn. (Current) (Current) (Constant) (Constant)
1960 • 0 0 0. 0 • •• • • • 0 • •• •• •• 0. 0 • • • • • 0 •• • 0. 4.0% 3.8% 2.3% 2.1%
1961 •• •• •••• ••• • 0 •• •• 0 •••• • • • 0 • • • 0 0. 0 0 3.4 4.5 2.5 3.6
1962 •• 0 ••• ••• • • 0 0 0 • • •• • • •• •• • 0 ••••• • 0 . 7.7 8.1 5.8 6.1
1963 • 0 •• 0 0 • • •• 0 • • 0 •• 0 • • •• 0 •• 0 • • • • 0 0 •• 0 5.5 5.7 4.0 4.1
1964 • ••• 0 0 • •• • 0 •• 0 • • • 0 . 0 • • • 0 • • 0 . 0 •• • 0. 6.9 7.3 5.3 5.7
1965 ••• 0 0 •• •• 0 • ••• 0 •• 0. 0. 0 . 0 •••• • 0 •• •• 8.2 8.1 5.9 5.8
1966 • 0 ••••• 0 •• • ••• • •• • • •• •••• 0 • • 0 ••• 0 • 9.4 10.5 5.9 7.0
1967 • 0 ••• •• 0 0. 0 0 0 . 0 • •• 0 0 0 • •••• • • 0 . 0 . 0. 5.8 7.2 2.7 4.2
1968 • • 0 0 0 ••• 0 •• • ••••• 0 ••• 0. 0 ••••• • 0 . 0 0 9.1 6.5 4.4 1.9
1969 • • 0 0 ••• 0 •••• • ••• • 0 • • • • •• •• • • • 0 •••• 7.7 7.5 2.6 2.4
1970 0 •••• 0 • ••• •• • • 0 •• •• •• 0 •• • • • • • 0 0 •• 0 5.0 4.9 -0.3 -0.4
1971 •• 0 0 •• • 0 ••••••• • • • • • • • • • 0 0 . 0 •• • • 0 . 8.2 4.2 3.0 -0.9
1972 •• • •• •• 0 •••• • 0 •• •• 0 ••• 0 0 • • • . 0. 0 . 0. 10.1 8.6 5.7 4.2
1973 • • • • • • 0 • • •• • 0 • • • • • 0 •• 0 • ••• • 0 ••• 0 0 • 11.6 10.9 5.5 4.8
1974 • 0 0 0 . 0 •• 0 0 0 ••• 0 •••• • • • 0 0 • • ••• •• • •• 8.2 6.5 -1.7 -3.2
1975 0 • ••••• •••••• • ••• • • •• • • • • • • •••• ••• 7.3 7.9 -1.8 -1.3
1976 .. . . . .. ... . . .. ...... .. . . ... . . .. .. 11.6 N.A. 6.2 N.A.
N.A.=Not available.
U.S. Current and Constant GNP percentage figures as P'l.lblished by United States Department of Commerce, Bureau of Economic Analysis, Business Conditions Digest, August 1976 ; 1976 United States figures derived from Survey of Current Business, January, 1977. GSP figures derived from total dollar figures obtained from the Federal Reserve Bank of Boston. GSP constant figures derived by using GNP implicit price deflator.
Source : "Official Statement," State of Connecticut, April 15, 1977, p . 8.
52

Table 1.
Table 2.
Appendix III-3
Personal Income Growth, Connecticut, New England and U.S., 1967- 75
Total Personal Income Growth
1967-75 1970-75
Connecticut 82% 4 L~%
United States 99.8 56
New England 86 45
Per Capita Personal Income Growth
Connecticut 73% 42 %
United States 85 49
New England 76 42
Source: "Official Statement," State of Connecticut, April 1977, p. 4.
53

Appendix III-4
State Revenue Sources: Connecticut and the National Average, 1975
Total United States, 1975 State Taxes
Connecticut State Taxes, 1975 Total $\058.9 million
Total $80,141.3 million
Property
I.e%
I Inheritance I.e%
General Sales 30.9%
Selective Sales
I e. 9%
Inheritance lf.lf%
Corporation2
24. 3%
Individual Income I. 3%
General Sales lf 0. 2%
2 2. 9%
2 Corporation revenues are from corporation net income taxes, and the insurance and public utility selective sales taxes.
Source: Financing Fiscal Reform in Connecticut, Federal Reserve Bank of Boston, December 1976, Research Report 60, p. 98.
54


PUBLrCATIONS LIST
Environmental
Issues
