bonding and coupling of cl fragments on metal surfaces
TRANSCRIPT

J . Am. Chem. SOC. 1988, 110,149-114 149
Bonding and Coupling of Cl Fragments on Metal Surfaces
Chong Zheng,t*t Yitzhak Apeloig,I and Roald Hoffmann*t
Contribution from the Departments of Chemistry and Materials Science Center, Cornell University, Ithaca, New York 14853, and Technion- Israel Institute of Technology, Haifa 32000, Israel. Received September 3, 1986
Abstract: The bonding of CH3, CH,, and CH fragments to Ti(0001), Cr(1 lo), and Co(OOO1) metal surfaces is examined with extended Hiickel band calculations on twedimensional slabs of metal and adsorbate. A local chemical viewpoint is sought through fragment analyses, decompositions of the density of states, and overlap population studies. All fragments tend to restore their missing C-H bonds when bound to these surfaces-CH3 prefers the on-top, CH2 the bridging, and CH the capping geometry. CH, anchors more strongly to the on-top site of a metal surface of higher d band filling since the antibonding feature at the top of the d band destabilizes sites of higher coordination. Similar conclusions hold for other fragments. Thus, the mobility of these fragments is reduced on metal surfaces of higher d band filling. The mobility patterns of CH3, CH2, and CH are examined. In general, on the way to products there are barriers to migration on the surface, a proximity or crowding effect which makes it costly for two fragments to approach on the surface, a barrier, small or large, to the reaction with each other, and finally a desorption barrier. When two C1 fragments couple, the C-C us orbital rises from below the Fermi level. It is initially filled and then empties as the reaction proceeds. Hence the lower the Fermi level (for metals at the right side of the transition series) the smaller the reaction barrier. The theoretically expected decrease of the mobility of the organic fragments on one hand and the higher coupling rate on the other, as the metal is changed from the left to the right side in the Periodic Table, may be two of many reasons that are responsible for metals in the middle of the transition series having higher reactivity in Fischer-Tropsch catalysis.
The Fischer-Tropsch (FT) synthesis, which can be defined as the reductive oligomerization of carbon monoxide over a heter- ogeneous catalyst (eq l ) , was described nearly 60 years ago.’,2 Because of the great technological importance of this reaction much effort, especially during the last two decades, has been devoted to the elucidation of its mechanism.’-3 Although the subject still continues to be strongly debated: the accumulated
Cata lyst n C O + m H P * Cx Hy 0,
evidence suggests that under conditions that lead to oxygen-free products (Le., z = 0 in eq 1) the FT reaction proceeds via the “carbide/methylene” mechanism,’-3 which is drawn schematically in Scheme I. Under these conditions, the major products are a-olefins and hydrocarbons, and the oxygen ends up primarily as water, along with some oxygenated products.
The carbide/carbene mechanism was first suggested by Fischer and Tropsch themselves as early as 1926: and it was re-introduced with additional details by Craxford and Rideal.3 According to this mechanism carbon monoxide is first adsorbed and then dissociates on the metal surface to give “surface carbides” (step 1, Scheme I), which are then hydrogenated to give surface-bonded methylene and methyl fragments (step 2). The oligomerization of these metal-bonded fragments (step 3) is followed by a ter- mination step such as a @-elimination (step 4), which followed by desorption yields the final products.’
The most extensive and convincing support for the carbide/ methylene mechanism comes from the elegant studies by the research groups of Biloed and Petit? Biloen and Sachtler found that Ni-, Co-, and Ru-based catalysts, which are pre-doped with ‘3C-labeled carbon, yield upon treatment with I3CO/H2 mixtures under FT conditions a product mixture consisting mainly of I3CH4 and of hydrocarbons containing several I3C atoms in the same m o l e c ~ l e . ~ These results indicate that the carbidic species, once formed, can react with hydrogen to give CH, intermediates (x = 1-3), which polymerize to produce hydrocarbons, in agreement with steps 2 and 3 in Scheme I. The feasibility of the first step in the mechanism, in which the carbidic surface is formed, has been demonstrated convincingly by other investigator^.^ Thus, a rapid dissociative chemisorption of carbon monoxide has been shown to occur on various clean metal surfaces, including typical
Present address: Houston, TX 77004.
Department of Chemistry, University of Houston,
* Cornell University. Technion-Israel Institute of Technology.
0002-1863/88/1510-0749$01.50/0
FT catalysts such as iron.7 More importantly, the formation of a “carbidic layer” under real FT conditions is well-known.*
The beautiful studies of Petit and Brady on the induced de- composition of gaseous diazomethane (CH2N2) on typical FT catalysts provides additional strong and independent evidence for the operation of the carbide/carbene mechanism? Decomposition of CH2N2 on Ni, Pd, Fe, Co, Ru, and Cu surfaces, a t atmospheric pressure and in the temperature range of 25-250 “C, produces only ethylene and dinitrogem6 This indicates that in the absence of hydrogen the absorbed CH, fragments dimerize to ethylene (Scheme 11), but polymerization to higher hydrocarbons does not occur. However, reaction of a mixture of H2 and CH2N2 over Co, Fe, and Ru surfaces, all typical FT catalysts, produces a variety of hydrocarbons with isomer and molecular weight dis- tribution typical of a “real” FT reaction.6 Furthermore, decom- position of CH2N2 on surfaces that are not capable of dissociative chemisorption of Hz, such as Cu, yields only ethylene, even in the presence of H2? Wang and Ekerdt in a more recent study showed that pyridine can be used to scavenge Cl-C3 alkyl species from the surface of an iron catalyst during FT s y n t h e ~ i s . ~ These findings are also consistent with the carbide/carbene mechanism in which alkyl fragments are the immediate precursors to the FT
(1) For recent reviews see: (a) Herrmann, W. A. Angew. Chem., Int. Ed. Engl. 1982, 21, 117. (b) Biloen, P.; Sachtler, W. M. H. Adu. Catal. 1981, 30, 165. (c) Keim, W., Ed. Catalysis in C, Chemistry; D. Reidel: Dordrecht, 1983. (d) Goodman, D. W. Acc. Chem. Res. 1984, 17, 194. (e) Anderson, R. B. The Fischet-Tropsch Synthesis; Academic: New York, 1984. (f) Anderson, J. R.; Boudart, M. Catalysis; Springer-Verlag: Berlin, 1981.
(2) Fischer, F.; Tropsch, H. Brennst. Chem. 1926,7,97; Chem. Ber. 1926, 59, 830.
(3) Craxford, S. R.; Rideal, E. K. J. Chem. Soc. 1939, 1604. (4) For a r e n t criticism of this mechanism see: Henrici-OlivC, G.; OlivB,
S . J . Mol. Caral. 1982, 16, 11 1. And for a counter-argument see: Smutek, M. Ibid. 1984, 24, 257.
(5) (a) Biloen, P.; Helle, J. N.; Sachtler, W. M. H. J. Catal. 1979, 58,95; (b) Biloen, P. Recl. Trau. Chim. Pays-Bas 1980, 99, 33.
(6) Brady, R. C., 111; Petit, R. J. Am. Chem. SOC. 1980, 102, 6181; 1981, 103, 287. For more recent related studies see: Bock, H.; Tschmutova, G.; Wolf, H. P. J. Chem. SOC., Chem. Commun. 1986, 1068.
(7) (a) Low, G. G.; Bell, A. T. J. Catal. 1979,57, 397. (b) Joyner, R. W.; Roberts, M. W. Chem. Phys. Lett. 1974,29,447. (c) Roberts, M. W. Chem. Soc. Rev. 1977,6,373. (d) Brodtn, G.; Rhodin, T. N.; Brucker, C.; Benbow, R.; Hurych, 2. Surf. Sci. 1976, 59, 593.
(8) Frohning, C. D.; KGlbel, H.; Ralek, M.; Rottig, W.; Schnur, F.; Schulz, H. In Chemierohstoffe aus Kohle; Balk, J., Ed.; Thieme: Stuttgart, 1977; Chapter 8, pp 219-299.
(9) Wang, C. J.; Ekerdt, J. G. J . Catal. 1984, 86, 239.
0 1988 American Chemical Society

150 J . Am. Chem. SOC.. Vol. 110, No. 3, 1988 Zheng et al.
Scheme I 0
CH2-CH2-CH3 step 3
/ / / 1 / / / / / / / 1 / 1
Scheme I1
CH2 CH, CH2-CH2 f \ I\ I I
7 7 " - z 7 7 n 7 7 - -
products. In another important recent paper,
+ H20
step 4 .' 7 7 ~ ~ 7 ~ ' t H,C=CH-CH,, H,C-CH,-CH,, * * *
CH2=CH2
"m
Ekstrom and Lapszewicz showed that high molecular weighi hydrocarbons can be formed by the reaction of carbides with hydrogen in the presence of water.'O Furthermore, Winograd et al. have recently reported the detection of CH, CH2, and CH, intermediates on a Ni( 11 1) methanation catalyst,'la and Ceyer and co-workers have observed CH3 on a Ni( l l1 ) surface.'Ib Also Copperthwaite and co-workers presented X-ray photoelectron spectroscopic evidence for C-C bond formation during the interaction of chemisorbed CO with diazomethane on a polycrystalline iron surface.11c
Additional support, although indirect, for the chemical feasi- bility of the various steps of the carbide/methylene mechanism stems from the study of appropriate model organometallic com- plexes. Substantial experimental effort has been devoted in the last decade to the study of such model complexes.la Relevant systems and molecular reactions will be mentioned briefly throughout the paper, and reviews (in addition to ref la ) are gathered in ref 12. We note that metal-bound fragments such as methylene and methyl might be important intermediates also in other reactions occurring on metal surfaces, such as olefin metathesis and alkane activation processes.
Despite the extensive study of the FT synthesis many of the mechanistic details remain poorly understood. In particular, there is virtually no knowledge of the electronic and geometrical factors that control the polymerization process (step 3, Scheme I), and very little is known of the nature of the bonding of the organic fragments to the surface. Representative questions that remain unanswered are the following: What are the most effective binding sites on the metal surface for the adsorbed fragments and are these sites the same for all radicals? What is the favored orientation for the coupling of two methylenes to produce ethylene (Scheme II)? Are the binding sites and the dimerization mechanism the same for different metals? What is the relative mobility of CH2 and CH, fragments on the metal surface, and how does this mobility change as the metal is varied? At present these and similar questions are difficult to answer experimentally, although encouraging advances have been made recently.13 We will address these and other interesting mechanistic questions regarding the FT synthesis in this paper.
A full theoretical treatment of the FT reaction is a vast project, and we have to impose some limitations on the scope of problems
(IO) Ekstrom, A.; Lapszewicz, J . J . Phys. Chem. 1984.88, 4577. (1 1) (a) Kaminsky, M. P.; Winograd, N.; Geoffroy, G. L.; Vannice, M.
A. J . Am. Chem. SOC. 1986, 108, 1315. For other related studies see refer- ences therein. (b) Lee, M. B.; Yang, Q. Y.; Tang, S . L.; Ceyer, S . T. J . Chem. Phys. 1986,85, 1693. Ceyer, S . T.; Beckerle, J . D.; Lee, M. B.; Tang, S. L.; Yang, Q. Y.; Hines, M. A. J. Vac. Sci. Technol., in press. (c) Loggenberg, P. M.; Carlton, L.; Copperthwaite, R. G.; Hutchings, G. J. J . Chem. SOC., Chem. Commun. 1987, 541.
(12) (a) Hahn, J. E. Prog. Inorg. Chem. 1984, 31, 205. (b) Holton, J.; Lappert, M. F.; Pearce, R.; Yarrow, P. I. W. Chem. Rev. 1983,83, 135. (c) Nutton, A.; de Miguel, A. V.; Isobe, K.; Maitlis, P. J . Chem. SOC., Chem. Commun. 1983, 166. (d) Saez, I. M.; Meanwell, N. J.; Nutton, A,; Isobe, K.; Vizquez de Miguel, A.; Bruce, D. W.; Okeya, S.; Andrews, D. G.; Ashton, P. R.; Johnstone, I. R.; Maitlis, P. M. J . Chem. Soc., Dalton Trans. 1986, 1565.
(13) (a) For an excellent review see: Somorjai, G. A. Chem. SOC. Rev. 1984,13,321. (b) Koestner, R. J.; Van Hove, M. A,; Somorjai, G. A. J . Phys. Chem. 1983, 87, 203.
that will be tackled. In this study we concentrate on three major issues: (1) the mode of binding of the postulated reaction intermediates-methyl, methylene, and methyne-to the metal surface; (2) the mobility of these radicals on the metal surface; and (3) the electronic and geometrical requirements for the surface-induced coupling of the organic radicals.
We use in our work tight binding extended Huckel calcula- t i o n ~ , ' ~ with details given in Appendix I. The analysis of the surface calculations is based on the methodology and the tools that we have described in detail in our recent study of C-H and H-H activation on surfaces.15 The extended Huckel method, whether applied to discrete molecules or extended systems, has well-known limitations. It does not do well at predicting distances, and this will impose severe limitations in the analyses of mobility and coupling. But the method does seem to capture the essence of bonding. It is also transparent and useful in constructing explanations, and it is for this reason that we use it.
While many of the problems we will attack have not been investigated theoretically before, some have. The relevant studies of Baetzold, Muetterties, and S h u s t o r ~ v i c h , ' ~ ~ ~ ~ of Minot, Van Hove, and Somorjai,Isa and of AndersonIS" as well as other related theoretical worklse will be discussed in this paper. We also note that the first step of the FT reaction, the chemisorption of CO on various metal surfaces, has been studied extensively by many t h e o r e t i c i a n ~ . l ~ ~ ~ ~ " ~ ~ ~
This will be a long paper. It could easily have been chopped up into three papers, one on fragment bonding, a second on migration, a third on fragment coupling. We think nothing would be gained by this, and continuity would be lost. We ask the reader to bear with us as we analyze, in detail, an important reaction at the border of chemistry, physics, and catalysis.
General Considerations
The FT synthesis occurs on Fe and Co catalysts and to some extent also on Ni surfaces.' A major goal of any mechanistic study of the FT synthesis is to try to define and understand the factors that determine the catalytic reactivity of the metal surface. In this respect two key parameters are the identity of the metal and the lattice form in which it crystallize^.'^^^^ For each metal, one
(14) (a) Hoffmann, R. J . Chem. Phys. 1963,39, 1397. (b) Hoffmann, R.; Lipscomb, W. N. Zbid. 1962, 36, 2179. (c) For the implementation of the E.H. formalism to generate band structures, see: Whangbo, M.-H.; Hoff- mann, R.; Woodward, R. B. Proc. R. SOC. (London) 1979, A-366, 23.
(15) Saillard, J.-Y.; Hoffmann, R. J . Am. Chem. SOC. 1984, 106, 2006. (16) Shustorovich, E.; Baetzold, R. C.; Muetterties, E. L. J . Phys. Chem.
1983,87, 1100. (17) (a) Baetzold, R. C. J . Phys. Chem. 1984,88, 5583. (b) Baetzold, R.
C.; Monnier, J. R. J. Phys. Chem., accepted for publication. (18) (a) Minot, C.; Van Hove, M. A.; Somorjai, G. A. Surf. Sci. 1982,
127, 441. (b) Anderson, A. B.; Onwood, D. D. Surf. Sci. 1985, 154, L261. (c) Ray, N. K.; Anderson, A. B. Surf. Sci. 1983, 125, 803; 119, 35. (d) Anderson, A. E. Surf. Sci. 1977, 62, 119. (e) Vetrivel, R.; Viswanathan, B. J. Mol. Catal. 1984, 24, 245.
(19) (a) Sung, S.-S.; Hoffmann, R. J . Am. Chem. SOC. 1985,107,578. (b) Blyholder, G. J. Phys. Chem. 1964,68, 2772. (c) Anderson, A. B. J. Chem. Hys. 1976, 64, 4046. (d) van Santen, R. A. Proc. Int. Congr. Caral., 8fh, 1984. ( e ) Andreoni, W.; Varma, C. M. Phys. Rev. B 1981, 23. 437. ( f ) Allison, J. N.; Goddard, W. A., 111 Surf. Sci. 1981, 110, L615. (g) Doyen, G.; Ertl, G. Surf. Sci. 1977, BS, 641; 69, 157. (h) Bagus, P. S.; Hermann, K. Phys. Rev. B 1977, 16, 4195. (i) Davenport, J. W. Phys. Rev. Left. 1976, 36, 945. Q) Bullett, D. W.; Cohen, M. L. J. Phys. 1977, CIO, 2101. (k) Andzelm, J.; Salahub, D. R. Int . J . Quantum Chem. 1986, 29, 1091.

Bonding and Coupling of C, Fragments on Metal Surfaces
PROJECTED DOS . , , . , , , . . . . . , . . . , INTEGRATED DOS
TOTAL DOS - - - - - - - - -
J . Am. Chem. Soc., Vol. 110, No. 3, 1988 751
DOS - a
n
- I 5 - $ , , I , , , , , , I - l 5 j , , , , , , , , , 1 - l 5 4 , , , , , , , , ,
DOS - DOS - DOS - b C d
Figure 1. Total DOS (dashed lines) of the Co(OOOl), Cr(1 IO) , and Ti(0001) three-layer slabs. The darkened areas show the contribution from s and p states in parts a and b, respectively, for the Co case. cf indicates the Fermi level. Cr and Ti total state densities are shown in parts c and d. The d band center of gravity and the Fermi level shifts to higher energy on going from Co to Ti.
can choose surfaces with different indices, and generally each surface is expected to exhibit a different reactivity. We are going to use a fixed surface throughout the paper, to model what must be only one aspect of reality. The surface we chose is the (0001) surface of a hexagonal metal. With the high symmetry of this surface the computational times can be greatly reduced. For example, when a methyl group is adsorbed on this surface in an “on-top” or ”threefold” geometry, the hexagonal symmetry is still retained and the computational advantage of this over other surfaces of FT catalysts (e.g., Fe( l l0) ) is obvious. The results can also be compared with our previous studies on other hexagonal surfaces. I 5*21
To extract the basic electronic effects that determine the re- activity of the metal, we are going to compare three metal surfaces: Ti(0001), Cr( 1 lo), and Co(OOO1). They are shown in 1,2, and 3, respectively. Although the Cr( 110) surface is not hexagonal, it can be viewed as a distortion therefrom.
T i IO0011 Cr (110) c o ~00013
I 2 3
Let us begin with the hcp lattice of cobalt and employ the experimental Co-Co distance of 2.51 A. The next choice to be made is that of the thickness of the slab of the metal to be used in the calculations, of necessity a compromise between compu- tational economy and reasonable accuracy. Our previous stud- i e s 1 “ 9 1 s . 1 9 ~ 2 1 as well as exploratory calculations on the cobalt slab lead to the conclusion that a reasonable choice is a 3-layer slab. We use here a slab of three layers because the changes in the important surface properties (e.g., the Fermi level, charge dis- tribution, overlap population, etc.) are small on going to a Clayer slab. The 3-layer slab model for the hcp Co surface is shown in a side view in 4. We choose the z axis to be perpendicular to the
(20) (a) Ashcroft, N. W.; Mermin, N . D. Solid State Physics; Saunders College: Philadelphia, 1976. (b) Kittel, C. Introduction to Solid State Physics; J. Wiley: New York, 1976. (c) Harrison, W. A. Solid State Theory; Dover Publications Inc.: New York, 1980. (d) Shustorovich, E.; Baetzold, R. C.; Muetterties, E. L. J . Phys. Chem. 1983, 87, 1100. Baetzold, R. C. SolidState Commun. 1982,44,781. Vanna, C . M.; Wilson, A. J. Phys. Rev. E 1980, 22, 3795. Varma, C. M. Ibid. 1981, 23,437. The difference in work function between Mn and Cu is - 1 eV, see: Handbook of Thermionic Properties; Samsanov, G . V., Ed.; Plenum Press Data Division: New York, 1966. Michaelson, H. B. J . Appl. Phys. 1977, 48, 4729.
(21) (a) Silvestre, J.; Hoffmann, R. Langmuir 1985, 1 , 621. (b) Silvestre, J.; Hoffmann, R. Helu. Chim. Acta 1985, 68, 1461.
surface. A top view is in 5, where the dots in the triangular hollows represent the Co atoms in the next layer below.
A zlrl_ B
A
4 , l ido
Y
5 , top
Figure 1 shows the density of states (DOS) curve of the slab. A DOS curve is the solid-state analogue of an energy level diagram and it gives the number of levels in a particular energy interval. The mejal bands (or orbitals) are filled up to the Fermi level-the solid-state equivalent of the molecular HOMO. The dashed lines in Figure 1 refer to the total DOS curve. The darkened areas indicate the contribution of the s (Figure la ) and the p states (Figure lb) to the total DOS. The darkened areas are examples of projected or local DOS curves that single out the contribution of a certain atom or a group of atomic or fragment orbitals to the overall DOS plot. The states that are not s or p are d states. The dotted lines are integration curves, from 0 to loo%, which additively count the relative number of states occupied as one sweeps up the energy scale. It is clear from Figure 1 that a substantial number of s and some p states penetrate into the d band. On the average any Co atom has its s band approximately one-third filled.
In any reactivity problem, molecular or solid state, the energy and bonding capabilities of the frontier orbitals, the lower unoccupied and higher occupied orbitals of the system will play a crucial role. In the case of a metal surface these are the orbitals near the Fermi level. It is important to know how the essential features of these frontier orbitals of the surface change as the metal is varied. As the number of d electrons increases from Ti to Co, the nuclear charge is less effectively “screened” and d electrons are more strongly bound by the bigger Coulomb interaction. There are therefore two factors competing in the determination of the Fermi level: the filling of the d band, which tends to raise the Fermi level, and the Coulomb interaction that pulls down the Fermi level with increasing d electron count. It turns out that the Coulomb interaction wins out, and the Fermi level descends slowly along the right side of the transition series (the relevant work functions are Ti 4.33, Cr 4.5, Co 5.0 eV2“). Another

152 J . Am. Chem. SOC.. Vol. 110, No. 3, I988 Zheng et ai.
Table I. Electron Distribution among the Metal Atomic Orbitals of Co(OOOl), Cr(llO), and Ti(0001) Slabs (Coordinate Axes Are Given in 4) Co d9 Cr d6 Ti d4
orbital ‘surface” ‘bulk” ‘surface” “bulk” “surface” “bulk”
dXz-yz or d, 1.57 1.54 1.03 0.90 0.63 0.57 1.73 1.51 1.04 0.95 0.57 0.57
d,, or d,, 1.76 1.45 1.05 0.86 0.59 0.61 S 0.65 0.62 0.75 0.67 0.80 0.73 P 0.26 0.29 0.33 0.31 0.22 0.30 total 9.31 8.39 6.29 5.42 4.02 3.95
consequence of the increasing Coulomb attraction is the decreasing d band width along the transition series, due to the “tighter” wave functions of the d electrons. The calculations confirm these general considerations. The extended Hiickel method, as usual, gives a much too high magnitude of the ionization potential or Fermi level. It does so for molecule as well as for extended structures.
we find that the charge distribution among the slab layers changes as a function of the number of electrons per metal atom.. Basically, this results from the fact that an inner atom has more neighbors than a surface one. The band dispersion is a function of inter-unit-cell interaction, so that the more interactions (neighbors) one has, the wider the resulting band is. Thus the states of the “surface atoms” (layer A in 4) form narrower bands than the bulklike atoms (layer B in 4). The wider bulk bands are filled first and thus the bulk atoms become negative relative to the surface. At some point along the transition series the two layers will have equal charges, and past this point the surface layer will become negative. The conclusion from these qualitative arguments is that a t the right side of the transition series surfaces are expected to be negative relative to the bulk (or to the isolated atom), while a t the left side of the transition series surfaces are expected to be positive.
The calculations fully support these conclusions. For Co we find that each of the surface atoms carries a negative charge of 0.31 electron (note that because of the ABA arrangement the charge on each bulk metal is twice as large and of opposite sign to charge on a surface atom). For Cr we get a negative charge of -0.29 at a surface atom. For Ti the polarization is small and both surface and bulk layers are nearly neutral (each surface Ti atom carries a charge of 0.03 electron). To put these charge distributions in a chemical context we might say that the surface layers of the Co and Cr slabs can be described as being nucleophilic and Ti neutral. Better calculations will temper the indubitably exaggerated density shifts between surface and bulk, but the trend should remain.
Another important difference between the surface and the bulk atoms, shown in Table I, is in the electron distribution between the atomic metal orbitals. Let us examine first the surface. The data in Table I reveal in the Co case a significant electron flow from the “in-plane” orbitals (dXZ-,,z, d,) into orbitals that are perpendicular to the surface (dZz, d,,, d,,). But as the d electron filling decreases the situation is reversed: for Ti there is an electron flow from dp2, d,,, and d,, to d,z-,z and d,. This is again due to the fact the “in-plane” orbitals on the surface overlap better with their neighbors, resulting in a wider band. At low electron counts these orbitals are filled first, but as the filling increases the narrower bands, which are at intermediate energy, are filled more.
For the bulk orbitals, the perpendicular orbitals (d,?, d,,, dyz) overlap not only with orbitals in the same plane (B in 4) but also with the layers sandwiching them (A layers in 4), thus the band widths are bigger than those of dA? and d,. For the same reason that we have adduced above the charge flows from dzz, d,,, and dYp to dXz-9 and d, a t high electron counts, but it is reversed for low electron fillings.
We are now in a position to bring to the surface a layer of organic molecules.
General Considerations for Adsorption of Methyl, Methylene, and Methyne Radicals on Metal Surfaces
In order to study the adsorption of CH, (x = 1-3) radicals on the metal surface we have to simplify the calculations further by
In analogy to our previous
covering only one side of the 3-layer slab. For justification we rely on our previous study which showed that very similar results are obtained for a coverage of a 4-layer Ni slab with H, on one side or on both sides.15 Please see Appendix I1 for further dis- cussion.
The one-side coverage makes the two identical A layers in 4 different in the covered metal slab. The top layer A can be described as the “adsorbing” layer, the inner layer B is the “bulklike” layer, and the bottom layer is similar in character to the surface layer A in the bare metal (except for a small per- turbation by the remote adsorbent).
We have studied the adsorption of three organic radicals, CH,, CH,, and CH, all believed to be intermediates in the IT synthesis.l Regardless of the geometry that is chosen, a 1:l coverage of the metal surface by CH, or CH, is chemically unrealistic due to the very short distances and the resulting excessive steric repulsions between the hydrocarbons. We have chosen a one-third coverage, which ensures minimal interactions between neighboring fragments but which still allows the use in the calculation of a convenient unit cell that is only three times larger than that in the bare metal. The details concerning the unit cell that was used, the Brillouin zone, the special k points, etc., are given in Appendix I. For each of the organic radicals we have considered three possible adsorption sites: a mono-coordinated “on-top” site 6, a site “bridging” two metal atoms 7, and a “triply bridging”, “capping”, or “hollow” site 8.
6 7 8
As in our previous ~ t u d i e s l ~ - ’ ~ - * ’ we use the language and for- malism of simple perturbation theory. Within this framework the interaction of two levels, AE, is given by eq 2 . The magnitude of the matrix element Hi, in the numerator is related to the overlap
of the relevant orbitals, and the denominator tells us that the interaction is greater the closer in energy the two orbitals are, Le., the more the two orbitals come into resonance.
The consequence of orbital interactions between the metal bands and the orbitals of the organic fragment can be traced down and analyzed by examining the DOS curves. Contributions or pro- jections of specific orbitals are particularly helpful. In general, a strong shift in the position of a particular fragment orbital as it approaches the metal surface indicates strong interaction, either bonding or antibonding. A small shift, on the other hand, indicates little interaction.
Another important tool for the analysis is the COOP (for Crystal Orbital Overlap Population) curve, which gives the relative number of levels in a given energy interval weighted by the contribution that these levels make to the overlap population of a specified bond. In other words a COOP curve allows us to determine if a collection of energy levels contributes to bonding or antibonding between two atoms or fragments. We find that both the DOS and the COOP curves, but in particular their combination, are very effective in analyzing the bonding properties of metal surface^.^^,'^.^^,^^ The use of these tools will be dem-

Bonding and Coupling of C, Fragments on Metal Surfaces J . Am. Chem. SOC., Vol. 110, No. 3, 1988 753
Table 11. Methyl-Surface Interactions (see 10) and Their Expected Consequences
no. of charge interaction electrons stabilizing? effective? transfer
1 Yes Yes to M
0 no no none
2 Yes no to M 4 no no none
3 Yes Yes to CH3
2 Yes no to CH,
0 0 (2 (23 0 m
onstrated throughout the paper.
each of the organic radicals and the metal surface.
Adsorbed Methyl The orbitals of the methyl fragment are well-known and they
are shown in 9. We arbitrarily choose to define the methyl fragment as a radical so that at infinite separation both the metal and the radical are neutral. The HOMO of the methyl radical
We proceed now to analyze in some detail the bonding between
,-.
0
is n-CH3, a nonbonding type orbital a t -1 1.75 eV. This orbital, which we will call n, is singly occupied. Lower in energy, at -15.56 eV, are the two degenerate a-CH3 orbitals and still lower is the u-CH3 orbital. The LUMO consists of the two degenerate a*-CH3 orbitals a t 4.93 eV.
L4.93)7r*-CH3 -4 \
I O
There are many interaction modes between the methyl radical and the metal slab, but the perturbation expression helps one sort these out. In the schematic diagram 10 we have assigned numbers 0, a, and 0 to the interactions of n, a*-CH3 and a-CH, with the unfilled band states of the surface slab and @, a, and 0 to the interaction with filled metal states. Whether these are overall stabilizing or destabilizing is a function of the orbital filling. The magnitude of the interactions obviously depends critically on both the separation in energy between the interacting orbitals and the effectiveness of the overlap in question. Table I1 contains a qualitative summary of our expectations, including the antic- ipated direction of charge transfer that is a consequence of each interaction in 10.
A word of explanation is needed on these expectations. NorT mally the focus would be on two-electron bonding interactions,
- U - C H )
DOS - DOS - a b
Figure 2. Total DOS (dashed line) and the CH3 contribution (darkened area) when a CH, group is chemisorbed in an on-top geometry on Co- (0001) (a) and Ti(0001) (b) surfaces. The arrows indicate the CH, MO levels before the adsorption occurs.
for these are both stabilizing and effective in charge transfer. But in the case at hand none of the interactions of this type, a or 0, is very good, because the orbitals in question are far from resonance. Instead interactions 0 and @ of the methyl radical orbital become most important. And interaction @, typical of energetically ambiguous and difficult to analyze 3-electron in- teractions, will be crucial.
In addition to these interactions, all of which have molecular equivalents, we have interaction @ , characteristic of surfaces. Interaction @ represents schematically the metal slab's ability to shift electron density between the bulk and surface layers, or on the surface to shift density between those metal atoms involved in bonding and those left alone. This occurs in response to the electronic demands imposed by interactions with the organic adsorbate.
We can trace the validity of the perturbation theory based characterization of the primary interactions by examining the consequences or symptoms of interaction in the DOS curves in Figure 2a. This is for methyl on Co(OOO1) in the on-top geometry. Projections of the methyl orbitals are darkened and the position of these orbitals in the isolated organic fragments are indicated by arrows.
As expected, the u-CH3 and the a-CH, bands of the adsorbed CH3 are essentially a t the same energy as in the isolated radical and their bands are narrow-a clear indication of their weak interaction with the surface. In contrast, the energies of the n and the a*-CH3 orbitals change significantly upon interaction with the metal. The n band is pulled down to a lower energy (by - 1 eV), while the n*-CH3 band is pushed up in energy approximately to the same degree. The large shifts of these orbitals relative to the orbitals of the isolated radical are clear indications of their strong interaction with the surface. The interaction, of course, depends on the M-C distance. The DOS in Figure 2 are calcu- lated for a typical M-C distance of 2.1 8, (for the choice of the M-C distance see Appendix I) .
Figure 2b is the DOS curve for the Ti case. Since the center of gravity of the d band and the Fermi level are higher in energy, we should expect a weaker interaction between the metal and the CH3. n in Figure 2b is pushed down less than in Figure 2a. However, the main feature remains the same. The Cr case is intermediate between the Co and Ti, and we omit it.
CH3 in the On-Top Geometry We will analyze this specific case in more detail than the others
so as to demonstrate how the DOS and COOP curves may be used to understand the bonding. The other geometries can be then analyzed in less detail. We concentrate on the Co surface, The DOS curve of geometry 6 (Figure 2) was already discussed above. We have concluded that among the methyl orbitals only the n and

154 J . Am. Chem. SOC., Vol. 110, No. 3, 1988 Zheng et al.
Table 111. Some Details of Energetics and Electron Distribution for Three Sites of Methyl Binding to Co(OOOl), Cr(llO), and Ti(0001) Surfaces binding energy
(ev) overlap population Fermi level (eV) E , E , Mj-M, Mi-C M,-C MI-HI M2-HI C-HI C-H2
Ti -6.48 0.35 u,-u1 -7.50 0.46
-8.48 0.18
-6.47 5.42 0.16 0.29 0.37 -0.04 -0.00 0.8 1 0.81 -7.51 4.29 0.09 0.41 0.42 -0.04 -0.01 0.80 0.80 -8.48 3.73 0.47 0.17 0.42 -0.02 -0.00 0.79 0.79
Ti -6.43 4.89 -0.36 0.16 0.18 0.20 0.01 0.79 0.79 -7.40 3.36 -0.84 0.26 0.23 0.21 0.01 0.77 -8.47 2.64 -0 .62 0.11 0.22 0.21 -0.00 0.78 0.80 -6.48 5 .3 0.06 0.19 0.17 0.17 0.10 0.74 0.74 -7.34 3.36 -0.85 0.28 0.17 0.16 0.06 0.76 -8.45 2.36 -0.90 0.11 0.17 0.17 0.01 0.77 0.77
@ ::
@ :: @? Cr c o
Ti 8 Cr c o
Ti
' E , = [E(slab) + E(CH,)] - Et?,& E2 = [E(slab+) + E(CH<)] - E,,,,,. Thus the positive signs mean C H p or CHC is bound. E2 measures the covalent contribution to the total binding energy E,.
a*-CH3 orbitals contribute to metal-carbon bonding (Le., in- teractions a, a, and a in 10). We proceed now to examine these interactions in more detail.
We shall begin with interaction between the n-CH, orbital and the metal bands. If we were in a discrete mono-nuclear complex then we could simply say that the u nature of the CH, n orbital allows interaction with d,z, 11, but prohibits them with, say d,,, 12. Life is not so simple in the solid. Each metal orbital spreads out into a band. Local interactions are dominant, but symmetry limitations on interaction are not so strong. We often have to replace statements such as "does (or does not) interact with a given level" by "interacts more (or less) with such and such part of a band".
11 12
Let us illustrate this point qualitatively with the interaction of n. In the metal there is not one d,z and d,, orbital but many. 13 illustrates schematically some representative orbitals in the d,2 and d,, bands. The orbitals a t the bottom of a band are met- al-metal bonding, those in the middle nonbonding, and those at the top antibonding. Things are more complicated in three (or two) dimensions, but these one-dimensional representations are indicative of what transpires.
d.2
1s
What we can say now is that n interacts with the entire d s band, but perhaps more strongly with the bottom of the band than with the top, judging by the overlap differences between 14 and 15. For interaction with the d,, band, the overlap is strictly zero only at the zone center and edge (the most antibonding and bonding combinations, respectively). It is never very efficient, but as 16 shows, one can have an overlap between the middle of the d, band and n. Still, the overlap in 16, depending as it does on non- nearest-neighbor interaction, is not very good for on-top adsorption. So in analogy to discrete complexes we can focus our attention on locally strong u interactions. In addition to dZz, s and pz have the proper local symmetry to interact. They will do so, but the
mixing with p, is not great since it is very high in energy relative to n.
v5
14 1s
16
The interactions between n of substrate and the surface are shown schematically in 17. We have drawn the s and d,2 con- tribution (and omitted pz), but really one has a linear combination of these, Le., hybridization of the surface orbitals, in a chemically intuitive way, so as to produce hybrids reaching out for better interaction with n.
The discussion up to now has focused on the methyl n orbital. A consideration of the fragment overlaps and energies, the factors that determine the extent of interaction, would indicate other CH, orbitals should interact less. So they do. The CH3 n orbital changes its occupation from 1.0 in free methyl to 1.52 - 1.74 in various chemisorbed states (see Table 111, a summary of CH, bonding characteristics calculated for the three metal surfaces and adsorption sites 6-8). The net charges for a-CH3 and a*-CH, are much smaller. Thus the depopulation of a is 10.16 and the population of a* is 10.1 1 electron (these numbers are not in the table).
17
Interaction diagram 17 is highly schematic. Let us see the actual manifestations of the bonding on the DOS. We already saw the n peak move down in energy in the DOS decomposition of Figure 2. Now let us examine the detailed contribution of n,

Bonding and Coupling of C, Fragments on Metal Surfaces
i o . 8 -
6 - 4 -
2 - 0.
- 2 r 2 - 4
P -8r & -10-
- -6
-12
-14
-16
-18
-20 -22
- 2 4 ~
J . Am. Chem. SOC., Vol. 110, No. 3, 1988 755
- - - -
~
-:;It, ;, , , ,
- 22 - 24 -26
DOS - a b
- 2 - 4 -6
...,..... . -14
-22 -24 -I- -26 DOS -
C
-6 -8
-10 -12 -14
.... ,......'
-22 lH!L -26 - 24 DOS - d
- 2 -4 -6
-14
-22 -!L -26 -24 DOS - e
Figure 3. DOS of the chemisorbed Co(OOO1) (CH, on-top). (a) DOS before the adsorption, the dashed line indicates the metal DOS, the horizontal lines show the free CHI MO levels. (b) Total DOS after the chemisorption occurs. (c) n-CH, (magnified) states in the chemisorbed system. Parts d and e show the dz2 and s states (magnified), respectively, of the metal atom below the CH, group.
_ _ c ontibonding bonding -
Figure 4. COOP curve of the M C bond of a CH, group on Co(OOO1) in the on-top geometry.
s, and d22 to the DOS. This is shown in Figure 3, along with the COOP curve of Figure 4.
The peak in the DOS of the composite system at -13 eV is mainly the methyl lone pair, n. It is stabilized by interaction with surface d22 and s. This is attested to by the contribution of these orbitals-10% of the total s states and 9% of the d,z states lie in this band (see projections in Figure 3)-and their predominant metal-carbon bonding character (see the COOP curve in Figure 4).
The antibonding component of the metal-methyl interaction is also clearly seen. The metal d22 band, formerly confined to the region of -12 to -8 eV, is now broader, -13 to +2 eV. Much of the density in it is pushed up above the Fermi level. The COOP curve shows a broad region of M-C antibonding from -1 1 to -4 eV. Here are disposed, highly delocalized, n-d22 antibonding combinations. The still higher energy M-C antibonding region arises from out-of-phase mixing of metal s and p, with the methyl lone pair.
Some further insight into the special interaction of surface d2z may be obtained by looking a t the contribution to the DOS of the surface Co atom nor involved in bonding to a methyl group, C02, and comparing it with the bonded Col . This is done in Figure 5. Note how the C02 dg DOS remains compact, relatively undispersed, while that of Col d22 becomes quite spread out. Bonding implies dispersion.
We have now seen how the qualitative model of localized in- teractions and a perturbation theory based language for discussing these interactions are beautifully supported by the DOS and COOP curves. The molecule is bound to the surface primarily by the n + d9,s interaction. Many M-C antibonding combinatioq are pushed above the Fermi level. The n band is substantially
-26 DOS - -26"'"'""
00s - a b
Figure 5. A comparison of the d9 states. Part a corresponds to the metal below the CHI group and part b the adjacent metal atom (the one not capped by a CH,).
more than half populated, with 1.6 electrons per methyl group. Note that this brings the CH3 group closer to CH,-, but then the formalism of the methyl choice was just that, a formalism.
Another interaction that might have led to further charge transfer to CH3 is 8 between various metal orbitals, mainly d,,, d,,,, and methyl a*-CH3. The calculations show clear signs of that interaction, but it is not very effective, for the separation in energy between the interacting orbitals is large.
We have discussed so far the M - C bonding, which is obviously the major chemical event that occurs when methyl is attached to a metal surface. However, there are additional bonding in- teractions between the metal and the organic fragment as well as changes within the metal slab and within the organic fragment. Let us discuss now briefly these "secondary" changes that follow adsorption.
Looking first at the hydrogen-metal interactions, we find that these are extremely small and slightly M-H antibonding. This holds for both the M1-H and (M1 is the metal atom directly bonded to carbon, etc.) and the M2-H interactions. Thus, for Co, the corresponding overlap populations are -0.02 and -0.00, respectively. A detailed examination of the COOP curve for M-H bonding shows an antibonding contribution in the band at -12.6 eV, which is mainly the bonding n + d,z,s combination. The small M-H antibonding effect is set by the phase relationship defined in 18.

756 J. Am. Chem. SOC., Vol. 110, No. 3, 1988
Our conclusion that the M-H interactions are weak and un- important contrasts with those of Muetterties' group." They have performed extended Hiickel cluster-type calculations2a and have reached the conclusion that multicenter metal-hydrogen-carbon interactions play a decisive role in the chemisorption of hydro- carbons on clean metal surfaces. They emphasized that the most stable geometries are those that achieve maximum multicenter bonding of this type. In light of this discrepancy we looked further into this problem. We changed the M-C-H angle from 109.5' to 95O, so that the Col-H distance decreases from 2.67 A in 6 to 2.45 A. Still we find no indication of metal-hydrogen bonding. On the contrary, as the hydrogens approach the metal surface the antibonding interactions increase. Thus our calculations predict repulsion, not attraction, between the surface and the P-hydrogens. It is interesting that Minot, Van Hove, and So- morjaiI8 used extended Hiickel cluster calculations similar to those of Muetterties and did not mention the presence of strong met- al-/3-hydrogen interactions.
We now turn to the metal-metal bonding changes upon chemisorption of the methyl group. We find that as the new M - C bond is formed the metal-metal bonds around the binding site are weakened. Thus, the overlap population between Col and C02 drops from 0.19 in the bare metal to 0.17 in the covered surface (similarly for Cr and Ti the values are 0.46 and 0.41,0.35 and 0.29, respectively). To some extent the new M-C bond is formed at the expense of weakening the bonds within the metal lattice.*'
The overall effect of adsorption on the C-H bonds is small. The relevant overlap population is 0.78 in isolated CH,, 0.79 in isolated CH), and 0.79 for the Co surface.
Further insight into the bonding mechanism is provided by analyzing the charge distributions. The methyl is calculated to be strongly negative with a charge of -0.58. This is for Co. High negative values are observed for the other metal surfaces. Thus, if the metal and the CH, fragments are taken as neutral when separated, then upon chemisorption strong electron transfer from the metal to the methyl takes place; the metal becomes positively and the methyl negatively charged. This is true for Ti and Cr surfaces as well as Co, though there are differences to which we will return later.
Where does this electron transfer come from, and how can we reconcile it with the organometallic view of methyl as a donor? The electron transfer derives primarily from the large (80%) occupation of n on adsorption, and that in turn is a consequence of the n + d,2,s bonding combinations, the large peak in the DOS at -12.6 eV, coming way below the Fermi level. To put it another way, and at the same time to answer the second question posed above, on the surface n is filled, and a better conceptual starting point might have been to think of it as an adsorbed CH3-, a carbanion. If one views the charge transfer as beginning from CH,- and (slab)' then the process of bonding is accompanied by a drift of 0.42 electron from CH3- to the slab. The direction of this electron drift might make some organometallic chemists happier; we think what is important is that one perceives the equally valid dual viewpoints of the bonding process.
From which levels of the metal's "sea of electrons" do these transferred electrons come? We return here to a neutral CH, reference (Le., the calculated transfer being to methyl). Exam- ination of the electron distribution chart (for Co), 19, shows that most of the electrons (0.47 electron) come from one metal atom, Col , which is directly bonded to the organic fragment. The adjacent atoms in the surface layer, Col , also participate by donating 0.12 electron. The other atoms are merely spectators in the bonding process. The inner B and the bottom A layers remain essentially unchanged. The only atom in the inner layers that "feels" the adsorbent is the Co atom located exactly below Col , which gains 0.07 electron. Interaction @I in 10, which involves charge transfer within the metal slab, is small in this case.
Zheng et al.
(22) (a) Gavin, R. M., Jr.; Reutt, J.; Muetterties, E. L. Proc. Nuti. Acad. Sci. U.S.A. 1981,78,3981. (b) Muetterties, E. L. J . Orgunomer. Chem. 1980, 200, 177.
Charges
-0.58 +c.,7
-0.30
A x c r m r c r / ,,, Lfn,o"8 0'
8'
A - iyyyLoy C'
* CU, r0.6' B & - -c
+ O S
+ t '\ 1 -0.37 -0.30 -0.30
before ot ter adsorption
19
Thus the charge transfer is a localized phenomenon, occurring mainly between the two atoms (Col and C) that form the new bond. Furthermore, not all the orbitals on Col contribute. Most of the charge comes from the dZ2 orbital (0.53 electron), and the d,, and dyr orbitals contribute only 0.002 electron each. The small electron donation from the d, and dyz orbitals is a strong indication that the p-type interactions with x*-CH3 are relatively weak and charge transfer occurs mainly in the u-framework through the M-n interaction (see 17). Thus, based on the charge criteria, M-C bonding is due mainly to the u M + n interaction. Similar conclusion can be drawn for the Ti and Cr surfaces.
To summarize, the overall picture that emerges from our analysis is that of localized bonding where essentially only one metal atom participates in the formation of the new metal-CH, bond. The orbitals that participate are also limited. In the metal slab these are mainly d,2 and s on M1 and on the methyl it is primarily the methyl lone pair, n. The other metal atoms as well as the other orbitals hardly feel the adsorbent. This bonding description is very similar to that in an isolated ML,CH, complex, of which many are known. There is one difference in the surface case. In the molecular case the ML, acceptor orbital that interacts with the CH, n is an empty dr2-s-p, hybrid, and that hybrid becomes populated upon interaction. In the case of the surface the orbital that interacts with CH3 n is not one orbital, but the entire dzz band. The metal actually loses electron density through this interaction, as some d,2-n antibonding combinations are pushed above the Fermi level.
Let us examine now how the bonding between the methyl and the surface changes as the electron count of the metal is decreased. Relevant overlap population data for Co, Cr, and Ti as well as the corresponding binding energies are presented in Table 111.
As one sweeps across the transition series from left to right the average energy of a d electron, the center of gravity of the d band, moves down. This variation may have certain consequences, for as the center of gravity of the band shifts different adsorbate levels may interact more or less strongly. A good illustration of this may be found in another reaction we have studied, CO chemi- sorption and dis~ociation. '~ As one moves to the left in the transition series, the CO x* becomes increasingly occupied, with consequent dissociative chemisorption.
According to the COOP curve of Figure 4, the d band energy range above the n peak is mainly M-C nonbonding. Thus as the d band is depopulated the M-C overlap population (which is summed up to the Fermi level) is expected to remain about the same. In the Ti case, however, the d band is higher in energy and should interact less effectively with n (by the energy criterion of eq 2). This is reflected in the M-C overlap populations that are listed in Table 111.
The metal-metal overlap population increases on going from Co to Cr, as expected from the fact that the top of the d band is metal-metal antibonding. But from Cr to Ti some bonding states are emptied, so we expect the overlap population to decrease and the M-M bond to be weakened. Figure 6 shows a typical COOP curve for the M-M bond which is the basis of this rea- soning.
The binding energies of the methyl fragment to the metal surface, which are also given in Table 111, are naturally of special interest. The binding energy is defined here as the energy of a covered unit cell minus the combined energies of the neutral methyl fragment and of a unit cell of the bare surface. Although the extended Hiickel method is not expected to reproduce quantita-

Bonding and Coupling of C1 Fragments on Metal Surfaces
10
8 -
6 -
4 -
2 - O t - 2
> -4
-6
- - I
P -8
I; -10-
- I2
-14
c 4 I -
- - - -
- -
2 - 0 -
-2. - - 4 z - 6 :
$ - 8 : -io
- I 2 -14
-16
-18
-20 - 2 2
-24
- - :tzL 24 26
- ontibooding bonding - Figure 6. COOP curve for the surface M-M bond of the CHI on the Co(OOO1) (on-top) system.
tively the binding energies we do believe that the relative binding energies have chemical significance.
We have traced down above the origins of the bonding inter- actions between the metal and the methyl. The binding energy gives the total energetic consequences that occur as the methyl binds to the surface. These include the changes that occur in all bonds, specifically the M-C, M-M, M-H, and C-H bonds. Why do the binding energies ( E , ) that are defined as E , = [E(slab) + E(CH,)] - Etod decrease on going from Ti to Co although the M-C bonds get stronger and the M-M bonds alternate in the way we described above (Table III)? This apparent paradox is rem- iniscent of a similar situation that occurs in using frontier orbital arguments in analyzing the strength of simple tweelectron bonds.= Within this simplistic theoretical framework it seems that the strength of a bond should increase as the energy separation be- tween the interacting orbitals decreases, i.e., as its covalent character increases. Highly ionic bonds, where the separation between the orbitals that form the bonds is very large, are therefore expected to be extremely weak, contrary to reality.23 As we use here essentially frontier orbital logic (eq 2) in analyzing the M-CH3 bond, which on the basis of the charge distribution is substantially ionic, it is not surprising that similar problems arise. Picture 20 describes schematically the energetic consequences of
-
- 2. /
! - @ *- - - - - -
20
the ionic character of the M-C bond. The M-C bond strength arises mainly from the fact that the approaching CH3 radical brings along a “hole” a t an energy of -1 1.75 eV, 3.26 eV below the Fermi level of cobalt. The M-C bond is formed by an electron transfer from the metal into this “hole”, and a binding energy of 3.26 eV is gained in this process. Thus, the “ionic character” of the M-C bond can be described as responsible for 87% of the total binding energy (3.73 eV) of the methyl radical to the Co surface. The difference of 0.47 eV can be described as the “covalent contribution” to M-C bonding (E2 value in Table 111, see also discussion below).
As we move from Co to Ti the Fermi level changes by 2 eV to higher energy. The energy gain on filling the “hole” is now greater (see 20), and so is the binding energy and charge transfer to the methyl (-0.59 and -0.79 for Cr and Ti, respectively). The smaller “ionic contribution” to the binding energy for Co compared to Ti is partially compensated by the increased “covalent character”
( 2 3 ) Fleming, I. Frontier Orbitals and Organic Chemical Reactions; John Wiley & Sons: New York, 1976.
J . Am. Chem. SOC., Vol. 110, No. 3, 1988 757
1
-22 ! iEl -24 -26 -_ DOS - Figure 7. Total DOS (dashed line) and the CH3 contribution (darkened area) of the bridging CHp + Co(OOO1) system. The arrows indicate where the free CHp MO levels were before the adsorption.
..... .. 1:m- ,,,,.:,..,.. , ... , z : . . .”” ..:. ..,
c- M 2 6 4
...,, .. , ’,,, :.. ’ ” ...../’... .;: . ::, . .. , ,.
- ontibonding bonding - Figure 8. COOP curves of the two nonequivalent C-M bonds in the bridging CH3 + Co(OOO1) system.
of the Co-C bond which is reflected in the increased M-C overlap population (Table 111). The binding energy of methyl to Ti is therefore greater than that of Co-CH, by only 1.7 eV, not 2 eV as suggested in 20.
Once again it is useful to change perspective and think of the binding energy of a CH< anion to a positively charged slab. The “hole” is filled and ambiguities of charge transfer are avoided. Now the binding energy E*, defined as E2 = [,?(slab+) + E(CH<)] - EmM, is lower for Ti (0.16 eV) than for Co (0.47 eV), paralleling the M-C overlap populations. Cr is intermediate between Ti and Co; due to its nonhexagonal lattice it might deviate from average behavior.
A final point to be made about the on-top site is that the barrier for the rotation of the methyl group around its local C3 axis of symmetry (see 21) is nearly zero. This is hardly surprising, for this is a sixfold barrier, and we know such to be very small in molecular cases.
21
The Bridging Methyl Geometry, 7 Figure 7 displays the total DOS (dashed line) of the Co(OOO1)
system upon chemisorption of CH3 in a doubly bridging geometry. The darkened areas show the contributions of the organic fragment and the arrows indicate the location of these states in the isolated fragment. Figure 8 shows the COOP curves for the metal-carbon bonds. Comparison of Figures 7 and 3 and of 8 and 4 reveals

158 J . Am. Chem. SOC., Vol. 110, No. 3, 1988 Zheng et al.
:::I,, , , , , I , , , -26
DOS - :::I ~, , , , , , , , j -26
DOS -
-6
-10 -12 -14
-18 -20 -22 -24 -26
DOS -
- 6
-12 -14
:E/ , , , , , , , , , I -24 -26
00s - 0 b C d
Figure 9. DOS of the bridging CH, + Co(OOO1) system: (a) dxz; (b) d,2; (c) T * ~ ; (d) ?T*,,. The dotted lines are the integrations.
immediately the similarity in the bonding mechanisms in the on-top and the bridged geometries. In both cam the interaction that is primarily responsible for the metal-carbon bonding is that with the n orbital. Nevertheless, there are important differences in the details of the bonding mechanisms in the two geometries and we concentrate our attention on these.
The major difference is obvious. In the “on-top” geometry only one surface atom contributes strongly to M-CH3 bonding, while in the bridging case two metal atoms are clearly involved. More interesting is the contribution of the various orbitals to M-C bonding. In contrast to 6, the carbon atom in 7 is located off the d,, nodal plane and effective interaction with the n orbital can now occur, see 22 (contrast with 12).
& L A Y
2 2
As seen in 22 these interactions take place with d,, levels a t or near the edge of the Brillouin zone, i.e., the bottom of the band. Projection of the d,, levels (Figure 9a) indeed shows considerable broadening of this band compared with that of 6. In the bridging geometry the d,, band contributes 12% (6% for each of the Co atoms) of the total number of states in the n band at -13 eV. In 6 (on-top) this contribution was close to zero. Another conse- quence of bridging is that n interacts effectively only with the bottom of the d,z band (23), and not with the top (24).
2 3 24
We thus expect that the contribution to M-C bonding from the d s band will be smaller in the bridging mode than in the on-top site. This is indeed observed. The contribution of the dzz band to M-C bonding (Le., its portion of the n peak in the DOS) drops from 9% in 6 to less than 2% in 7 (compare Figures 9b and 3d). The participation of the s band also diminishes from 16% in 6 to 12% in 7.
The contribution of the n-type interaction to M - C bonding is higher in the bridging than the on-top site. This is indicated in Figure 8 by the increased contribution of the a-CH3 orbital a t -15.3 eV to M-C bonding (compare with Figure 4). A major difference between 7 and 6 is that in the former the degeneracy of the methyl *-interactions is destroyed. These are two distinct components, one pointing along the M-M axis (Le., x in 25) and the other in a direction perpendicular to it 0, in 26). The n, orbital interacts more strongly with the metal surface orbitals (see 25) than the T, orbital (see 26). This is due primarily to the poorer orbital overlap in 26, but also to the energy of the piece of the d,, or d,, band with which overlap is effective. The representative d,, orbital is near the top of its band (see the nodal relationship
in 25) and so closer in energy to its n*-CH3 partner. The rep- resentative d,, orbital is low in its band, 26.
This effect is beautifully exhibited by comparing parts c and d of Figure 9, which show the projected DOS curves of the methyl x* , and x * ~ orbitals, respectively. While the ? T * ~ orbital is dis- persed into a band of significant width indicating strong interaction with the metal, the K * ~ band remains relatively narrow.
25 26
The two bonded metal atoms contribute similarly, as expected, to the bonding of the CH3 fragment. This is apparent from the total M-C overlap populations shown in 27, which indicate a slightly stronger Col-C bond. Col is “staggered” with respect to the methyl hydrogens and C02 is “eclipsed”.
Tolal
\ - 0209 0436 0208 0 4 3 2
T 0 3 7 4 E;;; 1 \ 0 2 0 l 0385
cr c o , , I 8 ] 0 4 1 4 -1 0 224
27
Closer examination of the COOP curves in Figure 8 reveals an intriguing difference between Col and C02. The COOP peak corresponding to the M + n interaction is almost twice as large for C02 as for Col. In the d-band region the contribution of C02 to M-C antibonding is also larger than that of Col. For cobalt, where the d band is almost filled, the stronger contributions of C02 to M-C bonding and antibonding nearly compensate and the Col-C and Co2-C overlap populations are similar, the former being somewhat larger. As the d band is depopulated the M2-C bond should gradually strengthen. The overlap populations calculated are in fact reversed for M = Ti, compared to Co (see 27).
The stronger M2-C interaction, in particular in the n band, must result from the different arrangement of the methyl hy- drogens with respect to the two relevant metal atoms. There is a correlated differential in the direct M-H and C-H overlap populations (see 28 and 29). But the effect is small and we are not certain if it merits a detailed discussion.
The total interaction between the methyl fragment and the metal surface seems stronger in the bridged geometry than in the on-top geometry. Thus, in 7 the M + n band that is the major
0 796
,,t /0776 &c-- h ‘ c /
0 2 2 3 ~ 0 208 -0 0 3 ~ - 0 ow
cot co2 C O l c02
28 29
contributor to M-C bonding is pushed to a lower energy by 0.2

Bonding and Coupling of C, Fragments on Metal Surfaces
eV (for Co) relative to its position in 6, indicating a stronger bonding interaction. Also, the M-C overlap population data indicate overall stronger M-C bonding in the doubly bridging site, 7.
Although the bonding between the metal atoms and the methyl is stronger in the bridged geometry, the binding energy of the organic fragment to the surface is lower in 7 compared to that in 6 (see Table 111). Thus, for Co, Cr, and Ti the binding energies of methyl in the bridging geometry are by 1.1, 0.9, and 0.5 eV, respectively, lower than in the on-top site. This apparent paradox of a stronger M-C bond that results in a weaker binding of the CH3 fragment to the surface becomes comprehensible upon ex- amining the M-M overlap populations in 30.
- - L-i. t
0 155 T I 0350 Cr 0 4 6 2 041 I 0 275
c o 0 184 0 170 0110
t 0 291
t
30
30 shows that the Ml-M2 bond is considerably weakened on going from 6 to 7. This bond weakening is a direct consequence of the stronger metal-methyl interactions that push many of the metal bands to higher energies. The dominant n-d interaction pushes up above the Fermi level those metal states that contribute to etiher M-M bonding or M-M antibonding in the on-top ge- ometry. But only M-M bonding states are lifted above the Fermi level by this interaction at the bridging position, and the M-M bond is weakened more. Thus, the stronger M-C bonding in 7 is gained at the expense of weakening the bonds within the metal slab, therefore raising its energy. In the Co case (and to a smaller degree also for Cr and Ti) the M-M bonding energy that is lost is greater than the M-C bonding energy that is gained upon bridging and the binding energy of methyl is lower in 7 than in 6. In addition, interaction @ in 10 plays a role: as the M-M bonding states are lifted up in energy, the electrons flow from these states into the top of the d band, which is M-M antibonding. Consequently, when the electron count on the metal decreases and the M-M antibonding states are depopulated the difference in binding energy between the on-top and the bridging geometry is reduced. In our calculation the difference is 1.1 eV for Co, 0.9 eV for Cr, and 0.5 eV for Ti, the on-top position being more stable.
Only a few molecular complexes are known that have a methyl group bridging two bonded metal atoms24 (e.g., 312" and 3225). In most such complexes the methyl bridges two nonbonded metal atoms, as in 33.26 Thus, it seems that in analogy to our com- putations for the covered surface, in the molecular complexes the bridging mode is accompanied by M-M bond weakening or by M-M bond cleavage.
MI I
31 32 33
Finally, we comment on the charge transfer that occurs upon bridging. This is shown in 34 and 35 for the cobalt surface.
~~~ ~
(24) (a) Hursthouse, M. B.; Malik, K. M. A,; Sales, K. D. J. Chem. SOC., Dalfon Trans. 1978, 1314. (b) Mertis, K.; Edwards, P. G.; Wilkinson, G.; Malik, K. M. A,; Hursthouse, M. B. J. Chem. Soc., Dalron Trans. 1981, 705. (c) Masters, A. F.; Mertis, K.; Gibson, J. F.; Wilkinson, G. Nouu. J . Chim. 1977, I , 389. (d) Edward, P. G.; Mertis, K.; Wilkinson, G.; Hursthouse, M. B.; Malik, K. M. A. J. Chem. SOC., Dalron Trans. 1980, 334.
(25) KrUger, C.; Sekutowski, J. C.; Berke, H.; Hoffmann, R. 2. Narur- forsch. 1978, 336, 11 10
(26) Holton, J.; Lappert, M. F.; Ballard, D. G. H.; Pearce, R.; Atwood, J. L.; Hunter, W. E. J. Chem. Soc., Dalton Trans. 1979, 54.
J . Am. Chem. SOC., Vol. 110, No. 3, 1988 159
' 1 -052 -045 +051 -0 37
34 35
As we can see the total transfer of charge from the metal to the methyl fragment is nearly the same in 6 and 7 (0.58 and 0.53 electron, respectively). However, there appear to be dramatic changes in the charge distributions within the metal slab on going from 6 to 7. There is a substantial flow of charge from the surface layer into the inner layers upon methyl bridging. The same is observed for Cr and Ti surfaces. Thus for cobalt the calculations show that on going from 6 to 7 the surface A layer loses 0.52 electron while the B and bottom A layers gain 0.30 and 0.36 electron, respectively. Thus, the Co surface layer which in the bare metal is negatively charged becomes nearly neutral for on top bonding and turns positively charged in the bridging case. This substantial charge flow away from the surface is easily understood in terms of the bonding picture that emerged from our calculations. Bridging involves stronger interactions with the metal d bands. The surface bands that are involved in these interactions are pushed up to higher energies and are therefore emptied. Charge flows to lower metal bands that are concentrated in the inner slab layers. These charge flows provide a clear determination of the importance of interaction @ in IO. As in the on-top geometry, so also in the bridging site the methyl
is essentially freely rotating; there is no calculated rotational barrier.
The Threefold Bridging or Capping Methyl Geometry, 8 Once we have analyzed in detail the on-top and the bridged
geometries and have understood the bonding mechanism, then it is easy to predict what happens in the capping geometry 8. The trends that have been observed on going from 6 to 7 will hold also for moving from 7 to 8. In 8 the interactions between the methyl and the metal slab are the strongest, and the total M-C bonding increases, as expected, on going from 7 to 8. 36 and 37 show the overlap populations for the M-C and M-M bonds in both ge- ometries. Concurrently on going from 7 to 8 the M-M bonds are weakened as reflected in the decreasing M-M total overlap populations (see 36 and 37). At high electron counts this results in a smaller binding energy for the capping geometry relative to the on-top mode (e.g., by 0.3 eV for Cr). For lower electron counts, many of the M-M bonding states, which are pushed up above the Fermi level by the CH3-metal interaction, were ori- ginally empty. The gain in M-C bonding thus compensates more the loss in the M-M bonding in the lower electron count case. On the Cr surface our calculation shows no energetic difference between the bridging and capping sites and on Ti the capping geometry is more stable by 0.4 eV. In all cases under consider- ation, however, the on-top mode is the most stable one for CH,.
Ti- + T I 0 229 0.155 0.261 0 191
co . 0 144 0.1 10 0.155 0.1 13 C r ' 0.115 0.261 0.317 0.284.0 100
36 37
The charge distributions also behave as expected. There is substantial electron flow from the surface layer into the inner metal layer. The charge on the methyl fragment decreases as its co- ordination number increases on the c o surface. Thus on the c o surface the CH3 charge is -0.58 in 6, -0.53 in 7, and -0.52 in 8. This trend can also be rationalized within our bonding model by using the following reasoning: If there is no interaction between the metal and the CH3 radical and the electrons are assigned to the lowest available levels, then the methyl's n orbital, which is lower in energy than the metal's d band, will be doubly occupied and the charge distribution is CH3-[metal slab]'. When the

760 J. Am. Chem. SOC., Vol. 110, No. 3, 1988
M-CH3 interactions are “turned on”, part of the methyl charge is transferred back to the metal. As the number and efficiency of the interaction mechanisms increases, as is the case along the progression 6 - 7 - 8, more charge is transferred back to the metal and the organic fragment becomes less negative.
The capping or triply bridging geometry is the first where we find a significant barrier of 6.3, 21.2, and 21.7 kcal/mol (for Co, Cr, Ti) for the rotation of the methyl group. The most stable arrangement is such that the hydrogens point toward three metal atoms. A top view is shown in 38. The less stable arrangement in which the hydrogens point toward the center of three M-M bonds is shown in 39. The M-H overlap populations that are given in 38 and 39 suggest that weak M-H attractive interactions favor
Zheng et al.
T I 0.096 [ T i - 0 . 0 1 2 Cr -0,009 pF Co -0.024
3% 39
38 over 39, where these interactions are repulsive. 38 is the only case where we find some indication for the attractive M-H forces that Muetterties and co-workers found to be significant.22 The larger rotational barrier a t lower electron count is due to the following fact: At the eclipsed geometry 38 the hydrogens of the CH3 group interact with both M-M bonding and antibonding states, whereas in the staggered 39 they interact only with the M-M bonding states. Thus 38 is more stable. At lower band filling it is more so because the unfilled M-M antibonding states act as acceptors. However, we are not sure whether the extended Huckel method has overestimated the barrier, so better calculations are needed.
To conclude this section we summarize the main features of the bonding between a methyl fragment and the metal slab. The major interactions occur between the metal’s surface bands and the CH3 orbital. These interactions are u type, involving surface d,z and s orbitals. The important difference from a molecular complex is that charge transfer in the u system occurs from d,z (and s) to CH3. But this is a consequence of the reference state as neutral CH3, and if CH3- is chosen instead, the methyl group behaves in the way we would have expected. As one moves along the geometry series on-top - bridged - triply bridging, some additional M - C bonding is gained, but this is generally achieved at the expense of considerable weakening of the metal-metal bonds in the surface layer. As a result the on-top geometry is the most stable geometry for all three metal surfaces. However, this theoretical conclusion is not uncontested: see the theoretical work of Shustorovich’” and the experimental finding of a soft CH mode in CH3 on Ni( l1 l ) , indicative of a possible capping geometry.’lb
Adsorbed Methylene We will follow the guidelines of our analysis for the methyl case.
As in the methyl system three adsorption sites are studied: the 1-fold on-top geometry 40, the 2-fold bridging position 41, and the 3-fold bridging or capping position 42. For each of these geometries two conformers with respect to rotation around the C2, axis of the methylene group were examined.
40 41 42
The major difference in the bonding of methyl and of methylene to the metal surface lies on the different set of orbitals that these two fragments bring to the bonding process. The relevant orbitals of methylene are displayed in 43 in increasing order of energy (in parentheses, eV) from left to right. In the free singlet methylene only ?r-CH2 and u are occupied. Note that for con- sistency with the methyl case we should have called the lone pair orbital n, but it is customary to designate it as u in carbene chemistry.
r r - C H z (-15.781 u (-12. I I1 p(-11.40) n’-CHz!6601
43
A schematic energy diagram of the methylene orbitals and the metal slab levels is displayed in 44. 44 also shows the position of the relevant orbitals of the methyl radical.
r * -cn2(6M)) -
p ( - 1 1 401 , Cr(-1211) = ” ( - 1 I751
44
Let us examine first the most important features of the sur- face-carbene bonding, those which hold for all the binding sites. Diagram 44 reveals a t a glance the important differences in the bonding of methyl and methylene to the surface. The methyl fragment carries a singly occupied empty orbital a t -1 1.75 eV while the methylene introduces an entirely vacant orbital at a similar energy. We have seen above that most of the binding energy of the organic fragment to the metal surface can be as- sociated with the “ionic character” of the M-C bond, in other words with the energy gained upon filling the ”hole” that the organic fragment is carrying. Using this naive picture we expect that methylene, which carries 2 empty sites, should be bound much more strongly to the surface than methyl, which provides only one vacancy. Note also that the empty orbital that methylene brings along is the p or ?r-type while that of methyl is of u-type. The bonding of methylene to the metal surface is therefore ex- pected to have a much more pronounced rr-character than that for methyl. We will see below that these qualitative expectations are indeed fulfilled.
Another important difference between methyl and methylene is that in CH2 the u orbital is doubly occupied while in CH3 it is singly occupied. This orbital interacts mainly with filled metal levels (see 44). When two filled orbitals interact this results in a strong destabilization due to the occupation of antibonding orbitals. This would have indeed been the case for the interaction of the u orbital of CH2 with a filled orbital of another molecular fragment. However, the situation in the metrl slab is entirely different. The electrons that should enter the antibonding states can instead occupy empty metal levels that are lying near the Fermi level. These states, which we have shown above to be primarily bulklike, serve as an empty reservoir for electrons that are pushed up by interactions between filled levels. These ar- guments are displayed schematically in 45.
45
The strong destabilization that is associated with 4-electron interhctions in molecules, and that controls much of their

Bonding and Coupling of C, Fragments on Metal Surfaces
Table IV. Energetics and Electron Redistribution upon Methylene Bonding
J. Am. Chem. Soc., Vol. 110, No. 3, 1988 761
binding energy orbital populations overlap populations (ev)
Fermi level (eV) El E2 U p charge on CH, Ml-M2 MI-C MI-Hl C-HI
it-? Ti -6.49 10.38 0.64 1.70 1.89 -1.59 0.29 0.55 -0.04 0.81
\~dLJ + .& ;.. Cr -7.60 8.02 0.42 1.64 1.90 -1.53 0.40 0.52 -0.04 0.80
c o -8.50 6.33 0.52 1.59 1.96 -1.54 0.17 0.44 -0.02 0.79
Ti -6.44 9.94 0.20 1.69 1.78 -1.46 0.15 0.28 -0.03 0.8 1 "7. -u , - 7 > Cr -7.45 7.15 -0.45 1.62 1.81 -1.40 0.24 0.28 -0.03 0.79 c o -8.47 5.31 -0.50 1.55 1.86 -1.37 0.1 1 0.23 -0.03 0.79 Li/
;" -*~ Ti -6.46 10.40 0.66 1.69 1.72 -1.42 0.14 0.42 -0.04 0.8 1
c o -8.48 6.35 0.54 1.53 1.64 -1.17 0.10 0.40 -0.02 0.80 4 ) ~ 4
\ \ ,
i" ,g I-; C r -7.53 8.13 0.53 1.60 1.69 -1.29 0.25 0.43 -0.03 0.80
t- -3 Ti -6.46 10.05 0.30 1.69 1.70 -1.39 0.15 0.18" -0.01 0.80 Cr -7.43 7.49 -0.11 1.60 1.64 -1.22 0.27 0.16" -0.00 0.78 c o -8.47 5.75 -0.06 1.53 1.62 -1.12 0.1 1 0.1 7" -0.02 0.79
"The M2-C overlap populations are 0.35, 0.36, and 0.33 for Ti, Cr, and Co, respectively.
a
DOS - DOS - b C
- 14-'
-18- -20- -22- - 24- -26 ' " " " ' '
-16- 'C'
DOS - d
IO: 8 . dy, (MI) magnified
6 - 4 - 2 - 0 -
- 2 - - 4 - -6.'
'C' -14- -16- - I8 -20 :
-22- -24- 4 -26 s ' ' " ' " '
DOS - e
Figure 10. DOS of the on-top CHI + Co(OOO1) system: (a) Bare metal surface (dashed line) plus free CH, (MO levels indicated by horizontal lines); (b) Total DOS (dashed line) and the CH2 contribution (darkened area) for the chemisorbed system; (c) d,i states of the metal atom bonded to the C H 2 group (magnified); (d) s states (magnified); (e) d,, states (magnified).
chemistry, has to a large extent diminished in metal-adsorbent systems. This is, we believe, one of the important characteristics of metals and metal surfaces, a factor that makes them behave so differently from the "analogous" isolated metal complexes.
We can proceed now to discuss in detail the different binding sites of methylene. Table IV collects the computational data regarding the bonding characteristics of methylene in the different adsorption sites. Some of these data will be discussed in some detail in the text. We also refer the interested reader to a recent contribution from our group in which we studied the adsorption of vinylidene, H,C=C:, on metal surfaces.21 In many aspects this system is similar to ours and we will refer to it when appropriate.
Adsorbed Methylene in the 1-Fold On-Top Geometry, 40 We have studied two conformers shown in 46 and 47 differing
by a 30° rotation around the metal-carbon bond. We find that the energy difference between these conformers is essentially zero. We will comment on the reasons for this tiny barrier later. We concentrate therefore on one geometry, 46, using the indicated coordinate system, but the analysis applies to 47 as well.
46 47
Figure lOa,b shows the total DOS curve (dashed line) of the Co system before and after the chemisorption of CH, in this geometry. The dark area in Figure 10b gives the states contributed by the methylene fragment and the straight lines in Figure 10a
P - 8
I; -10
-12
-14
-16
- 20
- 22
- 24
I..
c ontibonding bonding - Figure 11. COOP curves of the M-M (solid line) and the C-M (dotted line) bonds for the on-top CHI + Co(OOO1) system.
indicate the location of these states in the isolated organic frag- ment. Figure 10b can be compared with the analogous Figure 2a for the 1-fold chemisorbed methyl. The two orbitals of methylene that are most affected by the interaction with the metal are u and p. These are pushed to lower energies by 1.2 and 0.4 eV, respectively. The peak of the u band is located at a slightly lower energy in 46 than in 6. This is due primarily to the fact that u-CH, is lower than n-CH, to start with (-12.1 vs -1 1.8 eV).
The fact that the u orbital is affected more strongly than the p orbital by interaction with the metal indicates that the M-C bond is mainly of u character. This interpretation is corroborated by Figure 11 which displays the COOP curve for the Col-C bond.

762 J . Am. Chem. SOC., Vol. 110, No. 3, 1988 Zheng et al.
The strongest M-C bonding peak is at -13.0 eV corresponding to the u orbital of methylene. The p orbital also makes an im- portant contribution to M-C bonding, as indicated by the peak at -1 1.2 eV. But it does so to a smaller degree than the u band.
Comparison of Figure 1 1 with the analogous COOP curve for methyl (Figure 4) is interesting. There are essential similarities, and small differences: the absence of a p bonding contribution in Figure 4, minor and understandable differences in the con- tribution of the A orbitals. Note also that around the Fermi levels of C0(d9) indicated by the arrow in Figure 1 1 , the M-C COOP curve is antibonding and it is more so for methylene than in the methyl system. Thus as the top of the d band is depopulated the M-C bond is strengthened. The M-C overlap populations are in agreement: 0.44 for Co, 0.52 for Cr, and 0.55 for Ti (Table IV). As in the methyl case, for methylene the M-M COOP curve (which is also shown in Figure 11) is also antibonding around the Fermi level of Co. Emptying the top of the metal band results therefore in a strengthening of the M-M bond, up to a certain point (-d5), past which it is weakened. The calculated overlap populations for the on-top methyl and methylene geometries are shown in 48 (see also Table IV). Note that also for methylene the M-H interactions are weakly antibonding.
T i : 0.291 0.287 C f : 0.411 0.401 C O : 0.170 0.172
methyl methylene 48
The calculated total overlap populations in 48 indicate that the M-C bond is stronger for methylene than for methyl. This comes from the increased contribution of A bonding. The difference in the overlap populations between the two cases is, however, too small to indicate the presence of a fully developed M-C double bond character. Qualitatively, the M-CH, bond is best described as a partial double bond.
The relatively modest increase in the M - C overlap population, and thus in the M - C bond strength, upon substitution of methyl by methylene does not indicate, as we have already emphasized earlier, that the binding energies of these fragments to the metal surface are similar. This is because the overlap populations reflect only what we have termed the “covalent” fraction of the bonding (E,) while most of the binding energy comes from an “ionic” transfer of electrons from the metal to the organic fragment. For the adsorption of CH2 on cobalt we calculate a binding energy of 6.33 eV compared with only 3.73 eV for methyl. These values agree well with our interpretation. The “ionic” binding energy is given by the energy difference between the top of the bare cobalt band and the a-orbital “hole”, multiplied by 2 (for 2 electrons), i.e., 2 X (11.40 - 8.48) = 5.84 eV. The remaining fraction of the binding energy, 6.33 - 5.84 = 0.49 eV, can be associated with the “covalent” bonding. For methyl, only one electron contributes to the “ionic” stabilization, Le., 11.75 - 8.48 = 3.27 eV, and the total binding energy is only 3.73 eV (leaving 0.46 eV for “covalent” stabilization), roughly half that of methylene.
On going from Co to Cr to Ti, the Fermi level becomes higher and the “ionic” energy gain is larger, increasing the total sur- face-adsorbent bonding interactions (see E , values in Table IV). The “covalent” bonding remains, as expected, roughly the same as the metal is altered (see E2 values in Table IV).
Now that we have discussed the general features of the bonding of CH, to the metal surface let us analyze the bonding of CH, to the metal surface in more detail. We have shown using Figures 10 and 11 that M-C bonding is associated mainly with the u and p orbitals of CH,. Which of the metal levels contribute more to the M-C bond?
Interactions with the u orbital of CH2 involve mainly the metal’s s and d,2 bands as shown in 49 and 50, respectively. Interactions 49 and 50 are analogous to the u interactions with the methyl fragment shown earlier in 11.
49 50
As for adsorbed CH3, so also for CH, essentially the entire s and d,2 bands are involved in the interaction. This is the reason that we do not show the orbital phases at the neighboring metal atom. Projection of the dZ2 states of Col shown in Figure 1Oc reveals that nearly 8% of these states contribute to the metal-a band. For the s bands (Figure 10d) the contribution is slightly larger (12%). The strong interaction of the d22 band with the organic fragment is also evident from its large dispersion; nearly 40% of the dZ2 states are above the Fermi level of cobalt.
The p orbital of CHI can interact with several metal bands. The major interaction is with the d,, levels as shown in 51. According to Figure 10e, 17% of the dyz states are involved in a interactions with the p orbital. The neighboring metal atoms also contribute, as emphasized in 51 by the arrows. The d,, levels, being perpendicular to the p orbital, do not interact with the organic fragment (except for a minor interaction with the n*-CH2 orbital, which is of proper symmetry but lies 18 eV above the p orbital). Some levels around the center of the d,2 and s bands can also contribute to A bonding, as shown for dZ2 in 52. These interactions, however, do not in fact contribute much to the total A bonding, because of poor orbital overlap. Only 1-255 of the d,l levels contribute to the M-p band.
We can now understand why the barrier to the rotation of the CH, group is so small. The u-type interactions are invariant to rotation of the CH2 group and are the same in 46 and 47. The
51 5 2
important interactions for the rotation are the A type. As the CH2 fragment is rotated toward geometry 47 the contribution of the d,, bands to A bonding decreases due to smaller orbital overlaps. However, at the same time the contribution of the d, bands (which are zero in 46) increases and reaches its maximum in geometry 47. A nearly constant contribution of these levels to the M-C bonding is maintained as the CH, fragment rotates. The rotation barrier is sixfold and tiny. The different effectiveness of the a and a interactions is manifested also in the appropriate metal DOS.
In 55, we look at the charge distribution in the adsorbed methylene. We find two comparisons to be useful, one with the bare metal 54 and the other with the analogous 1-fold on-top methyl system 53. The data in 53-55 are for the Co surface, and data for other electron counts can be found in Table IV. As the CH2 fragment provides two vacancies for the metal electrons while the methyl provides only one, the charge transfer to the organic fragment is much higher in the methylene system. The CH, charge is -1.54 compared with -0 .58 for CH3. Using the adsorbed methyl system as the reference point we calculate that abstraction of a hydrogen atom causes 0.90 electron to flow from the metal
Chorqes
53 54 5 5
to the organic fragment. The charge is donated roughly equally from all three metal layers. Comparison with the bare surface shows that as in the methyl system, the charge that is donated to the methylene comes mainly from the Co atom that is directly

Bonding and Coupling of C, Fragments on Metal Surfaces
bonded to it. This cobalt atom contributes 0.64 electron. However, the electron demand placed by the methylene fragment is so large that the neighboring atoms in the surface layer as well as metal atoms in the bulk also contribute. The metal atoms adjacent to the adsorption site contribute 0.19 electron each and those in the B and bottom layers 0.32 and 0.20 electron, respectively. In the methyl case charge transfer from the inner metal layers is very small (see 19).
Numerous examples of carbene complexes of type 40 either substituted or unsubstituted are known.la,l2 Their bonding was analyzed in detail by our as well as by and we will not dwell on this point here. The reader is also referred to a recent relevant paper which reports the preparation and the characterization of the first simple unligated carbene complex FeCH2.2S Note, however, that to our best knowledge there is not a single known structure of a cluster carbene complex of type 40. These complexes exist commonly in a bridged geometry but 1-fold structures have been suggested as intermediates in their reac- tions.2'31
Adsorbed Methylene: The Twofold Bridged Geometry, 41 We have studied two bridged geometries, perpendicular 56 and
parallel 57. It is advantageous to analyze these geometries together although they differ substantially in energy, 56 being lower in energy. We will come back to this point later. & @ zk"
Parpendiculor POIOII.1
56 5r
As in the 1-fold geometry it is useful to discuss the metal- methylene bonding in terms of u and A contributions. The u interactions are expected to be similar in the two geometries, as those interactions remain reasonably invariant to rotation around the z axis. Furthermore, in comparison to the on-top geometry 40, the changes in the u bonding are expected to be similar to those that occur in the methyl systems, i.e., 6 - 7. For the u framework we indeed find strong similarities between the methyl and the methylene systems. In both systems D interactions are stronger in the bridged geometry.
The total density of states for methylene on Co(OOOl), bridging in the perpendicular conformation 56, is shown in Figure 12. The total DOS for the parallel conformation is similar, though it differs in critical aspects to be discussed below. Decompositions of the DOS identify methylene levels. Note that both u and p bands are stabilized in the adsorbate-surface complex.
The dramatic difference between perpendicular and parallel geometries, 56 and 57, is revealed in the metal-carbon COOP curves which are displayed in parts a and b of Figure 13 for 56 and 57, respectively. Note that in contrast to 7, here symmetry dictates identical COOP curves for Col-C and C02-C, of which only one is shown. The contribution of states descending from the methylene p state to M-C bonding is approximately twice as great in 56 as in 57. In the perpendicular geometry the M-C bonding is roughly half A and half u in character while in the parallel geometry u bonding is dominating.
The stronger A bonding in 56 compared with 57 results from a more efficient overlap in the perpendicular geometry between
(27) (a) Lauher, J. W.; Hoffmann, R. J. Am. Chem. SOC. 1976,98, 1729. (b) Goddard, R. J.; Hoffmann, R.; Jemmis, E. D. J. Am. Chem. Soc. 1980, 102, 7667. (c) Hoffmann, R.; Wilker, C. N.; Eisenstein, 0. Ibid. 1982, 104, 632. (d) Eisenstein, 0.; Hoffmann, R. Ibid. 1981,103,5582. (e) Rappe, A. K.; Goddard, W. A., 111 Ibid. 1980, 102, 5114; 1982, 104, 448. (f) KostiC, N. M.; Fenske, R. F. J. Am. Chem. Soc. 1982, 104, 3879.
(28) Chang, S.-C.; Kafafi, Z. H.; Hauge, R. H.; Billups, W. E.; Margrave, J. L. J. Am. Chem. SOC. 1985, 107, 1447.
(29) Dyke, A. F.; Knox, A. R.; Mead, K. A,; Woodward, P. J. Chem. Soc., Chem. Commun. 1981, 861.
(30) (a) Laws, W. J.; hddephatt, R. J. J. Chem. SOC., Chem. Commun. 1983, 1020. (b) Holmgren, J. S.; Shapley, J. R. Organometa//ics 1985,4793.
(31) For the structure of surface-bonded CHI see, for example: (a) De- muth, J. E.; Ibach, H. Surf. Sci. 1978, 78, L238. (b) McBrccn, P. H.; Erley, W.; Ibach, H. Surf. Sci. 1984, 148, 292.
J . Am. Chem. SOC., Vol. 110, No. 3, 1988 163
DOS - Figure 12. Total DOS (dashed line) and the CH, contribution (darkened area) for the bridging CH2 + Co(OOO1) system (CH2 perpendicular to the Cc-Co bond, Le., 56).
the p orbital and the appropriate metal states. In the parallel conformation the overlap between the carbene's p orbital and the top of the dzz, for example, is poor (see 58) so that there is practically no contribution of dz2 to the p band. In the perpen- dicular geometry, on the other hand, overlap is excellent (see 59) and 6% of the dz2 states contribute to the M-p bonding band. Other metal states that contribute significantly to A bonding are the top of the s band ( -5%, see 60) and the top of the dx2+ band (-1%). d,, also contributes, although its share is very small (-2%, see 61). The stronger A interaction in the perpendicular geometry is reflected in the greater M-C overlap populations. Accompanying this is a weakening of the bridged M-M bond, but the magnitude of that effect is small (see Table IV).
58 59 60 61
The stronger M - C bonds in 56 suggest that this conformation should be more stable than 57, as observed. For all metal surfaces we calculate substantial energy differences between the two conformations (ca. 1.0 eV for Co and Cr and ca. 0.5 eV for Ti). Note that these energy differences also give the barriers for ro- tation of the CH2 group around the z axis. It is interesting to note that these barriers are similar in magnitude to those found in molecular carbene complexes of the 1-fold type.27*29,30 This similarity is not surprising because the key orbital interaction that dictates the magnitude of these barriers is similar in the molecular and the surface systems.
Our result that the perpendicular geometry is substantially more stable than the parallel geometry agrees with that of Minot et al.lEa but is in contrast to the conclusions reached by Muetterties et a1.,22 who suggested that the parallel geometry is favored by strong metal-hydrogen interactions. As in the previously discussed systems, we find small antibonding interactions between the metal and the hydrogens in either 56 or 57 and for all electron counts (Table IV). Note that our results are in line with the known structures of analogous bridged molecular complexes, which in- variably have a perpendicular geometry with respect to the bridged M-M vector. Relevant molecules can be found in ref l a and 12.
It is interesting to compare our results with those of Silvestre and Hoffmann, who have found that the related vinylidene (CH2=C:) binds to a Pt surface most strongly in the parallel geometry 62.21 The corresponding perpendicular conformation is substantially higher in energy. Although at first glance this
62

764 J . Am. Chem. SOC., Vol. 110, No. 3, 1988
4 -
2 - 0 -
- 2 -
5‘ - 4 :
P - 8 -
- 6 - I
Zheng et ai.
- 4
-103 -12- -14-
- 2 4 - -26 1L - ontibonding bonding -
1
O! -2.
-4 <
-6 1 -8
-103
-121
i -141 i 1 -16
-20;
- 2 4 1 I -221
- 2 6 1 ’ I
-antibonding bonding - a
Figure 13. COOP curves for the M-C bond: (a) perpendicular; (b) parallel CH, on Co(OOO1). b
result may seem to be in conflict with that for methylene, in fact it is not. Examination of both systems reveals that exactly the same orbitals and interactions dictate the higher stabilities of 56 and 62 relative to the corresponding 90O-rotated structures. The reversed final geometrical outcome results from the different topologies of the orbitals of the two carbenes at hand. In CHI the carbene acceptor p orbital is perpendicular to the H C H plane while in vinylidene it lies in the molecular plane. Thus, interactions with the carbene’s p orbital dictate a planar geometry 62 for the vinylidene and a perpendicular geometry 56 for methylene. Note that essentially the same reasons lead us to construct the planar ethylene molecule from vinylidene and hydrogens but a tetrahedral (i.e., “perpendicular”) molecule (methane) from methylene and
An important result of the calculations is that the adsorption of the methylene fragment on all metal surfaces examined has essentially the same energy in the 2-fold perpendicular geometry 56 and in the 1-fold on-top geometry 40. This result is to be contrasted with methyl adsorption where the I-fold site (6) of Co, Cr, and Ti is preferred over the 2-fold bridged site (7) by 1.1,0.9, and 0.5 eV, respectively. Why do methyl and methylene choose different adsorption sites? The answer lies again in the presence of the empty p orbital of methylene. We have emphasized above for methyl that as the organic fragment moves to a more highly coordinated site its interaction with the surface strengthens, pushing many d states to higher energies. The overall effect is that the total energy rises and the bridged sites become less stable than the 1-fold site. The same effects are operating in the methylene system, but here the additional a-stabilization that is gained in the bridged geometry is so large that it overrides the destabilization that results from the higher energy of the met- al-centered bands, and the total energy drops. Indeed, a com- parison of the 1-fold site with the bridged parallel position 57 where the *-stabilization is weak reveals the “normal” stability order, with the 1-fold site having the lower energy.
Changing the metal surface has a small effect on the relative energies of the 1-fold and the perpendicular bridged sites. For Co, Cr, and Ti, the energy differences are 0.02, 0.1 1, and 0.02 eV, respectively, favoring 56. Similarly, on a Pt surface, vinylidene favors the 2-fold bridged site.I* These results are also in agreement with those of Minot and co-workers.IBa
Finally, we comment on the charge distribution. We remind the reader that in analyzing the charges it is useful to look at the separated molecules as [metal]+ and [organic fragment]-. In the case of methylene the charge-transferred extreme is actually CI1,*-, p orbital completely filled. As the metal-adsorbent in- teractions become more efficient electrons are transferred from the adsorbent to the metal. The calculational results for methylene (see Table IV) are very similar to those obtained in the methyl system (see 34 and 35). In both systems bridging increases the
H I .
, C-MM, -
- antibonding bonding - Figure 14. COOP curves for the MI-C and M2-C bonds. The CHI group is above the triangular hollow of the Co(OOO1) surface.
interactions between the metal and the organic fragment and consequently charge is transferred from the adsorbent back to the metal. For example, the charge on the methylene drops from -1.54 to -1.37 when the geometry is changed from the on-top to the 2-fold parallel on the Co surface. More interestingly, the migration of the organic fragment from a 1-fold to a 2-fold site is accom- panied by a massive reorganization of charge within the metal slab; electrons flow from the surface layer into the inner layers, avoiding the high-lying bands that are centered around the ad- sorbing metal atoms. It is instructive that quantitatively these inner metal charge reorganizations are practically identical for the geometry changes 40 - 57 (Table IV) and 6 - 7 (see 34 and 35). This emphasizes that similar basic changes occur in the metal-adsorbent interactions when the organic fragment migrates from a 1-fold to a 2-fold site, regardless of whether it is methyl or methylene. On top of these basic changes additional inter- actions, specific to the organic molecule a t hand, may alter somewhat the final picture. Thus when the methylene is rotated to geometry 56 and strong T interactions are put into play, ad- ditional charge (relative to 57) flows from the methylene, which becomes less negative, into the metal slab. There it is partitioned mainly between the surface and the B layers.
The Threefold Bridging or Capping Geometry, 42 The analysis of the bonding at this site is straightforward, using
the experience gained in the study of the methyl system and of the various adsorption sites of methylene. The COOP curves of the Co-C bonds are displayed in Figure 14. The numbering of the metal atoms and the precise orientation of the methylene group are shown in 63. The solid line in Figure 14 gives the COOP curve

Bonding and Coupling of C, Fragments on Metal Surfaces J. Am. Chem. Soc.. Vol. 110, No. 3, 1988 765
Table V. Binding Energies and Mulliken Populations of CH Chemisorbed on Various Metal Surfaces binding energy
(ev) overlap population geometry Fermi level El E2 MI-& MI-C M-H C-H
I Ti -6.50 15.51 0.95 0.27 0.70 0.79 && Cr -7.64 11.56 0.30 0.38 0.59 0.78
c o -8.53 8.84 0.15 0.17 0.42 0.77
, Ti -6.49 15.97 1.41 0.13 0.52 0.80
$3 Cr -7.58 11.99 0.74 0.22 0.49 -0.02 0.78 c o -8.51 9.05 0.36 0.09 0.40 -0.01 0.78 Ti -6.41 16.11 1.55 0.14 0.45 -0.04 0.80 Cr -7.46 12.43 1.17 0.26 0.43 -0.02 0.79 c o -8.50 9.36 0.68 0.09 0.39 -0.01 0.78
i- i/
for the Col-C bond and the dotted line shows the corresponding curve for the two identical C02-C and co3-C bonds. The COOP curve shows that, similarly to the 2-fold 56 system, also in 63 both u (band at -13.6 eV) and a interactions (band at -12.2 eV) contribute effectively to Co-C bonding. Typical u and a inter- actions with the metal's d,2 band are depicted in 64 and 65, respectively. Similar interactions with other metal bands, in particular s and to some extent d,, and d,,, also contribute to bonding.
63 64 65
Figure 14 reveals an interesting aspect of the bonding at the 3-fold site and provides a nice demonstration of the analytical power of COOP curves in general. u bonding (peak at -1 3.6 eV) is contributed equally (except for a small perturbation induced by the nonsymmetrical arrangement of the methylene hydrogens) by all three metal atoms. In contrast C02 and c o 3 contribute to x bonding (peak at -12.2 eV) much more than Col. This result can be interpreted quite easily. In 63 the p orbital of methylene is aligned parallel to the co2-Co3 vector allowing strong overlap with the bands centered around these metal atoms. The topology of the interacting orbitals is similar to that in the perpendicular 2-fold geometry. The interaction of Col with the p orbital is much smaller; the situation resembles that of Col in the parallel 2-fold geometry. Upon rotation of the methylene group by 30' in a clockwise direction Col and c o 3 change roles; now Col and C02 contribute to a bonding more than co3. At intermediate rotation angles metal bands combine effectively to maintain the level of a bonding, so that a t the triangular hollow site the adsorbed methylene fragment is essentially freely rotating.
We have already indicated in various places along the discussion that when the organic fragment migrates to a more highly bridged site its interactions with the metal strengthen. Geometry 42 is no exception. For all three metal surfaces the total M-C overlap population (Table IV) is higher in the 3-fold geometry (e.g., 0.83 for Co) than in the 2-fold perpendicular geometry (0.79 for Co). Other trends that we have observed for the 7 - 8 migration of methyl hold also for methylene (Table IV). As most of the energy which is associated with a bonding was already gained in the 2-fold geometry further bridging leads to the "normal" increase in the total energy, or equivalently to a decrease in the binding energy of the organic molecule to the metal. Binding of methylene at the 3-fold site of cobalt is consequently by 0.6 eV less favorable than binding a t the 2-fold or at the on-top sites. A similar trend holds for the Cr and the Ti surfaces.
Finally, we note that we are not aware of molecular trinuclear transition-metal cxbene complexes that are stable in the 3-fold capping geometry. Polymetallic carbene complexes usually adopt the 2-fold perpendicular geoemtry.la,'*
We can now proceed to analyze the adsorption of the last fragment, a methyne (CH).
-14 L. v
-26i " ' ' " ' "
a b
Figure 15. DOS of the CH + Co(OOO1) slab system before (a) and after (b) CH chemisorbs on the metal surface (capping geometry). CH states are shown by horizontal bars (a) or a darkened area (b).
Adsorbed Methyne, CH We will compare three different adsorption sites 66, 67, and
68. Again, the calculations are performed for an "unbiased" C-M distance of 2.1 A for all three geometries. The binding energies, overlap populations, and charges are tabulated in Table V. We will analyze the bonding based on DOS and COOP curves.
4 H H
66 67 68
The MOs of the methyne group before and after the adsorption on the hexagonal metal surface in a capping mode are shown in Figure 15. The reason we look at the capping geometry is that this site is the preferred one for both high and low metal electron counts. At the left side are the surface states plus the CH levels before the chemisorption takes place, and the right side is what happens after C H is chemisorbed on the metal surface. C H has five MOs: one of the two carbon sp hybrids pointing toward the hydrogen forms C-H u and u* orbitals. The other hybrid, directed away from the hydrogen, is mainly nonbonding, and so are the degenerate p,, p, orbitals. The u orbital is low in energy and we expect it interacts poorly with the metal d band. u* is high up in energy (off-scale in Figure 15), also out of the effective in- teraction range. What is left for bonding with the surface is the n and p,, p,, orbitals.
Let us focus on Figure 15b. We see that n is pushed down by - 1 eV; at higher energy p is smeared out over the region of -12.3 to -8 eV. Both C H orbitals interact with the metal surface. Which metal orbitals are effective in this interaction? DOS contributions, not shown here, indicate that both metal dZ2 and d,,, d,, are involved. The dzz orbital picks up a resonance with the C H p orbital at -12 eV: interactions of type 6% are important. The d,,, d,, set has resonances with both C H p and a; combinations of type 69b and 69c are effective.

766 J . Am. Chem. SOC., Vol. 110, No. 3, 1988 Zheng et al.
of surface reactions. In the FT synthesis, for example, it is im- portant to know if in the coupling step (step 3, Scheme I) the rate-determining process is the migration of the two (or more) fragments toward each other or if it is the chemical barrier as- sociated with the coupling reaction itself. Unfortunately, the experimental characterization of surface migration (or diffusion) is di f f i~ul t , ,~ and for the CH, fragments little such information is available.
Recently, Muetterties, Shustorovich, and Baetzold developed a remarkably useful and versatile theoretical model for surface migration of atoms and diatomic molecules.36 This is based on a Morse potential for the metal-adsorbent interaction and on the assumption that the M-X (M = metal, X = adsorbent) bond order is conserved along the migration path.36 Our approach is different and is based on the actual calculation of several selected points on the potential energy surface. All necessary data for analyzing the migration of the CH, fragments on the metal surface already have been presented above. A disadvantage of our approach already has been mentioned above-we rely on a molecular orbital method that is very approximate, especially when it deals with the energetics of bond formation. The conclusions we reach gain a little strength when they are supported by overlap population analysis, which together with the energies and other bonding arguments form a self-consistent conceptual picture.
In drawings 72, 73, and 74 we have collected what the com- putations give for the relative binding energies (in eV) at the three symmetry distinguished adsorption sites of methyl, methylene, and methyne, respectively. In each drawing we present the calculated values for Co, Cr, and Ti surfaces.
690 69 b 69c
What happens as C H moves to other adsorption sites, on-top or bridging? We do not show the DOS plots here, but the n level is pushed down a little less than in the capping site. More of a difference is observed in the fate of the p level. It is at ca. -12.5 eV for 68, -12.1 eV for 67, and -1 1.7 eV for the on-top geometry 66.
Motivated by Muetterties and co-worker’s suggestion that a C H group might not be perpendicular to the surface due to M-H interaction:2 we compared two geometries 70a = 67 and 7Ob. Our calculation shows no significant energetic difference, 70b being slightly higher in energy. Nearly all the organometallic analogues have C H or CR in a symmetrical, p,, or capping geometry, 71.32 Binuclear complexes with a bridging C R are well-known,37a as are mononuclear L,M=CR acetylene anal~gues.’’~
a 70 b 71
To summarize our results concerning various CH, groups on the surface, we can simply state that for equal C-M distances, for all adsorption sites, the CH, group would prefer to adopt a geometry that can restore its missing C-H bond(s). Thus, CH, on-top, CH2 bridging, and C H capping are energetically the most stable geometries. This agrees with previous theoretical studies and the available experimental information.
So far we have said nothing of reactivity. But most of the experimental studies of CH, groups cannot avoid the dynamic aspect. Reactions occur. For example, CH2 on Fe(100) is believed to dissociate into C H + H2, beginning a t the bridging position, with one of the C-H bonds parallel to the surface.33 On a Co surface the dehydrogenation of CHI occurs a t a relatively low temperature, 180 K, indicating a small barrier for the process CHzads - CH,d, + H,dS.34 In the next section we are going to analyze the migration of CH, groups on a surface and how the electronic factor affects various reaction processes.
Migration on the Surface Migration of species adsorbed on a surface is a phenomenon
of substantial significance in many areas of surface science (e.g., adhesion, lubrication, etc.). For catalysis, the case of interest here, knowledge of the barriers for the migration of the adsorbed fragments is fundamental to the understanding of the mechanism
~~ ~ ~ ~ ~~~
(32) See, for example: (a) Herrmann, W. A.; Plank, J.; Guggolz, E.; Ziegler, M. L. Angew. Chem. 1980, 92, 660; Angew. Chem., Int. Ed. Engl. 1980, 19, 651. Herrmann, W. A.; Plank, J.; Riedel, D.; Ziegler, M. L.; Weidenhammer, K.; Guggole, E.; Balbach, B. J . Am. Chem. Soc. 1981, 103, 63. (h) Dimas, P. A,; Duesler, E. N.; Lawson, R. J.; Shapley, J. R. J . Am. Chem. SOC. 1980, 102, 7787. (e ) Howard, M. W.; Kettle, S. F.; Oxton, J. A.; Powell, D. B.; Sheppard, N.; Skinner, P. J. Chem. SOC., Faraday Trans. 2 1981, 77, 397.
(33) Rhodin, T. N.; Brucker, C. F.; Anderson, A. B. J . Phys. Chem. 1978, 82, 894.
(34) Steinbach, F.; Kiss, J.; Krall, R. Surf. Sci. 1985, 157, 401. (35) (a) Ertl, G. In The Narure of the Surface Chemical Bond; Rhodin,
T. N., Ertl, G., Eds.; North-Holland: Amsterdam, 1979; Chapter 5. (b) Schmidt, L. D. In Interaction on Metal Surfaces; Gomer, R., Ed.; Springer: Berlin, 1975. (c) Muetterties, E. L.; Rhodin, T. N.; Band, E.; Brucker, C. F.; Pretzer, W. R. Chem. Rev. 1979, 79, 91.
(36) (a) Baetzold, R. Surf. Sci. 1985, 150, 193. (b) Muetterties, E. L.; Shustorovich, E.; Baetzold, R. C., preprint. (e ) Shustorovich first treated the migration barrier in a chemical way: Shustorovich, E. J . Am. Chem. Soc. 1984,106,6479. (d) For an excellent review see: Shustorovich, E. Surf. Sci. Rep. 1986, 6, I . (e) A recent theoretical study suggests that for CH3 on Ni, Pd, and Pt(ll1) the on-top site is less stable by 4 kcal/mol than the bridging site: Shustorovich, E. Surf. Sci. 1986, 176, L863.
(37) (a) Holton, J.; Lappert, M. F.; Pearce, R.; Yarrow, P. I . W. Chem. Rev. 1983,83, 135. (b) Fischer, E. 0.; Shubert, U. J . Organomel. Chem. 1975, 100, 59.
c o :
cr :
T i :
0 0 1 1 1 4
0 0 09 09
G O 0 5 01
7 2
Relolive E ( a V 1 :
Co : 0.0 0.0 0.6
Cr : 0.0 0.1 0.5
T i : 0 0 0.0 0.3
73
Re1ot:ve E , e \ ) :
Co 0.0 0.3 0.5
Cr 0.0 0.4 0.9
T i 0.0 0.1 0.6
74
A low migration barrier can be observed only if there are a t least two sites connected or nearby on the metal surface for which the binding energies of the organic fragment are similar. Let us call these sites A and B. In this case the lowest energy path for the migration of the fragment is simply along the A - B - A ... path. The energy barrier for the migration is then determined by the energy differences between points A and B. The relative energies of other binding sites (C, D, etc.) are of no significance to the migration process because even if these points are very high

Bonding and Coupling of C, Fragments on Metal Surfaces
in energy they can be circumvented by migration along the A - B - A path.
Let us look first a t the migration of a methyl fragment that is shown in 72. For a cobalt surface the site with the highest binding energy (Le., the lowest point on the potential energy surface) is the 1-fold "on-top" site. The two other sites are considerably higher in energy. The lower energy one of these is the 2-fold site, 1.1 eV higher in eriergy than the 1-fold site. The theoretical prediction is that the migration of methyl on a cobalt surface will require relatively high temperatures and should proceed mainly along the (formal) metal-metal bonds, via the path shown by the dotted line in 75. Migration occurs along the (formal) metal-metal bonds. When the electron count on the metal is lowered the bridged positions are differentially stabilized and the barriers to migration should be considerably lower. For the Ti surface the barrier to migration along the path shown in 76 (which is the lowest in energy) is only 0.1 eV. For the Cr surface the barrier is calculated to be the same (0.9 eV) along either path 75 or 76.
7 s 76
Why does the migration barrier decrease as the metal d band is depopulated? Remember the main interaction is between the methyl lone pair n and the metal d band, 77. The metal d band region is weakly C-M antibonding (cf. Figure 4). The strength of the antibonding character depends on the overlap between n and the metal d band. The higher the coordination number of the CH3 group, the stronger the C-M antibonding character in the metal d band. Thus a t high d band filling the capping ge- ometry is less stable, because of its stronger C-M antibonding contribution within the increasingly occupied d band. At lower band filling the C-M antibonding feature is reduced, and the higher coordination sites of CH3 stabilize n more. So the barrier is reduced.
77
For methylene the situation is different. Migration on a cobalt surface occurs with no barrier along a path (with no rotation of the CH, group) shown by the dashed line in 78. The same lowest energy migration path is calculated for CHI on the Cr and Ti surfaces (see also the more detailed discussion above).
18
The migration of a CH fragment is relatively facile; the barriers along path 79 are only 0.3, 0.4, and 0.1 eV for Co, Cr, and Ti, respectively. This migration path remains the lowest in energy for all metals, and for those with lower electron counts the binding preference for the 2- and 3-fold sites even increases.
19
J . Am. Chem. SOC., Vol. 11 0, No. 3, 1988 161
Scheme 111 H,C-CH,
The reason that the migration barriers for CH, and CH do not change much at low metal band filling derives from the fact that in addition to orbital n (u) some other orbitals (p) also play a decisive role in the bonding. Details of the analysis have been given above. One can say that the p orbital, being very close to the d band in energy, mixes very strongly with the metal orbitals (cf. Figures 10 and 12). This mixing, shown in 80, may contribute to C-M bonding even at high d band filling. Thus two types of interaction, 77 and 80, compete to determine the migration barrier.
met01
80
Knowledge of the barriers to migration has, of course, inter- esting implications regarding the coupling steps in the FT synthesis. For example, the calculations suggest that on a cobalt surface, the coupling of methyl and methylene may occur preferably by migration of CH2 toward the adsorbed methyl rather than by migration of methyl. Furthermore, the coupling of two methyl fragments may involve a substantial barrier for migration, while the coupling of two methylenes should require no such barrier. To demonstrate the implications of these results let us assume that the barriers to the coupling processes themselves are small so that the migration processes determine the rate of the FT reaction. The above results suggest that in such a case the rate of coupling of two methyls, but not that of two methylenes, should be reduced at lower temperatures. Thus, the coupling of two methylenes (or of a methylene and a methyl) would be favored a t lower tem- peratures and higher yields of ethylene expected. Similar analysis can lead to interesting conclusions regarding the Cr and Ti metal surfaces and the other coupling reactions.
The Coupling Reactions The coupling reactions in Scheme I11 model some of the pro-
cesses that determine chain length and olefin proportion among the FT product. In this treatment we assume that methyl and methylene are reasonably good models for other adsorbed alkyl (CnH2,+J or alkylidene (C,H,,) fragments. Thus, the coupling of two methyls (reaction a in Scheme 111) models a termination step that yields alkanes. A similar termination process (not shown here), that also yields alkanes, is the coupling of adsorbed alkyl and H fragments. A termination process, leading to olefins, is modeled by the coupling of two methylenes (reaction b in Scheme 111). The coupling of methylene and methyl (reaction c in Scheme 111) models the major propagation step in the FT reaction. Other coupling reactions that may also contribute to the overall FT process, e.g., CH, + C H - CH2=CH, were not included in this study.
By studying these coupling processes we hope to gain under- standing into basic questions concerning the FT synthesis. Typical questions are the following: What are the factors that control these reactions? Are steric or electronic factors more important? Why does the Schult-Flory distribution change when the metal catalyst is varied?lc We cannot answer these questions definitely, but we hope to extract some useful information from our calcu-

768 J . Am. Chem. SOC., Vol. 110, No. 3, 1988 Zheng et al.
Scheme IV
+ CH,-CH, H3
lations. Insight into these problems, even at a relatively primitive level, could help chemists design new catalysts with improved selectivities.52
We find it conceptually advantageous to partition each coupling reaction and the energy barrier associated with it into four discrete steps, shown schematically in Scheme IV. The first is the mi- gration process (step a in Scheme IV), which was discussed in detail in the previous section. In the second step the reacting fragments reach two adjacent metal atoms (step b in Scheme IV). The energy that is associated with this step is denoted as the “proximity” energy (PE), and it is not directly related to the migration barrier. The migration barrier is the lowest energy that is required for the migration of a fragment from one binding site to the other, with no other fragments in close proximity, Le., a t near zero coverage. The “proximity” energy denotes the energy that is required (or which is liberated) to bring the fragments to neighboring binding sites. The PE gives information on the in- teractions (steric and electronic) between the reactant fragments a t early stages of the coupling process. It is also obviously related to the energetics of moving from low to high coverage. The third step (step c in Scheme IV) is the coupling reaction itself. The last step (d in Scheme IV) corresponds to desorption removal of the product molecule from the surface. One would not expect any activation energy for desorption of ethane, so steps c and d will merge in that case. Buf if the product is unsaturated-an alkyl group or an ethylene-it might stick to the surface after coupling. The total energy that is required to execute a certain reaction is affected by the energies of these 4 steps, i.e., migration, “proximity”, coupling, and desorption.
Let us proceed now to discuss these discrete steps for the re- actions in Scheme 111. First a technical note on the way the calculations were carried out. All the previous calculations, for reasons of computational economy, were performed assuming a 1/3 coverage. If we bring another CH, group into the unit cell, the high 2/3 coverage will certainly lead to great crowding. A geometry such as 81 is forced. In our calculation for this and all other reactions we delete the interactions of the C, groups between unit cells, so that there is no crowding whose cause is inter-cell interaction. In other words, we are modeling a reaction in which two methyl groups come together locally, but remain isolated from other methyls on the surface. On the Cr surface the C, fragments were attached to metals along the shorter Cr-Cr bonds of 2.49 A.
81
The “Proximity” Energies (PES). The DOS curves for CH3 on Co in such a coverage (not shown here) show a splitting of all CH, states. Such a splitting in the occupied states, shown in 82 for a low-lying u orbital, is highly destabilizing as it is a typical four-electron,two-center repulsion. The COOP curves also indicate regions of C-C antibonding.
( n , + “1 In, - n 2 1
82
83 gives computed binding energies per CH3 for the coverage shown in 81 but with all inter-cell interactions cut. For com- parison, 83 also gives binding energies of an “isolated” adsorbed CH, fragment (see Table 111). The differences between these binding energies, also presented in 83, give the “proximity” energies (PES) per CH3 fragment. In the indicated eclipsed geometry the calculated methyl PES (per CH, fragment) are 0.7, 0.5, -0.1 eV for the Co, Cr, and Ti surfaces, respectively. The energies required to bring two methyl fragments to neighboring surface metal atoms are twice the above values.
.& AC. I I
m M m M m
Binding E par CHI i e V )
‘ isoiotcd’ BE PE
T i 5 4 5 5 - 0 1
Cr 4 3 3 8 0 5
Ca 3 7 3 0 0 7
83
To gain additional information on the origin of the “proximity” energies we have compared the above PES with the corresponding values for the two “nonbound” eclipsed methyl groups (Le., omitting the metal surface in 83). The energy of two “nonbound” eclipsed methyl radicals which are separated by a C-C distance of 2.51 A (as in 83) is 1.2 eV higher than that of two isolated non-interacting methyl fragments. This value reflects the strong steric repulsions between the hydrogens which are only 1.48 A apart. Rotation of one of the methyl groups by 60’ to a staggered conformation increases the steric congestion even further and the repulsion energy rises to 2.7 eV. The steric interactions are reduced considerably (i.e., to only 0.2 eV in the eclipsed con- formation), a t a separation of 2.95 A-the M-M distance in the Ti surface. The adsorbed organic fragments are negatively charged (Table 111) so that it is reasonable to assume that the interaction between two “nonbound” methyl anions is a better model for the surface situation than the interaction between two neutral methyl radicals. At C-C separation distances of 2.51 and 2.95 A the repulsion between two “nonbound” eclipsed methyl anions is 1.8 and 0.4 eV, respectively. Indeed, on the Co surface the PE of two adsorbed CH3 groups is 2 X 0.7 = 1.4 eV, a value intermediate between the interaction energies of two “nonbound” CH, radicals and anions. This value is of reasonable magnitude considering that the charge on the adsorbed methyl is -0.59 (Table 111). However, the steric and electrostatic repulsion between the neg- atively charged alkyl groups do not reveal the entire story. For example, on the Cr surface, two adsorbed CH3 groups repel each other by 1.0 eV, although a t the same separation distance (2.49 A) the repulsion between two “nonbound” methyl groups, either neutral or negatively charged, is much larger (2.8 eV for the radicals). Similarly, on the Ti surface the negatively charged (-0.79) adsorbed methyl groups attract each other by 0.2 eV, while at the same C-C separation the interaction between two “nonbound” methyl fragments, either neutral or negatively charged, is repulsive. Apparently, as the two adsorbed methyls approach each other additional attructiue forces come into action. We have not identified the electronic origin of these attractive forces in detail, but we note that their magnitude depends on the metal and that they are relatively small for Co and larger for Cr and Ti. The electronic nature of these attractive forces can be demonstrated also in the following manner. When the calculations for the Ti surface are repeated with use of the shorter Co-Co distances of 2.51 A, the PE for CH, increases moderately, from -0.1 to 0.3 eV. However, this value is still significantly lower than

Bonding and Coupling of C, Fragments on Metal Surfaces
the methyl PE on cobalt of 0.7 eV, although the methyl groups are more negatively charged when adsorbed on Ti (Table 111). Apparently, for the Ti surface there is an additional attractive electronic effect (compred to Co) which compensates for the increased electrostatic repulsions between the methyls a t the shorter M-M distance of 2.51 A. Calculations for the Ti surface with use of the “rigid band” model (i.e,, with the Co E H param- eters and surface geometry, but a d4 occupancy) give a PE of 0.8 eV, much higher than the 0.3 eV calculated with use of the same geometry but with the Ti parameters. This suggests that the position of the Fermi level, rather than the d occupancy, plays the dominant role in determining these PES.
The calculated PES for methylene groups (per CH,) are given in 84. As with the methyls, the PE decreases from Co to Cr and it becomes attractive for Ti. The absolute values of the PE are generally somewhat smaller for CH, than for CH,.
sindlnq E per cnp (ev)
“isoloted” BE PE
T i 104 105 -0 I cr 0 0 7 7 0 3
Ce 6 3 5 0 0 5
84
The PES in 84 can be compared with the analogous values for two “nonbound” CH2 groups. At a C-C distance of 2.51 and 2.95 A two neutral methylenes attract each other by 0.7 and 0.1 eV, respectively, while two doubly negatively charged CH2 groups repel each other by 1.3 and 0.3 eV, respectively. These energies should be compared with the PES in 84 multiplied by 2. The adsorbed CH, groups are strongly charged (-1.54, -1.53, and -1.59 on the Co, Cr, and the Ti surfaces, respectively, Table IV), and their mutual electrostatic repulsion is the major factor that determines the PE in 84. Steric effects are unimportant. As for the CH3 groups, also with the CH, fragments, a compensating attractive force reduces the PES so that they are smaller than expected on the basis of the electrostatic repulsions alone.
The PES for neighboring methyl and methylene fragments are given in 85 (the given values are for the two fragments). The geometry of the organic fragments in 85 is electrostatically the most stable arrangement. At a C-C separation of 2.51 A rotation of the methyl group by 60’ has almost no effect on the energy of “nonbound“ CH3 + CH2 fragments, but the energy increases by 1 eV for the triply charged (CH3 + CH,) unit. Similarly, on Co a 60° rotation of the methyl group increases the PE from 1.2 to 2.4 eV. The (CH, + CH2) PES in 85 can be understood as being simply the sum of the PES of CH, and of CH,. For example, on Co, PE(CH,) + PE(CH2) = 0.73 eV + 0.53 eV = 1.26 eV, compared with the directly calculated PE(CH3 + CH,) of 1.21 eV (see 85). Thus, the electronic and steric effects discussed above for CH3 and CH, dictate also the PES for the CH3 + CH, couple. Let us proceed to analyze the coupling processes in Scheme 111.
Binding E i e V i E ,
‘8ioIaled 0E PE
TI 150 1 6 0 - 0 2
Cr 1 2 3 115 O B
co 10 I 0 0 I 2
8 5
The Coupling Reactions. CH, + CH,. What happens when two CH, groups couple? First, let us examine the overall ther- modynamics of the process. In the coupling process a new C-C bond is formed but two M-C bonds are lost. Whether the reaction is exothermic or endothermic is determined primarily by the relative strengths of these bonds (the surface binding energy of ethane is assumed to be much smaller than the above bond en- ergies), which are not easily obtainable experimentally and which
J . Am. Chem. SOC., Vol. 11 0, No. 3, 1988 769
cannot be calculated reliably with the extended Huckel method. However, we believe that the calculations are sufficiently reliable to allow us to comment on the changes that occur in the reaction thermodynamics as the metal surface is changed. Thus, as the metal is changed from Co to Ti the M-C bond energy increases (see binding energies in 83 or Table 111) and this should increase the endothermicity of the coupling reaction, as is indeed found in the calculations (see below). Thus, the coupling of two methyl groups becomes increasingly endothermic, Le., by 0.9, 4.7, and 7.1 eV, on moving along the series Co - Cr - Ti, respectively.
What can we predict for the barrier to the dimerization re- action? Here interesting electronic factors, speciJic to reactions occurring on metal surfaces, come into action. The reaction begins with both CH3 lone pairs nearly filled, i.e., near a CH3- repre- sentation. As the reaction proceeds a new C-C a bond forms, and as usual we must consider a and n* combinations, Le., nl f n2. Both are filled initially, but as the C-C bond is more com- pletely formed the a* (n, - nz) combination will be pushed up in energy and eventually will dump its electrons into the metal d band.
Let us sample such a reaction on the surface by using a transit along a single reaction coordinate 6, see 86. The “umbrella handle” of the CH3 group is moved along and perpendicular to an arc of a circle. The circle is defined as “standing” on the metal atom, such that when the rotation angle 6 = 90° the C-C distance is 1.54 A as in ethane (C to surface separation is 2.59 A). 6 = 0’ corresponds to the initial geometry with the “umbrella handle” perpendicular to the surface and bonded to the metal atom, M-C being 2.1 A. This transit is probably not optimal, a true reaction path, but it can give us some information concerning the controlling electronic factors. Unfortunately, full exploration of the potential surface is not realistic with our computational capabilities and method.
e = 0’ e = go’
86
Figures 16 and 17 show the methyl lone pair contribution to the total DOS and C-C COOP curve along the reaction coordinate 6. Before the coupling starts (6 = 0’) n-CH, already has split into two peaks around -13 eV. The higher one is n, - n2 and the lower one nl + n, (cf. 82). But at a C-C separation of 2.51 A and with the two “umbrella handles“ parallel, n, - n2 is still hardly antibonding. At 6 = 30’ the antibonding portion (-12 to I eV, of Figures 16 and 17) separates from the bonding part (-14 eV) and at 0 = 60’ it is well above the Fermi level.
What if the position of the Fermi level changes? From the above discussion the total energy of the system increases along the path as nl - n, becomes more antibonding. When nl - n2 is pushed above the Fermi level it becomes empty. After this turning point in the reaction path the total energy should go down again as nl + n2 becomes continuously more bonding. The position of the Fermi level determines the turning point and the barrier height. The higher the Fermi level, the further away that turning point is from the starting geometry (i.e., a ”late” or “product-like” transition state), and the higher the barrier. Figure 18, showing the computed energy profile along the idealized reaction path, confirms this line of reasoning. The coupling barrier on Co is lower than that on Cr, which in turn is lower than that on Ti. Note that the “proximity” energies (see 83) decrease as the metal is changed from Co to Cr to Ti, while the actual coupling barriers and the reaction endothermicities increase from Co to Ti. Thus, the ”proximity” energies act to moderate the differences in the coupling energies between the different metals. (As with other extended Huckel energies, we do not trust the absolute energies sufficiently to try to predict the actual coupling barriers.)
We note here some important connections to earlier work: Mango and Schachtschneider made a clever suggestion early on
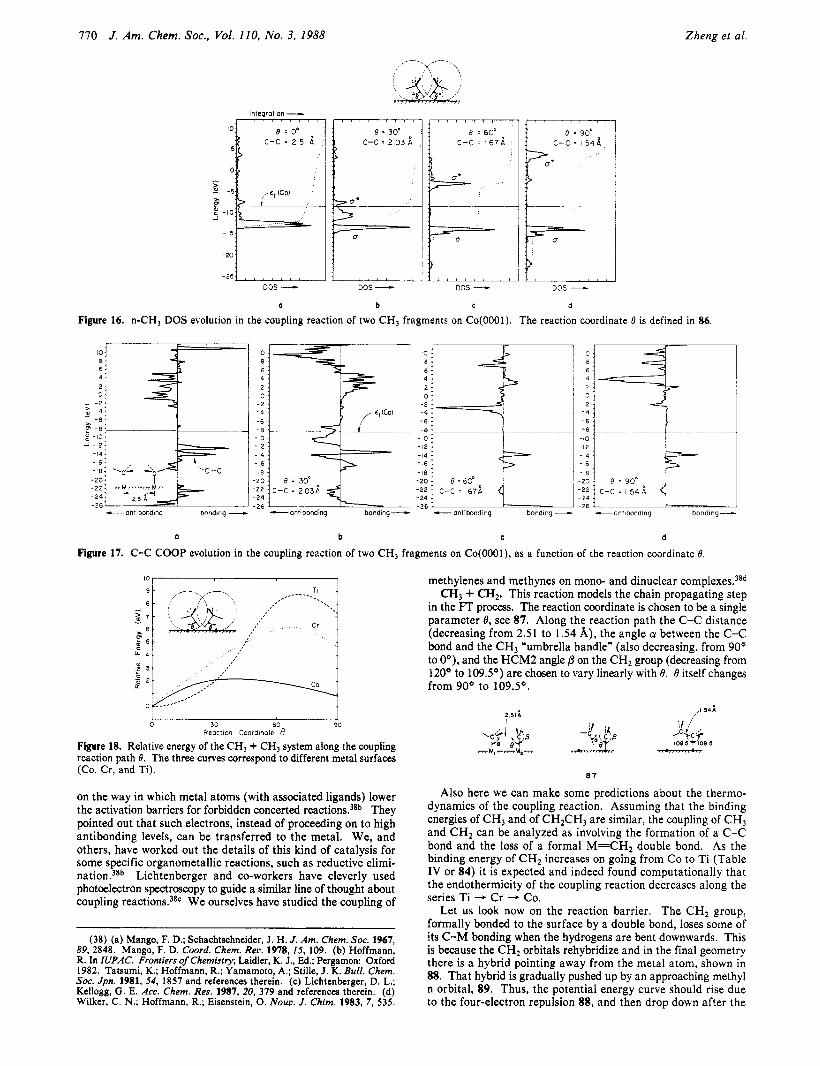
I10 J . Am. Chem. Soc., Vol. 110, No. 3, 1988 Zheng et ai.
lnteqration - C-C : 2 03 8
-20 1 I f
DOS - DOS -
E :60“ C - C = i 6 7 8
___
DOS -
~ c - c : I 5 4 4
1
i DOS - a b C d
Figure 16. n-CH, DOS evolution in the coupling reaction of two CH, fragments on Co(OOO1). The reaction coordinate 6 is defined in 86.
c a n t i b o n d i n g bonding - ::41;-E : :z3i Q 1 - 2 4 - 26 --- antibonding bondinq- - antibonding bonding -
a b C d
Figure 17. C-C COOP evolution in the coupling reaction of two CH3 fragments on Co(OOOl), as a function of the reaction coordinate 6.
I 0 30 60 90
Reaction Coordinote 8 Figure 18. Relative energy of the CH, + CH, system along the coupling reaction path 8. The three curves correspond to different metal surfaces (Co, Cr, and Ti).
on the way in which metal atoms (with associated ligands) lower the activation barriers for forbidden concerted reactions.38b They pointed out that such electrons, instead of proceeding on to high antibonding levels, can be transferred to the metal. We, and others, have worked out the details of this kind of catalysis for some specific organometallic reactions, such as reductive elimi- nation.38b Lichtenberger and co-workers have cleverly used photoelectron spectroscopy to guide a similar line of thought about coupling reactions.38c We ourselves have studied the coupling of
(38) (a) Mango, F. D.; Schachtschneider, J. H. J. Am. Chem. SOC. 1967, 89,2848. Mango, F. D. Coord. Chem. Rev. 1978, 15, 109. (b) Hoffmann, R. In IUPAC. Frontiers ojChemistry; Lsidlcr, K. J., Ed.; Pergamon: Oxford 1982. Tatsumi, K.; Hoffmann, R.; Yamamoto, A.; Stille, J. K. Bull. Chem. SOC. Jpn. 1981, 54, 1857 and references therein. (c) Lichtenberger, D. L.; Kellogg, G. E. Acc. Chem. Res. 1987, 20, 379 and references therein. (d) Wilker, C. N.; Hoffmann, R.; Eisenstein, 0. Nouv. J. Chim. 1983, 7, 535.
methylenes and methynes on mono- and dinuclear complexes.38d CH3 + CH2. This reaction models the chain propagating step
in the FT process. The reaction coordinate is chosen to be a single parameter 0, see 87. Along the reaction path the C-C distance (decreasing from 2.51 to 1.54 A), the angle a between the C-C bond and the CH3 “umbrella handle” (also decreasing, from 90° to OO), and the HCM2 angle on the CH, group (decreasing from 120’ to 109.5O) are chosen to vary linearly with 0. 0 itself changes from 90° to 1 0 9 . 5 O .
,I 54; 2 S l f
a 7
Also here we can make some predictions about the thermo- dynamics of the coupling reaction. Assuming that the binding energies of CH3 and of CH2CH3 are similar, the coupling of CH3 and CHI can be analyzed as involving the formation of a C-C bond and the loss of a formal M=CH2 double bond. As the binding energy of CH, increases on going from Co to Ti (Table IV or 84) it is expected and indeed found computationally that the endothermicity of the coupling reaction decreases along the series Ti - Cr - Co.
Let us look now on the reaction barrier. The CHI group, formally bonded to the surface by a double bond, loses some of its C-M bonding when the hydrogens are bent downwards. This is because the CHI orbitals rehybridize and in the final geometry there is a hybrid pointing away from the metal atom, shown in 88. That hybrid is gradually pushed up by an approaching methyl n orbital, 89. Thus, the potential energy curve should rise due to the four-electron repulsion 88, and then drop down after the

Bonding and Coupling of C, Fragments on Metal Surfaces
antibonding level is pushed above the Fermi level and transfers its electrons to the metal.
88 89
The contribution of the methylene p orbital to the total DOS along the reaction coordinate (not shown here) is similar to that of the methyl n orbital in Figure 16. A portion of the total contribution, corresponding to the C-C c* level, gradually climbs from below the Fermi level. The computed potential energy curve along the reaction path also has the same feature as that in Figure 18 for the methyl coupling case. Again for reasons similar to those discussed for the CH3 + CH, case, as the metal Fermi level is lowered the barrier height is reduced and the activation energy peak is shifted to the left side, Le., to a more "reactant-like" transition state. The n-CH, and u-CH2 (=n-CH2) states also have as expected a portion corresponding to the C-C d' level rising up along the reaction path, but these graphs are not shown here.
We should like to mention here the recent remarkable dem- onstration of methyl-methylene coupling in model binuclear or- ganometallic systems by Maitlis and co-workers.'2d
CH2 + CH,. The surface precursor could start in either a parallel, 90, or a perpendicular geometry, 91. The possibility of the perpendicular mode is anticipated from our earlier discussion that on the hexagonal surface the capping geometry for a CH2 group may have lower energy for low d band filling (see 73 and 80). However, geometry 91a, with each CH2 group sitting directly above the metal triangular hollow, requires a C-C separation of 1.45 A. This is obviously not a realistic starting geometry and our calculation indeed gives a large repulsion for 91a.
a b 90
a b 91
To find the appropriate reaction path for that geometry is beyond our means. Instead we will explore some limited parts of the potential surface, in particular those very close to the final product in the coupling process. Before we proceed to analyze in some detail the geometry of the product ethylene we note that calculations similar to those discussed above for reactions a and c in Scheme I11 (starting from geometry 90a and using 0 as the reactions cwrdinate) suggest that in contrast to the other reactions the coupling of two methylenes is exothermic and that no energy barrier exists along the reaction path. Thus, the theoretical prediction for all three metal surfaces is that the coupling of two methylenes is continuously exothermic, so that when two me- thylenes reach neighboring metal sites they couple spontaneously. This implies that the assembly of the two organic fragments (Le., the PES in 84) is the only endothermic step in the surface coupling of two methylenes. This contrasts with the coupling of two methyls (Figure 18) and of a methyl and a methylene, where the reactions are endothermic and energy barriers exist along the reaction path. There are of course obvious differences in the desorption step that might follow these coupling reactions.
Let us now discuss the geometry of the adsorbed product.
Ethylene Adsorbed on a Co Surface But what is the final geometry? The known molecular complex
92 has a "parallel" geometry. The C-C distance is - 1.52 A,
J . Am. Chem. Soc.. Vol. 110, No. 3, 1988 I11
characteristic of a single bond. The C-M distance is -2.0 A (M = Fe),39a and the hydrogens bend away from the metal.
1 5 2 i
I <\ 1 <?
7 -I M-M
92
Some information is available concerning the geometry of chemisorbed ethylene. Ibach and Lehwald have compared the vibrational frequencies of C2H4 on Pt ( l l1 ) with those of Zeise's salt (K[PtC13(C2H4)].H20) and concluded that the carbon atoms have sp3 hybridization.aa Comparison of experimental pho- toemission data with an SCF-LCAO calculation on ethylene in different geometries by Demuth suggested that the C-C distance is 1.34-1.49 A and the C-C-H angle is 106-109S0 for ethylene on C u ( l l l ) , N i ( l l l ) , P d ( l l l ) , and Pt( l l l ) .40b A recent HREELS study by Stroscio, Bare, and H o also suggests that adsorbed ethylene is characterized by sp3 h y b r i d i ~ a t i o n . ~ ' ~ Comparison of NEXAFS of gaseous and chemisorbed (on Pt- (1 11)) ethylene led to a proposal of a single C-C distance of 1 S 3 A.4 'b
Interestingly, on Pt( 11 1) precovered with oxygen there is a mixture of both di-a-bonded (sp3) and r-bonded (sp2) ethylene.4k On NiO(100) evidence exists for two adsorption states of ethylene.42b At high temperature ethylene also transforms into ethylidyne, H3C-C=.42*43 Other possibilities include hydro- genolysis@ or dehydr~genat ion~~~ of ethylene on the surface. Since the pioneering work of Rosch and R h ~ d i n ? ~ ~ Anderson,45e and Demuth,40 there have been many theoretical studies of ethylene interacting with metallic clusters of finite size.45 A recent paper by B a e t ~ o l d ~ ~ ' also studies ethylene on late transition-metal ( 1 11) surfaces.
From the available experimental information we choose the following geometry: C-C = 1.45 A, the HCH plane bent upward
(39) (a) Bonnet, J. J.; Mathieu, R.; Poilblanc, R.; Ibers, J . A. J . Am. Chem. SOC. 1979,101,7487-7496. (b) Green, M.; Laguna, A.; Spencer, J. L.; Stone, F. G. A. J . Chem. Sm., Dalton Trans. 1977, 1010-1016. (c) Motyl, K.; Norton, J. R.; Schauer, C. K.; Anderson, 0. P. J . Am. Chem. SOC. 1982, 104, 7325-7327. (d) Burke, M. R.; Takats, J.; Grevels, F.-W.; Reuvers, J . G. A. J . Am. Chem. SOC. 1983, 105, 4092-4093. (e) Theopold, K. H.; Bergman, R. G. Organometallics 1982, I , 1571-1579. (f) Dedieu, A,; Hoffmann, R. J. Am. Chem. Soc. 1978, 100, 2074-2079.
(40) (a) Ibach, H.; Lehwald, S. J . Vac. Sci. Technol. 1978, 15, 407. (b) Demuth, J. E . IBM J . Res. Deu. 1978, 22, 265.
(41) (a) Stroscio, J. A.; Bare, S. R.; Ho, W. Surf. Sci. 1984, 148, 499. (b) Stohr, J.; Sette, F.; Johnson, A. L. Phys. Reu. Letl. 1985, 53, 1684. (c) Horsley, J . A,; Stohr, J.; Koestner, R. J. J . Chem. Phys. 1985, 83, 3146.
(42) (a) Steininger, H.; Ibach, H.; Lehwald, S . SurJ Sci. 1982, 117, 685. (b) Furstenau, R. P.; Langell, M. A. Surf. Sci. 1985, 159, 108.
(43) (a) Koestner, R. J.; van Hove, M. A,; Somorjai, G. A. Surf. Sci. 1982, 121, 321. (b) Lloyd, D. R.; Netzer, F. P. Ibid. 1983, 129, L249. (c) Creighton, J. R.; White, J. M. Ibid. 1983, 129, 327. (d) Demuth, J. E. Ibid. 1979, 80, 315, 367. (e) Albert, M. R.; Snedden, L. G.; Eberhardt, W.; Greuter, F.; Gustafsson, T.; Plummer, E. W . Ibid. 1982, 120, 19. (0 Baro, A. M.; Ibach, H. J . Chem. Phys. 1981,74,4194. (g) Ibach, H.; Hopster, H.; Sexton, B. Appl. Phys. 1977, 14, 21. (h) Felter, T. E.; Weinberg, W. H. Surf. Sci. 1981, 103, 265. (i) Gates, J. A,; Kesmodel, L. L. Ibid. 1983, 124, 68; 1982, 120, L461. 6 ) Kesmodel, L. L.; Gates, J. A. Ibid. 1981, I l l , L747. (k) Lehwald, S.; Ibach, H. Ibid. 1979, 89, 425. (I) Dubois, L. H.; Caster, D. G.; Somorjai, G. A. J. Chem. Phys. 1980, 72, 5234. (m) Kesmodel, L. L.; Dubois, L. H.; Somorjai, G. A. Ibid. 1979, 70, 2180. (n) Stair, P. C.; So- morjai, G. A. Ibid. 1977, 66, 2036. (0) Lo, w. J,; Chung, Y. w.; Kesmodel, L. L.; Stair, P. C.; Somorjai, G. A. Solid State Commun. 1977, 22, 335. (p) Demuth, J. E.; Eastman, D. E. Phys. Rev. Lett. 1974, 32, 1123. (4) Skinner, P.; Howard, M. W.; Oxton, I. A,; Kettle, S. F. A.; Powell, D. B.; Sheppard, N. J. Chem. Soc., Faruduy Trans. 2 1981, 77, 1203. (r) Stuve, E. M.; Madix, R. J. J. Phys. Chem. 1985, 89, 3183; Surf. Sci. 1985, 160, 293. (s) Hills, M. M.; Parmeter, J. E.; Mullins, C. B.; Weinberg, W. H. J. Am. Chem. SOC. 1986, 108, 3554.
(44) Goodman, D. W. Surf. Sci. 1982, 123, L679. (45) See, for example: (a) Anderson, A. B.; Hoffmann, R. J . Chem. Phys.
1974,61, 4545. (b) Anderson, A. B. J. Am. Chem. SOC. 1977, 99, 696. (c) Howard, I. A,; Dresselhaus, G. Surf. Sci. 1984, 136, 229. (d) Rosch, N.; Rhodin, T. N. Phys. Rev. Lett 1974, 32, 1189. (e) Anderson, A. B. J. Chem. Phys. 1976, 65, 1729. (f) Baetzold, R. C. Langmuir, submitted for publica- tion.
(46) (a) Dewar, M. J. S . Bull. SOC. Chim. Fr. 1951, 18, C79. (b) Chatt, J.; Duncanson, L. A. J. Chem. SOC. 1953, 2939.

112 J . Am. Chem. Soc., Vol. 110, No. 3, 1988 Zheng et al.
Table VI. Binding Characteristics of Ethylene on the Co(OOO1) Surface overlap populationb orbital occupation
geometry binding E (eV). c-c C-M U P x* total charge on ethylene
IC-&< ,,>Y 2.0 0.83 0.38 1.94 1.75 1.28 -1 .o
U\u'
1 .o 0.86 0.23 1.95 1.79 1.08 -0.4 (c--c,
u- .Y1 -0.7 0.85 0.10 1.92 1.73 0.90 -0.9
"The binding energy is defined as E(s1ab) + E(p1anar ethylene) - E(system). A positive sign means ethylene is bound. bFor a comparison the C-C overlap population for the planar molecule is 1.30 and for the bent one 1.16.
by 30° but the HCH angle remaining 120O. We are going to compare three different adsorption sites 93,94, and 95, assuming a C-M distance 2.1 A for all. Since most experimental studies are on late transition we will perform the calculation only for Co(OOO1). The choice of these geometries is based on our knowledge of organometallic compounds, in particular those in ref 38, and the structure of Zeise's salt.47
+\c - c,2 +: - ;'/ \ y I\
< I , I \ I
, * . , M-I-M.: n M m M m M r
M---M
sowhorse
93 butterfly
94
For the small degree of bending or puckering assumed, the ethylene orbitals will change little on going from the planar molecule to the puckered one. This was confirmed by calculations-96 shows some of the valence orbitals:
r and r*, responsible for the important forward and back-donation in the Dewar-Chatt-Duncanson mix in some u character. Another u orbital, its lobes directed inward, may also play an important bonding role, especially in geometry 95, through an overlap of type 97.
sr
We compare the ethylene orbital contribution to the total DOS for those three absorption sites, 93,94, and 95 in Figure 19. Upon adsorption all occupied orbitals (up to A ) remain approximately where they were before adsorption. The unoccupied orbitals (above r*) are all smeared out, more so for geometry 95.
Let us zoom in at those three orbitals u, r, and A* whose lobes point toward the metal surface and thus should have the greatest potential for metal-ethylene interaction. The calculations (sum- marized in part in Table VI) show that n interacts little, most in the capping geometry 95. Even there it donates no more than 4% of its electron density to the surface. A typical interaction involved is 98. A similar conclusion holds for r; in the capping geometry r donates more electrons and is pushed down more. But in the butterfly geometry 94 there is no indication that the in-
(47) Love, R. A.; Koetzle, T. F.; Williams, G . J . B.; Andrews, L. C.; Bau,
(48) Jorgensen, W. L.; Salem, L. The Organic Chemist's Book of Orbitals;
(49) Vannice, M. A. J . Catal. 1975, 37, 449, 462.
R. Inorg. Chem. 1975, 14, 2653.
Academic: New York, 1973; pp 11-17.
-24 1 - 2 6 & , , , , , , , , 1 -28
DOS- DOS - DOS - a b C
Figure 19. A comparison of total DOS for ethylene (bent) chemisorbed systems of different adsorption geometries on Co(ooO1): (a) the sawhorse geometry; (b) the butterfly geometry; (c) the capping geometry. The darkened area shows the ethylene contribution.
-141 : ; ; I , , , , , , , , , I::, , , , , , , , , -20
- 24 - 24 - 26 -26 -28
-22 -22
DOS - DOS - a b
-28- DOS -
C
Figure 20. A comparison of ethylene P* states on three adsorption geometries: (a) sawhorse; (b) butterfly; (c) capping.
teraction is stronger than in the sawhorse geometry, mostly due to the fact that r has its lobes pointing outward, away from the metal atom, 99. Table VI shows that r has donated substantial density to the surface.
98
2% 99

Bonding and Coupling of CI Fragments on Metal Surfaces
The biggest difference occurs in the a* orbital, and for this one we offer a decomposition of the DOS in Figure 20. a* is smeared out more along the energy scale as the geometry goes from 93 (sawhorse) to 94 (butterfly) to 95 (capping). In the sawhorse geometry a* interacts only with the top of the d bond (M-M antibonding). A characteristic interaction (dZ2) is shown in 100. In the butterfly modes it interacts with the entire d,, band 101, especially those portions that match the energy of a*. So we
100 101
expect the interaction to be stronger and a* spread out more. The capping geometry 95 still remains the most effective for interaction and we see a* dispersed most. Again this is due to the fact that more metal atoms and orbital combinations are available to in- teract with a*. From its band width and proximity to the Fermi level we can conclude that a* has the strongest interaction with the metal and is primarily responsible for the binding.
The top of the wide a* band is C-M antibonding and the bottom C-M bonding. The stronger the interaction between a* and metal the more profound the antibonding or bonding char- acter. Thus at low band filling that geometry which allows stronger interaction has more bonding, but a t high band filling more antibonding. This kind of reasoning can extend our con- siderations to surfaces other than the one considered here.
Table VI collects the bonding information for all three geom- etries. As we have said before, the a* interaction with the metal strengthens on going from sawhorse (93) to butterfly (94) to capping (95) geometries. The stronger interaction for the capping geometry is supported also by the fact that ethylene donates more charge to the metal (see last column in Table VI). Our calculation also suggests that in the sawhorse geometry a* is more filled and ethylene dissociation into CH2’s should be more facile.
The sawhorse mode is categorized as the di-u-bonding and the butterfly as the *-bonding mode in surface science literature. Experimental studies4,p as well as theoretical calculation^^^ tell us that A is pushed down more in the a-bonding than in the di-cr-bonding geometry. Our calculations are no exception, but in addition they indicate the driving force behind the stronger interaction in the butterfly geometry.
Conclusions Let us summarize several important results and discuss the
possible consequences. In the C, fragment part we concluded that n-CH, or u-CH2 (=n-CH2) is responsible for the binding of the corresponding species to the surface. n-CH, or u-CH2 is pushed down in energy and its bonding partner, the metal d band region, is characterized by weak M-C antibonding. This is shown schematically in 102.
met01 d band
*’
,,-weoh M-C mlibandinp
/’
102
We saw what happens as the methyl group is moved from the on-top site 103 to the 2-fold bridging site 104 to the 3-fold bridging site 105. For symmetry and overlap reasons the antibonding feature in the d-band region becomes stronger and the total energy of the system goes up along with this migration. Also the
103 104 I O 5
J . Am. Chem. Soc., Vol. 110, No. 3, 1988 113
methyl-to-metal antibonding character grows with the metal d-band filling. The binding energy decreases from most of the binding sites and a t the same time the difference between the binding energies for these adsorption sites (Le., the migration barrier) is enhanced (cf. Table I1 and 72). Therefore, the methyl group becomes less mobile on the surface as the d bands are more occupied. For the same reason the binding energy of the other C, fragments to a metal surface also decreases as the metal d band is more populated (Tables IV and V). We have also found that the endothermicities and the energy barriers for the coupling of two alkyl groups or alkyl and alkylidene groups are generally lower for metals on the right side of the transition-metal series (e.g., Co). Combining this qualitative information we construct drawing 106.
- percentage d-bond occupancy -
I06
What are the consequences of 106? First of all the fact that the CH, group (which serves as a model for longer alkyl chains) is less mobile on the surface of higher d-band filling may contribute to the experimental fact that the average hydrocarbon chain length in the FT product is smaller for metal catalysts at the right side of the transition series than that produced by a catalyst a t the left side.50 Thus, a lower mobility means a smaller probability for propagation and therefore shorter chain products. Secondly, it is experimentally known that the reactivity of an FT metal catalyst has a maximum as one moves across the transition se- ries.49-51 This extremely important experimental observation, the so-called ’%olcano” effect, is consistent with the opposing effects displayed in 106. As the d band is filled, the mobility of the organic fragments (particularly that of the alkyl groups) is reduced, but a t the same time their coupling requires less energy and the propagation rate increases. A maximum in the reaction rate and the surface activity results. Our model is, of course, very simple and naive and factors other than those discussed above may also contribute to the “volcano” effect. For example, Narskov at- tributed the “volcano” effect to the decrease in binding energy on one hand and a decrease in the adsorption rate of the adsorbate on the other, along the transition series.51 The decrease in binding energy, he argued, is due to an increase in the antibonding between the adsorbate and the metal. This is exactly what we have in 102. So at the left side of the transition series the binding is so strong that it inhibits the coupling reaction and subsequent desorption. At the right side Narskov concluded that adsorption rate is small and the reactivity low. Our study shows that the decrease in the mobility and coupling rate, factors which were not considered in his analysis, may also contribute to the low reactivity a t the right side of the transition series. We have already noted earlier that the binding energies are one of the major factors that determine the thermodynamics of the coupling process. A high binding energy generally results in a highly endothermic coupling process (e.g., the propagation reaction c in Scheme 111). However, we stress that the absolute magnitude of the binding energy of the organic radical to the metal surface is not the only important
(50) (a) Bond, G. C. Catalysis by Metals; Academic: New York, 1962. (b) Boudart, M. Kinetics of Chemical Processes; Prentice-Hall: E n g l e w d Cliffs, NJ, 1968. (c) See also Chapter 4 in ref le; Sinfelt, J. H. in ref If, Vol. 1, Chapter 5 ; Schwab, G.-M. in ref If , Vol. 2, Chapter 1.
(51) (a) Nsrskov, J. K. Physica 1984, 1278, 193. (b) Holloway, S.; Lundqvist, 0. I.; Nsrskov, J. K. Proceedings of the 8th Inrernational Congress on Catalysis; Verlag Chemie: Weinheim, 1985; 4, IV85-IV95.

774 J. Am. Chem. SOC., Vol. 110, No. 3, 1988 Zheng et al.
surface, a “proximity” or crowding effect for the assembly of fragments prior to reaction, and, finally, an activation energy for actual coupling and desorption.
Acknowledgment. This research was supported by the Office of Naval Research and by the National Science Foundation through Grant CHE 84-061 19 and Grant DMR 821722 to the Material Science Center at Cornell University. We are grateful to Anne Turner for the typing, to Linda C. Kapitany for cor- rections and assembly, and to Jane Jorgensen and Elisabeth Fields for the drawings.
Appendix I All calculations are of the extended Hiickel tight binding type,I4
with the parameters given in Table VII. The M-C distance is chosen to be a fixed 2.1 A throughout the calculations although experimental data indicate different M-C distances for various adsorption sites and different C , fragments.22 The choice of a constant M-C distance comes from our experience that overlap populations for bonds of “unbiased” or equal length will be in- dicators of the relative bond strengths. The Co-Co distance in the hcp slab is 2.51 A,*& C-H = 1.09 A. The total energies, DOS and COOP, are calculated on a 10-k-point set from ref 53, but wherever symmetry permits the 10-k-point set is reduced to a 7 or 5 special k point set.
Appendix I1 The choice of the metal slab thickness was based on previous
exploratory calculations on up to 5 A 3-layer slab was found to be a good compromise between accuracy and economy. To ensure the above conclusion, we have performed calculations for CH, on a 7-layer Co slab in “on-top”, the ”bridging”, and the “capping” geometries. The binding energies (cf. E , in Table 111) are 3.51, 2.24, and 1.74 eV, respectively, not much different from those for the 3-layer slab. The total charges on CH3 are -0.59, -0.55, and -0.52. Other properties derived from the 7-layer slab also hold the same trends calculated for a 3-layer slab.
7440-32-6; Cr, 7440-47-3; Co, 7440-48-4. Registry No. CH3, 2229-07-4; CHI, 2465-56-7; CH, 3315-37-5; Ti,
Table VII. Extended Hiickel Parameters
c1* c2 orbital - Hi,, eV {id {z
CO 3d -9.7 5.55 1.9 0.5448 0.6556 4s -7.8 2.0 4p -3.8 2.0
4s -7.3 1.7 4p -3.6 1.7
4s -6.3 1.5 4p -3.2 1.5
C 2s -21.4 1.625 2p -11.4 1.625
H I S -13.6 1.3
Cr 3d -7.9 4.95 4.6 0.4876 0.7205
Ti 3d -5.9 4.55 1.4 0.4206 0.7839
Exponents and coefficients in a double-{ expansion of the 3d orbit- al.
factor. The relative binding energies, which determine the surface mobilities of these fragments, are also important. Furthermore, absolute and relative binding energies are not necessarily related. Thus, a strongly bound fragment is not necessarily *unreactive”, provided that it migrates easily from one metal site to the other (e.g., the binding energy of CH3 on Ti is 1.7 eV higher than that on Co, but the migration barrier on Ti is lower than that on Co) and that the barrier for its coupling is low.
We note that many other factors that may play an important role in the FT synthesis were not considered in our study. One is the relation between the metal’s d occupancy and the rate of the dissociative chemisorption of the reactants, such as C0.19” A second is the dependence of the rate of the reductive-elimination reaction 107 on the metal’s d occupancy.
I07
At this point we conclude our first glance a t the FT reaction. So much more remains to be done, and with better calculations than ours. But we believe that we have gained some insight into the essence of the bonding of CH,, CH2, CH, and C2H4 to metal surfaces, and the migration propensity and coupling capabilities of these important surface species. One useful conceptual de- composition of the barriers, often small, sometimes large, that are found on the way to products, is the following: there are preferred sites of chemisorption, differential barriers to migration on the
(52) Sinfelt, J. H. in ref If , Vol. 1, p 282. Sinfelt, J. H. J . Catal. 1973, 29, 308. Sinfelt, J. H. Ace. Chem. Res. 1977, 10, 15. Sci. Am. 1985, 253, No. 3, 90.
(53) Pack, J. D.; Monkhorst, H. J. Phys. Reu. B 1977, 16, 1748.