bond–slip models for frp sheets/plates bonded to concrete
TRANSCRIPT

Engineering Structures 27 (2005) 920–937
www.elsevier.com/locate/engstruct
of 253 pullhalf of thethecaleThroughd strength
Bond–slip models for FRP sheets/plates bonded to concrete
X.Z. Lua,b, J.G. Tengb,∗, L.P. Yea, J.J. Jianga
aDepartment of Civil Engineering, Tsinghua University, Beijing, PR ChinabDepartment of Civil and Structural Engineering, The Hong Kong Polytechnic University, Hong Kong, China
Received 24 June 2004; received in revised form 24 November 2004; accepted 25 January 2005Available online 8 April 2005
Abstract
An accurate local bond–slip model is of fundamental importance in the modelling of FRP-strengthened RC structures. In this paper, areview of existing bond strength models and bond–slip models is first presented. These models are then assessed using the resultstests on simple FRP-to-concrete bonded joints, leading to the conclusion that a more accurate model is required. In the secondpaper, a set of three new bond–slip models of different levels of sophistication is proposed. A unique feature of the present work is thatnew bond–slip models are not based on axial strain measurements on the FRPplate; instead, they are based on the predictions of a meso-sfinite element model, with appropriate adjustment to match their predictions with the experimental results for a few key parameters.comparisons with the large test database, all three bond–slip models are shown to provide accurate predictions of both the bon(i.e. ultimate load) and the strain distribution in the FRP plate.© 2005 Elsevier Ltd. All rights reserved.
Keywords: FRP; Concrete; Bond; Bond–slip models; Bond strength; Pull tests; Finite element simulation; Composites
cetelaCgig
vegk
thesePPla
fnceeder,rtivethem,
theaionin
ong
edP-
1. Introduction
Over the past decade, external bonding of fibre reinforpolymer (FRP) plates or sheets (referred to as plaonly hereafter for brevity) has emerged as a popumethod for the strengthening of reinforced concrete (Rstructures [1]. An important issue in the strengtheninof concrete structures using FRP composites is to desagainst various debonding failure modes, including (a) coseparation [2–4]; (b) plate end interfacial debondin[2,3]; (c) intermediate (flexural or flexural-shear) crac(IC) induced interfacial debonding [5]; and (d) criticaldiagonal crack (CDC) induced interfacial debonding [6].The behaviour of the interface between the FRP andconcrete is the key factor controlling debonding failurin FRP-strengthened RC structures. Therefore, for thsafe and economic design of externally bonded FRsystems, a sound understanding of the behaviour of FRto-concrete interfaces needs to be developed. In particu
∗ Corresponding author. Tel.: +852 2766 6012; fax: +852 2334 6389.E-mail address:[email protected] (J.G. Teng).
0141-0296/$ - see front matter © 2005 Elsevier Ltd. All rights reserved.doi:10.1016/j.engstruct.2005.01.014
ine
ed
dsr)
nr
e
-r,
a reliable local bond–slip model for the interface is ofundamental importance to the accurate modelling and heunderstanding of debonding failures in FRP-strengthenRC structures. It should be noted that throughout this papthe term “interface” is used to refer to the interfacial paof the FRP-to-concrete bonded joint, including the adhesand a thin layer of the adjacent concrete, responsible forrelative slip between the FRP plate and the concrete prisinstead of any physical interface in the joint.
In various debonding failure modes, the stress state ofinterface is similar to that in a pull test specimen in whichplate is bonded to a concrete prism and is subject to tens(Fig. 1). Such pull tests can be realized in laboratoriesa number of ways with some variations [7], but the resultsobtained are not strongly dependent on the set-up as las the basic mechanics as illustrated inFig. 1 is closelyrepresented [8].
The pull test not only delivers the ultimate load (referrto as the bond strength hereafter in this paper) of the FRto-concrete interface, but also has been used to determthe local bond–slip behaviour of the interface [9–16]. Localbond–slip curves from pull tests are commonly determin

X.Z. Lu et al. / Engineering Structures 27 (2005) 920–937 921
eabd
tolaalisciawets,erclenstsct
rveisay
aels,els.enandlyr thentof
not, butcaletcheseoreeionss of
taof
bext.
aste oro-
inge
sas
ich
Notation
A, B parameters in the proposed precise model;bc width of concrete prism;bf width of FRP plate;Ea elastic modulus of adhesive;E f elastic modulus of FRP;f ′c concrete cylinder compressive strength;
ft concrete tensile strength;Ga shear modulus of adhesive;Gc elastic shear modulus of concrete;G f interfacial fracture energy;Ga
finterfacial fracture energy for the ascendingbranch;
Ka Ga/ta, shear stiffness of adhesive layer;Kc Gc/tc, shear stiffness of concrete;L bond length;Le effective bond length;Pu ultimate load or bond strength;s local slip;se elastic component of local slip;sf local slip when bond stressτ reduces to zero;s0 local slip atτmax;ta thicknessof adhesive layer;tc effective thickness of concrete contributing to
shear deformation;t f thickness of FRP plate;α1, α2, α3 coefficients in proposed bond–slip models;βl bond length factor;βw width ratio factor;τ local bond stress;τmax maximal local bond stress;τu average bond stress.
in two ways: (a) from axial strains of the FRP platmeasured with closely spaced strain gauges (e.g. Naket al. [12]); (b) from load–displacement (slip at the loadeend) curves (e.g. Ueda et al. [15]). In the first method,the shear stress of a particular location along the FRP-concrete interface can be found using a difference formuwhile the corresponding slip can be found by a numericintegration of the measured axial strains of the plate. Thmethod appears to be simple, but in reality cannot produaccurate local bond–slip curves. This is because the axstrains measured on the thin FRP plate generally shoviolent variations as a result of the discrete nature of concrcracks, the heterogeneity of concrete and the roughnesthe underside of the debonded FRP plate. For examplestrain gauge located above a crack will have a much greatstrain than one that sits above a large aggregate partiThe shear stress deduced from such axial strains is thusreliable although the slip is less sensitive to such variationConsequently, bond–slip curves found from different tesmay differ substantially. The second method is an indire
a
-,
el
eofa
.ot.
Fig. 1. Schematic of pull test.
method and has its own problem: the local bond–slip cuis determined indirectly from the load–slip curve, but iteasy to show that rather different local bond–slip curves mlead to similar load–displacement curves.
This paper has two principal objectives: (a) to providecritical review and assessment of existing bond–slip modand (b) to present a set of three new bond–slip modThe former part aims to clarify the differences betweexisting bond–slip models and between these modelstest results, a task that does notappear to have been properundertaken so far. The former part also sets the stage folatter part in which three new bond–slip models of differelevels of sophistication are presented. A unique featurethe present work is that the new bond–slip models arebased on axial strain measurements on the FRP plateinstead they are based on the predictions of a meso-sfinite element model, with appropriate adjustment to mathe experimental results of a few key parameters. As thkey parameters such as the bond strength are much mreliable than local strain measurements on the FRP plate, thpresent approach does not suffer from the random variatassociated with strain measurements nor the indirectnesthe load–slip curve approach.
2. FRP-to-concrete bond behaviour
Before presenting a review of the existing test daand bond–slip models, some fundamental aspectsthe behaviour of FRP-to-concrete interfaces shouldsummarized to place the present work in its proper conteExisting pull tests have shown conclusively that in the vmajority of cases and except when a very weak adhesiva high strength concrete is used, the failure of an FRP-tconcrete bonded joint is by cracking in the concrete layeradjacent to the adhesive layer. InFig. 1, the dotted linesidentify a typical fracture plane in the process of debondfailure, and this plane is generally slightly wider than thwidth of the FRP plate (Fig. 1), if the plate is narrowerthan the concrete prism. Thefracture plane propagatefrom the loaded end to the free end of the FRP plateloading/deformation increases. InFig. 1, the FRP plate isshown unbonded near the loaded end (the free zone), whhas been adopted in some tests (e.g. [17]), but in some othertests, such a free zone was not included (e.g. [8,12]). If this

922 X.Z. Lu et al. / Engineering Structures 27 (2005) 920–937
tetenther
nda)
ted
anre
nt
53he
P
re
of
o
g
n
eb
ree
canayer
Ityerickd in
free zone does not exist or is small, a lump of concrenear the loaded end will generally be pulled off the concreprism, but this variation in detail does not have a significaeffect on the local bond–slip behaviour elsewhere nor tgeneral behaviour as long as the bond length is not veshort. From existing theoretical and experimental studies(e.g. [7,15,16]), the following six parameters are known togovern the local bond–slip behaviour as well as the bostrength of FRP-to-concrete bonded joints in pull tests: (the concrete strength, (b) the bond lengthL (Fig. 1), (c)the FRP plate axial stiffness,(d) the FRP-to-concrete widthratio, (e) the adhesive stiffness, and (f) the adhesive strengA very important aspect of the behaviour of these bondjoints is that there exists an effective bond lengthLe beyondwhich an extension of the bond lengthL cannot increase theultimate load. This is a fundamental difference betweenexternally bonded plate and an internal reinforcing bar fowhich a sufficiently long anchorage length can always bfound so that the full tensile strength of the reinforcemecan be achieved.
3. Existing pull tests
In this study, a database containing the results of 2pull tests on FRP-to-concrete bonded joints was built. Tdatabase includes tests reported by Chajes et al. [18],Taljsten [19], Takeo et al. [20], Zhao et al. [21], Uedaet al. [22], Nakaba et al. [12], Wu et al. [13], Tan [17],Ren [23] and Yao et al. [8]. Both single shear tests (e.g. Yaoet al. [8]) and double shear tests (e.g. Tan [17]) are includedin the database. Details of these tests, except those alreadyincluded in the easily accessible databases assembledChen and Teng [7], Nakaba et al. [12] and those fromthe recent study of Yao et al. [8], are given inTable A.1of Appendix A, wherebf , t f , E f and f f are the width,thickness, elastic modulus and tensile strength of the FRplate respectively,bc is the width of the concrete prism,fcu is the cube compressive strength of concrete (convertedfrom cylinder compressive strength by a factor of 0.78 wheapplicable), ft is the tensile strength of concrete (ft =0.395f 0.55
cu according to the Chinese code for the designconcrete structures [24] if not available from the originalsource), L is the total bond length, andPu is the bondstrength. For some of these specimens, strains measuredthe FRP plate are also available.
The distributions of the test data in terms of the followinfour key parameters are shown inFig. 2: (a) the concretecube compressive strength (Fig. 2(a)); (b) the axial stiffnessof the plate per unit width (Fig. 2(b)); (c) the bond lengthnormalized by the effective bond length predicted by Cheand Teng’s model [7]; (d) the FRP plate-to-concrete prismwidth ratio. It is clear that the test data cover a wide rangof each parameter and can be expected to provide a reliabenchmark for theoretical models. It is desirable for fututests to be conducted in regions where current data arscarce.
y
h.
by
n
le
(a) Range of concrete strength.
(b) Range of plate stiffness.
(c) Range of bond length.
(d) Range of FRP-to-concrete width ratio.
Fig. 2. Distributions of test data in terms of key parameters.
Dai and Ueda [14] and Ueda et al. [15] recently reportedthat the bond strength of FRP-to-concrete interfacesbe enhanced through the use of a very soft adhesive lwith a shear stiffnessKa (=Ga/ta) being between 0.14and 1.0 GPa/mm, whereta is the adhesive layer thicknessand Ga is the elastic shear modulus of the adhesive.is clear that a small shear stiffness of the adhesive lacan be achieved by the use of a soft adhesive or a thadhesive layer. While the properties of the adhesives use

X.Z. Lu et al. / Engineering Structures 27 (2005) 920–937 923
ystheefea
eeisosheter,lyersse
elyan
asi
bn
s
e
ethhieisseleedfo
mtoesgee
no)[
an
-trainlipd
s,
cedss
n,nbyleP-dela
otwo
ftr.
reest
then
els
t ofltsing
del
the specimensof the present test database were not alwareported, none of the relevant studies was focussed onissue of very soft adhesive layers. At least outside Japan, thapplication of adhesives commonly available in the markin a procedure complying with the recommendations othe manufacturers is unlikely to lead to an adhesive laywhich can be classified as being very soft (i.e. with a shestiffness in therange studied by Dai and Ueda [14] andUedaet al. [15]). Furthermore, relatively soft adhesives arnormally used only in wet lay-up applications wherthe definition of the thickness of the adhesive layerproblematic but affects the value of the shear stiffnessthe adhesive layer significantly. Indeed, since the same reis commonly used to saturate the fibre sheet to form tFRP plate as well as to bond the FRP plate to the concrewhich is often already covered with a thin layer of primethe thickness of the adhesive layer which deforms primariin shear cannot be easily defined and is believed to be vsmall by the present authors in debonding failures unledebonding occurs in the adhesive layer. Finally, in practicthe thickness of the adhesive layer cannot be preciscontrolled and measured as reported in the studies of DaiUeda [14] and Ueda et al. [15]. Therefore, it is reasonableto assume that the bonded joints of the present databhave Ka values much greater than those studied by Daand Ueda [14] and Ueda et al. [15] and are referred toas normal-adhesive joints hereafter. A separate studythe authors to be reported in a future paper has showthat for values ofKa ranging from 2.5 to 10 GPa/mm thebond–slip curve is littledependent on the shear stiffnesof the adhesive layer. A shear stiffness of 5 GPa/mm forthe shear-deformed adhesive layer is used in this study torepresent a normal-adhesive bonded joint when it is needAs the bond–slip models of Dai and Ueda [14] and Uedaet al. [15] arefor very soft adhesive layers and consider thadhesive layer shear stiffness as a significant parameter,are not included in the comparisons and discussions in tpaper. The test data from their studies are also not includin the present database. The scope of the present studytherefore limited to FRP-to-concrete bonded joints whoshear-deformed adhesive layer has a shear stiffness of nothan 2.5 GPa/mm. The present work nevertheless is believto cover at least all commercially available FRP systemsexternal bonding applications outside Japan.
4. Existing theoretical models for bond behaviour
4.1. Bond strength models
Many theoretical models have been developed fro1996 onwards to predict the bond strengths of FRP-concrete bonded joints, generally on the basis of pull tresults. These are commonly referred to as bond strenmodels. Altogether 12 bond strength models have befound in the existing literature, and eight of them havbeen examined in detail by Chen and Teng [7]. These eight
e
t
rr
fin
y
,
d
e
y
d.
eysd
ss
r
-tthn
models have been developed by Tanaka [25], Hiroyuki andWu [26], van Gemert [27,28], Maeda et al. [9], Neubauerand Rostasy [29], Khalifa et al. [30], Chaallal et al. [31] andChenand Teng [7]. The four models not covered by Cheand Teng [7] include three models (Izumo, Sato, and Isdeveloped in Japan and described in a recent JCI report32]and one developed by Yang et al. [33]. These four modelsare detailed inAppendix B. Table 1provides a summary ofthe key parameters considered by these 12 models, whileassessment of their accuracy is given later in the paper.
4.2. Bond–slip models
Despite the difficulty in obtaining local bond–slip curvesfrom pull tests directly, local bond–slip models for FRPto-concrete interfaces have been developed, based on smeasurements or load–slip curves. Six local bond–smodels available in the existing literature are summarizein Table 2, whereτ (MPa) is the local bond (shear) stress (mm) is the local slip,τmax (MPa) is the local bondstrength (i.e. the maximum bond/shear stress experienby the interface),s0 (mm) is the slip when the bond stresreachesτmax, sf (mm) is the slip when the bond stresreduces to zero,βw is the width ratio factor,f ′
c (MPa) isthe cylinder compressive strength of concrete. In additioSato [32] proposed a model which was modified from aexisting bond–slip model for rebar-concrete interfacesreplacing the yield strain of steel with the ultimate tensistrain of FRP,based on strain measurements on FRstrengthened RC tension members. As a result, the mohas included the effect of tensile cracking and is nottrue local bond–slip model. This model is therefore nfurther discussed in this paper. Of the six models, the tmodels recently proposed by Dai and Ueda [14] and Ueda etal. [15] were based on test data for specimens with very soadhesive layers and are not further discussed in this pape
5. Accuracy of existing theoretical models
5.1. Bond strength models
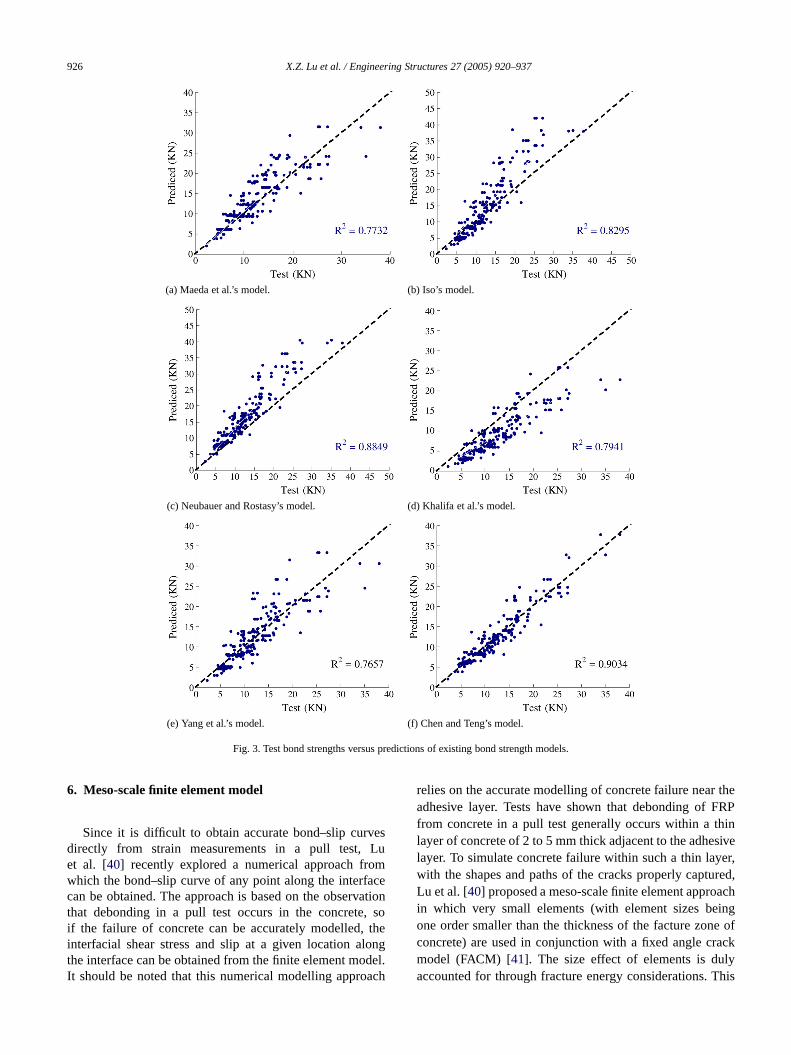
The predictions of all 12 bond strength models acompared with the 253 test results of the present tdatabase inTable 3 and Fig. 3. The average value andcoefficient of variation of the predicted-to-test bond strengratios and the correlation coefficient of each model are givin Table 3. It can be seen that the bond strength modof Maeda et al. [9], Neubauer and Rostasy [29], Khalifaet al. [30], Iso [32], Yang et al. [33] and Chenand Teng [7]are the better models, with a reasonably small coefficienvariation and a large correlation coefficient. The test resuare shown against the predictions of these better-performmodels in Fig. 3. Based onTables 1and3 as well asFig. 3,Chen and Teng’s model is clearly the most accurate moamong the 12 existing bond strength models. IfTable 3isexamined together withTable 1, it can be found that the

924 X.Z. Lu et al. / Engineering Structures 27 (2005) 920–937
Table 1Factors considered by existing bond strength models
Bond strength model Concrete strength FRP plate stiffness Effective bond length Width ratio
1 Tanaka [25] No No No No2 Hiroyuki and Wu [26] No No No No3 van Gemert [27] Yes No No No4 Maeda et al. [9] Yes Yes Yes No5 Neubauer and Rostasy [29] Yes Yes Yes Yes6 Khalifa et al. [30] Yes Yes Yes No7 Chaallal et al. [31] No Yes No No8 Chen and Teng [7] Yes Yes Yes Yes9 Izumo [32] Yes Yes No No
10 Sato [32] Yes Yes Yes No11 Iso [32] Yes Yes Yes No12 Yang et al. [33] Yes Yes Yes No
oslser
s,reesli
g
onstellyr
andot
dl.’s
ass
ote
t,
ted
al
tostr
elsdy,ing
ctedtingesurendheient
osre
tesibedofhen
ic.
accuracy of a model improves as more significant parametersare considered, with the effective bond length being the minfluential parameter. All the six better-performing modeinclude a definition of the effective bond length. Of the othsix models, only Sato’s model [32] takes the effective bondlength into consideration.
5.2. Shapes of bond–slip models
For a bond–slip model to provide accurate predictionit needs to have an appropriate shape as well as a corvalue forthe interfacial fracture energy which is equal to tharea under the bond–slip curve. The shape of the bond–model determines the predicted distribution of axial strainsin the plate. The predictions of the four existing bond–slipmodels for normal-adhesive interfaces are shown inFig. 4for an FRP-to-concrete bonded joint with the followinproperties: f ′
c = 32 MPa, ft = 3.0 MPa,b f = 50 mm,bc = 100 mm, E f t f = 16.2 GPa mm. An FRP-to-concrete width ratio of 0.5 was chosen for this comparisjoint as some of the bond–slip models were based on teresults of joints with similar width ratios and do not accounfor the effect of varying this ratio. It can be seen that thshapes of the predicted bond–slip curves differ substantia(Fig. 4). In particular, the linear-brittle model of Neubaueand Rostasy [34] is very different from the other threemodels. The fact that the bond stress reduces to zerothe ultimate slip dictates that there exists an effective bolength beyond which an increase in the bond length will nincrease the ultimate load.
Existing studies (e.g. [12,36]) have shown that thebond–slip curve should have an ascending branch andescending branch, similar to the curve from Nakaba et amodel [12] or Savioa et al.’s model [36] shown in Fig. 4.The bilinear model can be used as an approximation [16],but the linear-brittle model by Neubauer and Rostasy [34]is unrealistic. Apart from thegeneral shape, three keyparameters, including the maximum bond stress, the slipmaximum stress and the ultimate slip at zero bond stre
t
ct
p
t
t
a
t,
determine the accuracy of the model. It is interesting to nthat the models byNakaba et al. [12], Monti et al. [35]and Savioa et al. [36] are in reasonably close agreemenand the linear-brittle model of Neubauer and Rostasy [34]predicts a similar maximum bond stress. It should be nothat Savioa et al.’s model [36] was obtained by some veryminor modifications of Nakaba et al.’s model (Table 2).
5.3. Interfacial fracture energy of bond–slip models
Existing research has shown that the bond strengthPu
of an FRP-to-concrete bonded joint is directly proportionto the square root of the interfacial fracture energy
√G f
regardless of the shape of the bond–slip curve [16,29,37,38], so a comparison of the bond strength is equivalenta comparison of the interfacial fracture energy. As mobond–slip models do not provide an explicit formula fothe ultimate load, the bond strengths of bond–slip modneed to be obtained numerically. In the present stuthey were obtained by numerical nonlinear analyses usMSC.Marc [39] with a simple model consisting of 1 mmlong truss elements representing the FRP plate conneto a series of shear springs on a rigid base representhe bond–slip law of the interface. The nonlinear analyswere carried out with a tight convergence tolerance to ensaccurate predictions. The theoretical predictions of the bostrengths are compared with the 253 test results of tpresent test database. The average value and coefficof variation of the predicted-to-test bond strength ratitogether with the correlation coefficient for each model agiven in Table 4. The correlation coefficients for all fourbond–slip models are larger than 0.8, which demonstrathat the trends of the test data are reasonably well descrby the bond–slip models. The coefficients of variationthese models are nevertheless still larger than that of Cand Teng’s model (Table 3). The test results are shownagainst the theoretical predictions inFig. 5, where it isclearly seen that all four bond–slip models are too optimist

X.Z
.Lu
eta
l./Engin
eerin
gS
tructu
res27
(2005)
920–937
925
Table 2Existing bond–slip models
Bond–slip model As s0 sf βw Remarks
Neubauer and Rostasy [34] τma βw × 0.202
√1.125
2−b f /bc1+b f /400 A linear
ascendingbranch and asudden drop
Nakaba et al. [12] 0.065 A single curve
Monti et al. [35] τma 2.5τmax
(taEa
+ 50Ec
)0.33βw
√1.5(2−b f /bc)
1+b f /100
Savioa et al. [36] 0.051 A single curve
α = 0.028(E f t f /1000)0.254,
Dai and Ueda [14]a τma.3αβ2KaG f
τmax/(αKa) β = 0.0035Ka(E f t f /1000)0.34, Ka = Ga/ta,
G f = 7.554K−0.449a ( f ′
c)0.343
Ueda etal. [15]a 2UG 46(E f t f /1000)0.023(Ga/ta/1000)−0.352 f ′0.236c ] A single curve
a Regressed from specimens wi
cending branchs ≤ s0 Descending branchs > s0 τmax
x
(ss0
)0 1.8βw ft
τmax
(ss0
) [3/
(2 +
(ss0
)3)]
3.5 f ′0.19c
xss0
τmaxsf −ssf −s0
1.8βw ft
τmax
(ss0
)[2.86/
(1.86+
(ss0
)2.86)]
3.5 f ′0.19c
x
(ss0
)0.575τmaxe−β(s−s0)
−1.575αKa+√
2.481α2K 2a+6
2β
f (e−Us − e−2Us)[U = 6.846(E f t f /1000)0.108(Ga/ta/1000)0.833, G f = 0.4
th very soft adhesive layers.
926 X.Z. Lu et al. / Engineering Structures 27 (2005) 920–937
(a) Maeda et al.’s model. (b) Iso’s model.
(c) Neubauer and Rostasy’s model. (d) Khalifa et al.’s model.
(e) Yang et al.’s model. (f) Chen and Teng’s model.
Fig. 3. Test bond strengths versus predictions of existing bond strength models.
su
metisohenech
theRP
iver,,ch
ofck
his
6. Meso-scale finite element model
Since it is difficult to obtain accurate bond–slip curvedirectly from strain measurements in a pull test, Let al. [40] recently explored a numerical approach frowhich the bond–slip curve of any point along the interfaccan be obtained. The approach is based on the observathat debonding in a pull test occurs in the concrete,if the failure of concrete can be accurately modelled, tinterfacial shear stress and slip at a given location alothe interface can be obtained from the finite element modIt should be noted that this numerical modelling approa
on
gl.
relies on the accurate modelling of concrete failure nearadhesive layer. Tests have shown that debonding of Ffrom concrete in a pull test generally occurs within a thinlayer of concrete of 2 to 5 mm thick adjacent to the adheslayer. To simulate concrete failure within such a thin layewith the shapes andpaths of the cracks properly capturedLu et al. [40] proposed a meso-scale finite element approain which very small elements(with element sizes beingone order smaller than the thickness of the facture zoneconcrete) are used in conjunction with a fixed angle cramodel (FACM) [41]. The size effect of elements is dulyaccounted for through fracture energy considerations. T

X.Z. Lu et al. / Engineering Structures 27 (2005) 920–937 927
Table 3Predicted-to-test bond strength ratios: bond strength models
Bond strength model Average Predicted-to-test bond strength ratio Coefficientof variation Correlation coefficient
1 Tanaka [25] 4.470 0.975 0.4812 Hiroyuki and Wu [26] 4.290 0.611 −0.0283 Sato [32] 1.954 0.788 0.4944 Chaallal et al. [31] 1.683 0.749 0.2405 Khalifa et al. [30] 0.680 0.293 0.7946 Neubauer and Rostasy [29] 1.316 0.168 0.8857 Izumo [32] 1.266 0.506 0.6568 van Gemert [27] 1.224 0.863 0.3289 Maeda et al. [9] 1.094 0.202 0.773
10 Iso [32] 1.087 0.282 0.83011 Yang et al. [33] 0.996 0.263 0.76612 Chen and Teng [7] 1.001 0.163 0.90313 Proposed strength formula (Eq. (4e)) 1.001 0.156 0.908
Table 4Predicted-to-test bond strength ratios: bond–slip models
Bond–slip model Average predicted-to-test bond strength ratio Coefficient of variation Correlation coefficient
1 Neubauer and Rostasy [34] 1.330 0.209 0.8872 Nakaba et al. [12] 1.326 0.231 0.8463 Savioa et al. [36] 1.209 0.199 0.8474 Monti et al. [35] 1.575 0.164 0.8885 Proposed, precise model 1.001 0.155 0.9106 Proposed, simplified model 1.001 0.155 0.9107 Proposed, bilinear model 1.001 0.156 0.908
einseur
de
o
ts
rm
seses.
enty.in
udynged
inP
Fig. 4. Bond–slip curves from existing bond–slip models.
approach has the simplicity of the FACM for which threlevant material parameters have clear physical meanand can be found from well established standard tebut in the meantime retains the capability of tracing thpaths of cracks as deformations increase through theof very small elements. To reduce the computational effothe three-dimensional FRP-to-concrete bonded joint (Fig. 1)was modelled as a plane stress problem using four-noisoparametric elements, with the effect of FRP-to-concrwidth ratio being separately considered using a width ratiofactor devised by Chen and Teng [7].
Lu et al. [40] implemented their finite element model intthe general purpose finite element package MSC.Marc [39]
gsts,
set,
ete
as a user subroutine. The finiteelement model was verifiedby detailed comparisons with the results of 10 pull testaken from studies by Wu et al. [13], Ueda et al. [22],Tan [17], and Yuan et al. [16]. A close agreement wasachieved for all 10 specimens. A Fast Fourier Transfosmoothing procedure was proposed in Lu et al. [40] toprocess the raw finite element interfacial shear stresbefore the results are used to obtain local bond–slip curvLu et al. [40] showed that a smoothing length of 10 mm issuitable and this length was used in the present study. Anunbonded zone of 25 mm was included in the finite elemmodel in all numerical simulations of the present studFurther details of the finite element model can be foundLu et al. [40].
7. Proposed bond–slip models
7.1. Precise model
Using the meso-scale finite element model of Let al. [40], a parametric study was undertaken to stuthe local bond–slip behaviour of the interface, considerithe effects of a number of key parameters. The bondjoint modelled in this parametric study has the followingproperties: the axial stiffness of the FRP plateE f t f is26 GPa mm, which is similar to that provided by one thlayer of CFRP and is within the most popular range of FR

928 X.Z. Lu et al. / Engineering Structures 27 (2005) 920–937
e
nd
to
e
ere
ching
hint.se,
.
-del,:
of
std
(a) Neubauer and Rostasy’s model.
(b) Nakaba et al.’s model.
(c) Monti et al.’s model.
(d) Savioa et al.’s model.
Fig. 5. Test bond strengths versus predictions of existing bond–slip mod
ls.Fig. 6. Bond–slip curves from meso-scale finite element simulation aproposed bond–slip models.
plate axial stiffness in pull tests (Fig. 2(b)). In the finiteelement analysis, the elastic modulusEc, tensile strengthft and compressive strengthfc of concrete were relatedto the cube compressive strength of concrete accordingthe Chinese code for the design of concrete structures [24]:Ec = 100 000
2.2+34.74/ fcu, ft = 0.395( fcu)
0.55 and fc = 0.76 fcu,all in MPa. The Poisson ratio was assumed to be 0.2. Thshear stiffness of the adhesive layer is 5 GPa/mm. The bondlength of the FRP plate is 200 mm, which is much longthan the effective bond length. A typical bond–slip curvobtained from the finite element model is shown inFig. 6.From these finite element results, the following observationscan be made:
(a) The bond–slip curve is made up of an ascending branand a descending branch, with the bond stress reducto zero when the slip is sufficiently large.
(b) The initial stiffness of the bond–slip curve is muclarger than the secant stiffness at the peak stress poThis initial high stiffness, representing the stiffnesof the completely linear elastic state of the interfacdecreases quickly with the appearance of micro-cracking in the concrete as the bond stress increases
(c) The maximum bond stressτmax and the correspondingslip s0 increase almost linearly withft , while theinterfacial fracture energyG f increases almost linearlywith
√ft , as shown inFig. 7.
Based on the aboveobservations, the following equations, referred to hereafter as the precise bond–slip moare proposed to describe the local bond–slip relationship
τ = τmax
(√s
s0A+ B2 − B
)if s ≤ s0 (1a)
τ = τmaxexp[−α(s/s0 − 1)] if s > s0, (1b)
where A = (s0 − se)/s0, B = se/[2(s0 − se)]. To closelycapture the finite element bond–slip curves, a varietyequation forms were tested and Eqs. (1a) and (1b) werefound to predict the finite element bond–slip curves moclosely without undue complexity. The maximum bon

X.Z. Lu et al. / Engineering Structures 27 (2005) 920–937 929
te
ss
alof
le
e
healed
y
:
pt
e
eaty
hrs
the
itents
(a) Maximum bond stress.
(b) Slip at maximum bond stress.
(c) Interfacial fracture energy.
Fig. 7. Relationships between keybond–slip parameters and concretensile strength.
stressτmax and the corresponding slips0 are given by
τmax = α1βw ft (1c)
s0 = α2βw ft + se (1d)
wherese = τmax/K0 is the elastic component ofs0 andβw
is the FRP-to-concrete width ratio factor. The initial stiffneof the bond–slip model is defined by
K0 = KaKc/(Ka + Kc) (1e)
where Ka = Ga/ta and Kc = Gc/tc. Gc is the elasticshear modulus of concrete andtc is the effective thickness ofthe concretewhose deformation forms part of the interfacislip, which can be deduced from the initial stiffnessthe bond–slip curve from a meso-scale FE analysis [40].The initial part of the bond–slip curve from meso-scaFE analysis given inFig. 6 is shown inFig. 8. It can beseen thattc = 5 mm leads to a close prediction of thbond–slip curve. While a precise definition oftc requires
Fig. 8. Initial stiffness of bond–slip curve.
more deliberation, the overall effect of such precision on tbond–slip curve is very small and insignificant for practicpurposes. Furthermore, it may be noted that the simplifimodel introduced below does not includetc as a parameterbut still leads to a bond–slip curve which is very closelsimilar to that of the precise model.
The parameterα in Eq. (1b) controls the shape of thedescending branch and is given by
α = τmaxs0/(G f − Gaf ) (1f)
where the interfacial fracture energy can be expressed as
G f = α3β2w
√ft f (Ka) (1g)
while the fracture energy of the ascending branchGaf can be
calculated as:
Gaf =
∫ s0
0τds = τmaxs0
×2A
3
(1 + B2A
A
)3/2
− B − 2
3B3A
. (1h)
It should be noted that Eqs. (1c), (1d) and (1g) were found aslinear best-fit lines to the finite element predictions, excefor the introduction of the width effect ratioβw and theelastic slip componentse. The width effect is introducedbased on existing knowledge of how it affects the threbond–slip parameters defined by Eqs. (1c), (1d) and (1g),while the elastic slip component is introduced to ensurthat the slope of the bond–slip model is equal to thgiven by Eq. (1e). The elastic slip component is generallvery small and its inclusion in Eq. (1d) has little effecton its predictions. The functionf (Ka) is included to caterfor the future extension of the model to interfaces witvery soft adhesive layers but for normal adhesive layewith Ka ≥ 2.5 GPa/mm, f (Ka) = 1 as finite elementresults not presented here have shown that the effect ofadhesive layer stiffness onG f is very small for such normaladhesives.
Because of some inevitable differences between the finelement predictions and the test results, the three coefficie

930 X.Z. Lu et al. / Engineering Structures 27 (2005) 920–937
o
thse
r
of
eld
esne
th
t
u
re
ofi
nt
ly
verr
ed.neat
ssd
o
orr
dn
hendnddar
Fig. 9. Evaluation of the FRP-to-concrete width ratio effect.
in the proposed bond–slip modelα1, α2 and α3 weredetermined through an iterative procedure, making useboth the finite element and the test results. Theplanar natureof the finite element model also means that the effect ofFRP-to-concrete width ratio needs to be accounted for baon the test results. This iterative procedure is as follows:
(1) Take Ka = 5 GPa/mm for a normal adhesive layeand start the process withα1 = 1.5, α2 = 0.02 andα3 = 0.3, which were determined from regressionsthe finite element results.
(2) Assuming thatβw = 1, use the precise bond–slip modwith the coefficients from step (1) to calculate the bonstrength.
(3) Compare the predicted bond strengths with the tresults to evaluate the width ratio effect and to determia best-fit expression for the width ratio factorβw. Fig. 9shows the deduced values of the width ratio factor atend of the iterative process.
(4) Using the current expression forβw, fine-tune the valuesfor α1, α2 and α3 to reach an improved agreemenbetween the predicted and the test bond strengths.
(5) Compare the predicted bond strengths to the test resagain to refine the expression forβw.
(6) Repeat steps (4) and (5) until changes inα1, α2 andα3fall below 0.1%.
The final values obtained from this process for these thcoefficients are:α1 = 1.50,α2 = 0.0195, andα3 = 0.308,while the width ratio factor is given by
βw =√
2.25− bf /bc
1.25+ bf /bc. (1i)
The bond–slip curve from the precise model for onethe bonded joints analysed by the finite element methodshown inFig. 6. It is clear that there is a close agreemebetween this precise model andthe finite element curve.
In terms of the present test database, Eq. (1i) representsa slight improvement to the following expression original
f
ed
t
e
lts
e
s
proposed by Chen and Teng [7]:
βw =√
2 − bf /bc
1 + bf /bc. (2)
The difference between the two expressions is howevery small (Fig. 9) and both equations are satisfactory fopractical applications.
7.2. Simplified model
The precise model is accurate but somewhat complicatA simplified model without a significant loss of accuracy cabe easily obtained by noting that the initial stiffness of thbond–slip curve is much larger than the secant stiffnessthe peak point. Based on this observation, the initial stiffnecan be approximated as infinity and the following simplifiebond–slip model can be obtained:
τ = τmax
√s
s0if s ≤ s0 (3a)
τ = τmaxe−α
(ss0
−1)
if s > s0 (3b)
where
s0 = 0.0195βw ft (3c)
G f = 0.308β2w
√ft (3d)
α = 1G f
τmaxs0− 2
3
. (3e)
τmax andβw can be calculated with Eqs. (1c) and (1i). Thebond–slip curve predicted by the simplified model is alsshown in Fig. 6, where it can be seen that there is littledifference between this model and the precise model. Fall practical purposes, the simplified model is sufficient fonormal-adhesive joints with f (Ka) = 1 but muchsimplerthan the precise model.
7.3. Bilinear model
Further simplification can be made to the simplifiemodel by adopting a bilinear bond–slip curve which cabe used to derive a simple explicit design equation for tbond strength. This bilinear model has the same local bostrength and total interfacial fracture energy, so the bostrength is unaffected by this simplification if the bonlength is longer than the effective bond length. This bilinemodel is described by the following equations:
τ = τmaxs
s0if s ≤ s0 (4a)
τ = τmaxsf − s
sf − s0if s0 < s ≤ sf (4b)
τ = 0 if s > sf (4c)
where
sf = 2G f /τmax. (4d)
X.Z. Lu et al. / Engineering Structures 27 (2005) 920–937 931
ofial
y
de
innd
a
sed
stherugh
isels
herialioathe
eults
Fig. 10. Bond length factor versus bond length.
In the above equations,τmax, s0 andG f can be found usingEqs. (1c), (3c) and (3d), respectively. The prediction of thebilinear model is also shown inFig. 6.
Regardless of the bond–slip model, the bond strengthan FRP-to-concrete bonded joint in terms of the interfacfracture energy is given by Eq. (4e) [16]
Pu = βl b f√
2E f t f G f (4e)
whereβl is the bond length factor. WhenL > Le, βl = 1,but when L < Le, βl is smaller than 1. The analyticalsolution forLe with a bilinear bond–slip model is given byYuanet al. [16]:
Le = a + 1
2λ1ln
λ1 + λ2 tan(λ2a)
λ1 − λ2 tan(λ2a)(4f)
where
λ1 =√
τmax
s0E f t f(4g)
λ2 =√
τmax
(sf − s0)E f t f(4h)
a = 1
λ2arcsin
[0.99
√sf − s0
sf
]. (4i)
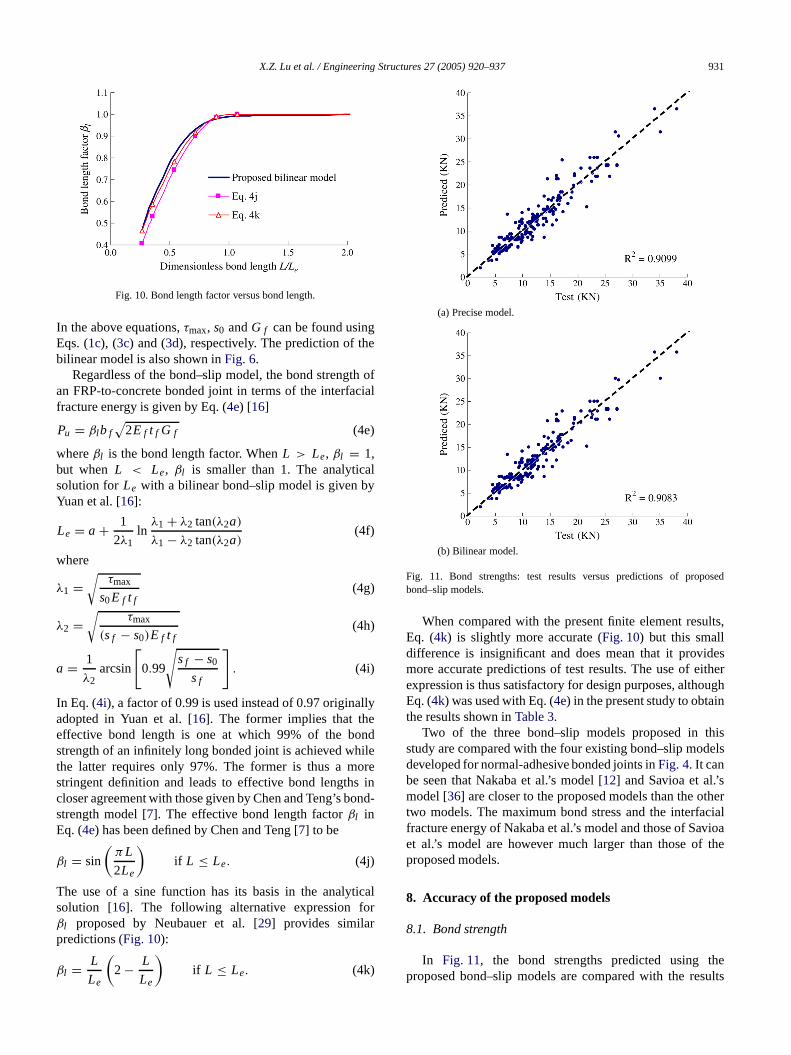
In Eq. (4i), a factor of 0.99 is used instead of 0.97 originalladopted in Yuan et al. [16]. The former implies that theeffective bond length is one at which 99% of the bonstrength of an infinitely long bonded joint is achieved whilthe latter requires only 97%. The former is thus a morestringent definition and leads to effective bond lengthscloser agreement with those given by Chen and Teng’s bostrength model [7]. The effective bond length factorβl inEq. (4e) has been defined by Chen and Teng [7] to be
βl = sin
(π L
2Le
)if L ≤ Le. (4j)
The use of a sine function has its basis in the analyticsolution [16]. The following alternative expression forβl proposed by Neubauer et al. [29] provides similarpredictions (Fig. 10):
βl = L
Le
(2 − L
Le
)if L ≤ Le. (4k)
-
l
(a) Precise model.
(b) Bilinear model.
Fig. 11. Bond strengths: test results versus predictions of propobond–slip models.
Whencompared with the presentfinite element results,Eq. (4k) is slightly more accurate (Fig. 10) but this smalldifference is insignificant and does mean that it providemore accurate predictions of test results. The use of eiexpression is thus satisfactory for design purposes, althoEq. (4k) was used with Eq. (4e) in thepresent study to obtainthe results shown inTable 3.
Two of the three bond–slip models proposed in thstudy are compared with the four existing bond–slip moddeveloped for normal-adhesive bonded joints inFig. 4. It canbe seen that Nakaba et al.’s model [12] and Savioa et al.’smodel [36] are closer to the proposed models than the ottwo models. The maximum bond stress and the interfacfracture energy of Nakaba et al.’s model and those of Savet al.’s model are however much larger than those ofproposed models.
8. Accuracy of the proposed models
8.1. Bond strength
In Fig. 11, the bond strengths predicted using thproposed bond–slip models are compared with the res

932 X.Z. Lu et al. / Engineering Structures 27 (2005) 920–937
(a) Specimen PG1-22 of Tan [17]. (b) Specimen of PC1-1C2 of Tan [17].
(c) Specimen S-CFS-400-25 of Wu et al. [13]. (d) Specimen B2 of Ueda et al. [22].
Fig. 12. Axial strains in FRP plate: test results versus predictions of proposed bond–slip models.
se
e
getn
g’
s
ee
ndb
e
eheentsshe
omisee
eved.ofle
ainre
geron-be
ofels
of the 253 pull tests listed inTable A.1. It can be foundthat the proposed bond–slip models give results in cloagreement with the test results and perform better thanexisting bond–slip models. The results of the precise modand the simplified model arealmost the same, with theprecise model performing very slightly better. The averavalue and coefficient of variation of the predicted-to-tesbond strength ratios together with the correlation coefficiefor the bond strength formula (Eq. (4e)) are given inTable 3.It can be seen that Eq. (4e) performs significantly better thanall existing bond strength models except Chen and Tenmodel [7]. The new bond strength model is only slightlybetter than Chen and Teng’s model [7], so Chen and Teng’smodel [7] is still recommended for use in design due to itsimpleform.
8.2. Strain distributions in the FRP plate
The strain distributions in the FRP plate can bnumerically calculated from the bond–slip models. Thcomparison of strain distributions between tests apredictions for specimens PG1-22 and PC1-1C2 testedTan [17], specimen S-CFS-400-25 tested by Wu et al. [13],and specimen B2, tested by Ueda et al. [22], are shownin Fig. 12(a)–(d). Comparisons are made for the sam
l
t
s
y
applied load (except for insignificant differences as thtest load levels are not identical to the load levels in tnumerical analysis which was conducted by displacemcontrol) before debonding and for the same effective stretransfer length in the stage of debonding propagation. Tload levels and slip values indicated here are those frnumerical analysis. It can be found that both the precmodel andthe bilinear model are in close agreement with thtest results. The precise model does provide slightly moraccurate predictions, which demonstrates that the curshape of theprecise model is closer to the real situationAdditional comparisons not reported here for a numberother specimens for which strain distributions are availabalso showed similar agreement.
Using specimen PG1-22 as an example, the strdistributions predicted with different bond–slip models acompared with the test results inFig. 13. Comparisonsare made for the same load ofP/Pu = 0.40 (wherePu is the finite element ultimate load) before debondinoccurs (Fig. 13(a)) and for the same effective stress transflength of 125 mm in the stage of debonding propagati(Fig. 13(b)). It can be seen that at a low load in the predebonding stage, the strain distribution does not appear tososensitive to the bond–slip model. However, in the stagedebonding propagation, the differences between the mod

X.Z. Lu et al. / Engineering Structures 27 (2005) 920–937 933
(a) Before debonding stage. (b) Debonding propagation stage.
Fig. 13. Axial strains in FRP plate: test results versus predictions of all bond–slip models.
ar
enlshsie
ipitresg
e
ag’
in
ngec
fgseed
helsth
io
teded-
hasar-
than
-hetal
edge0)de
thfor
and between the model predictions and the test resultslarge.Fig. 13 shows that the existing models do not provideaccurate predictions of test results.
9. Conclusions
This paper has provided a critical review and assessmof existing bond strength models and bond–slip modeand presented a set of three new bond–slip models. Tassessment of theoretical models has been conducted uthe test results of 253 pull specimens collected from thexisting literature. The development of the new bond–slmodels employed a new approach in which meso-scale finelement results with appropriate numerical smoothing aexploited together with test results. Based on the resultand discussions presented in this paper, the followinconclusions may be drawn.
1. Among the 12 existing bond strength models, the modproposed by Chen and Teng [7] is the most accurate.The bond strength model based on the proposed bilinebond–slip model is as accurate as Chen and Tenmodel [7] but is more complicated. Chen and Teng’smodel therefore remains the model of choice for usedesign.
2. Typical bond–slip curves should consist of an ascendibranch with continuous stiffness degradation to thmaximum bond stress and a curved descending branreaching a zero bond stress at a finite value of slip.
3. While a precise bond–slip model should consist oa curved ascending branch and a curved descendinbranch, other shapes such as a bilinear model can be uas a good approximation. An accurate bond–slip modshould provide close predictions of both the shape anfracture energy (area under the bond–slip curve) of tbond–slip curve. None of the existing bond–slip modeprovides accurate predictions of both the shape andinterfacial fracture energy as found from tests.
4. The three new bond–slip models, based on a combinatof finite element results and the test results predict both
e
t,eng
e
l
rs
h
dl
e
n
the bond strength and strain distribution in the FRP plaaccurately. These models are therefore recommenfor future use in the numerical modelling of FRPstrengthened RC structures.
It should be noted that the scope of the present studybeen limited to FRP-to-concrete bonded joints whose shedeformed adhesive layer has a shear stiffness of no less2.5 GPa/mm. The studies by Dai and Ueda [14] andUedaet al. [15] should be consulted for information on FRP-toconcrete bonded joints with a very soft adhesive layer. Tpresent work nevertheless is believed to be applicable to aleast all commercially available FRP systems for externbonding applications outside Japan.
Acknowledgements
The authors are grateful for the financial support receivfrom the Research Grants Council of the Hong KonSAR (Project No: PolyU 5151/03E), the Natural SciencFoundation of China (National Key Project No. 5023803and The Hong Kong Polytechnic University providethrough its Area of Strategic Development (ASD) Schemfor the ASD in Urban Hazard Mitigation.
Appendix A. Database of pull tests
SeeTable A.1.
Appendix B. Bond strength models
This appendix provides a summary of four bond strengmodels which are believed to be not widely accessiblethe convenience of readers. Three of them are described in arecent JCI report [32] while the fourth one was developed inChina. The following units are used: N for forces, MPa forstresses and elastic moduli, and mm forlengths.

934 X.Z. Lu et al. / Engineering Structures 27 (2005) 920–937
Table A.1Database of pull tests
Source Specimen FRP plate Concrete prismb Ultimateload Pu (kN)
Thicknesst f (mm)
Widthb f(mm)
Bondlength L(mm)
ElasticmodulusE f(GPa)
Tensilestrengthf f(MPa)
Cubestrengthfcu(MPa)
Tensilestrengthft(MPa)
Widthbc(mm)
Tan [17] PG1-11 0.169 50 130 97 2777 37.60 2.90 100 7.78a
PG1-12 0.169 50 130 97 2777 37.60 2.90 100 9.19a
PG1-1W1 0.169 75 130 97 2777 37.60 2.90 100 10.11a
PG1-1W2 0.169 75 130 97 2777 37.60 2.90 100 13.95a
PG1-1L11 0.169 50 100 97 2777 37.60 2.90 100 6.87a
PG1-1L12 0.169 50 100 97 2777 37.60 2.90 100 9.20a
PG1-1L21 0.169 50 70 97 2777 37.60 2.90 100 6.46a
PG1-1L22 0.169 50 70 97 2777 37.60 2.90 100 6.66a
PG1-21 0.338 50 130 97 2777 37.60 2.90 100 10.49a
PG1-22 0.338 50 130 97 2777 37.60 2.90 100 11.43a
PC1-1C1 0.111 50 130 235 3500 37.60 2.90 100 7.97a
PC1-1C2 0.111 50 130 235 3500 37.60 2.90 100 9.19a
Zhaoet al. [21] NJ2 0.083 100 100 240 3550 20.50 2.08 150 11.00NJ3 0.083 100 150 240 3550 20.50 2.08 150 11.25NJ4 0.083 100 100 240 3550 36.70 2.87 150 12.50NJ5 0.083 100 150 240 3550 36.70 2.87 150 12.25NJ6 0.083 100 150 240 3550 36.70 2.87 150 12.75
Takeo et al. [20] 1-11 0.167 40 100 230 3481 36.56 2.86 100 8.751-12 0.167 40 100 230 3481 33.75 2.74 100 8.851-21 0.167 40 200 230 3481 36.56 2.86 100 9.301-22 0.167 40 200 230 3481 33.75 2.74 100 8.501-31 0.167 40 300 230 3481 36.56 2.86 100 9.301-32 0.167 40 300 230 3481 33.75 2.74 100 8.301-41 0.167 40 500 230 3481 36.56 2.86 100 8.051-42 0.167 40 500 230 3481 36.56 2.86 100 8.051-51 0.167 40 500 230 3481 33.50 2.73 100 8.451-52 0.167 40 500 230 3481 33.50 2.73 100 7.302-11 0.167 40 100 230 3481 31.63 2.64 100 8.752-12 0.167 40 100 230 3481 31.63 2.64 100 8.852-13 0.167 40 100 230 3481 33.13 2.71 100 7.752-14 0.167 40 100 230 3481 33.13 2.71 100 7.652-15 0.167 40 100 230 3481 30.88 2.61 100 9.002-21 0.334 40 100 230 3481 31.63 2.64 100 12.002-22 0.334 40 100 230 3481 31.63 2.64 100 10.802-31 0.501 40 100 230 3481 31.63 2.64 100 12.652-32 0.501 40 100 230 3481 31.63 2.64 100 14.352-41 0.165 40 100 373 2942 30.88 2.61 100 11.552-42 0.165 40 100 373 2942 30.88 2.61 100 11.002-51 0.167 40 100 230 3481 33.13 2.71 100 9.852-52 0.167 40 100 230 3481 33.13 2.71 100 9.502-61 0.167 40 100 230 3481 33.13 2.71 100 8.802-62 0.167 40 100 230 3481 33.13 2.71 100 9.252-71 0.167 40 100 230 3481 33.13 2.71 100 7.652-72 0.167 40 100 230 3481 33.13 2.71 100 6.802-81 0.167 40 100 230 3481 63.25 3.87 100 7.752-82 0.167 40 100 230 3481 63.25 3.87 100 8.052-91 0.167 40 100 230 3481 30.88 2.61 100 6.752-92 0.167 40 100 230 3481 30.88 2.61 100 6.802-101 0.111 40 100 230 3481 31.63 2.64 100 7.702-102 0.111 40 100 230 3481 33.13 2.71 100 6.95
Ren [23] DLUT15-2G 0.507 20 150 83.03 3271 28.70 2.50 150 5.81DLUT15-5G 0.507 50 150 83.03 3271 28.70 2.50 150 10.60DLUT15-7G 0.507 80 150 83.03 3271 28.70 2.50 150 18.23DLUT30-1G 0.507 20 100 83.03 3271 45.30 3.22 150 4.63DLUT30-2G 0.507 20 150 83.03 3271 45.30 3.22 150 5.77DLUT30-3G 0.507 50 60 83.03 3271 45.30 3.22 150 9.42

X.Z. Lu et al. / Engineering Structures 27 (2005) 920–937 935
Table A.1(continued)
Source Specimen FRP plate Concrete prismb Ultimateload Pu (kN)
Thicknesst f (mm)
Widthb f(mm)
Bondlength L(mm)
ElasticmodulusE f(GPa)
Tensilestrengthf f(MPa)
Cubestrengthfcu(MPa)
Tensilestrengthft(MPa)
Widthbc(mm)
DLUT30-4G 0.507 50 100 83.03 3271 45.30 3.22 150 11.03DLUT30-6G 0.507 50 150 83.03 3271 45.30 3.22 150 11.80DLUT30-7G 0.507 80 100 83.03 3271 45.30 3.22 150 14.65DLUT30-8G 0.507 80 150 83.03 3271 45.30 3.22 150 16.44DLUT50-1G 0.507 20 100 83.03 3271 55.50 3.60 150 5.99DLUT50-2G 0.507 20 150 83.03 3271 55.50 3.60 150 5.90DLUT50-4G 0.507 50 100 83.03 3271 55.50 3.60 150 9.84DLUT50-5G 0.507 50 150 83.03 3271 55.50 3.60 150 12.28DLUT50-6G 0.507 80 100 83.03 3271 55.50 3.60 150 14.02DLUT50-7G 0.507 80 150 83.03 3271 55.50 3.60 150 16.71DLUT15-2C 0.33 20 150 207 3890 28.70 2.50 150 5.48DLUT15-5C 0.33 50 150 207 3890 28.70 2.50 150 10.02DLUT15-7C 0.33 80 150 207 3890 28.70 2.50 150 19.27DLUT30-1C 0.33 20 100 207 3890 45.30 3.22 150 5.54DLUT30-2C 0.33 20 150 207 3890 45.30 3.22 150 4.61DLUT30-4C 0.33 50 100 207 3890 45.30 3.22 150 11.08DLUT30-5C 0.33 50 100 207 3890 45.30 3.22 150 16.10DLUT30-6C 0.33 50 150 207 3890 45.30 3.22 150 21.71DLUT30-7C 0.33 80 100 207 3890 45.30 3.22 150 22.64DLUT50-1C 0.33 20 100 207 3890 55.50 3.60 150 5.78DLUT50-4C 0.33 50 100 207 3890 55.50 3.60 150 12.95DLUT50-5C 0.33 50 150 207 3890 55.50 3.60 150 16.72DLUT50-6C 0.33 80 100 207 3890 55.50 3.60 150 16.24DLUT50-7C 0.33 80 150 207 3890 55.50 3.60 150 22.80
Ueda etal. [22] Ueda_A1 0.11 50 75 230 3479 29.74 2.55 100 6.25a
Ueda_A2 0.11 50 150 230 3479 52.31 3.48 100 9.2a
Ueda_A3 0.11 50 300 230 3479 52.31 3.48 100 11.95a
Ueda_A4 0.22 50 75 230 3479 55.51 3.60 100 10.00a
Ueda_A5 0.11 50 150 230 3479 54.36 3.56 100 7.30a
Ueda_A6 0.165 50 65 372 2940 54.36 3.56 100 9.55a
Ueda_A7 0.22 50 150 230 3479 54.75 3.57 100 16.25a
Ueda_A8 0.11 50 700 230 3479 54.75 3.57 100 11.00a
Ueda_A9 0.11 50 150 230 3479 51.03 3.43 100 10.00a
Ueda_A10 0.11 10 150 230 3479 30.51 2.59 100 2.40a
Ueda_A11 0.11 20 150 230 3479 30.51 2.59 100 5.35a
Ueda_A12 0.33 20 150 230 3479 30.51 2.59 100 9.25a
Ueda_A13 0.55 20 150 230 3479 31.67 2.64 100 11.75a
Ueda_B1 0.11 100 200 230 3479 31.67 2.64 500 20.60Ueda_B2 0.33 100 200 230 3479 52.44 3.49 500 38.00Ueda_B3 0.33 100 200 230 3479 58.85 3.71 500 34.10
Wu etal. [13] D-CFS-150-30a 0.083 100 300 230 4200 58.85 3.71 100 12.20a
D-CFS-150-30b 0.083 100 300 230 4200 73.85 4.21 100 11.80a
D-CFS-150-30c 0.083 100 300 230 4200 73.85 4.21 100 12.25a
D-CFS-300-30a 0.167 100 300 230 4200 73.85 4.21 100 18.90a
D-CFS-300-30b 0.167 100 300 230 4200 73.85 4.21 100 16.95a
D-CFS-300-30c 0.167 100 300 230 4200 73.85 4.21 100 16.65a
D-CFS-600-30a 0.333 100 300 230 4200 73.85 4.21 100 25.65a
D-CFS-600-30b 0.333 100 300 230 4200 73.85 4.21 100 25.35a
D-CFS-600-30c 0.333 100 300 230 4200 73.85 4.21 100 27.25a
D-CFM-300-30a 0.167 100 300 390 4400 73.85 4.21 100 19.50a
D-CFM-300-30b 0.167 100 300 390 4400 73.85 4.21 100 19.50a
D-AR-280-30a 1 100 300 23.9 4400 73.85 4.21 100 12.75a
D-AR-280-30b 1 100 300 23.9 4400 73.85 4.21 100 12.85a
D-AR-280-30c 1 100 300 23.9 4400 73.85 4.21 100 11.90a
S-CFS-400-25a 0.222 40 250 230 4200 73.85 4.21 100 15.40S-CFS-400-25b 0.222 40 250 230 4200 73.85 4.21 100 13.90S-CFS-400-25c 0.222 40 250 230 4200 73.85 4.21 100 13.00
(continued on next page)

936 X.Z. Lu et al. / Engineering Structures 27 (2005) 920–937
Table A.1(continued)
Source Specimen FRP plate Concrete prismb Ultimateload Pu (kN)
Thicknesst f (mm)
Widthb f(mm)
Bondlength L(mm)
ElasticmodulusE f(GPa)
Tensilestrengthf f(MPa)
Cubestrengthfcu(MPa)
Tensilestrengthft(MPa)
Widthbc(mm)
S-CFM-300-25a 0.167 40 250 390 4400 73.85 4.21 100 12.00S-CFM-300-25b 0.167 40 250 390 4400 73.85 4.21 100 11.90S-CFM-900-25a 0.5 40 250 390 4400 73.85 4.21 100 25.90S-CFM-900-25b 0.5 40 250 390 4400 73.85 4.21 100 23.40S-CFM-900-25c 0.5 40 250 390 4400 73.85 4.21 100 23.70
a Double-shear test;Pu is equal to half of the total applied load at failure.b If the literature provides only the cylinder strength, thenfcu = f ′
c/0.78. The tensile strength was found usingft = 0.395( fcu)0.55 according to the
Chinese code [24]. The elastic modulus which is not listed in the table was found usingEc = 100 0002.2+34.74/ fcu
according to the same code when needed.
es.
w
ent
es03;
dng
nd
ates
dale
e
B.1. Izumo’s model
The bond strength model proposed by Izumo [32] is givenby
Pu = (3.8 f ′2/3c + 15.2)L E f b f t f × 10−3
for carbon fibre sheets
and
Pu = (3.4 f ′2/3c + 69)L E f b f t f × 10−3
for aramid fibre sheets.
B.2. Sato’s model
The bond strength model given by Sato [32] is describedby the following equations:
τu = 2.68 f ′0.2c t f E f × 10−5
Le = 1.89(E f t f )0.4
if Le > L, thenLe = L
Pu = (bf + 2�b)Leτu
�b = 3.7 mm is the working width of concrete.
B.3. Iso’s model
The bond strength model proposed by M. Iso [32] is givenby
τu = 0.93 f ′0.44c
Le = 0.125(E f t f )0.57
Pu = τu × bf × Le
where if Le = L if Le > L.
B.4. Yang’s model
The bond strength model proposed by Yang et al. [33] is
Pu =(
0.5 + 0.08
√E f t f
100ft
)bf Leτu
where
τu = 0.5 ftLe = 100 mm.
References
[1] Teng JG, Chen JF, Simth ST, Lam L. FRP-strengthened RC structurUK: John Wiley & Sons; 2002.
[2] Smith ST, Teng JG. FRP-strengthened RC structures-I: revieof debonding strength models. Engineering Structures 2002;24(4):385–95.
[3] Smith ST, Teng JG. FRP-strengthened RC structures-II: assessmof debonding strength models. Engineering Structures 2002;24(4):397–417.
[4] Smith ST, Teng JG. Shear-bending interaction in debonding failurof FRP-plated RC beams. Advances in Structural Engineering 206(3):183–99.
[5] Teng JG, Smith ST, Yao J, Chen JF. Intermediate crack-inducedebonding in RC beams and slabs. Construction and BuildiMaterials 2003;17(6–7):447–62.
[6] Oehler DJ, Park SM, Mohamed AliMS. A structural engineeringapproach to adhesive bonding longitudinal plates to RC beams aslabs. Composites: Part A 2003;34(12):887–97.
[7] Chen JF, Teng JG. Anchorage strength models for FRP and steel plbonded to concrete. Journal of Structural Engineering, ASCE 2001;127(7):784–91.
[8] Yao J, Teng JG, Chen JF. Experimental study on FRP-to-concretebonded joints. Composites-Part B:Engineering 2005;36(2):99–113.
[9] Maeda T, Asano Y, Sato Y, Ueda T, Kakuta Y. A study on bonmechanism of carbon fiber sheet. In: Proc. of 3rd internationsymposium on non-metallic (FRP) reinforcement for concretstructures, vol. 1. Sapporo: Japan Concrete Institute; 1997. p. 279–85.
[10] Brosens K, van Gemert D. Anchoring stresses between concreteand carbon fiber reinforced laminates. In: Proc. of 3rd internationalsymposium on non-metallic (FRP) reinforcement for concretstructures, vol. 1. Sapporo: Japan Concrete Institute; 1997. p. 271–8.
[11] De Lorezis L, Miller B, Nanni A. Bond of fiber-reinforced polymerlaminates to concrete. ACI Material Journal 2001;98(3):256–64.
[12] Nakaba K, Toshiyuki K, Tomoki F, Hiroyuki Y. Bond behaviorbetween fiber-reinforced polymerlaminates and concrete. ACIStructural Journal 2001;98(3):359–67.
[13] Wu ZS, Yuan H, Hiroyuki Y, Toshiyuki K. Experimental/analyticalstudy on interfacial fracture energy and fracture propagation alongFRP-concrete interface. In: ACI International SP-201-8. 2001. p.133–52.

X.Z. Lu et al. / Engineering Structures 27 (2005) 920–937 937
tsRP
ronret
ior:
RP
ndI
de;
due97
ce-
9.
is
na
s
3rdor
.
llyth
I):
-
d
l of
ivil
eing
nicsd
88.
d
rld
-P
edy;
in
for;
or
[14] Dai JG, Ueda T. Local bond stress slip relations for FRP sheeconcrete interfaces. In: Proc. of 6th international symposium on Freinforcement for concrete structures. Singapore: World ScientificPublications; 2003. p. 143–52.
[15] Ueda T, Dai JG, Sato Y. A nonlinear bond stress–slip relationship foFRP sheet–concrete interface. In: Proc. of international symposiumlatest achievement of technology and research on retrofitting concstructures. 2003. p. 113–20.
[16] Yuan H, Teng JG, Seracino R, Wu ZS, Yao J. Full-range behavof FRP-to-concrete bonded joints. Engineering Structures 2004;26(5)553–64.
[17] Tan Z. Experimental research for RC beam strengthened with GFMaster thesis, China: Tsinghua University; 2002 [in Chinese].
[18] Chajes MJ, Finch WWJ, Januszka TF, Thonson TAJ. Bond aforce transfer of composite material plates bonded to concrete. ACStructural Journal 1996;93(2):295–303.
[19] Taljsten B. Defining anchor lengths of steel and CFRP plates bonto concrete. International Journal of Adhesion and Adhesives 199717(4):319–27.
[20] Takeo K, Matsushita H, Makizumi T, Nagashima G. Boncharacteristics of CFRP sheets in the CFRP bonding techniqIn: Proc. of Japan concrete institute, vol. 19, no. 2. June, 19p. 1599–604.
[21] Zhao HD, Zhang Y, Zhao M. Research on the bond performanbetween CFRP plate and concrete. In: Proc. of 1st conference on FRPconcrete structures of China. 2000. p. 247–53.
[22] Ueda T, Sato Y, Asano Y. Experimental study on bond strengthof continuous carbon fiber sheet. In:Proc. of 4th internationalsymposium on fiber reinforced polymerreinforcement for reinforcedconcrete structures, SP-188. Farmington Hills (MI): ACI; 199p. 407–16.
[23] Ren HT. Study on basic theories and long time behavior of concretestructures strengthened by fiber reinforced polymers. Ph.D. thesChina: Dalian University of Technology; 2003 [in Chinese].
[24] GB 50010. Code for design of concrete structures. Beijing: ChiBuilding Industry Press; 2002 [in Chinese].
[25] Tanaka T. Shear resisting mechanism of reinforced concrete beamwith CFS as shear reinforcement. Graduation thesis. Japan: HokkaidoUniversity; 1996.
[26] Hiroyuki Y, Wu Z. Analysis of debonding fracture properties ofCFS strengthened member subject to tension. In: Proc. ofinternational symposium on non-metallic (FRP) reinforcement fconcrete structures, vol. 1. 1997. p. 284–94.
[27] van Gemert D. Force transfer inepoxy-bonded steel–concrete jointsInternational Journal of Adhesion and Adhesives 1980;1:67–72.
[28] Brosens K, van Gemert D. Anchorage design for externabonded carbon fiber reinforced polymer laminates. In: Proc. of 4
-
e
.
d
..
.
international symposium on fiber reinforced polymer reinforcementfor reinforced concrete structures, SP-188. Farmington Hills (MACI; 1999. p. 635–45.
[29] Neubauer U, Rostasy FS. Design aspects of concrete structures strengthened with externally bonded CFRP plates. In:Proc. of 7th international conference on structural faults anrepair, vol. 2. Edinburgh (Scotland): ECS Publications; 1997.p. 109–18.
[30] Khalifa A, Gold WJ, Nanni A, Aziz A. Contribution of externallybonded FRP to shear capacity of RC flexural members. JournaComposites for Construction, ASCE 1998;2(4):195–203.
[31] Chaallal O, Nollet MJ, Perraton D. Strengthening of reinforcedconcrete beams with externally bonded fiber-reinforced-plastic plates:design guidelines for shear and flexure. Canadian Journal of CEngineering 1998;25(4):692–704.
[32] JCI. Technical report of technicalcommittee on retrofit technology. In:Proc., international symposium on latest achievement of technologyand research on retrofitting concrete structures. 2003.
[33] Yang YX, Yue QR, Hu YC. Experimental study on bond performancbetween carbon fiber sheets and concrete. Journal of BuildStructures 2001;22(3):36–42 [in Chinese].
[34] Neubauer U, Rostasy FS. Bond failure of concretefiber reinforcedpolymer plates at inclined cracks-experiments and fracture mechamodel. In: Proc. of 4th international symposium on fiber reinforcepolymer reinforcement for reinforced concrete structures, SP-1Farmington Hills (MI): ACI; 1999. p. 369–82.
[35] Monti M, Renzelli M, Luciani P. FRP adhesion in uncracked ancracked concrete zones. In: Proc.of 6th international symposiumon FRP reinforcement for concrete structures. Singapore: WoScientific Publications; 2003. p. 183–92.
[36] Savioa M, Farracuti B, Mazzotti D. Non-linear bond–slip law for FRPconcrete interface. In: Proc. of 6th international symposium on FRreinforcement for concrete structures. Singapore: World ScientificPublications; 2003. p. 163–72.
[37] Taljsten B. Plate bonding: strengthening of existing concretestructures with epoxy bonded plates of steel or fiber reinforcplastics. Ph.D. thesis. Sweden: Lulea University of Technolog1994.
[38] Wu ZS, Yuan H, Niu HD. Stress transfer and fracture propagationdifferent kinds of adhesive joints. Journal of Engineering Mechanics,ASCE 2002;128(5):562–73.
[39] MSC.Marc. User’s manual.MSC Software Corporation; 2003.[40] Lu XZ, Ye LP, Teng JG, Jiang JJ. Meso-scale finite element model
FRP plates/sheets bonded to concrete. Engineering Structures 200527(4):564–75.
[41] Rots JG, Blaauwendraad J. Crack models for concrete: discretesmeared? fixed, multi-directional or rotating? Heron 1989;34(1).