bone density and cortical structure after pediatric renal
TRANSCRIPT
CLINICAL RESEARCH www.jasn.org
Bone Density and Cortical Structure after PediatricRenal Transplantation
Anniek M. Terpstra,*† Heidi J. Kalkwarf,‡ Justine Shults,†§ Babette S. Zemel,†
Rachel J. Wetzsteon,† Bethany J. Foster,| C. Frederic Strife,‡ Debbie L. Foerster,†
and Mary B. Leonard†§
*Department of Epidemiology, Biostatistics and Health Technology Assessment, Radboud University NijmegenMedical Centre, Nijmegen, The Netherlands; †Department of Pediatrics, Children’s Hospital of Philadelphia,Perelman School of Medicine at the University of Pennsylvania, Philadelphia, Pennsylvania; ‡Department of Pediatrics,Cincinnati Children’s Hospital Medical Center, Cincinnati, Ohio; §Department of Biostatistics and Epidemiology,Perelman School of Medicine at the University of Pennsylvania, Philadelphia, Pennsylvania; and |Department ofPediatrics, Montreal Children's Hospital, Montreal, Quebec, Canada
ABSTRACTThe impact of renal transplantation on trabecular and cortical bone mineral density (BMD) and corticalstructure is unknown.We obtained quantitative computed tomography scans of the tibia in pediatric renaltransplant recipients at transplantation and3, 6, and 12months; 58 recipients completed at least two visits.We used more than 700 reference participants to generate Z-scores for trabecular BMD, cortical BMD,section modulus (a summary measure of cortical dimensions and strength), and muscle and fat area. Atbaseline, compared with reference participants, renal transplant recipients had significantly lower meansection modulus and muscle area; trabecular BMD was significantly greater than reference participantsonly in transplant recipients younger than 13 years. After transplantation, trabecular BMD decreasedsignificantly in association with greater glucocorticoid exposure. Cortical BMD increased significantly inassociation with greater glucocorticoid exposure and greater decreases in parathyroid hormone levels.Muscle and fat area both increased significantly, but section modulus did not improve. At 12 months,transplantation associated with significantly lower section modulus and greater fat area compared withreference participants. Muscle area and cortical BMD did not differ significantly between transplant recip-ients and reference participants. Trabecular BMD was no longer significantly elevated in younger recipientsand was low in older recipients. Pediatric renal transplant associated with persistent deficits in section mod-ulus, despite recoveryofmuscle, and low trabecular BMD inolder recipients. Future studies should determinethe implications of these data on fracture risk and identify strategies to improve bone density and structure.
J Am Soc Nephrol 23: ccc–ccc, 2012. doi: 10.1681/ASN.2011050480
During childhood and adolescence, skeletal devel-opment is characterized by increases in trabecularand cortical bone mineral density (BMD) andcortical dimensions.1 Children with CKD have nu-merous risk factors for impaired bone acquisition,including growth failure, delayed puberty, mal-nutrition, acidosis, vitamin D deficiency, muscledeficits, and secondary hyperparathyroidism. Suc-cessful renal transplantation corrects many of theunderlying abnormalities contributing to bone defi-cits in childhood CKD. However, immunosuppres-sive therapies and persistent hyperparathyroidismmay impair recovery of bone structure and
strength. The risk of fracture among adult renaltransplant recipients increases in the months aftertransplantation and then gradually declines.2 The
Received May 17, 2011. Accepted October 30, 2011.
Published online ahead of print. Publication date available atwww.jasn.org.
Correspondence: Dr. Mary B. Leonard, Children’s Hospital ofPhiladelphia, 34th Street and Civic Center Boulevard, CHOPNorth, Room 868, Philadelphia, PA 19104. Email: [email protected]
Copyright © 2012 by the American Society of Nephrology
J Am Soc Nephrol 23: ccc–ccc, 2012 ISSN : 1046-6673/2304-ccc 1
impact of renal transplantation on trabecular and corticalBMD and cortical dimensions has not been well establishedin children or adults.
The majority of pediatric studies of BMD after transplan-tation relied on dual energy x-ray absorptiometry (DXA).3–11
DXA is a projection technique that summarizes total bonemineral content within the projected bone area, resulting intwo important limitations in childhood CKD. First, trabecularand cortical bone are superimposed, potentially concealingthe opposing effects of elevated parathyroid hormone (PTH)levels to increase and decrease trabecular and cortical bonemineral content, respectively.12 Second, DXA provides atwo-dimensional measure of areal BMD (g/cm2) that system-atically underestimates volumetric BMD (g/cm3) in childrenwith poor growth.13 This effect was illustrated in a study ofpediatric renal transplant recipients: areal BMD Z-scores rel-ative to chronological age were 1–2 SDs lower than areal BMDZ-scores relative to height age.6
Peripheral quantitative computed tomography (pQCT) is athree-dimensional technique that distinguishes between cor-tical and trabecular bone, and measures volumetric BMD andbone dimensions.We recently conducted a tibia pQCTstudy in156 children with mild to severe CKD and no history of renaltransplantation, showing that advanced CKD and secondaryhyperparathyroidism were associated withsignificant reductions in cortical dimen-sions and cortical BMD, with elevations intrabecular BMD in the younger childrenonly.14 To our knowledge, QCT studies inrenal transplant recipients are limited tothree studies in children15–17 and one studyin adults.18 These cross-sectional studieswere limited by inclusion of transplant re-cipients at highly variable intervals sincetransplantation; the largest pediatric studywas conducted a mean of 4.9 years aftertransplantation.15 Although these studiesshowed cortical deficits, they could not ad-dress progression or recovery given thecross-sectional design.
The objectives of this prospective cohortstudy were (1) to assess tibia trabecular andcortical volumetric BMD, cortical dimen-sions, and muscle and fat area using pQCTin pediatric and adolescent renal transplantrecipients over 12 months after transplanta-tion and (2) to identify correlates of changesin pQCT parameters after transplantation.pQCTresults were compared with referencedata generated in more than 700 concurrenthealthy participants.1,19–21 The hypotheseswere that glucocorticoid exposure and res-olution of secondary hyperparathyroidismafter renal transplantation would be asso-ciated with declines in trabecular BMD
and increases in cortical BMD.12,22 We also hypothesizedthat increases inmuscle area after renal transplantationwouldbe associated with increases in cortical dimensions.
RESULTS
Participant CharacteristicsA total of 61 transplant recipients were enrolled. These dataare limited to the 58 recipients (40 at Children’s Hospital ofPhiladelphia [CHOP] and 18 at Cincinnati Children’s HospitalMedical Center [CCHMC]) with greater than or equal to twopQCTvisits.Of these recipients, 53 completed the 12-monthvisit.
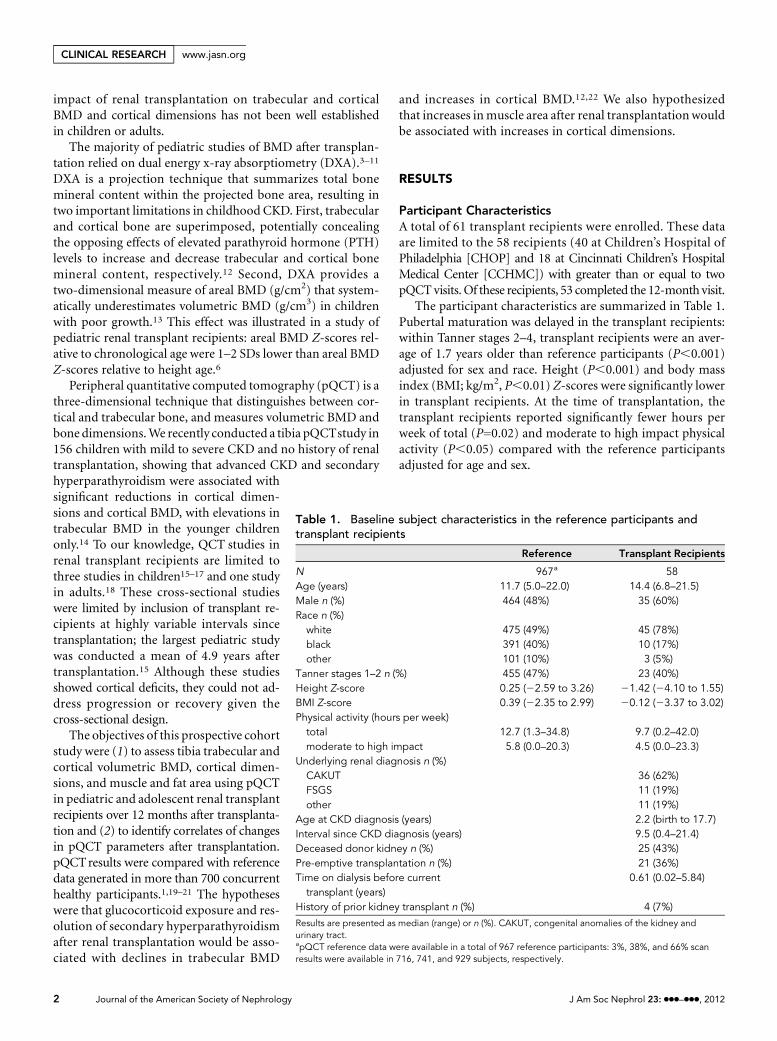
The participant characteristics are summarized in Table 1.Pubertal maturation was delayed in the transplant recipients:within Tanner stages 2–4, transplant recipients were an aver-age of 1.7 years older than reference participants (P,0.001)adjusted for sex and race. Height (P,0.001) and body massindex (BMI; kg/m2, P,0.01) Z-scores were significantly lowerin transplant recipients. At the time of transplantation, thetransplant recipients reported significantly fewer hours perweek of total (P=0.02) and moderate to high impact physicalactivity (P,0.05) compared with the reference participantsadjusted for age and sex.
Table 1. Baseline subject characteristics in the reference participants andtransplant recipients
Reference Transplant Recipients
N 967a 58Age (years) 11.7 (5.0–22.0) 14.4 (6.8–21.5)Male n (%) 464 (48%) 35 (60%)Race n (%)
white 475 (49%) 45 (78%)black 391 (40%) 10 (17%)other 101 (10%) 3 (5%)
Tanner stages 1–2 n (%) 455 (47%) 23 (40%)Height Z-score 0.25 (22.59 to 3.26) 21.42 (24.10 to 1.55)BMI Z-score 0.39 (22.35 to 2.99) 20.12 (23.37 to 3.02)Physical activity (hours per week)
total 12.7 (1.3–34.8) 9.7 (0.2–42.0)moderate to high impact 5.8 (0.0–20.3) 4.5 (0.0–23.3)
Underlying renal diagnosis n (%)CAKUT 36 (62%)FSGS 11 (19%)other 11 (19%)
Age at CKD diagnosis (years) 2.2 (birth to 17.7)Interval since CKD diagnosis (years) 9.5 (0.4–21.4)Deceased donor kidney n (%) 25 (43%)Pre-emptive transplantation n (%) 21 (36%)Time on dialysis before current
transplant (years)0.61 (0.02–5.84)
History of prior kidney transplant n (%) 4 (7%)
Results are presented as median (range) or n (%). CAKUT, congenital anomalies of the kidney andurinary tract.apQCT reference data were available in a total of 967 reference participants: 3%, 38%, and 66% scanresults were available in 716, 741, and 929 subjects, respectively.
2 Journal of the American Society of Nephrology J Am Soc Nephrol 23: ccc–ccc, 2012
CLINICAL RESEARCH www.jasn.org

Themost common cause of CKDwas congenital anomaliesof the kidney and urinary tract. FSGS was the leading cause ofacquired CKD. The majority of transplant recipients were ondialysis at the time of transplantation, and four had a history ofprior renal transplantation.
Clinical Course after TransplantationThe laboratory parameters, estimated GFR (eGFR), andmedications in the transplant recipients are summarized inTable 2. Serum intact PTH (iPTH) concentrations decreasedsignificantly within 3 months after transplantation (medianchange=2168 pg/ml; range=21438 to 49 pg/ml; P,0.0001)and were within the normal range (#66 pg/ml) in 80% and78% at 6 and 12 months, respectively. Bone biomarkers con-sisted of bone-specific alkaline phosphatase (BSAP), a mea-sure of bone formation, and C-terminal telopeptide of type Icollagen (b-CTX), a measure of bone resorption. At the timeof the 3- and 12-month visits, BSAP Z-scores were signifi-cantly lower (P,0.01) and b-CTX Z-scores were significantlygreater (P,0.001) compared with reference participants.Bone biomarker Z-scores did not change significantly withinthe transplant recipients between 3 and 12 months and werenot significantly associated with eGFR or iPTH levels at 3 or 12months. Serum phosphorus levels and bone biomarkerZ-scores were not significantly associated with pQCT results.The majority of the transplant recipients were treated with acombination of glucocorticoids, tacrolimus, and mycopheno-late mofetil. Two participants were treated with a steroid-freeprotocol.
At the 12-month visit, the transplant recipients reported amedian (range) of 8.3 (0.0–32.0) hours per week of total phys-ical activity and 3.2 (0.0–17.5) hours per week of moderate-to high-impact physical activity over the prior year. Four
transplant recipients sustained a total of five fractures: threeplaying sports, one because of a fall down stairs, and one whenstruck by a slow-moving car. Three fractures occurred in thefirst 3 months (one radius, one tibia, and one toe) and twofractures occurred in the second 6 months (one tibia and oneradius) after transplantation. The subject with two fracturessustained a radius fracture in the first 3 months and a tibiafracture in the second 6 months; both were related to sportsparticipation.
pQCT OutcomesExamples of trabecular and cortical pQCT scans are providedin Figure 1.
Trabecular BMDAt the time of transplantation, trabecular BMD Z-scores wereinversely associated with age (Figure 2) (r=20.52, P,0.001),consistent with our findings in moderate to severe CKD.20
Markedly elevated baseline trabecular BMD Z-scores(range=2.2–5.7) were observed solely in transplant recipients,13 years of age. Therefore, trabecular BMD Z-scores weredescribed separately for younger (age,13 years) and older(age$13 years) participants. Serum iPTH levels above the pe-diatric clinical target of 300 pg/ml23 were associated with sig-nificantly higher trabecular BMD Z-scores compared withiPTH levels#300 pg/ml (P,0.05); however, this positive as-sociation was absent in older participants (test for interaction:P,0.05), which was previously reported.20 Similar patternswere observed when iPTH was analyzed as a continuous vari-able; however, the results were not statistically significant.
Table 3 summarizes the pQCT Z-scores in the transplantrecipients at the time of transplantation and 12 monthslater compared with reference participants. At the time of
Table 2. Laboratory parameters and medications after transplantation
Baseline 3 Months 6 Months 12 Months
N 53 46 51 53Laboratory parametersiPTH (pg/ml) 237a (9–1552) 45 (14–176) 45 (18–163) 40 (13–292)corrected calcium (mg/dl) 9.3 (6.9–11.2) 9.7 (8.4–10.3) 9.6 (6.0–10.7) 9.6 (7.7–10.4)phosphorus (mg/dl) 6.4 (2.5–10.8) 4.2 (2.0–5.8) 4.1 (1.9–5.6) 4.0 (2.0–5.3)eGFR (ml/min per 1.73 m2) 63 (45–93) 62 (28–107) 63 (28–108)BSAP Z-score 20.8 (22.8 to 1.1) 20.4 (23.8 to 1.1)b-CTX Z-score 1.1 (22.9 to 5.0) 1.0 (23.4 to 4.5)
Medicationsglucocorticoids n (%) 51 (96%) 45 (98%) 49 (96%) 51 (96%)interval glucocorticoids (mg/kg per day) 0.36 (0.09–0.62) 0.14 (0.05–0.32) 0.12 (0.05–0.36)tacrolimus n (%) 47 (89%) 41 (89%) 44 (86%) 43 (81%)mycophenolate mofetil n (%) 45 (85%) 38 (83%) 39 (76%) 39 (74%)azathioprine n (%) 2 (4%) 2 (4%) 3 (6%) 4 (8%)sirolimus n (%) 10 (19%) 9 (20%) 14 (27%) 16 (30%)
Results are presented as median (range) or n (%).aThe median (range) iPTH concentration in transplant recipients enrolled and tested before renal transplantation (n=18) was 199 (44–1193 pg/ml). For participantstested after renal transplantation, a clinical iPTH drawn within 3 months before renal transplantation was available in 34 participants: the median pretransplantclinical iPTH concentrationwas 310 (9–1552pg/ml). In participants tested after renal transplantationbut forwhomno clinical iPTHwas collectedpretransplant (n=6),the median (range) iPTH concentration was 129 (63–237 pg/ml).
J Am Soc Nephrol 23: ccc–ccc, 2012 Pediatric Transplant Bone Disease 3
www.jasn.org CLINICAL RESEARCH

transplantation, trabecular BMD Z-scores were significantlygreater in younger transplant recipients compared with refer-ence participants (P,0.001), but older transplant recipientsdid not differ significantly from reference participants. Figure 3illustrates the distributions of trabecular BMD Z-scores at eachvisit within the younger and older transplant recipients. Overthe 12-month study interval, trabecular BMD Z-scores
decreased significantly (Table 3), with a mean decrease of1.70 SD in the older participants and 0.38 SD in the youngerparticipants. At the time of the 12-month visit, trabecular BMDZ-scores in the younger participants averaged 0.40 SD but werenot significantly different than the reference participants. Incontrast, trabecular BMD Z-scores were significantly lower inolder transplant recipients compared with reference partici-pants (P=0.03).
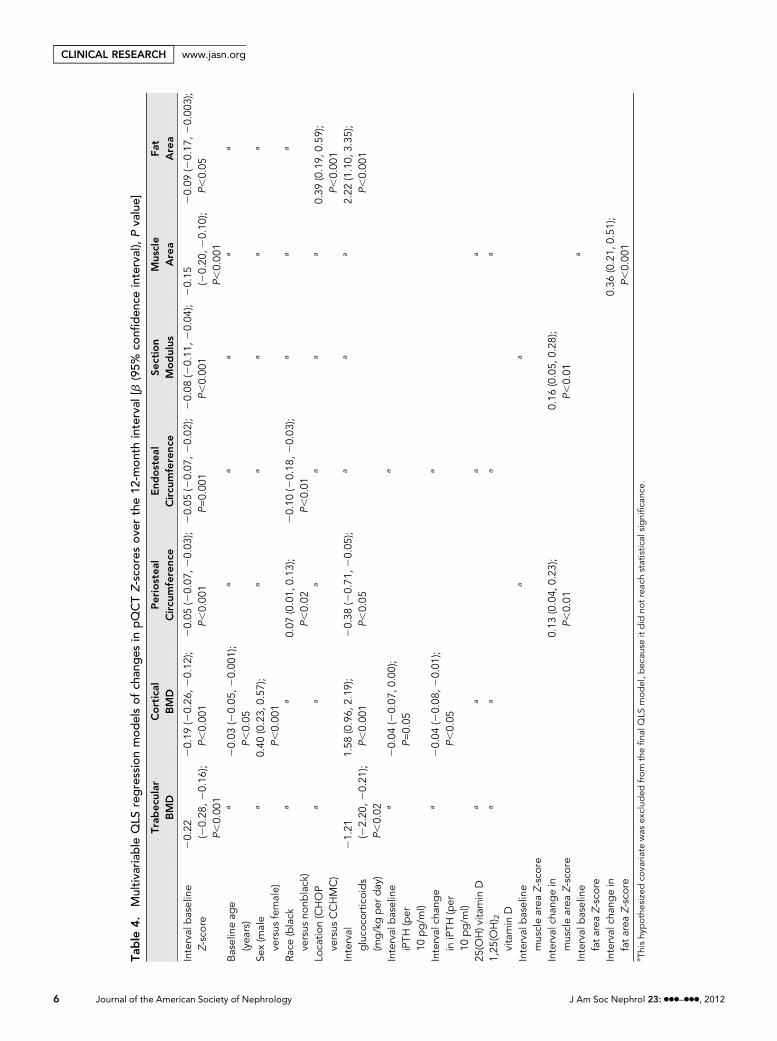
The multivariable quasi-least squares (QLS) regressionmodel of changes in trabecular BMD Z-scores over 12 monthsafter transplantation was conducted with the younger andolder transplant recipients combined. Baseline age was notsignificant in models adjusted for baseline trabecular BMDZ-score. Table 4 presents the QLS models for changes ineach of the pQCT Z-score outcomes over 12 months aftertransplantation. The table includes all of the covariates testedin the models, and the asterisks in each column representtested covariates that were not significant. The model forchanges in trabecular BMD Z-score showed that greatermean glucocorticoid doses (milligrams per kilograms perday) over each interval were significantly associated withgreater decreases in trabecular BMD Z-scores (P,0.02) ad-justed for trabecular BMD Z-scores at the start of each inter-val. The iPTH levels at the beginning of each interval andchanges in iPTH levels over each interval were not significantlyrelated to changes in trabecular BMD Z-scores.
Cortical BMDAt the time of transplantation, cortical BMDZ-scores were notsignificantly lower in transplant recipients compared with ref-erence participants (Table 3). However, baseline cortical BMDZ-scores were inversely associated with iPTH concentrationsin the transplant recipients (r=20.43, P,0.01). Over thecourse of 12 months after transplantation, cortical BMDZ-scores increased significantly (P=0.03), with a mean increaseof 0.37 SD. At the time of the 12-month study visit, cortical BMDZ-scores did not differ significantly between transplant and ref-erence participants.
In the QLS model for changes in cortical BMD Z-scores(Table 4), greater glucocorticoid exposure (P,0.001) andgreater decreases in iPTH levels (P,0.05) over each intervalwere independently associated with greater increases in corti-cal BMD Z-scores.
Cortical DimensionsAt the time of transplantation, cortical section modulusZ-scores were significantly lower in transplant recipients(P,0.001) compared with reference participants (Table 3).The lower section modulus was caused by the combined effectof smaller periosteal circumference and greater endosteal cir-cumference Z-scores compared with reference participants, al-though the differences in these individual parameters did notachieve statistical significance. At the time of transplantation,iPTH concentrations were positively associated with endostealcircumferenceZ-scores (r=0.40,P,0.01) butwere not associated
Figure 1. Tibia pQCT scans illustrate the cortical deficits andgreater trabecular BMD in transplant recipients compared withreference participants. A and B were obtained at the 38% corticaldiaphysis site. B illustrates the smaller cortical dimensions (perios-teal and endosteal circumference Z-score=22.0 and Z-score=20.8,respectively) observed in an 11-year-old black female transplantrecipient at baseline compared with an age-, sex-, race-, andheight Z-score–matched reference participant in A (periostealand endosteal circumference Z-score=0.1 and Z-score=1.0, re-spectively). C and D were obtained at the 3% trabecular meta-physis site. D illustrates the greater trabecular BMD (trabecularBMD Z-score=2.43) in a 12-year-old white female transplant re-cipient at baseline compared with an age-, sex-, and race-matchedreference participant in C (trabecular BMD Z-score=20.09).
Figure 2. Association between age and trabecular BMD Z-scoresat transplantation. Trabecular BMD Z-scores were inversely as-sociated with age (r=20.52, P,0.001).
4 Journal of the American Society of Nephrology J Am Soc Nephrol 23: ccc–ccc, 2012
CLINICAL RESEARCH www.jasn.org

with periosteal circumference or section modulus Z-scores(P.0.20). Over the 12 months after transplantation, the perios-teal circumference Z-scores decreased an additional 0.1 SD onaverage (P=0.02); however, sectionmodulus (Figure 4) and end-osteal circumference Z-scores did not change significantly. Peri-osteal circumference (P,0.01) and section modulus (P,0.001)Z-scores were significantly lower in the transplant recipientscompared with reference participants at the 12-month visit.
The multivariable QLS model for changesin periosteal circumference Z-scores showedthat higher mean glucocorticoid doses overeach interval (P,0.05) and lesser increasesin muscle area Z-scores over each interval(P,0.01) were independently associatedwith greaterdecreases in periosteal circumfer-enceZ-scores (Table 4). In theQLSmodel forchanges in sectionmodulusZ-scores, changesin muscle area Z-scores over each intervalwere positively associatedwith changes in sec-tion modulus Z-scores (P,0.01).
Muscle and Fat Cross-Sectional AreaAt the timeof transplantation,muscle and fatarea Z-scores were significantly lower intransplant recipients compared with refer-ence participants (both P,0.01) andincreased significantly within transplant re-cipients over the course of 12 months (bothP,0.001). Themean increase in muscle andfat area Z-scores were 0.56 and 1.29 SD, re-spectively. Twelve months after transplanta-tion, muscle area Z-scores did not differbetween transplant recipients and reference
participants, whereas fat areaZ-scoreswere significantly higher intransplant recipients. The increases in muscle area Z-scores aftertransplantation are shown in Figure 4. At the 12-month visit, thetransplant recipients had 17.2% (95% confidence interval=8.2–25.3; P,0.001) lower peak muscle torque relative to musclecross-sectional area compared with reference participants.
The multivariable QLS model for changes in muscle areaZ-scores showed that greater increases in fat area Z-scores over
Table 3. pQCT and anthropometric Z-scores at baseline and 12 months
Z-Score
Baseline Transplant VersusReference
12-Month Transplant VersusReference
0–12 Month Changes WithinTransplants
Mean 6 SD P Value Mean 6 SD P Value Mean (Range) P Value
BMDtrabecular BMDage,13 years 2.1061.97 ,0.001 0.4061.25 0.18 21.70 (23.65 to 20.06) ,0.001age$13years 20.1661.51 0.53 20.5461.17 0.03 20.38 (22.20 to 0.59) 0.02
cortical BMD 20.2261.58 0.34 0.1561.40 0.49 0.37 (22.18 to 3.16) 0.03Cortical dimensionsperiosteal circ 20.3561.21 0.06 20.4561.10 ,0.01 20.10 (20.85 to 0.45) 0.02endosteal circ 0.2861.46 0.21 0.2661.35 0.19 20.01 (20.99 to 1.29) 0.85section modulus 20.5761.12 ,0.001 20.5761.02 ,0.001 0.00 (20.97 to 1.81) 0.73
Body Compositionmuscle area 20.7461.07 ,0.001 20.1961.00 0.19 0.56 (21.18 to 1.69) ,0.001fat area 20.7561.62 ,0.01 0.5561.45 0.01 1.29 (20.86 to 3.44) ,0.001
Anthropometryheight 21.2761.37 ,0.001 21.3161.36 ,0.001 20.03 (20.56 to 0.50) 0.13BMI 20.1261.31 ,0.01 0.6861.35 0.10 0.80 (21.16 to 2.67) ,0.001
These data are limited to transplant recipients with data at baseline and 12-month visits. The cortical dimensions and muscle and fat pQCT Z-scores were adjustedfor age and tibia length. The cortical BMD Z-scores were adjusted for study location (CHOP versus CCHMC).
Figure 3. Trabecular BMD Z-scores after transplantation according to age at trans-plantation. The data are limited to the 14 participants ,13 years of age and the 14participants $13 years of age with trabecular BMD Z-scores at all four visits to facilitatecomparisons within the same participants over time.
J Am Soc Nephrol 23: ccc–ccc, 2012 Pediatric Transplant Bone Disease 5
www.jasn.org CLINICAL RESEARCH
Table
4.Multiva
riab
leQLS
regressionmod
elsof
chan
ges
inpQCTZ-sco
resov
erthe12
-mon
thinterval
[b(95%
confi
den
ceinterval),Pva
lue]
Trab
ecular
BMD
Cortical
BMD
Periostea
lCircu
mference
End
ostea
lCircu
mference
Section
Modulus
Mus
cle
Area
Fat
Area
Interval
baseline
Z-sco
re20.22
(20.28
,20.16
);P,0.00
1
20.19
(20.26
,20.12
);P,0.00
120.05
(20.07
,20.03
);P,0.00
120.05
(20.07
,20.02
);P=0.00
120.08
(20.11
,20.04
);P,0.00
120.15
(20.20
,20.10
);P,0.00
1
20.09
(20.17
,20.00
3);
P,0.05
Baselineag
e(yea
rs)
a20.03
(20.05
,20.00
1);
P,0.05
aa
aa
a
Sex(m
ale
versus
female)
a0.40
(0.23,
0.57
);P,0.00
1
aa
aa
a
Race
(black
versus
nonb
lack)
aa
0.07
(0.01,
0.13
);P,0.02
20.10
(20.18
,20.03
);P,0.01
aa
a
Loca
tion(CHOP
versus
CCHMC)
aa
aa
aa
0.39
(0.19,
0.59
);P,0.00
1Interval
gluco
corticoids
(mg/kgper
day)
21.21
(22.20
,20.21
);P,0.02
1.58
(0.96,
2.19
);P,0.00
120.38
(20.71
,20.05
);P,0.05
aa
a2.22
(1.10,
3.35
);P,0.00
1
Interval
baseline
iPTH
(per
10pg/m
l)
a20.04
(20.07
,0.00);
P=0.05
a
Interval
chan
ge
iniPTH
(per
10pg/m
l)
a20.04
(20.08
,20.01
);P,0.05
a
25(O
H)vita
min
Da
aa
a
1,25
(OH) 2
vitamin
D
aa
aa
Interval
baseline
musclearea
Z-sco
re
aa
Interval
chan
gein
musclearea
Z-sco
re0.13
(0.04,
0.23
);P,0.01
0.16
(0.05,
0.28
);P,0.01
Interval
baseline
fatarea
Z-sco
re
a
Interval
chan
gein
fatarea
Z-sco
re0.36
(0.21,
0.51
);P,0.00
1a Thishy
pothe
sizedco
varia
tewas
exclud
edfrom
thefina
lQLS
model,b
ecau
seitdid
notreac
hstatistic
alsignifica
nce.
6 Journal of the American Society of Nephrology J Am Soc Nephrol 23: ccc–ccc, 2012
CLINICAL RESEARCH www.jasn.org

each interval (P,0.001) were significantly associated withgreater increases in muscle area Z-scores (Table 4). In theQLS model for changes in fat area Z-scores, greater glucocor-ticoid exposure was associated with significantly greater in-creases in fat area Z-scores (P,0.001).
Changes in Section Modulus Relative to Changes in MuscleTo determine if gains in muscle area after transplantation wereassociated with the expected gains in section modulus (i.e., the“functional muscle-bone unit”)24, the 12-month changes inmuscle area and section modulus Z-scores were compared inthe transplant recipients and a subset of 302 reference partici-pants enrolled in an ancillary longitudinal study, adjusted forbaseline muscle area and section modulus Z-scores. Sectionmodulus Z-scores increased with increasing muscle areaZ-scores in both transplant and reference participants. However,the increase in the section modulus Z-score for a given increasein muscle area Z-score was significantly less in transplant recip-ients compared with reference participants (b:20.23; 95% con-fidence interval=20.34 to 20.11; P,0.001). This impairedresponse was less pronounced in participants with lower sec-tion modulus Z-scores at baseline (b:20.13; 95% confidenceinterval=20.22, 20.44; test for interaction P,0.01).
DISCUSSION
This study is the first to examine changes in trabecular andcortical volumetric BMD and cortical dimensions after renaltransplantation in children or adults. Trabecular BMDdecreased
significantly in association with greaterglucocorticoid exposure, and corticalBMD increased significantly in associationwith greater glucocorticoid exposure andgreater declines in iPTH levels. Despite thesignificant improvement in secondary hy-perparathyroidism and the recovery of mus-cle cross-sectional area, the structural corticaldeficits did not improve. Given the recentreport that cortical thinning is a significantrisk factor for fracture in ESRD in adults,these persistent cortical deficits may haveimportant life-long implications for childrenand adolescentswithCKD.25 It is noteworthythat 4 of 58 transplant recipients fractured inthe first 6 months—a fracture rate far higherthan observed in population-based studiesof childhood fracture at any age.26
Prior pQCT studies in pediatric renaltransplant recipients are limited to threecross-sectional studies.15–17 The earlierstudies were limited by small sample sizesand sparse reference data, failing to showsignificant differences between transplantrecipients and controls.16,17 More recently,
the work by Ruth et al.15 examined the forearm functionalmuscle-bone unit in 55 transplant recipients an average of4.9 (range=0.3–16.0) years after transplantation. Height-adjusted cortical thickness was significantly lower and corticalBMDwas significantly higher compared with controls. Height-adjusted muscle area did not differ between transplant recipi-ents and controls, but cortical thickness relative to muscle areawas significantly lower in the transplant recipients—consistentwith our findings here. Trabecular BMD did not differ in trans-plant recipients and controls.
The longitudinal data in this pediatric renal transplant cohortdocumented significant and persistent deficits in cortical di-mensions. The failure to increase periosteal circumferencecommensurate with concurrent increases in tibia lengthresulted in a significant decline in the periosteal circumferenceZ-score. This finding may have been because of glucocorticoideffects to impair bone formation through inhibition of osteo-blast differentiation and activity and increases in osteoblast andosteocyte apoptosis.27 The low BSAP Z-scores observed 3 and12 months after transplantation were consistent with theseeffects. The finding that greater increases in muscle area weresignificantly and independently associated with greater in-creases (or lesser decreases) in section modulus and periostealcircumference after transplantation is consistent with the func-tional muscle–bone unit paradigm: as muscle mass increasesduring growth, bones adapt by increasing dimensions andstrength.24 However, the additional longitudinal analyses inthe transplant recipients and reference participants indicatedthat the transplant recipients did not exhibit the expected in-crease in section modulus given the increase in muscle area.
Figure 4. Section modulus and muscle area Z-scores after transplantation. The dataare limited to the 33 participants with muscle area and section modulus Z-scores at allfour visits to facilitate comparison within the same participants over time.
J Am Soc Nephrol 23: ccc–ccc, 2012 Pediatric Transplant Bone Disease 7
www.jasn.org CLINICAL RESEARCH
This finding may have been because of the lower musclestrength relative to muscle cross-sectional area observed12 months after transplantation. Decreased physical activityand potential alterations in the insulin-like growth factor sys-tem may also have contributed to persistent cortical structuraldeficits.28 In a related study, we also observed that greater gainsin muscle were significantly associated with lesser declines insection modulus after diagnosis and treatment with glucocor-ticoids in children with Crohn disease.19
We recently examined pQCT trabecular BMD in childrenwith CKD (including 86 with eGFR,30 ml/min per 1.73 m2)and no history of renal transplantation, anticipating that tra-becular BMD Z-scores would be elevated because of an ana-bolic effect of PTH.12 Although this association was observedin the younger participants, it was absent in the adolescents.We hypothesized that the elevated trabecular BMD in theyounger children was caused by CKD and PTH effects onthemetaphysis. The work byMehls et al.29 reported that trans-formation of metaphyseal spongiosa into diaphyseal spong-iosa is disturbed in advanced CKD in children, such that densemetaphyseal spongiosa is encountered farther along the shaftof the bone.29 The baseline data in the transplant recipientshere (including 31 participants from the prior study that weresubsequently enrolled in this study at a mean of 7months laterand 8 participants that completed both studies simulta-neously) illustrated a similar pattern with markedly elevatedtrabecular BMD in the younger transplant recipients. The ab-sence of associations between age and Z-scores for measuresobtained in the cortical diaphysis is consistent with our in-terpretation that the age effectsmay have been related tomeas-urements in the metaphysis adjacent to the growth plate. Aftertransplantation, trabecular BMD decreased rapidly in theyounger recipients. This finding may have been partially be-cause of restoration of renal function and remodeling of themetaphyseal spongiosa. In the longitudinal models, greaterglucocorticoid exposure was associatedwith greater reductionsin trabecular BMD Z-scores, consistent with the establishedeffects of glucocorticoids to preferentially decrease trabecularbone volume fraction.30 At the end of the 12-month interval,trabecular BMD Z-scores were not lower in the younger recip-ients compared with reference participants. It is not known ifthese results indicate recovery of trabecular bone or distortedmicroarchitecture that is further compromised by glucocorti-coid therapy. Future studies are needed using high-resolutionpQCT to assess trabecular microarchitecture along the entiremetaphysis. The trabecular deficits in the older controls areconsistent with reports of rapid loss of DXA spine BMD in adulttransplant recipients.31
The pattern of reduced BSAP Z-scores after transplantationis consistent with glucocorticoid effects. However, the inter-pretation of the elevated b-CTX Z-scores is less clear. Studiesof glucocorticoid effects on bone resorption have producedconflicting results. Glucocorticoids promote osteoclastogene-sis and inhibit osteoclast apoptosis32; however, glucocorti-coids also directly impair osteoclast adherence to bone and
bone degradation,33 resulting in a state of low bone turnover.The elevated b-CTX Z-scores also may reflect persistent mildsecondary hyperparathyroidism.
This study also showed significant increases in cortical BMDafter transplantation. It is well-established that hyperparathy-roidism results in increased bone turnover and corticalporosity.12,34,35 At baseline, cortical BMD was inversely asso-ciated with iPTH levels, and greater subsequent declines iniPTH levels after transplantation were associated with greaterincreases in cortical BMD. To our knowledge, this associationhas not been examined in prior studies. In addition, greaterglucocorticoid exposure was associated with greater increasesin cortical BMD. This finding is consistent with our recentreports that glucocorticoid therapy was associated with in-creased cortical BMD and lower BSAP levels in childrenwith nephrotic syndrome and normal renal function22 andchildren with Crohn disease.19,36
This study had twoprimary limitations. First, in the absenceof bone biopsy data, it was not possible to assess bonemicroarchitecture, turnover, ormineralization. Second, studyprotocol iPTH levels were not available immediately beforetransplantation in a portion of participants. However, clinicaliPTH levels were available within 3 months before trans-plantation in all but six transplant recipients. An additionallimitation was the lack of lateral spine x-rays for theassessment of vertebral fractures given recent reports ofvertebral compression fractures in pediatric solid organtransplant recipients.5,37 This study design has two importantstrengths. First, this study is the first pQCT study to enrollparticipants at the time of transplantation, with assessment ofchanges after transplantation. Second, the inclusion of alarge, robust reference sample facilitated adjustment forage, sex, race, tibia length, and muscle area in the assessmentof bone outcomes.
In summary, this study showed that pediatric renal trans-plant recipients have persistent deficits in cortical dimensions,and the older recipients have significantly reduced trabecularBMD. Future studies are needed to determine the fractureimplications of these deficits and identify strategies to recoverbone mass in childhood CKD.
CONCISE METHODS
Study ParticipantsThis studywaspartof a larger studyofbonehealth andnutrition in 205
children and adolescents with CKD, ages 5–21 years, treated at CHOP
and CCHMC.14,20,36,38 For this transplant study, baseline visits were
completed within 2 weeks before or after transplantation, and follow-
up visits were conducted 3, 6, and 12 months later. A total of 53 of 58
participants completed a baseline visit with a pQCT scan. Among the
36 participants completing the baseline visit after transplantation, the
median interval after transplantation was 8 days. A total of 53 partic-
ipants completed a pQCT scan a median of 12.5 months after trans-
plantation. Nonambulatory patients and those patients with cognitive
8 Journal of the American Society of Nephrology J Am Soc Nephrol 23: ccc–ccc, 2012
CLINICAL RESEARCH www.jasn.org
or developmental disorders preventing completion of study proce-
dures were ineligible. Participants were excluded if they had a history
of diseases known to affect bone health, including neuromuscular
disease, inflammatory bowel disease, sickle cell anemia, malignancy,
or prior liver or cardiac transplantation. Prior renal transplantation
was not an exclusion criterion. We recently reported that greater 25-
hydroxy vitamin D concentrations after transplantation were associ-
ated with greater declines in PTH concentrations in this cohort.39
The renal transplant recipients were compared with a total of 967
healthy reference participants (899 at CHOP and 68 at CCHMC)
recruited from general pediatrics practices in the greater Philadelphia
and Cincinnati areas. Reference participants were ineligible if they
reported chronic diseases or medications known to affect growth,
development, or bone health (e.g., kidney disease, hepatic disease,
thyroid disease, or malabsorption syndromes). Race, sex, and pubertal
differences in pQCTmeasures of cortical bone and muscle area were
recently reported in the CHOP reference participants.1 A subset of 302
reference participants at CHOP enrolled in an ancillary longitudinal
study with an additional visit at 12 months, as previously described.40
The study protocol was approved by the Institutional Review
Boards at CHOP and CCHMC. Informed consent was obtained
directly from study participants older than 18 years, and assent along
with parental consent was obtained from participants younger than
18 years.
Anthropometry, Physical Maturity, and RaceHeight was measured with a stadiometer (Holtain, Crymych, UK),
and weight was measured with a digital scale (Scaletronix, White
Plains, NY). Tibia length was measured with a segmometer from the
distal margin of the medial malleolus to the proximal border of the
medial tibia condyl. Pubertal development stage was determined
using a validated self-assessment questionnaire and classified accord-
ing to the method of Tanner et al.41,42 Study participants and their
parents were asked to categorize the participant’s race according to
the National Institutes of Health categories.
Physical Activity QuestionnaireA questionnaire was developed that combined an assessment of
physical activity over the prior year based on thework byAaron et al.43
and incorporated a classification of the physical activities from no
impact to high impact based on the work by Kemper et al.44 Partic-
ipants were asked whether they performed any of 55 different activ-
ities at least 10 times in the prior year. To capture seasonal variability,
they were asked to estimate the days per week andminutes per day for
each activity for each month. Each activity was assigned an impact
level from zero (e.g., swimming) to three (e.g., gymnastics), and the
mean time at each activity level was averaged over the prior year. We
report the sum of all four categories (total physical activity in hours
per week) and the sum of the activities with impact levels of two or
three (moderate- to high-impact activity in hours per week). The
questionnaire was administered to the controls and at the time of
the baseline and 12-month transplant visit in the CKD participants.
We recently reported that total physical activity was positively asso-
ciated with section modulus independent of age, sex, race, Tanner
stage, tibia length, and muscle area.21
Biodex Measurement of Muscle TorqueMuscle torque was assessed using Biodex Multi-Joint System 3 Pro
(BiodexMedical Systems, Inc., Shirley,NY).High intrarater (0.97–0.99)
and interrater (0.93–0.96) intraclass correlation coefficients have been
reported.45 Peak isometric torque (foot-pounds) was measured in trip-
licate at 20° dorsiflexion, and the highest value was recorded, as pre-
viously described in the reference participants.21 Thismeasurementwas
used because the tibialis anterior attaches directly to the tibia (the bone
of interest in this study) and causes dorsiflexion of the ankle. The co-
efficient of variation in our laboratory was 4.3%. These Biodex mea-
sures were only performed in the transplant recipients at CHOP at the
baseline and 12-month visits. The results presented here are limited to
the 12-month transplant visit, because pain at the incision sites limited
the ability to perform thebaseline testing in themajority of participants.
The measures were completed in 280 reference participants.
CKD Disease Characteristics and MedicationsMedical charts were reviewed for underlying renal disease, date of
CKDdiagnosis, details of prior transplantation, dialysis duration and
modality, donor source, prior and current medications, and fracture
history. All clinical iPTH levels measured in the 3 months before
transplantation were recorded. Participants and parents were inter-
viewed at the study visit to review the medical history and details of
any new fracture events, including the treating hospital. All fracture
events after transplantation were confirmed by review of radiology
reports. Underlying disease was categorized as congenital anomalies
of the kidney and urinary tract (aplasia/hypoplasia/dysplasia,
obstructive uropathy, and reflux nephropathy), FSGS, or other
(systemic lupus erythematosis, Wegener’s granulomatosis, hemo-
lytic uremic syndrome, tubulointerstitial nephritis, membranopro-
liferative glomerulonephritis types I–III, Alports syndrome, and IgA
nephropathy).
pQCTBone,muscle, and fatmeasures in the left tibiawereobtainedby pQCT
using a Stratec XCT2000 device (Orthometrix, White Plains, NY)
with a12-detector unit, voxel sizeof 0.4mm, slice thickness of 2.3mm,
and scan speed of 25 mm/s. All scans were analyzed with Stratec
software version 5.50 at CHOP. A scout viewwas obtained to place the
reference line at the proximal border of the distal tibia growth plate in
participants with open growth plates and at the distal endplate in
participants with fused growth plates. The bone measurements were
obtained at 3% and 38% of tibia length proximal to the reference line
(Figure 1). At the 3% metaphyseal site, scans were analyzed for tra-
becular volumetric BMD (mg/cm3). At the 38% diaphyseal site, scans
were analyzed for cortical volumetric BMD (mg/cm3), periosteal cir-
cumference (mm), endosteal circumference (mm), and polar section
modulus (mm3). Polar section modulus is a function of the cortical
periosteal and endosteal dimensions, explaining 77% of the variance
in bone failure load in pQCT studies.46 Muscle and fat area (mm3)
were assessed 66% proximal to the distal physis. The manufacturer’s
hydroxyapatite phantom was scanned daily for quality assurance. In
our laboratory, the coefficient of variation for short-term precision
ranged from 0.5% to 1.6% for pQCToutcomes in children and ado-
lescents.
J Am Soc Nephrol 23: ccc–ccc, 2012 Pediatric Transplant Bone Disease 9
www.jasn.org CLINICAL RESEARCH
Partial volume effects may result in an underestimate of cortical
volumetric BMD in bones with a thin cortex, such as in children or
patients with disorders characterized by cortical thinning. The 38%
tibia sitewasused in this study as opposed to the radius or amoredistal
tibia site tominimize these effects, because the cortex is thicker at this
site. A prior study based on phantom measurements suggested that
accurate results for cortical volumetric BMD can be obtained at
cortical thickness .2 mm.47 None of the CKD or reference partic-
ipants reported in this manuscript had a cortical thickness ,2 mm,
and only five transplant recipients had a cortical thickness #3 mm
(range=2.4–3.0).
A single European Forearm Phantom was scanned on the pQCT
devices at CHOP and CCHMC. Calibration scans were obtained two
times over a 3-year interval during the conduct of this study. Measures
were highly stable over time. Cortical BMD was the only measure that
differed significantly between devices; cortical BMD was greater at
CHOP. A correction based on linear regression was applied to the
CCHMC cortical BMD results to adjust for site differences.
Laboratory StudiesNonfasting blood specimens were collected at each study visit in the
transplant participants. Serum creatinine (milligrams per deciliter)
was measured by spectrophotometric enzymatic assay (Vitros,
Johnson & Johnson Co., Rochester, NY) with a coefficient of varia-
tion of 1–5%. eGFR (milliliters per minute per 1.73 m2) was calcu-
lated from height and serum creatinine using the pediatric estimating
equations recently reported by the Prospective Cohort Study of Kid-
ney Disease in Children.48 Plasma iPTH (picograms per milliliter)
levels were quantified by a radioimmunoassay with 125I-labeled tracer
(Scantibodies Clinical Laboratory, Santee, CA) with an intra-assay
coefficient of variation of 3–5%. Serum calcium (milligrams per deci-
liter), phosphorus (milligrams per deciliter), and albumin (grams per
deciliter) concentrations were measured in the clinical laboratories
using standard methods, and calcium levels were adjusted for albu-
min levels.49 Serum 25(OH)D (nanograms per milliliter) and 1,25
(OH)2D (picograms per milliliter) levels were quantified by radioim-
munoassay with 125I-labeled tracer, as previously described in these
transplant recipients.39
It was not possible to obtain informed consent and collect blood
samples before transplantation in 40of 58 transplant recipients. Given
the rapid declines in iPTH levels after transplantation, a clinical iPTH
was substituted for the baseline value if the research protocol baseline
iPTH was collected after transplantation, and a clinical result was
availablewithin 3months before transplantation. For the 40participants
without a research iPTH level obtained before transplantation, a clinical
iPTH obtained within 3 months before renal transplantation was
available in 34 participants, and of these participants, 24 weremeasured
within 1 month before transplant. In six participants, a pretransplant
clinical iPTH result was not available, and the research protocol iPTH
collected within 2 weeks after transplantation was used.
Bone biomarkers were measured at Quest Diagnostics Laboratory
(San Juan Capistrano, CA); serum BSAP (micorgrams per liter) was
measured using a two-site immunoradiometric assay (coefficient of
variation=8%). Serum b-CTX (picograms per milliliter) was mea-
sured using the Roche Cobas E170 electrochemiluminescent assay
(coefficient of variation=5%). Bone biomarker levels were obtained
at baseline and 3 and 12 months after transplantation in the trans-
plant recipients. Only 17 of 53 baseline biomarker specimens were
obtained before transplantation. Given the variable timing of the
baseline specimen relative to transplantation, the rapid changes in
iPTH levels after transplantation, and the high doses of glucocorti-
coid therapy administered in the immediate post-transplant period,
the results presented here are limited to the 3- and 12-month data.
The bone biomarker assays were performed in a subset of the CHOP
and CCHMC healthy reference participants based on the availability
of serum and their inclusion in other concurrent studies of nutrition
and bone health. BSAP and b-CTX levels were available in 509 and
250 healthy participants, respectively.
Statistical AnalysesStata 11.2 (StataCorp LP, College Station, TX) was used for all
statistical analyses. P value,0.05 was considered statistically signifi-
cant, and two-sided tests of hypotheses were used throughout. Cor-
relations between continuous variables were assessed by Pearson
product moment correlations or Spearman’s rank correlations where
appropriate. Group differences between transplant recipients and
healthy reference subjects were tested using the t test, with adjustment
for unequal variance as needed, or the rank sum test. Changes within
transplant recipients were tested using the paired t test or the Wilcoxon
signed rank test where appropriate. Differences in proportions were
assessed using the chi-squared test.
Age- and sex-specific Z-scores (SD scores) for height and BMI
were calculated using National Center for Health Statistics 2000 Cen-
ter for Disease Control growth data.50 Sex and Tanner-stage specific
Z-scores for the bone biomarker levels36 were calculated using the
reference participant data.
The pQCT outcomes were converted to Z-scores using the LMS
method, as previously described.19,20,22 This method accounts for the
nonlinearity, heteroscedasticity, and skew of bone data in growing
children.51 All of the pQCT Z-scores were sex- and race-specific
(black versus all others) and generated using the LMS Chartmaker
Program version 2.3 in the healthy reference participants from
CHOP.52 The pQCT density outcomes (trabecular and cortical
BMD) were assessed relative to age. The pQCT cortical geometry
outcomes and muscle and fat areas were highly correlated with tibia
length (all P,0.0001); therefore, the Z-scores for these parameters
were generated relative to tibia length. The LMS method does not
allow for simultaneous adjustment for age and tibia length. Therefore,
the Z-scores that were generated relative to tibia length were subse-
quently adjusted for age and tibia length using linear regression analyses
to capture the differences in the joint distributions of age and tibia
length in children with CKD compared with the reference participants.
Changes in pQCT Z-scores within the transplant recipients over
the 12 months after transplantation were assessed with QLS regres-
sion using the xtqls function in Stata.53,54 QLS models allow for a
variable number ofmeasurements per participant and the implemen-
tation of the Markov correlation structure, which is appropriate for
modeling associations among measurements that are unequally
spaced in time. The QLS models include changes within each interval
as the outcome (i.e., baseline to 3 months, 3–6 months, and 6–12
10 Journal of the American Society of Nephrology J Am Soc Nephrol 23: ccc–ccc, 2012
CLINICAL RESEARCH www.jasn.org

months). The following covariates were tested in all of the longitu-
dinal models: Z-score at the start of each interval, study location
(CHOP versus CCHMC), baseline age, sex and race (black versus
nonblack), and mean glucocorticoid exposure (mg/kg per day) over
each interval. The models for changes in trabecular BMD, cortical
BMD, and endosteal circumference Z-scores evaluated associations
with vitamin D levels, changes in iPTH levels over the interval, and
iPTH level at the start of the interval. Models for changes in periosteal
circumference and section modulus Z-scores included changes in
muscle area Z-scores over the interval and the muscle area Z-score
at the start of the interval. Models of changes in muscle area Z-scores
considered vitamin D levels, changes in fat area Z-scores over the
interval, and fat area Z-score at the start of the interval.
To determine if gains in muscle area after transplantation were
associated with the expected gains in section modulus, the 12-month
changes in muscle area and sectionmodulus Z-scores were compared
in the transplant recipients and the subset of reference participants
enrolled in the longitudinal study using multivariable linear regres-
sion analysis.
Models for peak isometric muscle torque were compared in the
renal transplant and reference participants adjusted for age, sex,
race, tibia length, and muscle cross-sectional area, as previously
described.21
ACKNOWLEDGMENTS
We greatly appreciate the dedication and enthusiasm of the children
and their familieswhoparticipated in this study. Special thanks toDrs.
BernardKaplan, Jorge Baluarte, KevinMeyers, andMadhura Pradhan
in the Division of Nephrology and Donna Paulhamus in the Division
of Gastroenterology, Hepatology andNutrition at Children’sHospital
of Philadelphia; thanks to Drs. Mark Mitsnefes and Prasad Devarajan
in the Division of Nephrology and Ashwini Roy-Chaudhury in the
Center for Health Quality at Cincinnati Children’s Hospital Medical
Center. Additional thanks to Daniel Schiferl at Bone Diagnostic, Inc.
for technical assistance with the pQCT scans.
This work was supported by National Institutes of Health Grants
R01-DK060030, R01-HD040714, K24-DK076808, UL1-RR-024134,
and UL1-RR-026314 and the Dutch Kidney Foundation.
DISCLOSURESNone.
REFERENCES
1. Leonard MB, Elmi A, Mostoufi-Moab S, Shults J, Burnham JM, ThayuM, Kibe L,Wetzsteon RJ, Zemel BS: Effects of sex, race, and puberty oncortical bone and the functional muscle bone unit in children, ado-lescents, and young adults. J Clin Endocrinol Metab 95: 1681–1689,2010
2. Ball AM, Gillen DL, Sherrard D, Weiss NS, Emerson SS, Seliger SL,Kestenbaum BR, Stehman-Breen C: Risk of hip fracture among dialysisand renal transplant recipients. JAMA 288: 3014–3018, 2002
3. Derakhshan A, Behbahan AG, Lotfi M, Omrani GH, Fallahzadeh MH,Basiratnia M, Al-Hashemi GH: Bone mineral disorders in pediatric and ad-olescent renal transplant recipients. Pediatr Transplant 15: 367–375, 2011
4. Grenda R, Karczmarewicz E, Rubik J,Matusik H, Płudowski P, KiliszekM,Piskorski J: Bone mineral disease in children after renal transplantationin steroid-free and steroid-treated patients—a prospective study. Pe-diatr Transplant 15: 205–213, 2011
5. Valta H, Mäkitie O, Rönnholm K, Jalanko H: Bone health in children andadolescents after renal transplantation. J Bone Miner Res 24: 1699–1708, 2009
6. Saland JM, Goode ML, Haas DL, Romano TA, Seikaly MG: The preva-lence of osteopenia in pediatric renal allograft recipients varies with themethod of analysis. Am J Transplant 1: 243–250, 2001
7. Sanchez CP, Salusky IB, Kuizon BD, Ramirez JA, Gales B, Ettenger RB,Goodman WG: Bone disease in children and adolescents undergoingsuccessful renal transplantation. Kidney Int 53: 1358–1364, 1998
8. El-Husseini AA, El-Agroudy AE, El-Sayed M, Sobh MA, Ghoneim MA:A prospective randomized study for the treatment of bone loss withvitamin d during kidney transplantation in children and adolescents.Am J Transplant 4: 2052–2057, 2004
9. El-Husseini AA, El-Agroudy AE, El-Sayed MF, Sobh MA, Ghoneim MA:Treatment of osteopenia and osteoporosis in renal transplant childrenand adolescents. Pediatr Transplant 8: 357–361, 2004
10. Acott PD, Crocker JF,Wong JA: Decreased bonemineral density in thepediatric renal transplant population. Pediatr Transplant 7: 358–363,2003
11. Ellis EN, Floyd-Gimon DM, Berry PL, Wells TG, Seibert J, Belsha C: Riskfactors for bone mineral density loss in pediatric renal transplant pa-tients. Pediatr Transplant 4: 146–150, 2000
12. Parfitt AM: A structural approach to renal bone disease. J Bone Miner
Res 13: 1213–1220, 199813. Prentice A, Parsons TJ, Cole TJ: Uncritical use of bone mineral density
in absorptiometry may lead to size-related artifacts in the identificationof bone mineral determinants. Am J Clin Nutr 60: 837–842, 1994
14. Kalkwarf HJ, Denburg MR, Strife CF, Zemel BS, Foerster D, WetzsteonRJ, Leonard MB: Vitamin D status in children and adolescents withchronic kidney disease [published online ahead of print December 28,2011]. Kidney Int doi:10.1038/ki.2011.431
15. Rüth EM, Weber LT, Schoenau E, Wunsch R, Seibel MJ, Feneberg R,Mehls O, Tönshoff B: Analysis of the functional muscle-bone unit ofthe forearm in pediatric renal transplant recipients. Kidney Int 66:1694–1706, 2004
16. Behnke B, Altrogge H, Delling G, Kruse HP, Müller-Wiefel DE: Bonemineral density in pediatric patients after renal transplantation. ClinNephrol 46: 24–29, 1996
17. Reusz GS, Szabó AJ, Péter F, Kenesei E, Sallay P, Latta K, Szabó A,Szabó A, Tulassay T: Bone metabolism and mineral density followingrenal transplantation. Arch Dis Child 83: 146–151, 2000
18. Negri AL, Lombas C, Cuevas C, Schiavelli R, Bogado CE, Zanchetta JR:Evaluation of cortical bone by peripheral quantitative computedtomography in renal transplant recipients. Transplant Proc 37: 1020–1022, 2005
19. Dubner SE, Shults J, Baldassano RN, Zemel BS, ThayuM, Burnham JM,Herskovitz RM, Howard KM, Leonard MB: Longitudinal assessment ofbone density and structure in an incident cohort of children withCrohn’s disease. Gastroenterology 136: 123–130, 2009
20. Wetzsteon RJ, Kalkwarf HJ, Shults J, Zemel BS, Foster BJ, Griffin L,Strife CF, Foerster DL, Jean-Pierre DK, Leonard MB: Volumetric bonemineral density and bone structure in childhood chronic kidney dis-ease. J Bone Miner Res 26: 2235–2244, 2011
21. Wetzsteon RJ, Zemel BS, Shults J, Howard KM, Kibe LW, Leonard MB:Mechanical loads and cortical bone geometry in healthy children andyoung adults. Bone 48: 1103–1108, 2011
22. Wetzsteon RJ, Shults J, Zemel BS, Gupta PU, Burnham JM, HerskovitzRM, Howard KM, Leonard MB: Divergent effects of glucocorticoids on
J Am Soc Nephrol 23: ccc–ccc, 2012 Pediatric Transplant Bone Disease 11
www.jasn.org CLINICAL RESEARCH
cortical and trabecular compartment BMD in childhood nephroticsyndrome. J Bone Miner Res 24: 503–513, 2009
23. K/DOQI Clinical Practice Guidelines for bone metabolism and diseasein children with chronic kidney disease. Am J Kidney Dis 46[Suppl 1]:S1–S103, 2005
24. Schoenau E, Neu CM, Beck B, Manz F, Rauch F: Bone mineral contentper muscle cross-sectional area as an index of the functional muscle-bone unit. J Bone Miner Res 17: 1095–1101, 2002
25. Jamal SA, Gilbert J, Gordon C, Bauer DC: Cortical pQCTmeasures areassociated with fractures in dialysis patients. J BoneMiner Res 21: 543–548, 2006
26. Cooper C, Dennison EM, Leufkens HG, Bishop N, van Staa TP: Epi-demiology of childhood fractures in Britain: A study using the generalpractice research database. J Bone Miner Res 19: 1976–1981, 2004
27. O’Brien CA, Jia D, Plotkin LI, Bellido T, Powers CC, Stewart SA,Manolagas SC, Weinstein RS: Glucocorticoids act directly on osteo-blasts and osteocytes to induce their apoptosis and reduce bone for-mation and strength. Endocrinology 145: 1835–1841, 2004
28. Kiepe D, Rüth EM, Blum WF, Mohan S, Weber LT, Tönshoff B: TheIGF/IGFBP system in relation to macroscopic bone architecture inpediatric renal transplant patients. Pediatr Nephrol 25: 659–667, 2010
29. Mehls O, Ritz E, Krempien B, Willich E, Bommer J, Schärer K: Roent-genological signs in the skeleton of uremic children. An analysis of theanatomical principles underlying the roentgenological changes. Pe-diatr Radiol 1: 183–190, 1973
30. Dalle Carbonare L, Arlot ME, Chavassieux PM, Roux JP, Portero NR,Meunier PJ: Comparison of trabecular bone microarchitecture andremodeling in glucocorticoid-induced and postmenopausal osteopo-rosis. J Bone Miner Res 16: 97–103, 2001
31. Julian BA, LaskowDA,Dubovsky J, Dubovsky EV, Curtis JJ,Quarles LD:Rapid loss of vertebral mineral density after renal transplantation. NEngl J Med 325: 544–550, 1991
32. Canalis E, Mazziotti G, Giustina A, Bilezikian JP: Glucocorticoid-induced osteoporosis: pathophysiology and therapy. Osteoporos Int18: 1319–1328, 2007
33. Kim HJ, Zhao H, Kitaura H, Bhattacharyya S, Brewer JA, Muglia LJ, RossFP, Teitelbaum SL: Glucocorticoids suppress bone formation via theosteoclast. J Clin Invest 116: 2152–2160, 2006
34. Parfitt AM: Metacarpal cortical dimensions in hypoparathyroidism,primary hyperparathyroidism and chronic renal failure. Calcif TissueRes 22[Suppl]: 329–331, 1977
35. Hopper TA, Wehrli FW, Saha PK, Andre JB, Wright AC, Sanchez CP,Leonard MB: Quantitative microcomputed tomography assessment of in-tratrabecular, intertrabecular, andcorticalbonearchitecture ina ratmodelofsevere renal osteodystrophy. J Comput Assist Tomogr 31: 320–328, 2007
36. Tuchman S, Thayu M, Shults J, Zemel BS, Burnham JM, Leonard MB:Interpretation of biomarkers of bone metabolism in children: Impact ofgrowth velocity and body size in healthy children and chronic disease.J Pediatr 153: 484–490, 2008
37. Helenius I, Remes V, SalminenS,ValtaH,MäkitieO,HolmbergC, PalmuP,Tervahartiala P, Sarna S, HeleniusM, Peltonen J, JalankoH: Incidence andpredictorsof fractures in children after solid organ transplantation:A5-yearprospective, population-basedstudy. JBoneMinerRes21:380–387, 2006
38. Foster BJ, Kalkwarf HJ, Shults J, Zemel BS, Wetzsteon RJ, Thayu M,Foerster DL, Leonard MB: Association of chronic kidney disease withmuscle deficits in children. J Am Soc Nephrol 22: 377–386, 2011
39. Tuchman S, Kalkwarf HJ, Zemel BS, Shults J, Wetzsteon RJ, Foerster D,Strife CF, Leonard MB: Vitamin D deficiency and parathyroid hormonelevels following renal transplantation in children. Pediatr Nephrol 25:2509–2516, 2010
40. ThayuM, Denson LA, Shults J, Zemel BS, Burnham JM, Baldassano RN,Howard KM, Ryan A, Leonard MB: Determinants of changes in lineargrowth and body composition in incident pediatric Crohn’s disease.Gastroenterology 139: 430–438, 2010
41. Tanner JM, Whitehouse RH, Marshall WA, Healy MJR, Goldstein H:Assessment of Skeletal Maturity and Prediction of Adult Height (TW2Method), London, Academic Press, 1975
42. MorrisNM,Udry JR: Validationof a self-administered instrument to assessstage of adolescent development. J Youth Adolesc 9: 271–280, 1980
43. Aaron DJ, Kriska AM, Dearwater SR, Cauley JA, Metz KF, LaPorte RE:Reproducibility and validity of an epidemiologic questionnaire to as-sess past year physical activity in adolescents. Am J Epidemiol 142:191–201, 1995
44. Kemper HC, Bakker I, Twisk JW, van Mechelen W: Validation of aphysical activity questionnaire to measure the effect of mechanicalstrain on bone mass. Bone 30: 799–804, 2002
45. Leggin BG, Neuman RM, Iannotti JP, Williams GR, Thompson EC: In-trarater and interrater reliability of three isometric dynamometers inassessing shoulder strength. J Shoulder Elbow Surg 5: 18–24, 1996
46. Liu D, Manske SL, Kontulainen SA, Tang C, Guy P, Oxland TR, McKayHA: Tibial geometry is associatedwith failure load ex vivo: AMRI, pQCTand DXA study. Osteoporos Int 18: 991–997, 2007
47. Binkley TL, Specker BL: pQCT measurement of bone parameters inyoung children: Validation of technique. J Clin Densitom 3: 9–14,2000
48. Schwartz GJ, Muñoz A, Schneider MF, Mak RH, Kaskel F, Warady BA,Furth SL: New equations to estimate GFR in children with CKD. J AmSoc Nephrol 20: 629–637, 2009
49. Portale AA: Blood calcium, phosphorus, and magnesium. In: Primer onthe Metabolic Bone Diseases and Disorders of Mineral Metabolism,edited by FavusMJ, Philadelphia, Lippincott, Williams &Wilkins, 1999,pp 115–118
50. Ogden CL, Kuczmarski RJ, Flegal KM, Mei Z, Guo S, Wei R, Grummer-Strawn LM, Curtin LR, Roche AF, Johnson CL: Centers for DiseaseControl and Prevention 2000 growth charts for the United States: Im-provements to the 1977 National Center for Health Statistics version.Pediatrics 109: 45–60, 2002
51. Cole TJ: The LMS method for constructing normalized growth stan-dards. Eur J Clin Nutr 44: 45–60, 1990
52. Cole TJ: LMS Chartmaker Pro. Tyne and Wear, UK, Harlow PrintingLimited, 2006
53. Shults J, Morrow AL: Use of quasi-least squares to adjust for two levelsof correlation. Biometrics 58: 521–530, 2002
54. Shults J, Ratcliffe SJ, Leonard M: Improved generalized estimatingequation analysis via xtqls for quasi-least squares in Stata. Stata J 7:147–166, 2007
12 Journal of the American Society of Nephrology J Am Soc Nephrol 23: ccc–ccc, 2012
CLINICAL RESEARCH www.jasn.org