bonus and salary ir final submission - lancaster university
TRANSCRIPT
Don't Forget the Gravy! Are Bonuses Just Added on Top of Salaries?
Colin P. Green
Economics Department, Lancaster University, Lancaster UK LA1 4YT
Ph, +44 1524 594667 e-mail. [email protected]
John S. Heywood
Economics Department, Bolton Hall, University of Wisconsin-Milwaukee
Milwaukee, WI 53211 USA
Ph (414) 229-4437/431 e-mail [email protected]
Abstract
The press often depicts bonuses as extra payments to the already well compensated and calls for reform. Yet, these calls typically ignore the efficiency argument that bonuses are potentially risky performance pay that substitute for salary compensation. This paper uses representative UK data to estimate that bonuses appear not to substitute for salary in cross-sectional estimates. Yet, when controlling for time invariant characteristics in panel data, bonuses emerge as partial substitutes. Each pound of bonus comes at a cost of 40 pence in other earnings. The degree of substitution is far larger at the bottom of the earnings distribution and far smaller at the top of the earnings distribution where, indeed, bonuses look more like gravy.
Keywords: Bonus Payments, Performance Pay, Complements
Acknowledgement: The authors thank Antonio Galvao and seminar participants at UWM, the Scottish Economic Society and at the "Beyond Wages" conference at the British Academy for helpful comments. We are also grateful to the comments of the editor, Steven Raphael, and two anonymous referees on a previous version of this paper. Appreciation is also expressed to the UK Data Archive that made the BHPS available.

INTRODUCTION
The payment of bonuses as part of managerial and executive compensation attracts continued
public controversy. The media highlight the size of bonuses paid at financial institutions,
often with the application of pejorative terms such as 'bonus culture' that suggest the payment
of something for nothing.1 Indeed, the depth of public feeling regarding bonuses has led to
pronouncements by both the US president and the UK prime minister on the need to restrain
these "inequitable payments" and proposed legislations to cap bank bonuses in the EU. The
public perception of something for nothing seems at odds with the basic theory that bonuses,
like other forms of performance pay, represent a means to mitigate agency problems in labour
contracts. Payment contingent on worker performance stands in lieu of some portion of an
otherwise riskless (or at least less risky) salary payment and serves to increase firm
profitability, worker utility or both. In fact, the presumption that high performance bonuses
substitute for salaries provides the basis for the resistance by both the UK and US financial
sector to cap or reduce bonus payments. Advocates for the sector explicitly claim that
reducing bonuses will lead to either a necessary compensating increase in salary payments or
a loss of talent within the sector.
The basic notion that performance pay elicits additional effort and is associated with
increased earnings stands as well engrained in the economics of personnel (Brown 1992,
Lazear 2000; Parent 1999; Shearer 2004). Yet, the combination of the disutility from greater
effort and risk has left in doubt the extent to which the higher pay generates higher worker
utility from performance pay (Cornelissen et al. 2011; Green and Heywood 2008). At least
part of the answer of whether or not workers benefit from performance pay revolves around
the critical issue at the heart of the public debate, the extent to which performance pay
substitutes for fixed time rates. As we will detail, previous empirical results often fail to find
any substitution showing that higher performance payments tend to be associated with higher
fixed time rates. If correct, the performance pay in these studies would represent "gravy"
simply poured on top of fixed rates. We provide a unique study focused on bonus payments.
In contributing to this issue, we emphasize that none of the previous studies directly
examining substitutability control for worker fixed effects despite routine evidence that
performance pay causes worker sorting on characteristics such as ability. Using panel data
from the UK, we confirm the importance of accounting for worker fixed effects. We present
pooled cross-sectional evidence suggesting that bonuses are entirely gravy and a complement
1

to other earnings. Yet, when controlling for worker fixed effects, and the associated sorting,
we show that bonuses are partial substitutes for other earnings. In particular, we find that
around 60 pence of every pound of bonuses is translated into increased earnings. Put
differently, each pound of bonus costs 40 pence in lost other earnings. Moreover, when we
explore the distributional aspects of this correlation through quantile regression, the extent of
substitution is far larger at the bottom of the earnings distribution. While we provide some
speculation on this distributional aspect, our primary contribution is a unique focus on bonus
payments, an improvement on previous studies that attempt to measure the degree of
substitution between performance pay and time rates and our ability to find such substitution.
In what follows, the next section provides further motivation for our examination and
reviews previous empirical studies. The third section provides our data and methodology.
Section four presents the critical results and a series of robustness checks as well as our
quantile regression estimates. A fifth section concludes.
MOTIVATION AND THEORETICAL BACKGROUND
Perhaps the most dramatic example of substitution comes from the history of concern over
ratchet effects in which fixed rates are replaced by piece rates which are then lowered when
workers respond with greater productivity (see Carmichael and MacLeod 2000; Freeman and
Kleiner 2005; Gibbons 1987). Yet, even apart of these dynamic concerns, the two basic static
models of performance pay each predict partial substitution. The principal-agent and sorting
models do differ in the extent to which workers' earnings will increase as a result of
performance pay (Cornelissen et al. 2011). The former assumes a reservation utility
constraint and argues total earnings increase only enough to compensate for the increased
cost of effort and for assuming additional risk. While optimal risk sharing may prohibit fixed
earnings from being zero, it is also clear that the addition of a productivity contingent pay on
top of fixed earnings that remain at their no risk, minimal effort reservation level can only
improve worker utility and so violate the utility constraint. In short, no firm should have an
incentive to provide such a contract and so the advent of performance contingent pay
substitutes at least partially for fixed earnings.
The second type of model argues that workers capture individual rents and the firm
faces a zero profit constraint. The key feature of these models is that the reliance on
performance pay causes sorting in which those with greater ability (less disutility from effort)
2

choose the performance pay scheme while the less able sort into the fixed pay scheme. This
sorting on ability would simply not happen if the performance pay sector guaranteed the same
fixed pay and simply added performance pay on top. Thus, while capturing rents may cause
total earnings to go up more in the performance pay sector than in the principal-agent model,
it would still predict partial substitution. The very point of the performance pay is to reduce
the fixed salary component in order to make earnings depend, if imperfectly, on worker
productivity. Certainly, neither of the basic models implies that moving from fixed earnings
to performance pay causes the fixed earnings to increase while the performance pay is simply
added on top. Instead, the two forms of pay should be partial substitutes.
At first glance such a discussion may seem quite removed from the popular discussion
of bonus payments. Yet, to the contrary, it sits implicitly at the heart of the arguments given
by those opposing the restriction of bonus payments. First, as noted in the introduction, they
argue that any reduction in bonus payments will lead to a necessary positive adjustment to the
salary component of pay (as suggested by the principal-agent constraint). Second, they claim
that any reduction in bonus payments (PRP) will lead to a loss of talent in industries currently
paying bonuses (as suggested by the sorting model).
The prediction from both models is critical for empirical work as the, admittedly
modest, previous empirical literature often fails to confirm any substitution at all. It finds that
greater performance pay is, indeed, often associated with larger fixed pay. Among those who
do find partial substitution, Kaufman (1998) uses a survey of US firms implementing gain
sharing to follow earnings before and after the plans are implemented. He estimates that gain
sharing is not "pure gravy" as other compensation falls but not by as much as the gain sharing
payment. Barkume (2004) has more detailed data from the US Employment Cost Index on
specific jobs (but not workers and their characteristics). He finds that incentive pay (largely
piece rates) increases total employer costs for employee compensation but it is associated
with reductions in other forms of compensation suggesting partial substitution. Importantly,
both of these papers focus on types of performance pay typically oriented to line production
workers. On the other hand, a series of examinations of profit sharing payments fail to find
evidence of substitution (Cahuc and Dormont 1997 for France; Hart and Huebler 1991 for
Germany; Wadhwani and Wall 1990 for the UK;). Indeed, the studies of both France and
Germany present evidence that profit shares are positively associated with base wages
suggesting complementarity. Mitchell et al. (1990) examine bonus payments showing that
they are also positively associated not only with total compensation but with base wages
3

suggesting, again, not substitution but complementarity. Thus, previous evidence presents a
surprising number of positive associations between performance pay and base wages when
neither of the basic static models would predict such a result.2
In addition to the failures to confirm substitution cited above, other literatures might
cast doubt on the basic implications of principal-agent and sorting models. The separation
between ownership and control may allow managers substantial latitude in determining both
their own contracts and those of their employees. Bertrand and Mullanaithan (2001) and
Albanesi and Olivetti (2008) present evidence that CEOs `skim’ rents from firms, especially
in favourable conditions where they are less likely to be detected. Indeed, linking these
skimmed rents with "performance" may be crucial in reducing their likelihood of detection as
it is often difficult to accurately determine the influence of the CEO on performance.
Empirical evidence accords with this showing that more severe agency problems are
associated with unusually high performance payments such as options and other incentives
(Bebchuk et al. 2002; Brick et al. 2012). This can be relevant to workers beyond the upper
management if managers with high powered incentives tend to devise higher powered
incentives for their workers (See Heywood et al. 2006). Kruger (1991) confirms that the
earnings of line workers are higher when owners do not manage. Similarly, Groshen and
Kruger (1990) show that when earnings of managers are higher so are those of other
occupations even holding constant, as best as possible, job content and supervision. Thus, it
is not inconceivable that the separation of ownership from control could allow both
management and key workers to capture bonuses added on to large fixed compensation as
part of portraying a performance oriented workplace to owners with imperfect information.3
Alternatively, bonuses may simply not be linked intimately to productivity and
performance. In this view calling something a bonus in a survey or even within a firm’s
compensation scheme does not make it "performance pay" of the sort in the traditional
models. Critically, there may be large elements of subjectivity in the determination of
bonuses (MacLeod 2003). This subjectivity increases the latitude for managers who set
bonuses. As a consequence, managers may follow objective functions other than simple rent
skimming. Friebel and Raith (2004) describe a hierarchy in which supervisors at each level
reward unproductive subordinates as a way of protecting themselves.4 Heywood (1991)
presents a model in which managers "overpay" workers to reduce managerial effort
associated with monitoring and job turnover. In addition, performance pay has been
4

associated with greater racial earnings gaps (Heywood and Parent 2012). To the extent that
bonuses reflect industrial politics, effort avoidance or attempts to discriminate they need not
be linked to productivity and there becomes far less reason to think they necessarily substitute
for fixed salary.
Indeed, theorists have explicitly questioned the traditional models. Zaharieva (2010)
constructs a model that relies on heterogeneous jobs, incomplete information and equilibrium
job search to introduce frictions that can explain the "stylized fact" of complementarity. Yet,
before abandoning the more straightforward principal-agent and sorting models, we think the
estimation should be revisited.
The presence of bonuses associated with profit sharing complicates the bonus
measure used in our empirical estimates (although as reported in Table 1 of Green and
Heywood (2011) they likely represent a small share of the total number of bonuses). Yet,
even with profit sharing one might anticipate partial substitution. The Weitzman (1984) view
that profit sharing lowers the marginal cost of labor requires that bonuses cannot simply be
added on top of regular wages. If they were, the marginal cost of labor under profit sharing
would not decrease below that of fixed wages during negative demand shocks and the
employment effects associated with profit sharing would not be observed (Azfar and
Danninger 2001; Green and Heywood 2011). On the other hand, Hart and Huebler (1991)
emphasize that profit sharing may be a rent sharing tool oriented toward those with large
specific human capital investments or even represent an efficiency wage. In these cases,
complementarity might be more likely.
Crucially, findings that bonuses are complements could spuriously result from more
productive workers sorting into performance pay jobs (including profit sharing jobs) and the
inability to control for this in typical cross-section results. Indeed, none of the previous
empirical examinations described above has exploited comprehensive individual panel data to
construct tests of substitution. They use either firm level data or individual level data in
relatively small cross-sections. This is critical as worker sorting on the basis of innate
productivity is a well-known feature of the adoption of performance pay schemes (Lazear
2000). Failure to control for this is likely to lead to upwardly biased estimates of the
relationship between salary and bonus payments as higher innate productivity is likely to
positively influence both salary and bonus amounts. Panel data, and the ability to difference
out innate productivity, is clearly advantageous in this setting.
5

Previous research demonstrates that bonus payments are highly concentrated in the
upper levels of the income distribution (Bell and Van Reenen 2010, 2013). While the size of
bonuses for financial service workers garners substantial press attention, Lemieux et al.
(2009) demonstrate that the growing incidence of performance pay in the US is associated
with a large share of the growth in earnings inequality over the 1980s and 1990s and virtually
all of the growth of earnings inequality in the upper quintile of the distribution. Our UK
examination is timely in light of OECD research that earnings inequality is growing more
quickly in the UK than in any other developed country (OECD 2011), and the evidence that
this growth is uniquely tied to the financial services industry with its use of performance
bonuses (Stewart 2011). Part of evaluating this trend, and perhaps an even more pointed
equity examination, is determining the extent to which performance pay and other
compensation substitute across the earnings distribution. The examination is not one of the
extent to which bonuses are associated with inequality but rather of the extent to which
bonuses appear to be part of a reward structure in which pay is at risk because fixed salaries
are lower.
DATA AND EMPIRICAL APPROACH
The data we use are drawn from the British Household Panel Survey (BHPS). The BHPS is a
nationally representative longitudinal sample that annually interviews approximately 10,000
individuals from roughly 5,500 households. We use the 1997 to 2008 period as prior to 1997
information on bonus amounts was simply not collected. We also limit our sample to male
heads of households who were private sector employees.
The BHPS contains a range of information on earnings. We follow Bell and Van
Reenen (2010) focusing on the measure of annual labour income, which along with all other
earnings we deflate to 2005 pounds. This derived variable generated by the BHPS staff is
constructed from weekly and monthly wages accounting for job changes and other potential
variation in earnings.5 In addition to this derived annual earnings measure, respondents are
asked to report whether “in the last 12 months have you received any bonuses such as a
Christmas or quarterly bonus, profit-related pay or profit sharing bonus, or an occasional
commission? [this excludes overtime payments]”. If they answer yes, they are then asked for
the amount of the bonus payment. Bell and Van Reenen (2010) demonstrate that these two
figures, annual labour income and the additional bonus payment, are generally comparable to
6

those reported in the UK ASHE data that are based on verified payment details.6
Additionally, workers are asked “Does your pay include performance-related pay?”, There
are no pound amounts associated with question and we presume that it includes piece rates,
commissions and performance increments among other things. As workers with bonuses may
also receive such performance pay, or may even identify their bonus as performance pay, we
control for such receipt.
INSERT TABLE 1
While we observe bonus amounts we do not observe when workers are subject to a
bonus scheme but fail to meet the requirements for receiving a bonus in a given year. To
examine this, we follow the method outlined in Lemieux et al. (2009) to identify "bonus
jobs." In this method job matches which at any point paid a bonus are classified as bonus
scheme jobs for all periods. Again, we demonstrate the robustness of the key results to this
variation in the empirical section.
INSERT FIGURE 1
Table 1 presents key descriptive statistics divided by bonus receipt. Note that those
receiving bonuses are more likely to receive other types of performance pay and that their
annual labor income is substantially larger. This difference in means is not, by itself,
surprising as those receiving bonus payments might be expected to be those with higher
earnings capacity. The size of the average bonus among recipients is £3,180. All of these
figures have been averaged across years but deflated by the consumer price index to a base
year of 2005. Figure 1 shows that the real value of bonuses among recipients has increased
substantially over the decade we examine. It reaches a high of £5,400 in 2007, but declines
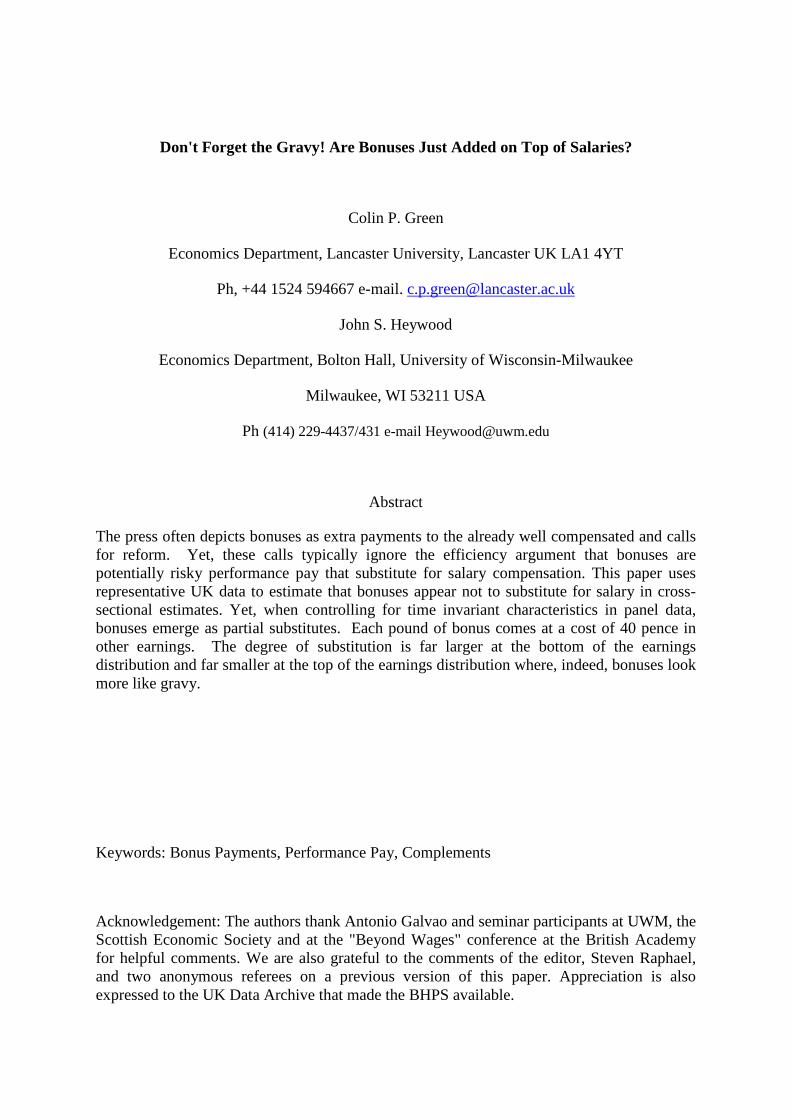
substantially the next year coinciding with the financial crisis. Figure 2 confirms that each
year the annual labour income is larger for those that receive bonuses than for those who do
not. As our empirical strategy relies heavily on worker fixed effects Table A1 presents
information on the amount of within worker variation in income and bonus payment amounts,
along with information on movements into and out of bonus receipt and the number of
individuals who never receive bonuses and hence do not contribute to our main estimates.
These reveal a substantial amount of within variation in both income and annual bonuses,
moreover there are many observations of moving in and out of receipt (although note our
fixed effects models are also identified by the changes in bonus amount), and 41% of
individuals in our sample never receive a bonus.
7
INSERT FIGURE 2
Bonus amount as a share of derived annual earnings shows the anticipated variation
across the earnings distribution. As Figure 3a shows, the bonus share generally increases with
earnings. It shoots up dramatically in the top five percent of the distribution. Figure 3b
concentrates on the upper decile showing that the share reaches its maximum in the single
highest percentile in the distribution. In both cases we show this information for those in
bonus receipt only. Approximately twenty percent of all earnings in the top five percent are
in the form of bonuses and this share increases to more than twenty five percent at the top
percentage point. This pattern suggests the importance of distributional considerations when
estimating the extent of substitution and will motivate one vein of our empirical testing.
INSERT FIGURE 3A, 3B
We present a series of estimates that seek to examine the extent of substitution, with
an emphasis on trying to eliminate any bias due to sorting of workers by ability. As a
preliminary step our initial test merely examines if those receiving bonuses have higher
annual earnings. We estimate the following equation:
𝑤𝑤𝑖𝑖𝑖𝑖 = 𝛽𝛽0 + 𝛽𝛽1𝐵𝐵𝐵𝐵𝐵𝐵𝐵𝐵𝐵𝐵𝑖𝑖𝑖𝑖 + 𝛽𝛽2𝑃𝑃𝑃𝑃𝑃𝑃𝑖𝑖𝑖𝑖 + 𝛾𝛾𝑋𝑋𝑖𝑖𝑖𝑖 + 𝜀𝜀𝑖𝑖𝑖𝑖 (1)
Where w is annual labour income earned by individual i in year t, Bonus indicates that they
received a bonus (of any size) in that year, PRP indicates other performance related pay
receipt and X is a vector of controls including age, union membership, temporary contract,
firm size along with year, region, hours of work, industry and occupational dummies.
We extend this estimate using the information on the amount of bonus receipt
available in the BHPS. We estimate:
𝑤𝑤𝑖𝑖𝑖𝑖 = 𝛼𝛼0 + 𝛼𝛼1𝐵𝐵𝐵𝐵𝐵𝐵𝐵𝐵𝐵𝐵𝐵𝐵𝐵𝐵𝐵𝐵𝐵𝐵𝐵𝐵𝐵𝐵𝑖𝑖𝑖𝑖 + 𝛼𝛼2𝑃𝑃𝑃𝑃𝑃𝑃𝑖𝑖𝑖𝑖 + 𝛾𝛾𝑋𝑋𝑖𝑖𝑖𝑖 + 𝜖𝜖𝑖𝑖𝑖𝑖 (2)
where BonusAmount is the pound value of the annual bonuses. Complete substitution implies
that an additional pound of bonus will be reflected in no increase in annual earnings (𝛼𝛼1 =
0). Partial substitution implies that an additional pound of bonus will cause less than a pound
increase in annual earnings (0 < 𝛼𝛼1 < 1). A pure gravy result would indicate total annual
earnings increasing by at least the amount of the bonus (𝛼𝛼1 ≥ 1). Thus, to aid in interpreting
the pound to pound relationship between bonus amounts and annual labour income, we
estimate this and subsequent variations in linear specifications. We do provide variations that
8
include a variable measuring the squared amount of bonus, to examine for non-linearity in the
relationship between bonuses and annual labour income.
A number of empirical challenges exist in properly identifying 𝛼𝛼1. A fundamental
difficulty not dealt with in previous empirical work is that unobserved worker productivity
(ability) influences both bonus payment and wages. Thus, unmeasured ability might bias the
coefficients toward complementarity as ability would be anticipated to simultaneously
influence multiple dimensions of compensation. More specifically, it is well established that
the presence of performance pay schemes leads to ability sorting across jobs in which the
more able sort into such schemes (Curme and Stefanec 2007; Lazear 2000). Our main
approach will control for worker specific fixed effects which remove first order bias in the
estimates of 𝛼𝛼1 and 𝛽𝛽1 due to time invariant worker characteristics. While attractive, this
approach restricts the identification of our key parameters to those who we observe both with
and without receipt or those for whom we observe some variation in the bonus payment
amount. In the results section we spend considerable time examining the stability of the FE
estimates and the sources of identification.
The concentration of bonus payments at the top of the earnings distribution leads to
concerns regarding the role of bonus receipt in generating inequality (Bell and Van Reenen,
2010). Yet, this concern may be more or less pronounced depending on how the relationship
between bonus payments and salary varies across the wage distribution. Thus, if one found
that the high bonuses come at the cost of reduced salaries, the concern in the popular press
that these bonuses are unjustified (represent rents) may be over-stated. We seek to examine
this by estimating quantile regression analogues of (2) above, where for each quantile τ:
𝑄𝑄𝜏𝜏(𝑤𝑤𝑖𝑖𝑖𝑖) = 𝛼𝛼𝜏𝜏0 + 𝛼𝛼𝜏𝜏1𝐵𝐵𝐵𝐵𝐵𝐵𝐵𝐵𝐵𝐵𝐵𝐵𝐵𝐵𝐵𝐵𝐵𝐵𝐵𝐵𝐵𝐵𝑖𝑖𝑖𝑖 + 𝛼𝛼𝜏𝜏2𝑃𝑃𝑃𝑃𝑃𝑃𝑖𝑖𝑖𝑖 + 𝛾𝛾𝜏𝜏𝑋𝑋𝑖𝑖𝑖𝑖 + 𝜀𝜀𝜏𝜏𝑖𝑖𝑖𝑖 (3)
Again, the key parameters of interest will suffer from ability bias in simple cross-
sectional estimates. A larger, more positive, relationship between bonus payment and salaries
at higher salaries may just reflect the sorting of talent towards highly paid jobs. Fixed effect
estimation again seems the most natural approach to addressing this. However, this is
complicated in the quantile regression setting. One analogue to the fixed effects approach in
linear regression is to include a worker specific shift for each individual for every τth
quantile. This might be termed a conditional (on the quantile) fixed effects quantile
9
regression model. However, as discussed by Koenker (2004) including this type of this τ-
dependent distributional worker effect is difficult in practice in a setting such as ours where
there a large number of cross-sectional units but the number of time observations per unit is
not so large. Instead he suggests the inclusion of a single individual specific effect across the
τ quantiles.
To do this requires the joint estimation of all τ quantile regressions simultaneously.
This is termed an unconditional fixed effects quantile regression and takes the form:
𝑄𝑄𝜏𝜏(𝑤𝑤𝑖𝑖𝑖𝑖) = 𝛼𝛼𝑖𝑖 + 𝛼𝛼𝜏𝜏0 + 𝛼𝛼𝜏𝜏1𝐵𝐵𝐵𝐵𝐵𝐵𝐵𝐵𝐵𝐵𝑖𝑖𝑖𝑖 + 𝛼𝛼𝜏𝜏2𝑃𝑃𝑃𝑃𝑃𝑃𝑖𝑖𝑖𝑖 + 𝛾𝛾𝜏𝜏𝑋𝑋𝑖𝑖𝑖𝑖 + 𝜀𝜀𝜏𝜏𝑖𝑖𝑖𝑖 (4)
A key aspect of this approach is that the individual fixed effects shift the conditional
quantiles, but do not vary by quantile (Koenker, 2004). We estimate this using the rqpd
package in the statistical program R. We pursue this estimation as part of examining the
distribution aspects of bonus receipt while accounting for individual fixed effects.
We note that a log-log elasticity specification would be difficult to interpret in our
quantile regression framework. The majority of bonus amounts are zero leading to infinite
percentage increases when a bonus is received. Moreover, the share of income provided by
bonuses increases dramatically across the distribution resulting in a distribution of elasticities
even when 𝛼𝛼𝜏𝜏0 does not vary across the quantiles. Nonetheless, as a check of non-linearity,
we will again include the square of the bonus amount as a robustness check.
RESULTS
Table 2 presents estimates of the association between bonus receipt and annual earnings. The
OLS estimates reveal that workers who receive a bonus earn £2,585 higher in annual labour
earnings. The corresponding figure for PRP jobs is approximately £1,868. As emphasized,
the large difference associated with a bonus may reflect unobserved worker characteristics.
More able workers are likely to sort into jobs paying bonuses and earn higher compensation
of all types. The next column reports fixed effects estimates that seek to control for these
characteristics. As expected the bonus premium falls markedly, to £952 but remains
statistically different from zero. The PRP figure falls to £471 and is now significant at the
five percent level instead of the one percent level.
10

INSERT TABLE 2
Ultimately we want to include the pound value of bonuses to examine the extent of
substitution but we recognize that it is both common and closer to theoretical derivations to
present log earnings equations. We show these in columns 3 and 4 to confirm the same
general pattern. The OLS estimation suggests that those receiving bonuses earn 12 percent
more than those on times rates while the return to PRP is 6.3 percent. The fixed effect
estimates again shrink markedly with those receiving bonuses earning 5 percent more but the
return to PRP now insignificantly different from zero. These estimates for the return to
receiving a bonus are reasonably close to those estimated in the US. Lemieux et al. (2012)
present returns of 8.5 percent in an OLS estimate using the Panel Study of Income Dynamics
and 4.1 percent in the associated fixed effect estimate.
As discussed, our bonus receipt indicator fails to capture years where workers are
eligible for a bonus but did not meet the requirements for bonus receipt within that year.
While we do not have any way of directly observing this from the data, we follow Lemieux et
al (2009) in creating a broader measure. From the BHPS we know job changes and we
classify a worker as in a bonus job if they ever received a bonus in their current job. Thus, if
the original measure fails to capture years on a bonus scheme where there was no payout, this
runs the opposite risk of counting years as on a bonus scheme when the scheme was
removed. Column five of Table 2 reports fixed effects estimates using this alternative
measure of bonus receipt. This reveals a modestly smaller estimate as anticipated but also
shows that non-receipt in a given year while eligible does not appear to be generating our
estimates.
INSERT TABLE 3
In Table 3 we present the estimated relationship between bonus amounts and usual
earnings. These estimates show the pound to pound conditional relationship between bonus
amount and annual earnings. Column 1 presents the OLS estimates demonstrating that for
every additional dollar of bonus, the annual earnings are approximately 1.24 pounds larger.
Taken at face value, this implies that bonuses and time rate earnings are complements. The
estimate holds constant earnings from PRP and implies that annual earnings go up by more
than the bonus amount. Specifically time rates go up by approximately 25 percent of the
11

bonus amount as well. This would be gravy indeed and might be considered broadly similar
to findings in previous studies.
Yet, this fails to account for unmeasured ability that likely causes both bonuses and
time rates to be larger as the more able sort into bonus jobs. Column 2 presents the equivalent
estimate controlling for worker fixed effects. As expected, this causes the estimated
coefficient on the bonus amount to fall markedly. However, it remains positive, statistically
significant and of an economically important magnitude. Each pound of bonus is associated
with earnings that are 0.6 pounds higher. This suggests clear partial substitution rather than
the complementarity suggested by the OLS estimate. Thus, substantially less than the full
value of bonuses is observed in total earnings. Each pound of bonus is associated with a 40
pence reduction in time rate earnings. This differs from the flavour of the earlier empirical
research that failed to control for worker fixed effects and it suggests that bonuses are not
simply gravy added on top.
As a test of nonlinearity in the bonus amount, we include a squared term as shown in
the second and third columns of Table 3. These estimates suggest that a non-linearity exists.
The rate at which larger bonus amounts are translated into total income is smaller than that
for smaller bonus amounts. This result is statistically significant but not in the fixed effect
estimate. Nonetheless, the clear pattern in the OLS continues to suggest pure gravy while that
with the fixed effects continues to suggest partial substitution.7 We recognize that the
variation the variation in Table 3 comes from both sorting into jobs that provide bonuses (the
bonus going from zero to positive) and changes in the bonus amount (among positive
amounts). This leads to a series of robustness checks.
Robustness Checks
We undertake a series of robustness checks that assess the source of the identification, the
stability of our estimate over a number of subsamples and the influence of functional form
and model specification.
First we examine who identifies our fixed effects model and the stability of our key
estimate across sources of identification. Specifically, the critical pound value of bonuses can
vary and identify the fixed effect estimate in three ways. First, workers can move into
bonuses (receiving a bonus in the current period when they did not in the previous period).
12

Second, they can move out of bonuses (not receive a bonus in the current period having
received a bonus in the previous period). Third, they can remain in bonuses in adjacent
periods but experience a change in the amount of receipt (and in income). We separately
examine each source of variation and stress that our results tend to be broadly similar for each
source of variation. The overall observations associated with each source of variation allow
reasonable inference: 4,055 observations moving in, 4,024 moving out and 7,200 changing
within. The remaining observations are for those 2,261 workers who never receive a bonus
and hence do not contribute to the fixed effects estimate of the bonus amount coefficient.
Table 4 shows our fixed effects estimate for those moving in is a 0.39 pound increase in
annual earnings for each pound increase in bonus amount. The size is smaller but still
positive for those moving out with a 0.27 increase in earnings for each pound increase in
bonus amount. Finally, the within estimate is virtually identical to the original estimate at a
0.58 increase in earnings for each pound increase in bonus amount. Each estimate is
significantly different from zero. Thus, our general result of a general positive association
between bonus and non-bonus earnings that indicates partial substitution is not driven by
asymmetries that make only one source of identification meaningful. For instance, there may
have simply been increasing bonus receipts in general across our sample period in which non-
bonus earnings may also be increasing. This decomposition suggests that such an underlying
pattern does not drive the empirical results.
INSERT TABLE 4
Like all panels, the BHPS suffers attrition, and our focus on workers who may leave
employment even if still in the sample makes it more acute. We worried that attrition might
be associated with earnings in a way that might lead to a biased estimate of the relationship
between bonus and non-bonus earnings. We re-estimated our model on only those workers
who we observe at least 10 times and the point estimate was of the same general magnitude
(0.552 [s.e. =0.048]). A related concern is that one-off bonuses may reflect some
idiosyncratic payment rather than the income routinely being at risk. We re-estimated our
models including only those workers who received bonus payments at least twice. These
estimates were essentially the same as our main estimates (0.584 [s.e.=0.018]). In further
unreported estimates we continued to increase the number of minimum bonus payments (at
least 3 payments, 4 payments etc), and again the estimates did not vary markedly. In sum,
13

these estimates suggest that the positive correlation is not driven by any particular pattern of
the frequency of bonus receipt.
The bonus to salary relationship may not be stationary across the years for which we
have data. To investigate this, we split the sample in half and report the both sets of estimates.
There is only modest variation across period: from 0.41 for 1997-2002 and 0.38 for 2003
onwards but both are highly significant. In unreported results we estimate our fixed effects
model across a range of different sub-samples of years of the survey; in all cases the
coefficient on bonuses remained positive, statistically significant and indicative of
substitution. Related to potential changes over time, we also explored using deflated wages
only without year dummies, or year dummies using nominal wage values. Neither
modification materially changes our results.
We estimated the specification in a series of further sub-samples in an effort to avoid
a spurious relationship between bonuses and non-bonus earnings. First, PRP receipt may be
problematic as it is incorporated into the derived annual labour income, our dependent
variable. We re-estimate our model for workers who do not receive PRP generating a fixed
effects estimate of bonus amount of 0.638 [s.e.=0.023]. Second, bonus receipt and salaries for
workers with longer tenure may reflect a variety of factors including deferred compensation.
Hence, any trade-off between salaries and bonuses may be more acute early in a job when the
compensation scheme reflects a salary – bonus trade-off that is potentially driven more by the
external market than by internal labour market negotiations. We re-estimate our OLS model
for those workers with less than 2 years of tenure8. These reveal a point estimate of 1.201
[s.e. =0.150] suggesting that our positive bonus coefficient is not being driven by internal
labour market institutions such as deferred compensation.
We also recognize that while typical of many in the literature our specification
contains a fairly parsimonious set of industry and occupation controls. This could hide
occupation and industry variation at a more disaggregated level. We examine this by
saturating the model with 77 occupational controls (SOC 2 digit) and 84 industry controls
(SIC 2 digit). The resultant fixed effect estimate is essentially unchanged by this degree of
detail (0.561 [0.021]). We next re-estimate our model separately for white and blue collar
workers. These return surprisingly similar estimates. To focus on the broad group subject to
the greatest press scrutiny, we limit the sample to those in the managerial and professional
14
occupation groups. This returns only a modestly smaller fixed effect estimate than found for
the entire sample (0.544 [.030]).
Perhaps the confounding issue is not the occupation but an effort level of the workers
which is unobserved and varies with bonus amounts. While difficult to examine, we
undertook several checks with the hours of work measure. We limited ourselves to those
who reported working full time. We also added to the control for usual hours a control for
usual overtime hours. Neither check produced meaningful differences from the original
estimates.
Finally, we were concerned that smaller profit sharing payments or routine Christmas
bonuses may be included in our measure. These may be routinely given for reasons other
than individual performance and may be causing our estimates to understate the level of
substitutability. We re-estimate our results excluding observations where the worker received
a bonus but it was less than £1,000. The fixed effect estimate is 0.579 [s.e. = 0.023].
In summary, despite a variety of robustness tests and specifications, each of our
estimates show a positive relationship between bonus levels and earnings but one that
suggests substitution between bonuses and time rates. It may be the case that more finely
drawn data within a single occupation or with more homogenous workers would reveal
different results but we cannot find them with our data. As an attempt to further investigate
this, we now consider how this relationship varies across the wage distribution.
Distribution of Bonus Payments
The bonuses observed at the top of the earnings distribution may be fundamentally different
in type from those at the bottom of the distribution. Much of the recent concern with bonuses
for bankers has been that they may be able to manipulate a system in which others have
imperfect information and, as a consequence, the size of bonuses may have little relationship
to true productivity. At the extreme the "performance" measure may have been simply short-
term sales of a "toxic" product. While not passing judgement on this claim, currently the
focus of a federal inquiry in the United States, it remains possible that there is more
transparency and less ability to manipulate performance measures at the bottom of the
earnings distribution than at the top. This could suggest that substitution may be more
obvious at the bottom of the distribution. Moreover, as performance pay has been intimately
15

tied to growing inequality (Lemieux et al. 2009), there is good reason to explore
distributional aspects of substitution.
INSERT TABLE 5
We first pool the data and run simple quantile regressions. As shown in Table 5,
these indicate large coefficients across the distribution but a clear pattern that the positive
values increase moving up the distribution. At the bottom of the distribution (0.10) the
estimates suggest a pound of bonus is associated with .84 pence of labour earnings. At the
top of the distribution, the estimates suggest and enormous 1.9 pounds of earnings associated
with every pound of bonus income.9 Taken literally this would suggest very strong
complements. At the risk of stretching the metaphor, the gravy appears thicker at the top. In
unreported estimates, we further extended the estimates out to the 95th and 99th percentile.
This follows a similar increasing pattern, 2.418 [0.008] for the 95th percentile and 2.785
[0.019] for the 99th percentile.10
Yet, like the earlier estimates, these quantile estimates surely suffer from
unmeasured ability influencing the earnings measures. Thus, we implement Koenker's
(2004) unconditional fixed effect estimator using the public domain package R and Koenker's
program. The results are shown in the bottom of Table 5 and while much smaller in absolute
magnitude, they show the same or even greater percentage growth across the distribution. In
the lowest quantile at 0.10, the coefficient is only .39. There is substantial substitution with
workers giving up 61 pence for every pound earned in bonuses. The estimated coefficient
steadily increases so that at the top quantile, 0.90, it is a 0.97 and not statistically different
from 1. This says in essence that there is no cost in lost time rates for increased bonus
payments at the top of the distribution. Again we explore estimates at the extremes of the
distribution. First, we estimate a model with bonus coefficient evaluated at the 5th and 95th
percentile. The estimates for these two points are 0.048 [s.e.= 0.061] and 0.934[s.e.= 0.114],
respectively; with the 5th percentile estimate not statistically different from zero. Second, we
estimate the 1st and 99th percentile in addition to those points listed in Table 5. This reveals -
0.211 [s.e. = 0.118] at the 1st percentile and 1.231 [s.e. = 0.173] at the 99th percentile. These
estimates suggest that, once holding unmeasured time invariant ability constant, there is
evidence of gravy at the upper most part of the wage distribution but substantial evidence of
substitution at the lowest point.
16
The critical point from this distributional exercise has been that we typically find
evidence of substitution throughout most of the earnings distribution but only after
controlling for sorting. The basic implication of the agency model seems supported at all but
perhaps the very top of the earnings distribution where the evidence of substitution fades.
CONCLUSION
The frequent inability of past research to find substitution between performance pay and time
rates stood as the starting point for this paper. This is a critical point from a policy
perspective as the efficiency of bonus payments rely on a degree of substitution with fixed
pay. Indeed, we initially confirmed this finding in simple earnings equations that show higher
bonus amounts go together with higher time rate amounts. Yet, such estimates fail to control
for the ability sorting that is inherent especially in sorting type models. This led to fixed
effect estimates that showed the importance of such sorting and that demonstrated evidence
of partial substitution only when accounting for this sorting. This was followed by a series of
robustness checks designed to improve the focus of the estimates. We focused only on large
bonuses, bonuses that were regular and also focused on the distributional aspects of the
estimates. These efforts served to reinforce the early estimates. We found no evidence of
complementarity in the fixed effect estimates. Nonetheless, we found strong distributional
aspects suggesting that the extent of substitution is very large at the bottom of the earnings
distribution and vanishingly small at the top of the earnings distribution. The BHPS data on
bonuses payments is imperfect and we readily admit that such a general representative survey
of workers may not provide the detail and sample size needed to uncover the implications of
a firm deciding to pay such bonuses. Nonetheless, it is striking that our evidence shows
partial substitution between base pay and bonuses only when accounting for worker fixed
effects and perhaps even more striking that this disappears at the top where bonuses appear to
be largely gravy.
There exists room for further testing. First, data sources from other countries that
itemize the size of bonuses may be worth investigating. Second, it could also be worth
examining other forms of performance pay beyond bonuses and controlling for worker fixed
effects. The trade-off between piece rate earnings (or commissions) and fixed wage
payments stand as obvious examples but the BHPS does not itemize these earnings. While
these other forms of performance pay could inform theoretical models, the current public
17

scrutiny is aimed at bonuses. It remains the case that our best efforts to examine bonuses and
other earnings have found that they appear to be partial substitutes but only when looking at
within worker estimates generated by the fixed effect estimate.
18
REFERENCES
Albanesi, Stefania and Claudia Olivetti. 2008. ‘Gender and Dynamic Agency: Theory and
Evidence on the Compensation of Top Executives,’ Working Paper, Department of
Economics, Columbia University.
Azfar, Omar and Stephan Danninger. 2001. ‘Profit Sharing, Employment stability and Wage
Growth,’ Industrial and Labor Relations Review, 54: 619-630.
Barkume, Anthony J. 2004. ‘Using Incentive Pay and Providing Pay Supplements in U.S. Job
Markets,’ Industrial Relations 43: 618 – 33.
Bebchuk, Lucian, Jesse Fried and David Walker. 2002. ‘Managerial Power and Rent
Extraction in the Design of Executive Compensation,’ University of Chicago Law
Review 69: 751-846.
Bell, Brian and John van Reenen. 2010. ‘Bankers' Pay and Extreme Wage Inequality in the
UK,’ Working Paper, Centre for Economic Performance, London School of
Economics.
Bell, Brian and John van Reenen. 2013. ‘Extreme Wage Inequality: Pay at the Very Top,’
American Economic Review 103: 153-157.
Bertrand, Marianne and Sendil Mullainathan, 2001. ‘Are CEOs Rewarded for Luck? The
Ones without Principals are,’ Quarterly Journal of Economics 116: 901-932.
Brick, Ivan, Oded Palmon and John Wald. 2012. ‘Too Much Pay-Performance Sensitivity?’
Review of Economics and Statistics 94: 276-304.
Brown, Charles. 1992. ‘Wage Levels and Method of Pay,’ Rand Journal of Economics 23:
366-375.
Cahuc P. and B. Dormont. 1997. ‘Profit-sharing: Does it Increase Productivity and
Employment?’ Labour Economics 4: 293-319.
Carmichael, H. Lorne and W. Bentley MacLeod. 2000. ‘Worker cooperation and the Ratchet
Effect,’ Journal of Labor Economics 18: 1-19.
Cornelissen, Thomas, John S. Heywood and Uwe Jirjahn. 2011. ‘Performance Pay, Risk
Attitudes and Job Satisfaction,’ Labour Economics 18: 229-239.
Curme, Michael and Noah Stefanec, N. 2007. ‘Worker Quality and Labor Market Sorting,’
Economics Letters 96: 202-208.
Dash, Eric. 2010. ‘Few Fled Companies Constrained by Pay Limits,’ New York Times,
March 23: http://www.nytimes.com/2010/03/23/business/23pay.html?ref=bonuses.
19
Friebel, Guido and Michael Raith. 2004. ‘Abuse of Authority and Hierarchical
Communication,’ Rand Journal of Economics 35: 224-244.
Gibons, Robert. 1987. ‘Piece-Rate Incentive Schemes,’ Journal of Labour Economics 5: 413-
429.
Green, Colin. P and John S. Heywood. 2008. ‘Does Performance Pay increase Job
Satisfaction?’ Economica 75: 710-728.
Green, Colin. P and John S. Heywood. 2011. ‘Profit Sharing, Separation and Training’
British Journal of Industrial Relations, 49: 623-642.
Hart, Robert A. and Olaf Huebler. 1991. ‘Are Profit Shares and Wages Substitute or
Complementary Forms of Compensation?’ Kyklos 44: 221-231.
Heywood, John S. and Daniel Parent. 2012. ‘Performance Pay and the Black-White Wage
Gap,’ Journal of Labor Economics 2012: 249-290.
Jenkins, Stephen, 2010. ‘The British Household Panel Survey and its Income Data’, IZA
Discussion Paper No. 5242.
Kaufman, Roger T. 1998. ‘The Effects of Gain Sharing on the Basic Wage: The Case of
IMPROSHARE,’ Labour 12: 595-610.
Koenker, Roger. 2004. ‘Quantile Regression for Longitudinal Data,’ Journal of Multivariate
Analysis 91: 74-89.
Lazear, Edward P. 2000. ‘Performance Pay and Productivity,’ American Economic Review
90: 1346-1361
Laffont, Jean-Jacques. 1990. ‘Analysis of Hidden Gaming in a Three-Level Hierarchy,’
Journal of Law, Economics, and Organization 6: 301–324.
Lemieux, Thomas, Bentley Macleod and Daniel Parent. 2009. ‘Performance Pay and Wage
Inequality’ Quarterly Journal of Economics 124: 1-49.
Lemieux, Thomas, Bentley Macleod and Daniel Parent. 2012. ‘Contract Form, Wage
Flexibility and Employment,’ American Economic Review, 102: 526-531
MacLeod, W. Bentley. 2003. ‘Optimal Contracting with Subjective Evaluation,’ American
Economic Review 93: 216-240.
Mitchell, Daniel J.B., David Lewin and Edward E. Lawler. 1990. ‘Alternative Pay Systems,
Firm Performance and Productivity,’ in ed. Alan S. Blinder, Paying for Productivity:
A Look at the Evidence, Washington DC: The Brookings Institution Press.
Parent, Daniel. 1999. ‘Methods of Pay and Earnings: A Longitudinal Analysis,’ Industrial
and Labor Relations Review 53: 71-86.
20

Prendergast, Canice and Robert Topel. 1993. ‘Discretion and Bias in Performance
Evaluation,’ European Economic Review 37: 355–365.
OECD. 2011. ‘Divided We Stand: Why inequality Keeps Rising’, Paris: OECD Publishing.
Shearer, Bruce. 2004. ‘Piece rates, fixed wages and incentives: Evidence from a field
experiment’. The Review of Economic Studies, 71:513-534.
Stewart, Mark. 2011. ‘The Changing Picture of Earnings Inequality in Britain and the Role of
Regional and Sectoral Differences,’ National Institute Economic Review, 218: R20-R32.
Wadhwani S. And M. Wall. 1990. ‘The Effects of Profit Sharing on Employment, Wages
Stock Returns and Productivity,’ The Economic Journal 100: 1 -17.
Weitzman, M. (1984). The Share Economy. Cambridge, MA: Harvard University Press.
Zaharieva, Anna. 2010. ‘Risk Sharing and Employee Motivation in Competitive Search
Equilibrium,’ Working Paper, Department of Economics, University of Konstanz,
Konstanz, Germany.
21

TABLE 1 Summary Statistics, Male Private Sector Employees, 1997-2008
Bonus No Bonus Annual Labour Income 27,031.20 21,327.24 Bonus Amount 3,180.37 Performance Pay 0.278 0.091 Normal Hours 39.977 39.985 Age 40.069 41.693 A Level 0.263 0.222 Diploma 0.099 0.089 Degree or Higher 0.198 0.128 Union 0.232 0.219 Temporary Job 0.006 0.034 Large Firm 0.473 0.387 Manager/Supervisory Duties 0.593 0.393 Observations 9,482 12,376 Source: BHPS
22

TABLE 2 Bonus Receipt Wage Premium on (non-bonus) Annual Incomes (£2005), Male
Private Sector Employees, 1997-2008.
(1) (2) (3) (4) (5) OLS FE ln(income)
OLS
ln(income) FE
ln(income) Bonus Job
FE
VARIABLES Bonus/Profit Share 2,585*** 952.8*** 0.115*** 0.0487*** 0.0403*** (286.4) (168.2) (0.008) (0.005) (0.009) Performance Pay 1,868*** 471.7** 0.0614*** 0.00780 0.0143** (465.7) (211.6) (0.011) (0.007) (0.007) Age 1,326*** 1,419*** 0.0648*** 0.0725*** 0.0699*** (88.54) (265.7) (0.003) (0.008) (0.008) Age2 -14.07*** -24.32*** -0.000711*** -0.000947*** -0.000948*** (1.097) (1.195) (4.00e-05) (3.73e-05) (3.74e-05) A Level 2,558*** -777.7 0.102*** -0.0811** -0.0774** (360.6) (1,215) (0.013) (0.0379) (0.038) Diploma 5,329*** -2,686 0.186*** -0.124** -0.110** (893.3) (1,770) (0.021) (0.0552) (0.055) Degree or Higher 8,898*** 809.8 0.282*** 0.00501 0.00849 (693.7) (1,393) (0.019) (0.0435) (0.044) Union Member 840.5** 2,038*** 0.0992*** 0.108*** 0.110*** (345.4) (313.1) (0.012) (0.010) (0.010) Temporary Job -2,651*** -941.8* -0.214*** -0.107*** -0.110*** (715.2) (557.4) (0.035) (0.017) (0.018) Large Firm 2,992*** 739.0*** 0.127*** 0.0448*** 0.0454*** (332.5) (215.3) (0.010) (0.007) (0.007 Manager/Supervisor 4,955*** 799.4*** 0.209*** 0.0565*** 0.0564*** (288.0) (213.8) (0.010) (0.007) (0.007) Constant -27,368*** -6,036 7.503*** 8.089*** 8.174*** (1,998) (9,044) (0.0774) (0.282) (0.283) Observations 21,868 21,868 21,868 21,868 21,868 R-squared 0.331 0.118 0.435 0.193 0.188 Number of pid 5,419 5,419 5,419
Source: BHPS. Robust standard errors in parentheses. *, ** and *** indicate statistical significance at the 10%, 5% and 1% respectively. Controls included but not reported are hours worked, occupation, industry, region and year dummies.
23

TABLE 3: Bonus Amount and Non-Bonus Labour Income, Male Private Sector Employees,
1997-2008
OLS OLS FE FE (I) (II) (II) Bonus Amount(£2005) 1.170*** 1.470*** 0.580*** 0.583*** (0.0613) (0.106) (0.0209) (0.036) Bonus Amount2 -5.4 e-06*** -3.36e-08 (1.3e-06) (4.9e-07) Performance Pay 1,182*** 951.353** 412.8** 378.837* (396.6) (409.6) (208.1) (210.1) Constant -23,055*** -22,757.07*** -1,994.00 -4,912.14 (1,744) (1,740) (8,953) (8969.59) Observations 21,868 21,868 21,868 21,868 R-squared 0.419 0.425 0.153 0.158 Number of pid 5,419 5,393
Source: BHPS. Standard errors in parentheses and clustered by worker in the OLS. *, ** and *** indicate statistical significance at the 10%, 5% and 1% respectively. All other controls as per Table 2.
24

TABLE 4: Sub Sample Estimates: Bonus Amount and Non-Bonus Labour Income, Male
Private Sector Employees, 1997-2008
(1) (2) (3) (4) (5) moved into moved out moved within 1997-2002 2003-2008 bonus
payment of bonus payment
bonus payment
Bonus Amount(£2005) 0.388*** 0.271*** 0.583*** 0.408*** 0.379*** (0.0445) (0.0549) (0.0209) (0.0468) (0.0214) Performance Pay -968.2*** 916.7* -141.3 764.1** 6.712 (359.8) (517.4) (253.2) (334.9) (229.7) Constant -26,394 24,275 -6,942 6,343 -12,160 (18,158) (25,686) (12,673) (15,476) (12,561) Observations 4,055 4,024 7,250 10,621 11,247 R-squared 0.208 0.087 0.319 0.079 0.105 Number of pid 1,552 1,533 1,730 3,432 4,052
Source: BHPS. Standard errors in parentheses. *,** and *** indicate statistical significance at the 10%, 5% and 1% respectively. All other controls as per Table 2.
25

TABLE 5, Quantile Regression Estimates: Male Private Sector Employees, 1997-2008
(1) (2) (3) (4) (5) VARIABLES 10% 25% median 75% 90% Bonus Amount(£2005) 0.848*** 0.973*** 1.217*** 1.533*** 1.919*** (0.0277) (0.0414) (0.0520) (0.0506) (0.0968) Performance Pay 714.8*** 832.3*** 970.0*** 868.3*** 353.1 (161.7) (139.1) (189.4) (224.8) (349.4) Observations 21,868
Quantile Fixed Effects
10% 25% median 75% 90% Bonus Amount(£2005) 0.386*** 0.479*** 0.605*** 0.765*** 0.966*** (0.036) (0.047) (0.046) (0.071) (0.060) Performance Pay 167.147 115.703 297.511*** 329.916*** 358.292*** (222.843) (0.00) (95.814) (131.541) (191.385) Observations 21,868
Source: BHPS. Standard errors in parentheses. *,** and *** indicate statistical significance at the 10%, 5% and 1% respectively. All other controls as per Table 2.
26

TABLE A1 Variation in Annual Income, Bonus Payment and Receipt, 1997-2008, Male Private Sector Employees. Annual Income Annual Bonus Mean 23,985.30 1,408.65 Between Individual Std.Dev 12,755.52 6,061.33 Within Individual Std.Dev 7,807.61 6,447.08
Bonus Receipt # Changes in Bonus Receipt 6,843 # Never Received Bonus 2,261 Source: BHPS.
27

Figure 1, Average Bonus Payments UK 1997-2008, Male Private Sector Employees, BHPS.
£0
£1,000
£2,000
£3,000
£4,000
£5,000
£6,000
1997 1998 1999 2000 2001 2002 2003 2004 2005 2006 2007 2008
Bonus Amount Bonus Amount (recipients only)
28

FIGURE 2 Annual Incomes, Bonus versus non-Bonus recipients, 1997-2008, Male Private
Sector Employees, BHPS.
£0.00
£5,000.00
£10,000.00
£15,000.00
£20,000.00
£25,000.00
£30,000.00
£35,000.00
1997 1998 1999 2000 2001 2002 2003 2004 2005 2006 2007 2008
Non Bonus Recipient Bonus Recipient
29

Figure 3a, Bonus Share of Total Annual Income across Income Distribution, 1997-2008,
Male Private Sector Employees, Bonus Receivers Only, BHPS.
0.0
5.1
.15
.2m
ean
of b
onus
_inc
ome
1 2 3 4 5 6 7 8 9 10 11 12 13 14 15 16 17 18 19 20
30
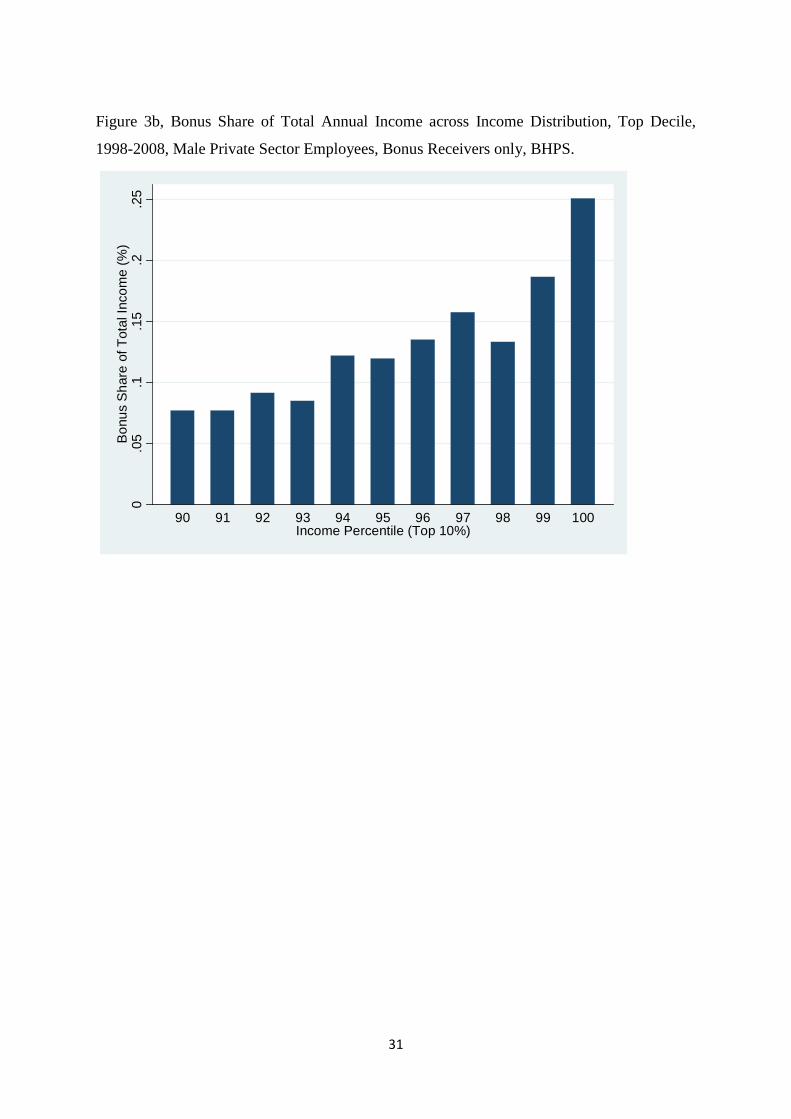
Figure 3b, Bonus Share of Total Annual Income across Income Distribution, Top Decile,
1998-2008, Male Private Sector Employees, Bonus Receivers only, BHPS.
0.0
5.1
.15
.2.2
5B
onus
Sha
re o
f Tot
al In
com
e (%
)
90 91 92 93 94 95 96 97 98 99 100Income Percentile (Top 10%)
31

Endnotes
1 Among numerous illustrations, we highlight two in the New York Times, “Banks Prepare
for Big Bonuses, and Public Wrath” (9th Jan 2010) and “A Modest Proposal to End Those
Outlandish Bonuses” (16th Sep 2009) and two in The Times, “No More Money for Nothing”
(25th Jan 2009) and “Bonus Culture Thrives with Payouts of £22bn” (27th May 2011).
2 Lemeuix et al. (2012) use the PSID to estimate the influence of a dichotomous bonus receipt
indicator on an earnings variable that likely includes the value of bonuses. They find a small
positive influence. When they include as an alternative a dichotomous indicator of whether
the current job has ever paid a bonus, they find no effect. While not in the precise spirit of
those estimating the extent of substitution, these results do appear consistent with substantial
substitution.
3 It is important to note that just because bonuses may be based on objective indicators does
not mean they reflect market forces. As a potential illustration, despite fear among large US
banks to the contrary, government interventions restricting pay and bonuses apparently did
not result in an exodus of talent (Dash 2010).
4 Indeed, both Prendergast and Topel (1993) and Laffont (1990) argue that collusion and
hidden gaming within the hierarchy between superiors and subordinates becomes more likely
when the superiors are paid in fashions other than simply being residual claimants of their
subordinate's output. Surely, bonuses run this risk.
5 Please refer to Jenkins (2010) for a summary of this information.
6 The one key difference that they note is that the BHPS appears to under-sample high earners
while in ASHE response is effectively mandatory. However, we do not use the ASHE data as
it lacks a specific measure of bonuses.
7 As mentioned, we see the log-log specification as problematic especially in the fixed-effect
estimate because of the large number of zero values for the bonus amount. If we arbitrarily
set the log of zero to zero itself and estimate a log-log specification in the OLS we return an
estimate of 0.043 [s.e=0.008]).
32

8 Fixed effects estimation of wages do not make sense in a situation where we are essentially
limiting our sample to new hires.
9 In estimates available upon request, we added the squared bonus amount in the quantile
estimates. The coefficient is routinely negative but does not dominate the linear term when
evaluated at quantile bonus amount. The pattern continues to show increases net coefficients
when moving up the distribution.
10 In additional estimates available upon request we re-estimated our model of the returns to
bonus receipt in a quantile regression setting. These revealed increasing returns to bonus
receipt from £1,647 at the 10th percentile to £2,329 at the 90th percentile.
33