bonus payments, hierarchy levels and tenure: theoretical ...ftp.iza.org/dp5284.pdf · bonus...
TRANSCRIPT
DI
SC
US
SI
ON
P
AP
ER
S
ER
IE
S
Forschungsinstitut zur Zukunft der ArbeitInstitute for the Study of Labor
Bonus Payments, Hierarchy Levels and Tenure: Theoretical Considerations and Empirical Evidence
IZA DP No. 5284
October 2010
Christian GrundMatthias Kräkel

Bonus Payments, Hierarchy Levels and Tenure: Theoretical Considerations and
Empirical Evidence
Christian Grund University of Würzburg
and IZA
Matthias Kräkel University of Bonn
and IZA
Discussion Paper No. 5284 October 2010
IZA
P.O. Box 7240 53072 Bonn
Germany
Phone: +49-228-3894-0 Fax: +49-228-3894-180
E-mail: [email protected]
Any opinions expressed here are those of the author(s) and not those of IZA. Research published in this series may include views on policy, but the institute itself takes no institutional policy positions. The Institute for the Study of Labor (IZA) in Bonn is a local and virtual international research center and a place of communication between science, politics and business. IZA is an independent nonprofit organization supported by Deutsche Post Foundation. The center is associated with the University of Bonn and offers a stimulating research environment through its international network, workshops and conferences, data service, project support, research visits and doctoral program. IZA engages in (i) original and internationally competitive research in all fields of labor economics, (ii) development of policy concepts, and (iii) dissemination of research results and concepts to the interested public. IZA Discussion Papers often represent preliminary work and are circulated to encourage discussion. Citation of such a paper should account for its provisional character. A revised version may be available directly from the author.

IZA Discussion Paper No. 5284 October 2010
ABSTRACT
Bonus Payments, Hierarchy Levels and Tenure: Theoretical Considerations and Empirical Evidence*
Using data on executive compensation for the German chemical industry, we investigate the relevance of two theoretical approaches that focus on bonuses as part of a long term wage policy of a firm. The first approach argues that explicit bonuses serve as substitutes for implicit career concerns. The second approach claims that bonuses are used as complements to an executive’s internal career. Our data show that bonus payments are mostly prevalent among senior executives at higher hierarchy levels and rather for management jobs than for jobs in research and development. This is true for the whole chemical sector as well as for single large corporations. The findings indicate that the two theoretical views are not mutually exclusive, but are both relevant in practice. JEL Classification: M52, J33 Keywords: bonus payments, chemical sector, hierarchy, tenure, wage policy Corresponding author: Christian Grund Department of Business and Economics University of Würzburg Sanderring 2 97070 Würzburg Germany E-mail: [email protected]
* Many thanks to Martin Kukuk and two anonymous referees for helpful comments and to Johannes Martin for preparing the data set. Financial support by the Deutsche Forschungsgemeinschaft (DFG), grant SFB/TR 15 (“Governance and the Efficiency of Economic Systems”) is gratefully acknowledged.

2
Bonus Payments, Hierarchy Levels and Tenure: Theoretical Considerations and Empirical Evidence
1. Introduction
Executives are rewarded according to both long-term and short-term performance. Following
the traditional view on executive compensation, promotion-based incentive schemes are used
to honor long-term success, whereas bonus-based incentive schemes typically fix annual
payments to focus on short-term goals (Baker, Jensen and Murphy 1988). In the last two
decades, applied contract theory has emphasized that bonus payments can also be seen as part
of a long-term wage policy of a firm. In particular, two approaches have contributed to this
view. First, Gibbons and Murphy (1992) pointed out that the optimal incentive mix consists of
explicit pay-for-performance (i.e., bonuses) and implicit career incentives.1 In the beginning
of an employee’s career, high ability uncertainty provides strong career concerns so that the
firm can skip high powered explicit incentives. However, the more ability uncertainty
diminishes the less effective will be career concerns for employee motivation and the firm
must more strongly rely on bonus payments as explicit incentives. Hence, according to
Gibbons and Murphy (1992), bonuses and career incentives are substitutes, implying a
positive relation between tenure and bonus payments of employees.
Second, bonus payments and an executive’s internal career may also be complements: In the
case of limited liability, linking job promotion to individual performance generates strong
incentives for executives at lower levels since climbing the ladder is associated with
significant rents when attaining higher levels of the hierarchy. As rents at higher tiers of a
corporate hierarchy can only be used for incentive purposes when being combined with job
promotion, bonuses and internal careers are complements within the optimal wage policy of a
firm (Kräkel and Schöttner 2009, 2010). According to this view, bonus payments are
positively related to hierarchy levels in the sense that bonuses increase upwards a corporate
hierarchy.
In this paper, by using data from the German chemical industry we explore whether real
executive compensation is in line with these two approaches. The two approaches are not
mutually exclusive as bonuses at high hierarchy levels may serve both purposes – being a
1 See Fama (1980) and Holmström (1982, 1999) on implicit incentives via career concerns.

3
substitute for missing implicit career incentives and transferring rents to executives. Hence,
there are four possible outcomes: (1) only the substitutes approach turns out to be valid, (2)
only the complements approach is valid, (3) both approaches are supported by the data, or (4)
neither approach proves relevant in practice. The data provide detailed information of more
than 5,000 executives. In particular, we know all components of each executive’s
compensation, his or her2 hierarchy level, tenure, occupational skills and other individual
characteristics. We use two proxies for the intensity of bonus pay: first, the fact whether an
executive has a bonus contract or not, and second, the executive’s individual bonus income
relative to his total compensation. Whereas the first indicates the contractual pay for
performance relevance, the second measures the actual pay for (individual, group and/or firm)
performance. The results indicate that bonus contracts and payments are mostly prevalent
among executives with large tenure at higher tiers of the corporate hierarchy and rather for
management jobs than for jobs in research and development. Hence, the data offer empirical
support for both the substitutes approach and the complements approach.
Concerning the complements approach, note that the use of bonuses is only one of several
alternatives to transfer rents to executives. For example, promotion can be directly
accompanied by an increase of the executive’s base wage. Moreover, there are non-monetary
rewards like flexible working time and discretion (e.g., Lazear 1995, pp. 57-62, 85, 1998,
chapter 14) as well as perks like company cars and nice offices (e.g., Marino and Zábojnik
2008a, b), which are particularly important for managers. Since we only focus on bonuses in
our paper, this may lead to an underestimation of rent transfer. Therefore, including additional
sources of rent transfer would even strengthen our empirical findings.
To the best of our knowledge the substitutes approach has not been empirically compared
with the complements approach so far. Nevertheless, our paper is related to part of the
compensation literature. There is a rich literature on executive pay with a special focus on the
compensation of chief executive officers (CEOs) (e.g., Murphy 1999 for an overview).
Hereby, many contributions focus on stock options and not on bonus payments. As an
exception, Gibbons and Murphy (1992) empirically tested their substitutes approach by using
publicly available data on salaries, bonuses and other compensation ingredients of 3,000
CEOs from the U.S. The results are in line with their theoretical model of explicit and implicit
2 We use the male form for managers and the female form for the employer in the remainder of this contribution for simplicity.

4
incentives being substitutes by showing that pay for performance sensibilities are higher for
CEOs nearing retirement.
The career-concerns part of the substitutes approach has also been experimentally tested in the
laboratory. For their experiments, Irlenbusch and Sliwka (2006) as well as Koch, Morgenstern
and Raab (2009) used a simplified two-period version of the well-known career-concerns
model by Holmström (1982, 1999). The two experimental papers yield mixed results on the
validity of career concerns for real decision makers.
Another strand of the literature explores the wage policy of single firms. For instance, Baker,
Gibbs and Holmström (1994a, 1994b) as well as Treble et al. (2001) use personnel records
and examine the white collar workforces of single financial sector firms. They concentrate on
fix wages and abstain from dealing with bonuses, though. In a recent case study, Ockenfels,
Sliwka and Werner (2010) examine a large firm with subsidiaries in Germany and the U.S.
and focus on perceived reference points of bonus payments. The authors explore
consequences (e.g., job satisfaction, supervisor performance) of bonuses rather than
determinants.
Ortin-Angel and Salas-Fumas (1998) examine determinants of bonus incidence and bonus
levels based on individual cross section data from Spain in 1990. They refer to Gibbs (1995)
who – similar to the model of Gibbons and Murphy (1992) – predicts that explicit bonus
payments and implicit career incentives are substitutes in the optimal compensation package
for managers. Ortin-Angel and Salas-Fumas point out that their results support the substitutes
model of Gibbs (1995). Their empirical study differs from ours in several respects. First, they
do not explore the bonus fraction relative to total compensation. Second, they do not analyze
the bonus policy of single firms. As the two authors consider different sectors of the Spanish
economy, they investigate sectoral patterns of managerial compensation, whereas our study
concentrates on one industry with more homogeneous firms. Third, they do not investigate the
complements approach.
Note that there also exist other compensation theories that lead to similar predictions as the
substitutes and the complements approaches – a positive relationship between hierarchy level
and tenure on the one hand and managerial compensation on the other hand. However, these
theories deal with the increase of base salaries and not with pay for performance in form of
bonuses. Therefore, our bonus data cannot be used to investigate the relevance of these
theories. Two of the most prominent approaches dealing with base salary and hierarchy level

5
or tenure, respectively, are introduced by Rosen (1982, 1986). In Rosen (1982), the effort of a
certain manager influences the values of marginal product of all subordinate managers.
Consequently, the higher a manager is located in the corporate hierarchy the higher should be
his base salary. Rosen (1986) considers a dynamic tournament model. In order to motivate
risk-averse employees in a corporate hierarchy, wage differentials between hierarchy levels
should be positive and increasing along the promotion ladder. In particular, the spread
between CEO compensation and the base salary of the vice president of the corporation
should be very large to induce incentives for all employees that have a positive probability to
become CEO once in their career.
The remainder of the paper is organized as follows: Section 2 describes the substitutes
approach and the complements approach in more details, and suggests three hypotheses. The
data are introduced in Section 3. The main empirical findings are derived in Section 4.
Section 5 concludes.
2. Intertemporal Incentives and Bonus Payments - Theoretical Considerations and Hypotheses
Bonuses are typically used for creating short-term incentives. If, for example, the performance
of a certain department exceeds a given annual threshold, the respective department manager
will receive a prespecified bonus for this year. However, bonus payments can also play an
important role in the long run. In the following subsections, we present two alternatives for
creating incentives that work against moral hazard of employees. We argue that bonuses can
either substitute or complement implicit career incentives. In the substitute case, bonus
payments and tenure should be positively related. In the complement case, there should be a
positive relation between bonus payments and hierarchy level (i.e., bonus contracts should be
particularly observed on high levels of a corporate hierarchy).
Bonuses as Career Substitutes
The first approach has been analyzed by Gibbons and Murphy (1992). It is based on the
seminal papers by Fama (1980) and Holmström (1982, 1999), addressing the topic of career
concerns: Fama and Holmström assume that labor market competition for talented employees
leads to a strictly positive relation between an employee’s expected talent and his market
6
value. The higher the expected talent is, the higher will be the reservation value of the
employee and, therefore, the higher the actual payment by his current employer. When an
employee starts working and enters a low level of a corporate hierarchy there is still high
uncertainty about his true productivity or talent. This uncertainty is symmetric between
employee and employer so that both learn from the employee’s success and failure on the job.
Technically, the employee’s productivity can be described by a random variable that follows a
given prior distribution, based on previous experiences and statistical information. Due to
Bayesian updating, every success of the employee shifts probability mass from the left of the
distribution to the right, thus increasing the employee’s posterior expected productivity and
thereby his market value. Conversely, every failure leads to a probability shift from the right
to the left and, therefore, decreases the employee’s posterior expected productivity. In this
early stage of an employee’s career with high talent uncertainly, individuals have very strong
career incentives since success and failure have a high impact on the posterior talent
distribution, determining the individuals’ reservation values. Consequently, they choose high
effort levels. The more talent uncertainty diminishes as tenure increases, the smaller will be
an employee’s career incentives. From a technical perspective, low talent uncertainty means
that the variance of the employee’s unknown productivity shrinks or, in other words, the
precision of observed performance as a signal of underlying productivity increases. Now,
additional observations on success and failure only have less influence on the redistribution of
posterior probability mass. As a consequence, if tenure rises the employee will reduce effort
in order to save effort costs.
Gibbons and Murphy (1992) combine the career-concerns model with bonuses to analyze a
firm’s optimal mix of explicit and implicit incentives. They assume that an employee’s output
to the firm in period t, yt, is linear in effort chosen by the employee in that period, et, and the
employee’s unknown talent, η:
yt = η + et + εt.
Unknown talent η is modeled as a random variable that follows a certain distribution with
variance Var[η]. According to the assumption of symmetric talent uncertainty, this
distribution is common knowledge for the employer, the employee and the remaining labor
market. εt is a random noise variable for period t (e.g., denoting measurement error) with
noise being stochastically independent across periods. Output is observable and verifiable by
the firm, whereas talent, effort and noise are unobservable. Hence, we have a moral hazard
7
problem. The firm is assumed to be risk neutral, but the employee is risk averse. Gibbons and
Murphy assume that long-term or multi-period contracts are not feasible.
At the beginning of an employee’s career, Var[η] is rather large. On the one hand, following
the career-concerns approach, this high talent uncertainty leads to strong implicit career
incentives. On the other hand, explicit incentives via a bonus contract based on observed
output are very costly for the firm: Since Var[η] is large, output is mainly determined by the
exogenous random variable η. In order to motivate the employee in such situations, the firm
must offer very high bonuses in case of high outputs. Moreover, since the employee is risk
averse a large value of Var[η] will be associated with a large risk premium, if the employee is
incentivized via bonuses. This risk premium is completely paid by the firm given that the
employee is not protected by limited liability. For these reasons, the firm will use implicit
career incentives but does not offer explicit bonus payments if the employee is at the
beginning of his career. As employee tenure increases, talent uncertainty diminishes. The
more the uncertainly is reduced (i.e., the smaller Var[η]), the less effective will be implicit
career incentives, which has been pointed out above. In this situation, the firm will use bonus
schemes as a substitute for missing career incentives. If an employee’s tenure is quite high,
there is only marginal talent uncertainty so that implicit career incentives are completely
replaced by explicit bonus schemes. Low talent uncertainty makes these bonuses very
effective and rather cheap for the firm. Altogether, the optimal incentive mix leads to a strong
positive relationship between tenure and bonuses, yielding our first hypothesis:
Hypothesis 1: The relevance of bonus payments increases in tenure.
This substitutes approach is based on career concerns due to talent uncertainty. If this
approach is highly relevant, then career incentives (instead of bonuses) should be prevalent
for jobs, in which talent uncertainty matters, whereas bonus contracts should be attached to
those jobs with routine and administrative dominated tasks. Thus, we should observe less
relevance of bonus payments at research and development jobs. Here, high talent uncertainty
should favor implicit career incentives instead of explicit pay for performance in form of
bonuses. Note that career incentives for industrial researchers can take two different forms.
On the one hand, researchers may be interested to climb up the hierarchy by becoming head
of the research department or by switching to the management track. On the other hand,
researchers may primarily be interested to stay in the research area. For these individuals,
8
career incentives can be generated by promising higher research budgets or promotion along a
special research track, the so-called dual ladder (see already Smith and Szabo (1977) on the
dual ladder at Union Carbide in the 1970s). Talent uncertainty plays a minor role for
managerial tasks at rather administrative jobs in the areas of controlling, finance, marketing
and HR. For these jobs, explicit incentives via bonus payments should be more important.
Hypothesis 2: Bonuses should mainly be paid at management jobs rather than in
research and development.
Bonuses as Complements to Internal Careers
If, contrary to the career-concerns approach, initial talent uncertainty of young employees’ is
not an issue (e.g., due to formal qualifications that credibly signal true talent in the sense of
Spence 1973), career incentives may still work when being complemented by bonus payments
at higher hierarchy levels: Let an employee’s output in period t again be described by the
linear production function yt = η + et + εt. However, without talent uncertainty the variable η is
now deterministic and common knowledge. Because of unobservable noise εt the employer
still faces a moral hazard problem. She can use a bonus contract (bL, bH) to induce incentives
to her employees. The high bonus bH will be paid to an employee if realized output exceeds a
certain standard y (i.e., yt > y), whereas the low bonus bL (< bH) is given to the employee
otherwise (i.e., yt < y). Suppose that employees are protected by limited liability (see, e.g.,
Sappington 1983; Innes 1990; Kim 1997) in the sense that bonuses are not allowed to be
negative. Moreover, let the employees be risk neutral and be characterized by a convex
disutility-of-effort function (in monetary terms) c(et) with c(0) = c´(0) = 0. Finally, let the
employees’ reservation values be normalized to zero.
We can exemplarily sketch the optimal contract for the employees at the highest hierarchy
level. In the given setting, an employee maximizes his expected utility
prob{yt > y} bH + prob{yt < y} bL – c(et)
= [1 – prob{εt < y – η – et}] bH + prob{εt < y – η – et} bL – c(et)
= bL + (bH – bL) [1 – F(y – η – et)] – c(et)

9
with F as the cumulative distribution function of the random variable εt. If the employee’s
objective function is strictly concave, optimal effort choice is described by the first-order
condition
(bH – bL) F´(y – η – et) = c´(et).
Hence, for a given standard and given bonuses an employee’s optimal effort equates marginal
expected bonus payments and marginal costs.
Now we consider the employer’s bonus contract. First, note that the employee’s participation
constraint can be neglected by the employer when solving for the optimal contract, that is, the
employee will earn a non-negative rent in the optimum: Since bonuses are non-negative due
to limited liability and c(0) = 0, by accepting any feasible contract and choosing zero effort an
employee can ensure himself an expected utility that is at least as large as his zero reservation
value. Second, the optimal low bonus bL is zero since incentives decrease and expected labor
costs increase in bL. The optimal high bonus bH maximizes the employer’s expected net
profits E[yt] – bH [1 – F(y – η – et)] subject to the incentive constraint bH F´(y – η – et)] =
c´(et) and the limited-liability constraint, which is strictly positive in the optimum (i.e., bH >
0). In any case, an employee at the highest hierarchy level will earn a strictly positive rent if
the employer wants to implement positive effort levels.
When looking at lower hierarchy levels, we have a completely different situation. Employees
located at lower levels anticipate that they will earn expected bonus payments and, hence,
positive rents if being promoted to higher levels. This expectation generates strong career
incentives even if employees’ talents are perfectly known in the beginning. Since expected
bonuses at the top of the hierarchy complement an employee’s internal career along a certain
ladder and already imply high efforts on lower hierarchy levels, the firm may optimally
forego bonus schemes at these levels (see Kräkel and Schöttner 2009, 2010).
Both models may lead to the same observation that high-tenured employees have successfully
climbed the ladder and now earn large bonus payments at high hierarchy levels, whereas low-
tenured employees at lower ranks of the hierarchy are only offered few if any bonus contracts.
However, the substitutes issue focuses on tenure, whereas certain hierarchy levels of a firm
are necessary for the complements argument. In practice, both arguments may well be
relevant. Empirically it is possible to disentangle tenure from hierarchy level effects. Aiming
to check the relevance of the complements argument, we formulate

10
Hypothesis 3: Bonus payments are more relevant at higher levels of the hierarchy.
3. Data and Variables
Examining the hypotheses, we make use of a new and unique data set of highly qualified
professionals and executive staff of the German chemical industry. The chemical industry is
important for the whole German economy and dominated by large firms. Subsectors include
fine and special chemicals, polmers, pharmaceutical products, petrochemicals, detergents and
toiltries as well as anorganic chemicals. The association of the chemical industry (Verband
der Chemischen Industrie – VCI) reports an aggregate revenue of the ten largest firms of the
sector of over 180 billion € in 2008. These ten firms have employed almost 600,000
employees worldwide (see Table A in the appendix for detailed numbers of single firms).
Over 400.000 employees are employed in the German chemical sector. Most of them are not
employed as executives and covered by collective wage agreements, though.
In collaboration with the German association of executive staff of the chemical industry
(Verband angestellter Akademiker und leitender Angestellter der Chemischen Industrie e.V.
(VAA)) we conduct a salary survey. In March 2009, the survey has been sent to VAA
members and also to members of a partner association GDCh (Gesellschaft deutscher
Chemiker e.V.), from which about 33 percent respond. According to VAA and GDCh, our
sample is representative for the respective employees of the chemical sector. Individuals are
asked about their current job next to some demographics and their previous occupational
career. In particular, we have detailed information on all components of their 2008 salary such
as fix wages, bonuses and other integral parts such as exercised stock options, inventors’
gratuities or jubilee payments. We have valid information for 5,586 employees.
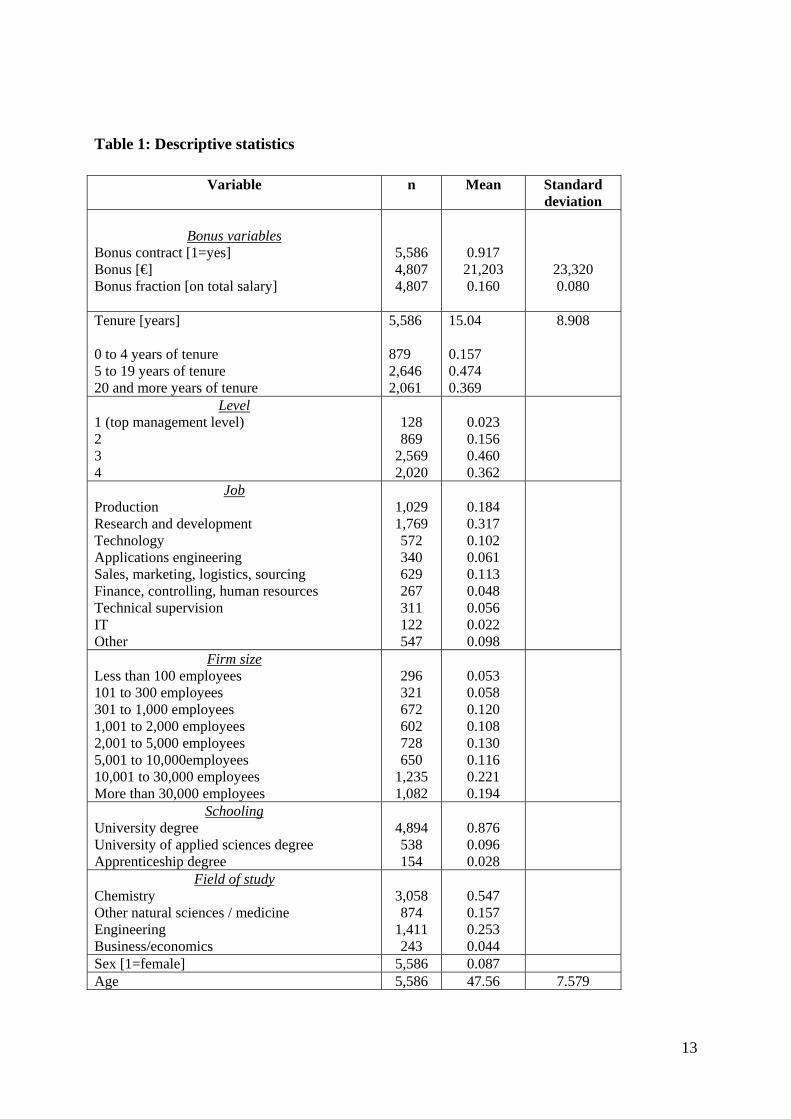
In this contribution, we concentrate on bonuses. First, we examine, whether employees have
some kind of bonus contract. Over 90 percent of employees in the sample affirm a
corresponding question and over 90 percent of this group actually reports a positive bonus for
the year 2008. Second, the fraction of the bonus on total yearly salary is taken into account.
The average bonus fraction amounts to 0.16. These two variables act as dependent variables
in our empirical analysis. Table 1 provides an overview of descriptive statistics for these and
other variables. The average bonus of those who receive such payments is about € 21,000.

11
In correspondence to our hypotheses stated in section 2 above, the most important
independent variables are tenure, hierarchy level and functional area. Tenure is measured in
years. Focusing on special effects on new hires, we also compare three categories of tenure
((i) less than 5 years, (ii) 5 to 19 years, (iii) at least 20 years). Functional areas are divided
into nine categories. About 30 percent of the employees work in the field of R&D. One of six
employees is allocated to a typical management task such as marketing, finance, controlling
or HR. Respondents are also asked to allocate themselves to one of four management levels
from 1 to 4. Hereby, level 1 represents the top-management level.3 Jobs at a certain level are
likely to differ between firms with respect to firm size. Therefore, it makes sense to control
for firm size as well. We can distinguish between eight categories with regard to the number
of firms’ employees. As mentioned above, the chemical sector is dominated by large firms.
More than three quarter of respondents work in firms with more than 1,000 employees.
We also control for sex, age, schooling degrees and field of study. We distinguish between
apprenticeships, university of applied sciences and university graduates with regard to
schooling, and between chemistry, other natural sciences, technical and business/economics
degrees with regard to field of study.4 Additionally, we have information for the corporation
in which the employees are employed for more than half of observations. We will use this
information by examining whether our overall results are robust for single large corporations.
To the best of our knowledge, the data are unique with regard to the combination of sample
size and the degree of information on salary components. Representative surveys of the whole
population such as the IAB employment sample or the German Socio Economic Panel do not
cover detailed information on bonus payments. Besides, it seems to be useful to have a more
homogeneous sample of employees for the addressed research question.
3 Although our data provide pretty good information about jobs of employees by knowing the level of the hierarchy and functional areas, we have to state that tasks and responsibility of jobs may even differ within groups. A level 1 manager may also have some further career opportunities by being promoted to the CEO.
4 We exclude the very few observations with other degrees such as law and humanities from the analysis. This restriction does not have any effect on our results.

12
4. Results
As a first illustration Figures 1 to 3 indicate the relevance of bonus payments for certain
categories of tenure, hierarchy level and functional area. Although bonus contracts are also
relevant for recently hired employees, the incidence increases with tenure from 0.83 for
employees with less than 5 years to 0.95 for 20 and more years of tenure. Accordingly, the
longtime employees face higher fractions of bonuses than the recently hired (0.18 vs 0.13). At
first glance, differences in hierarchy levels can be seen for the bonus fraction. There is no
clear interrelation for the incidence of bonus contracts, though. Note, however, that other
forms of performance related pay such as stock options are relevant particularly for managers
at levels 1 and 2.
Level 1 managers with a positive bonus indeed report particularly high payments of € 55,000
on average. With regard to the functional area the bar graphs hint for particular bonus
relevance in the typical management areas such as marketing, finance, controlling and HR. In
contrast, the corresponding values for employees in the R&D area are somewhat lower.
Therefore, firms seem to distinguish bonus payments with regard to tenure, hierarchy level
and functional area, although some institutional pressure may work against it. Usually,
employees’ interest groups such as works councils or the representative committee of
executive employees try to avoid a substantially unequal treatment of employees. In a next
step, we examine the impact of tenure, hierarchy level and functional area in more details.
The figures also show 10th, 25th, 75th and 90th percentiles of bonus fraction. Intra-group
differences are quite large.
13
Table 1: Descriptive statistics
Variable n Mean Standard deviation
Bonus variables
Bonus contract [1=yes] Bonus [€] Bonus fraction [on total salary]
5,586 4,807 4,807
0.917 21,203 0.160
23,320 0.080
Tenure [years] 0 to 4 years of tenure 5 to 19 years of tenure 20 and more years of tenure
5,586 879 2,646 2,061
15.04 0.157 0.474 0.369
8.908
Level 1 (top management level) 2 3 4
128 869
2,569 2,020
0.023 0.156 0.460 0.362
Job Production Research and development Technology Applications engineering Sales, marketing, logistics, sourcing Finance, controlling, human resources Technical supervision IT Other
1,029 1,769 572 340 629 267 311 122 547
0.184 0.317 0.102 0.061 0.113 0.048 0.056 0.022 0.098
Firm size Less than 100 employees 101 to 300 employees 301 to 1,000 employees 1,001 to 2,000 employees 2,001 to 5,000 employees 5,001 to 10,000employees 10,001 to 30,000 employees More than 30,000 employees
296 321 672 602 728 650
1,235 1,082
0.053 0.058 0.120 0.108 0.130 0.116 0.221 0.194
Schooling University degree University of applied sciences degree Apprenticeship degree
4,894 538 154
0.876 0.096 0.028
Field of study Chemistry Other natural sciences / medicine Engineering Business/economics
3,058 874
1,411 243
0.547 0.157 0.253 0.044
Sex [1=female] 5,586 0.087 Age 5,586 47.56 7.579

14
Figure 1: Relevance of bonus payments and tenure
Notes: Figures show shares respectively means (dots) as well as percentiles (10th, 25th, 75th, 90th).

15
Figure 2: Relevance of bonus payments and hierarchy levels
Notes: Figures show shares respectively means (dots) as well as percentiles (10th, 25th, 75th, 90th).

16
Figure 3: Relevance of bonus payments and functional areas
Notes: Figures show shares respectively means (dots) as well as percentiles (10th, 25th, 75th, 90th).

17
Table 2 presents the results of our multivariate analysis. We run two regressions with our two
bonus variables as dependent variables. Since the incidence of a bonus contract is a binary
variable, we apply a binary probit approach here. An ordinary least square estimation is used
for the regression on the fraction of the bonuses. In order to better interpret the coefficients,
we stick to simple fractions. A transformation of the fraction x by ln(x/(1-x)) leads to the
same results.
The results support our three hypotheses. Indeed, bonus payments are more relevant for
employees with longer periods of tenure, for individuals with jobs at higher hierarchy levels,
and for those with management rather than R&D tasks. The results do not depend on the
proxy for bonus relevance, but are robust for the incidence of bonus contracts and the fraction
of bonus payments on total salary. All results are highly statistically significant.
In order to report the economic relevance, marginal effects for binary probit estimates can be
calculated for the mean of other variables. Since bonus contracts are prevalent for most
employees in the sector, marginal effects for bonus contracts are not too big. Additional ten
years of tenure lead to an increase in the incidence of a bonus contract of 1.4 percentage
points. Level 1 managers face a higher incidence in the amount of 3.4 percentage points than
level 3 employees, and employees in management areas have a 4 percentage points higher
incidence than R&D workers.5 Differences with respect to the fraction of the bonus on total
salary are more pronounced for level and job area than for tenure. The bonus fraction of level
1 managers is seven percentage points higher than at level 3. The fraction of employees at
sales exceeds that of R&D workers in the amount of three percentage points. 6
5 The detailed results with respect to marginal effects are provided by the authors on request.
6 The results are also robust with respect to the absolute amount of bonus payments as a possible third indicator of bonus relevance. Differences concerning the amount of bonuses are somewhat pronounced. Interpreting the data as causal effects, each additional year of tenure increases the bonus in the amount of 1.4 percent. Executives at level 1 earn a bonus more than twice as high than the employees at level 3. Employees with management task receive considerably higher bonuses (sales, marketing, logistics: 33 percent, finance, controlling, hr: 20 percent) than R&D workers.

18
Table 2: Regressions on bonus relevance
Bonus contract (1=yes)
- Binary probit -
Bonus fraction
- OLS - Tenure [years] Tenure squared
0.042*** (0.010) -0.0009*** (0.0003)
0.0030*** (0.0005) -0.00006*** (0.00001)
Level (base: level 3) 1 (top management level) 2 4
0.454*** (0.164) 0.174** (0.080) -0.300*** (0.064)
0.080*** (0.012) 0.031** (0.004) -0.012*** (0.002)
Job (base: research and development) Production Technology Applications engineering Sales, marketing, logistics, sourcing Finance, controlling, human resources, Technical supervision IT Other
0.050 (0.075) 0.205* (0.119) 0.444*** (0.132) 0.577*** (0.119) 0.644*** (0.198) 0.354*** (0.137) 0.262 (0.237) 0.085 (0.092)
0.001 (0.003) 0.008** (0.004) 0.007 (0.005) 0.028*** (0.004) 0.016*** (0.005) 0.001 (0.004) 0.011 (0.007) 0.006* (0.004)
Firm size (base: 1,001 to 2,000) Less than 100 employees 101 to 300 employees 301 to 1,000 employees 2,001 to 5,000 employees 5,001 to 10,000employees 10,001 to 30,000 employees More than 30,000 employees
-1.137*** (0.118) -0.775*** (0.113) -0.534*** (0.098) 0.080 (0.106) 0.418*** (0.122) 0.440*** (0.105) 0.594*** (0.118)
-0.040*** (0.009) -0.033*** (0.007) -0.019*** (0.005) -0.009** (0.005) 0.007 (0.004) 0.019*** (0.004) 0.063*** (0.004)
Schooling (base: university degree) University of applied sciences degree Apprenticeship degree
0.028 (0.104) -0.150 (0.171)
-0.017*** (0.004) -0.017** (0.007)
Field of study (base: chemistry) Other natural sciences / medicine Engineering Business/economics
-0.084 (0.076) 0.036 (0.082) -0.150 (0.181)
0.004 (0.003) 0.012*** (0.003) -0.001 (0.006)
Sex [1=female] -0.234*** (0.086) -0,0064* (0.004) Age -0.001 (0.005) 0.0002 (0.0002) Intercept 1.156*** (0.229) 0.103*** (0.010)
Number of observations 5,586 4,807
R2 0.184 0.216 Notes: The table reports coefficients and robust standard errors. Significant result at the 10%, 5% and 1% level are indicated with *, ** and *** respectively.
19
To summarize, since tenure and job dummies as well as hierarchy levels are significantly
associated to bonus relevance, the results are in line with our hypothetical considerations of
section 2. In this sense, we can ascribe both the substitute and the complement argument
empirical relevance. Although we cannot check strict causal effects, there are at least no
empirical hints opposed to our considerations.
Our results are robust with respect to a number of different specifications. The hierarchy
levels 1 to 4 might have a different meaning across firm size categories. Estimations for single
categories generally lead to the same results, though. The tenure effects are somewhat more
pronounced in large firms, whereas differences across functional areas are a little bit more
relevant in smaller firms. Neither estimations for single hierarchy levels nor implementing
interaction terms of hierarchy levels and tenure lead to additional than the general results.
It is worth mentioning that the two regressions of Table 2 are connected to each other. As
stated above, most individuals have explicit bonus contracts and most of these indeed get a
positive bonus. One may argue at first glance that some kind of double hurdle model might be
relevant. However, there are also some managers, who state a positive bonus without having
an explicit bonus contract. Nevertheless, managers receiving a bonus payment are not
necessarily a random selection of all managers. In order to take into account a possible
selection bias, a Heckman selection model (Heckman 1976) can be used, where the bonus
fraction and the probability to get such a payment are estimated in one common approach (see
Table B in the appendix). The results of the probit (selection) model coincide with the
outcomes of the binary probit model of Table 2. The results with regard to determinants of the
bonus fraction do not differ, either.
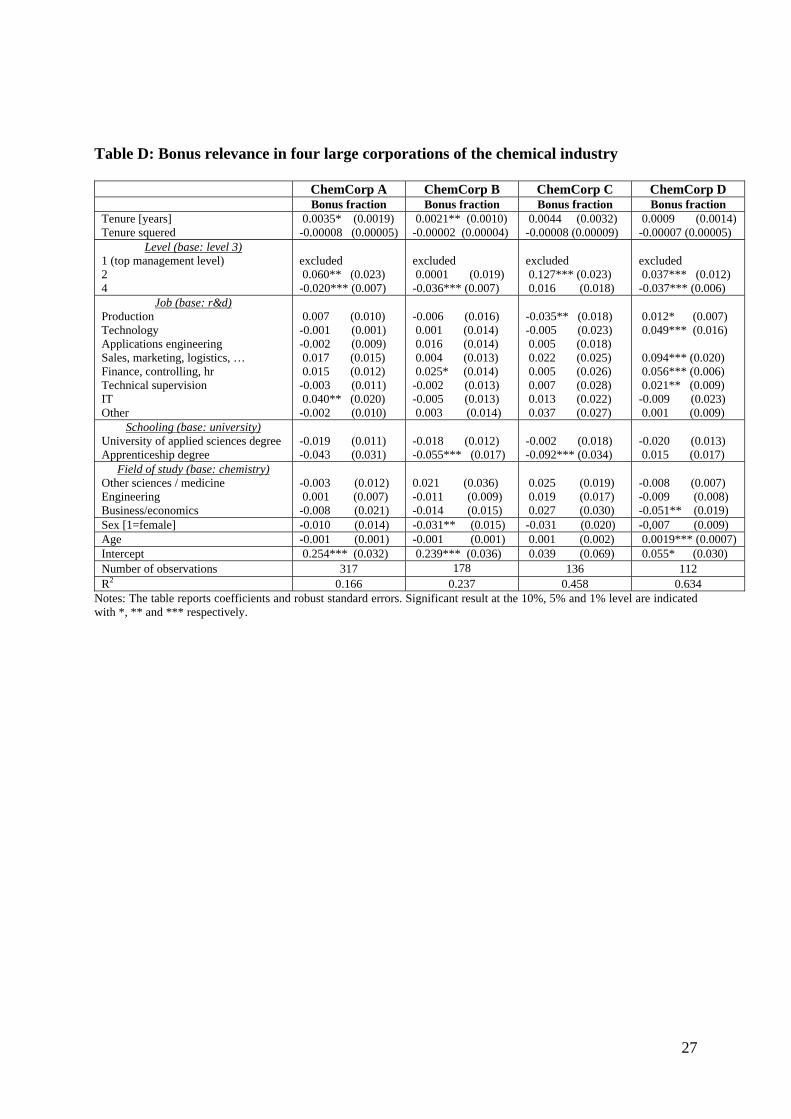
Firms may differ with respect to their bonus policy. As mentioned above, we can assign
employees to certain firms in the majority of cases. It is therefore possible to analyze the
bonus policy of single firms. We have more than 100 observations for four large corporations.
We call these corporations ChemCorp A, B, C and D, respectively. In these four firms, almost
all employees under considerations have bonus contracts. There are hardly any observations
for level 1 employees so that we exclude the few observations and concentrate on the bonus
fraction. Re-estimating the regression of Table 2 for employees of these four firms only lead
to the same qualitative results compared to the general perspective of the chemical sector (see
Table C in the appendix). However, the absolute level and relative importance of bonus
payments differ considerably across firms. Employees of ChemCorp A receive much higher

20
bonuses than employees of the other firms. We checked that bonus levels and fractions are
positively correlated with some measures of firm performance such as growth of revenue.
Firmwise estimations show that bonus payments are determined by tenure and level in most
cases (see Table D in the appendix). Functional areas as supposed above are relevant only in
two (A and D) of these firms, though.
In order to examine a particular relevance for recently hired employees, we re-estimate the
specifications of Tables 2 described above with three categories of tenure instead of a metric
tenure variable (see Table 3). Indeed, the results concerning tenure are mainly driven by
employees with less than five years of tenure. This is true for the employees under
consideration in general and also for three of the four large corporations of the chemical
sector A, B and C. There are no meaningful differences between employees with 5 to 19 years
of tenure and workers with at least 20 years at their firm. In contrast, bonuses are less relevant
for recently hired employees with tenure up to 4 years, independent of the bonus dimension.
Table 3: Regression on bonus relevance – results for tenure categories (one regression per row)
Tenure (base: 5 to 19 years)
Dependent variable
0 to 4 years of tenure
20 and more years of tenure
All observations
Bonus contract
ln Bonus
Bonus fraction
-0.203*** (0.072)
-0.255*** (0.039)
-0.021*** (0.004)
0.004 (0.003)
0.070** (0.028)
0.004 (0.003)
ChemCorp A ln Bonus
Bonus fraction
-0.207** (0.103)
-0.026* (0.015)
0.007 (0.062)
0.0004 (0.009)
ChemCorp B ln Bonus
Bonus fraction
-0.627* (0.353)
-0.045* (0.025)
0.122 (0.083)
0.011 (0.007)
ChemCorp C ln Bonus
Bonus fraction
-0.681*** (0.252)
-0.048** (0.020)
0.127 (0.157)
0.003 (0.181)
ChemCorp D ln Bonus
Bonus fraction
-0.097 (0.159)
-0.007 (0.014)
-0.154 (0.108)
-0.009 (0.009)
Notes: Same specification as Table 2 and 3 (tenure dummies instead of tenure in years). The table reports coefficients and robust standard errors. Significant result at the 10%, 5% and 1% level are indicated with *, ** and *** respectively.

21
5. Conclusion
We provide evidence for individual and job based characteristics that affect bonus payments
for executives in Germany. Due to lack of data this issue has been addressed only
insufficiently before. Our data set has the advantage that we are able to run firmwise
regressions, which allow to examine possible differences in the bonus policies of single firms.
Using unique data from executive compensation in the German chemical industry we can
show that bonus payments are in line with two different purposes within the long term wage
policy of firms. First, bonuses substitute implicit career incentives when the ability of a
manager is revealed over time. Second, bonuses also complement internal careers by
generating strong job-promotion incentives via substantial employee rents at higher hierarchy
levels. Our data contain information on tenure and hierarchy levels of executives next to
detailed information on individual compensation so that the two effects can be disentangled.
Some limitations of our study occur due to data restrictions. Similar to Ortin-Angel and Salas-
Fumas (1998), we only have a cross-section data set and cannot examine changes over a
specific period of time. The possible problem of unobserved heterogeneity could be
diminished with appropriate panel data. However, if the internal wage structures of the firms
are rather stable over time, our cross-section analysis will give a reliable picture of the firms’
bonus policies. For example, Baker, Gibbs and Holmström (1994a, 1994b) analyzed the wage
policy of a single corporation over a period of 20 years and pointed out that both the
organizational structure and the wage structure of the corporation do not significantly change
during their observation period.
Both the substitutes approach and the complements approach are based on the assumption that
there is sufficient internal mobility upwards the firms’ hierarchies. Our cross-section data do
not offer information on individual job promotion and executives’ real opportunities of
climbing up the corporate hierarchy. In addition, there may be certain positions that are
regularly filled by hiring executives from outside. However, we know from discussions with
VAA members and representatives that there is substantial internal promotion in the sector.
Analyzing the relation between bonus relevance and tenure, we have to state that the actual
amount of the bonus usually depends on the performance of the individual (and also the
performance of his division and the whole firm). If individual performance depends on tenure,

22
it is even more difficult to identify causal effects. However, the incidence of a bonus contract
variable is not hit by this problem and we show significant relevance for this variable, too.
Future work with repeated corresponding surveys may, for instance, contribute to the issues,
to what extent bonuses and other wage components are affected by the recent economic crisis
and whether this global crisis has long term effects in general or for certain cohorts of
employees in particular.
References
Auriol, E., Friebel, G. and L. Pechlivanos (2002): Career Concerns in Teams, Journal of Labor
Economics 20, 289-307.
Baker, G.P., Gibbs, M. and B. Holmström (1994a): The Internal Economics of the Firm:
Evidence from Personnel Data, Quarterly Journal of Economics 109, 881-919.
Baker, G.P., Gibbs, M. and B. Holmström (1994b): The Wage Policy of a Firm, Quarterly
Journal of Economics 109, 921-955.
Baker, G.P., Jensen, M.C. and K.J. Murphy (1988): Compensation and Incentives: Practice
vs. Theory, Journal of Finance 43, 593-616.
Fama, E. (1980): Agency Problems and the Theory of the Firm, Journal of Political Economy
88, 288-307.
Gibbons, R. and K.J. Murphy (1992): Optimal Incentive Contracts in the Presence of Career
Concerns: Theory and Evidence, Journal of Political Economy 100, 468-505.
Gibbs, M. (1995): Incentive Compensation in a Corporate Hierarchy, Journal of Accounting
and Economics 19, 247-277.
Heckman, J. (1976): The Common Structure of Statistical Models of Truncation, Sample
Selection, and Limited Dependent Variables and a Simple Estimator for Such Models,
The Annals of Economic and Social Measurement 5, 475-492.
Holmström, B. (1982): Managerial Incentive Problems – A Dynamic Perspective, in Walross
B. (ed.): Essays in Economics and Management in Honor of Lars Wahlbeck, Helsinki,
209-230.
Holmström, B. (1999): Managerial Incentive Problems: A Dynamic Perspective, Review of
Economic Studies 66, 169-182.
Innes, R.D. (1990): Limited Liability and Incentive Contracting with Ex-ante Action Choices,
Journal of Economic Theory 52, 45-67.
23
Irlenbusch, B. and D. Sliwka (2006): Career Concerns in a Simple Experimental Labour
Market, European Economic Review 50, 147-170.
Kim, S.K. (1997): Limited Liability and Bonus Contracts, Journal of Economics and
Management Strategy 6, 899-913.
Koch, A.K., Morgenstern, A. and P. Raab (2009): Career Concerns Incentives: An
Experimental Test, Journal of Economic Behavior and Organization 72, 571-588.
Kräkel, M. and A. Schöttner (2009): Internal Labor Markets and Worker Rents. Discussion
Paper.
Kräkel, M. and A. Schöttner (2010): Minimum Wages and Excessive Effort Supply.
Economics Letters 108, 341-344.
Lazear, E.P. (1995): Personnel Economics. Cambridge (Mass.)/London.
Lazear, E.P. (1998): Personnel Economics for Managers. New York et al.
Marino, A.M. and J. Zábojnik (2008a): Work-Related Perks, Agency Problems, and Optimal
Incentive Contracts, RAND Journal of Economics 39, 565-585.
Marino, A.M. and J. Zábojnik (2008b): A Rent Extraction View of Employee Discounts and
Benefits, Journal of Labor Economics 26, 485-518.
Murphy, K.J. (1999): Executive Compensation. In Ashenfelter, O. and D. Card (eds.):
Handbook of Labor Economics, Volume 3b, 2485-2563.
Ockenfels, A., Sliwka, D. and P. Werner (2010): Bonus Payments and Reference Point
Violations. IZA Discussion Paper No. 4795.
Ortin-Angel, P. and V. Salas-Fumas (1998): Agency-Theory and Internal-Labor-Market
Explanations of Bonus Payments: Empirical Evidence from Spanish Firms, Journal of
Economics and Management Strategy 7, 573-613.
Rosen, S. (1982): Authority, Control and the Distribution of Earnings, Bell Journal of
Economics 13, 311-323.
Rosen, S. (1986): Prizes and Incentives in Elimination Tournaments, American Economic
Review 76, 701-715.
Sappington, D. (1983): Limited Liability Contracts between Principal and Agent, Journal of
Economic Theory 29, 1-21.
Smith, J.J. and T.T. Szabo (1977): The Dual Ladder – Importance of Flexibility, Job Content
and Individual Temperament, Research Management 20, 20-23.
Treble, J., E. van Gameren; S. Bridges; T. Barmby (2001): The Internal Economics of the Firm:
Further Evidence from Personnel Data, Labour Economics 8, 531-552.

24
Appendix
Table A: Largest firms of the German chemical sector (ranked by 2008 revenue)
Firm Revenue (Mill. €)
Number of employees
BASF S.E. Bayer AG Evonik Industries AG Henkel KGaA Linde AG Fresenius S.E. Boehringer Ingelheim GmbH Merck KGaA Lanxess AG Beiersdorf AG K+S AG Wacker Chemie AG B. Braun Melsungen AG Cognis GmbH Ratiopharm GmbH Stada Arzneimittel AG SGL Carbon S.E. Westfalen AG Fuchs Petrolub AG Altana AG
62,30432,91815,87314,13112,66312,33611,5957,5586,5765,9714,7974,2983,7863,0011,9001,6461,6121,5001,3941,342
96,924 108,600 40,767 55,513 51,908
122,217 41,300 32,800 14,797 21,766 12,368 15,922 37,601 5,900
n.a. 8,318 6,500 1,205 3,855 4,791
Subsidiaries of foreign firms
Sandoz International GmbH Dow Gruppe Deutschland Procter & Gamble Deutschland GmbH Basell Polyolefine GmbH Roche Deutschland Holding GmbH Sanofi-Aventis Deutschland GmbH Novartis Deutschland GmbH Unilever Deutschland GmbH Celanese GmbH Air Liquide Deutschland GmbH
7,6004,8354,6504,6464,2894,0002,9502,4142,1002,000
23,000 6,532
n.a. 2,585
13,000 10,000 8,300 1,961 2,850 4,000
Source: VCI 2009 (http://www.vci.de/default~cmd~shd~docnr~94490~lastDokNr~-1.htm)

25
Table B: Regressions on bonus relevance (Heckman selection model)
Prob (Positive Bonus)
Bonus fraction
Tenure [years] Tenure squared
0.072*** (0.009) -0.002*** (0.0003)
0.0040*** (0.0008) -0.00008*** (0.00002)
Level (base: level 3) 1 (top management level) 2 4
0.288** (0.142) 0.093 (0.070) -0.256*** (0.054)
0.085*** (0.008) 0.033*** (0.003) -0.015*** (0.003)
Job (base: research and development) Production Technology Applications engineering Sales, marketing, logistics, sourcing Finance, controlling, human resources, Technical supervision IT Other
0.147** (0.067) 0.289*** (0.101) 0.446*** (0.110) 0.494*** (0.908) 0.500*** (0.143) 0.268** (0.112) 0.266 (0.178) 0.084 (0.078)
0.003 (0.004) 0.013*** (0.005) 0.012** (0.006) 0.033*** (0.005) 0.021*** (0.006) 0.004 (0.005) 0.014* (0.008) 0.006 (0.004)
Firm size (base: 1,001 to 2,000) Less than 100 employees 101 to 300 employees 301 to 1,000 employees 2,001 to 5,000 employees 5,001 to 10,000employees 10,001 to 30,000 employees More than 30,000 employees
-0.925*** (0.106) -0.718*** (0.100) -0.391*** (0.085) 0.256*** (0.938) 0.423*** (0.100) 0.429*** (0.087) 0.432*** (0.090)
-0.056*** (0,013) -0.044*** (0.010) -0.240*** (0.006) -0.006 (0.005) -0.004 (0.005) 0.024*** (0.005) 0.067*** (0.005)
Schooling (base: university degree) University of applied sciences degree Apprenticeship degree
-0.069 (0.088) -0.328** (0.147)
-0.018*** (0.004) -0.210*** (0.008)
Field of study (base: chemistry) Other natural sciences / medicine Engineering Business/economics
-0.037 (0.640) 0.041 (0.068) 0.307 (0.149)
0.003 (0.003) 0.012*** (0.003) -0.001 (0.006)
Sex [1=female] -0.095 (0.076) ---a
Age -0.004 (0.004) ---a
Intercept 0.652*** (0.186) 0.092*** (0.013)
Number of observations 5,586 4,807
λ 0.036 (0.026) Notes: The table reports coefficients and standard errors. Significant result at the 10%, 5% and 1% level are indicated with *, ** and *** respectively. a sex and age have been skipped due to the necessity of having more independent variables in the selection model.

26
Table C: Regressions on bonus relevance in four large corporations
Bonus fraction
- OLS - Tenure [years] Tenure squared
0.0025** (0.0012) -0.00005* (0.00003)
Level (base: level 3) 1 2 4
excluded
0.059*** (0.012) -0.019*** (0.004)
Job (base: research and development) Production Technology Applications engineering Sales, marketing, logistics, sourcing Finance, controlling, human resources, Technical supervision IT Other
-0.002 (0.006) 0.013 (0.008) 0.002 (0.007) 0.026*** (0.009) 0.018** (0.008) 0.002 (0.008) 0.011 (0.009) 0.008 (0.008)
Schooling (base: university degree) University of applied sciences degree Apprenticeship degree
-0.017** (0.007) -0.014 (0.015)
Field of study (base: chemistry) Other natural sciences / medicine Engineering Business/economics
0.0007 (0.007) 0.004 (0.005) -0.008 (0.012)
Sex [1=female] -0,005 (0.008) Age 0.0001 (0.0006)
Firm dummies (base: ChemCorp A) ChemCorp B ChemCorp C ChemCorp D
-0.053*** (0.005) -0.092*** (0.007) -0.111*** (0.005)
Intercept 0.217*** (0.022)
Number of observations 743
R2 0.456 Notes: The table reports coefficients and robust standard errors. Significant result at the 10%, 5% and 1% level are indicated with *, ** and *** respectively.
27
Table D: Bonus relevance in four large corporations of the chemical industry
ChemCorp A ChemCorp B ChemCorp C ChemCorp D Bonus fraction Bonus fraction Bonus fraction Bonus fraction
Tenure [years] Tenure squered
0.0035* (0.0019) -0.00008 (0.00005)
0.0021** (0.0010) -0.00002 (0.00004)
0.0044 (0.0032) -0.00008 (0.00009)
0.0009 (0.0014) -0.00007 (0.00005)
Level (base: level 3) 1 (top management level) 2 4
excluded 0.060** (0.023) -0.020*** (0.007)
excluded 0.0001 (0.019) -0.036*** (0.007)
excluded 0.127*** (0.023) 0.016 (0.018)
excluded 0.037*** (0.012) -0.037*** (0.006)
Job (base: r&d) Production Technology Applications engineering Sales, marketing, logistics, … Finance, controlling, hr Technical supervision IT Other
0.007 (0.010) -0.001 (0.001) -0.002 (0.009) 0.017 (0.015) 0.015 (0.012) -0.003 (0.011) 0.040** (0.020) -0.002 (0.010)
-0.006 (0.016) 0.001 (0.014) 0.016 (0.014) 0.004 (0.013) 0.025* (0.014) -0.002 (0.013) -0.005 (0.013) 0.003 (0.014)
-0.035** (0.018) -0.005 (0.023) 0.005 (0.018) 0.022 (0.025) 0.005 (0.026) 0.007 (0.028) 0.013 (0.022) 0.037 (0.027)
0.012* (0.007) 0.049*** (0.016) 0.094*** (0.020) 0.056*** (0.006) 0.021** (0.009) -0.009 (0.023) 0.001 (0.009)
Schooling (base: university) University of applied sciences degree Apprenticeship degree
-0.019 (0.011) -0.043 (0.031)
-0.018 (0.012) -0.055*** (0.017)
-0.002 (0.018) -0.092*** (0.034)
-0.020 (0.013) 0.015 (0.017)
Field of study (base: chemistry) Other sciences / medicine Engineering Business/economics
-0.003 (0.012) 0.001 (0.007) -0.008 (0.021)
0.021 (0.036) -0.011 (0.009) -0.014 (0.015)
0.025 (0.019) 0.019 (0.017) 0.027 (0.030)
-0.008 (0.007) -0.009 (0.008) -0.051** (0.019)
Sex [1=female] -0.010 (0.014) -0.031** (0.015) -0.031 (0.020) -0,007 (0.009) Age -0.001 (0.001) -0.001 (0.001) 0.001 (0.002) 0.0019*** (0.0007) Intercept 0.254*** (0.032) 0.239*** (0.036) 0.039 (0.069) 0.055* (0.030) Number of observations 317 178 136 112 R2 0.166 0.237 0.458 0.634
Notes: The table reports coefficients and robust standard errors. Significant result at the 10%, 5% and 1% level are indicated with *, ** and *** respectively.