boosting economic growth through foreign direct … growing acceptance of fdi •“fdi supports a...
TRANSCRIPT

Boosting Economic Growth through Foreign
Direct Investment
Trainer(s):
Aaron Brickman Organization for
International Investment www.ofii.org

#NLCDC

Boosting Your Economy
through Foreign Direct
InvestmentAaron Brickman
Senior Vice President
Organization for International Investment
Twitter: @aaronbrickman @InsourceJobsUSA
#NLCDC
What is FDI?
Jobs, Growth, Innovation

#NLCDC
Defining FDI
• Foreign Direct Investment (FDI) in the United States: Ownership or
control, directly or indirectly, by one foreign person, or entity, of 10 percent
or more of the voting securities of an incorporated U.S. business enterprise
or an equivalent interest in an unincorporated U.S. business enterprise.
• FDI Position/Stock: Accounts for all existing FDI from one market to the
United States. Using BEA data, SelectUSA tracks FDI Position/Stock by the
country of ultimate beneficiary owner (UBO).
• FDI Flow: Accounts for FDI between one market and the United States in a
given time period (annual, quarterly, etc.). In most cases, SelectUSA uses
annual bilateral flows, which are updated on March 15th of every year.
Source: U.S. Bureau of Economic Analysis
#NLCDC
Is FDI good or bad?

#NLCDC
Growing Acceptance of FDI
• “FDI supports a host of benefits in the United States, notably good jobs and innovation led by research and development investment.” –CEA and DOC
• “An appreciation of the benefits that FDI can bring, together with the widespread adoption of development strategies based on increased integration in the world economy, have resulted in most countries actively seeking FDI.” –World Trade Organization
Sources: Foreign Direct Investment In the United States Report October 2013: CEA and DOC
WTO- Trade and Foreign Investment Press Release 1996
#NLCDC
Introduction to Foreign Direct
Investment:
A Global Perspective
#NLCDC
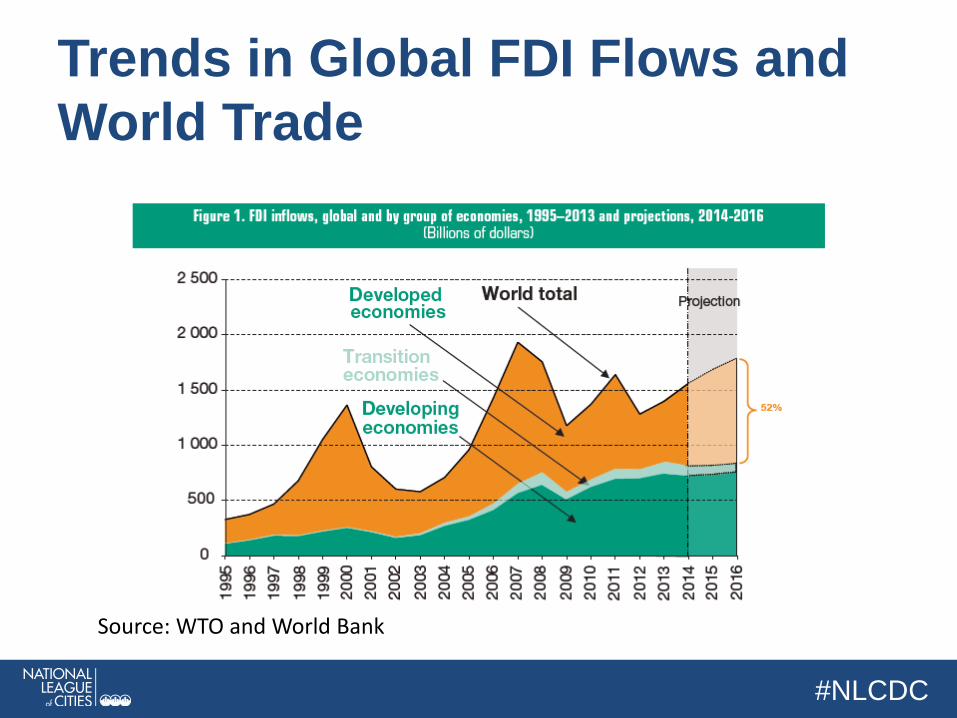
Trends in Global FDI Flows and
World Trade
Source: WTO and World Bank

#NLCDC
Trends in Global FDI Flows and
World Trade
Source: UNCTAD World Investment Report 2014

#NLCDC
FDI Trends to Emerging Markets
#NLCDC
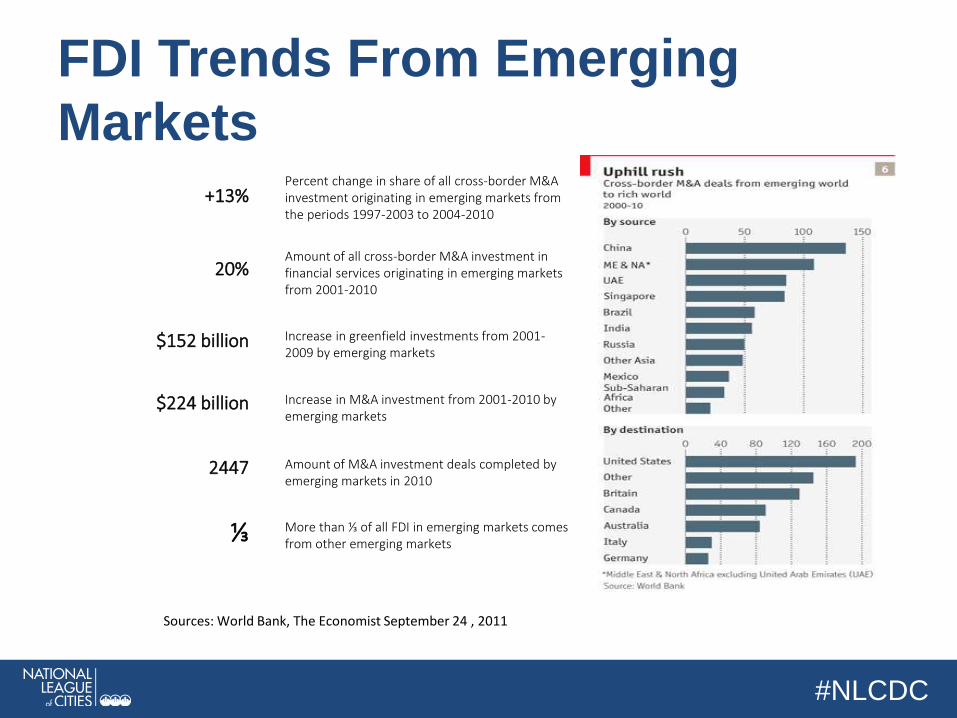
FDI Trends From Emerging
Markets+13%
20%
$152 billion
$224 billion
2447
⅓
Percent change in share of all cross-border M&A investment originating in emerging markets from the periods 1997-2003 to 2004-2010
Amount of all cross-border M&A investment in financial services originating in emerging markets from 2001-2010
Increase in greenfield investments from 2001-2009 by emerging markets
Increase in M&A investment from 2001-2010 by emerging markets
Amount of M&A investment deals completed by emerging markets in 2010
More than ⅓ of all FDI in emerging markets comes from other emerging markets
Sources: World Bank, The Economist September 24 , 2011

#NLCDC
FDI Trends From Emerging Markets
#NLCDC
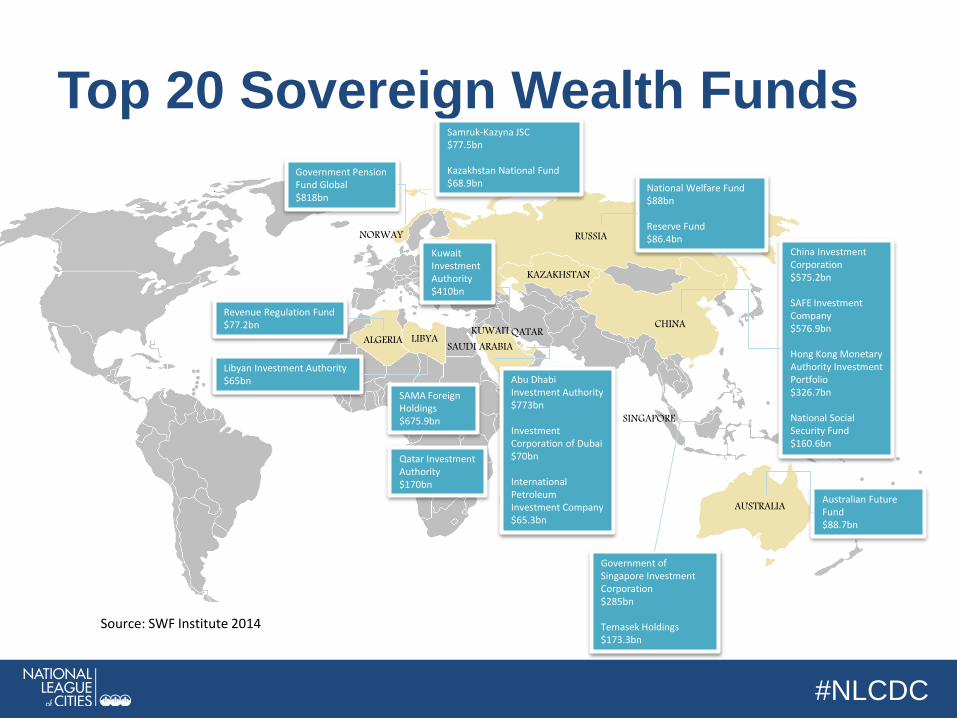
Top 20 Sovereign Wealth Funds
Government Pension Fund Global$818bn
NORWAY RUSSIA
CHINA
KAZAKHSTAN
SAUDI ARABIAQATARKUWAIT
SINGAPORE
AUSTRALIA
LIBYAALGERIA
National Welfare Fund$88bn
Reserve Fund$86.4bn
Abu Dhabi Investment Authority$773bn
Investment Corporation of Dubai$70bn
International Petroleum Investment Company$65.3bn
SAMA Foreign Holdings$675.9bn
China Investment Corporation$575.2bn
SAFE Investment Company$576.9bn
Hong Kong Monetary Authority Investment Portfolio$326.7bn
National Social Security Fund $160.6bn
Government of Singapore Investment Corporation$285bn
Temasek Holdings$173.3bn
Qatar Investment Authority$170bn
Australian Future Fund$88.7bn
Samruk-Kazyna JSC$77.5bn
Kazakhstan National Fund$68.9bn
Revenue Regulation Fund$77.2bn
Libyan Investment Authority$65bn
Kuwait Investment Authority$410bn
Source: SWF Institute 2014
#NLCDC
Impact on the United States
Foreign Direct Investment:
#NLCDC
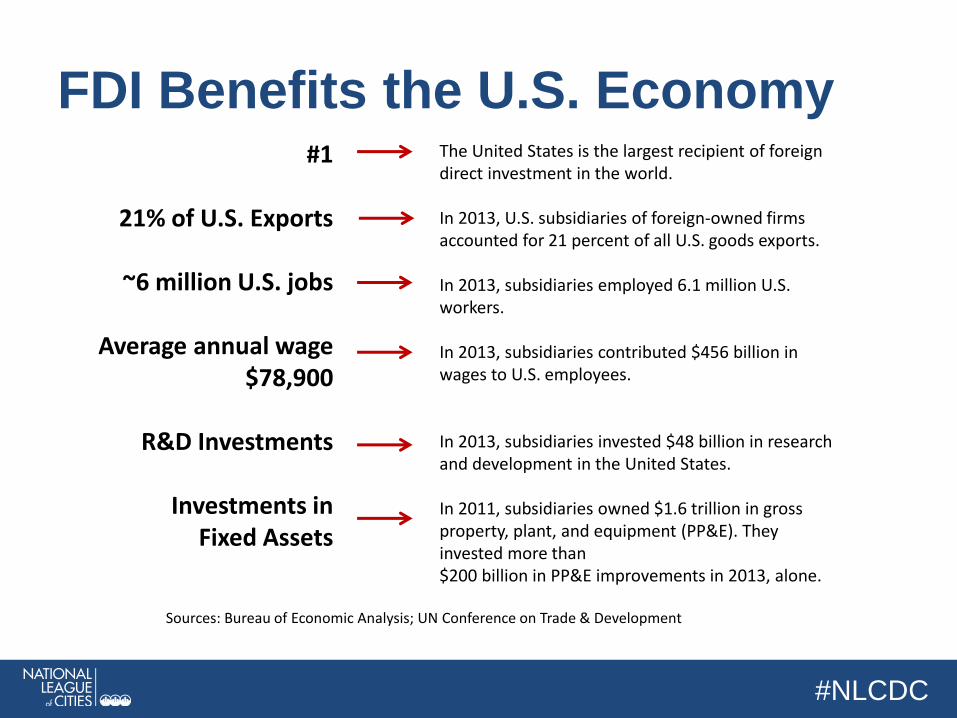
FDI Benefits the U.S. Economy#1
21% of U.S. Exports
~6 million U.S. jobs
Average annual wage $78,900
R&D Investments
Investments in Fixed Assets
The United States is the largest recipient of foreign direct investment in the world.
In 2013, U.S. subsidiaries of foreign-owned firms accounted for 21 percent of all U.S. goods exports.
In 2013, subsidiaries employed 6.1 million U.S. workers.
In 2013, subsidiaries contributed $456 billion in wages to U.S. employees.
In 2013, subsidiaries invested $48 billion in research and development in the United States.
In 2011, subsidiaries owned $1.6 trillion in gross property, plant, and equipment (PP&E). They invested more than $200 billion in PP&E improvements in 2013, alone.
Sources: Bureau of Economic Analysis; UN Conference on Trade & Development
#NLCDC
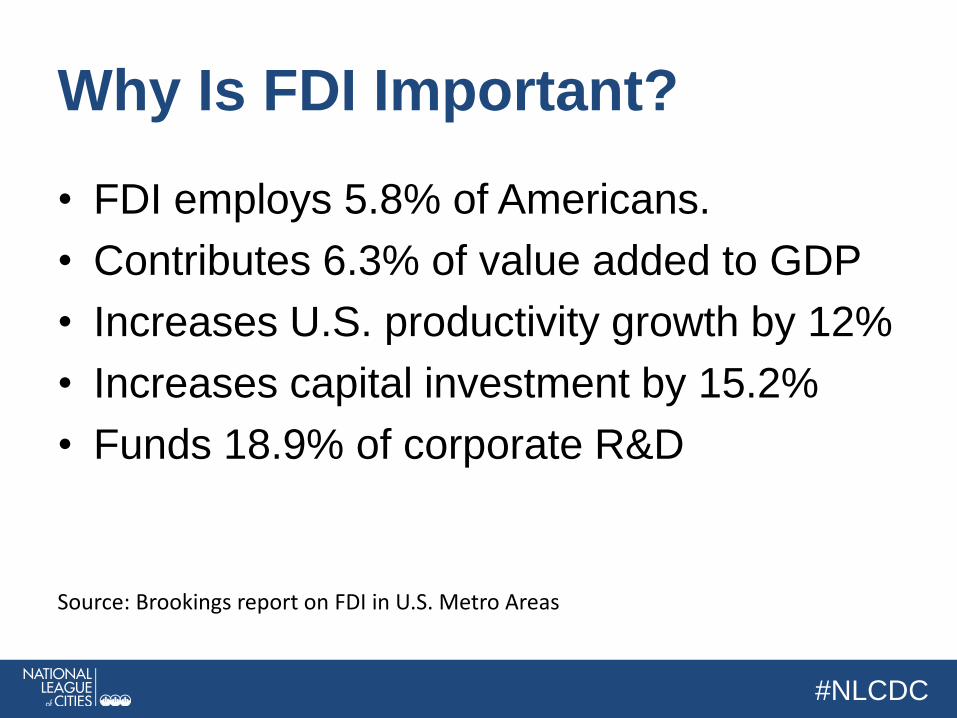
Why Is FDI Important?
• FDI employs 5.8% of Americans.
• Contributes 6.3% of value added to GDP
• Increases U.S. productivity growth by 12%
• Increases capital investment by 15.2%
• Funds 18.9% of corporate R&D
Source: Brookings report on FDI in U.S. Metro Areas

#NLCDC
Global FDI Trends
$0
$500,000
$1,000,000
$1,500,000
$2,000,000
$2,500,000
$3,000,000
$3,500,000
$4,000,000
$4,500,000
$5,000,000
22 largest country recipients by FDI stock in 2013; Currency displayed at current market value.Source: UN Conference on Trade and Development
#NLCDC
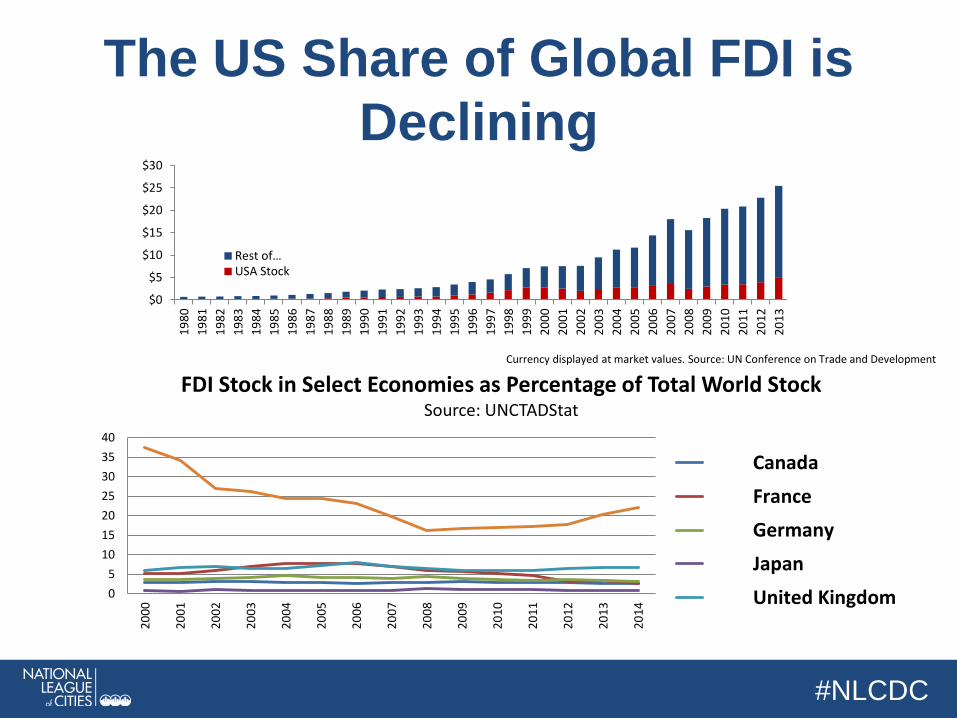
The US Share of Global FDI is
Declining
$0
$5
$10
$15
$20
$25
$30
19
80
19
81
19
82
19
83
19
84
19
85
19
86
19
87
19
88
19
89
19
90
19
91
19
92
19
93
19
94
19
95
19
96
19
97
19
98
19
99
20
00
20
01
20
02
20
03
20
04
20
05
20
06
20
07
20
08
20
09
20
10
20
11
20
12
20
13
Rest of…USA Stock
0
5
10
15
20
25
30
35
40
20
00
20
01
20
02
20
03
20
04
20
05
20
06
20
07
20
08
20
09
20
10
20
11
20
12
20
13
20
14
FDI Stock in Select Economies as Percentage of Total World StockSource: UNCTADStat
Canada
France
Germany
Japan
United Kingdom
Currency displayed at market values. Source: UN Conference on Trade and Development

#NLCDC
Why is Chinese FDI
Controversial?

#NLCDC
The US as a Location for Growth

#NLCDC
US FDI Trends
Source: SelectUSA
#NLCDC
Foreign Direct Investment:
The Impact on US Cities
#NLCDC
Do you know how many jobs
exist in your city as a result of
FDI?
#NLCDC
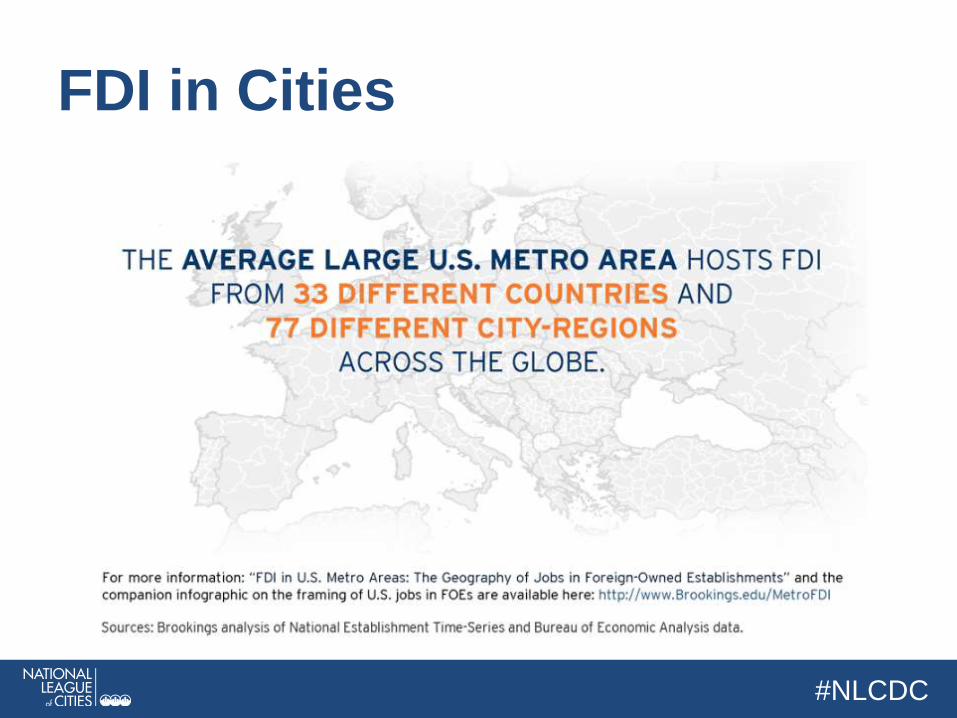
FDI in Cities
#NLCDC
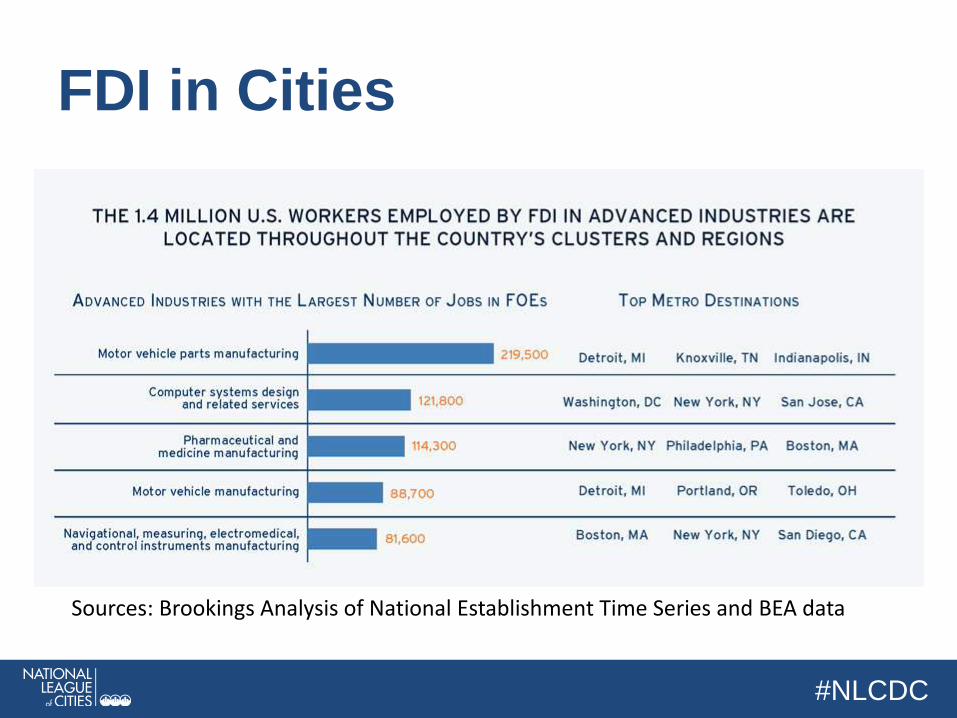
FDI in Cities
Sources: Brookings Analysis of National Establishment Time Series and BEA data

#NLCDC
FDI Job Creation in the U.S.A
• Allentown, PA: 20,780 (118,577)
• Austin, TX: 29,180 (885,400)
• San Francisco, CA: 89,120 (837,442)
• Washington, DC: 126,210 (658,893)
• Philadelphia, PA: 137,040 (1,553,000)
• New York City, NY: 490,290 (8,406,000)
Source: Brookings report on FDI in U.S. Metro Areas, U.S. Census Bureau

#NLCDC
Case Studies: FDI in U.S. Cities
• Samsung 2012: Austin, TX– Manufacturing Plant
– $4 billion investment
– 2500 jobs
• Continental Tire 2016: Mississippi– $1.45 billion investment
– 2500 American jobs
• Allianz 2016: New Mexico– Investing in Wind Farms
– 200 million Euros
– Power 170,000 households
Source: ofii.org

#NLCDC
BREAK
#NLCDC
Attracting FDI
#NLCDC
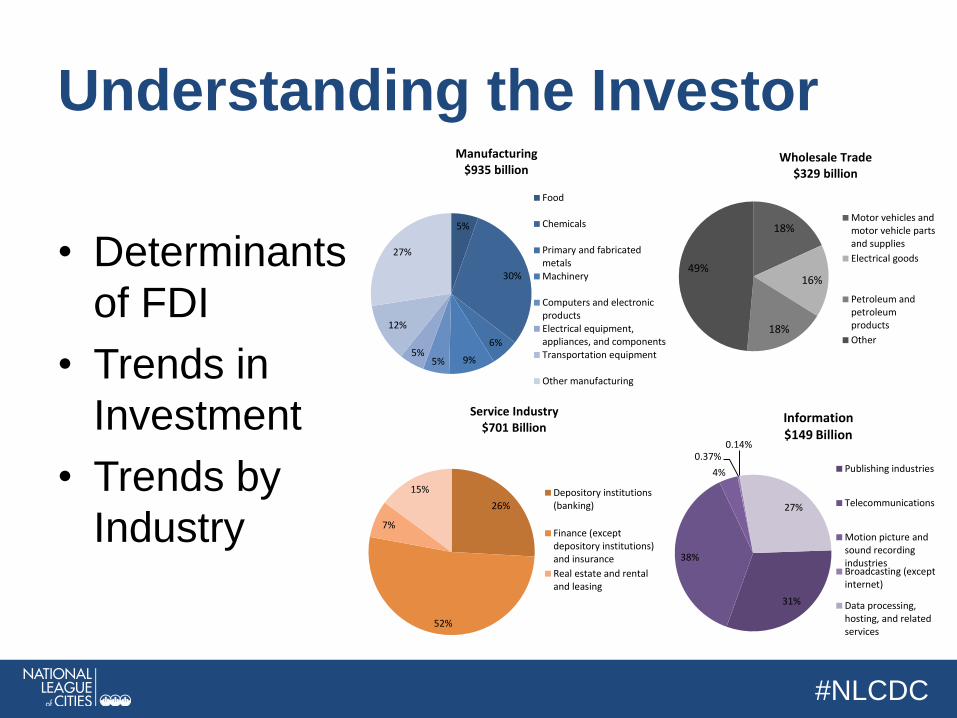
Understanding the Investor
• Determinants
of FDI
• Trends in
Investment
• Trends by
Industry
5%
30%
6%
9%5%5%
12%
27%
Manufacturing$935 billion
Food
Chemicals
Primary and fabricatedmetalsMachinery
Computers and electronicproductsElectrical equipment,appliances, and componentsTransportation equipment
Other manufacturing
26%
52%
7%
15%
Service Industry$701 Billion
Depository institutions(banking)
Finance (exceptdepository institutions)and insurance
Real estate and rentaland leasing
18%
16%
18%
49%
Wholesale Trade$329 billion
Motor vehicles andmotor vehicle partsand supplies
Electrical goods
Petroleum andpetroleumproducts
Other
31%
38%
4%
0.37%0.14%
27%
Information$149 Billion
Publishing industries
Telecommunications
Motion picture andsound recordingindustriesBroadcasting (exceptinternet)
Data processing,hosting, and relatedservices

#NLCDC
Why are Companies Investing
Across Borders?

#NLCDC
The “Typical” Investment
Process• Greenfield (1): Foreign companies create
U.S. operations for the first time.
• Greenfield (2): Foreign company expands existing operations within the U.S.
• Brownfield: Foreign company or government entity purchases existing production facilities to launch a new production activity.
• M&A: One entity acquires another’s existing assets.
• FTZ: Investments made more appealing by foreign trade zones.
#NLCDC
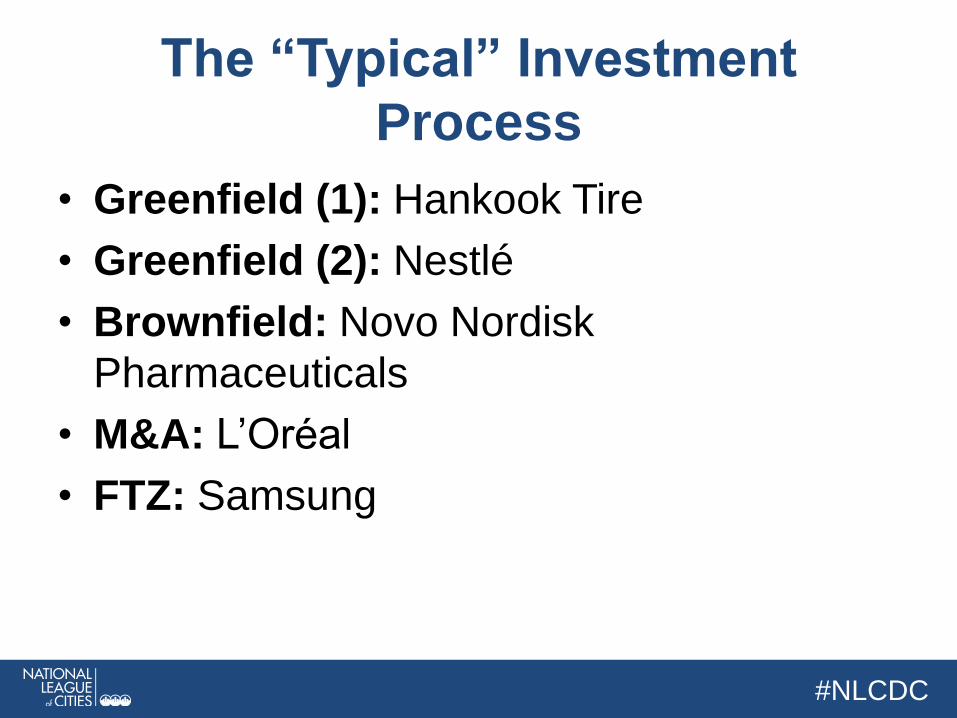
The “Typical” Investment
Process
• Greenfield (1): Hankook Tire
• Greenfield (2): Nestlé
• Brownfield: Novo Nordisk
Pharmaceuticals
• M&A: L’Oréal
• FTZ: Samsung
#NLCDC
Creating and Refining FDI
Strategies
#NLCDC
Have you defined a strategy for
attracting FDI to your city?
#NLCDC
The Globalization Audit
• Collection of Data
• Allows cities to prioritize markets and
industries
• Contributes to a strategy that can be
executed in a collaborative manner, within
a budget.

#NLCDC
The Globalization Audit
• Get a sense for economic activity
(4-way trade & investment):
–Inbound FDI
–Outbound FDI
–Exports
–Imports
#NLCDC
The Globalization Audit
• Research a list of current foreign
investors
– Create a list of current top countries for
region’s exports and current top countries
for region’s inbound investment
#NLCDC
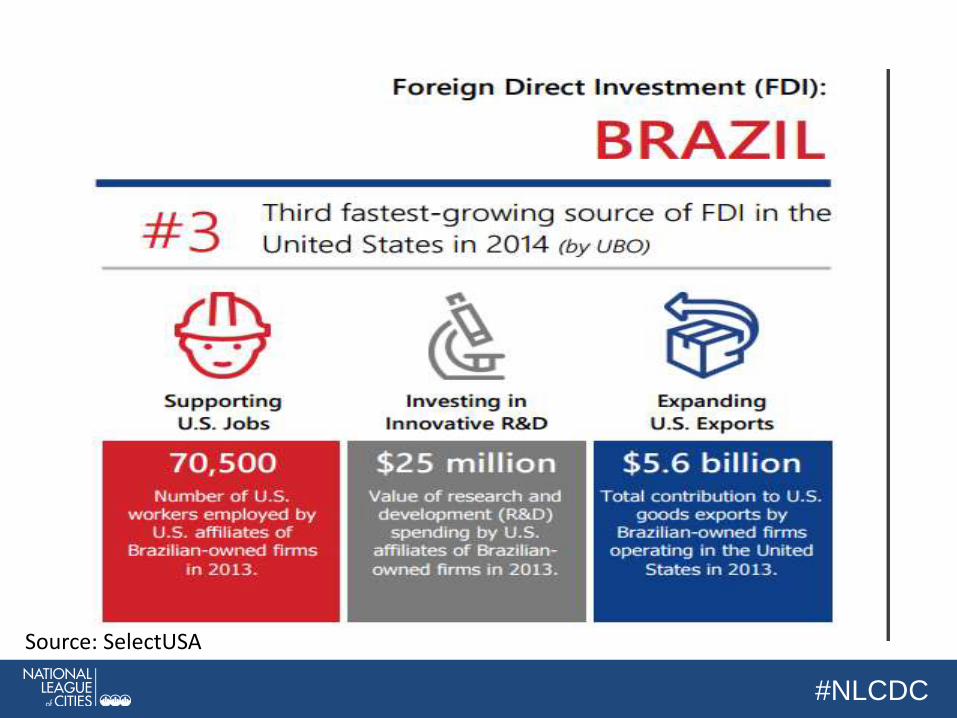
Source: SelectUSA
#NLCDC
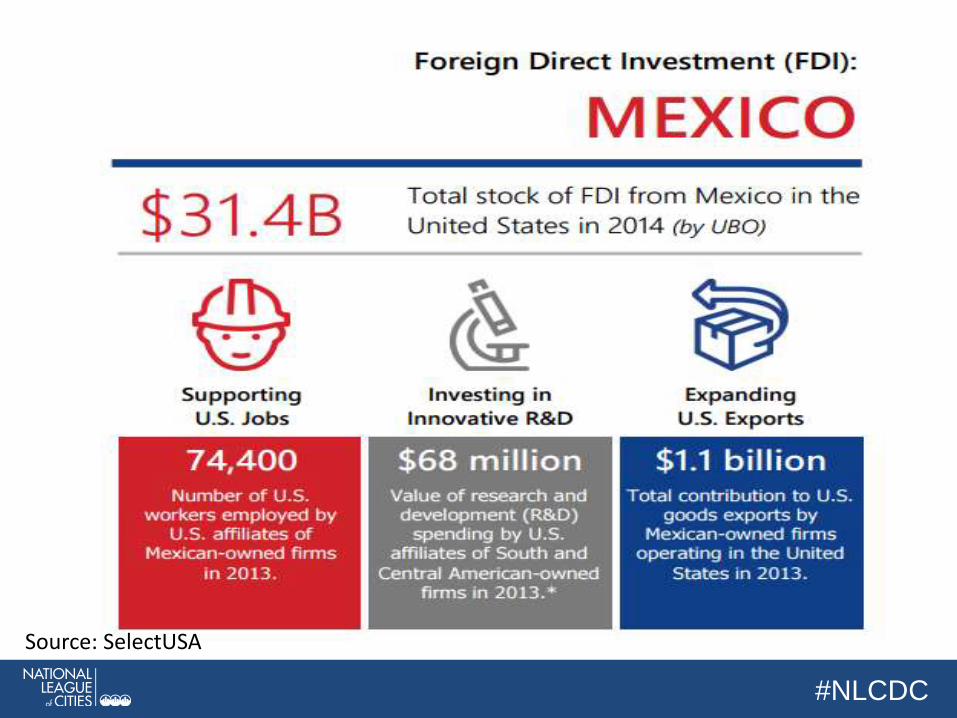
Source: SelectUSA
#NLCDC
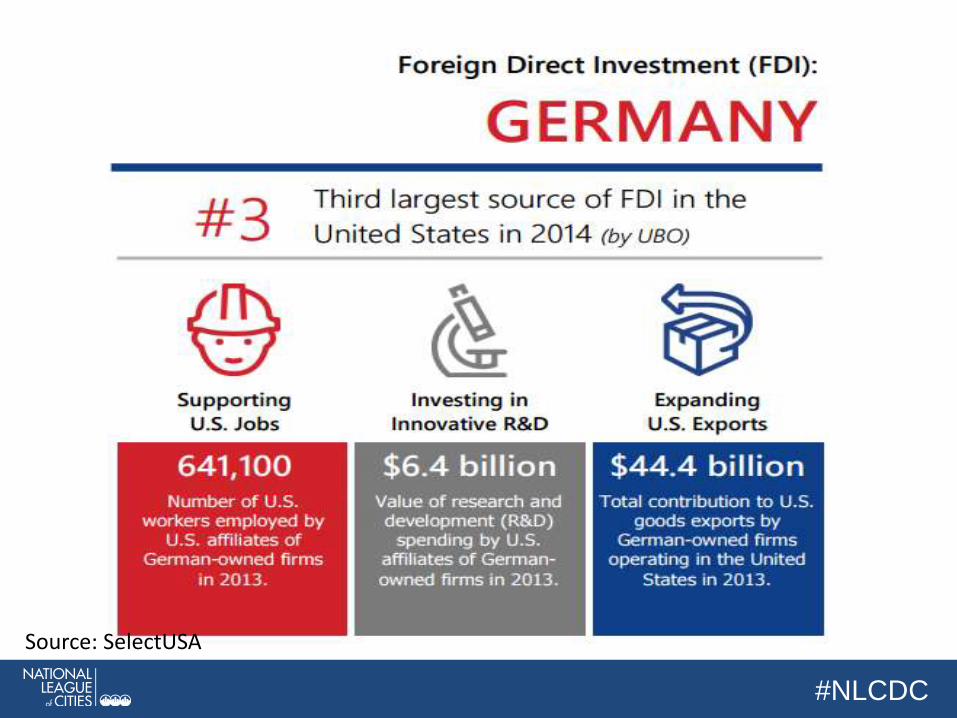
Source: SelectUSA
#NLCDC
Source: SelectUSA

#NLCDC
The Globalization Audit
• Create a list of current top industries for
region’s exports and current top industries
for region’s inbound investment
• Research a list of all foreign entities or
globally-oriented organizations, including:
– foreign consulates
– church groups going on mission
– foreign student groups

#NLCDC
Free Trade Agreements
Year Entered into Force FTA Signatory Markets
Signatory’s 2012 Nominal GDP* (million USD)
1985 Israel 240,900
1994 NAFTA: Canada, Mexico, United States 2,376,000
2004 Chile 268,200
2004 Singapore 276,500
2005 Australia 1,542,000
2006 Bahrain 27,030
2006 Morocco 97,530
2007 Peru 199,000
2009CAFTA – DR: Costa Rica, El Salvador, Guatemala, Honduras, Nicaragua, Dominican Republic, United States
206,730
2009 Oman 76,460
2010 Jordan 31,210
2011 Colombia 366,000
2011 Panama 36,250
2012 South Korea 1,156,000
Proposed: TPP
Australia, Brunei, Canada, Chile, Japan, Malaysia, Mexico, New Zealand, Peru, Singapore, United States, Vietnam
11,873,630
Proposed: TTIP
European Union and United States 16,417,100
*U.S. nominal GDP was $15.7 trillion in 2012. Source: CIA World Factbook
Source: SelectUSA
#NLCDC
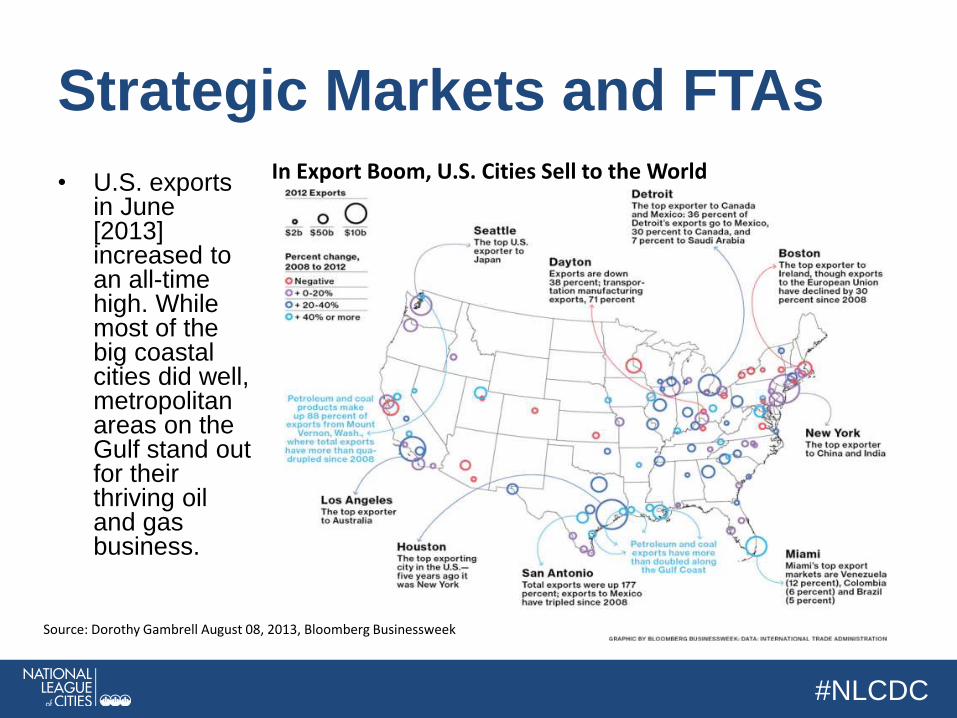
Strategic Markets and FTAs
• U.S. exports in June [2013] increased to an all-time high. While most of the big coastal cities did well, metropolitan areas on the Gulf stand out for their thriving oil and gas business.
In Export Boom, U.S. Cities Sell to the World
Source: Dorothy Gambrell August 08, 2013, Bloomberg Businessweek

#NLCDC
The Globalization Audit
• Compile a list of assets useful in
recruitment, including:
– Universities
– Utilities
• domestic & foreign
• business incubators
• soft-landing sites
• business associations
• ethnic-based associations
#NLCDC
The Globalization Audit
• Drafting process
• Engaging Stakeholders
• Varied outcomes are possible

#NLCDC
The Globalization Audit
• Once a strategy is created and agreed-
upon, it must be properly executed:
– New staff may need to be hired, or tasks
added to existing staff.
– Expectations should be set in-line with
dedicated budget and staff time.
– It’s useful to have a support network, use
EDOs in the state or region, or even at the
national level.
#NLCDC
Aftercare
• Eight Fundamentals of Aftercare:
– Create an organizational mindset
– Engage top leadership
– Conduct the “globalization audit”
– Ensure capacity and expertise
– Give foreign companies a “go-to”
– Deliver value-added services
– Engage continually
– Measure return on investment
#NLCDC
Global Engagement and
Partnership Building• Provide an initial one-stop international business
center for companies looking to enter the market and make the services easy to understand
• Raise the international IQ of local decision makers through periodic presentation, research and social media posts
• Highlight success stories with the local media, emphasizing local impact
• Support local education efforts to infuse international education into curriculum
• Identify and maintain local resources such as lawyers and accountants with international business expertise
#NLCDC
Partnership Building
• Bilateral Export Agreements
– Missouri Governor Jay Nixon
– Canada, Colombia, Peru
• Investment Agreements
– Florida Governor Rick Scott
– Chile, Spain, United Kingdom
• Using Trade Agreements
– NAFTA, TTIP, TPP
• Low-Budget Relationship Building

#NLCDC
Foreign Trade Zones
• FTZs present a holistic solution to the
uncertainties of inbound investment:
– Relief from Tariffs
– Speeds up supply chain velocity by
eliminating third parties
– Exemptions from certain taxes, with a tradeoff
of increased local investment
#NLCDC
EB-5 Immigrant Investor
Program
• EB-5 Regional Program Center
• US Citizenship and Immigration Services
(USCIS)
• Increasingly popular
#NLCDC
U.S. Views on FDI:
Federal and State-Level Policies
#NLCDC
Does the United States have an
official position on foreign direct
investment (FDI)?
#NLCDC
Open Investment Policy
“The United States reaffirms our open
investment policy, a commitment to treat all
investors in a fair and equitable manner
under the law.”- Statement by the President of the United States, June 20, 2011
#NLCDC
Open Investment Policy
• Upheld by administrations throughout U.S.
history
• Core obligation in bilateral investment
treaties (BITs).
• Ensures investors and investments
receive treatment no less favorable than a
country affords to its own investors and
investments.
#NLCDC
Federal: CFIUS
• “[t]o ensure national security while
promoting foreign investment and the
creation and maintenance of jobs.”
– Threat analysis
– Vulnerability analysis
– Risk analysis
#NLCDC
Federal: Immigration
• Comprehensive reform needed
• Politics
• Not Unique to FDI
Source: https://www.whitehouse.gov/issues/immigration/economy

#NLCDC
Federal and State-Level: Buy
America
• Supply chain regulations
• Increases taxpayer costs
• Penalizes small and large employers
#NLCDC
State-Level: Tax Havens
• Intended to limit tax avoidance by
multinational corporations
• The blacklist approach
• Misaligned with federal tax treaties
• Could decrease FDI within the state

#NLCDC
Questions?
#NLCDC
Please Keep in Touch
Aaron Brickman
Organization for International Investment [email protected]
(202) 659-1903
ofii.org
Twitter: @aaronbrickman
@InsourceJobsUSA
#NLCDCto follow along and comment on social media