bord bia periscop 7 study 2013-summary report · i tend to pick foods that ... germany, and nz are...
TRANSCRIPT


2 Introduction
PERIscope 2013 explores consumer behaviours & attitudes towards food, shopping and cooking.
Online survey conducted amongst 1,000 adults aged 18+ in Belgium.
Results are also available across nine other countries.
Survey covers topics such as: Eating at home, attitudes towards cooking, local food,
sustainability, the environment, grocery shopping and health & wellbeing.
Research carried out by Ipsos MRBI.
Please note, there may be discrepancies in relation to some of the ‘total’ figures within this
report. This is due to rounding (e.g. “slightly agree” at 45, “strongly agree” at 30, “agree” at
76).
For further information or queries please visit www.bordbia.ie or email [email protected]

4
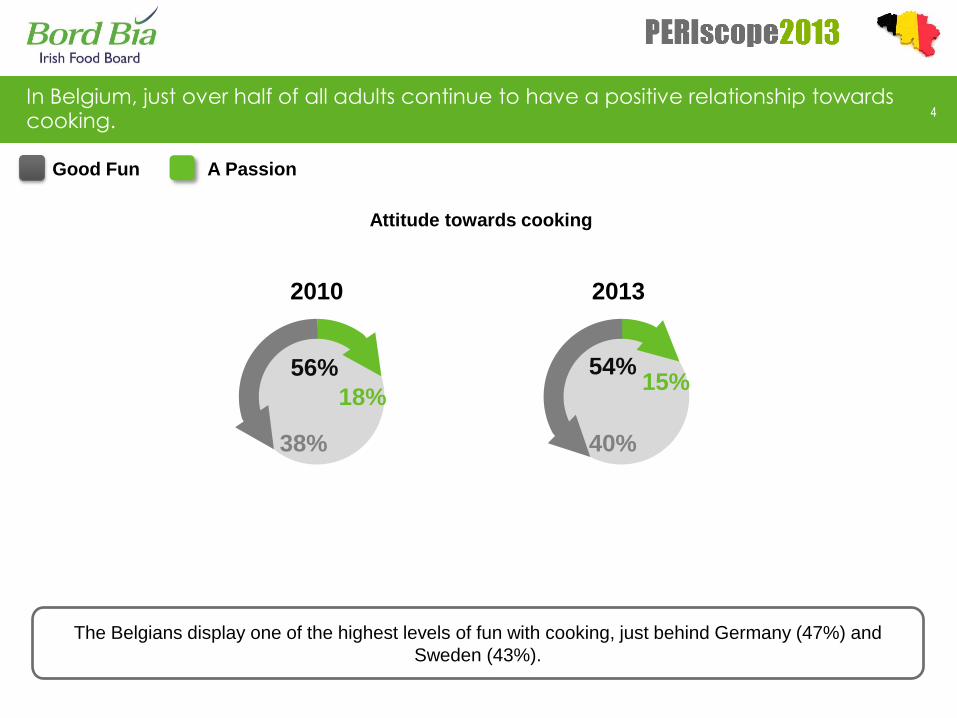
18%
38% 40%
15%
2010 2013
Good Fun A Passion
In Belgium, just over half of all adults continue to have a positive relationship towards cooking.
The Belgians display one of the highest levels of fun with cooking, just behind Germany (47%) and
Sweden (43%).
56% 54%
Attitude towards cooking

5
39 36
26 25
Would enjoy having a dinner party where I do all the cooking
Would be confident that I could produce a good Sunday roast
with all the trimmings
61
Level of cooking expertise
65
2010 2013
Belgium's cooking expertise (on the basis of dinner party hosting and producing meals with all the trimmings), is
in the bottom three countries.
In three years, overall levels of culinary expertise have declined slightly in Belgium.

6
55
26
45
29
% preparing a meal from scratch few times a week % preparing a meal from scratch once/ few times a day
2010 2013
81 74
Just under three quarters of Belgians prepare their meals from scratch few times a day/few times a week , a lower proportion than in 2010.
Compared to other countries in the PERIscope 2013 study, Belgium ranks fifth for
scratch cooking. NZ (81%) ranks first while the US (62%) ranks last.

15 14
9 9
7
On the basis of those who are scratch cooking more often, Belgium is displaying
somewhat poorer levels of scratch cooking than other countries.
Just over one in ten claim to be cooking from scratch more often than 12 months ago, a similar proportion to three years ago.
Frequency of cooking meals from scratch more often or less often compared to 12 months ago
2010 2013
Cooking from scratch more often
Cooking from scratch less often
8
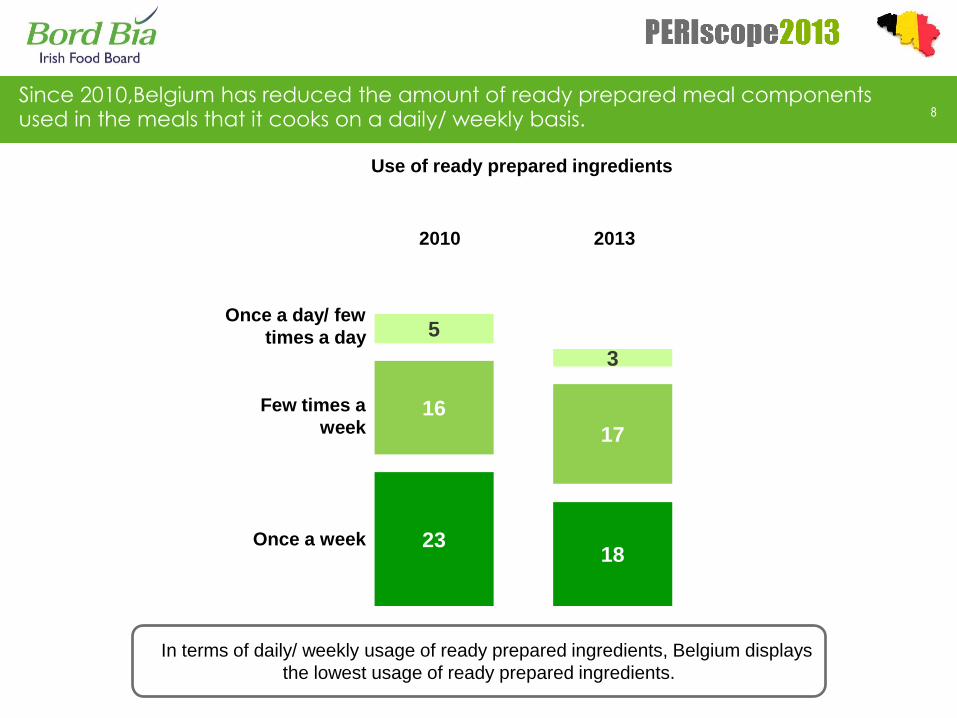
23 18
16
17
5
3
Once a day/ few
times a day
Few times a
week
Once a week
In terms of daily/ weekly usage of ready prepared ingredients, Belgium displays
the lowest usage of ready prepared ingredients.
2010 2013
Since 2010,Belgium has reduced the amount of ready prepared meal components used in the meals that it cooks on a daily/ weekly basis.
Use of ready prepared ingredients
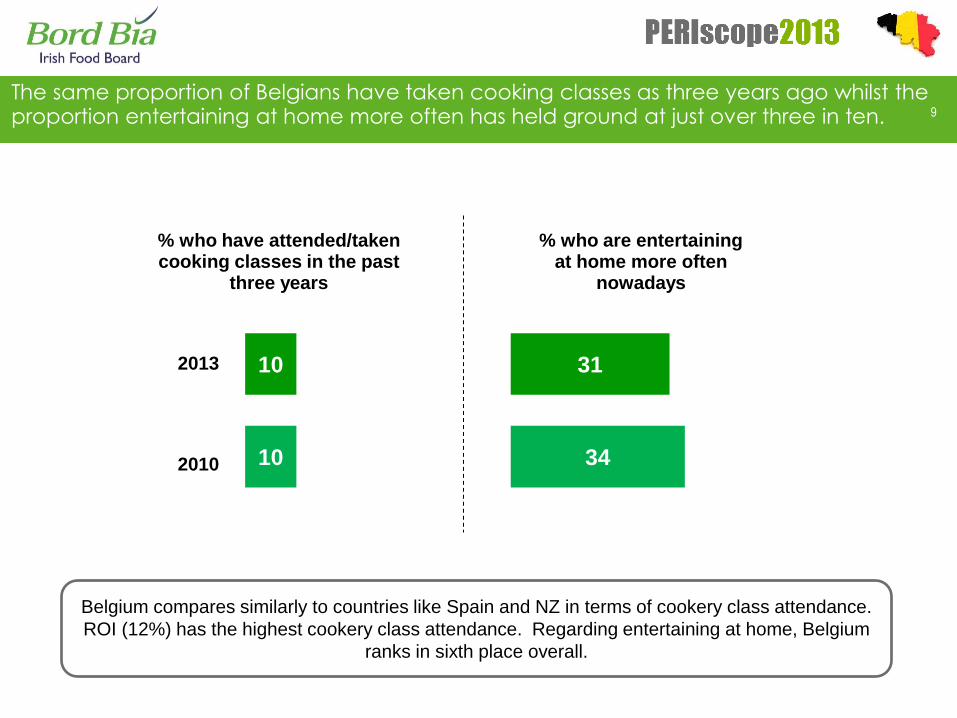
The same proportion of Belgians have taken cooking classes as three years ago whilst the proportion entertaining at home more often has held ground at just over three in ten. 9
10
10 2013
2010
Belgium compares similarly to countries like Spain and NZ in terms of cookery class attendance.
ROI (12%) has the highest cookery class attendance. Regarding entertaining at home, Belgium
ranks in sixth place overall.
% who have attended/taken cooking classes in the past
three years
34
31
% who are entertaining at home more often
nowadays
10
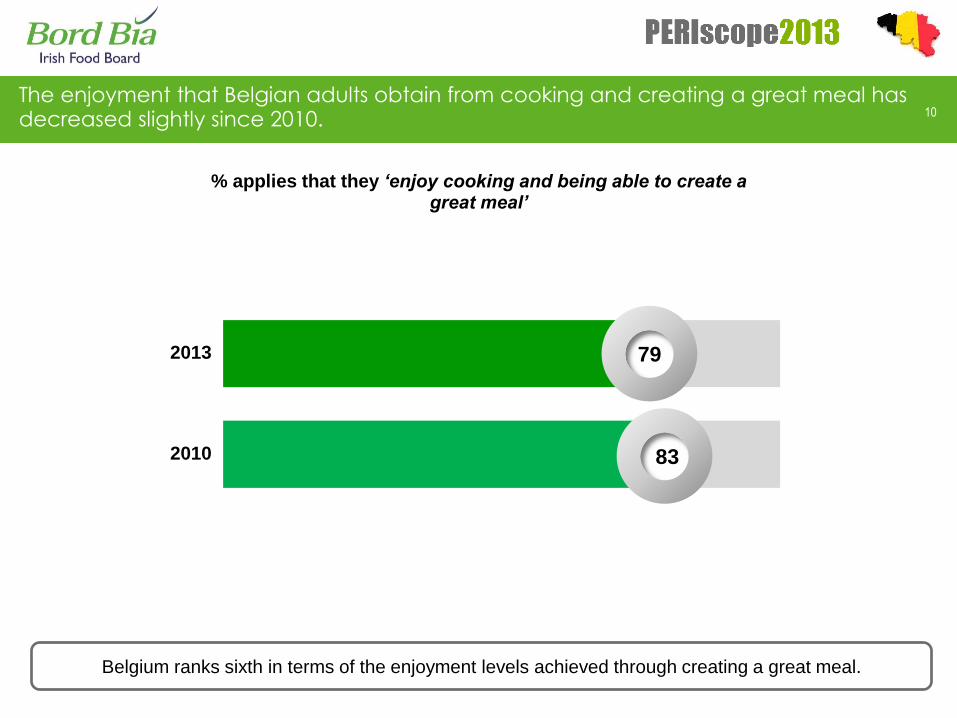
% applies that they ‘enjoy cooking and being able to create a great meal’
2013
2010 83
79
Belgium ranks sixth in terms of the enjoyment levels achieved through creating a great meal.
The enjoyment that Belgian adults obtain from cooking and creating a great meal has decreased slightly since 2010.

11
41 43
64 62
2010 2013 2010 2013
Food Processor Wok
Ownership levels of food processors and woks, amongst Belgian adults, have remained stable over the past three years.
Belgium displays a relatively average ownership level of food processors. In contrast it has the
second highest wok ownership, behind the Netherlands (70%).

70 69
12
I tend to pick foods that are quick to cook
I tend to pick foods that are
easy to prepare
%
Applies
79 77
2010 2013
Belgium ranks amongst the lowest countries when it comes to picking both foods that are quick to prepare
and quick to cook.
Levels of demand for food that is easy to prepare and quick to cook have been maintained at similar levels to 2010.
13
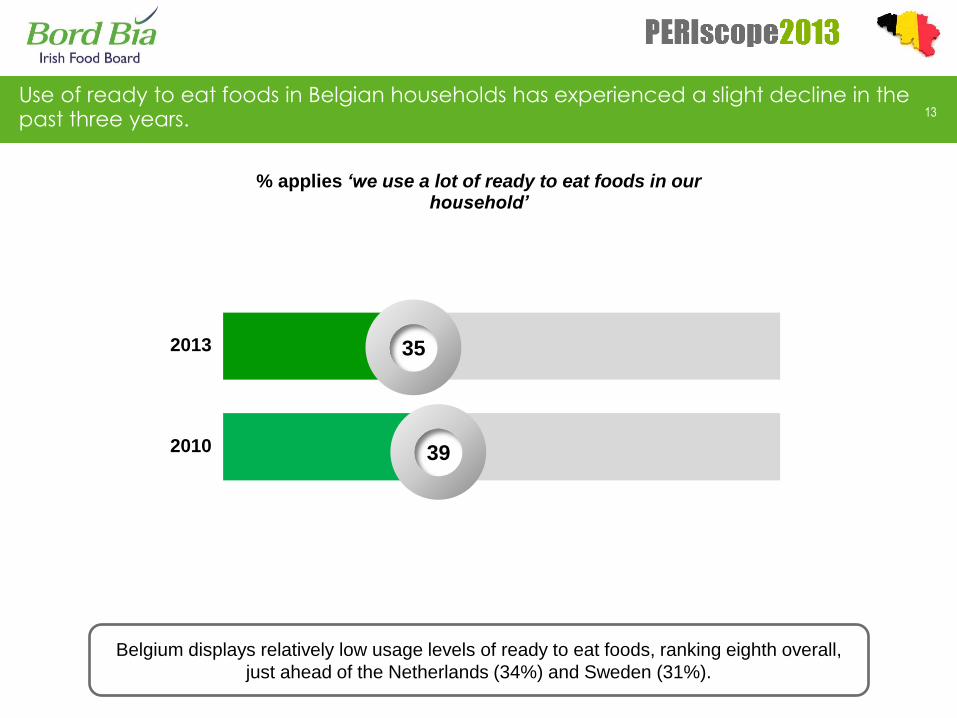
% applies ‘we use a lot of ready to eat foods in our household’
2013
2010 39
35
Belgium displays relatively low usage levels of ready to eat foods, ranking eighth overall,
just ahead of the Netherlands (34%) and Sweden (31%).
Use of ready to eat foods in Belgian households has experienced a slight decline in the past three years.

14
% applies that they ‘would often eat ready prepared/ convenience meals’
2013
2010 48
41
Eating convenience meals in Belgium is a relatively unpopular behaviour, particularly when
compared to countries like the US (71%) and Spain (69%).
The proportion who claim to often eat ready prepared/convenience meals has fallen by seven percentage points in three years.

15
7 6
32 33
More often
Less often
% eating ready meals/ convenience meals more/less often than 12 months ago
2010 2013
One third of Belgians claim to be eating ready meals/ convenience meals less often than 12 months ago, a similar level to 2010.
Belgium compares similarly to Sweden and the Netherlands in its consumption of ready meals/
convenience meals in the last 12 months.

16
% agree that convenience meals… ‘are a good substitute for home cooked meals when time is limited’
2013
2010 57
56
In terms of agreement with the idea that convenience meals can be a good substitute for home
cooked meals, Belgium ranks fifth.
The proportion who consider convenience meals to be a good substitute for home cooked meals when time is limited remains at just over half of all adults.

17
Convenience foods……
… have poor quality ingredients
29% 33% 2010 2013
… taste great
23% 26% 2010 2013
… are expensive
72% 74% 2010 2013
… are good value for money
18% 20% 2010 2013
The majority of Belgians consider convenience foods to be expensive. One third believe that they contain poor quality ingredients. One quarter believe they taste great.
Belgium displays particular low levels of agreement when it comes to claims that convenience meals ‘taste
great’ or are ‘good value for money’.


19
2010 2013
Importance of buying ‘local’ produce when shopping
Total
importance
Very
important
54%
17%
51%
15%
The overall importance of buying local food has fallen slightly in the past three years.
France (73%) places the most importance on buying local. At just over half of all adults, Belgium
ranks eighth, just ahead of NZ (48%) and the Netherlands (27%).

20
17 18
23 28
53 49
7 5
2010 2013
Daily
Few times/ once a week
Few times/ once a month
Less often/ never
Frequency of ‘Local Food’ Purchases
The frequency with which local food is bought in Belgium has remained stable over the past three years. Those who buy local less often (than monthly)/ never is steady.
Sweden, Spain, Germany, and NZ are the most frequent purchasers of local food
purchases on a daily/weekly basis. Belgium ranks fifth overall.

21
More than 4 in 10
believe local
food is food that
is…
45% … made within the county in which I live
Just over one
third believe it is
food that is… 36% … made within a close proximity to where I live
Much less believe
local food to refer
to food that is …
29% … available in farmers’ markets
27% … made within a 20 mile radius from where I live
22% … made within the province I live
6% … made within Europe
In Belgium, ‘local food’ is a proxy primarily for food that is made within one’s home country, or alternatively, within a very close distance from one’s home.

22
Checking for Country of Origin label
26 24
(74) (75)
55 52
19 23 Always check
Sometimes check
NET (check for quality symbol)
Never check
2010 2013
Sweden ranks first (92%) for checking country of origin information. In contrast,
Belgium ranks sixth.
Checking for the country of origin label is done by three quarters of Belgian shoppers.

23
20 26
(80) (74)
59 56
21 18 Always check
Sometimes check
NET (check for quality symbol)
Never check
Checking for Symbol of Quality label
2010 2013
In Belgium, checking for the symbol of quality has fallen over the past three years. The proportion who ‘never check’ represents one quarter of all grocery shoppers.
Belgium ranks third behind, France (76%), ROI (76%), Spain (82%) and Sweden
(82%) for checking the symbol of quality on food products.

24
% applies that ‘it is important to spend time over dinner as a family’
2013
2010 94
92
Overall, spending time eating dinner together as a family is important in all countries, with six out of the
ten countries displaying more than or equal to ninety per cent agreement.
At more than ninety per cent, the importance placed on eating dinner together as a family remains considerably high in Belgium.


55 40
26
% never heard of food miles
% who sometimes try to buy food with low food miles
TOTAL % who buy foods with low food miles
% who buy foods with low food miles in 2013
2010 2013
25
18
34
19
2010 2013
Belgium ranks amongst the highest for awareness of food miles. It ranks joint first with Germany in terms of
purchases of food with low food miles.
Awareness of food miles has shown a significant advancement since 2010. The percentage buying foods with low food miles has risen by nine percentage points in 2013.

27
15 15
% never heard of sustainability
% who sometimes try to buy food with sustainable features
TOTAL % who buy foods with sustainable features
% who buy foods with sustainable features in 2013
2010 2013
43
35
48
23
2010 2013
Belgium ranks third for awareness of the term sustainability. It ranks as one of the highest purchasers of
‘sustainable’ products, alongside France, NZ and Germany
Sustainability is a well known term amongst Belgians. The proportion claiming to buy foods with sustainable features has been risen slightly.

33 19
28
% never heard of carbon footprint
% who sometimes try to buy food with low footprint
TOTAL % who buy foods with low footprint
% who buy foods with low footprint in 2013
2010 2013
32
25
41
23
2010 2013
Belgium is behind only NZ for awareness of carbon footprint. Purchases of low footprint products are
highest in Belgium.
The numbers claiming to have never heard of carbon footprint have reduced in the last three years. There has also been a growth in low footprint purchases during this time.

29
% who agree that they are more conscious of environmental issues in
their choice of products
61% 54%
2010 2013
% who agree that they prefer to buy from companies that are aware of the
impact of environmental issues
60% 50%
2010 2013
Belgium ranks joint fifth in terms of its consciousness of environmental issues. The preference of
buying from environmentally aware companies places Belgium in seventh place overall.
Being environmentally conscious and buying from companies who are environmentally aware have both declined since 2010.
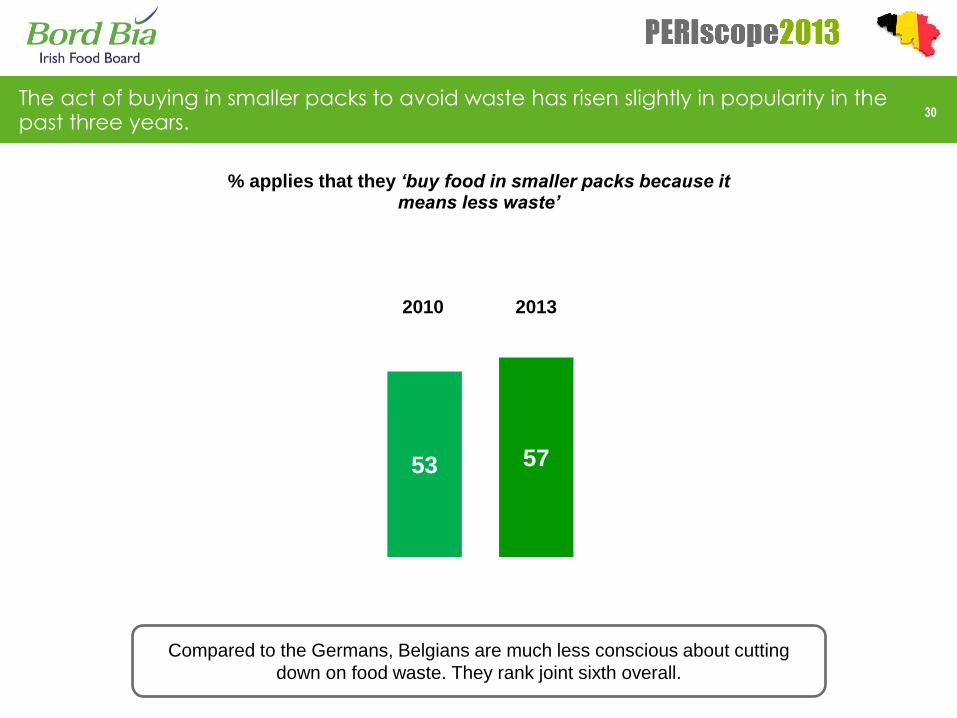
The act of buying in smaller packs to avoid waste has risen slightly in popularity in the past three years.
30
53 57
Compared to the Germans, Belgians are much less conscious about cutting
down on food waste. They rank joint sixth overall.
2010 2013
% applies that they ‘buy food in smaller packs because it means less waste’

31
I try to buy Fair Trade products/brands whenever they are available
16
13 2013
2010
60
% applies a lot % NET applies
61
The Belgians rank fifth overall when it comes to efforts to buy Fair Trade products.
Overall, efforts by Belgians, to buy Fair Trade products have remained unchanged since 2010. Only a small percentage admit to concerted efforts to buy Fair Trade.


33
When I shop the first thing I look for is price
35
40
19
19 2013
2010
59
% agree slightly
% agree strongly
54
Looking for price as a ‘first thing’ has average popularity in Belgium compared to all other
countries in the PERIscope 2013 study.
Having price as a primary influencer when grocery shopping has increased in importance in Belgium since 2010.

34
43
47
22
17 2013
2010
64
Quality of fresh food is more important than price
% agree slightly
% agree strongly
65
Belgium displays average agreement levels with the idea that quality is more important than price. It ranks
fifth overall. ROI (79%) has the highest level of agreement while the Netherlands (51%) has the lowest.
Compared to 2010, placing the quality of fresh food ahead of price has maintained the same level of popularity amongst grocery shoppers.

35
42
53
42
26 2013
2010
79
I most often go to the same store but look for the best value for money I can get
% agree slightly
% agree strongly
83
Obtaining value for money in the same store is a very popular shopping
behaviour in Belgium. It ranks third behind NZ (84%) and ROI (81%).
In Belgium, getting value for money in the same store is important for almost eight in ten grocery shoppers.
36
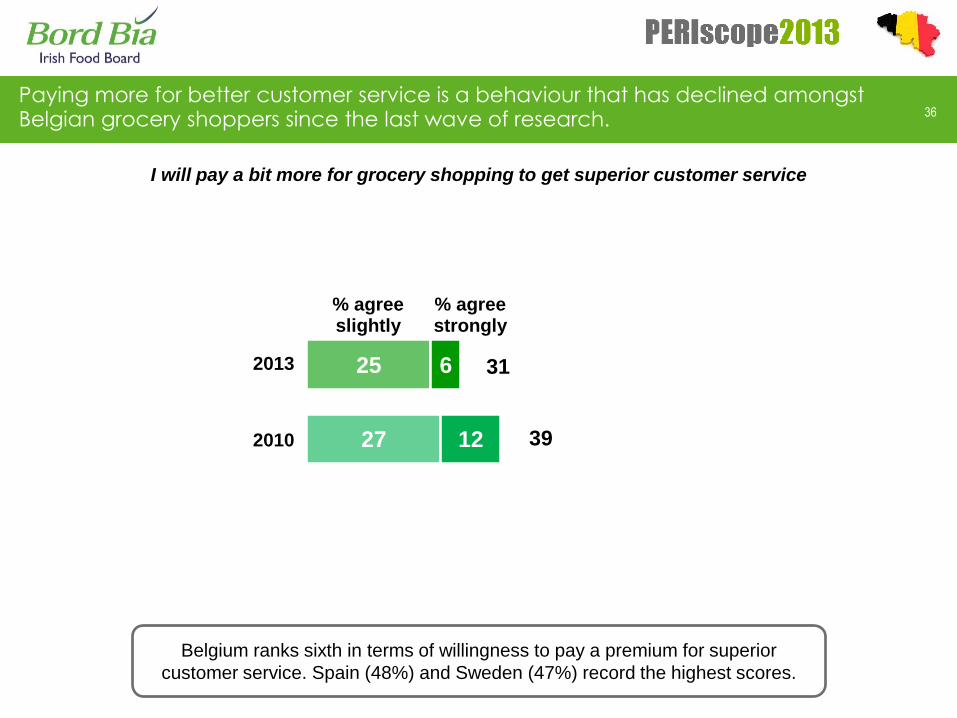
I will pay a bit more for grocery shopping to get superior customer service
% agree slightly
% agree strongly
2013
2010 27
25
12
6 31
39
Belgium ranks sixth in terms of willingness to pay a premium for superior
customer service. Spain (48%) and Sweden (47%) record the highest scores.
Paying more for better customer service is a behaviour that has declined amongst Belgian grocery shoppers since the last wave of research.

37
I tend to buy on impulse if I think products are cheap
% agree slightly
% agree strongly
26
25
9
7 2013
2010
31
35
Belgium ranks eighth in terms of its susceptibility towards buying cheap products
on impulse. Spain (26%) and France (17%) follow thereafter.
Buying products on impulse is a shopping behaviour applicable to just three in ten grocery shoppers.
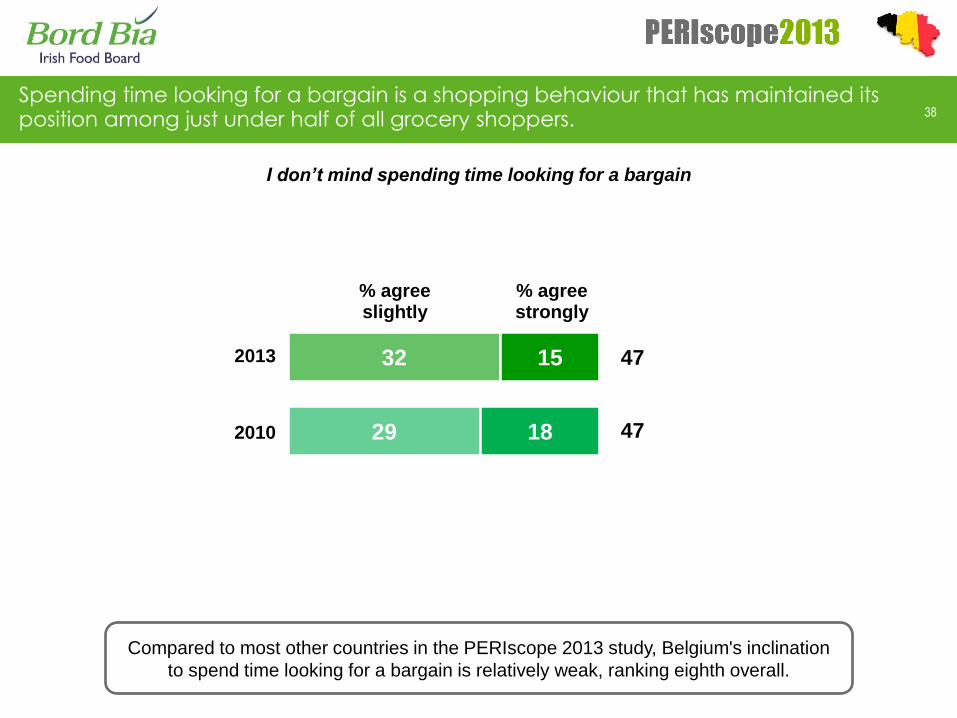
38
I don’t mind spending time looking for a bargain
29
32
18
15 2013
2010
47
% agree slightly
% agree strongly
47
Compared to most other countries in the PERIscope 2013 study, Belgium's inclination
to spend time looking for a bargain is relatively weak, ranking eighth overall.
Spending time looking for a bargain is a shopping behaviour that has maintained its position among just under half of all grocery shoppers.

3 4
9
17 67
39
How often have they ordered
their grocery shopping online?
13% of Belgian adults
(with internet
access) have
ever ordered their
grocery shopping
online.
Every day/ few
times a week
2-3 times a
month
Once a week
About once a
month
Less often
Just over one in ten Belgians have ordered their grocery shopping online. More than two thirds of these shop online for grocery items less often than once a month.
Belgium ranks fifth for the percentage of people who have ordered their shopping online. It is
considerably behind Spain (30%) and GB (28%).

40
13%
Downloaded
Food App
66%
Downloaded
Recipe
16% 18% 19% 13% 2% 3% 4% 4%
Past
Week
Past
Month
Past 6
Months
Longer
Ago
Past
Week
Past
Month
Past 6
Months
Longer
Ago
Most recent download activity
Using the internet to access recipes is done by two thirds of Belgians. Downloading food apps is much less popular.
Belgium is in the bottom four for the percentage of people who have downloaded a recipe. It ranks in
the bottom two for the percentage who have downloaded a food app.
42
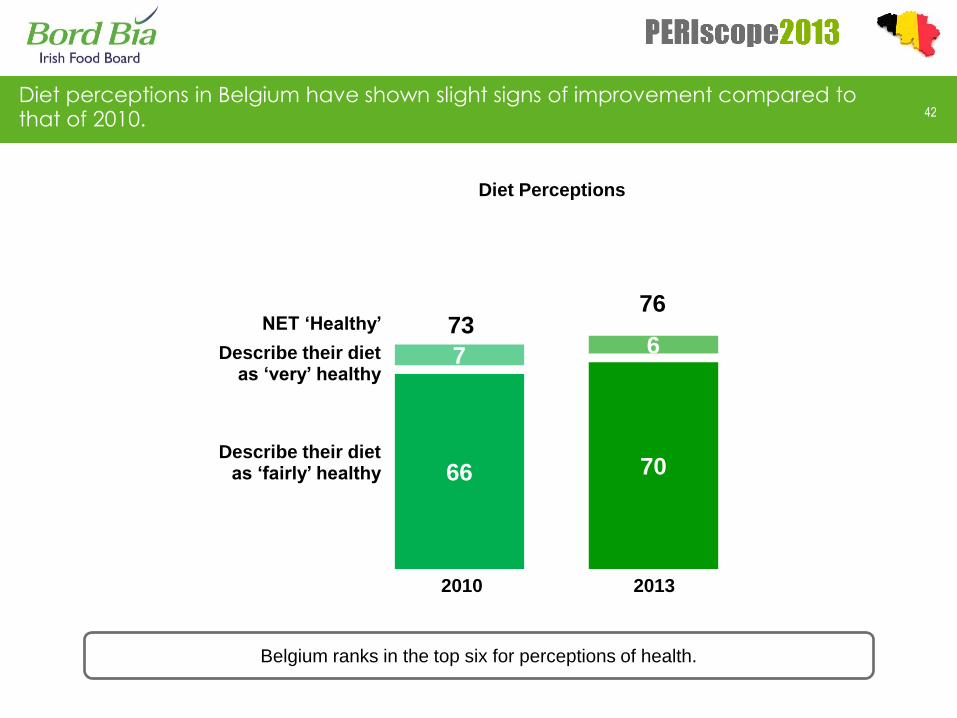
Diet Perceptions
66 70
7 6
76
2010 2013
NET ‘Healthy’
Describe their diet as ‘very’ healthy
Describe their diet as ‘fairly’ healthy
73
Belgium ranks in the top six for perceptions of health.
Diet perceptions in Belgium have shown slight signs of improvement compared to that of 2010.

28 25
6 6
43
My eating habits are more healthy
My eating habits are less healthy
Changes in eating habits in last 12 months
2010 2013
Belgium ranks seventh overall when it comes to claims that its eating habits are
healthier than before.
One quarter of Belgians believe their eating habits to be more healthy in the last 12 months; a slight decline on 2010 levels.

20
21
44
I eat at least 5 portions of fruit and veg per day
% applies a lot NET % applies
Five countries claim to have more than seven in ten adults who make efforts to eat the
recommended ‘5 a day’. Belgium falls outside this cohort and is positioned sixth overall.
2013
2010
67
65
Efforts to eat at least 5 portions of fruit and veg each day are displayed by just over two thirds of Belgian adults.

45
92
88
78
92
79
Dairy foods
(milk/cheese) are an
important part of my
diet
I try to eat a lot of fruit
and vegetables
I always try to eat high
fibre foods
To be healthy it is
important to eat
properly
I always try to eat a
balanced diet
% applies
In Belgium, dairy foods and high-fibre foods are consumed much less than fruit and veg. The majority believe having a balanced diet and eating properly are important.

46
I try to limit the amount of fast food that I consume
2013
2010 59
58
30
34 92
89
% applies a lot % applies a little
While all countries are making efforts to reduce fast food consumption, Belgium
and Spain (94%) claim to be making the most effort.
Endeavours to limit fast food consumption in Belgium are applicable to more than nine in ten adults.

47
% applies that ‘always look for low fat options when buying
food products’
2013
2010 71
66
54
57
54
49
% applies that they ‘think of the calories in
what they eat’
% applies that ‘if a label says ‘low fat/reduced fat’ then the product
will always be the healthy choice’
2013
2010
2013
2010
Belgium displays relatively average tendencies to look for low fat products when shopping. Its level of
assertion regarding low fat equalling the healthy choice is also average. It ranks third overall for the amount of
thought given to the calories in the food eaten.
There has been a slight decline in both the proportion claiming to always look for low fat options and the proportion who believe that low fat equals the healthy choice.

48
I am concerned about my children becoming obese
2013
2010 34
35
25
14
% agree slightly % agree strongly
49
59
Belgium ranks second in terms of concern about one’s children becoming obese. Its
levels of concern are similar to that of the US (48%) and NZ (46%).
Concerns about ones children becoming obese have fallen from just under six in ten in 2010 to just under five in ten in 2013.
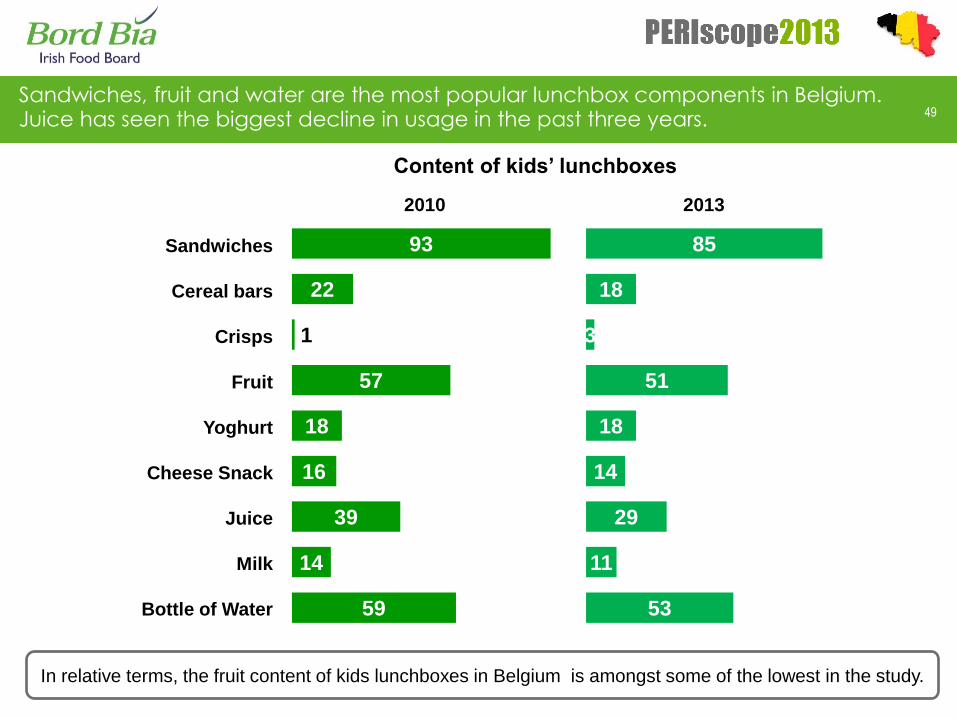
49
Sandwiches
Cereal bars
Crisps
Fruit
Yoghurt
Cheese Snack
Juice
Milk
Bottle of Water 59
14
39
16
18
57
1
22
93
2010
Content of kids’ lunchboxes
53
11
29
14
18
51
3
18
85
2013
In relative terms, the fruit content of kids lunchboxes in Belgium is amongst some of the lowest in the study.
Sandwiches, fruit and water are the most popular lunchbox components in Belgium. Juice has seen the biggest decline in usage in the past three years.

9
9
50
Choosing healthy food to eat is limiting and boring
% applies a lot NET % applies
Belgium ranks sixth for its assertion that healthy food equals food that is limiting and boring.
It is therefore one of the more positive countries when it comes to healthy foods.
2013
2010
46
48
The belief that choosing healthy food is limiting and boring is an opinion that is applicable to just under half of Belgian adults.

51
I would like manufacturers to help me to eat healthy
2013
2010 34
30
47
50 80
81
% applies a lot % applies a little
Spain (94%), Germany (88%), France (81%) and Belgium rank as the top
four countries that would like manufacturers to help them to eat healthy.
The Belgians continue to maintain a strong preference for having manufacturers help them to eat healthy.

21
20
52
I am willing to pay a bit more for healthy food and beverages (as long as they taste good)
There are six countries in which more than 70% of adults are willing to pay more
for healthy food and beverages. Belgium falls just outside this group.
2013
2010
69
76
Willingness to pay a premium for healthy foods is a behaviour that has declined substantially in popularity in the past three years.
% applies a lot NET % applies

53
I eat healthy to take control of my life
% agree slightly % agree strongly
2013
2010 45
46
16
20 65
61
Belgium ranks in the top three in terms of agreeing that it eats healthy to take control of life.
Eating healthy to take control of one’s life is a concept relevant to almost two thirds of Belgians.

67 69
54
A good diet can help your mental health
68 75
2010 2013
% Agree
I eat to enhance mental alertness and spiritual
wellbeing
Belgium displays one of the lowest levels of support for the idea that a good diet can help your mental
health. It ranks much higher (third) in its belief that what one eats can be important for spiritual wellbeing.
The relationship between diet and mental health and the link between food and spiritual well-being are viewed with increasing strength in Belgium.

55
74
69 2013
2010
% applies that they ‘always check the nutritional labelling on food before buying them’
Belgium's propensity to check the nutritional labelling on food before purchase
ranks fourth overall.
The Belgian grocery shopper of 2013 is slightly less inclined, than in 2010, to check the nutritional labelling on food prior to purchase.

56
% applies that they ‘often find it difficult to understand
nutritional claims on packaging’
76
74 2013
2010 75
73
% applies that they ‘often find it difficult to understand labelling
on food’
Belgium ranks third both in terms of difficulty in understanding nutritional claims
on packing and in understanding labelling on food.
Since 2010, Belgians are continuing to find it difficult to understand nutritional claims on packaging and food labelling.

57
91 80
5
8
4 12
Weekly
Less often
Never/ don’t know
Frequency of purchase of
Gluten Free products
Frequency of purchase of
‘Free From’ products
2013 2013
Purchases of gluten free products are amongst the lowest of all countries surveyed. Belgium ranks fifth for
purchases of ‘free from’ food.
Gluten free products are much less popular than ‘free from’ products. Weekly purchases of ‘free from’ products are three times that of gluten free products.

TAKEAWAYS

13-035911/Bia Periscope Study 2013 Multicountry Report
# 1 Building the food
relationship
• Can see the fun in cooking
but lack confidence to
advance expertise or extend
to social dimension.
• Scope to advance scratch
cooking, particularly in
context of low usage of
convenience foods and
negative attitudes towards
this food type.
• Opportunity to advance skills,
confidence and enjoyment
through technology
inspiration.

13-035911/Bia Periscope Study 2013 Multicountry Report
#2
Local failing to
connect
• ‘Local’ concept weak in
importance and
consideration.
• Failing to connect with the
origin of food as a shopping
influencer or decision aid.
• Disengaged with concept of
sourcing and transparency.
• Potential to enhance
importance of local by
connecting benefits to quality
and value.

13-035911/Bia Periscope Study 2013 Multicountry Report
#3 Environmental
connections
• High levels of engagement
with food miles, sustainability
and carbon footprint.
• Articulating what matters
through purchases of these
products.
• Will respond to specific
environmental subject (i.e.
carbon footprint) more so than
sweeping environmental label.

13-035911/Bia Periscope Study 2013 Multicountry Report
#4
Helping the
shopper
• Slightly disengaged with
shopping for food.
• Potential to be motivated by
triggers (price promos) in-store
are somewhat unpredictable.
• Value for money dominates
the grocery shopping psyche.
• In-store experience affected
by high levels of difficulty in
understanding food
information/ labelling and
need for manufacturers to
provide more help.

13-035911/Bia Periscope Study 2013 Multicountry Report
#5 Interlocking
consumer health
• Evidence of a disconnection
between desire to be healthy
and efforts to be healthy.
• Relatively detached from
‘healthy’ (re: low fat, high fibre,
‘5 a day’), connection to
mental health. Both affecting
willingness to pay and appetite
for these products.
• Seeking help from
manufactures in the area of
health.
