border security efforts
TRANSCRIPT
Slide 1
Border Security in the 21st Century
Our Border Security Efforts
The Past
The Present
The Future
Slide 2
Slide 3
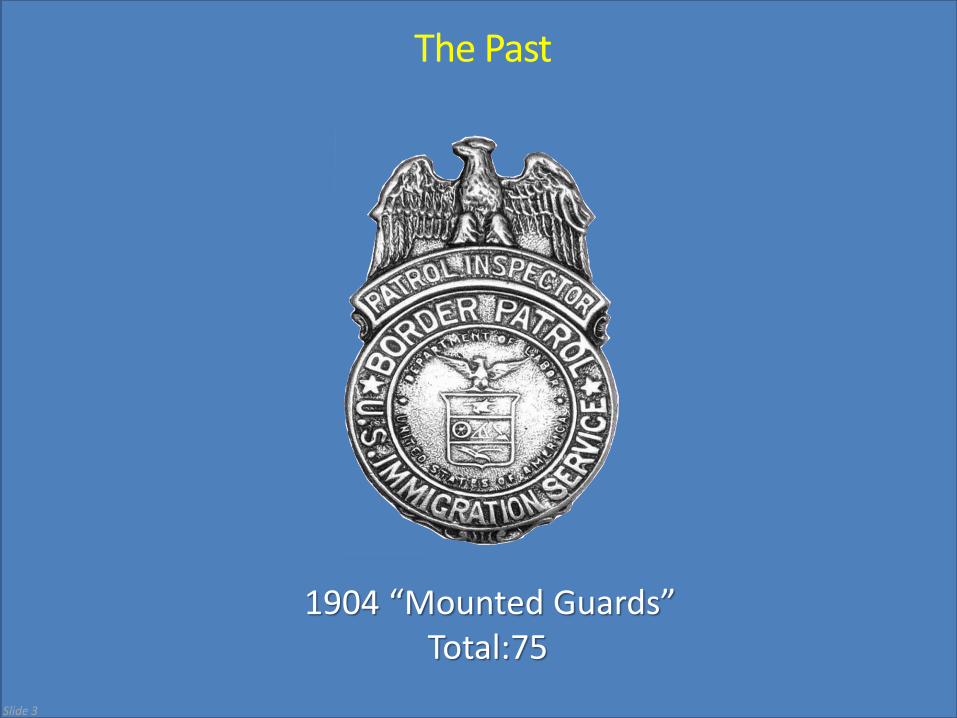
The Past
1904 “Mounted Guards” Total:75
Slide 4
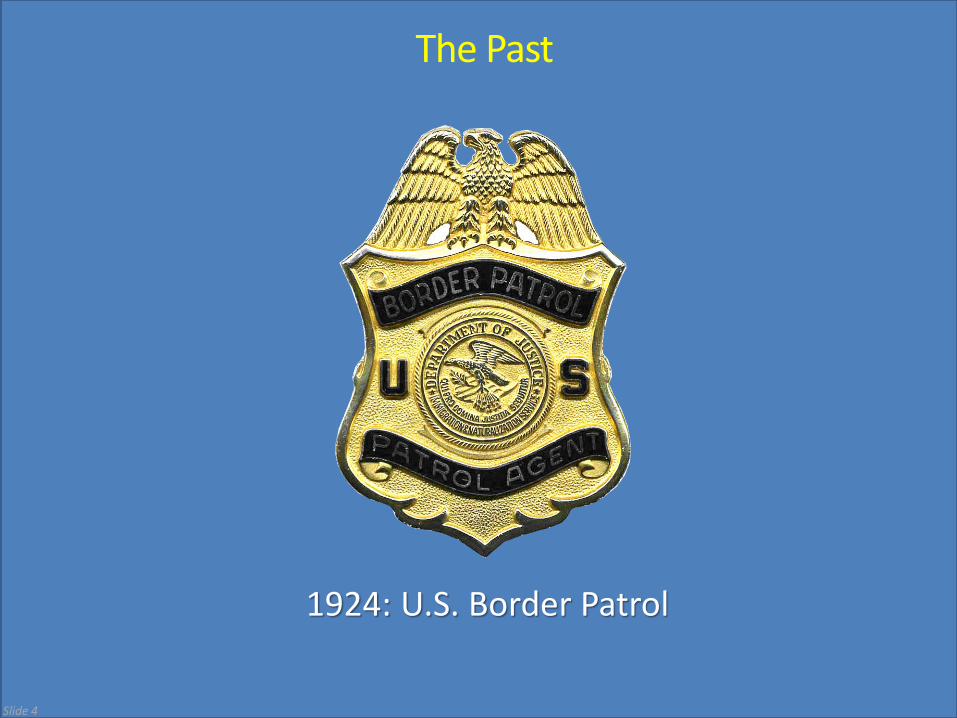
The Past
1924: U.S. Border Patrol
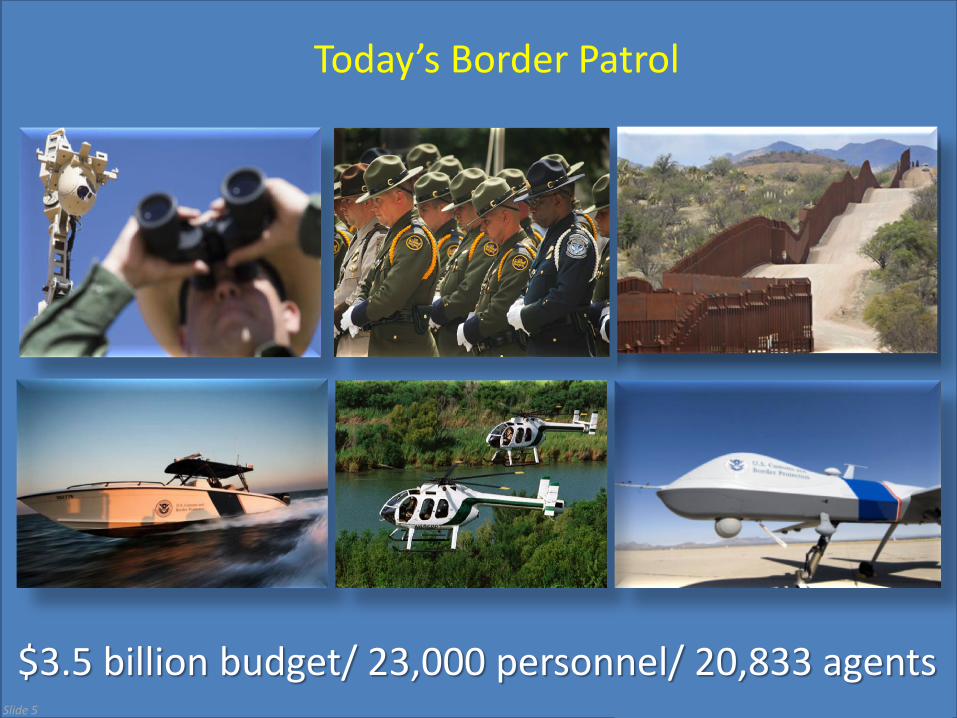
Today’s Border Patrol
$3.5 billion budget/ 23,000 personnel/ 20,833 agents Slide 5
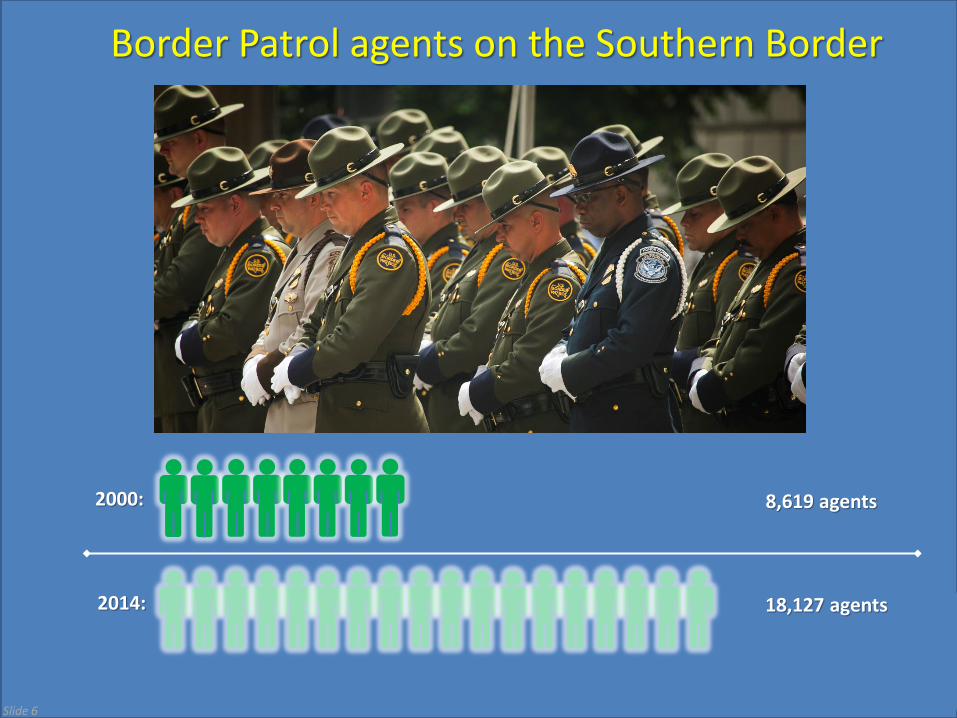
Border Patrol agents on the Southern Border
2000:
2014:
8,619 agents
18,127 agents
Slide 6
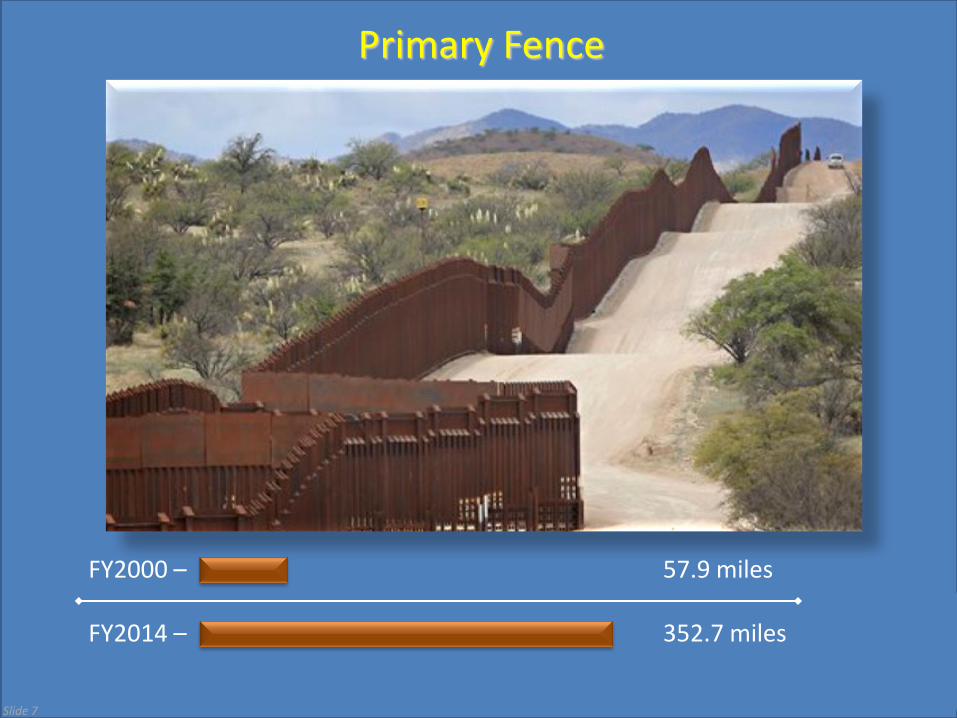
Primary Fence
FY2000 – 57.9 miles FY2014 – 352.7 miles
Slide 7
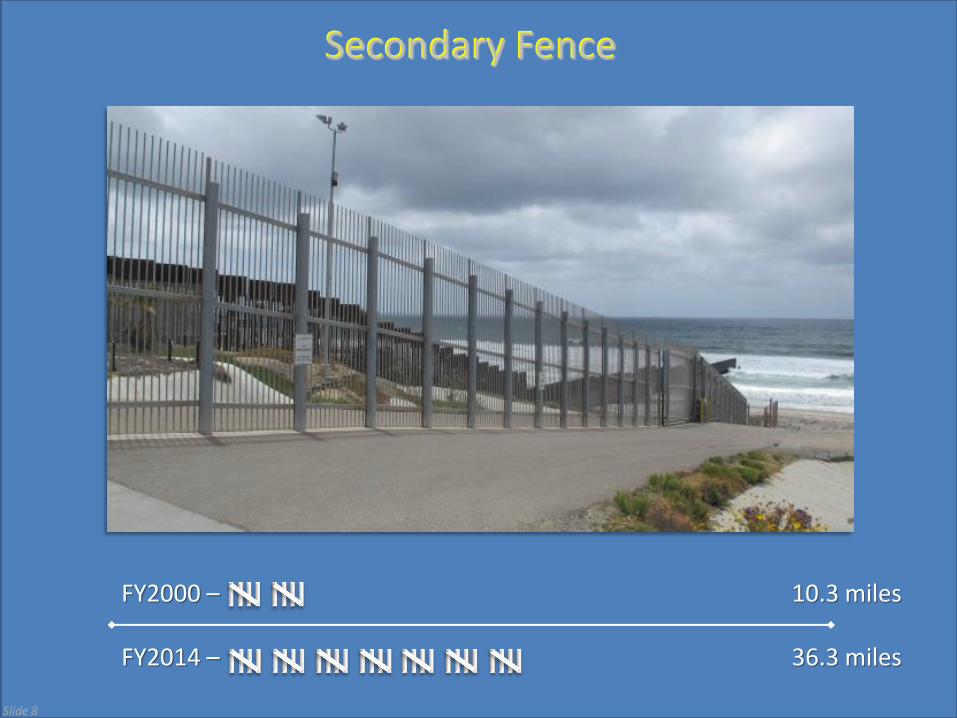
Secondary Fence
FY2000 – 10.3 miles FY2014 – 36.3 miles
Slide 8
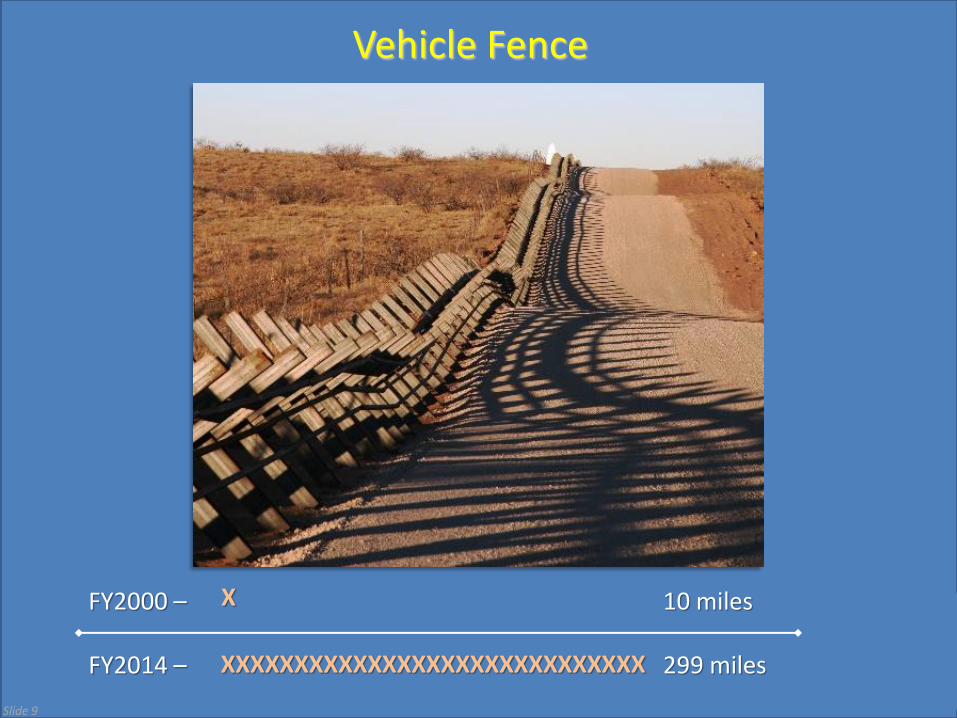
Vehicle Fence
FY2000 – 10 miles FY2014 – 299 miles
X
XXXXXXXXXXXXXXXXXXXXXXXXXXXXX
Slide 9
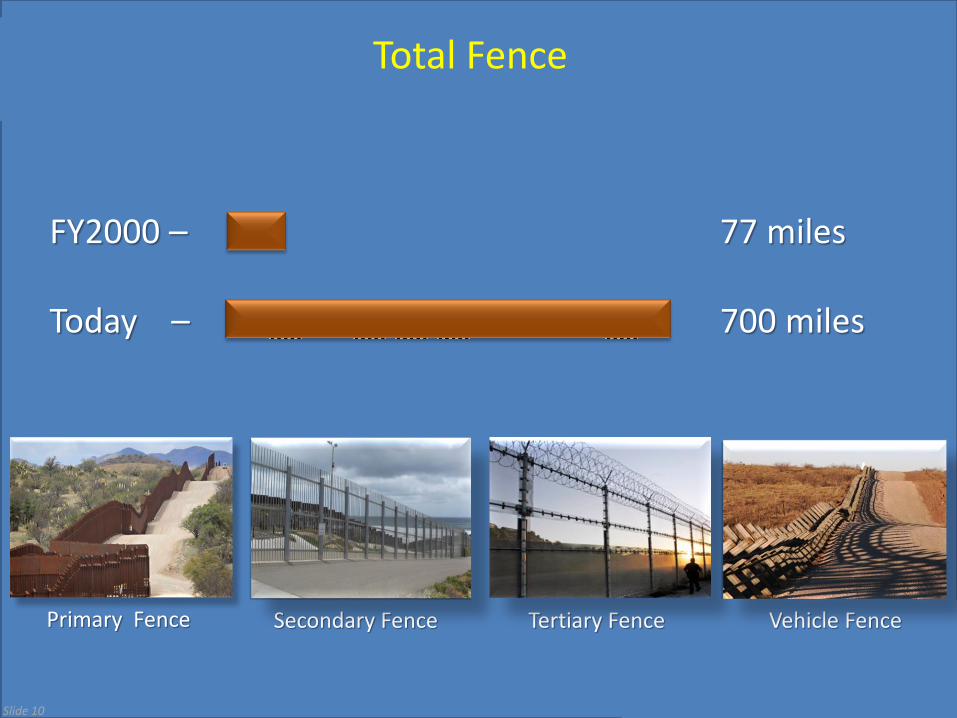
Total Fence
FY2000 – 77 miles Today – 700 miles
Primary Fence Secondary Fence
Slide 10
Tertiary Fence Vehicle Fence
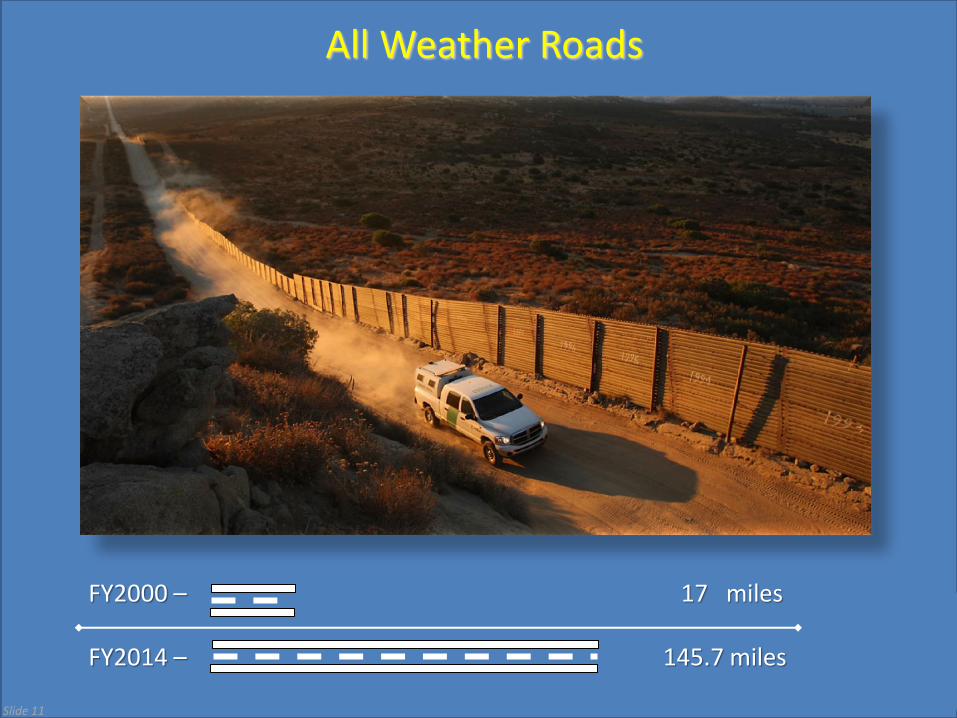
All Weather Roads
FY2000 – 17 miles FY2014 – 145.7 miles
Slide 11
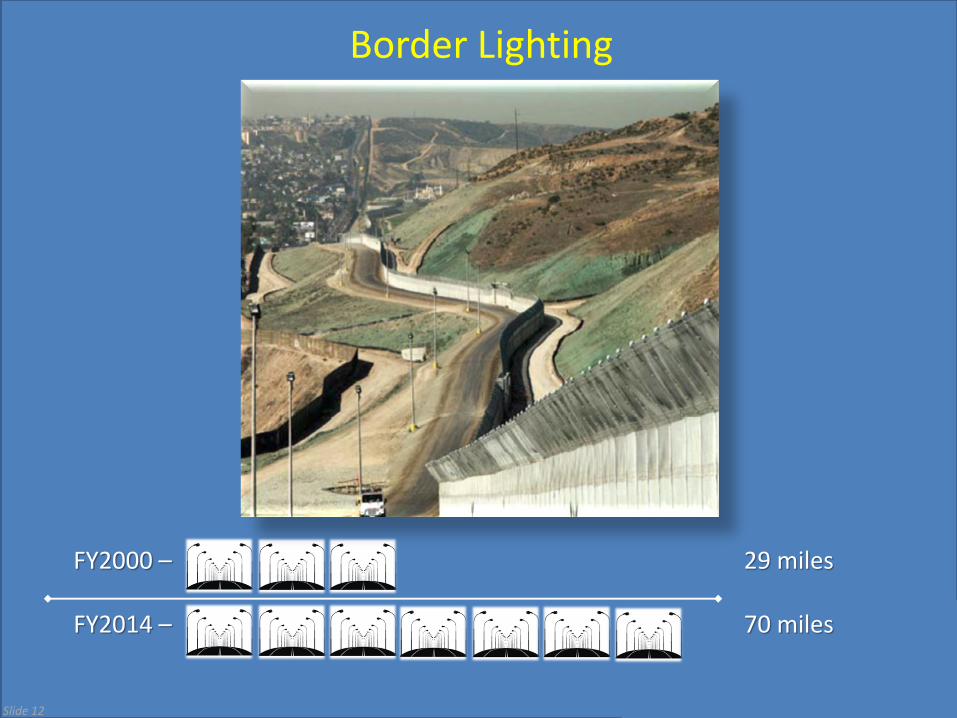
Border Lighting
FY2000 – 29 miles FY2014 – 70 miles
Slide 12
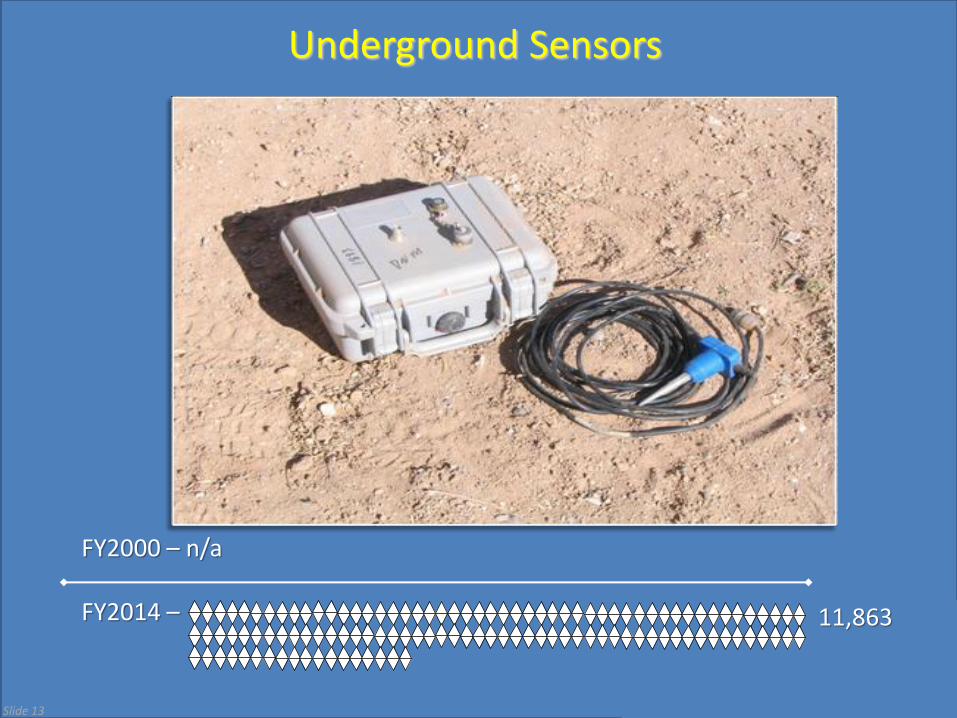
Underground Sensors
FY2000 – n/a FY2014 – 11,863
Slide 13
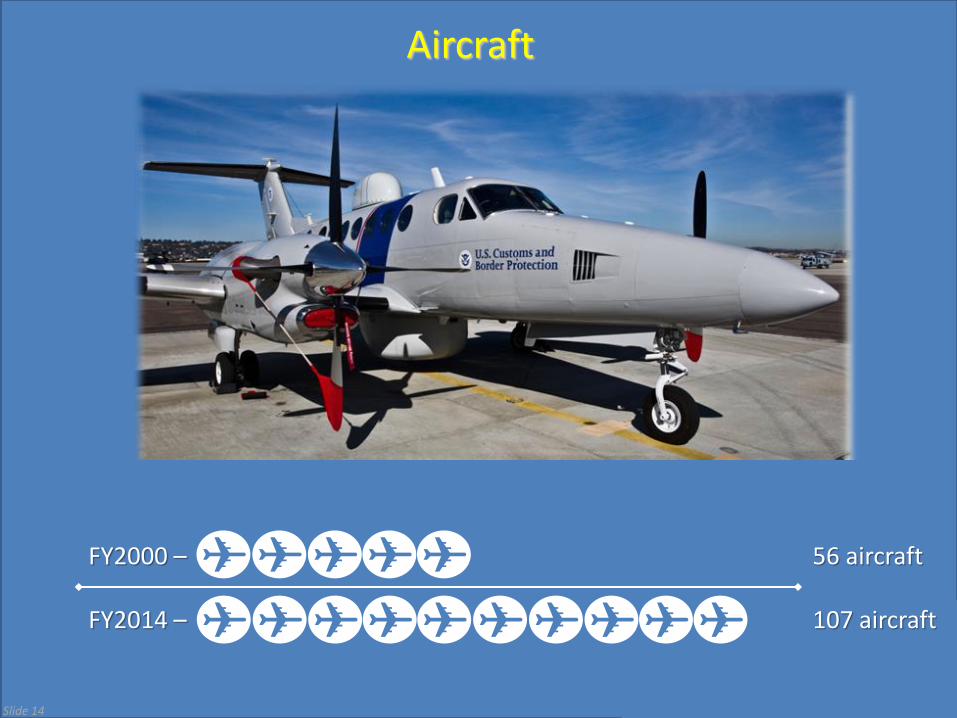
Aircraft
FY2000 – 56 aircraft FY2014 – 107 aircraft
Slide 14
Slide 15
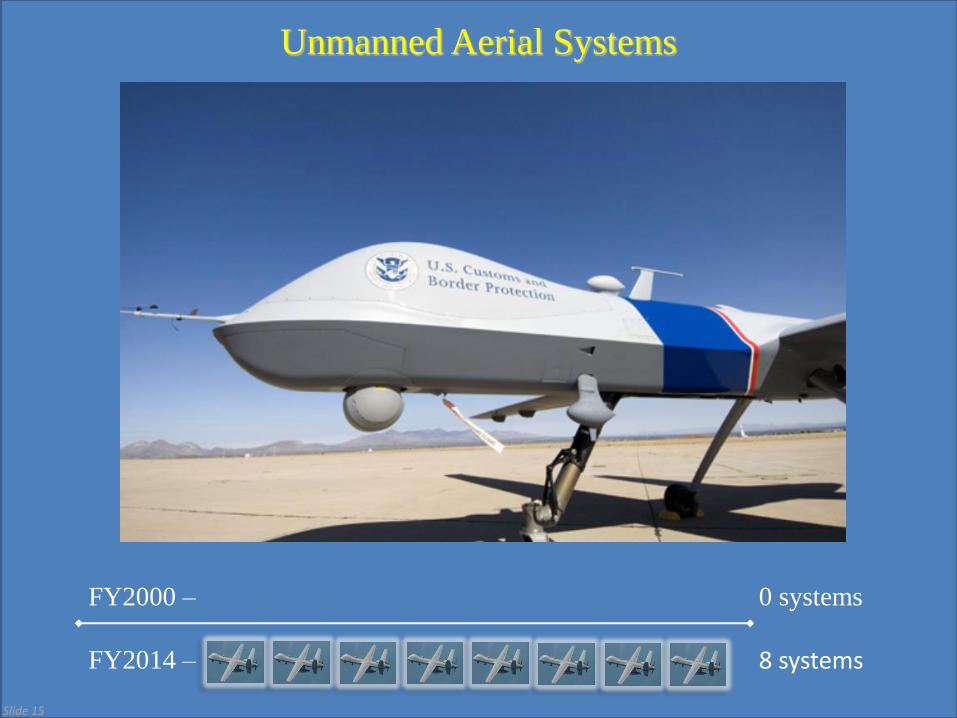
Unmanned Aerial Systems
FY2000 – 0 systems
FY2014 – 8 systems
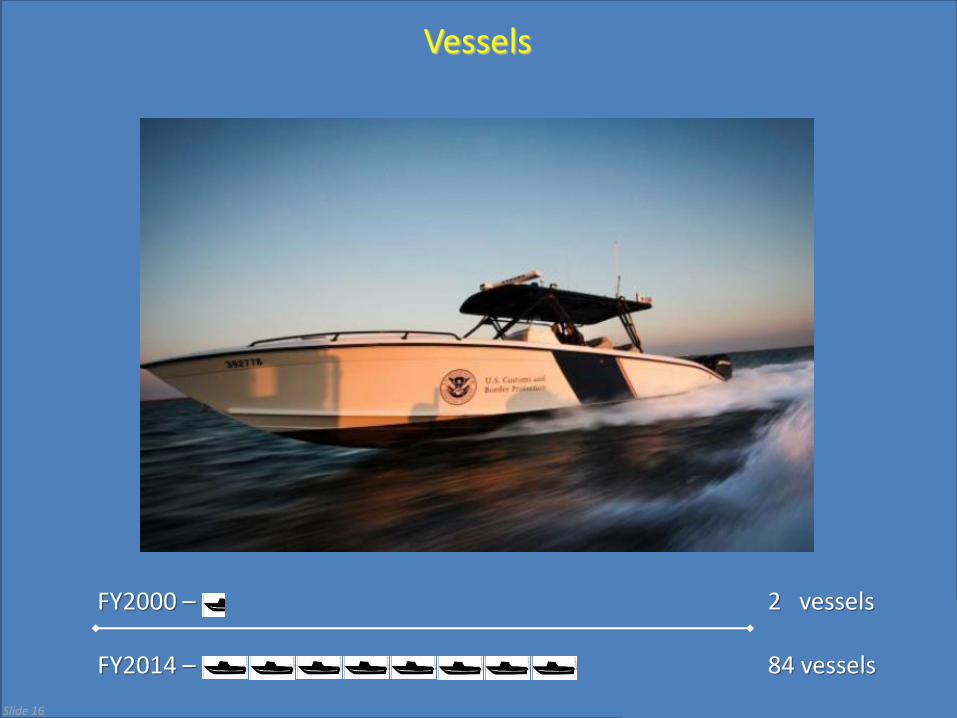
Vessels
FY2000 – 2 vessels FY2014 – 84 vessels
Slide 16
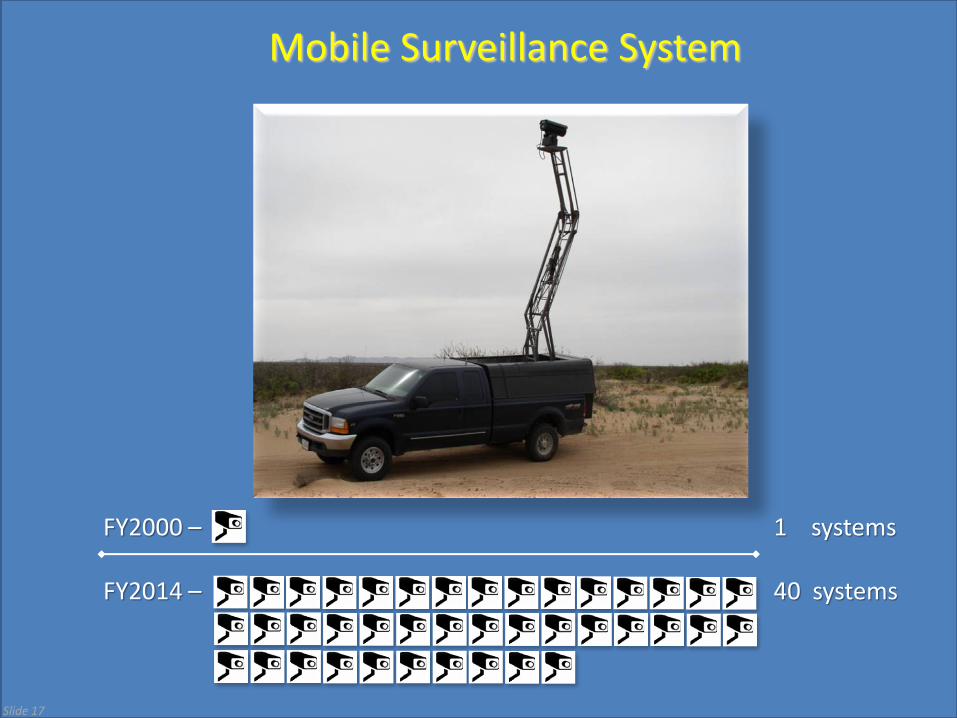
Slide 17
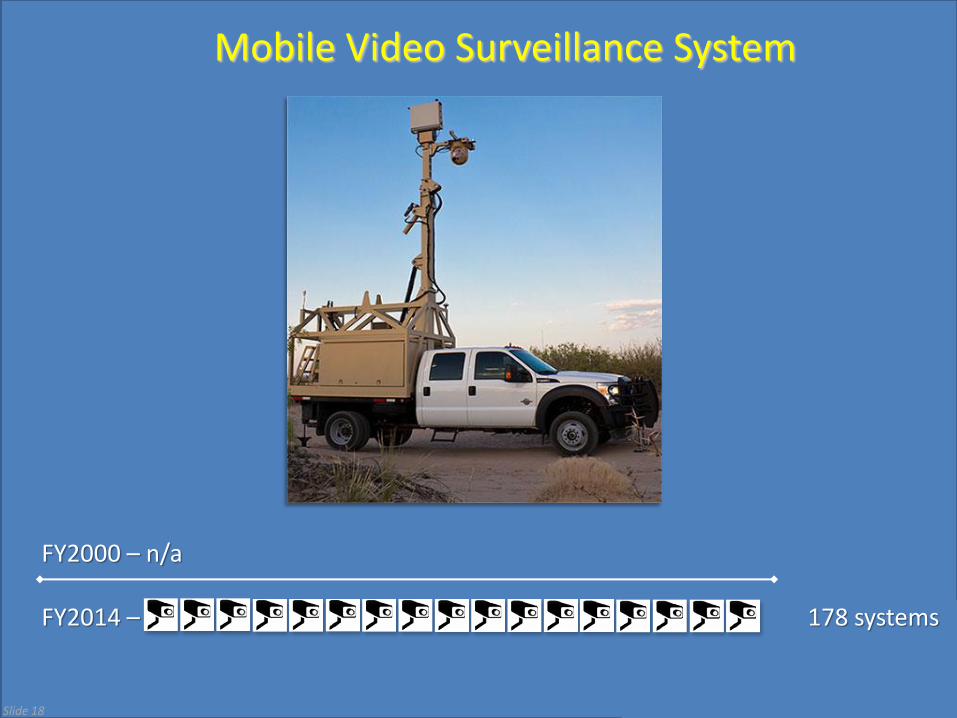
Mobile Surveillance System
FY2000 – 1 systems FY2014 – 40 systems
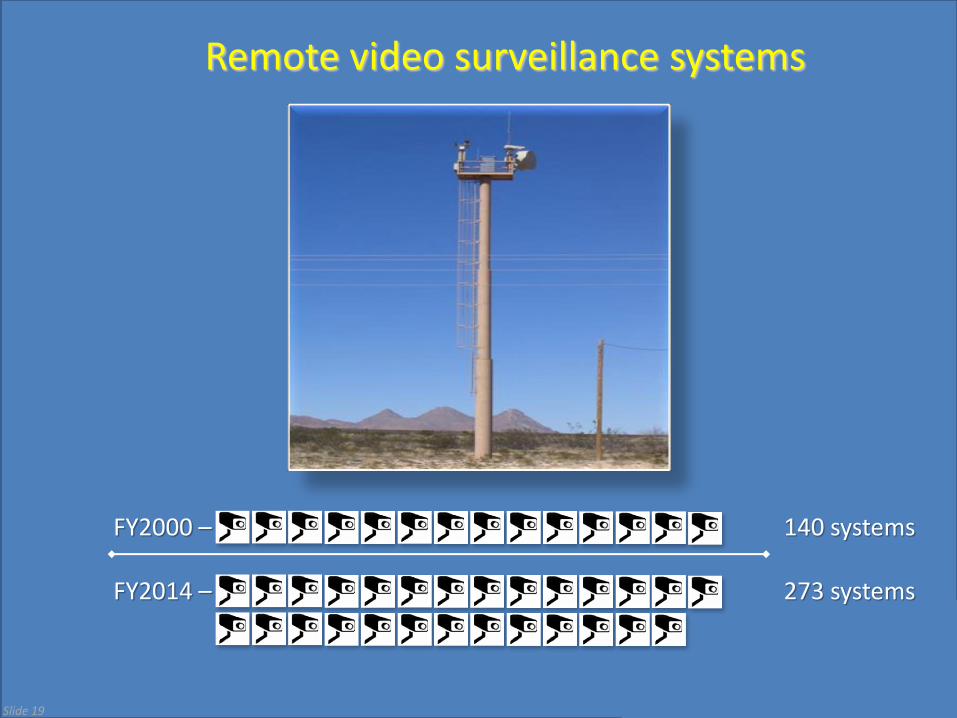
Remote video surveillance systems
FY2000 – 140 systems FY2014 – 273 systems
Slide 19
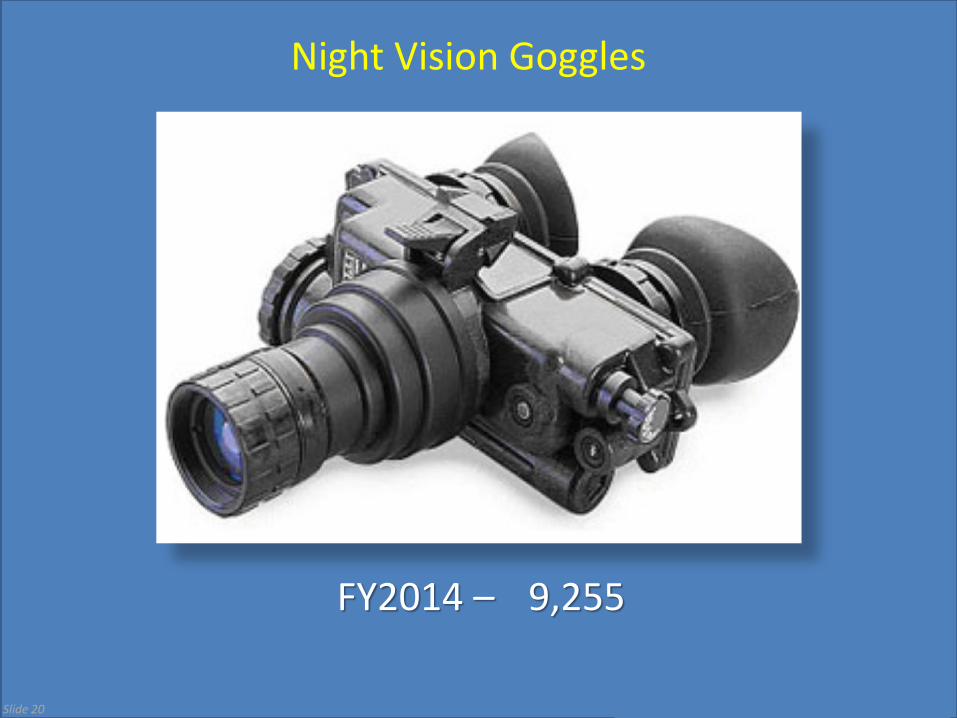
Slide 20
Night Vision Goggles
FY2014 – 9,255
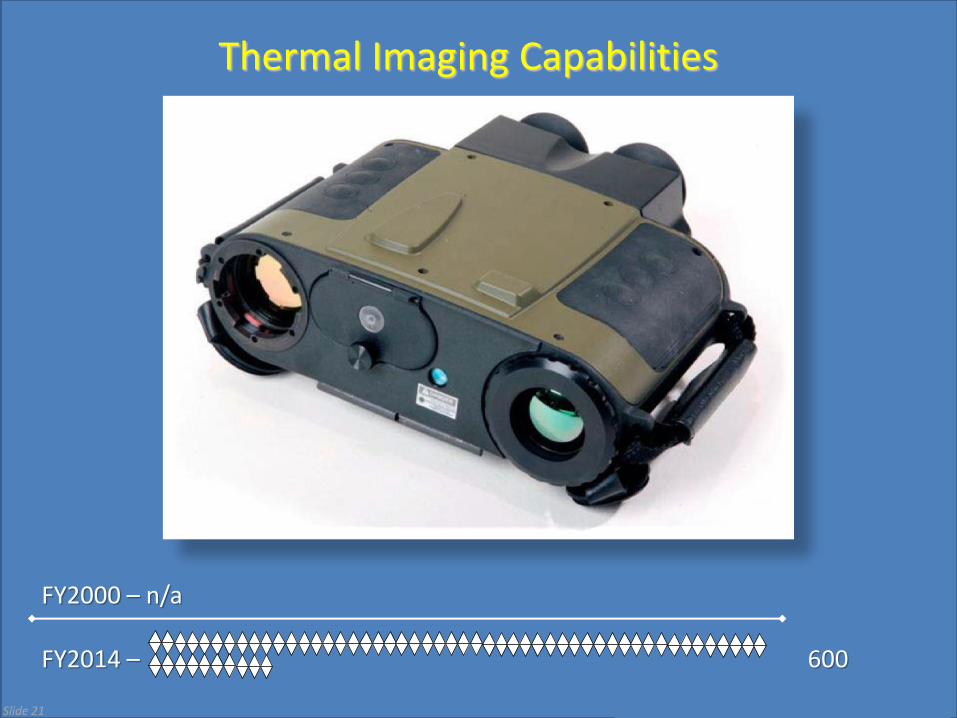
Slide 21
Thermal Imaging Capabilities
FY2000 – n/a FY2014 – 600
Slide 21 Slide 22
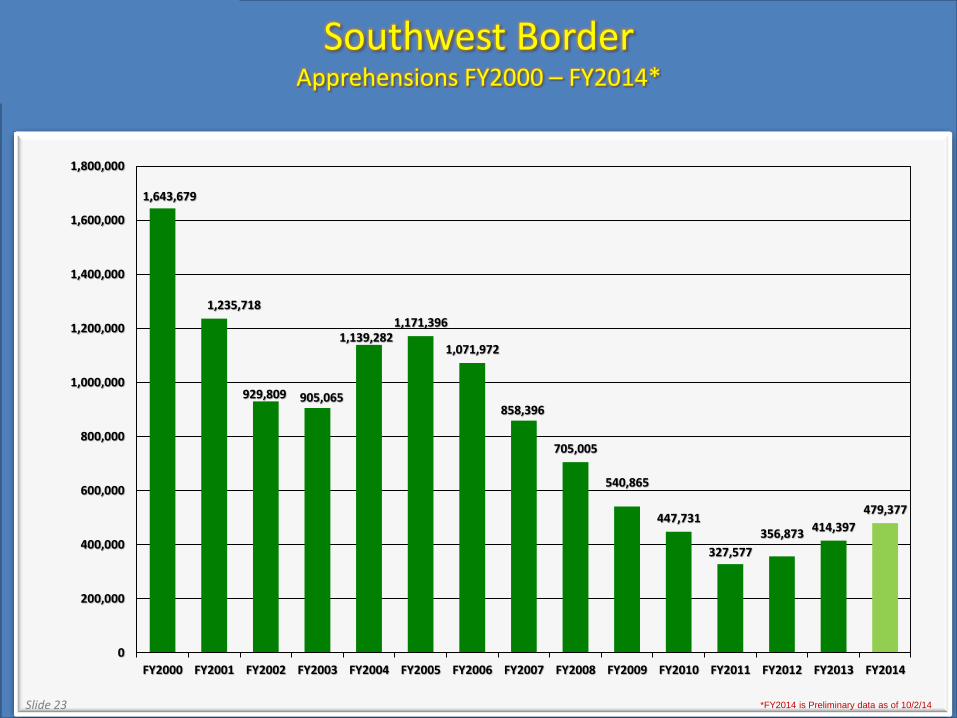
Southwest Border Apprehensions FY2000 – FY2014*
1,643,679
1,235,718
929,809 905,065
1,139,282 1,171,396
1,071,972
858,396
705,005
540,865
447,731
327,577
356,873 414,397
479,377
0
200,000
400,000
600,000
800,000
1,000,000
1,200,000
1,400,000
1,600,000
1,800,000
FY2000 FY2001 FY2002 FY2003 FY2004 FY2005 FY2006 FY2007 FY2008 FY2009 FY2010 FY2011 FY2012 FY2013 FY2014
Slide 23 *FY2014 is Preliminary data as of 10/2/14
Slide 23
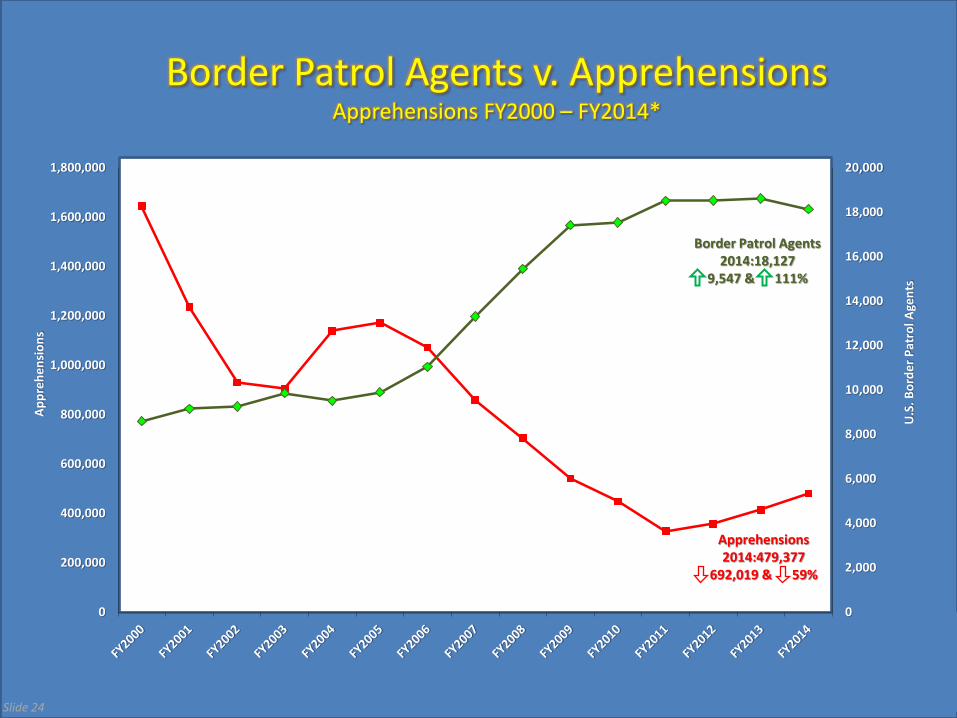
Apprehensions U.S. Border Patrol Agents
Slide 24
Border Patrol Agents v. Apprehensions Apprehensions FY2000 – FY2014*
0
2,000
4,000
6,000
8,000
10,000
12,000
14,000
16,000
18,000
20,000
0
200,000
400,000
600,000
800,000
1,000,000
1,200,000
1,400,000
1,600,000
1,800,000
U.S
. B
ord
er
Pat
rol A
gen
ts
Ap
pre
he
nsi
on
s
Border Patrol Agents 2014:18,127
9,547 & 111%
Apprehensions 2014:479,377
692,019 & 59%
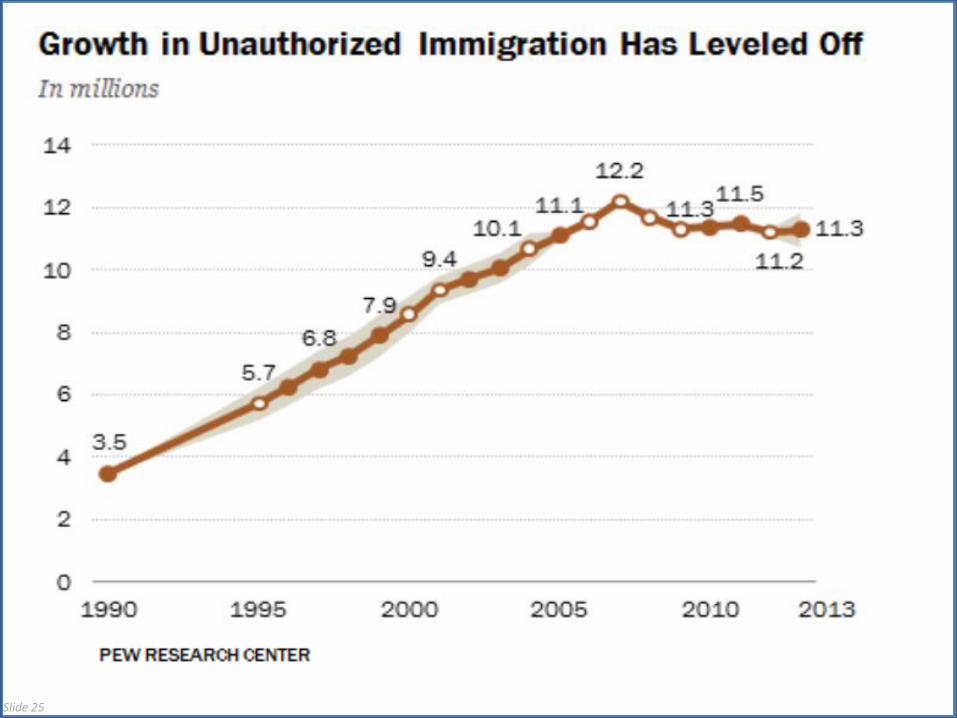
Slide 25
Note: Shading surrounding line indicates low and high points of the estimated 90% confidence interval. White data markers indicate that the change from the previous estimate shown is statistically significant (for example, for 1995 change is significant from 1990). Data labels are for 1990, odd years from 1995-2011, 2012, 2013. Source: This table, is derived from Pew Research Center estimates based on residual methodology, applied to March supplements of the Current Population Survey for 1995-2004 and 2013, and the American Community Survey for 2005-2012. Estimates for 1990 from “Warren and Warren” (2013).
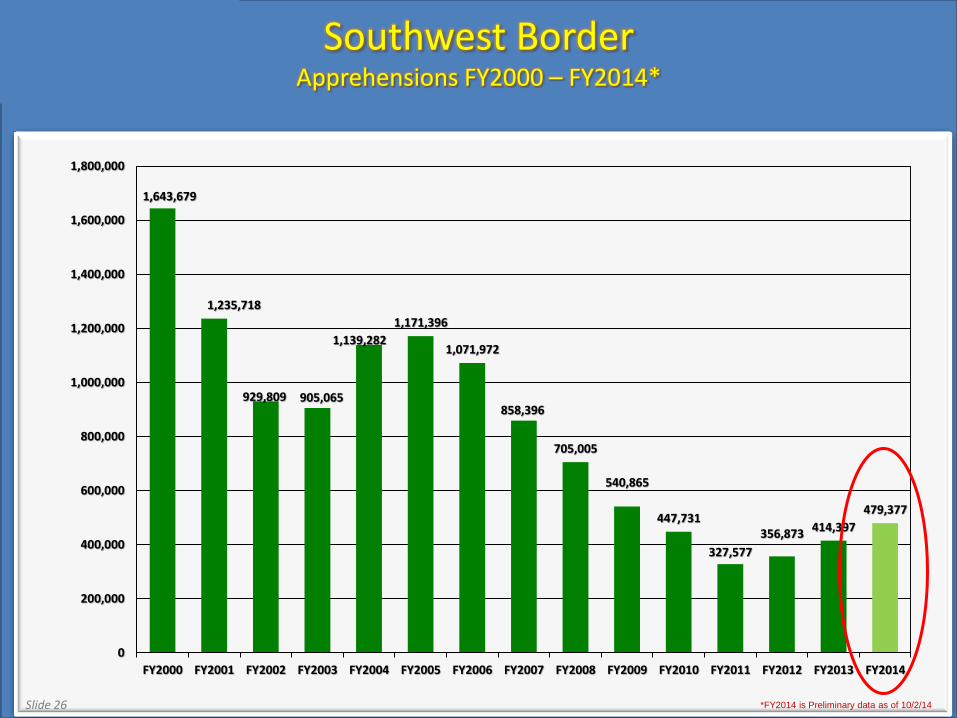
1,643,679
1,235,718
929,809 905,065
1,139,282
1,171,396
1,071,972
858,396
705,005
540,865
447,731
327,577
356,873 414,397
479,377
0
200,000
400,000
600,000
800,000
1,000,000
1,200,000
1,400,000
1,600,000
1,800,000
FY2000 FY2001 FY2002 FY2003 FY2004 FY2005 FY2006 FY2007 FY2008 FY2009 FY2010 FY2011 FY2012 FY2013 FY2014
Slide 26
Southwest Border Apprehensions FY2000 – FY2014*
*FY2014 is Preliminary data as of 10/2/14
S
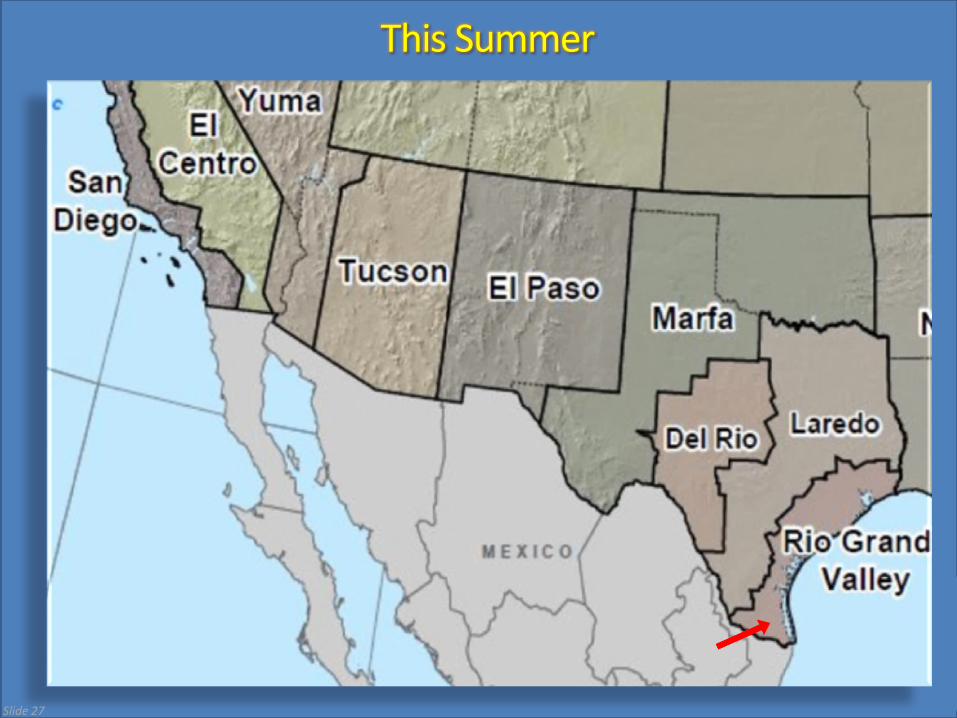
This Summer
lide 27
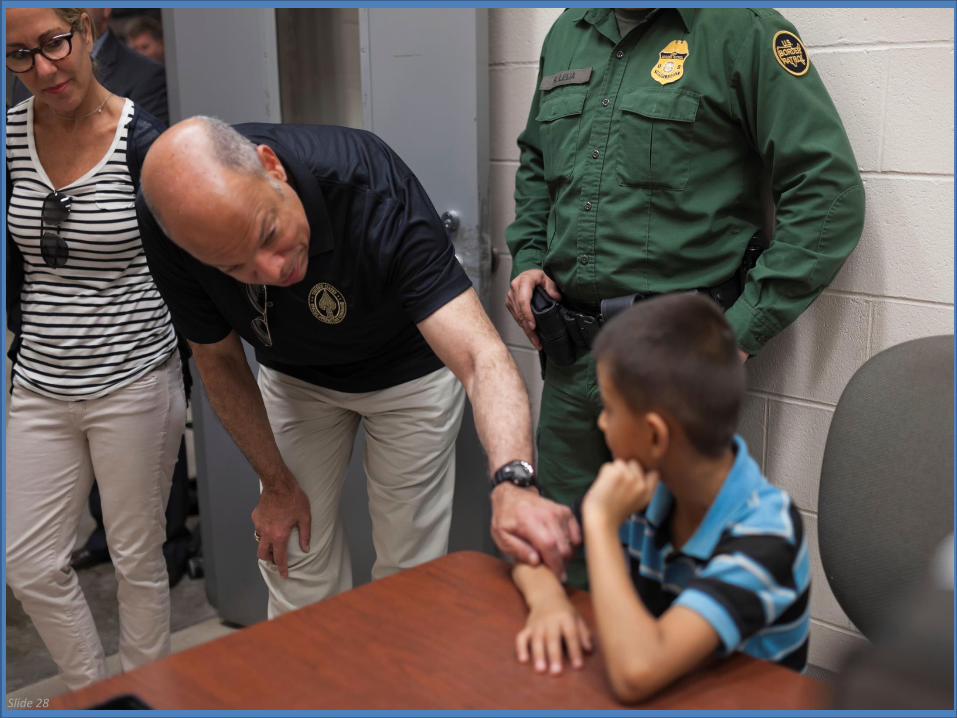
Slide 28
Slide 29
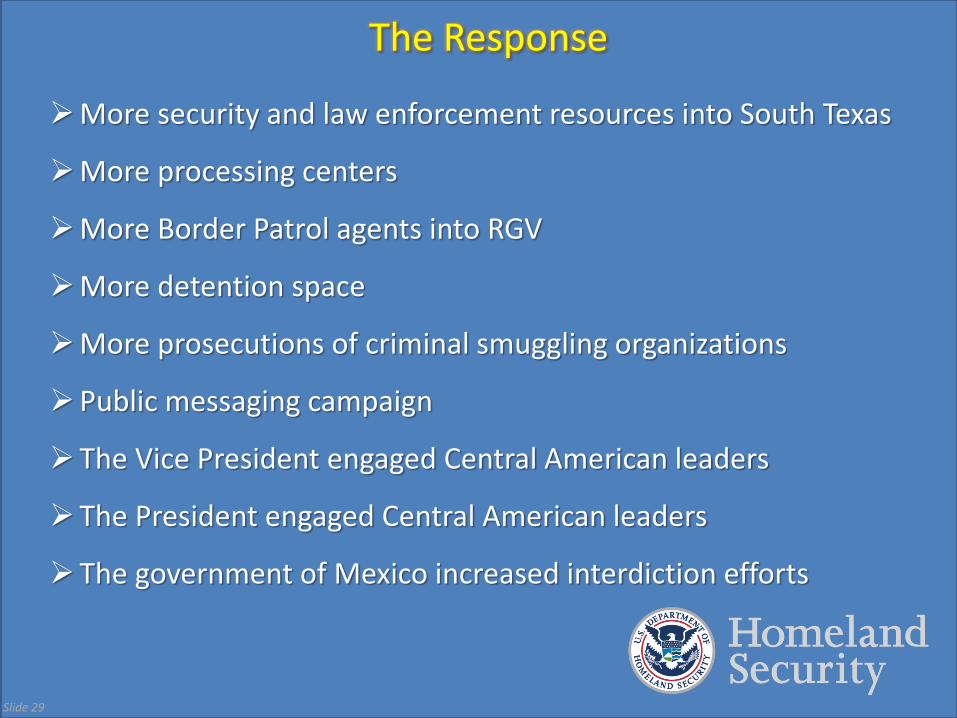
The Response
More security and law enforcement resources into South Texas
More processing centers
More Border Patrol agents into RGV
More detention space
More prosecutions of criminal smuggling organizations
Public messaging campaign
The Vice President engaged Central American leaders
The President engaged Central American leaders
The government of Mexico increased interdiction efforts
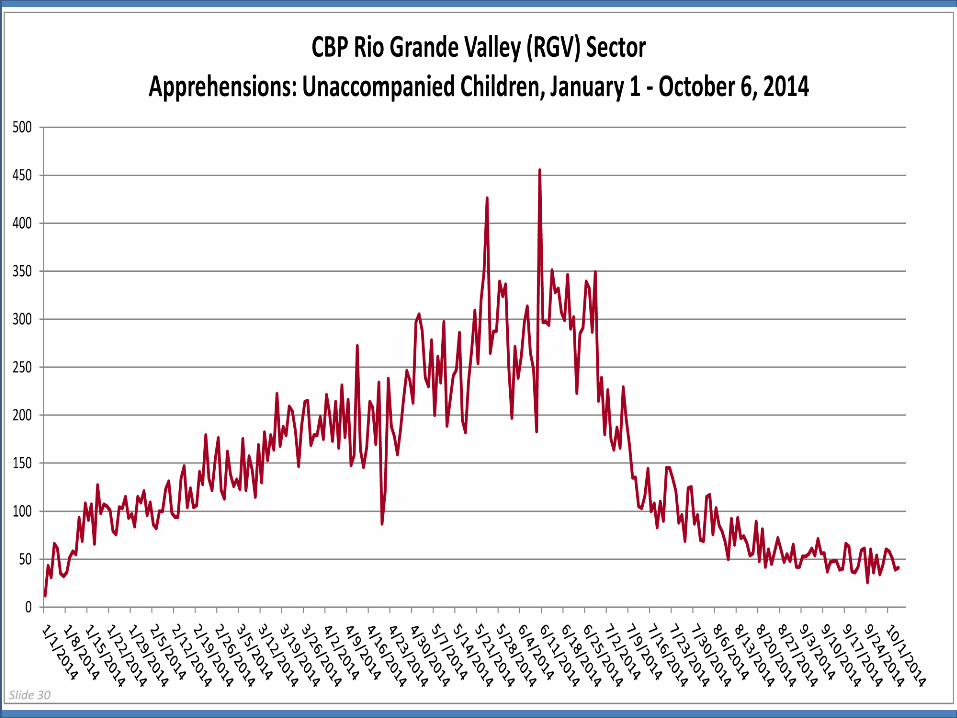
Slide 30
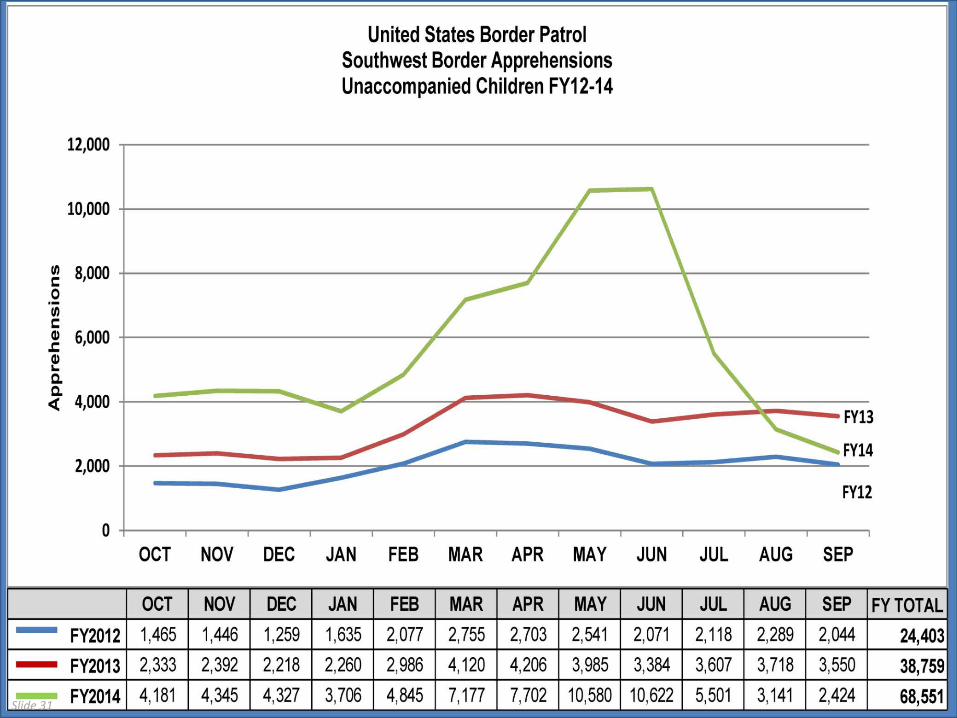
United States Border Patrol Southwest Border Apprehensions Unaccompanied Children FY12-14
12,000 ......-----------------------------
"' 8,000 c: 0
"' c: Q) 6,000 .c: Q) ... Q. Q.
<l'. 4,000 FY13
FY14 2,000
FY12
0 OCT NOV DEC JAN FEB MAR APR MAY JUN JUL AUG SEP
Slide 31
OCT NOV DEC JAN FEB MAR APR MAY JUN JUL AUG SEP FY TOTAL FY2012 1,465 1,446 1,259 1,635 2,077 2,755 2,703 2,541 2,071 2, 118 2,289 2,044 24,403 FY2013 2,333 2,392 2,218 2,260 2,986 4, 120 4,206 3,985 3,384 3,607 3,718 3,550 38,759 FY2014 4, 181 4,345 4,327 3,706 4,845 7, 177 7,702 10,580 10,622 5,501 3, 141 2,424 68,551
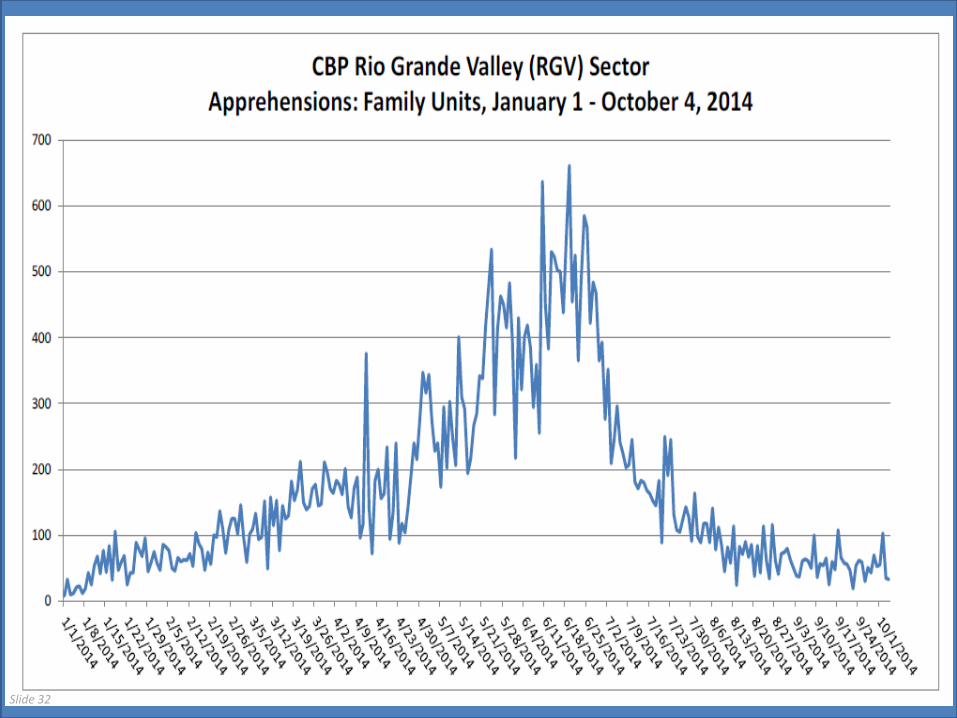
Slide 32
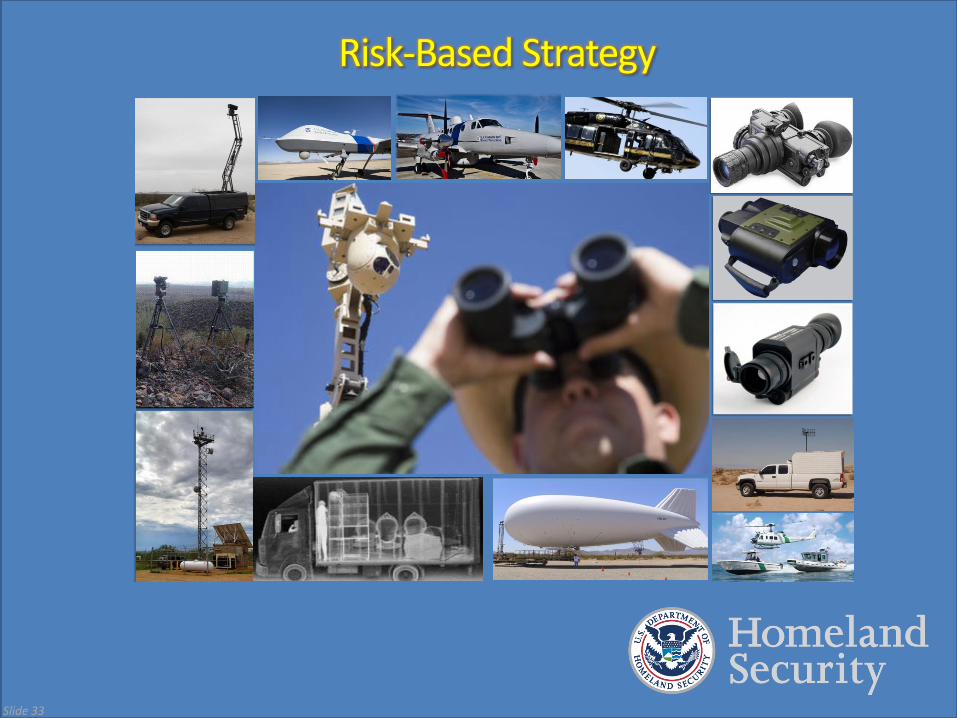
Slide 33
Risk-Based Strategy
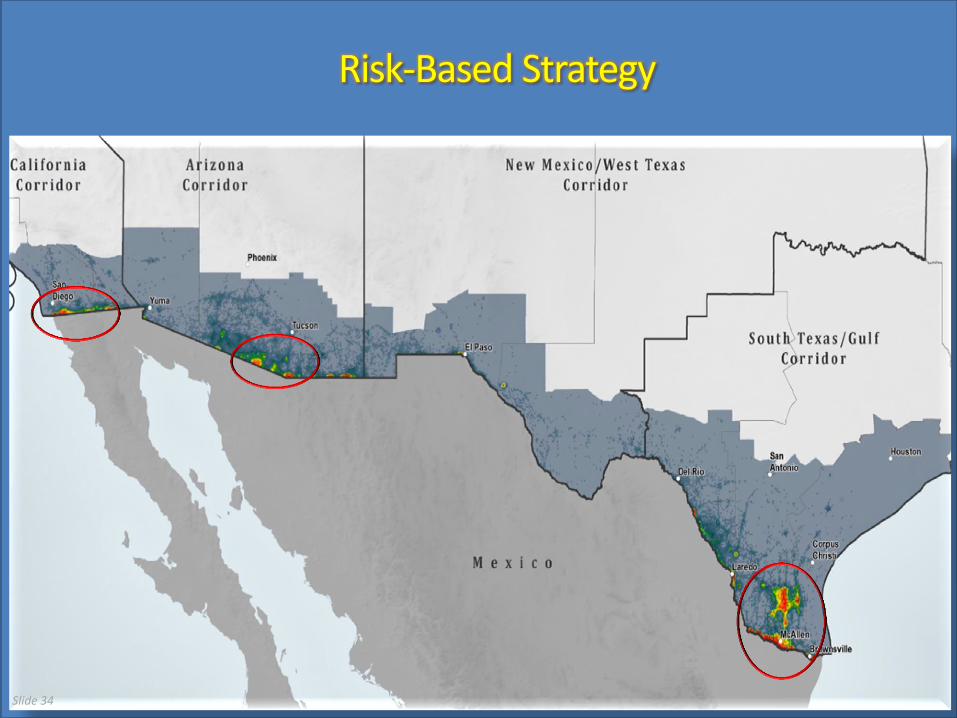
Risk-Based Strategy
Slide 34
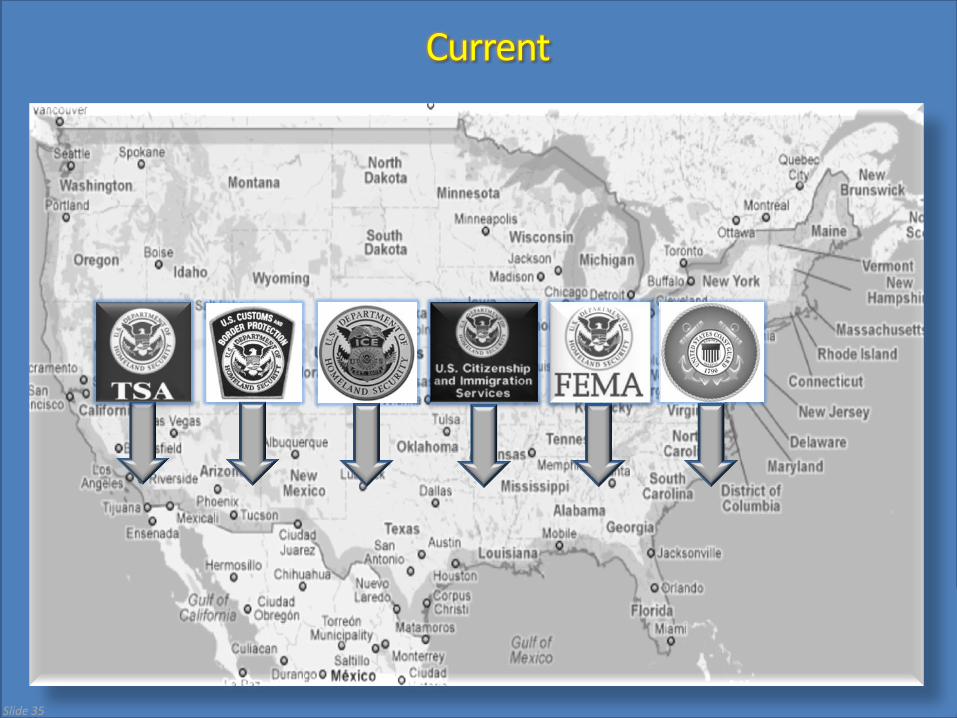
Current
Slide 35
Slide 38
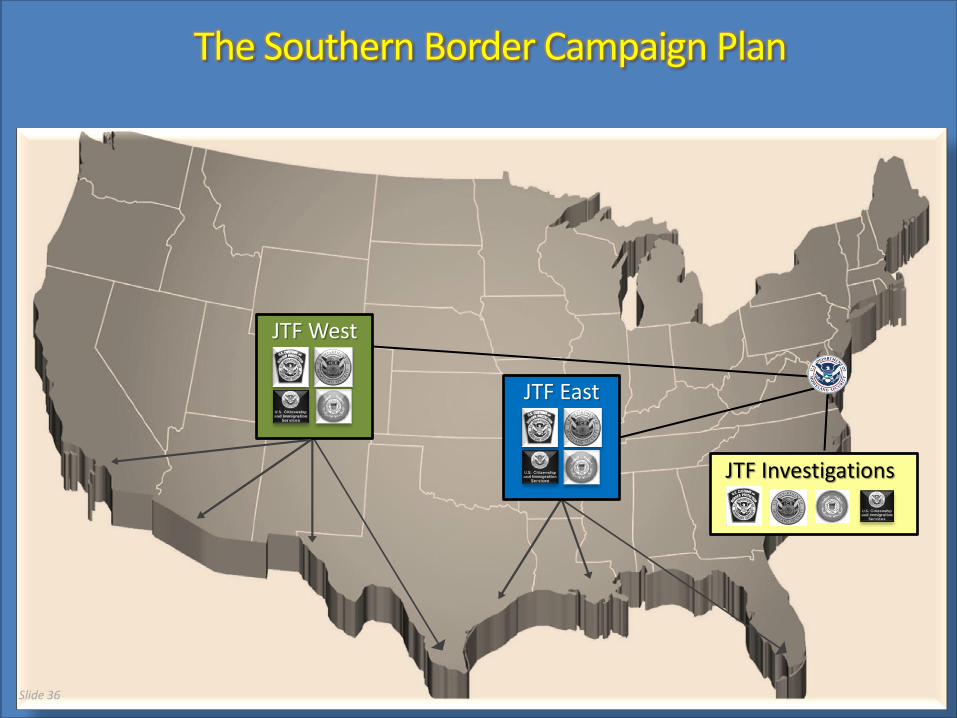
The Southern Border Campaign Plan
JTF Investigations
JTF West
JTF East
Slide 36
A commitment to transparency
Slide 37

Questions?
Slide 38