borgwarner letter to stockholders 2008 annual report on ... · we expect open, honest, ... of...
TRANSCRIPT

BorgWarner Letter to Stockholders 2008 Annual Report on Form 10K
BW5365_AR 2008 Letter_FINAL.B&W.10K VER2.indd 1-2 3/2/09 4:56 PM

BorgWarner Vision
To be the global technology leader in powertrain solutions
BorgWarner Mission
Develop leading powertrain technologies that improve fuel economy, emissions and performance
BorgWarner Beliefs
R E S P E C T F O R E A C H O T H E R BorgWarner must operate in a climate of openness, trust, and cooperation, in which each of us freely grants others the same respect and decency we seek for ourselves. We expect open, honest, and timely communication. As a global company, we invite and embrace the diversity of all our people.
T H E P O W E R O F C O L L A B O R AT I O N BorgWarner is both a community of entrepreneurial businesses and a single enterprise. Our goal is to preserve the freedom each of us needs to � nd personal satisfaction while building a strong business that comes from unity of purpose. True unity is more than a melding of self-inter-ests; it results when goals and values are shared.
PA S S I O N F O R E X C E L L E N C E BorgWarner chooses to be a leader — in serving our customers, advancing our technologies, and rewarding all who invest in us. To sustain our leadership, we relentlessly seek to im-prove our performance. We bring urgency to every business challenge and opportunity. We anticipate change and shape it to our purpose. We encourage new ideas that challenge the status quo, and we seek to involve every mind in the growth of our business.
P E R S O N A L I N T E G R I T Y We at BorgWarner demand uncompromising ethical standards in all we do and say. We are committed to doing what is right — in good times and in bad. We are accountable for the commitments we make. We are, above all, an honorable company of honorable people.
R E S P O N S I B I L I T Y T O O U R C O M M U N I T I E S BorgWarner is committed to good corporate citizenship. We strive to supply goods and services of superior value to our customers; to create jobs that provide meaning for those who do them; and to contribute generously of our talents and our wealth in the communities in which we do business.
BW5365_AR 2008 Letter_FINAL.B&W.10K VER2.indd 3-4 3/2/09 4:56 PM

For many companies around the world, including BorgWarner, 2008 was an extraordinary year that will long be remembered as a watershed in the history of economics and business. Despite the daunting challenges facing the global economy and our industry in particular, BorgWarner has the financial strength and management experience necessary to weather this storm and prepare for a recovery. When the crisis subsides, the future holds outstanding growth opportunities for BorgWarner driven by our technological focus on improved fuel economy and emissions reduction, and the skills of our worldwide workforce. I believe that companies like BorgWarner that survive the current crisis will form the foundation of a renewed, sustainable, and vital global auto industry.
A Year of ExtremesWe expected 2008 to be a challenge, but could not have predicted that the first half of the year would be so markedly different from the second half. We enjoyed strong demand for our products in the first half of the year, leading to record sales and earnings. With the escalation of gasoline prices by mid-year, vehicle builds in North America contracted. The economic crisis and loss of consumer confidence that took hold in the third quarter and accelerated into the fourth quarter, created a domino effect around the world that brought auto production to a virtual standstill by year-end.
Throughout this time we were adjusting our production and workforce levels to cope with daily changes. The deep declines in North America and the overnight cuts in European production schedules challenged our ability to reduce our costs at the same pace. The robust start to the year was offset by dramatically reduced demand by year-end, which impacted our financial performance. The year was not without its achievements, however:
• Our fuel-efficient technology helped both our customers and our businesses receive accolades throughout the year. We were associated with a record number of awards in
2008, from recognition for technology which helped a host of vehicles win environmental honors to industry innovation awards for our turbochargers, all-wheel drive systems, dual clutch transmission technology, variable cam timing and ignition systems.
• Customers continued to adopt our solutions for improved fuel efficiency with a number of major launches of our dual clutch transmission technology, and the turbocharger business award of a major portion of the Ford six-cylinder EcoBoost engine program.
Timothy M. ManganelloChairman and Chief Executive Officer
To Our StockholdersBorgWarner has the financial strength, technological focus and skilled workforce to actively manage through current economic conditions and continue our growth.
Sales GrowthDollars in Billions
$2.4$2.7
$3.1$3.5
$4.3$4.6
$5.3 $5.3
‘01 ‘02 ‘03 ‘04 ‘05 ‘06 ‘07 ‘08
12% CAGR
Earnings Performance*Per Diluted Share
$0.81
$2.07
‘01 ‘02 ‘03 ‘04 ‘05 ‘06 ‘07 ‘08
14.3% CAGR
*Excludes non-recurring items
$2.44
$2.04$2.17
$1.83$1.60
$1.40
February 2009
BW5365_AR 2008 Letter_FINAL.B&W.10K VER2.indd 5-6 3/2/09 4:56 PM

• While expansion programs were temporarily slowed by year-end, we are well positioned for growth in emerging markets like Eastern Europe, China and India.
• In China, we established a joint venture during the year with a consortium of 12 top Chinese automakers to produce dual clutch transmission modules. This significant collaboration establishes dual clutch technology as the preferred transmission solution for China’s major domestic vehicle manufacturers.
• Our dividend was increased by 9%. We have increased the dividend in each of the last seven years, and over that period, the dividend has more than tripled.
Managing through Global UncertaintyWe proactively approached 2009 prepared to deal with uncertain industry conditions, especially in North America and Western Europe, which together represent about 80% of our revenue. We have successfully managed through difficult market environments before and expect to apply that same focus and determination to the current situation. While industry conditions are difficult, the strong underlying fundamentals of our company remain strong and we plan to protect our foundation for future growth.
Our underlying strengths include: • Powertrain technology leadership that drives our growth.• Customer and geographic diversity that minimizes our
exposure to any single customer or market.• An operational focus that actively manages the size and
overhead costs of our business.• Financial structure and liquidity that are strong.
As business conditions continued to worsen in all of our major selling regions during the fourth quarter of 2008, we took aggressive cost control measures. We entered 2009 having already undertaken significant restructuring actions in North America and Europe, and having implemented three and four week shutdowns at most of our worldwide operations. We had made the tough but necessary decisions to reduce our workforce by about 4,400 people or 24%, and had moved to four-day work weeks in many European operations.
Each of our business units has focused on adjusting their operations to the appropriate staffing levels for the low production volumes that we are predicting for 2009. Our teams are working aggressively to respond to ever-changing customer and business needs. We are reducing inventory and capital spending. At the same time, we are continuing to spend wisely on research and development to enhance our future growth and powertrain technology leadership position.
Against this backdrop of a global recession, we continue to gain new business. Our net new business of $2.1 billion over the next three years provides a good, longer-term view of our expected growth beyond the current crisis.
Of the total net new business, about 80% is from engine-related systems and the remainder is drivetrain-related.From a product perspective, turbochargers and dual clutch transmission technologies remain our major growth platforms.
Our growth is tied to issues of global importance for drivers and manufacturers – fuel efficiency without sacrificing performance, cleaner air and vehicle stability. We have
Net New Business 2009 thru 2011$2.1 Billion of Net New Business by Product
Drivetrain Engine
1%All-Wheel Drive35%
Turbochargers: Gasoline Direct Injection, Variable Turbine Geometry & Regulated Two-Stage®
Dual Clutch Technology 16%
Transmission Components 4%
Variable Cam Timing & Engine Timing 14%
Thermal Systems 5%
Ignition Systems 5%
20% Turbo & Emissions
Total Shareholder Return$100 invested on 12/31/03 in stock or index including reinvestment of dividends. Fiscal year ending December 31.
250
200
150
100
50
0
2003 2004 2005 2006 2007 2008
BorgWarner Inc.S&P 500
Peer GroupSIC 3714
BW5365_AR 2008 Letter_FINAL.B&W.10K VER2.indd 7-8 3/2/09 4:56 PM

www.borgwarner.com
powertrain technologies that enhance the driving experience while conserving energy, whether it is through technology aimed at clean diesels, advanced gasoline engines, hybrids or electric vehicles. We believe that when combined, our products can enable fuel economy improvements of up to 40% over today’s most common powertrains. We will weather the current economic downturn with an enhanced focus on operational efficiency while remaining passionate in our commitment to powertrain technology leadership.
What do we expect in 2009? As I prepare this letter in February of 2009, we see depressed levels of auto production around the world, with a level in North America that we have not seen in almost 30 years. As a result, we expect a decline in 2009 sales, but anticipate that earnings and cash flow will be positive. Based on our current information, the foreseeable future remains difficult with no real industry turnaround predicted until mid-2010. We are better positioned than most companies however, and we have the fortitude to endure this downturn and will emerge leaner and stronger.
We Will Emerge StrongerThe current period of global economic crisis and dramatic industry schedule reductions has strained even the best performing companies around the world. BorgWarner maintains the financial capability to continue to invest in research and development, as well as to pursue strategic acquisitions to further strengthen our competitive position in the marketplace. We are taking actions to mitigate the impact of the current global economic situation, while continuing to position ourselves for the future.
While the current economic crisis is expected to slow global car sales in the near-term, BorgWarner remains at the forefront of global automotive trends. Clean air and fuel economy are major issues that automakers around the world must address for many years to come. The strategic moves that the company has made in recent years are paying off. We expect to continue to outpace the growth of the auto industry and to strengthen our competitive position throughour leading technology and strong focus on cost control.
These are extraordinary times for our company and for our industry. Despite the external economic environment that is beyond our control, our employees around the world will continue to concentrate on effectively executing our technology driven growth strategy. We have always been a lean company and are now asking more from our people than ever before as we proactively protect the future of BorgWarner during this difficult period.
We know there is strength in our entrepreneurial spirit and “BorgWarner Pride” that will see us through this recession. When the global economy turns around, BorgWarner will still be the leading powertrain supplier to the global auto industry!
Timothy M. Manganello Chairman and Chief Executive Officer
Customer Diversity Worldwide2009 Sales Outlook*
Toyota 5%Hyundai/Kia 3%
Honda 2%
15% VW/Audi
5% Com. Vehicles11% Other
6% Daimler3% Renault/Nissan
3% BMW3% Fiat
2% Ford1% GM1% PSA
Renault/Nissan 1%
Chinese OEMs 1%For. OEMs/China 1%
Other 7%
Ford 5%GM 4%
Chrysler 3%
Commercial Vehicles 10%
Asian OEMs 2%Aftermarket 2%
Other 4%Asia 20%* (13%)** Americas 30%* (32%)** Europe 50%* (55%)**
*Includes NSK-Warner **Excludes NSK-Warner
Dividend GrowthAnnual Dividend Per Share
$0.25
$0.18
$0.28$0.32
$0.34
$0.44$0.48
‘03 ‘04 ‘05 ‘06 ‘07 ‘08 ’09E
15% CAGR
BW5365_AR 2008 Letter_FINAL.B&W.10K VER2.indd 7-8 3/2/09 4:56 PM

Exhaust Gas Recirculation
CoolingSystems
Engine Timing
Cam Torque Actuated Variable
Cam Timing
Diesel Cold-Start
Technology
Regulated Two-Stage®
Turbocharger
K E Y T E C H N O L O G I E S
Chain Products Global leader in the design and manufacture of chain systems for engine timing, automatic transmissions and torque transfer, including four- and all-wheel drive applications. Engine chain systems include chains, sprockets, tensioners, control arms and guides, and variable cam timing phasers.
Emissions Systems A global leader in the design and supply of exhaust gas recirculation (EGR) systems, secondary air systems (SAS), and advanced actuators for enhanced engine performance, fuel economy, and reduced emissions.
Thermal Systems Systems for thermal management designed to improve engine cooling, and reduce emissions and fuel consumption.
Turbocharging Leading designer and manufacturer of turbo-chargers and boosting systems for passenger cars, light trucks and commercial vehicles. Systems enhance fuel efficiency, reduce emissions and enhance vehicle performance.
BERU Systems BERU is a worldwide leading supplier of diesel cold-start technology and a leading European manufacturer of ignition technology for gasoline vehicles. BERU electronics and sensor technology provide more comfort and stability for appli-cations in various engine and vehicle functions.
TransmissionControl Modules
All-Wheel Drive Transfer Cases
Transmission One Way Clutches
TransmissionFriction Products
DualTronic® Transmission
Clutch Modules
Engine Group The Engine Group develops air management strategies and products to optimize engines for fuel efficiency, reduced emissions and enhanced performance. BorgWarner’s expertise in engine timing systems, boosting systems, ignition systems, air and noise manage-ment, cooling and controls is the foundation for this collaboration.
Drivetrain Group The Drivetrain Group harnesses a legacy of more than 100 years as an industry innovator in transmission and all-wheel drive technology. The group is leveraging its understanding of powertrain clutching technology to develop interactive control systems and strategies for all types of torque management.
K E Y T E C H N O L O G I E S
Torque Management Leading global designer and producer of torque distribution and management systems, including i-Trac™ Torque Management devices for front-wheel drive vehicles and transfer cases for rear-wheel drive applications. These systems enhance stability, security and drivability of passenger cars, crossover vehicles, SUVs and light trucks.
Transmission Products “Shift quality” components andsystems including one way clutches, transmission bands, friction plates, torsional vibration dampers and clutch module assemblies; controls including transmission solenoids, control modules and integrated mechatronic control systems. BorgWarner is a trusted supplier to virtually every automatic and dual clutch transmission manufacturer in the world.
NexTrac ™All-Wheel Drive
Engine Group Sales millions of dollars
$2,855.4M$2,059.9M
0807060504
$3,154.9M$3,761.3M$3,861.5M
$1,472.9M$1,509.2M
0807060504
$1,461.4M$1,598.8M
Drivetrain Group Sales millions of dollars
$1,426.4M
BorgWarner will provide its full financial report electronically as part of its environmental initiative to conserve resources and reduce costs. For more information on the company’s financial performance and sustainability initiatives, please visit out website at www.borgwarner.com.
BW5365_AR 2008 Letter_FINAL.B&W.10K VER2.indd 5-6 3/2/09 4:56 PM
UNITED STATESSECURITIES AND EXCHANGE COMMISSION
Washington D.C. 20549
Form 10-KANNUAL REPORT
(Mark One)¥ Annual Report Pursuant to Section 13 or 15(d) of
the Securities Exchange Act of 1934
For the fiscal year ended December 31, 2008OR
n Transition Report Pursuant to Section 13 or 15(d) ofthe Securities Exchange Act of 1934
For the transition period from to
Commission File Number: 1-12162
BorgWarner Inc.(Exact name of registrant as specified in its charter)
Delaware 13-3404508State or other jurisdiction ofIncorporation or organization
(I.R.S. Employer Identification No.)
3850 Hamlin Road,Auburn Hills, Michigan 48326
(Address of principal executive offices) (Zip Code)
Registrant’s telephone number, including area code: (248) 754-9200Securities registered pursuant to Section 12(b) of the Act:
Title of each className of each exchange on
which registered
Common Stock, par value $0.01 per share . . . . . . . . . . . . . . . . . . . . . . . . . . . . . . . . New York Stock Exchange
Securities registered Pursuant to Section 12(g) of the Act: None
Indicate by check mark if the registrant is a well-known seasoned issuer, as defined in Rule 405 of the Securities Act.Yes ¥ No n
Indicate by check mark if the registrant is not required to file reports pursuant to Section 13 or Section 15(d) of the Act.Yes n No ¥
Indicate by check mark whether the registrant (1) has filed all reports required to be filed by Section 13 or 15(d) of theSecurities Exchange Act of 1934 during the preceding 12 months (or for such shorter period that the registrant was required to filesuch reports), and (2) has been subject to such filing requirements for the past 90 days. Yes ¥ No n
Indicate by check mark if disclosure of delinquent filers pursuant to Item 405 of Regulation S-K (§ 229.405 of this chapter) isnot contained herein, and will not be contained, to the best of registrant’s knowledge, in definitive proxy or information statementsincorporated by reference in Part III of this Form 10-K or any amendment to this Form 10-K. Yes ¥ No n
Indicate by check mark whether the registrant is a large accelerated filer, an accelerated filer, a non-accelerated filer, or asmaller reporting company. See the definitions of “large accelerated filer,” “accelerated filer” and “smaller reporting company” inRule 12b-2 of the Exchange Act. (Check one):Large accelerated filer ¥ Accelerated filer n Non-accelerated filer n Smaller reporting company n
(Do not check if a smaller reporting company)Indicate by check mark whether the registrant is a shell company (as defined in Rule 12b-2 of the Exchange Act).
Yes n No ¥
The aggregate market value of the voting common stock of the registrant held by stockholders (not including voting common stockheld by directors and executive officers of the registrant) on June 30, 2008 (the last business day of the most recently completed secondfiscal quarter) was approximately $5.2 billion. As of February 6, 2009, the registrant had 115,532,736 shares of voting common stockoutstanding.
DOCUMENTS INCORPORATED BY REFERENCEPortions of the following documents are incorporated herein by reference into the Part of the Form 10-K indicated.
Document
Part of Form 10-Kinto which
incorporated
BorgWarner Inc. Proxy Statement for the 2009 Annual Meeting of Stockholders . . . . . . . . . . . . . . . . . . . . . . . . . . . . Part III

BORGWARNER INC.
FORM 10-K
YEAR ENDED DECEMBER 31, 2008
INDEX
Page No.
PART I.Item 1. Business . . . . . . . . . . . . . . . . . . . . . . . . . . . . . . . . . . . . . . . . . . . . . . . . . . . . . . . . 4Item 1A. Risk Factors. . . . . . . . . . . . . . . . . . . . . . . . . . . . . . . . . . . . . . . . . . . . . . . . . . . . . . 14Item 1B. Unresolved Staff Comments . . . . . . . . . . . . . . . . . . . . . . . . . . . . . . . . . . . . . . . . . . 19Item 2. Properties . . . . . . . . . . . . . . . . . . . . . . . . . . . . . . . . . . . . . . . . . . . . . . . . . . . . . . . 19Item 3. Legal Proceedings . . . . . . . . . . . . . . . . . . . . . . . . . . . . . . . . . . . . . . . . . . . . . . . . . 20Item 4. Submission of Matters to a Vote of Security Holders . . . . . . . . . . . . . . . . . . . . . . . . 21
PART II.Item 5. Market for the Registrant’s Common Equity, Related Stockholder Matters and Issuer
Purchases of Equity Securities . . . . . . . . . . . . . . . . . . . . . . . . . . . . . . . . . . . . . . . . 21Item 6. Selected Financial Data . . . . . . . . . . . . . . . . . . . . . . . . . . . . . . . . . . . . . . . . . . . . . 23Item 7. Management’s Discussion and Analysis of Financial Condition and Results of
Operations . . . . . . . . . . . . . . . . . . . . . . . . . . . . . . . . . . . . . . . . . . . . . . . . . . . . . . . 24Item 7A. Quantitative and Qualitative Disclosure About Market Risk . . . . . . . . . . . . . . . . . . . . 45Item 8. Financial Statements and Supplementary Data . . . . . . . . . . . . . . . . . . . . . . . . . . . . 45Item 9. Changes in and Disagreements with Accountants on Accounting and Financial
Disclosure . . . . . . . . . . . . . . . . . . . . . . . . . . . . . . . . . . . . . . . . . . . . . . . . . . . . . . . 93Item 9A. Controls and Procedures . . . . . . . . . . . . . . . . . . . . . . . . . . . . . . . . . . . . . . . . . . . . 93Item 9B. Other Information . . . . . . . . . . . . . . . . . . . . . . . . . . . . . . . . . . . . . . . . . . . . . . . . . . 96
PART III.Item 10. Directors, Executive Officers and Corporate Governance . . . . . . . . . . . . . . . . . . . . . 96Item 11. Executive Compensation . . . . . . . . . . . . . . . . . . . . . . . . . . . . . . . . . . . . . . . . . . . . 96Item 12. Security Ownership of Certain Beneficial Owners and Management and Related
Stockholder Matters . . . . . . . . . . . . . . . . . . . . . . . . . . . . . . . . . . . . . . . . . . . . . . . . 96Item 13. Certain Relationships and Related Transactions and Director Independence . . . . . . . 96Item 14. Principal Accountant Fees and Services . . . . . . . . . . . . . . . . . . . . . . . . . . . . . . . . . 96
PART IV.Item 15. Exhibits and Financial Statement Schedules . . . . . . . . . . . . . . . . . . . . . . . . . . . . . . 96
2

CAUTIONARY STATEMENTS FOR FORWARD-LOOKING INFORMATION
Statements contained in this Form 10-K (including Management’s Discussion and Analysis of FinancialCondition and Results of Operations) may contain forward-looking statements as contemplated by the 1995Private Securities Litigation Reform Act that are based on management’s current outlook, expectations,estimates and projections. Words such as “outlook,” “expects,” “anticipates,” “intends,” “plans,” “believes,”“estimates,” variations of such words and similar expressions are intended to identify such forward-lookingstatements. Forward-looking statements are subject to risks and uncertainties, many of which are difficult topredict and generally beyond our control, that could cause actual results to differ materially from thoseexpressed, projected or implied in or by the forward-looking statements. Such risks and uncertainties include:fluctuations in domestic or foreign vehicle production, the continued use of outside suppliers, fluctuations indemand for vehicles containing our products, changes in general economic conditions, as well as the otherrisks noted under “Risk Factors.” We do not undertake any obligation to update any forward-lookingstatements.
3

PART I
Item 1. Business
BorgWarner Inc. and Consolidated Subsidiaries (the “Company”) is a Delaware corporation that wasincorporated in 1987. We are a leading, global supplier of highly engineered automotive systems andcomponents, primarily for powertrain applications. Our products help improve vehicle performance, fuelefficiency, stability and air quality. These products are manufactured and sold worldwide, primarily to originalequipment manufacturers (“OEMs”) of light-vehicles (passenger cars, sport-utility vehicles, vans and light-trucks). The Company’s products are also sold to other OEMs of commercial trucks, buses and agricultural andoff-highway vehicles. We also manufacture and sell our products to certain Tier One vehicle systems suppliersand into the aftermarket for light and commercial vehicles. The Company operates manufacturing facilitiesserving customers in the Americas, Europe and Asia, and is an original equipment supplier to every majorautomotive OEM in the world.
Financial Information About Segments
Refer to Note 21, “Reporting Segments and Related Information” of the Notes to the ConsolidatedFinancial Statements in Item 8 of this report for financial information about business segments.
Narrative Description of Reporting Segments
The Company reports its results under two reporting segments: Engine and Drivetrain. Net revenues bysegment for the three years ended December 31, 2008, 2007 and 2006 are as follows (in millions of dollars):
Net Sales 2008 2007 2006Year Ended December 31,
Millions of dollars
Engine. . . . . . . . . . . . . . . . . . . . . . . . . . . . . . . . . . . . . . . . $3,861.5 $3,761.3 $3,154.9Drivetrain . . . . . . . . . . . . . . . . . . . . . . . . . . . . . . . . . . . . . . 1,426.4 1,598.8 1,461.4Inter-segment eliminations . . . . . . . . . . . . . . . . . . . . . . . . . (24.0) (31.5) (30.9)
Net sales . . . . . . . . . . . . . . . . . . . . . . . . . . . . . . . . . . . . . . $5,263.9 $5,328.6 $4,585.4
The sales information presented above excludes the sales by the Company’s unconsolidated jointventures (See “Joint Ventures” section). Such sales totaled approximately $792 million in 2008, $720 million in2007 and $676 million in 2006.
Engine
The Engine Group develops products to manage engines for fuel efficiency, reduced emissions, andenhanced performance. Concern about fuel prices and availability, and the need to lower CO2 emissions aredriving demand for the Company’s products in smaller, more efficient gasoline and diesel engines andalternative powertrains in hybrid vehicles. Engine Group products currently fall into the following majorcategories: turbochargers, chain products, emissions systems, thermal systems, diesel cold start andgasoline ignition technology and diesel cabin heaters.
The Engine Group provides turbochargers for light-vehicle, commercial-vehicle and off-road applica-tions for diesel and gasoline engine manufacturers in Europe, North America, South America and Asia. TheEngine Group has greatly benefited from the growth in turbocharger demand in Europe. This growth is linkedto increasing demand for diesel engines in light vehicles which typically use turbochargers and for turbo-charged gasoline engines. Benefits of turbochargers in both light-vehicle and commercial-vehicle applica-tions include increased power for a given engine size, improved fuel economy and significantly reducedemissions.
Sales of turbochargers for light-vehicles represented approximately 24%, 21%, and 18% of the Compa-ny’s total revenues for 2008, 2007 and 2006, respectively. The Company currently supplies light-vehicle
4

turbochargers to many OEMs including VW/Audi, Renault, PSA, Daimler, Hyundai, Fiat and BMW. TheCompany also supplies commercial-vehicle turbochargers to Caterpillar, John Deere, Daimler, International,Deutz and MAN.
The Company’s newest technologies are its regulated two-stage turbocharging system known as R2S»,variable turbine geometry (“VTG”) turbochargers and turbochargers for gasoline direct injected engines. In2006, the Company launched a high temperature VTG turbocharger for a Porsche 3.6 liter gasolineapplication, an R2S application for a Daimler light-truck called the Sprinter and VTG turbochargers forthe Hyundai A-engine family. In 2007, the Company began supplying its R2S turbocharger technologycombined with variable turbine geometry to International Engine Group’s PowerStroke 6.4-liter V8 dieselengine used in Ford’s F-Series heavy-duty pickup trucks. In 2008, the Company announced the start ofproduction of its award winning R2S technology for Daimler’s new 4 cylinder diesel engine range. TheCompany also began shipping VTG turbochargers for VW’s new common-rail engine range and announcedthe launch of a VTG turbocharger for use with low-pressure exhaust gas recirculation to reduce emissions onVW’s Jetta Clean Diesel TDI.
The Engine Group also designs and manufactures products to control emissions and improve fueleconomy. These products include electric air pumps, turbo actuators that use integrated electronics toprecisely control turbocharger speed and pressure ratio, and exhaust gas recirculation valves for gasolineand diesel applications. The Engine Group also manufactures a wide variety of fluid pumps, including engineoil pumps for engine and transmission lubrication, and products for engine air intake management.
The Engine Group’s chain and chain systems products include timing chain and timing drive systems,variable cam timing (“VCT”) systems, crankshaft and camshaft sprockets, tensioners, guides and snubbers,HY-VO» front-wheel drive (“FWD”) transmission chain and four-wheel drive (“4WD”) chain, and MORSEGEMINI» chain systems for light-vehicle and commercial-vehicle applications.
The Company’s timing chain systems are used in Ford’s family of overhead cam engines, including theDuratec and Modular, and in-line 4 cylinder engines, as well as on Chrysler’s 2.7 liter, 3.7 liter and 4.7 liter,overhead cam engines, as well as the 4 cylinder World Engine family of engines. In addition, the Companyprovides timing systems to a number of Asian OEMs and their North American transplant operations,including Honda, Nissan, and Hyundai, and to several European OEMs. The Company believes that it is theworld’s leading manufacturer of timing chain systems.
The Engine Group has successfully launched its latest VCT product; Cam Torque ActuatedTM (“CTA”) VCT.VCT is a means of precisely controlling the flow of air into and out of an engine by allowing the camshaft to bedynamically phased relative to its crankshaft. The Company’s CTA technology utilizes camshaft torque as itsmain actuation energy, instead of the conventional oil-pressure actuated approach. The CTA system has beenlaunched on Ford’s 3.0 liter Duratec engine featured in the Ford Escape, Ford Fusion, Mazda 6, and MercuryMariner.
The Company believes it is the world’s leading manufacturer of chain for FWD transmissions and 4WDtransfer cases. HY-VO chain is used to transfer power from the engine to the drivetrain. The Company’sMORSE GEMINI transmission chain system emits significantly less chain pitch frequency noise thanconventional transmission chain systems. The chain in a transfer case distributes power between a vehicle’sfront and rear output shafts which, in turn, provide torque to the front and rear wheels.
The Engine Group believes it is a leading global provider of engine thermal solutions for truck, agriculturaland off-highway applications. The group designs, manufactures and markets viscous fan drives that controlfans to sense and respond to multiple cooling requirements. The Engine Group also manufactures andmarkets polymer fans for engine cooling systems. The Company’s thermal products provide improved vehiclefuel economy and reduced engine emissions while minimizing parasitic horsepower loss. The Company hasbeen awarded the “standard position” (the OEM-designated preferred supplier of component systemsavailable to the end-customer) at the major global heavy truck producers.
In 2005, the Company acquired approximately 69.4% of the outstanding shares of BERU Aktienge-sellschaft (“BERU”), headquartered in Ludwigsburg, Germany. In 2007, the Company increased its
5

ownership to approximately 82.2%. In the second quarter of 2008, the Company and BERU completed aDomination and Profit Transfer Agreement (“DPTA”), giving BorgWarner full control of BERU. Refer to Note 20,“Recent Transactions” of the Notes to the Consolidated Financial Statements in Item 8 of this report for furtherinformation related to the Company’s DPTA agreement with BERU.
As a result of the tendering of shares in 2008 in accordance with the DPTA, the Company ownsapproximately 96% of all BERU’s outstanding shares. On January 7, 2009, the Company informed BERU ofits intention to purchase the remaining outstanding shares of approximately 4%, using the required Germanlegal process referred to as a “squeeze-out” to complete the 100% ownership.
BERU’s operating results are included within the Company’s Engine Group segment. BERU is a leadingglobal automotive supplier of diesel cold starting technology (glow plugs and instant starting systems); gasolineignition technology (spark plugs and ignition coils); and electronic control units and sensor technology (tirepressure sensors, diesel cabin heaters and selected sensors). In 2008, BERU launched its new Pressure SensorGlow Plug with which the combustion processes of a diesel engine allowing the lowest CO2 and NOx emissionspossible.
Drivetrain
The Drivetrain Group leverages the Company’s expertise in clutching and control systems to enableefficient transmission of engine torque through the vehicle drivetrain and management of torque distributionto the driven wheels. The Company’s technology can improve fuel efficiency and help reduce emissions in alltypes of powertrains. The Drivetrain Group’s major products are transmission components and systems, andAWD torque management systems.
The Drivetrain Group designs and manufactures automatic transmission components and modules andis a supplier to virtually every major automatic transmission manufacturer in the world for both conventionalautomatic and new dual-clutch transmissions (“DCT”).
“Shift quality” products are provided in four principal categories. DCT products include dual-clutchmodules, torsional vibration dampers and mechatronic control modules. Friction products include frictionplates, transmission bands, torque converter clutches, and friction clutch modules.
One-way clutches and torsional vibration dampers are mechanical products. The controls products linefeatures electro-hydraulic solenoids, solenoid modules and high pressure solenoids for automated manualtransmissions (“AMT”s).
The Company’s 50%-owned joint venture in Japan, NSK-Warner Kabushiki Kaisha (“NSK-Warner”), is aleading producer of friction plates and one-way clutches in Japan. NSK-Warner is also the joint venturepartner with a 40% interest in the Drivetrain Group’s Korean subsidiary, BorgWarner Transmission SystemsKorea, Inc.
The Company has led the globalization of today’s DCT technology for over ten years. Following thedevelopment of its DCT technology in the 1990s, the Company established its industry-leading position inEurope in 2003 with the production launch of its award-winning DualTronic» innovations with VW/Audi. In2006, the Company was awarded the first dual-clutch program in China with SAIC. In 2007, the Companylaunched its first dual-clutch technology application in a Japanese transmission with Nissan.
The Company has announced programs with customers that include VW, Audi, Bugatti, SAIC andNissan, in addition to Getrag DCT programs with five additional global automakers. Also, the Company isworking on over 20 programs with OEMs around the world. BorgWarner DualTronic technology provides bothbetter fuel-efficiency and a great driving experience, enabling a conventional, manual gearbox to function as afully automatic transmission by eliminating the interruption in power flow that occurs when a single clutchmanual transmission shifts gears.
In conventional automatic transmissions, there has been a global market trend from four and five speedsto six, seven, and even eight speed transmissions. Transmissions with more speeds improve fuel economyand vehicle performance and offer growth opportunities.
6
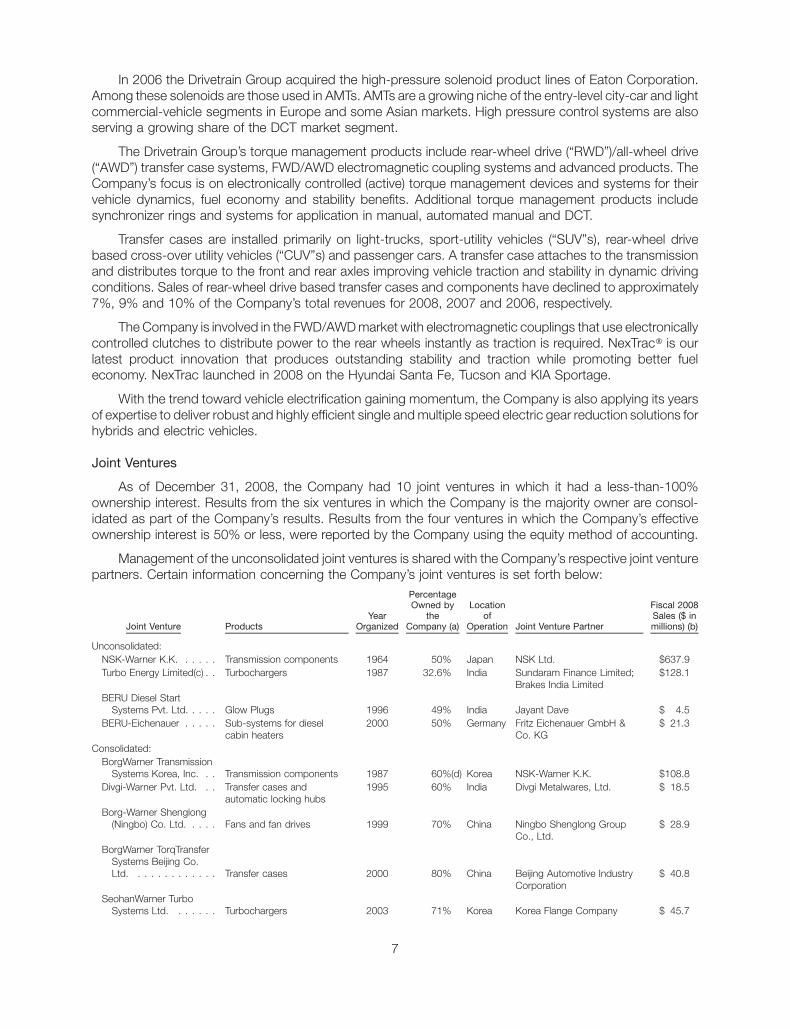
In 2006 the Drivetrain Group acquired the high-pressure solenoid product lines of Eaton Corporation.Among these solenoids are those used in AMTs. AMTs are a growing niche of the entry-level city-car and lightcommercial-vehicle segments in Europe and some Asian markets. High pressure control systems are alsoserving a growing share of the DCT market segment.
The Drivetrain Group’s torque management products include rear-wheel drive (“RWD”)/all-wheel drive(“AWD”) transfer case systems, FWD/AWD electromagnetic coupling systems and advanced products. TheCompany’s focus is on electronically controlled (active) torque management devices and systems for theirvehicle dynamics, fuel economy and stability benefits. Additional torque management products includesynchronizer rings and systems for application in manual, automated manual and DCT.
Transfer cases are installed primarily on light-trucks, sport-utility vehicles (“SUV”s), rear-wheel drivebased cross-over utility vehicles (“CUV”s) and passenger cars. A transfer case attaches to the transmissionand distributes torque to the front and rear axles improving vehicle traction and stability in dynamic drivingconditions. Sales of rear-wheel drive based transfer cases and components have declined to approximately7%, 9% and 10% of the Company’s total revenues for 2008, 2007 and 2006, respectively.
The Company is involved in the FWD/AWD market with electromagnetic couplings that use electronicallycontrolled clutches to distribute power to the rear wheels instantly as traction is required. NexTrac» is ourlatest product innovation that produces outstanding stability and traction while promoting better fueleconomy. NexTrac launched in 2008 on the Hyundai Santa Fe, Tucson and KIA Sportage.
With the trend toward vehicle electrification gaining momentum, the Company is also applying its yearsof expertise to deliver robust and highly efficient single and multiple speed electric gear reduction solutions forhybrids and electric vehicles.
Joint Ventures
As of December 31, 2008, the Company had 10 joint ventures in which it had a less-than-100%ownership interest. Results from the six ventures in which the Company is the majority owner are consol-idated as part of the Company’s results. Results from the four ventures in which the Company’s effectiveownership interest is 50% or less, were reported by the Company using the equity method of accounting.
Management of the unconsolidated joint ventures is shared with the Company’s respective joint venturepartners. Certain information concerning the Company’s joint ventures is set forth below:
Joint Venture ProductsYear
Organized
PercentageOwned by
theCompany (a)
Locationof
Operation Joint Venture Partner
Fiscal 2008Sales ($ inmillions) (b)
Unconsolidated:NSK-Warner K.K. . . . . . Transmission components 1964 50% Japan NSK Ltd. $637.9Turbo Energy Limited(c) . . Turbochargers 1987 32.6% India Sundaram Finance Limited;
Brakes India Limited$128.1
BERU Diesel StartSystems Pvt. Ltd. . . . . Glow Plugs 1996 49% India Jayant Dave $ 4.5
BERU-Eichenauer . . . . . Sub-systems for dieselcabin heaters
2000 50% Germany Fritz Eichenauer GmbH &Co. KG
$ 21.3
Consolidated:BorgWarner Transmission
Systems Korea, Inc. . . Transmission components 1987 60%(d) Korea NSK-Warner K.K. $108.8Divgi-Warner Pvt. Ltd. . . Transfer cases and
automatic locking hubs1995 60% India Divgi Metalwares, Ltd. $ 18.5
Borg-Warner Shenglong(Ningbo) Co. Ltd. . . . . Fans and fan drives 1999 70% China Ningbo Shenglong Group
Co., Ltd.$ 28.9
BorgWarner TorqTransferSystems Beijing Co.Ltd. . . . . . . . . . . . . Transfer cases 2000 80% China Beijing Automotive Industry
Corporation$ 40.8
SeohanWarner TurboSystems Ltd. . . . . . . Turbochargers 2003 71% Korea Korea Flange Company $ 45.7
7

Joint Venture ProductsYear
Organized
PercentageOwned by
theCompany (a)
Locationof
Operation Joint Venture Partner
Fiscal 2008Sales ($ inmillions) (b)
BERU Korea Co. Ltd. . . . Ignition coils and pumps 2001 51% Korea Mr. K.B. Mo and Mr. D.H.Kim
$ 34.2
(a) In the second quarter of 2008, the Company and BERU AG (“BERU”) completed a Domination and ProfitTransfer Agreement (“DPTA”), giving BorgWarner full control of BERU. For the joint ventures in whichBERU is a party, the percentage of ownership for each joint venture reflects BERU’s ownershippercentage.
(b) All sales figures are for the year ended December 31, 2008, except NSK-Warner and Turbo EnergyLimited. NSK-Warner’s sales are reported for the 12 months ended November 30, 2008. Turbo EnergyLimited’s sales are reported for the 12 months ended September 30, 2008
(c) The Company made purchases from Turbo Energy Limited totaling $25.4 million, $25.1 million and$18.7 million for the years ended December 31, 2008, 2007, and 2006, respectively.
(d) BorgWarner Inc. owns 50% of NSK-Warner, which has a 40% interest in BorgWarner TransmissionSystems Korea, Inc. This gives the Company an additional indirect effective ownership percentage of20%. This results in a total effective ownership interest of 80%.
Financial Information About Geographic Areas
Refer to Note 21, “Reporting Segments and Related Information” of the Notes to the ConsolidatedFinancial Statements in Item 8 of this report for financial information about geographic areas.
Approximately 72% of the Company’s consolidated sales for 2008 were outside the United States,including exports. However, a portion of such sales was to OEMs headquartered outside the United Statesthat produce vehicles that are, in turn, exported to the United States.
Customers
Approximately 72% of the Company’s total sales in 2008 were for light-vehicle applications, with theremaining 28% of the Company’s sales to a diversified group of commercial truck, bus, construction andagricultural vehicle manufacturers, and to distributors of aftermarket replacement parts.
For the most recent three-year period, the Company’s worldwide sales to the following customers wereapproximately as follows:
Customer 2008 2007 2006
Volkswagen . . . . . . . . . . . . . . . . . . . . . . . . . . . . . . . . . . . . . . . . . . . . . . . 19% 15% 13%Ford . . . . . . . . . . . . . . . . . . . . . . . . . . . . . . . . . . . . . . . . . . . . . . . . . . . . 9% 12% 13%Daimler . . . . . . . . . . . . . . . . . . . . . . . . . . . . . . . . . . . . . . . . . . . . . . . . . . 6% 6% 11%
Daimler divested Chrysler in 2007. No other single customer accounted for more than 10% of ourconsolidated sales in any year of the periods presented.
The Company’s automotive products are generally sold directly to OEMs substantially pursuant tonegotiated annual contracts, long-term supply agreements or terms and conditions as may be modified bythe parties. Deliveries are subject to periodic authorizations based upon the production schedules of theOEMs. The Company typically ships its products directly from its plants to the OEMs.
Sales and Marketing
Each of the Company’s business units within its two reporting segments has its own sales function.Account executives for each of our business units are assigned to serve specific OEM customers for one ormore of a business unit’s products. Our account executives spend the majority of their time in direct contactwith OEM purchasing and engineering employees and are responsible for servicing existing business and for
8

identifying and obtaining new business. Because of their close relationship with OEMs, account executivesare able to identify and meet customers’ needs based upon their knowledge of our customer’s needs and ourproducts and design and manufacturing capabilities. Upon securing a new order, account executivesparticipate in product launch team activities and serve as a key interface with the customers.
In addition, the sales and marketing employees of our Engine segment and Drivetrain segment oftenwork together to explore cross-development opportunities for the business units. The development ofDualTronic, the Company’s wet-clutch and control-system technology for a new-concept automatedtransmission, is an example of a successful collaboration.
Seasonality
The Company’s business is moderately seasonal because the Company’s largest North Americancustomers typically halt vehicle production for approximately two weeks in July and one week in December.Additionally, customers in Europe and Asia typically shut down vehicle production during portions of July orAugust and one week in the fourth quarter. Accordingly, the Company’s third and fourth quarters may reflectthose practices.
Research and Development
The Company conducts advanced engine and drivetrain research at the segment level. This advancedengineering function looks to leverage electronics and the Company’s expertise across product lines tocreate new engine and drivetrain systems and modules that can be commercialized. A venture capital fundthat was created by the Company as seed money for new innovation and collaboration across businesses ismanaged by this function.
In addition, each of the Company’s operating segments has its own research and development (“R&D”)organization. The Company has approximately 800 employees, including engineers, mechanics and tech-nicians, engaged in R&D activities at facilities worldwide. The Company also operates testing facilities such asprototype, measurement and calibration, life cycle testing and dynamometer laboratories.
By working closely with the OEMs and anticipating their future product needs, the Company’s R&Dpersonnel conceive, design, develop and manufacture new proprietary automotive components and sys-tems. R&D personnel also work to improve current products and production processes. The Companybelieves its commitment to R&D will allow it to obtain new orders from its OEM customers.
The following table presents the Company’s gross and net expenditures on R&D activities:
2008 2007 2006Year Ended December 31,
Millions of dollars
Gross R&D expenditures. . . . . . . . . . . . . . . . . . . . . . . . . . . . . . . $273.4 $246.7 $219.5Customer reimbursements . . . . . . . . . . . . . . . . . . . . . . . . . . . . . (67.7) (35.9) (31.8)
Net R&D expenditures . . . . . . . . . . . . . . . . . . . . . . . . . . . . . . . . $205.7 $210.8 $187.7
The Company’s net R&D expenditures are included in the selling, general, and administrative expensesof the Consolidated Statements of Operations. Customer reimbursements are netted against gross R&Dexpenditures upon billing of services performed. The Company has contracts with several customers at theCompany’s various R&D locations. No such contract exceeded $6.0 million in any of the years presented.
Patents and Licenses
The Company has approximately 3,800 active domestic and foreign patents and patent applicationspending or under preparation, and receives royalties from licensing patent rights to others. While it considersits patents on the whole to be important, the Company does not consider any single patent, any group ofrelated patents or any single license essential to its operations in the aggregate or to the operations of any ofthe Company’s business groups individually. The expiration of the patents individually and in the aggregate is
9

not expected to have a material effect on the Company’s financial position or future operating results. TheCompany owns numerous trademarks, some of which are valuable, but none of which are essential to itsbusiness in the aggregate.
The Company owns the “BorgWarner” and “Borg-Warner Automotive” trade names and housemarks,and variations thereof, which are material to the Company’s business.
Competition
The Company’s operating segments compete worldwide with a number of other manufacturers anddistributors which produce and sell similar products. Many of these competitors are larger and have greaterresources than the Company. Price, quality, delivery, technological innovation, application engineeringdevelopment and program launch support are the primary elements of competition.
The Company’s major competitors by product type follow:
Product Type: Engine Name of Competitor
Turbochargers: . . . . . . . . . . . . . . . . . . . . . . . . . . . . . . . . . . HoneywellIHIMitsubishi Heavy Industries (MHI)
VCT: . . . . . . . . . . . . . . . . . . . . . . . . . . . . . . . . . . . . . . . . . . AisinDensoHitachi
Chains:. . . . . . . . . . . . . . . . . . . . . . . . . . . . . . . . . . . . . . . . IwisSchaeffler GroupTsubaki Group
Emissions products: . . . . . . . . . . . . . . . . . . . . . . . . . . . . . . BoschPierburgValeo
Thermal products:. . . . . . . . . . . . . . . . . . . . . . . . . . . . . . . . BehrHorton/SachsUsui
Diesel cold start technology: . . . . . . . . . . . . . . . . . . . . . . . . BoschNGK
Product Type: Drivetrain Name of Competitor
Torque transfer products: . . . . . . . . . . . . . . . . . . . . . . . . . . GKN DrivelineJTEKTMagna Powertrain
Transmission products: . . . . . . . . . . . . . . . . . . . . . . . . . . . . BoschDensoDynaxSchaeffler Group
In addition, a number of the Company’s major OEM customers manufacture, for their own use and forothers, products which compete with the Company’s products. Although these OEM customers haveindicated that they will continue to rely on outside suppliers, the OEMs could elect to manufacture products tomeet their own requirements or to compete with the Company. There can be no assurance that theCompany’s business will not be adversely affected by increased competition in the markets in which itoperates.
For many of its products, the Company’s competitors include suppliers in other parts of the world thatenjoy economic advantages such as lower labor costs, lower health care costs and, in some cases, exportsubsidies and/or raw materials subsidies. Also, see Item 1A. Risk Factors.
10
Employees
As of December 31, 2008, the Company and its consolidated subsidiaries had approximately 13,800salaried and hourly employees (as compared with approximately 17,700 employees at December 31, 2007),of which approximately 4,100 were U.S. employees. Approximately 13% of the Company’s U.S. workforce isunionized. The hourly employees at certain of our international facilities are also unionized. The Companybelieves its present relations with employees to be satisfactory.
Our two domestic collective bargaining agreements are for our Muncie, Indiana plant and our Ithaca andCortland, New York facilities. The Muncie agreement expires on April 24, 2009. The agreement covering theNew York facilities expires in September 2012.
Raw Materials
Continuing a trend which began in 2004, several raw materials used in the Company’s products hitrecord pricing levels in the second quarter of 2008, including steel, aluminum, copper, resins and certainalloying elements. This was due to a host of supply and demand factors.
Despite these challenges, the Company used a variety of tactics in order to limit the impact of inflationaryprices and supply shortages. The Company formed a global procurement organization to accelerate: costreductions, purchases from lower cost regions, risk mitigation efforts, and collaborative buying activities. Inaddition, the Company used long-term contracts, cost sharing arrangements, design changes, customerbuy programs, and hedging instruments to help control costs. The Company intends to use similar measuresin 2009 and beyond. Refer to Note 11, “Financial Instruments” of the Notes to the Consolidated FinancialStatements in Item 8 of this report for information related to the Company’s hedging activities.
For 2009, the Company believes that its supplies of raw materials and energy are adequate and availablefrom multiple sources to support its manufacturing requirements. Manufacturing operations for each of theCompany’s operating segments are dependent upon natural gas, fuel oil, and electricity.
Environmental Regulation and Proceedings
The Company and certain of its current and former direct and indirect corporate predecessors,subsidiaries and divisions have been identified by the United States Environmental Protection Agencyand certain state environmental agencies and private parties as potentially responsible parties (“PRPs”) atvarious hazardous waste disposal sites under the Comprehensive Environmental Response, Compensationand Liability Act (“Superfund”) and equivalent state laws and, as such, may presently be liable for the cost ofclean-up and other remedial activities at 35 such sites. Responsibility for clean-up and other remedialactivities at a Superfund site is typically shared among PRPs based on an allocation formula.
The Company believes that none of these matters, individually or in the aggregate, will have a materialadverse effect on its results of operations, financial position, or cash flows. Generally, this is because either theestimates of the maximum potential liability at a site are not large or the liability will be shared with other PRPs,although no assurance can be given with respect to the ultimate outcome of any such matter.
Based on information available to the Company (which in most cases includes: an estimate of allocationof liability among PRPs; the probability that other PRPs, many of whom are large, solvent public companies,will fully pay the cost apportioned to them; currently available information from PRPs and/or federal or stateenvironmental agencies concerning the scope of contamination and estimated remediation and consultingcosts; remediation alternatives; and estimated legal fees), the Company has established an accrual forindicated environmental liabilities with a balance at December 31, 2008 of $11.9 million. The Company hasaccrued amounts that do not exceed $3.4 million related to any individual site and we do not believe that thecosts related to any of these sites will have a material adverse effect on the Company’s results of operations,cash flows or financial condition. The Company expects to pay out substantially all of the amounts accrued forenvironmental liability over the next three to five years.
11
In connection with the sale of Kuhlman Electric Corporation, the Company agreed to indemnify the buyerand Kuhlman Electric for certain environmental liabilities, then unknown to the Company, relating to certainoperations of Kuhlman Electric that pre-date the Company’s 1999 acquisition of Kuhlman Electric. During2000, Kuhlman Electric notified the Company that it discovered potential environmental contamination at itsCrystal Springs, Mississippi plant while undertaking an expansion of the plant. The Company is continuing towork with the Mississippi Department of Environmental Quality and Kuhlman Electric to investigate andremediate to the extent necessary, historical contamination at the plant and surrounding area. KuhlmanElectric and others, including the Company, were sued in numerous related lawsuits, in which multipleclaimants alleged personal injury and property damage. In 2005, the Company and other defendants enteredinto settlements that resolved approximately 99% of the then known personal injury and property damageclaims relating to the alleged environmental contamination. Those settlements involved payments by theCompany of $28.5 million in the second half of 2005 and $15.7 million in the first quarter of 2006, in exchangefor, among other things, dismissal with prejudice of these lawsuits.
In December 2007, a lawsuit was filed against Kuhlman Electric and others, including the Company, onbehalf of approximately 209 plaintiffs, alleging personal injury relating to the alleged environmental contam-ination. In August 2008, two similar lawsuits were filed against Kuhlman Electric and others, including theCompany, on behalf of approximately 100 plaintiffs and 30 plaintiffs, respectively, alleging personal injuryrelated to the alleged environmental contamination. Given the early stage of the litigation, the Companycannot make any predictions as to the outcome, but its current intent is to vigorously defend against the suits.
Conditional Asset Retirement Obligations
In March 2005, the FASB issued Interpretation No. 47, Accounting for Conditional Asset RetirementObligations — an interpretation of FASB Statement No. 143 (“FIN 47”), which requires the Company torecognize legal obligations to perform asset retirements in which the timing and/or method of settlement areconditional on a future event that may or may not be within the control of the entity. Certain governmentregulations require the removal and disposal of asbestos from an existing facility at the time the facilityundergoes major renovations or is demolished. The liability exists because the facility will not last forever, but itis conditional on future renovations (even if there are no immediate plans to remove the materials, which poseno health or safety hazard in their current condition). Similarly, government regulations require the removal orclosure of underground storage tanks (“USTs”) and above ground storage tanks (“ASTs”) when their useceases, the disposal of polychlorinated biphenyl (“PCB”) transformers and capacitors when their use ceases,and the disposal of used furnace bricks and liners, and lead-based paint in conjunction with facilityrenovations or demolition. The Company currently has 32 manufacturing locations that have been identifiedas containing these items. The fair value to remove and dispose of this material has been estimated andrecorded at $1.4 million as of December 31, 2008 and $1.0 million as of December 31, 2007.
Available Information
Through its Internet website (www.borgwarner.com), the Company makes available, free of charge, itsAnnual Report on Form 10-K, Quarterly Reports on Form 10-Q, Current Reports on Form 8-K, all amend-ments to those reports, and other filings with the Securities and Exchange Commission, as soon asreasonably practicable after they are filed or furnished. The Company also makes the following documentsavailable on its Internet website: the Audit Committee Charter; the Compensation Committee Charter; theCorporate Governance Committee Charter; the Company’s Corporate Governance Guidelines; the Com-pany’s Code of Ethical Conduct; and the Company’s Code of Ethics for CEO and Senior Financial Officers.You may also obtain a copy of any of the foregoing documents, free of charge, if you submit a written requestto Mary Brevard, Vice President, Investor Relations, 3850 Hamlin Road, Auburn Hills, Michigan 48326.
12

Executive Officers of the Registrant
Set forth below are the names, ages, positions and certain other information concerning the executiveofficers of the Company as of February 12, 2009.
Name Age Position With Company
Timothy M. Manganello . . . . . . . . . . . 59 Chairman and Chief Executive OfficerRobin J. Adams . . . . . . . . . . . . . . . . 55 Executive Vice President, Chief Financial Officer
and Chief Administrative OfficerAngela J. D’Aversa . . . . . . . . . . . . . . 62 Vice President, Human ResourcesDaniel CasaSanta . . . . . . . . . . . . . . . 54 Vice PresidentJohn J. Gasparovic . . . . . . . . . . . . . . 51 Vice President, General Counsel & SecretaryAnthony D. Hensel . . . . . . . . . . . . . . 50 Vice President and TreasurerBernd W. Matthes. . . . . . . . . . . . . . . 48 Vice PresidentJeffrey L. Obermayer . . . . . . . . . . . . 53 Vice President and ControllerThomas Waldhier . . . . . . . . . . . . . . . 46 Vice PresidentAlfred Weber . . . . . . . . . . . . . . . . . . 51 Vice PresidentRoger J. Wood . . . . . . . . . . . . . . . . . 46 Vice President
Mr. Manganello has been Chairman of the Board since June 2003 and Chief Executive Officer of theCompany since February 2003. He was also President and Chief Operating Officer from February 2002 untilFebruary 2003. Mr. Manganello is also a director of Bemis Company, Inc. and he serves as the BoardChairman of Federal Reserve Bank of Chicago, Detroit branch.
Mr. Adams has been Executive Vice President, Chief Financial Officer and Chief Administrative Officersince April 2004. He was Executive Vice President — Finance and Chief Financial Officer of American Axle &Manufacturing Holdings Inc. (“American Axle”) from July 1999 until April 2004. Mr. Adams also is a member ofthe Supervisory Board of BERU AG.
Mr. CasaSanta has been Vice President of the Company and President and General Manager ofBorgWarner TorqTransfer Systems Inc. (“TTS”) since June 2008. He was Vice President and GeneralManager of Thermal Systems from January 2003 until June 2008.
Ms. D’Aversa has been Vice President, Human Resources since October 2004. She was Acting VicePresident, Human Resources from April 2004 until September 2004 and Senior Director, Management andOrganization Development from April 2004 until September 2004. She was Director Management & Orga-nization Development from January 1995 until March 2004.
Mr. Gasparovic has been Vice President, General Counsel and Secretary of the Company sinceJanuary 2007. After working as a private investor from January 2004 until January 2005, he was SeniorVice President and General Counsel of Federal-Mogul Corporation from February 2005 until December 2006.From February 2003 until December 2003, he was Executive Vice President, General Counsel, CorporateSecretary and Chief Compliance Officer and from May 2000 until January 2003 he was Vice President,General Counsel (and Secretary since January 2001) of Roadway Corporation.
Mr. Hensel has been Vice President of the Company since July 2002 and Treasurer since January 2005.He was Vice President, Business Development from July 2002 until December 2004. Mr. Hensel also is amember of the Supervisory Board of BERU AG.
Mr. Matthes has been Vice President of the Company and President and General Manager ofBorgWarner Transmission Systems Inc. (“Transmission Systems”) since July 2005. He was General Manager,Operations Europe for Transmission Systems from August 2004 to July 2005. He was Vice President-Operations Europe for Transmission Systems from January 2003 to August 2004. He was General Manager,DualTronic from November 2000 to July 2005.
13

Mr. Obermayer has been Vice President since December 1999 and Controller since January 2005. Hewas Vice President and Treasurer of the Company from December 1999 to December 2004.
Mr. Waldhier has been Vice President of the Company since November 2008 and Chief Executive Officerof BERU since October 2007. He was a member of the Management Board of SAS Autosystemtechnik andExecutive Vice President and Chief Operating Officer of SAS Automotive from April 2004 to October 2007. Hewas Vice President of Faurecia Interior Systems from January 2001 to March 2004.
Mr. Weber has been Vice President of the Company since July 2002. He has been President and GeneralManager of BorgWarner Morse TEC Inc. (“Morse TEC”) since August 2005 and BorgWarner ThermalSystems Inc. since January 2003. He was President and General Manager of BorgWarner EmissionsSystems Inc. from July 2002 to July 2005. Mr. Weber also is a member of the Supervisory Board of BERU AG.
Mr. Wood has been Vice President of the Company since January 2001 and President and GeneralManager of BorgWarner Turbo Systems Inc. and BorgWarner Emissions Systems Inc. since August 2005. Hewas President and General Manager of Morse TEC from January 2001 to July 2005.
Item 1A. Risk Factors
The following risk factors and other information included in this Annual Report on Form 10-K should beconsidered. The risks and uncertainties described below are not the only ones we face. Additional risks anduncertainties not presently known to us or that we currently deem immaterial also may impair our businessoperations. If any of the following risks occur, our business including its financial performance, financialcondition, operating results and cash flows could be materially adversely affected.
Our industry is cyclical and our results of operations will be adversely affected by industry downturns.
Automotive and truck production and sales are cyclical and sensitive to general economic conditionsand other factors including interest rates, consumer credit, and consumer spending and preferences. Furthereconomic decline that results in further significant reduction in automotive or truck production would have amaterial adverse effect on our sales to original equipment manufacturers.
We have initiated steps to realign and resize our production capacity and cost structure to meet currentand projected operational and market requirements. Further significant declines in the automotive industryand financial declines and restructurings by our significant customers may make it necessary to take furtherrestructuring actions and charges.
We are dependent on market segments that use our key products and would be affected by decreas-ing demand in those segments.
Some of our products, in particular turbochargers, are currently used primarily in diesel passenger carsand commercial vehicles. Any significant reduction in production in these market segments or loss ofbusiness in these market segments could have a material adverse effect on our sales to original equipmentmanufacturers.
We face strong competition.
We compete worldwide with a number of other manufacturers and distributors that produce and sellproducts similar to ours. Price, quality and technological innovation are the primary elements of competition.Our competitors include vertically integrated units of our major original equipment manufacturer customers,as well as a large number of independent domestic and international suppliers. We are not as large as anumber of these companies and do not have as many financial or other resources. The competitiveenvironment has changed dramatically over the past few years as our traditional U.S. original equipmentmanufacturer customers, faced with intense international competition, have expanded their worldwidesourcing of components. As a result, we have experienced competition from suppliers in other parts ofthe world that enjoy economic advantages, such as lower labor costs, lower health care costs and, in somecases, export or raw materials subsidies. Increased competition could adversely affect our businesses.
14

We are under substantial pressure from original equipment manufacturers to reduce the prices of ourproducts.
There is substantial and continuing pressure on original equipment manufacturers to reduce costs,including costs of products we supply. Although original equipment manufacturers have indicated that theywill continue to rely on outside suppliers, a number of our major original equipment manufacturer customersmanufacture products for their own uses that directly compete with our products. These original equipmentmanufacturers could elect to manufacture such products for their own uses in place of the products wecurrently supply. We believe that our ability to develop proprietary new products and to control our costs willallow us to remain competitive. However, we cannot assure you that we will be able to improve or maintain ourgross margins on product sales to original equipment manufacturers or that the recent trend by originalequipment manufacturers towards increased outsourcing will continue.
Annual price reductions to original equipment manufacturer customers appear to have become apermanent feature of our business environment. To maintain our profit margins, we seek price reductionsfrom our suppliers, improve production processes to increase manufacturing efficiency, update productdesigns to reduce costs and develop new products, the benefits of which support stable or increased prices.Our ability to pass through increased raw material costs to our original equipment manufacturer customers islimited, with cost recovery often less than 100% and often on a delayed basis. We cannot assure you that wewill be able to reduce costs in an amount equal to annual price reductions and increases in raw material costs.
We are sensitive to the effects of our major customers’ labor relations.
All three of our primary North American customers, Ford, Chrysler and General Motors, have major unioncontracts with the United Automobile, Aerospace and Agricultural Implement Workers of America. Becauseof domestic original equipment manufacturers’ dependence on a single union, we are affected by labordifficulties and work stoppages at original equipment manufacturers’ facilities. Similarly, a majority of ourglobal customers’ operations outside of North America are also represented by various unions. Any extendedwork stoppage could have an adverse effect on our business.
Part of our labor force is unionized which could subject us to work stoppages.
As of December 31, 2008, approximately 13% of our U.S. workforce was unionized. Our two domesticcollective bargaining agreements are for our Muncie, Indiana plant and our Ithaca and Cortland, New Yorkfacilities. The Muncie agreement expires on April 24, 2009. The agreement covering the New York facilitiesexpires in September 2012. The hourly employees at certain of our international facilities are also unionized.While we believe that our relations with our employees are satisfactory, a prolonged dispute with ouremployees could have an adverse effect on our business.
We are subject to extensive environmental regulations.
Our operations are subject to laws governing, among other things, emissions to air, discharges to watersand the generation, handling, storage, transportation, treatment and disposal of waste and other materials.We believe that our business, operations and activities have been and are being operated in compliance in allmaterial respects with applicable environmental, health and safety laws. However, the operation of auto-motive parts manufacturing plants entails risks in these areas, and we cannot assure you that we will not incurmaterial costs or liabilities as a result. Furthermore, through various acquisitions over the years, we haveacquired a number of manufacturing facilities, and we cannot assure you that we will not incur materials costsand liabilities relating to activities that predate our ownership. In addition, potentially significant expenditurescould be required in order to comply with evolving environmental, health and safety laws that may be adoptedin the future.
15

We have contingent liabilities related to environmental, product warranties, regulatory matters,litigation and other claims.
We and certain of our current and former direct and indirect corporate predecessors, subsidiaries anddivisions have been identified by the United States Environmental Protection Agency and certain stateenvironmental agencies and private parties as potentially responsible parties at various hazardous wastedisposal sites under the Comprehensive Environmental Response, Compensation and Liability Act andequivalent state laws. As a result, as of December 31, 2008, we may be liable for the cost of clean-up andother remedial activities at 35 of these sites.
We work with outside experts to determine a range of potential liability for environmental sites. Theranges for each individual site are then aggregated into a loss range for the total accrued liability.Management’s estimate of the loss range for environmental liability, including conditional asset retirementobligations, for 2008 is between $12.4 million and $26.1 million. We record an accrual at the most probableamount within the range unless one cannot be determined; in which case we record the accrual at the lowend of the range. Based on information available to us, we have established an accrual in our financialstatements for indicated environmental liabilities, including our conditional asset retirement obligation underFIN 47, with a total balance of $1.4 million at December 31, 2008. We currently expect the substantial portionof this amount to be expended over the next three to five years.
We provide warranties to our customers for some of our products. Under these warranties, we may berequired to bear costs and expenses for the repair or replacement of these products. We cannot assure youthat costs and expenses associated with these product warranties will not be material, or that those costs willnot exceed any amounts accrued for such warranties in our financial statement. Based upon informationavailable to us, we have established an accrual in our financial statements for product warranties of$82.1 million at December 31, 2008.
We are also party to, or have an obligation to defend a party to, various legal proceedings, includingthose described in Note 15 to the Notes to the Consolidated Financial Statements in the Company’s AnnualReport on Form 10-K.
We are currently, and may in the future become, subject to legal proceedings and commercial orcontractual disputes. These claims typically arise in the normal course of business and may include, but notbe limited to, commercial or contractual disputes with our suppliers, intellectual property matters andemployment claims. There is a possibility that such claims may have an adverse impact on our business thatis greater than we anticipate.
Our growth strategy may prove unsuccessful.
We have a stated goal of increasing revenues and operating revenues at a rate greater than global vehicleproduction by increasing content per vehicle with innovative new components and through select acqui-sitions. We may not meet our goal because of any of the following: (a) the failure to develop new productswhich will be purchased by our customers; (b) technology changes rendering our products obsolete; (c) areversal of the trend of supplying systems (which allows us to increase content per vehicle) instead ofcomponents; and (d) the failure to find suitable acquisition targets or the failure to integrate operations ofacquired businesses quickly and cost effectively.
We are subject to risks related to our international operations.
We have manufacturing and technical facilities in many regions and countries, including North America,Europe, China, India, South Korea, Japan, and Brazil and sell our products worldwide. For 2008, approx-imately 68% of our sales were outside North America. Consequently, our results could be affected bychanges in trade, monetary and fiscal policies, trade restrictions or prohibitions, import or other charges ortaxes, and fluctuations in foreign currency exchange rates, limitations on the repatriation of funds changingeconomic conditions, social unrest, political instability and disputes, and international terrorism. Compliancewith multiple and potentially conflicting laws and regulations of various countries is burdensome and
16

expensive. See Note 21, “Reporting Segments and Related Information” to Consolidated Financial State-ments in the Company’s Annual Report on Form 10-K.
We may not realize sales represented by awarded business.
We base our growth projections, in part, on commitments made by our customers. These commitmentsgenerally renew yearly during a program life cycle. If actual production orders from our customers do notapproximate such commitments, it could adversely affect our business.
We are impacted by the rising cost of providing pension and other post employment benefits.
The automotive industry, like other industries, continues to be impacted by the rising cost of providingpension and other post employment benefits. To partially address this impact, we announced adjustments tocertain retiree medical and pension plans to be effective January 1, 2009. See Note 12, “Retirement BenefitPlans” to the Consolidated Financial Statements in the Company’s Annual Report on Form 10-K.
Certain defined benefit pension plans we sponsor are currently underfunded.
We sponsor certain defined benefit pension plans worldwide that are underfunded and will require cashpayments. Additionally, if the performance of the assets in our pension plans does not meet our expectations,or if other actuarial assumptions are modified, our required contributions may be higher than we expect. SeeNote 12, “Retirement Benefit Plans” to the Consolidated Financial Statements in the Company’s AnnualReport on Form 10-K.
Negative or unexpected tax consequences could adversely affect our business.
Adverse changes in the underlying profitability and financial outlook of our operations in severaljurisdictions could lead to changes in our valuation allowances against deferred tax assets and other taxaccruals that could adversely affect our financial performance.
Additionally, we are subject to tax audits by governmental authorities in the U.S. and numerousnon-U.S. jurisdictions. Because the results of tax audits are inherently uncertain, negative or unexpectedresults from one or more such tax audits could adversely affect our business.
We rely on sales to major customers.
We rely on sales to original equipment manufacturers around the world. Supply to several of thesecustomers requires significant investment by the Company in working capital, plant and equipment. Some ofour customers are rated by the credit rating agencies as below investment grade. The loss of sales to a majorcustomer, due to any of a variety of factors including non-renewal of purchase orders, the customer’s financialhardship or other unforeseen reasons, could adversely affect our business.
Furthermore, some of our sales are concentrated. Our worldwide sales in 2008 to Volkswagen and Fordconstituted approximately 19% and 9%, respectively, of our 2008 consolidated sales.
Suppliers’ economic distress could result in the disruption of our operations and have a materialeffect on our business.
Unfavorable industry conditions such as lower production volumes; credit tightness; changes in foreigncurrencies; raw material, commodity, transportation, and energy price escalation; drastic changes in con-sumer preferences; and others could adversely affect our supply chain, and sometimes with little advancednotice. These conditions could also result in increased commercial disputes and supply interruption risks. Incertain instances, it would be difficult and expensive for us to change suppliers that are critical to ourbusiness. On occasion, we must provide financial support to distressed suppliers or take other measures toprotect our supply lines. While we have taken definite actions to mitigate these factors, we can not predictwith certainty the potential adverse effects these costs might have on our business.
17

We continue to face highly volatile commodity costs used in the production of our products.
The Company uses a variety of commodities (including steel, nickel, copper, aluminum, plastic resins,other raw materials and energy) and materials purchased in various forms such as castings, powder metal,forgings, stampings, and bar stock. Increasing commodity costs will have an impact on our results. We havesought to alleviate the impact of increasing costs by selectively hedging certain commodity exposures or byincluding a material pass-through provision in our customer contracts wherever possible. Customersfrequently challenge these contractual provisions and rarely pay the full cost of any materials increases.The continuation of this practice would adversely affect our business.
From time to time, commodity prices may also fall rapidly. When this happens, suppliers may withdrawcapacity from the market until prices improve which may cause periodic supply interruptions. The same maybe true of our transportation carriers and energy providers.
We could be adversely affected by supply shortages of components from our suppliers.
In an effort to manage and reduce the cost of purchased goods and services, we have been rationalizingour supply base. As a result, we are dependent on fewer sources of supply for certain components used in themanufacture of our products. The Company selects suppliers based on total value (including total landedprice, quality, delivery, and technology), taking into consideration their production capacities and financialcondition. We expect that they will deliver to our stated written expectations.
However, there can be no assurance that capacity limitations, labor unrest, weather emergencies,commercial disputes, government actions, riots, wars, sabotage, non-conforming parts, acts of terrorism,“Acts of God”, or other problems experienced by our suppliers will not result in occasional shortages or delaysin their supply of components to us. If we were to experience a significant or prolonged shortage of criticalcomponents from any of our suppliers and could not procure the components from other sources, we wouldbe unable to meet the production schedules for some of our key products and could miss customer deliveryexpectations. This would adversely affect our customer relations and business.
A downgrade in the ratings of our debt could restrict our ability to access the debt capital markets.
Changes in the ratings that rating agencies assign to our debt may ultimately impact our access to thedebt capital markets and the costs we incur to borrow funds. If ratings for our debt fall below investmentgrade, our access to the debt capital markets would become restricted. The tightening in the credit marketsand the low level of liquidity in many financial markets due to the current turmoil in the financial and bankingindustries could also affect our access to the debt capital markets. In the event the Company is unable toaccess the debt capital markets, we would have the ability to draw on our $600 million revolving credit facility;however, this agreement is scheduled to expire July 22, 2009.
Additionally, our revolving credit agreement includes an increase in interest rates if the ratings for our debtare downgraded. Further, an increase in the level of our indebtedness and related interest costs may increaseour vulnerability to adverse general economic and industry conditions and may affect our ability to obtainadditional financing.
Conditions in the automotive industry may adversely affect our business.
Our financial performance depends on conditions in the global automotive industry. Ford MotorCompany, General Motors Corporation and Chrysler LLP (collectively “the Detroit 3”) have experienceddeclining market shares and are burdened with significant structural costs that have affected their profitabilityand labor relations and may ultimately result in severe financial difficulty, including possible bankruptcy. If theDetroit 3 cannot fund their operations or if major customers reach similar levels of financial distress we mayincur significant write-offs of accounts receivable, incur impairment charges or require additional restructuringactions beyond those already taken. Automakers across Europe are also experiencing difficulties from aweakened economy and tightening credit markets. If our customers reduce their orders to us, it wouldadversely affect our results of operations. A prolonged downturn in the North American or European
18

automotive industries or a significant product mix shift due to consumer demand could require us to shutdown plants or incur impairment charges. Continued uncertainty relating to the financial condition of theDetroit 3 and other automakers would have a negative impact on our business.
We are subject to possible insolvency of financial counterparties.
The Company engages in numerous financial transactions and contracts including insurance policies,letters of credit, credit line agreements, financial derivatives, and investment management agreementsinvolving various counterparties. The Company is subject to the risk that one or more of these counterpartiesmay become insolvent and therefore be unable to discharge its obligations under such contracts.
We are subject to possible insolvency of outsourced service providers.
The Company relies on third party service providers for administration of workers’ compensation claims,health care benefits, pension benefits, stockholder and bondholder registration and similar services. Theseservice providers contribute to the efficient conduct of the Company’s business, so the Company could beadversely affected in the event of insolvency of one or more of these service providers.
A variety of other factors could adversely affect our business.
Any of the following could materially and adversely affect our business: the loss of or changes in supplycontracts or sourcing strategies of our major customers or suppliers; start—up expenses associated withnew vehicle programs or delays or cancellation of such programs, underutilization of our manufacturingfacilities, which can be dependent on a single product line or customer; inability to recover engineering andtooling costs; market and financial consequences of recalls that may be required on products we supplied;delays or difficulties in new product development; the possible introduction of similar or superior technologiesby others; and global overcapacity and vehicle platform proliferation.
Item 1B. Unresolved Staff Comments
The Company has received no written comments regarding its periodic or current reports from the staffof the Securities and Exchange Commission that were issued 180 days or more preceding the end of its 2008fiscal year and that remain unresolved.
Item 2. Properties
As of December 31, 2008, the Company had 60 manufacturing, assembly, and technical locationsworldwide. In addition to its 14 U.S. manufacturing locations, the Company has 10 locations in Germany; fivelocations in each of India and Korea; three locations in each of the United Kingdom, France, China, andJapan; and one location in each of Brazil, Canada, Hungary, Ireland, Italy, Monaco, Mexico, Poland, Spain,and Taiwan. The Company also has several sales offices, warehouses and technical centers. The Company’sworldwide headquarters are located in a leased facility in Auburn Hills, Michigan. In general, the Companybelieves its facilities to be suitable and adequate to meet its current and reasonably anticipated needs.
19

The following is additional information concerning the principal manufacturing, assembly, and technicalfacilities operated by the Company, its subsidiaries, and affiliates.(a)
ENGINE
Americas: Europe: Asia:Asheville, North Carolina Arcore, Italy Aoyama, JapanAuburn Hills, Michigan Bradford, England Changwon, South Korea(b)Cadillac, Michigan Bretten, Germany Chennai, IndiaCampinas, Brazil Chazelles, France Chungju-City, South KoreaCortland, New York Diss, England Kakkalur, IndiaDixon, Illinois Kandel, Germany(b) Nabari City, JapanFletcher, North Carolina Kirchheimbolanden, Germany Ningbo, ChinaGuadalajara, Mexico La Ferte Mace, France Pune, IndiaIthaca, New York Ludwigsburg, Germany Pyongtaek, South Korea(b)Marshall, Michigan Markdorf, Germany Tainan Shien, TaiwanSallisaw, Oklahoma Muggendorf, GermanySimcoe, Ontario, Canada Neuhaus, Germany
Oroszlany, HungaryRzeszow, PolandTralee, IrelandVitoria, Spain
DRIVETRAIN
Americas: Europe: Asia:Addison, Illinois(b) Arnstadt, Germany Beijing, ChinaAuburn Hills, Michigan Heidelberg, Germany Eumsung, South KoreaBellwood, Illinois Ketsch, Germany Fukuroi City, JapanFrankfort, Illinois Margam, Wales(d) Ningbo, ChinaLivonia, Michigan Principality of Monaco Ochang, South Korea(b)Longview, Texas Tulle, France Pune, IndiaMuncie, Indiana(c) Shanghai, ChinaSeneca, South Carolina Sirsi, IndiaWater Valley, Mississippi
(a) The table excludes joint ventures owned less than 50% and administrative offices in Auburn Hills,Michigan USA and Shanghai, China.
(b) Indicates leased land rights or a facility.
(c) Announced closure plans for 2009.
(d) Announced closure plans for 2010.
Item 3. Legal Proceedings
The Company is subject to a number of claims and judicial and administrative proceedings (some ofwhich involve substantial amounts) arising out of the Company’s business or relating to matters for which theCompany may have a contractual indemnity obligation. Refer to Note 15, “Contingencies” of the Notes to theConsolidated Financial Statements in Item 8 of this report for a discussion of environmental, asbestos andother litigation.
20

In January 2006, BorgWarner Diversified Transmission Products Inc (“DTP”), a subsidiary of theCompany, filed a declaratory judgment action in United States District Court, Southern District of Indiana(Indianapolis Division) against the United Automobile, Aerospace, and Agricultural Implements Workers ofAmerica (“UAW”) Local No. 287 and Gerald Poor, individually and as the representative of a defendant class.DTP sought the Court’s affirmation that DTP did not violate the Labor-Management Relations Act or theEmployee Retirement Income Security Act by unilaterally amending certain medical plans effective April 1,2006 and October 1, 2006, prior to the expiration of the current collective bargaining agreements. OnSeptember 10, 2008, the Court found that DTP’s reservation of the right to make such amendments reducingthe level of benefits provided to retirees was limited by its collectively bargained health insurance agreementwith the UAW, which does not expire until April 24, 2009. Thus, the amendments were untimely. In 2008 theCompany recorded a charge of $4.0 million as a result of the Court’s decision.
The Company has communicated its plan to reduce the level of benefits provided to the retirees to makethem comparable to other Company retiree benefit plans. The change will be effective following expiration ofthe health insurance agreement in April 24, 2009.
Item 4. Submission of Matters to a Vote of Security Holders
There were no matters submitted to the Company’s security holders during the fourth quarter of 2008.
PART II
Item 5. Market for the Registrant’s Common Equity, Related Stockholder Matters and IssuerPurchases of Equity Securities
The Company’s Common Stock is listed for trading on the New York Stock Exchange under the symbolBWA. As of February 6, 2009, there were 2,463 holders of record of Common Stock.
The Company has increased its declared dividend during each of the last seven years. Cash dividendsdeclared and paid per share, adjusted for stock splits in 2004 and 2007, were as follows:
2008 2007 2006 2005 2004
Dividend Amount . . . . . . . . . . . . . . . . . . . . . . . . . $0.44 $0.34 $0.32 $0.28 $0.25
While the Company currently expects that the 2009 quarterly cash dividend of $0.12 per share ($0.48per year) will continue to be paid in the future, the dividend policy is subject to review and change at thediscretion of the Board of Directors.
High and low sales prices* (as reported on the New York Stock Exchange composite tape) for theCommon Stock for each quarter in 2007 and 2008 were:
Quarter Ended High Low
March 31, 2007 . . . . . . . . . . . . . . . . . . . . . . . . . . . . . . . . . . . . . . . . . . . . . $39.31 $29.02June 30, 2007 . . . . . . . . . . . . . . . . . . . . . . . . . . . . . . . . . . . . . . . . . . . . . . $43.43 $36.63September 30, 2007 . . . . . . . . . . . . . . . . . . . . . . . . . . . . . . . . . . . . . . . . . $48.08 $37.73December 31, 2007 . . . . . . . . . . . . . . . . . . . . . . . . . . . . . . . . . . . . . . . . . . $53.00 $46.11March 31, 2008 . . . . . . . . . . . . . . . . . . . . . . . . . . . . . . . . . . . . . . . . . . . . . $51.39 $40.16June 30, 2008 . . . . . . . . . . . . . . . . . . . . . . . . . . . . . . . . . . . . . . . . . . . . . . $55.99 $42.30September 30, 2008 . . . . . . . . . . . . . . . . . . . . . . . . . . . . . . . . . . . . . . . . . $45.54 $30.82December 31, 2008 . . . . . . . . . . . . . . . . . . . . . . . . . . . . . . . . . . . . . . . . . . $32.69 $15.00
21
* All amounts have been restated, per the 2-for-1 stock split that was effected through a stock dividend onDecember 17, 2007.

The line graph below compares the cumulative total shareholder return on our Common Stock with thecumulative total return of companies on the Standard & Poor’s (S&P’s) 500 Stock Index, companies withinBorgWaner’s peer group, and companies within Standard Industrial Code (“SIC”) 3714 — Motor VehicleParts.
This graph assumes the investment of $100 on September 1, 2003 and the reinvestment of all dividendssince that date.
5 Year Cumulative Total Return (%)
200820072006200520042003
BWAS&P 500SIC Code IndexPeer Group
0
50
100
150
200
250
BWA, S&P 500 and Peer Group data gleaned from Capital IQ; SIC Code Index gleaned from ResearchData Group
2003 2004 2005 2006 2007 2008
BorgWarner Inc.(1) 100.00 128.95 145.86 143.55 237.45 108.08
S&P 500(2) 100.00 108.99 112.27 127.56 132.06 81.23
SIC Code Index(3) 100.00 109.81 93.13 108.37 114.92 52.88
Peer Group(4) 100.00 106.56 103.25 117.89 127.17 53.08
(1) BorgWarner Inc.
(2) S&P 500 — Standard & Poor’s 500 Total Return Index
(3) Standard Industrial (“SIC”) 3714-Motor Vehicle Parts
(4) Peer Group Companies — Consists of the following companies:American Axle & Manufacturing Holdings, Inc., Arvin Meritor Inc., Autoliv Inc., Gentex Corp.,Johnson Controls Inc., Lear Corporation, Magna International, Inc., Modine Manufacturing Co., TennecoAutomotive, Inc., TRW Automotive Holdings Corp. and Visteon Corporation
Repurchases of Equity Securities
The Company’s Board of Directors previously authorized the purchase of up to 9.8 million shares(adjusted for the company’s 2007 two-for-one stock split) of the Company’s common stock. As of Decem-ber 31, 2008, the Company has repurchased 5,422,428 shares.
All shares purchased under this authorization have been and will continue to be repurchased in the openmarket at prevailing prices and at times the amounts to be determined by management as market conditions
22

and the Company’s capital position warrant. The Company may use Rule 10b5-1 plans to facilitate sharerepurchases. Repurchased shares will be deemed treasury shares and may subsequently be reissued forgeneral corporate purposes.
The following table provides information about Company purchases of its equity securities that areregistered pursuant to Section 12 of the Exchange Act during the quarter ended December 31, 2008, at atotal cost of $7.4 million:
ISSUER PURCHASES OF EQUITY SECURITIES
Period
Total Numberof SharesPurchased
Average PricePaid per
Share
Total Number ofShares Purchasedas Part of Publicly
AnnouncedPlans or Programs
Maximum Number of Sharesthat May Yet Be
Purchased Underthe Plans or Programs
Month EndedOctober 31, 2008 . . . . . . . . 230,000 $23.81 230,000 4,463,072
Month EndedNovember 30, 2008 . . . . . . 85,500 23.04 85,500 4,377,572
Month EndedDecember 31, 2008 . . . . . . — — — 4,377,572
Total. . . . . . . . . . . . . . . . . . 315,500 $23.60 315,500 4,377,572
Note: all purchases were made on the open market.
Equity Compensation Plan Information
As of December 31, 2008, the number of stock options and restricted common stock outstanding underour equity compensation plans, the weighted average exercise price of outstanding options and restrictedcommon stock, and the number of securities remaining available for issuance were as follows:
Plan Category
Number of Securitiesto be Issued Upon
Exercise ofOutstanding Options,
Restricted Common Stock,Warrants and Rights
(a)
Weighted-AverageExercise Price of
Outstanding Options,Restricted Common Stock,
Warrants and Rights(b)
Number of SecuritiesRemaining Availablefor Future Issuance
Under EquityCompensation Plans(Excluding Securities
Reflected in Column (a))(c)
Equity compensation plansapproved by securityholders. . . . . . . . . . . . . . . . . . 6,459,201 $29.65 1,648,449
Equity compensation plans notapproved by securityholders. . . . . . . . . . . . . . . . . . — — —
Total . . . . . . . . . . . . . . . . . . . . . 6,459,201 $29.65 1,648,449
Item 6. Selected Financial Data
Refer to Note 21, “Reporting Segments and Related Information” of the Notes to the ConsolidatedFinancial Statements in Item 8 of this report for Selected Financial Data for the five years ended December 31,2008. See the material in response to Item 7 of this report for a discussion of the factors that materially affectthe comparability of the information contained in such data.
23

Item 7. Management’s Discussion and Analysis of Financial Condition and Results of Operations
INTRODUCTION
BorgWarner Inc. and Consolidated Subsidiaries (the “Company”) is a leading global supplier of highlyengineered systems and components primarily for powertrain applications. Our products help improvevehicle performance, fuel efficiency, air quality and vehicle stability. They are manufactured and soldworldwide, primarily to original equipment manufacturers (“OEMs”) of light vehicles (i.e. passenger cars,sport-utility vehicles (“SUVs”), cross-over vehicles, vans and light trucks). Our products are also manufac-tured and sold to OEMs of commercial trucks, buses and agricultural and off-highway vehicles. We alsomanufacture for and sell our products to certain Tier One vehicle systems suppliers and into the aftermarketfor light and commercial vehicles. We operate manufacturing facilities serving customers in the Americas,Europe and Asia, and are an original equipment supplier to every major automaker in the world.
The Company’s products fall into two reporting segments: Engine and Drivetrain. The Engine segment’sproducts include turbochargers, timing chain systems, air management, emissions systems, thermal sys-tems, as well as diesel and gas ignition systems. The Drivetrain segment’s products include all-wheel drivetransfer cases, torque management systems, and components and systems for automated transmissions.
Stock Split
On November 14, 2007, the Company’s Board of Directors approved a two-for-one stock split effectedin the form of a stock dividend on its common stock. To implement this stock split, shares of common stockwere issued on December 17, 2007 to stockholders of record as of the close of business on December 6,2007. All prior year share and per share amounts disclosed in this document have been restated to reflect thetwo-for-one stock split.
RESULTS OF OPERATIONS
Overview
A summary of our operating results for the years ended December 31, 2008, 2007 and 2006 is asfollows:
millions of dollars, except per share data
Year Ended December 31, 2008 2007 2006
Net sales . . . . . . . . . . . . . . . . . . . . . . . . . . . . . . . . . . . . . . $5,263.9 $5,328.6 $4,585.4Cost of sales . . . . . . . . . . . . . . . . . . . . . . . . . . . . . . . . . . . 4,425.4 4,378.7 3,735.5
Gross profit . . . . . . . . . . . . . . . . . . . . . . . . . . . . . . . . . . . . 838.5 949.9 849.9Selling, general and administrative expenses . . . . . . . . . . . . 542.9 531.9 498.1Restructuring expense . . . . . . . . . . . . . . . . . . . . . . . . . . . . 127.5 — 84.7Goodwill impairment charge . . . . . . . . . . . . . . . . . . . . . . . . 156.8 — —Other income . . . . . . . . . . . . . . . . . . . . . . . . . . . . . . . . . . (3.1) (6.8) (7.5)
Operating income . . . . . . . . . . . . . . . . . . . . . . . . . . . . . . . 14.4 424.8 274.6Equity in affiliates’ earnings, net of tax . . . . . . . . . . . . . . . . (38.4) (40.3) (35.9)Interest expense and finance charges . . . . . . . . . . . . . . . . . 38.8 34.7 40.2
Earnings before income taxes and minority interest . . . . . 14.0 430.4 270.3Provision for income taxes . . . . . . . . . . . . . . . . . . . . . . . . . 33.3 113.9 32.4Minority interest, net of tax . . . . . . . . . . . . . . . . . . . . . . . . . 16.3 28.0 26.3
Net earnings (loss) . . . . . . . . . . . . . . . . . . . . . . . . . . . . . . . $ (35.6) $ 288.5 $ 211.6
Earnings (loss) per share — diluted . . . . . . . . . . . . . . . . . . . $ (0.31) $ 2.45 $ 1.83
24
A summary of major factors impacting the Company’s net earnings for the year ended December 31,2008 in comparison to 2007 and 2006 is as follows:
• Global financial market and economic crisis in the second half of 2008 significantly impactedconsumer demand for light vehicles and negatively impacted our sales.
• Continued demand for our products in both Engine and Drivetrain segments.
• Lower North American production of light trucks and SUVs.
• Continued benefits from our cost reduction programs, including containment of raw material andenergy cost increases, health care cost inflation and the costs related to global expansion.
• Restructuring expenses in the third and fourth quarters of 2006 to adjust headcount and capacitylevels, primarily in North America and primarily in the Drivetrain segment.
• Restructuring expenses in the third and fourth quarters of 2008 to adjust headcount and capacitylevels, in North America, Europe and Asia.
• The write-offs of the excess purchase price allocated to in-process research and development(“IPR&D”), order backlog and beginning inventory related to the 2007 acquisition of approximately12.8% of BERU AG (“BERU”) stock and the 2008 completion of a Domination and Profit TransferAgreement (“DPTA”) between the Company and BERU.
• The write-offs of the excess purchase price allocated to IPR&D, order backlog and beginning inventoryrelated to the 2006 acquisition of the European Transmission and Engine Controls (“ETEC”) productlines from Eaton in Monaco.
• Favorable currency impact of $13.0 million, $15.2 million and $0.4 million in 2008, 2007 and 2006,respectively.
• Adjustments to tax accounts in 2008, 2007 and 2006 upon conclusion of certain tax audits andchanges in circumstances, including changes in tax laws.
• An approximate $14 million provision in 2007 for a warranty-related issue surrounding a product, builtduring a 15-month period in 2004 and 2005, that is no longer in production.
• An approximate $23.5 million warranty-related issue associated with the company’s transmissionproduct sold in Europe, limited to mid-2007 through May 2008 production.
• An c111.5 million $(156.8 million) impairment charge in 2008 to adjust BERU’s goodwill to itsestimated fair value.
• Recognition in 2008 of a $4.0 million charge related to an untimely change in the level of benefitsprovided to BorgWarner Diversified Transmission Products Inc (“DTP”) retirees.
• The establishment of a valuation allowance for foreign tax credit carryforwards in 2008 of $13.5 million.
25

The Company’s earnings (loss) per diluted share were $(0.31), $2.45 and $1.83 for the years endedDecember 31, 2008, 2007 and 2006, respectively. The Company believes the following table is useful inhighlighting non-recurring or non-comparable items that impacted its earnings per diluted share:
Year Ended December 31, 2008 2007 2006
Non-recurring or non-comparable items:Goodwill impairment charge . . . . . . . . . . . . . . . . . . . . . . . . . . . . $(1.35) $ — $ —Restructuring expense . . . . . . . . . . . . . . . . . . . . . . . . . . . . . . . . (0.72) — (0.41)Transmission product related warranty charge . . . . . . . . . . . . . . . (0.14) — —Tax valuation allowance . . . . . . . . . . . . . . . . . . . . . . . . . . . . . . . (0.12) — —Write-off of the excess purchase price
allocated to IPR&D, order backlog and beginninginventory associated with acquisitions . . . . . . . . . . . . . . . . . . . (0.04) (0.02) (0.02)
Net gain from divestitures . . . . . . . . . . . . . . . . . . . . . . . . . . . . . . — — 0.03Adjustments to tax accounts . . . . . . . . . . . . . . . . . . . . . . . . . . . 0.02 0.03 0.19Retiree healthcare litigation outcome . . . . . . . . . . . . . . . . . . . . . . (0.03) — —
Total impact to earnings per share — diluted: . . . . . . . . . . . . . . . $(2.38) $ 0.01 $(0.21)
The Company’s effective tax rate, after giving tax effect to the non-recurring or non-comparable items shownabove, was 23.0%, 27.1%, and 26.0% for 2008, 2007, and 2006, respectively.
Net Sales
The table below summarizes the overall worldwide global light vehicle production percentage changesfor 2008 and 2007:
Worldwide Light Vehicle Year Over Year Increase (Decrease) in Production2008 2007
North America* . . . . . . . . . . . . . . . . . . . . . . . . . . . . . . . . . . . . . . . . . . . . . . . . . (15.8)% (1.5)%Europe* . . . . . . . . . . . . . . . . . . . . . . . . . . . . . . . . . . . . . . . . . . . . . . . . . . . . . . (4.5)% 5.6%Asia* . . . . . . . . . . . . . . . . . . . . . . . . . . . . . . . . . . . . . . . . . . . . . . . . . . . . . . . . 2.4% 7.1%Total Worldwide* . . . . . . . . . . . . . . . . . . . . . . . . . . . . . . . . . . . . . . . . . . . . . . . . (3.7)% 5.0%BorgWarner year over year net sales change . . . . . . . . . . . . . . . . . . . . . . . . . . . (1.2)% 16.2%
* Data provided by CSM Worldwide.
Our net sales decrease in 2008 of 1.2% was slightly better than the estimated worldwide marketproduction decrease of 3.7%. Our net sales increase in 2007 of 16.2% was strong in light of the estimatedworldwide market production increase of 5.0%. The effect of changing currency rates had a positive impacton the Company’s net sales and net earnings in 2008 and 2007. The effect of non-U.S. currencies, primarilythe Euro, increased net sales by $191.0 million and reduced the Company’s net loss by $13.0 million in 2008.In 2007, non-U.S. currencies, primarily the Euro, added $262.1 million to net sales and $15.2 million to netearnings. The year over year decrease in net sales, excluding the favorable impact of currency, was 4.8% in2008. The year over year increase in net sales, excluding the favorable impact of currency, was 10.5% in2007.
Consolidated net sales included sales to Volkswagen of approximately 19%, 15%, and 13%; to Ford ofapproximately 9%, 12%, and 13%; and to Daimler of approximately 6%, 6%, and 11% for the years endedDecember 31, 2008, 2007 and 2006, respectively. Daimler divested Chrysler in 2007. Both of our reportingsegments had significant sales to all three of the customers listed above. Such sales consisted of a variety ofproducts to a variety of customer locations and regions. No other single customer accounted for more than10% of consolidated sales in any year of the periods presented.
26

Outlook
The Company is very cautious about 2009. The recent crisis in the financial sector and deterioratingglobal economic conditions have increased uncertainty about automotive vehicle sales in every geographicregion of the world. The Company expects the unprecedented current global economic environment tocontinue to affect near-term results and to create difficult conditions through 2009.
The Company maintains a positive long-term outlook for its global business and is committed to newproduct development and strategic capital investments to enhance its product leadership strategy. Thetrends that are driving our long-term growth are expected to continue, including the growth of direct injectiondiesel and gasoline engines worldwide, the increased adoption of automated transmissions in Europe andAsia-Pacific, and the move to chain engine timing systems in both Europe and Asia-Pacific.
The impact of non-U.S. currencies is currently expected to be a decline in 2009. When the recovery fromcurrent global economic conditions occur, we expect long-term sales and net earnings growth to resume tohistorical rates.
Results By Reporting Segment
The Company’s business is comprised of two reporting segments: Engine and Drivetrain. Thesesegments are strategic business groups, which are managed separately as each represents a specificgrouping of related automotive components and systems.
The Company allocates resources to each segment based upon the projected after-tax return oninvested capital (“ROIC”) of its business initiatives. The ROIC is comprised of projected earnings beforeinterest and taxes (“EBIT”) adjusted for taxes compared to the projected average capital investment required.
EBIT is considered a “non-GAAP financial measure.” Generally, a non-GAAP financial measure is anumerical measure of a company’s financial performance, financial position or cash flows that excludes (orincludes) amounts that are included in (or excluded from) the most directly comparable measure calculatedand presented in accordance with GAAP. EBIT is defined as earnings before interest, taxes and minorityinterest. “Earnings” is intended to mean net earnings as presented in the Consolidated Statements ofOperations under GAAP.
The Company believes that EBIT is useful to demonstrate the operational profitability of its segments byexcluding interest and taxes, which are generally accounted for across the entire Company on a consolidatedbasis. EBIT is also one of the measures used by the Company to determine resource allocation within theCompany. Although the Company believes that EBIT enhances understanding of its business and perfor-mance, it should not be considered an alternative to, or more meaningful than, net earnings or cash flowsfrom operations as determined in accordance with GAAP.
The following tables present net sales and Segment EBIT by segment for the years 2008, 2007 and2006:
Net Sales
millions of dollars
Year Ended December 31, 2008 2007 2006
Engine. . . . . . . . . . . . . . . . . . . . . . . . . . . . . . . . . . . . . . . . $3,861.5 $3,761.3 $3,154.9Drivetrain . . . . . . . . . . . . . . . . . . . . . . . . . . . . . . . . . . . . . . 1,426.4 1,598.8 1,461.4Inter-segment eliminations . . . . . . . . . . . . . . . . . . . . . . . . . (24.0) (31.5) (30.9)
Net sales . . . . . . . . . . . . . . . . . . . . . . . . . . . . . . . . . . . . . . $5,263.9 $5,328.6 $4,585.4
27

Earnings Before Interest and Taxes
millions of dollars
Year Ended December 31 2008 2007 2006
Engine . . . . . . . . . . . . . . . . . . . . . . . . . . . . . . . . . . . . . . . . . . . $ 394.9 $418.0 $365.8Drivetrain. . . . . . . . . . . . . . . . . . . . . . . . . . . . . . . . . . . . . . . . . . (4.9) 118.1 90.6
Segment earnings before interest and taxes (“Segment EBIT”). . . 390.0 536.1 456.4Restructuring expense . . . . . . . . . . . . . . . . . . . . . . . . . . . . . . . . (127.5) — (84.7)Goodwill impairment charge . . . . . . . . . . . . . . . . . . . . . . . . . . . . (156.8) — —Corporate, including equity in affiliates’ earnings . . . . . . . . . . . . . (52.9) (71.0) (61.2)
Consolidated earnings before interest and taxes (“EBIT”) . . . . . . . 52.8 465.1 310.5Interest expense and finance charges. . . . . . . . . . . . . . . . . . . . . 38.8 34.7 40.2
Earnings before income taxes and minority interest . . . . . . . . . . . 14.0 430.4 270.3Provision for income taxes . . . . . . . . . . . . . . . . . . . . . . . . . . . . . 33.3 113.9 32.4Minority interest, net of tax . . . . . . . . . . . . . . . . . . . . . . . . . . . . . 16.3 28.0 26.3
Net earnings (loss) . . . . . . . . . . . . . . . . . . . . . . . . . . . . . . . . . . . $ (35.6) $288.5 $211.6
The Engine segment 2008 net sales were up 2.7% from 2007, with a 5.5% decrease in Segment EBITover the same period. The Engine segment continued to benefit from Asian automaker demand forturbochargers and timing systems, European automaker demand for turbochargers, timing systems, exhaustgas recirculation (“EGR”) valves and diesel engine ignition systems. This benefit was offset by lower NorthAmerican production of light truck and sport-utility vehicles. The Segment EBIT margin was 10.2% in 2008,down from 11.1% in 2007 (which includes the one-time write-off in 2008 of the excess purchase priceallocated to BERU’s IPR&D, order backlog and inventory), due to the significant reduction in customerproduction schedules in the U.S. and European markets, and increased costs for raw materials, principallysteel.
The Engine segment 2007 net sales were up 19.2% from 2006, with a 14.3% increase in Segment EBITover the same period. The Engine segment continued to benefit from Asian automaker demand forturbochargers and timing systems, European automaker demand for turbochargers, timing systems, exhaustgas recirculation (“EGR”) valves and diesel engine ignition systems, the continued roll-out of its variable camtiming systems with General Motors high-value V6 engines, stronger EGR valve sales in North America, andhigher turbocharger and thermal products sales due to stronger global commercial vehicle production. TheSegment EBIT margin was 11.1% in 2007 down from 11.6% in 2006 (which includes the one-time write-off in2007 of the excess purchase price allocated to BERU’s IPR&D, order backlog and inventory), due to thesignificant reduction in customer production schedules in the U.S. market and increased costs for rawmaterials, principally nickel.
The Drivetrain segment 2008 net sales decreased 10.8% from 2007 with a 104.1% decrease inSegment EBIT over the same period. The group was negatively impacted by lower U.S. production of lighttrucks and SUVs equipped with its torque transfer products and lower sales of its traditional transmissionproducts. Segment EBIT margin was (0.3)% in 2008, down from 7.4% in the prior year, due to the combinedeffect of DCT product start-up cost pressures and lower North American production of light trucks and sport-utility vehicles equipped with its torque transfer products.
The Drivetrain segment 2007 net sales increased 9.4% from 2006 with a 30.4% increase in SegmentEBITover the same period. The segment continued to benefit from growth outside of North America includingthe continued ramp up of dual-clutch transmission and torque transfer product sales in Europe. In the U.S.,the group was negatively impacted by lower production of light trucks and SUVs equipped with its torquetransfer products and lower sales of its traditional transmission products. Segment EBIT margin was 7.4% in2007, up from 6.2% in the prior year, due to the benefits of restructuring in its North American operations andgrowth outside of the U.S.
28
Corporate is the difference between calculated total Company EBITand the total of the Segments’ EBIT.It represents corporate headquarters’ expenses, expenses not directly attributable to the individual segmentsand equity in affiliates’ earnings. This net expense was $52.9 million in 2008, $71.0 million in 2007 and$61.2 million in 2006.
Other Factors Affecting Results of Operations
The following table details our results of operations as a percentage of sales:
Year Ended December 31, 2008 2007 2006
Net sales . . . . . . . . . . . . . . . . . . . . . . . . . . . . . . . . . . . . . . . . . . . . . 100.0% 100.0% 100.0%Cost of sales . . . . . . . . . . . . . . . . . . . . . . . . . . . . . . . . . . . . . . . . . . 84.1 82.2 81.5
Gross profit . . . . . . . . . . . . . . . . . . . . . . . . . . . . . . . . . . . . . . . . . . . 15.9 17.8 18.5Selling, general and administrative expenses . . . . . . . . . . . . . . . . . . . 10.3 10.0 10.9Restructuring expense . . . . . . . . . . . . . . . . . . . . . . . . . . . . . . . . . . . 2.4 — 1.8Goodwill impairment charge . . . . . . . . . . . . . . . . . . . . . . . . . . . . . . . 3.0 — —Other income . . . . . . . . . . . . . . . . . . . . . . . . . . . . . . . . . . . . . . . . . . (0.1) (0.2) (0.2)
Operating income . . . . . . . . . . . . . . . . . . . . . . . . . . . . . . . . . . . . . . 0.3 8.0 6.0Equity in affiliates’ earnings, net of tax. . . . . . . . . . . . . . . . . . . . . . . . (0.7) (0.8) (0.8)Interest expense and finance charges . . . . . . . . . . . . . . . . . . . . . . . . 0.7 0.7 0.9
Earnings before income taxes and minority interest . . . . . . . . . . . . 0.3 8.1 5.9Provision for income taxes . . . . . . . . . . . . . . . . . . . . . . . . . . . . . . . . 0.7 2.2 0.7Minority interest, net of tax . . . . . . . . . . . . . . . . . . . . . . . . . . . . . . . . 0.3 0.5 0.6
Net earnings (loss) . . . . . . . . . . . . . . . . . . . . . . . . . . . . . . . . . . . . . . (0.7)% 5.4% 4.6%
Gross profit as a percentage of net sales was 15.9%, 17.8% and 18.5% in 2008, 2007 and 2006,respectively. Our gross profit decrease in 2008 is due to unfavorable product mix as a result of the suddendecline in the North American and European automotive markets, including a 15.8% decrease in light truckand SUV production in North America. The Company has restructured its North American and Europeanoperations in the third and fourth quarters of 2008 to align the Company’s workforce with forecastedproduction.
Selling, general and administrative expenses (“SG&A”) as a percentage of net sales were 10.3%,10.0% and 10.9% in 2008, 2007 and 2006 respectively. The 2008 increase in SG&A as a percentage of netsales was primarily due to $8.0 million of amortization for the recognition of the remaining 17.8% of the fairvalue of BERU. $3.3 million of the amortization recognized in the second quarter of 2008 is for the immediatewrite off of in process R&D and order backlog, the remaining $4.7 million increase is amortization on otherintangible assets. The Company also recorded an increase in bad debt expense of $2.7 million in 2008 relatedto a decline in the financial condition of certain customers.
Research and development (“R&D”) is a major component of our SG&A expenses. R&D spending, net ofcustomer reimbursements, was $205.7 million, or 3.9% of sales in 2008, compared to $210.8 million, or4.0% of sales in 2007, and $187.7 million, or 4.1% of sales in 2006. We currently intend to continue toincrease our spending in R&D, although the growth rate in the future may not necessarily match the rate of oursales growth. We also intend to continue to invest in a number of cross-business R&D programs, as well as anumber of other key programs, all of which are necessary for short and long-term growth. Our current long-term expectation for R&D spending is approximately 4.0% of sales. We intend to maintain our commitment toR&D spending while continuing to focus on controlling other SG&A costs.
Restructuring expense of $127.5 million in 2008 and $84.7 million in 2006 was in response to declinesin global customer production levels, customer restructurings and a subsequent evaluation of our headcountlevels in North America, Europe and Asia (in 2008 only) and our long-term capacity needs.
29

On July 31, 2008, the Company announced a restructuring of its operations to align ongoing operationswith a continuing, fundamental market shift in the auto industry. As a continuation of the Company’s thirdquarter restructuring, on December 11, 2008, the Company announced plans for additional restructuringactions. As a result of these third and fourth quarter restructuring actions, the Company has reduced its NorthAmerican workforce by approximately 2,400 people, or 33%; its European workforce by approximately1,600 people, or 18%; and its Asian workforce by approximately 400 people, or 17%. The restructuringexpense recognized for employee termination benefits is $54.6 million, of which $10.3 million was paid out inthe third and fourth quarters of 2008. The remaining liability will be paid out by the middle of 2010. In additionto employee termination costs, the Company recorded $72.9 million of asset impairment charges related tothe North American and European restructuring. The combined restructuring expenses of $127.5 million arebroken out by segment as follows: Engine $85.3 million, Drivetrain $40.9 million and Corporate $1.3 million.Refer to Note 19, “Restructuring” of the Notes to the Consolidated Financial Statements in Item 8 of thisreport for further discussion.
On September 22, 2006, the Company announced the reduction of its North American workforce byapproximately 850 people, or 13%, spread across its 19 operations in the U.S., Canada and Mexico. Thisthird quarter reduction of the North American workforce addressed an immediate need to adjust employmentlevels to meet customer restructurings and significantly lower production schedules going forward. Inaddition to employee related costs of $6.7 million, the Company recorded $4.8 million of asset impairmentcharges related to the North American restructuring. The third quarter restructuring expenses of $11.5 millionbroken out by segment were as follows: Engine $7.3 million, Drivetrain $3.6 million and Corporate$0.6 million.
During the fourth quarter 2006, the Company evaluated the competitiveness of its North Americanfacilities, as well as its long-term capacity needs. As a result, the Company will be closing the drivetrain plantin Muncie, Indiana and has adjusted the carrying values of other assets, primarily related to its four-wheel drivetransfer case product line. Production activity at the Muncie facility is scheduled to cease no later than theexpiration of the current labor contract in April 24, 2009. As a result of the fourth quarter restructuring, theCompany recorded employee related costs of $14.8 million, asset impairments of $51.6 million and pensioncurtailment expense of $6.8 million. The fourth quarter restructuring expenses of $73.2 million broken out bysegment were as follows: Engine $5.9 million and Drivetrain $67.3 million.
Other income was $(3.1) million, $(6.8) million and $(7.5) million in 2008, 2007 and 2006, respectively.The 2008 income was comprised primarily of interest income, offset by the realization of a loss on the sale of aproduct line and other asset disposals. The 2007 income was comprised primarily of interest income. The2006 income was comprised primarily of a $(4.8) million gain from a previous divestiture and $(3.2) million ofinterest income.
Equity in affiliates’ earnings, net of tax was $38.4 million, $40.3 million and $35.9 million in 2008, 2007and 2006, respectively. This line item is primarily driven by the results of our 50% owned Japanese jointventure, NSK-Warner, and our 32.6% owned Indian joint venture, Turbo Energy Limited (“TEL”). For morediscussion of NSK-Warner, see Note 6 of the Consolidated Financial Statements.
Interest expense and finance charges were $38.8 million, $34.7 million and $40.2 million in 2008, 2007and 2006, respectively. The increase in 2008 expense over 2007 expense was primarily due to costs relatedto BERU’s DPTA. The decrease in 2007 expense over 2006 expense was primarily due to reduced debtlevels.
The provision for income taxes resulted in an effective tax rate for 2008 of 237.9% compared with ratesof 26.5% in 2007 and 12.0% in 2006. The effective tax rate of 237.9% for 2008 differs from the U.S. statutoryrate primarily due to the non-deductibility of the $156.8 million impairment charge in 2008 related to BERUgoodwill; a reduction in U.S. income; foreign rates, which differ from those in the U.S.; the realization of certainbusiness tax credits including R&D and foreign tax credits and favorable permanent differences betweenbook and tax treatment for items, including equity in affiliates’ earnings. If the effects of tax accrual changesand the Company’s third quarter $13.5 million valuation allowance are not taken into account, the Company’s
30
effective tax rate associated with its on-going business operations was 23.0%. This rate was lower than the2007 tax rate for on-going operations of 27.1% primarily due to the decline in U.S. earnings.
Minority interest, net of tax of $16.3 million decreased by $11.7 million from 2007 and by $10.0 millionfrom 2006. The decrease is primarily related to the Company’s DPTA with BERU, giving BorgWarner fullcontrol of BERU.
LIQUIDITY AND CAPITAL RESOURCES
Capitalization
millions of dollars 2008 2007 % Change
Notes payable . . . . . . . . . . . . . . . . . . . . . . . . . . . . . . . . . . $ 183.8 $ 63.7Current portion of long-term debt . . . . . . . . . . . . . . . . . . . . 136.9 —Long-term debt . . . . . . . . . . . . . . . . . . . . . . . . . . . . . . . . . 459.6 572.6
Total debt. . . . . . . . . . . . . . . . . . . . . . . . . . . . . . . . . . . . 780.3 636.3 22.6%
Minority interest in consolidated subsidiaries . . . . . . . . . . . . 31.5 117.9Total stockholders’ equity . . . . . . . . . . . . . . . . . . . . . . . . . . 2,006.0 2,321.1
Total capitalization . . . . . . . . . . . . . . . . . . . . . . . . . . . . . $2,817.8 $3,075.3 (8.4)%
Total debt to capital ratio . . . . . . . . . . . . . . . . . . . . . . . 27.7% 20.7%
The Company intends to settle the current portion of long-term debt (due February 17, 2009) of$136.9 million with cash on hand, cash from operations and affiliate dividend receipts.
The $144.0 million increase in debt was primarily due to the $133.6 million acquisition of additionalshares of BERU.
Stockholders’ equity decreased by $315.1 million in 2008 as follows:millions of dollars
Balance, January 1, 2008 . . . . . . . . . . . . . . . . . . . . . . . . . . . . . . . . . . . . . . . . . . . . $2,321.1Net loss . . . . . . . . . . . . . . . . . . . . . . . . . . . . . . . . . . . . . . . . . . . . . . . . . . . . . . . . . (35.6)Currency translation and hedged instruments . . . . . . . . . . . . . . . . . . . . . . . . . . . . . (136.9)Defined benefit post employment plans . . . . . . . . . . . . . . . . . . . . . . . . . . . . . . . . . . (74.7)Treasury stock purchases, net of options exercised . . . . . . . . . . . . . . . . . . . . . . . . . (40.9)Dividend payments . . . . . . . . . . . . . . . . . . . . . . . . . . . . . . . . . . . . . . . . . . . . . . . . . (51.1)Other . . . . . . . . . . . . . . . . . . . . . . . . . . . . . . . . . . . . . . . . . . . . . . . . . . . . . . . . . . . 24.1
Balance, December 31, 2008 . . . . . . . . . . . . . . . . . . . . . . . . . . . . . . . . . . . . . . . . . $2,006.0
The currency translation component of other comprehensive income decreased in 2008 primarily due tothe weakening of the Euro, Korean Won and British Pound in relation to the U.S. Dollar.
Operating Activities
Net cash provided by operating activities was $400.8 million, $603.5 million and $442.1 million in 2008,2007 and 2006, respectively. The $202.7 million decrease in 2008 from 2007 was primarily due to lowerearnings and increased working capital needs. The $161.4 million increase in 2007 from 2006 was primarilydue to higher earnings and improved working capital usage. The $400.8 million of net cash provided byoperating activities in 2008 consists of a net loss of $35.6 million, increased for non-cash charges of$530.7 million and a $94.3 million decrease in net operating assets and liabilities. Non-cash charges areprimarily comprised of $286.8 million in depreciation and amortization expense and a $156.8 million goodwillimpairment charge.
31

Accounts receivable and accounts payable and accrued expenses decreased a total of $163.9 millionand $195.6 million, respectively, excluding the impact of currency, due to lower business levels, particularly inNorth America and Europe. Certain of our European customers tend to have longer payment terms than ourNorth American customers. Inventory increased by $26.3 million excluding the impact of currency, while ourfull year average inventory turns decreased to 9.8 times from 10.5 in 2007.
Investing Activities
Net cash used in investing activities was $485.1 million, $368.0 million and $341.1 million in 2008, 2007and 2006, respectively. Capital expenditures, including tooling outlays (“capital spending”) of $369.7 million in2008, or 7.0% of sales, increased $75.8 million over the 2007 level of $293.9 million, or 5.5% of sales.Selective capital spending remains an area of focus for us, both in order to support our book of new businessand for cost reduction and other purposes. Heading into 2009, we plan to continue to spend capital tosupport the launch of our new applications and for cost reductions and productivity improvement projects,but at levels considerably lower than 2008.
In 2008, the Company purchased approximately 1.34 million BERU shares, at a cost of $133.6 million.See Note 20, “Recent Transactions” for further information.
The Company acquired approximately 12.8% of additional BERU shares in 2007 for $138.8 million,including transaction fees.
In 2006, the Company acquired the ETEC product lines from Eaton for $63.7 million, net of cashacquired.
Financing Activities and Liquidity
Liquidity: The Company had $103.4 million of cash on hand at December 31, 2008. The Company has amulti-currency revolving credit facility, which provides for borrowings up to $600 million through July 22, 2009. Weintend to extend or renew our existing multi-currency credit facility with terms sufficient for our ongoing financingneeds before July 22, 2009. However, if the Company is unable to negotiate a new credit facility or similar accessto credit lines, it could adversely affect the Company’s ability to operate. At December 31, 2008 and December 31,2007 there were no outstanding borrowings under the facility. The credit agreement is subject to the usual termsand conditions applied by banks to an investment grade company. The two key covenants of the creditagreement are a net worth test and a debt compared to EBITDA (“Earnings Before Interest, Taxes, Depreciationand Amortization”) test. The Company was in compliance with all covenants at December 31, 2008 and expectsto be compliant in future periods. In addition to the credit facility, the Company has $750 million available under auniversal shelf registration statement on file with the Securities and Exchange Commission under which a varietyof debt and equity instruments could be issued. The Company also has access to the commercial paper marketthrough a $50 million accounts receivable securitization facility, which is rolled over annually. The current facilitymatures on April 25, 2009. From a credit quality perspective, the Company has an investment grade credit ratingof BBB from Standard & Poor’s and Baa3 from Moody’s. The current outlook from Standard & Poor’s is negativeand we are under review for a potential further downgrade from Moody’s. None of the Company’s debtagreements require accelerated repayment in the event of a decrease in credit ratings.
32

The Company’s significant contractual obligation payments at December 31, 2008 are as follows:
millions of dollars Total 2009 2010-2011 2012-2013 After 2013
Other post employment benefits excludingpensions(a) . . . . . . . . . . . . . . . . . . . . . . . . $ 853.1 $ 30.8 $ 66.0 $ 66.0 $ 690.3
Unfunded pension plans(b). . . . . . . . . . . . . . . 61.6 5.4 9.8 11.4 35.0Notes payable and long-term debt . . . . . . . . . 782.7 320.7 8.1 4.4 449.5Projected interest payments(c) . . . . . . . . . . . . 321.7 29.5 47.9 47.9 196.4Non-cancelable operating leases(d) . . . . . . . . 65.9 24.3 16.3 13.6 11.7Capital spending obligations. . . . . . . . . . . . . . 63.2 63.2 — — —Inventory purchase obligations . . . . . . . . . . . . 13.2 13.2 — — —Income tax payments(e) . . . . . . . . . . . . . . . . . 56.7 56.7 — — —Domination and Profit Transfer Agreement(f) . . 44.0 44.0 — — —Environmental(g) . . . . . . . . . . . . . . . . . . . . . . 13.3 5.9 3.0 3.0 1.4
Total . . . . . . . . . . . . . . . . . . . . . . . . . . . . . $2,275.4 $593.7 $151.1 $146.3 $1,384.3
(a) Other post employment benefits excluding pensions include anticipated future payments to cover retireemedical and life insurance benefits. See Note 12 to the Consolidated Financial Statements for disclo-sures related to the Company’s pension and other post employment benefits.
(b) Amount contained in “After 2013” column includes estimated payments through 2018. Since the timingand amount of payments for funded defined benefit pension plans are not certain for future years, suchpayments have been excluded from this table. The Company expects to contribute a total of $10 millionto $20 million into all defined benefit pension plans during 2009. See Note 12 to the ConsolidatedFinancial Statements for disclosures related to the Company’s pension and other post employmentbenefits.
(c) Projection is based upon actual fixed rates w here appropriate, and a projected floating rate for thevariable rate portion of the total debt portfolio. The floating rate projection is based upon current marketconditions and rounded to the nearest 50th basis point (0.50%), which is 4.5% for this purpose.Projection is also based upon debt being redeemed upon maturity.
(d) 2009 includes $7.7 million for the guaranteed residual value of production equipment with a lease thatexpires in 2009. Please see Note 16 to the Consolidated Financial Statements for details concerning thislease.
(e) See Note 4 to the Consolidated Financial Statements for disclosures related to the Company’s incometaxes.
(f) See Note 20 to the Consolidated Financial Statements for disclosures related to the Company’sDomination and Profit Transfer Agreement.
(g) See Note 15 to the Consolidated Financial Statements for disclosures related to the Company’senvironmental liability.
We believe that the combination of cash from operations, cash balances, available credit facilities andthe shelf registration will be sufficient to satisfy our cash needs for our current level of operations and ourplanned operations for the foreseeable future. We will continue to balance our needs for internal growth,external growth, debt reduction, dividends and share repurchase.
Financing Activities: Net debt increases were $107.5 million in 2008 excluding the impact of currencytranslation. Net debt reductions were $101.7 million in 2007 excluding the impact of currency translation.Proceeds from stock options exercised, net of tax benefit were $17.1 million, $46.3 million and $27.1 millionin 2008, 2007 and 2006, respectively. The Company paid dividends to BorgWarner stockholders of$51.1 million, $39.4 million and $36.7 million in 2008, 2007 and 2006, respectively. The Company hadtreasury stock purchases of $55.9 million and $47.0 million in 2008 and 2007, respectively.
33

Off Balance Sheet Arrangements
As of December 31, 2008, the accounts receivable securitization facility was sized at $50 million and hasbeen in place with its current funding partner since January 1994. This facility sells accounts receivablewithout recourse.
The Company has certain leases that are recorded as operating leases. Types of operating leasesinclude leases on the headquarters facility, an airplane, vehicles, and certain office equipment. The Companyalso has a lease obligation for production equipment at one of its facilities. The total expected future cashoutlays for all lease obligations at the end of 2008 is $65.9 million. See Note 16 to the Consolidated FinancialStatements for more information on operating leases, including future minimum payments.
The Company has guaranteed the residual values of certain leased machinery and equipment at one ofits facilities. The guarantees extend through the maturity of the underlying lease, which is in September 2010.In the event the Company exercises its option not to purchase the machinery and equipment, the Companyhas guaranteed a residual value of $7.7 million. The Company has accrued $4.1 million as a loss on thisguarantee, which is expected to be paid in 2009.
Pension and Other Post Employment Benefits
The Company’s policy is to fund its defined benefit pension plans in accordance with applicable gov-ernment regulations and to make additional contributions when management deems it appropriate. AtDecember 31, 2008, all legal funding requirements had been met. The Company contributed $13.3 millionto its defined benefit pension plans in 2008 and $12.4 million in 2007. The Company expects to contribute atotal of $10 million to $20 million in 2009.
The funded status of all pension plans was a net unfunded position of $(253.5) million and $(136.5) millionat the end of 2008 and 2007, respectively. Of these amounts, $(110.9) million and $(111.1) at the end of 2008and 2007, respectively, were related to plans in Germany, where there is not a tax deduction allowed underthe applicable regulations to fund the plans, hence, the common practice is that they are unfunded plans.
Other post employment benefits primarily consist of post employment health care benefits for certainemployees and retirees of the Company’s U.S. operations. The Company funds these benefits as retireeclaims are incurred. Other post employment benefits had an unfunded status of $(328.5) million at the end of2008 and $(373.1) million at the end of 2007. The unfunded levels decreased due to an increase in thediscount rate assumption and changes in certain plan designs.
The Company believes it will be able to fund the requirements of these plans through cash generatedfrom operations or other available sources of financing for the foreseeable future.
See Note 12 to the Consolidated Financial Statements for more information regarding costs andassumptions for employee retirement benefits.
OTHER MATTERS
Contingencies
In the normal course of business the Company and its subsidiaries are parties to various commercial andlegal claims, actions and complaints, including matters involving warranty claims, intellectual property claims,general liability and various other risks. See Notes 8 and 15 to the Consolidated Financial Statements. It is notpossible to predict with certainty whether or not the Company and its subsidiaries will ultimately be successfulin any of these commercial and legal matters or, if not, what the impact might be. The Company’senvironmental and product liability contingencies are discussed separately below. The Company’s man-agement does not expect that the results in any of these commercial and legal claims, actions and complaintswill have a material adverse effect on the Company’s results of operations, financial position or cash flows.
34

Litigation Outcome
In January 2006, BorgWarner Diversified Transmission Products Inc (“DTP”), a subsidiary of theCompany, filed a declaratory judgment action in United States District Court, Southern District of Indiana(Indianapolis Division) against the United Automobile, Aerospace, and Agricultural Implements Workers ofAmerica (“UAW”) Local No. 287 and Gerald Poor, individually and as the representative of a defendant class.DTP sought the Court’s affirmation that DTP did not violate the Labor-Management Relations Act or theEmployee Retirement Income Security Act by unilaterally amending certain medical plans effective April 1,2006 and October 1, 2006, prior to the expiration of the current collective bargaining agreements. OnSeptember 10, 2008, the Court found that DTP’s reservation of the right to make such amendments reducingthe level of benefits provided to retirees was limited by its collectively bargained health insurance agreementwith the UAW, which does not expire until April 24, 2009. Thus, the amendments were untimely. In 2008 theCompany recorded a charge of $4.0 million as a result of the Court’s decision.
The Company has communicated its plan to reduce the level of benefits provided to the retirees to makethem comparable to other Company retiree benefit plans. The change will be effective following expiration ofthe health insurance agreement in April 24, 2009.
Environmental
The Company and certain of its current and former direct and indirect corporate predecessors,subsidiaries and divisions have been identified by the United States Environmental Protection Agencyand certain state environmental agencies and private parties as potentially responsible parties (“PRPs”) atvarious hazardous waste disposal sites under the Comprehensive Environmental Response, Compensationand Liability Act (“Superfund”) and equivalent state laws and, as such, may presently be liable for the cost ofclean-up and other remedial activities at 35 such sites. Responsibility for clean-up and other remedialactivities at a Superfund site is typically shared among PRPs based on an allocation formula.
The Company believes that none of these matters, individually or in the aggregate, will have a materialadverse effect on its results of operations, financial position, or cash flows. Generally, this is because either theestimates of the maximum potential liability at a site are not large or the liability will be shared with other PRPs,although no assurance can be given with respect to the ultimate outcome of any such matter.
Based on information available to the Company (which in most cases includes: an estimate of allocationof liability among PRPs; the probability that other PRPs, many of whom are large, solvent public companies,will fully pay the cost apportioned to them; currently available information from PRPs and/or federal or stateenvironmental agencies concerning the scope of contamination and estimated remediation and consultingcosts; remediation alternatives; and estimated legal fees), the Company has established an accrual forindicated environmental liabilities with a balance at December 31, 2008 of $11.9 million. The Company hasaccrued amounts that do not exceed $3.4 million related to any individual site and we do not believe that thecosts related to any of these sites will have a material adverse effect on the Company’s results of operations,cash flows or financial condition. The Company expects to pay out substantially all of the amounts accrued forenvironmental liability over the next three to five years.
In connection with the sale of Kuhlman Electric Corporation, the Company agreed to indemnify the buyerand Kuhlman Electric for certain environmental liabilities, then unknown to the Company, relating to certainoperations of Kuhlman Electric that pre-date the Company’s 1999 acquisition of Kuhlman Electric. During2000, Kuhlman Electric notified the Company that it discovered potential environmental contamination at itsCrystal Springs, Mississippi plant while undertaking an expansion of the plant. The Company is continuing towork with the Mississippi Department of Environmental Quality and Kuhlman Electric to investigate andremediate to the extent necessary, historical contamination at the plant and surrounding area. KuhlmanElectric and others, including the Company, were sued in numerous related lawsuits, in which multipleclaimants alleged personal injury and property damage. In 2005, the Company and other defendants enteredinto settlements that resolved approximately 99% of the then known personal injury and property damageclaims relating to the alleged environmental contamination. Those settlements involved payments by the
35

Company of $28.5 million in the second half of 2005 and $15.7 million in the first quarter of 2006, in exchangefor, among other things, dismissal with prejudice of these lawsuits.
In December 2007, a lawsuit was filed against Kuhlman Electric and others, including the Company, onbehalf of approximately 209 plaintiffs, alleging personal injury relating to the alleged environmental contam-ination. In August 2008, two similar lawsuits were filed against Kuhlman Electric and others, including theCompany, on behalf of approximately 100 plaintiffs and 30 plaintiffs, respectively, alleging personal injuryrelated to the alleged environmental contamination. Given the early stage of the litigation, the Companycannot make any predictions as to the outcome, but its current intent is to vigorously defend against the suits.
Conditional Asset Retirement Obligations
In March 2005, the FASB issued Interpretation No. 47, Accounting for Conditional Asset RetirementObligations — an interpretation of FASB Statement No. 143 (“FIN 47”), which requires the Company torecognize legal obligations to perform asset retirements in which the timing and/or method of settlement areconditional on a future event that may or may not be within the control of the entity. Certain governmentregulations require the removal and disposal of asbestos from an existing facility at the time the facilityundergoes major renovations or is demolished. The liability exists because the facility will not last forever, but itis conditional on future renovations (even if there are no immediate plans to remove the materials, which poseno health or safety hazard in their current condition). Similarly, government regulations require the removal orclosure of underground storage tanks (“USTs”) and above ground storage tanks (“ASTs”) when their useceases, the disposal of polychlorinated biphenyl (“PCB”) transformers and capacitors when their use ceases,and the disposal of used furnace bricks and liners, and lead-based paint in conjunction with facilityrenovations or demolition. The Company currently has 32 manufacturing locations that have been identifiedas containing these items. The fair value to remove and dispose of this material has been estimated andrecorded at $1.4 million as of December 31, 2008 and $1.0 million as of December 31, 2007.
Product Liability
Like many other industrial companies who have historically operated in the U.S., the Company (or partiesthe Company is obligated to indemnify) continues to be named as one of many defendants in asbestos-related personal injury actions. We believe that the Company’s involvement is limited because, in general,these claims relate to a few types of automotive friction products that were manufactured many years ago andcontained encapsulated asbestos. The nature of the fibers, the encapsulation and the manner of use lead theCompany to believe that these products are highly unlikely to cause harm. As of December 31, 2008 and2007, the Company had approximately 27,000 and 42,000 pending asbestos-related product liability claims,respectively. Of the 27,000 outstanding claims at December 31, 2008, approximately 16,000 are pending injust three jurisdictions, where significant tort and judicial reform activities are underway.
The Company’s policy is to aggressively defend against these lawsuits and the Company has beensuccessful in obtaining dismissal of many claims without any payment. The Company expects that the vastmajority of the pending asbestos-related product liability claims where it is a defendant (or has an obligation toindemnify a defendant) will result in no payment being made by the Company or its insurers. In 2008, of theapproximately 17,500 claims resolved, only 210 (1.2%) resulted in any payment being made to a claimant byor on behalf of the Company. In 2007, of the approximately 4,400 claims resolved, only 194 (4.4%) resulted inany payment being made to a claimant by or on behalf of the Company.
Prior to June 2004, the settlement and defense costs associated with all claims were covered by theCompany’s primary layer insurance coverage, and these carriers administered, defended, settled and paid allclaims under a funding arrangement. In June 2004, primary layer insurance carriers notified the Company ofthe alleged exhaustion of their policy limits. This led the Company to access the next available layer ofinsurance coverage. Since June 2004, secondary layer insurers have paid asbestos-related litigation defenseand settlement expenses pursuant to a funding arrangement. To date, the Company has paid $50.1 million indefense and indemnity in advance of insurers’ reimbursement and has received $14.2 million in cash from
36

insurers. The outstanding balance of $35.9 million is expected to be fully recovered. Timing of the recovery isdependent on final resolution of the declaratory judgment action referred to below. At December 31, 2007,insurers owed $20.6 million in association with these claims.
At December 31, 2008, the Company has an estimated liability of $34.7 million for future claimsresolutions, with a related asset of $34.7 million to recognize the insurance proceeds receivable by theCompany for estimated losses related to claims that have yet to be resolved. Insurance carrier reimbursementof 100% is expected based on the Company’s experience, its insurance contracts and decisions received todate in the declaratory judgment action referred to below. At December 31, 2007, the comparable value of theinsurance receivable and accrued liability was $39.6 million.
The amounts recorded in the Consolidated Balance Sheets related to the estimated future settlement ofexisting claims are as follows:
millions of dollars 2008 2007
Assets:Prepayments and other current assets . . . . . . . . . . . . . . . . . . . . . . . . . . . . $22.1 $20.1Other non-current assets . . . . . . . . . . . . . . . . . . . . . . . . . . . . . . . . . . . . . . 12.6 19.5
Total insurance receivable . . . . . . . . . . . . . . . . . . . . . . . . . . . . . . . . . . . . $34.7 $39.6
Liabilities:Accounts payable and accrued expenses . . . . . . . . . . . . . . . . . . . . . . . . . . $22.1 $20.1Other non-current liabilities . . . . . . . . . . . . . . . . . . . . . . . . . . . . . . . . . . . . . 12.6 19.5
Total accrued liability . . . . . . . . . . . . . . . . . . . . . . . . . . . . . . . . . . . . . . . . $34.7 $39.6
The Company cannot reasonably estimate possible losses, if any, in excess of those for which it hasaccrued, because it cannot predict how many additional claims may be brought against the Company (orparties the Company has an obligation to indemnify) in the future, the allegations in such claims, the possibleoutcomes, or the impact of tort reform legislation that may be enacted at the State or Federal levels.
A declaratory judgment action was filed in January 2004 in the Circuit Court of Cook County, Illinois byContinental Casualty Company and related companies (“CNA”) against the Company and certain of its otherhistorical general liability insurers. CNA provided the Company with both primary and additional layerinsurance, and, in conjunction with other insurers, is currently defending and indemnifying the Companyin its pending asbestos-related product liability claims. The lawsuit seeks to determine the extent of insurancecoverage available to the Company including whether the available limits exhaust on a “per occurrence” or an“aggregate” basis, and to determine how the applicable coverage responsibilities should be apportioned. OnAugust 15, 2005, the Court issued an interim order regarding the apportionment matter. The interim order hasthe effect of making insurers responsible for all defense and settlement costs pro rata to time-on-the-risk, withthe pro-ration method to hold the insured harmless for periods of bankrupt or unavailable coverage. Appealsof the interim order were denied. However, the issue is reserved for appellate review at the end of the action. Inaddition to the primary insurance available for asbestos-related claims, the Company has substantialadditional layers of insurance available for potential future asbestos-related product claims. As such, theCompany continues to believe that its coverage is sufficient to meet foreseeable liabilities.
Although it is impossible to predict the outcome of pending or future claims or the impact of tort reformlegislation that may be enacted at the State or Federal levels, due to the encapsulated nature of the products,the Company’s experiences in aggressively defending and resolving claims in the past, and the Company’ssignificant insurance coverage with solvent carriers as of the date of this filing, management does not believethat asbestos-related product liability claims are likely to have a material adverse effect on the Company’sresults of operations, cash flows or financial condition.
37

CRITICAL ACCOUNTING POLICIES
The consolidated financial statements are prepared in conformity with GAAP. In preparing these financialstatements, management has made its best estimates and judgments of certain amounts included in thefinancial statements, giving due consideration to materiality. Critical accounting policies are those that aremost important to the portrayal of the Company’s financial condition and results of operations. These policiesrequire management’s most difficult, subjective or complex judgments in the preparation of the financialstatements and accompanying notes. Management makes estimates and assumptions about the effect ofmatters that are inherently uncertain, relating to the reporting of assets, liabilities, revenues, expenses and thedisclosure of contingent assets and liabilities. Our most critical accounting policies are discussed below.
Revenue Recognition
The Company recognizes revenue when title and risk of loss pass to the customer, which is usually uponshipment of product. Although the Company may enter into long-term supply agreements with its majorcustomers, each shipment of goods is treated as a separate sale and the price is not fixed over the life of theagreements.
Impairment of Long-Lived Assets
The Company periodically reviews the carrying value of its long-lived assets, whether held for use ordisposal, including other intangible assets, when events and circumstances warrant such a review. Thisreview is performed using estimates of future cash flows. If the carrying value of a long-lived asset isconsidered impaired, an impairment charge is recorded for the amount by which the carrying value of thelong-lived asset exceeds its fair value. Management believes that the estimates of future cash flows and fairvalue assumptions are reasonable; however, changes in assumptions underlying these estimates could affectthe evaluations. Significant judgments and estimates used by management when evaluating long-livedassets for impairment include: (i) an assessment as to whether an adverse event or circumstance hastriggered the need for an impairment review; and (ii) undiscounted future cash flows generated by the asset.The Company recognized $72.9 million and $56.4 million in impairment of long-lived assets as part ofrestructuring expenses in 2008 and 2006, respectively.
See Note 19 to the Consolidated Financial Statements for more information regarding the Company’s2006 and 2008 impairment of long-lived assets.
Goodwill
The Company annually reviews its goodwill for impairment in the fourth quarter of each year for all of itsreporting units, or when events and circumstances warrant such a review. This review utilizes the “two-stepimpairment test” required under Statement of Financial Accounting Standards No. 142, Goodwill and OtherIntangibles, and requires us to make significant assumptions and estimates about the extent and timing offuture cash flows, discount rates and growth rates. The cash flows are estimated over a significant futureperiod of time, which makes those estimates and assumptions subject to an even higher degree ofuncertainty. We also utilize market valuation models and other financial ratios, which require us to makecertain assumptions and estimates regarding the applicability of those models to our assets and businesses.We believe that the assumptions and estimates used to determine the estimated fair values of each of ourreporting units are reasonable. However, different assumptions could materially affect the estimated fairvalue. The goodwill impairment test was performed in December and September 2008, December 2007 andDecember 2006. The Company recognized goodwill impairment of $156.8 million in the Engine segment in2008 and $0.2 million in the Drivetrain segment in 2006. No goodwill impairment was recorded in 2007.
See Note 7 to the Consolidated Financial Statements for more information regarding goodwill.
38
Environmental Accrual
We work with outside experts to determine a range of potential liability for environmental sites. Theranges for each individual site are then aggregated into a loss range for the total accrued liability.Management’s estimate of the loss range for environmental liability, including conditional asset retirementobligations, for 2008 is between $12.4 million and $26.1 million. We record an accrual at the most probableamount within the range unless one cannot be determined; in which case we record the accrual at the lowend of the range. At the end of 2008, our total accrued environmental liability was $13.3 million, whichincludes our conditional asset retirement obligation under FIN 47 of $1.4 million.
See Note 15 to the Consolidated Financial Statements for more information regarding environmentalaccrual.
Product Warranty
The Company provides warranties on some of its products. The warranty terms are typically from one tothree years. Provisions for estimated expenses related to product warranty are made at the time products aresold. These estimates are established using historical information about the nature, frequency, and averagecost of warranty claim settlements; as well as product manufacturing and industry developments andrecoveries from third parties. Management actively studies trends of warranty claims and takes action toimprove product quality and minimize warranty claims. Management believes that the warranty accrual isappropriate; however, actual claims incurred could differ from the original estimates, requiring adjustments tothe accrual. The accrual is represented in both current and non-current liabilities on the balance sheet.
See Note 8 to the Consolidated Financial Statements for more information regarding product warranty.
Other Loss Accruals and Valuation Allowances
The Company has numerous other loss exposures, such as customer claims, workers’ compensationclaims, litigation, and recoverability of assets. Establishing loss accruals or valuation allowances for thesematters requires the use of estimates and judgment in regard to the risk exposure and ultimate realization. Weestimate losses under the programs using consistent and appropriate methods; however, changes to ourassumptions could materially affect our recorded accrued liabilities for loss or asset valuation allowances.
Pension and Other Post Employment Defined Benefits
The Company provides post employment defined benefits to a number of its current and formeremployees. Costs associated with post employment defined benefits include pension and post employmenthealth care expenses for employees, retirees and surviving spouses and dependents. The Company’semployee defined benefit pension and post employment health care expenses are dependent on manage-ment’s assumptions used by actuaries in calculating such amounts. These assumptions include discountrates, health care cost trend rates, inflation, long-term return on plan assets, retirement rates, mortality ratesand other factors. Health care cost trend assumptions are developed based on historical cost data, the near-term outlook, and an assessment of likely long-term trends. The inflation assumption is based on anevaluation of external market indicators. Retirement and mortality rates are based primarily on actual planexperience. The Company reviews its actuarial assumptions on an annual basis and makes modifications tothe assumptions based on current rates and trends when appropriate. The effects of the modifications arerecorded currently or amortized over future periods in accordance with GAAP.
The Company’s approach to establishing the discount rate is based upon the market yields of high-quality corporate bonds, with appropriate consideration of each plan’s defined benefit payment terms andduration of the liabilities. The discount rate assumption is typically rounded up or down to the nearest 25 basispoints for each plan. As a sensitivity measure for the Company’s pension plans, a decrease of 25 basis pointsto the discount rate would increase the Company’s 2009 expense by approximately $0.9 million. As for the
39

Company’s other post employment benefit plans, a decrease of 25 basis points to the discount rate wouldincrease the Company’s 2009 expense by approximately $0.3 million.
The Company determines its expected return on plan asset assumptions by evaluating estimates offuture market returns and the plans’ asset allocation. The Company also considers the impact of activemanagement of the plans’ invested assets. The Company’s expected return on assets assumption reflectsthe asset allocation of each plan. For 2009, the Company is changing its expected return on U.S. plan assetsto 7.50% from 8.75% to reflect adjustments made to its targeted asset allocations. For sensitivity purposes, a25 basis point decrease in the long-term return on assets would increase the 2009 pension expense byapproximately $0.8 million.
The Company determines its health care inflation rate for its other post employment benefit plans byevaluating the circumstances surrounding the plan design, recent experience and health care economics.For sensitivity purposes, a one percentage point increase in the assumed health care cost trend wouldincrease the Company’s projected benefit obligation by $18.9 million at December 31, 2008, and wouldincrease the 2009 expense by $1.4 million.
Based on the information provided by its independent actuaries and other relevant sources, theCompany believes that the assumptions used are reasonable; however, changes in these assumptions,or experience different from that assumed, could impact the Company’s financial position, results ofoperations, or cash flows.
See Note 12 to the Consolidated Financial Statements for more information regarding costs andassumptions for employee retirement benefits.
Income Taxes
The Company accounts for income taxes in accordance with SFAS No. 109, Accounting for IncomeTaxes. Deferred tax assets and liabilities are recognized for the future tax consequences attributable todifferences between financial statement carrying amounts of existing assets and liabilities and their respectivetax bases and operating loss and tax credit carryforwards. Deferred tax assets and liabilities are measuredusing enacted tax rates expected to apply to taxable income in the years in which those temporary differencesare expected to be recovered or settled. The Company records a valuation allowance that primarilyrepresents foreign operating and other loss carryforwards for which utilization is uncertain. Managementjudgment is required in determining the Company’s provision for income taxes, deferred tax assets andliabilities and the valuation allowance recorded against the Company’s net deferred tax assets. In calculatingthe provision for income taxes on an interim basis, the Company uses an estimate of the annual effective taxrate based upon the facts and circumstances known at each interim period. In determining the need for avaluation allowance, the historical and projected financial performance of the operation recording the netdeferred tax asset is considered along with any other pertinent information. Since future financial results maydiffer from previous estimates, periodic adjustments to the Company’s valuation allowance may benecessary.
The Company is subject to income taxes in the U.S. and numerous non-U.S. jurisdictions. Significantjudgment is required in determining our worldwide provision for income taxes and recording the relatedassets and liabilities. In the ordinary course of our business, there are many transactions and calculationswhere the ultimate tax determination is less than certain. The Company is regularly under audit by the variousapplicable tax authorities. Accruals for income tax contingencies are provided for in accordance with therequirements of FASB interpretation No. 48, Accounting for Uncertainty in Income Taxes, an interpretation ofFASB Statement No. 109. The Company’s federal and certain state income tax returns and certainnon-U.S. income tax returns are currently under various stages of audit by applicable tax authorities.Although the outcome of tax audits is always uncertain, management believes that it has appropriate supportfor the positions taken on its tax returns and that its annual tax provisions included amounts sufficient to payassessments, if any, which may be proposed by the taxing authorities. At December 31, 2008, the Companyhas recorded a liability for its best estimate of the probable loss on certain of its tax positions, which is included
40

in other non-current liabilities. Nonetheless, the amounts ultimately paid, if any, upon resolution of the issuesraised by the taxing authorities may differ materially from the amounts accrued for each year.
See Note 4 to the Consolidated Financial Statements for more information regarding income taxes.
New Accounting Pronouncements
In June 2006, the FASB issued interpretation No. 48, Accounting for Uncertainty in Income Taxes, aninterpretation of FASB Statement No. 109 (“FIN 48”). The interpretation prescribes a consistent recognitionthreshold and measurement attribute, as well as clear criteria for subsequently recognizing, derecognizingand measuring such tax positions for financial statement purposes. FIN 48 also requires expanded disclosurewith respect to the uncertainty in income taxes. The Company adopted the provisions of FIN 48 on January 1,2007. As a result of the implementation of FIN 48, the Company recognized a $16.6 million reduction to itsJanuary 1, 2007 retained earnings balance.
In September 2006, the FASB issued Statement of Financial Accounting Standards No. 157, Fair ValueMeasurements (“FAS 157”). FAS 157 defines fair value, establishes a framework for measuring fair value inGAAP and expands disclosures about fair value measurements. On January 1, 2008, the Company partiallyadopted as required, FAS 157. See Note 10 to the Consolidated Financial Statements for more informationregarding the implementation of FAS 157.
In February 2007, the FASB issued Statement of Financial Accounting Standards No. 159, The Fair ValueOption for Financial Assets and Financial Liabilities (“FAS 159”). FAS 159 allows entities to irrevocably elect torecognize most financial assets and financial liabilities at fair value on an instrument-by-instrument basis. Thestated objective of FAS 159 is to improve financial reporting by giving entities the opportunity to elect tomeasure certain financial assets and liabilities at fair value in order to mitigate earnings volatility caused whenrelated assets and liabilities are measured differently. FAS 159 is effective for the Company beginning with itsquarter ending March 31, 2008. The Company chose to not make the election to adopt.
In December 2007, the FASB issued Statement of Financial Accounting Standards No. 141 (Revised2007), Business Combinations (“FAS 141(R)”). FAS 141(R) establishes principles and requirements forrecognizing identifiable assets acquired, liabilities assumed, noncontrolling interest in the acquiree, goodwillacquired in the combination or the gain from a bargain purchase, and disclosure requirements. Under thisrevised statement, all costs incurred to effect an acquisition will be recognized separately from the acquisition.Also, restructuring costs that are expected but the acquirer is not obligated to incur will be recognizedseparately from the acquisition. FAS 141(R) is effective for the Company beginning with its quarter endingMarch 31, 2009. The adoption of FAS 141(R) is not expected to have a material impact on the Company’sconsolidated financial position, results of operations or cash flows.
In December 2007, the FASB issued Statement of Financial Accounting Standards No. 160, Non-controlling Interests in Consolidated Financial Statements (“FAS 160”). FAS 160 requires that ownershipinterests in subsidiaries held by parties other than the parent are clearly identified. In addition, it requires thatthe amount of consolidated net income attributable to the parent and to the noncontrolling interest be clearlyidentified and presented on the face of the income statement. FAS 160 is effective for the Company beginningwith its quarter ending March 31, 2009. The adoption of FAS 160 is not expected to have a material impact onthe Company’s consolidated financial position, results of operations or cash flows.
In February 2008, the FASB issued FASB Staff Position No. FAS 157-2 (“FSP FAS 157-2”). FSPFAS 157-2 delays the effective date of SFAS 157 for nonfinancial assets and nonfinancial liabilities that arerecognized or disclosed in the financial statements on a nonrecurring basis to fiscal years beginning afterNovember 15, 2008. Refer to Note 10, “Fair Value Measurements” of the Notes to the Consolidated FinancialStatements for further discussion of the Company’s partial adoption of FSP FAS 157-2.
In March 2008, the FASB issued Statement of Financial Accounting Standards No. 161, Disclosuresabout Derivative Instruments and Hedging Activities (“FAS 161”). FAS 161 requires entities to provide
41
enhanced disclosures about how and why an entity uses derivative instruments, how derivative instrumentsand related hedged items are accounted for under Statement 133 and its related interpretations, and howderivative instruments and related hedged items affect an entity’s financial position, financial performance,and cash flows. FAS 161 is effective for the Company beginning with its quarter ending March 31, 2009. Theadoption of FAS 161 is not expected to have a material impact on the Company’s consolidated financialposition, results of operations or cash flows.
In December 2008, the FASB issued Staff Position 132(R)-1, Employers’ Disclosures about Postretire-ment Benefit Plan Assets (“FAS 132(R)-1”). FAS 132(R)-1 requires entities to provide enhanced disclosuresabout how investment allocation decisions are made, the major categories of plan assets, the inputs andvaluation techniques used to measure fair value of plan assets, the effect of fair value measurements usingsignificant unobservable inputs on changes in plan assets for the period, and significant concentrations of riskwithin plan assets. FAS 132(R)-1 is effective for the Company beginning with its year ending December 31,2009. The Company is currently assessing the potential impacts, if any, on its consolidated financialstatements.
In December 2008, the FASB issued Staff Position 140-4 and Financial Interpretation 46(R)-8, Disclo-sures by Public Entities (Enterprises) about Transfers of Financial Assets and Interests in Variable InterestEntities (“FSP 140-4 and FIN 46(R)-8”). FSP 140-4 and FIN 46(R)-8 requires entities to provide enhanceddisclosures about how an entity accounts for transfers of financial assets, the nature of involvement, if any,after the financial asset sale and the nature of any restrictions on assets reported by an entity in its statementof financial position that relates to a transferred financial asset, including the carrying amounts of such assets.The Company has adjusted its disclosures to be compliant with FSP 140-4 and FIN 46(R)-8 atDecember 31,2008.
QUALITATIVE AND QUANTITATIVE DISCLOSURE ABOUT MARKET RISK
The Company’s primary market risks include fluctuations in interest rates and foreign currency exchangerates. We are also affected by changes in the prices of commodities used or consumed in our manufacturingoperations. Some of our commodity purchase price risk is covered by supply agreements with customersand suppliers. Other commodity purchase price risk is addressed by hedging strategies, which includeforward contracts. The Company enters into derivative instruments only with high credit quality counter-parties and diversifies its positions across such counterparties in order to reduce its exposure to credit losses.We do not engage in any derivative instruments for purposes other than hedging specific operating risks.
We have established policies and procedures to manage sensitivity to interest rate, foreign currencyexchange rate and commodity purchase price risk, which include monitoring the level of exposure to eachmarket risk.
Interest Rate Risk
Interest rate risk is the risk that we will incur economic losses due to adverse changes in interest rates.The Company manages its interest rate risk by balancing its exposure to fixed and variable rates whileattempting to minimize its interest costs. The Company selectively uses interest rate swaps to reduce marketvalue risk associated with changes in interest rates (fair value hedges). At the end of 2008, the amount of netdebt with fixed interest rates was 38.5% of total debt, including the impact of the interest rate swaps. Ourearnings exposure related to adverse movements in interest rates is primarily derived from outstandingfloating rate debt instruments that are indexed to floating money market rates. A 10% increase or decrease inthe average cost of our variable rate debt would result in a change in pre-tax interest expense for 2008 ofapproximately $2.1 million, and $1.8 million in 2007.
We also measure interest rate risk by estimating the net amount by which the fair value of all of ourinterest rate sensitive assets and liabilities would be impacted by selected hypothetical changes in marketinterest rates. Fair value is estimated using a discounted cash flow analysis. Assuming a hypothetical
42

instantaneous 10% change in interest rates as of December 31, 2008, the net fair value of these instrumentswould increase by approximately $24 million if interest rates decreased and would decrease by approximately$22 million if interest rates increased. Our interest rate sensitivity analysis assumes a constant shift in interestrate yield curves. The model, therefore, does not reflect the potential impact of changes in the relationshipbetween short-term and long-term interest rates. Interest rate sensitivity at December 31, 2007, measured ina similar manner, was slightly less than at December 31, 2008.
Foreign Currency Exchange Rate Risk
Foreign currency risk is the risk that we will incur economic losses due to adverse changes in foreigncurrency exchange rates. Currently, our most significant currency exposures relate to the British Pound, theEuro, the Hungarian Forint, the Japanese Yen, and the South Korean Won. We mitigate our foreign currencyexchange rate risk principally by establishing local production facilities and related supply chain participants inthe markets we serve, by invoicing customers in the same currency as the source of the products and byfunding some of our investments in foreign markets through local currency loans and cross currency swaps.Such non-U.S. Dollar debt was $495.8 million as of December 31, 2008 and $413.5 million as of Decem-ber 31, 2007. We also monitor our foreign currency exposure in each country and implement strategies torespond to changing economic and political environments. In addition, the Company periodically enters intoforward currency contracts in order to reduce exposure to exchange rate risk related to transactionsdenominated in currencies other than the functional currency. As of December 31, 2008, the Companywas holding foreign exchange derivatives with positive and negative fair market values of $10.2 million and$(61.8) million, respectively, of which $9.9 million in gains and $(36.3) million in losses mature in less than oneyear. As of December 31, 2008, $1.0 million in gains and $(8.2) million in losses did not qualify for deferral.
Commodity Price Risk
Commodity price risk is the possibility that we will incur economic losses due to adverse changes in thecost of raw materials used in the production of our products. Commodity forward and option contracts areexecuted to offset our exposure to the potential change in prices mainly for various non-ferrous metals andnatural gas consumption used in the manufacturing of vehicle components. As of December 31, 2008, theCompany had forward and option commodity contracts with a total notional value of $50.2 million. As ofDecember 31, 2008, the Company was holding commodity derivatives with positive and negative fair marketvalues of $2.1 million and $(16.3) million, respectively, of which $1.0 million in gains and $(15.1) million inlosses mature in less than one year.
Disclosure Regarding Forward-Looking Statements
Statements contained in this Management’s Discussion and Analysis of Financial Condition and Resultsof Operations may contain forward-looking statements as contemplated by the 1995 Private SecuritiesLitigation Reform Act that are based on management’s current expectations, estimates and projections.Words such as “outlook”, “expects,” “anticipates,” “intends,” “plans,” “believes,” “estimates,” or variations ofsuch words and similar expressions are intended to identify such forward-looking statements. Forward-looking statements are subject to risks and uncertainties, many of which are difficult to predict and generallybeyond the control of the Company, which could cause actual results to differ materially from thoseexpressed, projected or implied in or by the forward-looking statements. Such risks and uncertaintiesinclude: fluctuations in domestic or foreign automotive production, the continued use of outside suppliers,fluctuations in demand for vehicles containing BorgWarner products, general economic conditions, as well asother risks detailed in the Company’s filings with the Securities and Exchange Commission, including thefactors identified under Item 1A, “Risk Factors,” in its most recently filed annual report on Form 10-K. TheCompany does not undertake any obligation to update any forward-looking statement.
43

REPORT OF MANAGEMENT ON INTERNAL CONTROL OVER FINANCIAL REPORTINGThe information in this report is the responsibility of management. BorgWarner Inc. and Consolidated
Subsidiaries (the “Company”) has in place reporting guidelines and policies designed to ensure that thestatements and other information contained in this report present a fair and accurate financial picture of theCompany. In fulfilling this management responsibility, we make informed judgments and estimates con-forming with accounting principles generally accepted in the United States of America.
The accompanying Consolidated Financial Statements have been audited by Deloitte & Touche LLP, anindependent registered public accounting firm.
The management of the Company is responsible for establishing and maintaining adequate internalcontrol over financial reporting.
The Company’s internal control over financial reporting is a process designed to provide reasonableassurance regarding the reliability of financial reporting and the preparation of financial statements for externalpurposes in accordance with generally accepted accounting principles in the United States of America. Theinternal control process includes those policies and procedures that:
• Pertain to the maintenance of records that, in reasonable detail, accurately and fairly reflect thetransactions and dispositions of the assets of the Company;
• Provide reasonable assurance that transactions are recorded as necessary to permit preparation offinancial statements in accordance with generally accepted accounting principles, and that receiptsand expenditures of the Company are being made only in accordance with authorizations ofmanagement and directors of the Company; and
• Provide reasonable assurance regarding prevention or timely detection of unauthorized acquisition, useor disposition of the Company’s assets that could have a material effect on the financial statements.
Any system of internal control, no matter how well designed, has inherent limitations. Therefore, even thosesystems determined to be effective may not prevent or detect misstatements and can provide only reasonableassurance with respect to financial statement preparation and presentation. Also, projections of any evaluationof effectiveness to future periods are subject to the risk that controls may become inadequate because ofchanges in conditions, or that the degree of compliance with the policies or procedures may deteriorate.
The Company’s management assessed the effectiveness of the Company’s internal control overfinancial reporting as of December 31, 2008. In making this assessment, the Company’s managementused the criteria set forth by the Committee of Sponsoring Organizations of the Treadway Commission(“COSO”) in Internal Control — Integrated Framework.
Based on management’s assessment and those criteria, we believe that, as of December 31, 2008, theCompany’s internal control over financial reporting is effective.
Deloitte & Touche LLP, the Company’s independent registered public accounting firm, who audited theCompany’s financial statements included in this Annual Report, and has issued an attestation reportappearing in item 9A of Form 10-K on the effectiveness of the Company’s internal control over financialreporting as of December 31, 2008.
The Company’s Audit Committee, composed entirely of directors of the Company who are not employees,meets periodically with the Company’s management and independent registered public accounting firm to reviewfinancial results and procedures, internal financial controls and internal and external audit plans and recom-mendations. In carrying out these responsibilities, the Audit Committee and the independent registered publicaccounting firm have unrestricted access to each other with or without the presence of managementrepresentatives.
/s/ Timothy M. ManganelloChairman and Chief Executive Officer
/s/ Robin J. AdamsExecutive Vice President,Chief Financial Officer & Chief Administrative Officer
February 12, 2009
44

Item 7A. Quantitative and Qualitative Disclosures About Market Risk
Refer to Note 11, “Financial Instruments” of the Notes to the Consolidated Financial Statements in Item 8of this report for information with respect to interest rate risk and foreign currency exchange risk. Informationwith respect to the levels of indebtedness subject to interest rate fluctuation is contained in Note 9, “NotesPayable and Long-Term Debt” to the Consolidated Financial Statements in Item 8. Information with respect tothe Company’s level of business outside the United States which is subject to foreign currency exchange ratemarket risk is contained in Note 21, “Reporting Segments and Related Information” of the Notes to theConsolidated Financial Statements in Item 8.
Item 8. Financial Statements and Supplementary Data
45
REPORT OF INDEPENDENT REGISTERED PUBLIC ACCOUNTING FIRM
To the Board of Directors and Stockholders of BorgWarner Inc.Auburn Hills, Michigan
We have audited the accompanying consolidated balance sheets of BorgWarner Inc. and ConsolidatedSubsidiaries (the “Company”) as of December 31, 2008 and 2007, and the related consolidated statementsof operations, stockholders’ equity and comprehensive income (loss), and cash flows for each of the threeyears in the period ended December 31, 2008. These financial statements are the responsibility of theCompany’s management. Our responsibility is to express an opinion on the financial statements based on ouraudits.
We conducted our audits in accordance with the standards of the Public Company AccountingOversight Board (United States). Those standards require that we plan and perform the audit to obtainreasonable assurance about whether the financial statements are free of material misstatement. An auditincludes examining, on a test basis, evidence supporting the amounts and disclosures in the financialstatements. An audit also includes assessing the accounting principles used and significant estimates madeby management, as well as evaluating the overall financial statement presentation. We believe that our auditsprovide a reasonable basis for our opinion.
In our opinion, such consolidated financial statements present fairly, in all material respects, the financialposition of BorgWarner Inc. and Consolidated Subsidiaries as of December 31, 2008 and 2007, and theresults of their operations and their cash flows for each of the three years in the period ended December 31,2008, in conformity with accounting principles generally accepted in the United States of America.
As discussed in Note 1 to the consolidated financial statements, the Company changed its method ofaccounting in 2007 for income taxes as a result of adopting FASB Interpretation No. 48, Accounting forUncertainty in Income Taxes, and in 2006 for defined benefit pension and other postretirement plans as aresult of adopting SFAS No. 158, Employers’ Accounting for Defined Benefit Pension and Other Postre-tirement Plans.
We have also audited, in accordance with the standards of the Public Company Accounting OversightBoard (United States), the Company’s internal control over financial reporting as of December 31, 2008,based on the criteria established in Internal Control — Integrated Framework issued by the Committee ofSponsoring Organizations of the Treadway Commission and our report dated February 12, 2009 expressedan unqualified opinion on the Company’s internal control over financial reporting.
/s/ DELOITTE & TOUCHE LLP
Detroit, MichiganFebruary 12, 2009
46
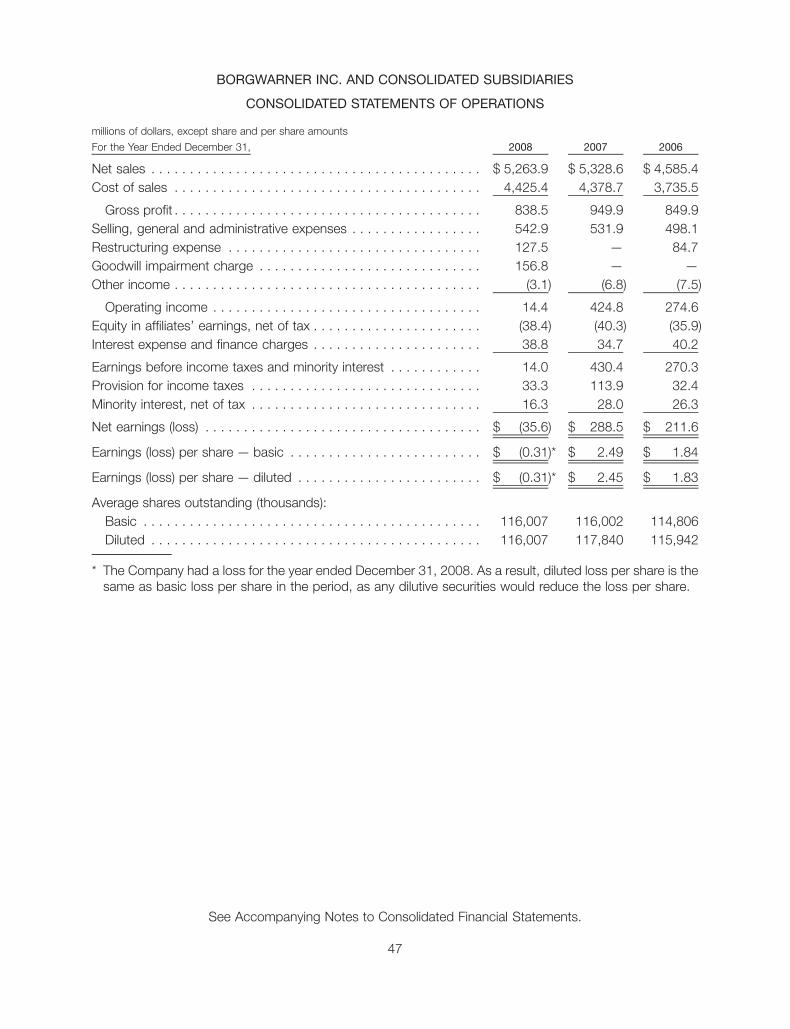
BORGWARNER INC. AND CONSOLIDATED SUBSIDIARIES
CONSOLIDATED STATEMENTS OF OPERATIONS
millions of dollars, except share and per share amounts
For the Year Ended December 31, 2008 2007 2006
Net sales . . . . . . . . . . . . . . . . . . . . . . . . . . . . . . . . . . . . . . . . . . . $ 5,263.9 $ 5,328.6 $ 4,585.4Cost of sales . . . . . . . . . . . . . . . . . . . . . . . . . . . . . . . . . . . . . . . . 4,425.4 4,378.7 3,735.5
Gross profit . . . . . . . . . . . . . . . . . . . . . . . . . . . . . . . . . . . . . . . . 838.5 949.9 849.9Selling, general and administrative expenses . . . . . . . . . . . . . . . . . 542.9 531.9 498.1Restructuring expense . . . . . . . . . . . . . . . . . . . . . . . . . . . . . . . . . 127.5 — 84.7Goodwill impairment charge . . . . . . . . . . . . . . . . . . . . . . . . . . . . . 156.8 — —Other income . . . . . . . . . . . . . . . . . . . . . . . . . . . . . . . . . . . . . . . . (3.1) (6.8) (7.5)
Operating income . . . . . . . . . . . . . . . . . . . . . . . . . . . . . . . . . . . 14.4 424.8 274.6Equity in affiliates’ earnings, net of tax . . . . . . . . . . . . . . . . . . . . . . (38.4) (40.3) (35.9)Interest expense and finance charges . . . . . . . . . . . . . . . . . . . . . . 38.8 34.7 40.2
Earnings before income taxes and minority interest . . . . . . . . . . . . 14.0 430.4 270.3Provision for income taxes . . . . . . . . . . . . . . . . . . . . . . . . . . . . . . 33.3 113.9 32.4Minority interest, net of tax . . . . . . . . . . . . . . . . . . . . . . . . . . . . . . 16.3 28.0 26.3
Net earnings (loss) . . . . . . . . . . . . . . . . . . . . . . . . . . . . . . . . . . . . $ (35.6) $ 288.5 $ 211.6
Earnings (loss) per share — basic . . . . . . . . . . . . . . . . . . . . . . . . . $ (0.31)* $ 2.49 $ 1.84
Earnings (loss) per share — diluted . . . . . . . . . . . . . . . . . . . . . . . . $ (0.31)* $ 2.45 $ 1.83
Average shares outstanding (thousands):Basic . . . . . . . . . . . . . . . . . . . . . . . . . . . . . . . . . . . . . . . . . . . . 116,007 116,002 114,806Diluted . . . . . . . . . . . . . . . . . . . . . . . . . . . . . . . . . . . . . . . . . . . 116,007 117,840 115,942
* The Company had a loss for the year ended December 31, 2008. As a result, diluted loss per share is thesame as basic loss per share in the period, as any dilutive securities would reduce the loss per share.
See Accompanying Notes to Consolidated Financial Statements.
47

BORGWARNER INC. AND CONSOLIDATED SUBSIDIARIES
CONSOLIDATED BALANCE SHEETS
millions of dollars
December 31, 2008 2007
ASSETSCash . . . . . . . . . . . . . . . . . . . . . . . . . . . . . . . . . . . . . . . . . . . . . . . . . . . . . . . . . . $ 103.4 $ 188.5Marketable securities . . . . . . . . . . . . . . . . . . . . . . . . . . . . . . . . . . . . . . . . . . . . . . — 14.6Receivables, net . . . . . . . . . . . . . . . . . . . . . . . . . . . . . . . . . . . . . . . . . . . . . . . . . 607.1 802.4Inventories, net . . . . . . . . . . . . . . . . . . . . . . . . . . . . . . . . . . . . . . . . . . . . . . . . . . 451.2 447.6Deferred income taxes . . . . . . . . . . . . . . . . . . . . . . . . . . . . . . . . . . . . . . . . . . . . . 67.5 42.8Prepayments and other current assets . . . . . . . . . . . . . . . . . . . . . . . . . . . . . . . . . 79.0 84.4
Total current assets . . . . . . . . . . . . . . . . . . . . . . . . . . . . . . . . . . . . . . . . . . . . 1,308.2 1,580.3Property, plant and equipment, net . . . . . . . . . . . . . . . . . . . . . . . . . . . . . . . . . . . . 1,586.2 1,609.1Investments and advances . . . . . . . . . . . . . . . . . . . . . . . . . . . . . . . . . . . . . . . . . . 266.5 255.1Goodwill . . . . . . . . . . . . . . . . . . . . . . . . . . . . . . . . . . . . . . . . . . . . . . . . . . . . . . . 1,052.4 1,168.2Other non-current assets . . . . . . . . . . . . . . . . . . . . . . . . . . . . . . . . . . . . . . . . . . . 430.7 345.8
Total assets . . . . . . . . . . . . . . . . . . . . . . . . . . . . . . . . . . . . . . . . . . . . . . . . . $4,644.0 $4,958.5
LIABILITIES AND STOCKHOLDERS’ EQUITYNotes payable . . . . . . . . . . . . . . . . . . . . . . . . . . . . . . . . . . . . . . . . . . . . . . . . . . . $ 183.8 $ 63.7Current portion of long-term debt . . . . . . . . . . . . . . . . . . . . . . . . . . . . . . . . . . . . . 136.9 —Accounts payable and accrued expenses . . . . . . . . . . . . . . . . . . . . . . . . . . . . . . . 923.0 993.0Income taxes payable . . . . . . . . . . . . . . . . . . . . . . . . . . . . . . . . . . . . . . . . . . . . . 6.3 27.2
Total current liabilities . . . . . . . . . . . . . . . . . . . . . . . . . . . . . . . . . . . . . . . . . . 1,250.0 1,083.9Long-term debt . . . . . . . . . . . . . . . . . . . . . . . . . . . . . . . . . . . . . . . . . . . . . . . . . . 459.6 572.6Other non-current liabilities:
Retirement-related liabilities . . . . . . . . . . . . . . . . . . . . . . . . . . . . . . . . . . . . . . . . 543.8 500.4Other . . . . . . . . . . . . . . . . . . . . . . . . . . . . . . . . . . . . . . . . . . . . . . . . . . . . . . . . 353.1 362.6
Total other non-current liabilities. . . . . . . . . . . . . . . . . . . . . . . . . . . . . . . . . . . 896.9 863.0Minority interest in consolidated subsidiaries . . . . . . . . . . . . . . . . . . . . . . . . . . . . . 31.5 117.9Capital stock:
Preferred stock, $0.01 par value; authorized shares: 5,000,000; none issued . . . — —Common stock, $0.01 par value; authorized shares: 150,000,000; issued
shares: 2008, 117,699,542 and 2007, 117,206,709; outstanding shares:2008, 115,532,372 and 2007, 116,128,572. . . . . . . . . . . . . . . . . . . . . . . . . . 1.2 1.2
Non-voting common stock, $0.01 par value; authorized shares: 25,000,000;none issued and outstanding . . . . . . . . . . . . . . . . . . . . . . . . . . . . . . . . . . . . — —
Capital in excess of par value . . . . . . . . . . . . . . . . . . . . . . . . . . . . . . . . . . . . . . . . 977.6 943.4Retained earnings . . . . . . . . . . . . . . . . . . . . . . . . . . . . . . . . . . . . . . . . . . . . . . . . 1,200.5 1,295.9Accumulated other comprehensive income (loss) . . . . . . . . . . . . . . . . . . . . . . . . . (85.9) 127.1Common stock held in treasury, at cost: 2,167,170 shares in 2008 and
1,078,137 shares in 2007 . . . . . . . . . . . . . . . . . . . . . . . . . . . . . . . . . . . . . . . . . (87.4) (46.5)
Total stockholders’ equity . . . . . . . . . . . . . . . . . . . . . . . . . . . . . . . . . . . . . . . 2,006.0 2,321.1
Total liabilities and stockholders’ equity. . . . . . . . . . . . . . . . . . . . . . . . . . . . $4,644.0 $4,958.5
See Accompanying Notes to Consolidated Financial Statements.
48

BORGWARNER INC. AND CONSOLIDATED SUBSIDIARIES
CONSOLIDATED STATEMENTS OF CASH FLOWS
millions of dollars
For the Year Ended December 31, 2008 2007 2006
OPERATINGNet earnings (loss) . . . . . . . . . . . . . . . . . . . . . . . . . . . . . . . . . . . . . . . . . . . . . . . $ (35.6) $ 288.5 $ 211.6Adjustments to reconcile net earnings (loss) to net cash flows from operations:Non-cash charges (credits) to operations:
Depreciation and tooling amortization . . . . . . . . . . . . . . . . . . . . . . . . . . . . . . . . 259.7 243.1 239.1Amortization of intangible assets and other . . . . . . . . . . . . . . . . . . . . . . . . . . . . 27.1 21.5 17.5Restructuring expense, net of cash paid . . . . . . . . . . . . . . . . . . . . . . . . . . . . . . 115.9 — 79.4Goodwill impairment charge . . . . . . . . . . . . . . . . . . . . . . . . . . . . . . . . . . . . . . 156.8 — —Gain on sales of businesses, net of tax . . . . . . . . . . . . . . . . . . . . . . . . . . . . . . . — — (3.6)Stock option compensation expense . . . . . . . . . . . . . . . . . . . . . . . . . . . . . . . . 21.2 16.3 12.7Deferred income tax benefit . . . . . . . . . . . . . . . . . . . . . . . . . . . . . . . . . . . . . . . (78.3) (29.9) (46.4)Equity in affiliates’ earnings, net of dividends received, minority interest and
other . . . . . . . . . . . . . . . . . . . . . . . . . . . . . . . . . . . . . . . . . . . . . . . . . . . . . 28.3 16.0 38.8
Net earnings adjusted for non-cash charges to operations . . . . . . . . . . . . . . . . 495.1 555.5 549.1Changes in assets and liabilities, net of effects of acquisitions and divestitures:
Receivables . . . . . . . . . . . . . . . . . . . . . . . . . . . . . . . . . . . . . . . . . . . . . . . . . . 163.9 (6.2) (57.4)Inventories . . . . . . . . . . . . . . . . . . . . . . . . . . . . . . . . . . . . . . . . . . . . . . . . . . . (26.3) (34.7) (32.7)Prepayments and other current assets . . . . . . . . . . . . . . . . . . . . . . . . . . . . . . . 16.0 9.0 (25.2)Accounts payable and accrued expenses . . . . . . . . . . . . . . . . . . . . . . . . . . . . . (195.6) 94.2 (8.1)Income taxes payable . . . . . . . . . . . . . . . . . . . . . . . . . . . . . . . . . . . . . . . . . . . (23.0) (15.1) 0.5Other non-current assets and liabilities . . . . . . . . . . . . . . . . . . . . . . . . . . . . . . . (29.3) 0.8 15.9
Net cash provided by operating activities . . . . . . . . . . . . . . . . . . . . . . . . . . . . 400.8 603.5 442.1INVESTINGCapital expenditures, including tooling outlays . . . . . . . . . . . . . . . . . . . . . . . . . . . . (369.7) (293.9) (268.3)Net proceeds from asset disposals . . . . . . . . . . . . . . . . . . . . . . . . . . . . . . . . . . . 5.7 17.3 3.6Payments for businesses acquired, net of cash acquired . . . . . . . . . . . . . . . . . . . . (141.2) (138.8) (63.7)Proceeds from sale of business . . . . . . . . . . . . . . . . . . . . . . . . . . . . . . . . . . . . . . 5.5 — —Purchases of marketable securities . . . . . . . . . . . . . . . . . . . . . . . . . . . . . . . . . . . — (13.0) (41.5)Proceeds from sales of marketable securities . . . . . . . . . . . . . . . . . . . . . . . . . . . . 14.6 60.4 28.8
Net cash used in investing activities . . . . . . . . . . . . . . . . . . . . . . . . . . . . . . . (485.1) (368.0) (341.1)FINANCINGNet increase (decrease) in notes payable . . . . . . . . . . . . . . . . . . . . . . . . . . . . . . . 114.8 (92.6) (27.7)Additions to long-term debt . . . . . . . . . . . . . . . . . . . . . . . . . . . . . . . . . . . . . . . . — 20.0 289.1Repayments of long-term debt . . . . . . . . . . . . . . . . . . . . . . . . . . . . . . . . . . . . . . (7.3) (29.1) (296.6)Payment for purchase of treasury stock . . . . . . . . . . . . . . . . . . . . . . . . . . . . . . . . (55.9) (47.0) —Proceeds from stock options exercised, including the tax benefit . . . . . . . . . . . . . . 17.1 46.3 27.1Dividends paid to BorgWarner stockholders . . . . . . . . . . . . . . . . . . . . . . . . . . . . . (51.1) (39.4) (36.7)Dividends paid to minority shareholders . . . . . . . . . . . . . . . . . . . . . . . . . . . . . . . . (12.5) (17.5) (15.1)
Net cash provided by (used in) financing activities . . . . . . . . . . . . . . . . . . . . . . 5.1 (159.3) (59.9)Effect of exchange rate changes on cash . . . . . . . . . . . . . . . . . . . . . . . . . . . . . . . (5.9) (11.0) (7.5)Net increase (decrease) in cash . . . . . . . . . . . . . . . . . . . . . . . . . . . . . . . . . . . . . . (85.1) 65.2 33.6Cash at beginning of year . . . . . . . . . . . . . . . . . . . . . . . . . . . . . . . . . . . . . . . . . . 188.5 123.3 89.7
Cash at end of year . . . . . . . . . . . . . . . . . . . . . . . . . . . . . . . . . . . . . . . . . . . . . . $ 103.4 $ 188.5 $ 123.3
SUPPLEMENTAL CASH FLOW INFORMATIONNet cash paid during the year for:
Interest . . . . . . . . . . . . . . . . . . . . . . . . . . . . . . . . . . . . . . . . . . . . . . . . . . . $ 44.4 $ 42.7 $ 45.0Income taxes . . . . . . . . . . . . . . . . . . . . . . . . . . . . . . . . . . . . . . . . . . . . . . . 122.0 91.6 83.8
Non-cash investing transactions:Domination and Profit Transfer Agreement . . . . . . . . . . . . . . . . . . . . . . . . . . . 44.0 — —
Non-cash financing transactions:Stock performance plans . . . . . . . . . . . . . . . . . . . . . . . . . . . . . . . . . . . . . . . 5.0 10.0 3.0Restricted common stock for employees . . . . . . . . . . . . . . . . . . . . . . . . . . . . 9.0 1.6 —Restricted common stock for non-employee directors . . . . . . . . . . . . . . . . . . . 0.7 0.3 0.5
49

BORGWARNER INC. AND CONSOLIDATED SUBSIDIARIES
CONSOLIDATED STATEMENTS OF STOCKHOLDERS’ EQUITY ANDCOMPREHENSIVE INCOME (LOSS)
IssuedCommon
Stock
CommonStock inTreasury
IssuedCommon
Stock
Capital inExcess ofpar Value
TreasuryStock
RetainedEarnings
AccumulatedOther
ComprehensiveIncome (Loss)
ComprehensiveIncome (Loss)
Number of Shares Stockholders’ Equitymillions of dollars
Balance, January 1, 2006 . . . . . . . . . . . . . . . . . 114,276,950 (7,968) $0.6 $827.6 $ (0.1) $ 889.2 $ (73.1)
Dividends declared . . . . . . . . . . . . . . . . . . . . — — — — — (36.7) —
Stock option expense . . . . . . . . . . . . . . . . . . — — — 12.7 — — —
Stock incentive plans . . . . . . . . . . . . . . . . . . 994,372 — — 27.1 — — —
Executive stock plan . . . . . . . . . . . . . . . . . . . 100,550 — — 3.0 — — —
Net issuance of restricted stock, lessamortization. . . . . . . . . . . . . . . . . . . . . . . 22,696 — — 0.7 — — —
Net earnings. . . . . . . . . . . . . . . . . . . . . . . . — — — — — 211.6 — $ 211.6
FAS 158 incremental effect . . . . . . . . . . . . . . . — — — — — — (98.5)
Defined benefit post employment plans . . . . . . . . — — — — — — 18.1 18.1
Net unrealized gain (loss) on available-for-salesecurities . . . . . . . . . . . . . . . . . . . . . . . . — — — — — — 1.8 1.8
Currency translation and hedge instruments, net . . — — — — — — 91.4 91.4
Balance, December 31, 2006 . . . . . . . . . . . . . . . 115,394,568 (7,968) $0.6 $871.1 $ (0.1) $1,064.1 $ (60.3) $ 322.9
Dividends declared . . . . . . . . . . . . . . . . . . . . — — — — — (39.4) —
Stock split . . . . . . . . . . . . . . . . . . . . . . . . . — — 0.6 — — (0.6) —
Stock option expense . . . . . . . . . . . . . . . . . . — — — 16.3 — — —
Stock incentive plans . . . . . . . . . . . . . . . . . . 1,725,339 19,083 — 45.7 0.6 (0.1) —
Executive stock plan . . . . . . . . . . . . . . . . . . . 78,170 — — 10.0 — — —
Net issuance of restricted stock, lessamortization. . . . . . . . . . . . . . . . . . . . . . . 8,632 — — 0.3 — — —
Purchases of treasury stock. . . . . . . . . . . . . . . — (1,089,252) — — (47.0) — —
FIN 48 adoption . . . . . . . . . . . . . . . . . . . . . — — — — — (16.6) —
Net earnings. . . . . . . . . . . . . . . . . . . . . . . . — — — — — 288.5 — $ 288.5
Defined benefit post employment plans . . . . . . . . — — — — — — 70.6 70.6
Net unrealized gain (loss) on available-for-salesecurities . . . . . . . . . . . . . . . . . . . . . . . . — — — — — — (0.1) (0.1)
Currency translation and hedge instruments, net . . — — — — — — 116.9 116.9
Balance, December 31, 2007 . . . . . . . . . . . . . . . 117,206,709 (1,078,137) $1.2 $943.4 $(46.5) $1,295.9 $ 127.1 $ 475.9
Dividends declared . . . . . . . . . . . . . . . . . . . . — — — — — (51.1) —
Stock option expense . . . . . . . . . . . . . . . . . . — — — 12.2 — — —
Stock incentive plans . . . . . . . . . . . . . . . . . . — 375,075 — 10.8 15.0 (8.7) —
Executive stock plan . . . . . . . . . . . . . . . . . . . 197,052 — — 1.5 — — —
Net issuance of restricted stock, lessamortization. . . . . . . . . . . . . . . . . . . . . . . 295,781 — — 9.7 — — —
Purchases of treasury stock. . . . . . . . . . . . . . . — (1,464,108) — — (55.9) — —
Net loss . . . . . . . . . . . . . . . . . . . . . . . . . . — — — — — (35.6) — $ (35.6)
Defined benefit post employment plans . . . . . . . . — — — — — — (74.7) (74.7)
Net unrealized gain (loss) on available-for-salesecurities . . . . . . . . . . . . . . . . . . . . . . . . — — — — — — (1.4) (1.4)
Currency translation and hedge instruments, net . . — — — — — — (136.9) (136.9)
Balance, December 31, 2008 . . . . . . . . . . . . . . . 117,699,542 (2,167,170) $1.2 $977.6 $(87.4) $1,200.5 $ (85.9) $(248.6)
See Accompanying Notes to Consolidated Financial Statements.
50
NOTES TO CONSOLIDATED FINANCIAL STATEMENTS
INTRODUCTION
BorgWarner Inc. and Consolidated Subsidiaries (the “Company”) is a leading global supplier of highlyengineered systems and components primarily for powertrain applications. These products are manufac-tured and sold worldwide, primarily to original equipment manufacturers of passenger cars, sport-utilityvehicles, crossover vehicles, trucks, commercial transportation products and industrial equipment and tocertain Tier One vehicle systems suppliers. The Company’s products fall into two reporting segments: Engineand Drivetrain.
NOTE 1 SUMMARY OF SIGNIFICANT ACCOUNTING POLICIES
The following paragraphs briefly describe the Company’s significant accounting policies.
Use of estimates The preparation of financial statements in conformity with accounting principlesgenerally accepted in the United States of America requires management to make estimates and assump-tions. These estimates and assumptions affect the reported amounts of assets and liabilities and disclosure ofcontingent assets and liabilities at the date of the financial statements and the reported amounts of revenuesand expenses during the reporting period. Actual results could differ from those estimates.
Concentrations of risk Cash is maintained with several financial institutions. Deposits held with banksmay exceed the amount of insurance provided on such deposits. Generally, these deposits may be redeemedupon demand and are maintained with financial institutions of reputable credit and therefore bear minimalrisk.
The Company performs ongoing credit evaluations of its suppliers and customers and, with the exception ofcertain financing transactions, does not require collateral from its customers. The Company’s customers areprimarily original equipment manufacturers of passenger cars, sport-utility vehicles, crossover vehicles, trucks,commercial transportation products and industrial equipment.
Some automotive parts suppliers continue to experience commodity cost pressures and the effects ofindustry overcapacity. These factors have increased pressure on the industry’s supply base, as suppliers copewith higher commodity costs, lower production volumes and other challenges. The Company receives certain ofits raw materials from sole suppliers or a limited number of suppliers. The inability of a supplier to fulfill supplyrequirements of the Company could materially affect future operating results.
Principles of consolidation The Consolidated Financial Statements include all majority-owned sub-sidiaries. All inter-company accounts and transactions have been eliminated in consolidation.
Revenue recognition The Company recognizes revenue when title and risk of loss pass to the customer, whichis usually upon shipment of product. Although the Company may enter into long-term supply agreements with itsmajor customers, each shipment of goods is treated as a separate sale and the price is not fixed over the life of theagreements.
Cash Cash is valued at fair market value. It is the Company’s policy to classify all highly liquid investmentswith original maturities of three months or less as cash.
Marketable securities Marketable securities are classified as available-for-sale. These investments are statedat fair value with any unrealized holding gains or losses, net of tax, included as a component of stockholders’ equityuntil realized.
See Note 5 to the Consolidated Financial Statements for more information on marketable securities.
Accounts receivable The Company securitizes and sells certain receivables through third party financialinstitutions without recourse. The amount sold can vary each month based on the amount of underlying receivables.The Company continues to administer the collection of these receivables on behalf of the third party. The maximumsize of the facility has been set at $50 million since fourth quarter 2003.
51

During the years ended December 31, 2008 and 2007, total cash proceeds from sales of accountsreceivable were $600 million. The Company paid servicing fees related to these receivables of $1.9 million,$2.9 million and $2.7 million in 2008, 2007 and 2006, respectively. These amounts are recorded in interestexpense and finance charges in the Consolidated Statements of Operations. At December 31, 2008 and2007, the Company had sold $50 million of receivables under a Receivables Transfer Agreement for facevalue without recourse.
Inventories Inventories are valued at the lower of cost or market. Cost of U.S. inventories is determinedby the last-in, first-out (“LIFO”) method, while the foreign operations use the first-in, first-out (“FIFO”) oraverage-cost methods. Inventory held by U.S. operations was $124.1 million and $135.9 million at Decem-ber 31, 2008 and 2007, respectively. Such inventories, if valued at current cost instead of LIFO, would havebeen greater by $16.6 million in 2008 and $13.5 million in 2007.
See Note 6 to the Consolidated Financial Statements for more information on inventories.
Pre-production costs related to long-term supply arrangements Engineering, research and devel-opment, and other design and development costs for products sold on long-term supply arrangements areexpensed as incurred unless the Company has a contractual guarantee for reimbursement from thecustomer. Costs for molds, dies and other tools used to make products sold on long-term supply arrange-ments for which the Company either has title to the assets or has the non-cancelable right to use the assetsduring the term of the supply arrangement are capitalized in property, plant and equipment. Capitalized itemsspecifically designed for a supply arrangement are amortized to cost of sales over the shorter of the term ofthe arrangement or over the estimated useful lives of the assets, typically 3 to 5 years. Carrying values ofassets capitalized according to the foregoing policy are reviewed for impairment when events and circum-stances warrant such a review. Costs for molds, dies and other tools used to make products sold on long-term supply arrangements for which the Company has a contractual guarantee for lump sum reimbursementfrom the customer are capitalized in prepayments and other current assets.
Property, plant and equipment and depreciation Property, plant and equipment are valued at cost lessaccumulated depreciation. Expenditures for maintenance, repairs and renewals of relatively minor items aregenerally charged to expense as incurred. Renewals of significant items are capitalized. Depreciation iscomputed generally on a straight-line basis over the estimated useful lives of the assets. Useful lives forbuildings range from 15 to 40 years and useful lives for machinery and equipment range from 3 to 12 years.For income tax purposes, accelerated methods of depreciation are generally used.
See Note 6 to the Consolidated Financial Statements for more information on property, plant andequipment and depreciation.
Impairment of long-lived assets The Company reviews the carrying value of its long-lived assets,whether held for use or disposal, including other intangible assets, when events and circumstances warrantsuch a review. This review is performed using estimates of future cash flows. If the carrying value of a long-lived asset is considered impaired, an impairment charge is recorded for the amount by which the carryingvalue of the long-lived asset exceeds its fair value. Management believes that the estimates of future cashflows and fair value assumptions are reasonable; however, changes in assumptions underlying theseestimates could affect the evaluations. Long-lived assets held for sale are recorded at the lower of theircarrying amount or fair value less cost to sell. Significant judgments and estimates used by managementwhen evaluating long-lived assets for impairment include: (i) an assessment as to whether an adverse event orcircumstance has triggered the need for an impairment review; and (ii) undiscounted future cash flowsgenerated by the asset. The Company recognized $72.9 million and $56.4 million in impairment of long-livedassets as part of restructuring expenses in 2008 and 2006, respectively.
See Note 19 to the Consolidated Financial Statements for more information regarding the Company’s2006 and 2008 impairment of long-lived assets.
52
NOTES TO CONSOLIDATED FINANCIAL STATEMENTS — (Continued)

Goodwill and other intangible assets Under Statement of Financial Accounting Standards No. 142,Goodwill and Other Intangible Assets, goodwill is no longer amortized; however, it must be tested forimpairment at least annually. In the fourth quarter of each year, or when events and circumstances warrantsuch a review, the Company reviews the goodwill of all of its reporting units for impairment. The fair value ofthe Company’s businesses used in the determination of goodwill impairment is computed using the expectedpresent value of associated future cash flows. This review requires the Company to make significantassumptions and estimates about the extent and timing of future cash flows, discount rates and growthrates. The cash flows are estimated over a significant future period of time, which makes those estimates andassumptions subject to an even higher degree of uncertainty. The Company also utilizes market valuationmodels and other financial ratios, which require the Company to make certain assumptions and estimatesregarding the applicability of those models to its assets and businesses. The Company believes that theassumptions and estimates used to determine the estimated fair values of each of its reporting units arereasonable. However, different assumptions could materially affect the estimated fair value. The Companyrecognized goodwill impairment of $156.8 million in the Engine segment in 2008 and $0.2 million in theDrivetrain segment in 2006. No goodwill impairment was recorded in 2007.
See Note 7 to the Consolidated Financial Statements for more information regarding goodwill.
Product warranty The Company provides warranties on some of its products. The warranty terms aretypically from one to three years. Provisions for estimated expenses related to product warranty are made atthe time products are sold. These estimates are established using historical information about the nature,frequency, and average cost of warranty claim settlements as well as product manufacturing and industrydevelopments and recoveries from third parties. Management actively studies trends of warranty claims andtakes action to improve product quality and minimize warranty claims. Management believes that thewarranty accrual is appropriate; however, actual claims incurred could differ from the original estimates,requiring adjustments to the accrual. The accrual is represented in both current and non-current liabilities onthe balance sheet.
See Note 8 to the Consolidated Financial Statements for more information on product warranties.
Other loss accruals and valuation allowances The Company has numerous other loss exposures, suchas customer claims, workers’ compensation claims, litigation, and recoverability of assets. Establishing lossaccruals or valuation allowances for these matters requires the use of estimates and judgment in regard to therisk exposure and ultimate realization. The Company estimates losses under the programs using consistentand appropriate methods; however, changes to its assumptions could materially affect its recorded accruedliabilities for loss or asset valuation allowances.
Derivative financial instruments The Company recognizes that certain normal business transactionsgenerate risk. Examples of risks include exposure to exchange rate risk related to transactions denominatedin currencies other than the functional currency, changes in cost of major raw materials and supplies, andchanges in interest rates. It is the objective and responsibility of the Company to assess the impact of thesetransaction risks, and offer protection from selected risks through various methods including financialderivatives. Virtually all derivative instruments held by the Company are designated as hedges, have highcorrelation with the underlying exposure and are highly effective in offsetting underlying price movements.Accordingly, gains and losses from changes in qualifying hedge fair values are matched with the underlyingtransactions. All hedge instruments are carried at their fair value based on quoted market prices for contractswith similar maturities. The Company does not engage in any derivative transactions for purposes other thanhedging specific risks.
See Note 11 to the Consolidated Financial Statements for more information on derivative financialinstruments.
Foreign currency The financial statements of foreign subsidiaries are translated to U.S. Dollars using theperiod-end exchange rate for assets and liabilities and an average exchange rate for each period for
53
NOTES TO CONSOLIDATED FINANCIAL STATEMENTS — (Continued)
revenues, expenses, and capital expenditures. The local currency is the functional currency for substantiallyall the Company’s foreign subsidiaries. Translation adjustments for foreign subsidiaries are recorded as acomponent of accumulated other comprehensive income (loss) in stockholders’ equity. The Companyrecognizes transaction gains and losses arising from fluctuations in currency exchange rates on transactionsdenominated in currencies other than the functional currency in earnings as incurred, except for thosetransactions which hedge purchase commitments and for those intercompany balances which are desig-nated as long-term investments. Net income included a foreign currency transaction loss of $5.8 million in2008. Net income included foreign currency transaction gains of $4.4 million and $1.6 million in 2007 and2006, respectively.
See Note 14 to the Consolidated Financial Statements for more information on other comprehensiveincome (loss).
New Accounting Pronouncements In June 2006, the FASB issued Interpretation No. 48, Accounting forUncertainty in Income Taxes, an interpretation of FASB Statement No. 109 (“FIN 48”). FIN 48 prescribes aconsistent recognition threshold and measurement attribute, as well as clear criteria for subsequentlyrecognizing, derecognizing and measuring such tax positions for financial statement purposes. FIN 48 alsorequires expanded disclosure with respect to the uncertainty in income taxes. The Company adopted theprovisions of FIN 48 on January 1, 2007. As a result of the implementation of FIN 48, the Company recognizeda $16.6 million reduction to its January 1, 2007 retained earnings balance.
In September 2006, the FASB issued Statement of Financial Accounting Standards No. 157, Fair ValueMeasurements (“FAS 157”). FAS 157 defines fair value, establishes a framework for measuring fair value inGAAP and expands disclosures about fair value measurements. On January 1, 2008, the Company partiallyadopted as required, FAS 157. See Note 10 to the Consolidated Financial Statements for more informationregarding the implementation of FAS 157.
In February 2007, the FASB issued Statement of Financial Accounting Standards No. 159, The Fair ValueOption for Financial Assets and Financial Liabilities (“FAS 159”). FAS 159 allows entities to irrevocably elect torecognize most financial assets and financial liabilities at fair value on an instrument-by-instrument basis. Thestated objective of FAS 159 is to improve financial reporting by giving entities the opportunity to elect tomeasure certain financial assets and liabilities at fair value in order to mitigate earnings volatility caused whenrelated assets and liabilities are measured differently. FAS 159 is effective for the Company beginning with itsquarter ending March 31, 2008. The Company chose to not make the election to adopt.
In December 2007, the FASB issued Statement of Financial Accounting Standards No. 141 (Revised2007), Business Combinations (“FAS 141(R)”). FAS 141(R) establishes principles and requirements forrecognizing identifiable assets acquired, liabilities assumed, noncontrolling interest in the acquiree, goodwillacquired in the combination or the gain from a bargain purchase, and disclosure requirements. Under thisrevised statement, all costs incurred to effect an acquisition will be recognized separately from the acquisition.Also, restructuring costs that are expected but the acquirer is not obligated to incur will be recognizedseparately from the acquisition. FAS 141(R) is effective for the Company beginning with its quarter endingMarch 31, 2009. The Company has incurred $3.2 million of on-going acquisition related costs, which will beexpensed upon adoption of FAS 141(R) in the first quarter of 2009.
In December 2007, the FASB issued Statement of Financial Accounting Standards No. 160, Non-controlling Interests in Consolidated Financial Statements (“FAS 160”). FAS 160 requires that ownershipinterests in subsidiaries held by parties other than the parent are clearly identified. In addition, it requires thatthe amount of consolidated net income attributable to the parent and to the noncontrolling interest be clearlyidentified and presented on the face of the income statement. FAS 160 is effective for the Company beginningwith its quarter ending March 31, 2009. The adoption of FAS 160 is not expected to have a material impact onthe Company’s consolidated financial position, results of operations or cash flows.
54
NOTES TO CONSOLIDATED FINANCIAL STATEMENTS — (Continued)
In February 2008, the FASB issued FASB Staff Position No. FAS 157-2 (“FSP FAS 157-2”). FSPFAS 157-2 delays the effective date of SFAS 157 for nonfinancial assets and nonfinancial liabilities that arerecognized or disclosed in the financial statements on a nonrecurring basis to fiscal years beginning afterNovember 15, 2008. Refer to Note 10, “Fair Value Measurements” of the Notes to the Consolidated FinancialStatements for further discussion of the Company’s partial adoption of FSP FAS 157-2.
In March 2008, the FASB issued Statement of Financial Accounting Standards No. 161, Disclosuresabout Derivative Instruments and Hedging Activities (“FAS 161”). FAS 161 requires entities to provideenhanced disclosures about how and why an entity uses derivative instruments, how derivative instrumentsand related hedged items are accounted for under Statement 133 and its related interpretations, and howderivative instruments and related hedged items affect an entity’s financial position, financial performance,and cash flows. FAS 161 is effective for the Company beginning with its quarter ending March 31, 2009. Theadoption of FAS 161 is not expected to have a material impact on the Company’s consolidated financialposition, results of operations or cash flows.
In December 2008, the FASB issued Staff Position 132(R)-1, Employers’ Disclosures about Postretire-ment Benefit Plan Assets (“FAS 132(R)-1”). FAS 132(R)-1 requires entities to provide enhanced disclosuresabout how investment allocation decisions are made, the major categories of plan assets, the inputs andvaluation techniques used to measure fair value of plan assets, the effect of fair value measurements usingsignificant unobservable inputs on changes in plan assets for the period, and significant concentrations of riskwithin plan assets. FAS 132(R)-1 is effective for the Company beginning with its year ending December 31,2009. The Company is currently assessing the potential impacts, if any, on its consolidated financialstatements.
In December 2008, the FASB issued Staff Position 140-4 and Financial Interpretation 46(R)-8, Disclo-sures by Public Entities (Enterprises) about Transfers of Financial Assets and Interests in Variable InterestEntities (“FSP 140-4 and FIN 46(R)-8”). FSP 140-4 and FIN 46(R)-8 requires entities to provide enhanceddisclosures about how an entity accounts for transfers of financial assets, the nature of involvement, if any,after the financial asset sale and the nature of any restrictions on assets reported by an entity in its statementof financial position that relates to a transferred financial asset, including the carrying amounts of such assets.The Company has adjusted its disclosures to be complaint with FSP 140-4 and FIN 46(R)-8 at December 31,2008.
NOTE 2 RESEARCH AND DEVELOPMENT COSTS
The following table presents the Company’s gross and net expenditures on research and development(“R&D”) activities:
millions of dollars
Year Ended December 31, 2008 2007 2006
Gross R&D expenditures. . . . . . . . . . . . . . . . . . . . . . . . . . . . . . . $273.4 $246.7 $219.5Customer reimbursements . . . . . . . . . . . . . . . . . . . . . . . . . . . . . (67.7) (35.9) (31.8)
Net R&D expenditures . . . . . . . . . . . . . . . . . . . . . . . . . . . . . . . . $205.7 $210.8 $187.7
The Company’s net R&D expenditures are included in the selling, general, and administrative expensesof the Consolidated Statements of Operations. Customer reimbursements are netted against gross R&Dexpenditures upon billing of services performed. The Company has contracts with several customers at theCompany’s various R&D locations. No such contract exceeded $6 million in any of the years presented.
55
NOTES TO CONSOLIDATED FINANCIAL STATEMENTS — (Continued)
NOTE 3 OTHER INCOME
Items included in other income consist of:
millions of dollars
Year Ended December 31, 2008 2007 2006
Interest income . . . . . . . . . . . . . . . . . . . . . . . . . . . . . . . . . . . . . . . . . $(7.1) $(6.7) $(3.2)Net gain on sale of businesses. . . . . . . . . . . . . . . . . . . . . . . . . . . . . . — — (4.8)Loss on the sale of a product line . . . . . . . . . . . . . . . . . . . . . . . . . . . 2.2 — —Net loss on asset disposals . . . . . . . . . . . . . . . . . . . . . . . . . . . . . . . . 2.0 0.6 1.0Other . . . . . . . . . . . . . . . . . . . . . . . . . . . . . . . . . . . . . . . . . . . . . . . . (0.2) (0.7) (0.5)
Total other income . . . . . . . . . . . . . . . . . . . . . . . . . . . . . . . . . . . . . $(3.1) $(6.8) $(7.5)
NOTE 4 INCOME TAXES
Earnings before income taxes and the provision for income taxes are presented in the following table.
millions of dollars
Year Ended December 31, U.S. Non-U.S. Total U.S. Non-U.S. Total U.S. Non-U.S. Total2008 2007 2006
Earnings beforetaxes . . . . . . . . . . $(123.8) $137.8 $ 14.0 $ 48.4 $382.0 $430.4 $ (27.2) $297.5 $270.3
Provision for incometaxes:Current:
Federal/foreign. . 7.7 99.5 107.2 36.6 106.2 142.8 (11.1) 87.7 76.6State. . . . . . . . . 1.0 — 1.0 1.0 — 1.0 2.2 — 2.2
Total current . . . . . 8.7 99.5 108.2 37.6 106.2 143.8 (8.9) 87.7 78.8Deferred . . . . . . . . (44.7) (30.2) (74.9) (10.0) (19.9) (29.9) (27.4) (19.0) (46.4)
Total provision forincome taxes . . . . $ (36.0) $ 69.3 $ 33.3 $ 27.6 $ 86.3 $113.9 $ (36.3) $ 68.7 $ 32.4
Effective tax rate . . . . (29.1)% 50.3% 237.9% 57.0% 22.6% 26.5% (133.5)% 23.1% 12.0%
The provision for income taxes resulted in an effective tax rate for 2008 of 237.9% compared with rates of26.5% in 2007 and 12.0% in 2006. The effective tax rate of 237.9% for 2008 differs from the U.S. statutoryrate primarily due to the non-deductibility of the $156.8 million impairment charge in 2008 related to BERUgoodwill; a reduction in U.S. income; foreign rates, which differ from those in the U.S.; the realization of certainbusiness tax credits including R&D and foreign tax credits; and favorable permanent differences betweenbook and tax treatment for items, including equity in affiliates’ earnings.
The Company adopted the provisions of FASB Interpretation No. 48, Accounting for Uncertainty inIncome Taxes (“FIN 48”), on January 1, 2007. As a result of the implementation of FIN 48, the Companyrecognized a $16.6 million reduction to the January 1, 2007 balance of retained earnings. At December 31,2007, the Company reported $71.7 million of unrecognized tax benefits; approximately $62.5 millionrepresent the amount that, if recognized, would affect the Company’s global effective income tax rate infuture periods.
Following is a reconciliation of the Company’s total gross unrecognized tax benefits for the year-to-dateperiods ended December 31, 2008 and 2007, respectively. Of the total $61.1 million of unrecognized taxbenefits as of December 31, 2008, approximately $51.1 million of this total represents the amount that, ifrecognized, would affect the Company’s effective income tax rate in future periods. This amount differs from
56
NOTES TO CONSOLIDATED FINANCIAL STATEMENTS — (Continued)
the gross unrecognized tax benefits presented in the table due to the decrease in the U.S. federal incometaxes which would occur upon recognition of the state tax benefits included therein.
millions of dollars 2008 2007
Balance, January 1 . . . . . . . . . . . . . . . . . . . . . . . . . . . . . . . . . . . . . . . . . . . . $71.7 $50.5Additions based on tax positions related to current year . . . . . . . . . . . . . . . . . 0.5 1.2Additions for tax positions of prior years . . . . . . . . . . . . . . . . . . . . . . . . . . . . . 0.2 20.0Reductions for tax positions of prior years . . . . . . . . . . . . . . . . . . . . . . . . . . . (1.7) —Settlements . . . . . . . . . . . . . . . . . . . . . . . . . . . . . . . . . . . . . . . . . . . . . . . . . . (6.7) —Translation adjustment . . . . . . . . . . . . . . . . . . . . . . . . . . . . . . . . . . . . . . . . . . (2.9) —
Balance, December 31 . . . . . . . . . . . . . . . . . . . . . . . . . . . . . . . . . . . . . . . . . $61.1 $71.7
In the first quarter of 2008, the Company made a $6.6 million cash payment to the IRS to resolve agreedupon issues of the ongoing IRS examination of the Company’s 2002-2004 tax years. There was a reduction inthe first quarter of 2008 of $6.7 million related to the Company’s unrecognized tax benefits balance due to thesettlement of the agreed upon issues primarily related to the Extraterritorial Income Exclusion for the2002-2004 tax years. The Company is currently in the appeals process on disputed issues related to the2002-2004 IRS audit, which is not expected to be resolved by December 31, 2009. Other possible changesin the unrecognized tax benefits balance related to other examinations cannot be reasonably estimated withinthe next 12 months.
The Company recognizes interest and penalties related to unrecognized tax benefits in income taxexpense. The Company had $9.7 million accrued at January 1, 2008 for the payment of any such interest andpenalties. The Company had approximately $11.4 million for the payment of interest and penalties accrued atDecember 31, 2008.
The Company or one of its subsidiaries files income tax returns in the U.S. federal jurisdiction, andvarious states and foreign jurisdictions. The Company is no longer subject to income tax examinations by taxauthorities in its major tax jurisdictions as follows:
Tax JurisdictionYears No LongerSubject to Audit
U.S. Federal . . . . . . . . . . . . . . . . . . . . . . . . . . . . . . . . . . . . . . . . . . . . . . . . . 2001 and priorBrazil . . . . . . . . . . . . . . . . . . . . . . . . . . . . . . . . . . . . . . . . . . . . . . . . . . . . . . . 2002 and priorFrance . . . . . . . . . . . . . . . . . . . . . . . . . . . . . . . . . . . . . . . . . . . . . . . . . . . . . . 2006 and priorGermany . . . . . . . . . . . . . . . . . . . . . . . . . . . . . . . . . . . . . . . . . . . . . . . . . . . . 2003 and priorHungary . . . . . . . . . . . . . . . . . . . . . . . . . . . . . . . . . . . . . . . . . . . . . . . . . . . . 2004 and priorItaly . . . . . . . . . . . . . . . . . . . . . . . . . . . . . . . . . . . . . . . . . . . . . . . . . . . . . . . . 2002 and priorJapan . . . . . . . . . . . . . . . . . . . . . . . . . . . . . . . . . . . . . . . . . . . . . . . . . . . . . . 2006 and priorSouth Korea . . . . . . . . . . . . . . . . . . . . . . . . . . . . . . . . . . . . . . . . . . . . . . . . . 2004 and priorUnited Kingdom . . . . . . . . . . . . . . . . . . . . . . . . . . . . . . . . . . . . . . . . . . . . . . . 2006 and prior
In certain tax jurisdictions the Company may have more than one taxpayer. The table above reflects thestatus of the major taxpayers in each major tax jurisdiction.
57
NOTES TO CONSOLIDATED FINANCIAL STATEMENTS — (Continued)

The analysis of the variance of income taxes as reported from income taxes computed at theU.S. statutory rate for consolidated operations is as follows:
millions of dollars 2008 2007 2006
Income taxes at U.S. statutory rate of 35% . . . . . . . . . . . . . . . . . . $ 4.9 $150.6 $ 94.6Increases (decreases) resulting from:
Income from non-U.S. sources including withholding taxes . . . . . (26.5) (12.3) (8.8)State taxes, net of federal benefit. . . . . . . . . . . . . . . . . . . . . . . . 0.9 (0.6) (1.5)Business tax credits . . . . . . . . . . . . . . . . . . . . . . . . . . . . . . . . . (9.8) (8.6) (1.0)Affiliates’ earnings . . . . . . . . . . . . . . . . . . . . . . . . . . . . . . . . . . . (13.2) (13.1) (11.3)Accrual adjustment and settlement of prior year tax matters . . . . 6.0 24.6 (22.9)Changes in tax laws . . . . . . . . . . . . . . . . . . . . . . . . . . . . . . . . . — (24.2) (10.4)Medicare prescription drug benefit . . . . . . . . . . . . . . . . . . . . . . . 1.1 (2.1) (3.8)Capital loss limitation. . . . . . . . . . . . . . . . . . . . . . . . . . . . . . . . . — — 5.7Goodwill impairment . . . . . . . . . . . . . . . . . . . . . . . . . . . . . . . . . 54.9 — —Restructuring . . . . . . . . . . . . . . . . . . . . . . . . . . . . . . . . . . . . . . 0.6 — (5.0)Valuation allowance . . . . . . . . . . . . . . . . . . . . . . . . . . . . . . . . . . 13.1 — —Non-temporary differences and other . . . . . . . . . . . . . . . . . . . . . 1.3 (0.4) (3.2)
Provision for income taxes as reported . . . . . . . . . . . . . . . . . . . . . $ 33.3 $113.9 $ 32.4
In July 2007, the government of the United Kingdom enacted a statutory income tax rate reduction from30% to 28%, effective April 1, 2008. In August 2007, the government of Germany enacted a federal statutoryincome tax rate reduction from 38% to 28%, effective January 1, 2008. In addition, Korea also reduced itsfederal statutory income tax rate from 27.5% to 24.2% effective January 1, 2009.
58
NOTES TO CONSOLIDATED FINANCIAL STATEMENTS — (Continued)

Following are the gross components of deferred tax assets and liabilities as of December 31, 2008 and2007:
millions of dollars 2008 2007
Current deferred tax assets:Employee related . . . . . . . . . . . . . . . . . . . . . . . . . . . . . . . . . . . . . . . . . $ 28.5 $ 15.5Inventory . . . . . . . . . . . . . . . . . . . . . . . . . . . . . . . . . . . . . . . . . . . . . . . 5.1 5.6Warranties . . . . . . . . . . . . . . . . . . . . . . . . . . . . . . . . . . . . . . . . . . . . . . 4.4 2.8Litigation & environmental . . . . . . . . . . . . . . . . . . . . . . . . . . . . . . . . . . . 4.0 1.2Net operating loss carryforwards . . . . . . . . . . . . . . . . . . . . . . . . . . . . . . 1.8 0.6Derivatives . . . . . . . . . . . . . . . . . . . . . . . . . . . . . . . . . . . . . . . . . . . . . . 10.5 4.5Accrued interest . . . . . . . . . . . . . . . . . . . . . . . . . . . . . . . . . . . . . . . . . . — 0.9Customer claims . . . . . . . . . . . . . . . . . . . . . . . . . . . . . . . . . . . . . . . . . . 2.3 —Other . . . . . . . . . . . . . . . . . . . . . . . . . . . . . . . . . . . . . . . . . . . . . . . . . . 10.9 11.0
Total current deferred tax assets . . . . . . . . . . . . . . . . . . . . . . . . . . . . . . . . $ 67.5 $ 42.1Current deferred tax liabilities:
Derivatives . . . . . . . . . . . . . . . . . . . . . . . . . . . . . . . . . . . . . . . . . . . . . . $ (2.0) $ —Employee related . . . . . . . . . . . . . . . . . . . . . . . . . . . . . . . . . . . . . . . . . — (1.4)Other . . . . . . . . . . . . . . . . . . . . . . . . . . . . . . . . . . . . . . . . . . . . . . . . . . (0.7) (1.9)
Total current deferred tax liabilities . . . . . . . . . . . . . . . . . . . . . . . . . . . . . . . $ (2.7) $ (3.3)Non-current deferred tax assets:
Pension and other post employment benefits . . . . . . . . . . . . . . . . . . . . . $ 89.5 $ 102.8Other comprehensive income . . . . . . . . . . . . . . . . . . . . . . . . . . . . . . . . 114.5 68.0Employee related . . . . . . . . . . . . . . . . . . . . . . . . . . . . . . . . . . . . . . . . . 13.9 16.2Litigation and environmental . . . . . . . . . . . . . . . . . . . . . . . . . . . . . . . . . 3.2 3.5Warranties . . . . . . . . . . . . . . . . . . . . . . . . . . . . . . . . . . . . . . . . . . . . . . 6.4 6.9Foreign tax credits . . . . . . . . . . . . . . . . . . . . . . . . . . . . . . . . . . . . . . . . 78.3 25.0Research and development credits . . . . . . . . . . . . . . . . . . . . . . . . . . . . 6.6 5.7Capital loss carryforwards . . . . . . . . . . . . . . . . . . . . . . . . . . . . . . . . . . . 20.4 19.4Net operating loss carryforwards . . . . . . . . . . . . . . . . . . . . . . . . . . . . . . 12.9 9.0Other . . . . . . . . . . . . . . . . . . . . . . . . . . . . . . . . . . . . . . . . . . . . . . . . . . 8.3 7.0
Total non-current deferred tax assets . . . . . . . . . . . . . . . . . . . . . . . . . . . . $ 354.0 $ 263.5Non-current deferred tax liabilities:
Fixed assets . . . . . . . . . . . . . . . . . . . . . . . . . . . . . . . . . . . . . . . . . . . . . $ (98.3) $(127.5)Goodwill & intangibles . . . . . . . . . . . . . . . . . . . . . . . . . . . . . . . . . . . . . . (104.5) (80.8)Other comprehensive income . . . . . . . . . . . . . . . . . . . . . . . . . . . . . . . . (3.1) (1.5)Lease obligation — production equipment . . . . . . . . . . . . . . . . . . . . . . . (4.0) (5.0)Other . . . . . . . . . . . . . . . . . . . . . . . . . . . . . . . . . . . . . . . . . . . . . . . . . . (1.3) (1.7)
Total non-current deferred tax liabilities . . . . . . . . . . . . . . . . . . . . . . . . . . . $(211.2) $(216.5)
Total . . . . . . . . . . . . . . . . . . . . . . . . . . . . . . . . . . . . . . . . . . . . . . . . . $ 207.6 $ 85.8Valuation allowances . . . . . . . . . . . . . . . . . . . . . . . . . . . . . . . . . . . . . (31.0) (24.0)
Net deferred tax asset . . . . . . . . . . . . . . . . . . . . . . . . . . . . . . . . . . . . . . . $ 176.6 $ 61.8
59
NOTES TO CONSOLIDATED FINANCIAL STATEMENTS — (Continued)

The deferred tax assets and liabilities recognized in the Company’s Consolidated Balance Sheets are asfollows:
millions of dollars 2008 2007
Deferred income taxes — current assets . . . . . . . . . . . . . . . . . . . . . . . . . . $ 67.5 $ 42.8Deferred income taxes — current liabilities . . . . . . . . . . . . . . . . . . . . . . . . . (2.7) (3.3)Other non-current assets . . . . . . . . . . . . . . . . . . . . . . . . . . . . . . . . . . . . . . 201.4 124.4Other non-current liabilities . . . . . . . . . . . . . . . . . . . . . . . . . . . . . . . . . . . . (89.6) (102.1)
Net deferred tax asset (current and non-current) . . . . . . . . . . . . . . . . . . . $176.6 $ 61.8
The deferred income taxes — current assets are primarily comprised of amounts from the U.S., France,India, Japan, Mexico and the U.K. The deferred income taxes — current liabilities are primarily comprised ofamounts from Germany. The other non-current assets are primarily comprised of amounts from the U.S. andKorea. The other non-current liabilities are primarily comprised of amounts from Germany, Hungary, Italy,Monaco and the U.K.
The Company has a U.S. capital loss carryforward of $20.4 million, which will expire in 2010, 2011, 2012and 2013. A valuation allowance of $16.9 million has been recorded for the tax effect of some of this losscarryforward.
The foreign tax credits of $78.3 million will expire beginning in 2013 through 2018. A valuation allowanceof $13.5 million has been recorded for the tax effect of some of this carryforward.
At December 31, 2008, certain non-U.S. subsidiaries have net operating loss carryforwards totaling$63.5 million that are available to offset future taxable income. Carryforwards of $34.6 million expire at variousdates from 2009 through 2016 and the balance has no expiration date. A valuation allowance of $1.5 millionhas been recorded for the tax effect on $5.5 million of the loss carryforwards. Any benefit resulting from theutilization of $6.0 million of the operating loss carryforwards will be applied to reduce goodwill related to theBERU acquisition. Certain U.S. subsidiaries have state net operating loss carryforwards totaling $240.7 mil-lion and 235.2 million in 2008 and 2007, respectively, for which a non-current deferred tax asset has beenestablished in 2008 on $7.7 million of the loss carryforward and the remainder is completely offset by avaluation allowance due to risk of realization. Certain non-U.S. subsidiaries located in China and Korea havetax exemptions or tax holidays. The cumulative impact of these tax exemptions or tax holidays to the effectivetax rate in 2008 was negligible.
No deferred income taxes have been provided on the excess of the amount for financial reporting overthe tax basis of investments in foreign subsidiaries or foreign equity affiliates totaling $1,465.6 million in 2008,as these amounts are essentially permanent in nature. The excess amount will become taxable uponrepatriation of assets, sale, or liquidation of the investment. It is not practicable to determine the unrecognizeddeferred tax liability on the excess amount because the actual tax liability on the excess amount, if any, isdependent on circumstances existing when remittance occurs.
NOTE 5 MARKETABLE SECURITIES
As of December 31, 2008 the Company had no investments in marketable securities. At December 31,2007, the Company had $14.6 million in marketable securities, primarily bank notes. The securities arecarried at fair value with the unrealized gain or loss, net of tax, reported in other comprehensive income (loss).As of December 31, 2007, $7.3 million of the contractual maturities are within one to five years and$7.3 million are due beyond five years. Gross proceeds from sales of marketable securities were $14.6 millionand $60.4 million in 2008 and 2007, respectively. No gain or loss was realized in 2008. A net realized loss of$0.1 million, based on specific identification of securities sold, has been reported in other income for the yearended December 31, 2007.
60
NOTES TO CONSOLIDATED FINANCIAL STATEMENTS — (Continued)

NOTE 6 BALANCE SHEET INFORMATION
Detailed balance sheet data are as follows:millions of dollars
December 31, 2008 2007
Receivables:Customers . . . . . . . . . . . . . . . . . . . . . . . . . . . . . . . . . . . . . . . . . . . $ 522.7 $ 721.9Other . . . . . . . . . . . . . . . . . . . . . . . . . . . . . . . . . . . . . . . . . . . . . . . 90.1 85.7
Gross receivables . . . . . . . . . . . . . . . . . . . . . . . . . . . . . . . . . . . . 612.8 807.6Bad debt allowance (a) . . . . . . . . . . . . . . . . . . . . . . . . . . . . . . . . . . (5.7) (5.2)
Net receivables . . . . . . . . . . . . . . . . . . . . . . . . . . . . . . . . . . . . . . $ 607.1 $ 802.4
Inventories:Raw material and supplies . . . . . . . . . . . . . . . . . . . . . . . . . . . . . . . . $ 260.7 $ 246.7Work in progress. . . . . . . . . . . . . . . . . . . . . . . . . . . . . . . . . . . . . . . 95.7 99.8Finished goods . . . . . . . . . . . . . . . . . . . . . . . . . . . . . . . . . . . . . . . . 111.4 114.6
FIFO inventories . . . . . . . . . . . . . . . . . . . . . . . . . . . . . . . . . . . . . . . 467.8 461.1LIFO reserve . . . . . . . . . . . . . . . . . . . . . . . . . . . . . . . . . . . . . . . . . . (16.6) (13.5)
Net inventories. . . . . . . . . . . . . . . . . . . . . . . . . . . . . . . . . . . . . . . $ 451.2 $ 447.6
Other current assets:Product liability insurance receivable . . . . . . . . . . . . . . . . . . . . . . . . $ 22.1 $ 20.1Prepaid tax . . . . . . . . . . . . . . . . . . . . . . . . . . . . . . . . . . . . . . . . . . . 1.6 2.2Prepaid insurance . . . . . . . . . . . . . . . . . . . . . . . . . . . . . . . . . . . . . . 1.6 1.4Other . . . . . . . . . . . . . . . . . . . . . . . . . . . . . . . . . . . . . . . . . . . . . . . 53.7 60.7
Total other current assets . . . . . . . . . . . . . . . . . . . . . . . . . . . . . . . $ 79.0 $ 84.4
Property, plant and equipment:Land. . . . . . . . . . . . . . . . . . . . . . . . . . . . . . . . . . . . . . . . . . . . . . . . $ 56.1 $ 46.3Buildings. . . . . . . . . . . . . . . . . . . . . . . . . . . . . . . . . . . . . . . . . . . . . 563.7 558.6Machinery and equipment . . . . . . . . . . . . . . . . . . . . . . . . . . . . . . . . 1,756.1 1,806.1Capital leases . . . . . . . . . . . . . . . . . . . . . . . . . . . . . . . . . . . . . . . . . 1.1 1.1Construction in progress . . . . . . . . . . . . . . . . . . . . . . . . . . . . . . . . . 160.0 143.4
Total property, plant and equipment . . . . . . . . . . . . . . . . . . . . . . . 2,537.0 2,555.5Accumulated depreciation . . . . . . . . . . . . . . . . . . . . . . . . . . . . . . (1,047.4) (1,037.9)
1,489.6 1,517.6Tooling, net of amortization . . . . . . . . . . . . . . . . . . . . . . . . . . . . . . . 96.6 91.5
Property, plant & equipment, net . . . . . . . . . . . . . . . . . . . . . . . . . $ 1,586.2 $ 1,609.1
Investments and advances:Investment in equity affiliates . . . . . . . . . . . . . . . . . . . . . . . . . . . . . . $ 214.3 $ 211.3Other investments and advances . . . . . . . . . . . . . . . . . . . . . . . . . . . 52.2 43.8
Total investments and advances . . . . . . . . . . . . . . . . . . . . . . . . . . $ 266.5 $ 255.1
61
NOTES TO CONSOLIDATED FINANCIAL STATEMENTS — (Continued)
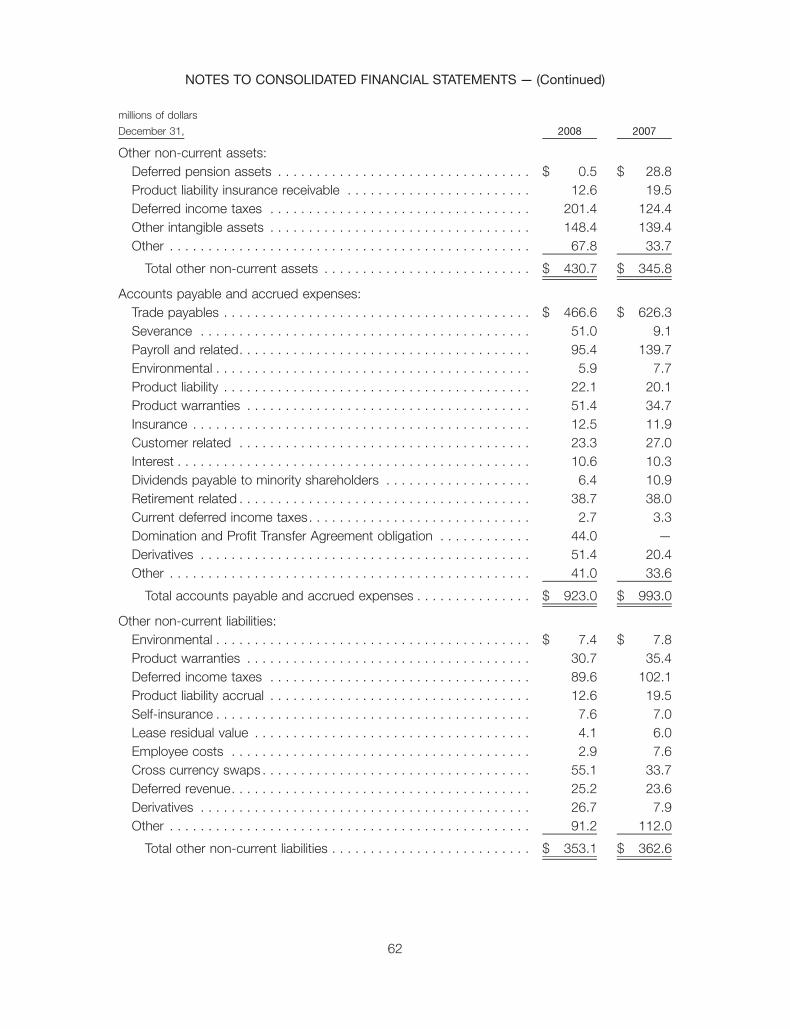
millions of dollars
December 31, 2008 2007
Other non-current assets:Deferred pension assets . . . . . . . . . . . . . . . . . . . . . . . . . . . . . . . . . $ 0.5 $ 28.8Product liability insurance receivable . . . . . . . . . . . . . . . . . . . . . . . . 12.6 19.5Deferred income taxes . . . . . . . . . . . . . . . . . . . . . . . . . . . . . . . . . . 201.4 124.4Other intangible assets . . . . . . . . . . . . . . . . . . . . . . . . . . . . . . . . . . 148.4 139.4Other . . . . . . . . . . . . . . . . . . . . . . . . . . . . . . . . . . . . . . . . . . . . . . . 67.8 33.7
Total other non-current assets . . . . . . . . . . . . . . . . . . . . . . . . . . . $ 430.7 $ 345.8
Accounts payable and accrued expenses:Trade payables . . . . . . . . . . . . . . . . . . . . . . . . . . . . . . . . . . . . . . . . $ 466.6 $ 626.3Severance . . . . . . . . . . . . . . . . . . . . . . . . . . . . . . . . . . . . . . . . . . . 51.0 9.1Payroll and related. . . . . . . . . . . . . . . . . . . . . . . . . . . . . . . . . . . . . . 95.4 139.7Environmental . . . . . . . . . . . . . . . . . . . . . . . . . . . . . . . . . . . . . . . . . 5.9 7.7Product liability . . . . . . . . . . . . . . . . . . . . . . . . . . . . . . . . . . . . . . . . 22.1 20.1Product warranties . . . . . . . . . . . . . . . . . . . . . . . . . . . . . . . . . . . . . 51.4 34.7Insurance . . . . . . . . . . . . . . . . . . . . . . . . . . . . . . . . . . . . . . . . . . . . 12.5 11.9Customer related . . . . . . . . . . . . . . . . . . . . . . . . . . . . . . . . . . . . . . 23.3 27.0Interest . . . . . . . . . . . . . . . . . . . . . . . . . . . . . . . . . . . . . . . . . . . . . . 10.6 10.3Dividends payable to minority shareholders . . . . . . . . . . . . . . . . . . . 6.4 10.9Retirement related . . . . . . . . . . . . . . . . . . . . . . . . . . . . . . . . . . . . . . 38.7 38.0Current deferred income taxes. . . . . . . . . . . . . . . . . . . . . . . . . . . . . 2.7 3.3Domination and Profit Transfer Agreement obligation . . . . . . . . . . . . 44.0 —Derivatives . . . . . . . . . . . . . . . . . . . . . . . . . . . . . . . . . . . . . . . . . . . 51.4 20.4Other . . . . . . . . . . . . . . . . . . . . . . . . . . . . . . . . . . . . . . . . . . . . . . . 41.0 33.6
Total accounts payable and accrued expenses . . . . . . . . . . . . . . . $ 923.0 $ 993.0
Other non-current liabilities:Environmental . . . . . . . . . . . . . . . . . . . . . . . . . . . . . . . . . . . . . . . . . $ 7.4 $ 7.8Product warranties . . . . . . . . . . . . . . . . . . . . . . . . . . . . . . . . . . . . . 30.7 35.4Deferred income taxes . . . . . . . . . . . . . . . . . . . . . . . . . . . . . . . . . . 89.6 102.1Product liability accrual . . . . . . . . . . . . . . . . . . . . . . . . . . . . . . . . . . 12.6 19.5Self-insurance . . . . . . . . . . . . . . . . . . . . . . . . . . . . . . . . . . . . . . . . . 7.6 7.0Lease residual value . . . . . . . . . . . . . . . . . . . . . . . . . . . . . . . . . . . . 4.1 6.0Employee costs . . . . . . . . . . . . . . . . . . . . . . . . . . . . . . . . . . . . . . . 2.9 7.6Cross currency swaps . . . . . . . . . . . . . . . . . . . . . . . . . . . . . . . . . . . 55.1 33.7Deferred revenue. . . . . . . . . . . . . . . . . . . . . . . . . . . . . . . . . . . . . . . 25.2 23.6Derivatives . . . . . . . . . . . . . . . . . . . . . . . . . . . . . . . . . . . . . . . . . . . 26.7 7.9Other . . . . . . . . . . . . . . . . . . . . . . . . . . . . . . . . . . . . . . . . . . . . . . . 91.2 112.0
Total other non-current liabilities . . . . . . . . . . . . . . . . . . . . . . . . . . $ 353.1 $ 362.6
62
NOTES TO CONSOLIDATED FINANCIAL STATEMENTS — (Continued)
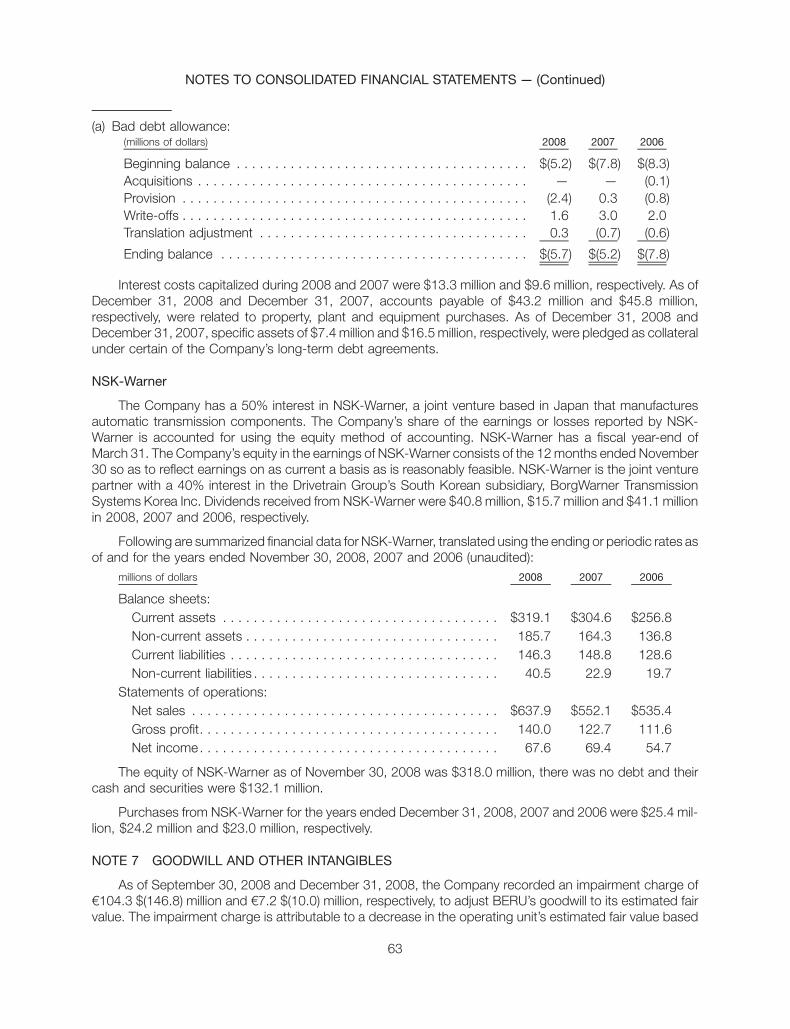
(a) Bad debt allowance:(millions of dollars) 2008 2007 2006
Beginning balance . . . . . . . . . . . . . . . . . . . . . . . . . . . . . . . . . . . . . . $(5.2) $(7.8) $(8.3)Acquisitions . . . . . . . . . . . . . . . . . . . . . . . . . . . . . . . . . . . . . . . . . . . — — (0.1)Provision . . . . . . . . . . . . . . . . . . . . . . . . . . . . . . . . . . . . . . . . . . . . . (2.4) 0.3 (0.8)Write-offs . . . . . . . . . . . . . . . . . . . . . . . . . . . . . . . . . . . . . . . . . . . . . 1.6 3.0 2.0Translation adjustment . . . . . . . . . . . . . . . . . . . . . . . . . . . . . . . . . . . 0.3 (0.7) (0.6)
Ending balance . . . . . . . . . . . . . . . . . . . . . . . . . . . . . . . . . . . . . . . . $(5.7) $(5.2) $(7.8)
Interest costs capitalized during 2008 and 2007 were $13.3 million and $9.6 million, respectively. As ofDecember 31, 2008 and December 31, 2007, accounts payable of $43.2 million and $45.8 million,respectively, were related to property, plant and equipment purchases. As of December 31, 2008 andDecember 31, 2007, specific assets of $7.4 million and $16.5 million, respectively, were pledged as collateralunder certain of the Company’s long-term debt agreements.
NSK-Warner
The Company has a 50% interest in NSK-Warner, a joint venture based in Japan that manufacturesautomatic transmission components. The Company’s share of the earnings or losses reported by NSK-Warner is accounted for using the equity method of accounting. NSK-Warner has a fiscal year-end ofMarch 31. The Company’s equity in the earnings of NSK-Warner consists of the 12 months ended November30 so as to reflect earnings on as current a basis as is reasonably feasible. NSK-Warner is the joint venturepartner with a 40% interest in the Drivetrain Group’s South Korean subsidiary, BorgWarner TransmissionSystems Korea Inc. Dividends received from NSK-Warner were $40.8 million, $15.7 million and $41.1 millionin 2008, 2007 and 2006, respectively.
Following are summarized financial data for NSK-Warner, translated using the ending or periodic rates asof and for the years ended November 30, 2008, 2007 and 2006 (unaudited):
millions of dollars 2008 2007 2006
Balance sheets:Current assets . . . . . . . . . . . . . . . . . . . . . . . . . . . . . . . . . . . . $319.1 $304.6 $256.8Non-current assets . . . . . . . . . . . . . . . . . . . . . . . . . . . . . . . . . 185.7 164.3 136.8Current liabilities . . . . . . . . . . . . . . . . . . . . . . . . . . . . . . . . . . . 146.3 148.8 128.6Non-current liabilities . . . . . . . . . . . . . . . . . . . . . . . . . . . . . . . . 40.5 22.9 19.7
Statements of operations:Net sales . . . . . . . . . . . . . . . . . . . . . . . . . . . . . . . . . . . . . . . . $637.9 $552.1 $535.4Gross profit. . . . . . . . . . . . . . . . . . . . . . . . . . . . . . . . . . . . . . . 140.0 122.7 111.6Net income. . . . . . . . . . . . . . . . . . . . . . . . . . . . . . . . . . . . . . . 67.6 69.4 54.7
The equity of NSK-Warner as of November 30, 2008 was $318.0 million, there was no debt and theircash and securities were $132.1 million.
Purchases from NSK-Warner for the years ended December 31, 2008, 2007 and 2006 were $25.4 mil-lion, $24.2 million and $23.0 million, respectively.
NOTE 7 GOODWILL AND OTHER INTANGIBLES
As of September 30, 2008 and December 31, 2008, the Company recorded an impairment charge ofc104.3 $(146.8) million and c7.2 $(10.0) million, respectively, to adjust BERU’s goodwill to its estimated fairvalue. The impairment charge is attributable to a decrease in the operating unit’s estimated fair value based
63
NOTES TO CONSOLIDATED FINANCIAL STATEMENTS — (Continued)

primarily upon the effect of the decline in European market conditions on current and projected operatingresults. The impairment charge was also impacted by the recognition of additional goodwill in the secondquarter of 2008, which was based on the court determined buy out value of c71.32 per share related to theDomination and Profit Transfer Agreement. Any differences in future results compared to management’sestimates could result in fair values different from estimated fair values, which could materially impact theCompany’s future results of operations and financial condition.
See Note 20, “Recent Transactions”, for further discussion on the BERU AG Domination and ProfitTransfer Agreement.
The changes in the carrying amount of goodwill for the twelve months ended December 31, 2006, 2007and 2008 are as follows:
millions of dollars
Balance at January 1, 2006 . . . . . . . . . . . . . . . . . . . . . . . . . . . . . . . . . . . . . . . . . . $1,029.8Goodwill impairment . . . . . . . . . . . . . . . . . . . . . . . . . . . . . . . . . . . . . . . . . . . . . . . . (0.2)ETEC acquisition . . . . . . . . . . . . . . . . . . . . . . . . . . . . . . . . . . . . . . . . . . . . . . . . . . 21.9Translation adjustment . . . . . . . . . . . . . . . . . . . . . . . . . . . . . . . . . . . . . . . . . . . . . . 35.0
Balance at December 31, 2006. . . . . . . . . . . . . . . . . . . . . . . . . . . . . . . . . . . . . . . . $1,086.5BERU acquisition — 12.8% . . . . . . . . . . . . . . . . . . . . . . . . . . . . . . . . . . . . . . . . . . . 48.7Translation adjustment . . . . . . . . . . . . . . . . . . . . . . . . . . . . . . . . . . . . . . . . . . . . . . 33.0
Balance at December 31, 2007. . . . . . . . . . . . . . . . . . . . . . . . . . . . . . . . . . . . . . . . $1,168.2BERU acquisition — 17.8% . . . . . . . . . . . . . . . . . . . . . . . . . . . . . . . . . . . . . . . . . . . 74.5Goodwill impairment . . . . . . . . . . . . . . . . . . . . . . . . . . . . . . . . . . . . . . . . . . . . . . . . (156.8)Translation adjustment . . . . . . . . . . . . . . . . . . . . . . . . . . . . . . . . . . . . . . . . . . . . . . (33.5)
Balance at December 31, 2008. . . . . . . . . . . . . . . . . . . . . . . . . . . . . . . . . . . . . . . . $1,052.4
The Company’s other intangible assets, primarily from acquisitions consist of the following:
millions of dollars
GrossCarryingAmount
AccumulatedAmortization
NetCarryingAmount
GrossCarryingAmount
AccumulatedAmortization
NetCarryingAmount
December 31, 2008 December 31, 2007
Amortized intangible assetsPatented technology . . . . . . . . . . . . $ 16.8 $ 4.2 $ 12.6 $ 13.8 $ 2.9 $ 10.9Unpatented technology . . . . . . . . . . 6.6 2.3 4.3 6.5 1.5 5.0Customer relationships . . . . . . . . . . 116.3 32.5 83.8 100.8 22.9 77.9Distribution network . . . . . . . . . . . . 53.1 31.9 21.2 45.6 23.2 22.4Miscellaneous. . . . . . . . . . . . . . . . . 14.7 11.9 2.8 14.7 11.9 2.8
Total amortized intangible assets. . . . . 207.5 82.8 124.7 181.4 62.4 119.0Unamortized trade names . . . . . . 23.7 — 23.7 20.4 — 20.4
Total intangible assets . . . . . . . . . . . . $231.2 $82.8 $148.4 $201.8 $62.4 $139.4
Amortization of other intangible assets was $27.1 million, $21.5 million and $17.5 million in 2008, 2007and 2006, respectively. The amortization totals include non-recurring charges directly attributable to acqui-sitions, as described in Note 20, “Recent Transactions”. The estimated useful lives of the Company’samortized intangible assets range from 4 to 12 years. The Company utilizes the straight line method ofamortization, recognized over the estimated useful lives of the assets. The estimated future annual amor-tization expense, primarily for acquired intangible assets, is as follows: $24.9 million in 2009, $17.5 million in2010, $17.5 million in 2011, $17.4 million in 2012 and $17.3 million in 2013.
64
NOTES TO CONSOLIDATED FINANCIAL STATEMENTS — (Continued)

A roll-forward of the gross carrying amounts for the years ended December 31, 2008 and 2007 ispresented below:
millions of dollars 2008 2007
Beginning balance . . . . . . . . . . . . . . . . . . . . . . . . . . . . . . . . . . . . . . . . . . . $201.8 $161.3Acquisitions . . . . . . . . . . . . . . . . . . . . . . . . . . . . . . . . . . . . . . . . . . . . . . 36.7 25.0Translation adjustment . . . . . . . . . . . . . . . . . . . . . . . . . . . . . . . . . . . . . . (7.3) 15.5
Ending balance . . . . . . . . . . . . . . . . . . . . . . . . . . . . . . . . . . . . . . . . . . . . . $231.2 $201.8
A roll-forward of accumulated amortization for the years ended December 31, 2008 and 2007 ispresented below:
millions of dollars 2008 2007
Beginning balance . . . . . . . . . . . . . . . . . . . . . . . . . . . . . . . . . . . . . . . . . . . . . $62.4 $40.9Provisions . . . . . . . . . . . . . . . . . . . . . . . . . . . . . . . . . . . . . . . . . . . . . . . . . 27.1 19.4Non-recurring charges . . . . . . . . . . . . . . . . . . . . . . . . . . . . . . . . . . . . . . . . (3.2) (2.1)Translation adjustment . . . . . . . . . . . . . . . . . . . . . . . . . . . . . . . . . . . . . . . . (3.5) 4.2
Ending balance . . . . . . . . . . . . . . . . . . . . . . . . . . . . . . . . . . . . . . . . . . . . . . . $82.8 $62.4
NOTE 8 PRODUCT WARRANTY
The changes in the carrying amount of the Company’s total product warranty liability for the years endedDecember 31, 2008 and 2007 were as follows:
millions of dollars 2008 2007
Beginning balance . . . . . . . . . . . . . . . . . . . . . . . . . . . . . . . . . . . . . . . . . . . . $ 70.1 $ 60.0Acquisition . . . . . . . . . . . . . . . . . . . . . . . . . . . . . . . . . . . . . . . . . . . . . . . . — —Provisions. . . . . . . . . . . . . . . . . . . . . . . . . . . . . . . . . . . . . . . . . . . . . . . . . 66.1 60.7Payments . . . . . . . . . . . . . . . . . . . . . . . . . . . . . . . . . . . . . . . . . . . . . . . . . (50.6) (54.9)Translation adjustment . . . . . . . . . . . . . . . . . . . . . . . . . . . . . . . . . . . . . . . (3.5) 4.3
Ending balance . . . . . . . . . . . . . . . . . . . . . . . . . . . . . . . . . . . . . . . . . . . . . . $ 82.1 $ 70.1
Contained within the 2007 provision is approximately $14 million for a warranty-related issue surround-ing a product, built during a 15-month period in 2004 and 2005, that is no longer in production.
Contained within the 2008 provision is approximately $23.5 for a warranty-related issue associated withthe company’s transmission product sold in Europe, limited to mid-2007 through May 2008 production.
The product warranty liability is classified in the consolidated balance sheets as follows:millions of dollars 2008 2007
Accounts payable and accrued expenses . . . . . . . . . . . . . . . . . . . . . . . . . . . . $51.4 $34.7Other non-current liabilities . . . . . . . . . . . . . . . . . . . . . . . . . . . . . . . . . . . . . . . 30.7 35.4
Total product warranty liability . . . . . . . . . . . . . . . . . . . . . . . . . . . . . . . . . . . $82.1 $70.1
65
NOTES TO CONSOLIDATED FINANCIAL STATEMENTS — (Continued)

NOTE 9 NOTES PAYABLE AND LONG-TERM DEBT
Following is a summary of notes payable and long-term debt. The weighted average interest rate on allborrowings outstanding as of December 31, 2008 and 2007 was 5.0% and 5.4%, respectively.
millions of dollars
December 31, Current Long-Term Current Long-Term2008 2007
Bank borrowings and other. . . . . . . . . . . . . . . . . . . $130.7 $ 1.0 $30.0 $ 6.0Term loans due through 2015 (at an average rate of
4.9% in 2008 and 4.0% in 2007) . . . . . . . . . . . . . 53.1 12.9 33.7 18.86.50% Senior Notes due 02/17/09, net of
unamortized discount(a) . . . . . . . . . . . . . . . . . . . 136.7 — — 136.55.75% Senior Notes due 11/01/16, net of
unamortized discount(a) . . . . . . . . . . . . . . . . . . . — 149.2 — 149.18.00% Senior Notes due 10/01/19, net of
unamortized discount(a) . . . . . . . . . . . . . . . . . . . — 133.9 — 133.97.125% Senior Notes due 02/15/29, net of
unamortized discount . . . . . . . . . . . . . . . . . . . . . — 119.2 — 119.2
Carrying amount of notes payable and long-termdebt . . . . . . . . . . . . . . . . . . . . . . . . . . . . . . . . . . 320.5 416.2 63.7 563.5
Impact of derivatives on debt . . . . . . . . . . . . . . . . . 0.2 43.4 — 9.1
Total notes payable and long-term debt . . . . . . . . . $320.7 $459.6 $63.7 $572.6
(a) The Company entered into several interest rate swaps, which have the effect of converting $325.0 millionof these fixed rate notes to variable rates as of December 31, 2008 and December 31, 2007. Theweighted average effective interest rates for these borrowings, including the effects of outstanding swapsas noted in Note 11, were 5.3% and 5.0% as of December 31, 2008 and 2007, respectively.
Annual principal payments required as of December 31, 2008 are as follows (in millions of dollars):
2009 . . . . . . . . . . . . . . . . . . . . . . . . . . . . . . . . . . . . . . . . . . . . . . . . . . . . . . . . . . . . . $320.72010 . . . . . . . . . . . . . . . . . . . . . . . . . . . . . . . . . . . . . . . . . . . . . . . . . . . . . . . . . . . . . 5.12011 . . . . . . . . . . . . . . . . . . . . . . . . . . . . . . . . . . . . . . . . . . . . . . . . . . . . . . . . . . . . . 3.02012 . . . . . . . . . . . . . . . . . . . . . . . . . . . . . . . . . . . . . . . . . . . . . . . . . . . . . . . . . . . . . 2.22013 . . . . . . . . . . . . . . . . . . . . . . . . . . . . . . . . . . . . . . . . . . . . . . . . . . . . . . . . . . . . . 2.2After 2013 . . . . . . . . . . . . . . . . . . . . . . . . . . . . . . . . . . . . . . . . . . . . . . . . . . . . . . . . . 449.5
Total Payments . . . . . . . . . . . . . . . . . . . . . . . . . . . . . . . . . . . . . . . . . . . . . . . . . . . $782.7Less: Unamortized Discounts . . . . . . . . . . . . . . . . . . . . . . . . . . . . . . . . . . . . . . . . . . . (2.4)
Total . . . . . . . . . . . . . . . . . . . . . . . . . . . . . . . . . . . . . . . . . . . . . . . . . . . . . . . . . . . $780.3
The Company’s long-term debt includes various financial covenants, none of which are expected torestrict future operations.
The Company has a multi-currency revolving credit facility, which provides for borrowings up to $600 millionthrough July 22, 2009. At December 31, 2008 and December 31, 2007 there were no outstanding borrowingsunder the facility. The credit agreement is subject to the usual terms and conditions applied by banks to aninvestment grade company. The two key covenants of the credit agreement are a net worth test and a debtcompared to EBITDA (“Earnings Before Interest, Taxes, Depreciation and Amortization”) test. The Companywas in compliance with all covenants at December 31, 2008. At December 31, 2008 and 2007, the Company
66
NOTES TO CONSOLIDATED FINANCIAL STATEMENTS — (Continued)
had outstanding letters of credit of $21.4 million and $22.0 million, respectively. The letters of credit typically actas a guarantee of payment to certain third parties in accordance with specified terms and conditions.
As of December 31, 2008 and 2007, the estimated fair values of the Company’s senior unsecured notestotaled $532.3 million and $572.4 million, respectively. The estimated fair values were $6.7 million lower in2008 and $33.7 million higher in 2007 than their respective carrying values. Fair market values are developedby the use of estimates obtained from brokers and other appropriate valuation techniques based oninformation available as of year-end. The fair value estimates do not necessarily reflect the values theCompany could realize in the current markets.
NOTE 10 FAIR VALUE MEASUREMENTS
On January 1, 2008, the Company partially adopted as required, Statement of Financial AccountingStandards No. 157 — “Fair Value Measurements” (“SFAS 157”) which expands the disclosure of fair valuemeasurements and its impact on the Company’s financial statements. In February 2008, the FASB issuedFSP 157-2, which delayed the effective date of adoption with respect to certain non-financial assets andliabilities until 2009. We intend to defer the adoption of SFAS 157 with respect to certain non-financial assetsand liabilities as permitted.
Statement No. 157 emphasizes that fair value is a market-based measurement, not an entity specificmeasurement. Therefore, a fair value measurement should be determined based on assumptions that marketparticipants would use in pricing an asset or liability. As a basis for considering market participant assump-tions in fair value measurements, SFAS 157 establishes a fair value hierarchy, which prioritizes the inputs usedin measuring fair values as follows:
Level 1: Observable inputs such as quoted prices in active markets;Level 2: Inputs, other than quoted prices in active markets, that are observable either directly
or indirectly; andLevel 3: Unobservable inputs in which there is little or no market data, which require the
reporting entity to develop its own assumptions.
Assets and liabilities measured at fair value are based on one or more of the following three valuationtechniques noted in SFAS 157:
A. Market approach: Prices and other relevant information generated by market transactionsinvolving identical or comparable assets or liabilities.
B. Cost approach: Amount that would be required to replace the service capacity of an asset(replacement cost).
C. Income approach: Techniques to convert future amounts to a single present amount basedupon market expectations (including present value techniques, option-pricing and excessearnings models).
67
NOTES TO CONSOLIDATED FINANCIAL STATEMENTS — (Continued)

The following table classifies the assets and liabilities measured at fair value on a recurring and non-recurring basis as of December 31, 2008:
(millions)
Balance atDecember 31,
2008
QuotedPrices inActive
Markets forIdentical Items
(Level 1)
SignificantOther
ObservableInputs
(Level 2)
SignificantUnobservable
Inputs(Level 3)
ValuationTechnique
Basis of Fair Value Measurements
Assets:Goodwill . . . . . . . . . . . . . . . . . . . $174.2 $— $ — $174.2 CFixed assets . . . . . . . . . . . . . . . . 21.2 — — 21.2 CCommodity contracts . . . . . . . . . 2.1 — 2.1 — AInterest rate swap contracts. . . . . 43.6 — 43.6 — AForeign exchange contracts. . . . . 10.2 — 10.2 — A
$251.3 $— $ 55.9 $195.4
Liabilities:Commodity contracts . . . . . . . . . $ 16.3 $— $ 16.3 $ — AForeign exchange contracts. . . . . 61.8 — 61.8 — ANet investment hedge
contracts . . . . . . . . . . . . . . . . . 64.1 — 64.1 — A
$142.2 $— $142.2 $ —
Refer to Note 1, “Summary of Significant Accounting Policies” and Note 11, “Financial Instruments”, formore detail surrounding the Company’s valuation methodology, inputs used, and fair value adjustmentrecorded for the year-ended December 31, 2008.
The change in the fair value of BERU’s goodwill for the year ended December 31, 2008 is as follows:
Fair ValueMeasurements
Using SignificantUnobservable Inputs
(Level 3)
Beginning balance as of December 31, 2007 . . . . . . . . . . . . . . . . . . . . . . . $ 274.6Acquired 17.8% of BERU through DPTA . . . . . . . . . . . . . . . . . . . . . . . . . 74.5BERU goodwill impairment charge . . . . . . . . . . . . . . . . . . . . . . . . . . . . . . (156.8)Translation adjustment. . . . . . . . . . . . . . . . . . . . . . . . . . . . . . . . . . . . . . . (18.1)
Ending balance as of December 31, 2008 . . . . . . . . . . . . . . . . . . . . . . . . . . $ 174.2
The change in the fair value of the Company’s net fixed assets impaired in 2008 is as follows:
Net book value prior to impairment . . . . . . . . . . . . . . . . . . . . . . . . . . . . . . . . . . . . . . . $ 94.1Fixed Asset Impairment Charge . . . . . . . . . . . . . . . . . . . . . . . . . . . . . . . . . . . . . . . . (72.9)
Net book value after impairment . . . . . . . . . . . . . . . . . . . . . . . . . . . . . . . . . . . . . . . . . $ 21.2
Losses included in earnings for the period ended December 31, 2008 are reported in the Statement ofOperations as goodwill impairment charge and restructuring expense.
68
NOTES TO CONSOLIDATED FINANCIAL STATEMENTS — (Continued)

NOTE 11 FINANCIAL INSTRUMENTS
The Company’s financial instruments include cash, marketable securities, trade receivables, tradepayables, and notes payable. Due to the short-term nature of these instruments, the book value approx-imates fair value. The Company’s financial instruments also include long-term debt, interest rate and currencyswaps, commodity forward contracts, and foreign currency forward contracts. All derivative contracts areplaced with counterparties that have an S&P, or equivalent, credit rating of “A�” or better at the time of thecontract placement.
The Company manages its interest rate risk by balancing its exposure to fixed and variable rates whileattempting to minimize its interest costs. The Company selectively uses interest rate swaps to reduce marketvalue risk associated with changes in interest rates (fair value hedges). The Company also selectively usescross-currency swaps to hedge the foreign currency exposure associated with our net investment in certainforeign operations (net investment hedges).
A summary of these instruments outstanding at December 31, 2008 follows (currency in millions):
Hedge TypeNotionalAmount Maturity (a)
Interest rate swapsFixed to floating . . . . . . . . . . . . . . . . . . . . . . Fair value $100 February 15, 2009Fixed to floating . . . . . . . . . . . . . . . . . . . . . . Fair value $150 November 1, 2016Fixed to floating . . . . . . . . . . . . . . . . . . . . . . Fair value $ 75 October 1, 2019Cross currency swapFloating $ to floating c. . . . . . . . . . . . . . . . . . Net Investment $100 February 15, 2009Floating $ to floating ¥. . . . . . . . . . . . . . . . . . Net Investment $150 November 1, 2016Floating $ to floating c. . . . . . . . . . . . . . . . . . Net Investment $ 75 October 1, 2019
(a) The maturity of the swaps corresponds with the maturity of the hedged item as noted in the debtsummary, unless otherwise indicated.
Effectiveness for fair value and net investment hedges is assessed at the inception of the hedgingrelationship. If specified criteria for the assumption of effectiveness are not met at hedge inception, effec-tiveness is assessed quarterly. Ineffectiveness is measured quarterly and results are recognized in earnings.
The interest rate swaps that are fair value hedges were determined to be exempt from ongoing tests oftheir effectiveness as hedges at the time of the hedge inception. This determination was made based uponthe fact that the swaps matched the underlying debt terms for the following factors: notional amount, fixedinterest rate, interest settlement dates, and maturity date. Additionally, the fair value of the swap was zero atthe time of inception, the variable rate is based on a benchmark, with no floor or ceiling, and the interestbearing liability is not pre-payable at a price other than its fair value.
Fair values of fixed to floating interest rate swaps are based on observable inputs, such as interest rate,yield curves, credit risks, and other external valuation methodology (Level 2 inputs under SFAS 157). SeeNote 10 for further discussion of fair value measurements. As of December 31, 2008, the fair values of thefixed to floating interest rate swaps were recorded as a current asset of $0.2 million and a non-current asset of$43.4 and a corresponding increase in short-term debt of $0.2 million and an increase in long-term debt of$43.4 million. As of December 31, 2007, the fair values of the fixed to floating interest rate swaps wererecorded as a non-current asset of $9.1 million and a corresponding increase in long-term debt of $9.1 million.No hedge ineffectiveness was recognized in relation to fixed to floating swaps.
Fair values of cross currency swaps are based on observable inputs, such as interest rate, yield curves,credit risks, currency exchange rates and other external valuation methodology (Level 2 inputs underSFAS 157). See Note 10 for further discussion of fair value measurements. As of December 31, 2008,
69
NOTES TO CONSOLIDATED FINANCIAL STATEMENTS — (Continued)

the fair values of the cross currency swaps were recorded as a current liability of $9.0 million and a non-current liability of $55.1 million. Hedge ineffectiveness of $4.6 million was recognized as of December 31,2008 in relation to cross currency swaps. As of December 31, 2007, the fair values of the cross currencyswaps were recorded as a non-current liability of $33.7 million. As of December 31, 2008, the fair value of aforeign currency forward contract designated as a net investment hedge was recorded as a current asset of$0.2 million. As of December 31, 2007, the fair value of foreign currency forward contracts designated as anet investment hedge was negligible.
The Company also entered into certain commodity derivative instruments to protect against commodityprice changes related to forecasted raw material and supplies purchases. The primary purpose of thecommodity price hedging activities is to manage the volatility associated with these forecasted purchases.The Company primarily utilizes forward and option contracts, which are designated as cash flow hedges. Asof December 31, 2008, the Company had forward and option commodity contracts with a total notional valueof $50.2 million. The fair values for certain commodity derivative instruments are based on Level 2 evidence(for example, future prices reported on commodity exchanges) under SFAS 157. See Note 10 for furtherdiscussion of fair value measurements. As of December 31, 2008, the Company was holding commodityderivatives with positive and negative fair market values of 2.1 million and $(16.3) million, respectively, ofwhich $1.0 million in gains and $(15.1) million in losses mature in less than one year. To the extent thatderivative instruments are deemed to be effective as defined by FAS 133, gains and losses arising from thesecontracts are deferred in other comprehensive income (loss). Such gains and losses will be reclassified intoincome as the underlying operating transactions are realized. Gains and losses not qualifying for deferraltreatment have been credited/charged to income as they are recognized. Losses not qualifying for deferralassociated with these contracts for December 31, 2008 were $(0.9) million, all of which mature in less thanone year. As of December 31, 2007, the Company had forward and option commodity contracts with a totalnotional value of $67.3 million. As of December 31, 2007, the Company was holding commodity derivativeswith positive and negative fair market values of $0.1 million and $(18.4) million, respectively, of which$0.1 million in gains and $(14.5) million in losses mature in less than one year. At December 31, 2007, lossesnot qualifying for deferral were $(0.1) million.
The Company uses foreign exchange forward and option contracts to protect against exchange ratemovements for forecasted cash flows for purchases, operating expenses or sales transactions designated incurrencies other than the functional currency of the operating unit. Most contracts mature in less than oneyear, however, certain long-term commitments are covered by forward currency arrangements to protectagainst currency risk through 2011. Foreign currency contracts require the Company, at a future date, toeither buy or sell foreign currency in exchange for the operating units’ local currency. At December 31, 2008,contracts were outstanding to buy or sell the British Pound Sterling, Brazilian Real, Euro, Hungarian Forint,Indian Rupee, Japanese Yen, Mexican Peso, South Korean Won and U.S. Dollar. To the extent that derivativeinstruments are deemed to be effective as defined by FAS 133, gains and losses arising from these contractsare deferred in other comprehensive income. Such gains and losses will be reclassified into income as theunderlying operating transactions are realized. Any gains or losses not qualifying for deferral are credited/charged to income as they are recognized. The fair value of foreign exchange forward and option contractsare based on Level 2 inputs under SFAS 157, such as quoted exchange rates by various exchanges. SeeNote 10 for further discussion of fair value measurements. As of December 31, 2008, the Company washolding foreign exchange derivatives with positive and negative fair market values of $10.2 million and$(61.8) million, respectively, of which $9.9 million in gains and $(36.3) million in losses mature in less than oneyear. As of December 31, 2008, $1.0 million of gains and $(8.2) million of losses did not qualify for deferral. Asof December 31, 2007, the Company was holding foreign exchange derivatives with a positive market valueof $1.9 million, all maturing in less than one year, and derivatives contracts with a negative value of$(9.9) million, with $(5.9) million maturing in less than one year. As of December 31, 2007, there were nogains or losses which did not qualify for deferral.
70
NOTES TO CONSOLIDATED FINANCIAL STATEMENTS — (Continued)

NOTE 12 RETIREMENT BENEFIT PLANS
The Company sponsors various defined contribution savings plans primarily in the U.S. that allowemployees to contribute a portion of their pre-tax and/or after-tax income in accordance with plan specifiedguidelines. Under specified conditions, the Company will make contributions to the plans and/or match apercentage of the employee contributions up to certain limits. Total expense related to the defined contri-bution plans was $22.1 million in 2008 and $23.7 million in 2007 and 2006.
The Company has a number of defined benefit pension plans and other post employment benefit planscovering eligible salaried and hourly employees and their dependents. The defined pension benefits providedare primarily based on (i) years of service and (ii) average compensation or a monthly retirement benefitamount. The Company provides defined benefit pension plans in the U.S., U.K., Germany, Japan, SouthKorea, Italy, France, Ireland, Monaco and Mexico. The other post employment benefit plans, which providemedical and life insurance benefits, are unfunded plans. The pension and other post employment benefitplans in the U.S. have been closed to new employees since 1995. The measurement date for all plans isDecember 31.
In September 2008 and 2007, the Company made changes to its U.S. retiree medical program thatimpact certain union and non-union active employees with a future retiree benefit and current retireesparticipating in a health care plan. The effect of the changes to both groups is that most members will pay ahigher percentage of the annual premium for Company-sponsored retiree medical coverage betweenages 60 to 64, and neither group will receive Company-sponsored Medicare Supplemental coverage onceentitled to Medicare. Instead, certain active employees will receive a lump sum credit into a non-contributorycash balance pension plan earning interest each year. Current retirees will receive an annual per memberallowance toward the purchase of individual Medicare Supplemental coverage and for reimbursement ofmedical out-of-pocket expenses.
During fourth quarter 2006, the Company evaluated the competitiveness of its North American facilities,as well as its long-term capacity needs. As a result, the Company will be closing the drivetrain plant in Muncie,Indiana and has adjusted the carrying values of other assets, primarily related to its four-wheel drive transfercase product line. One of the impacts of this fourth quarter restructuring was the Company’s recognition of a$6.8 million pension curtailment expense. See Note 19 for further details on the Company’s 2006 restruc-turing activities.
The following table summarizes the expenses for the Company’s defined contribution and definedbenefit pension plans and the other post employment defined benefit plans.
millions of dollars 2008 2007 2006
Defined contribution expense . . . . . . . . . . . . . . . . . . . . . . . . . . . . . . $22.1 $23.7 $23.7Defined benefit pension expense . . . . . . . . . . . . . . . . . . . . . . . . . . . 19.2 45.5 24.1Other post employment benefit expense . . . . . . . . . . . . . . . . . . . . . . 1.3 (3.5) 47.2
Total . . . . . . . . . . . . . . . . . . . . . . . . . . . . . . . . . . . . . . . . . . . . . . . $42.6 $65.7 $95.0
71
NOTES TO CONSOLIDATED FINANCIAL STATEMENTS — (Continued)

The following provides a reconciliation of the plans’ benefit obligations, plan assets, funded status andrecognition in the Consolidated Balance Sheets.
millions of dollars US Non-US US Non-US 2008 20072008 2007
Other PostEmployment Benefits
Pension Benefits
Change in projected benefit obligation:Projected benefit obligation at beginning
of year . . . . . . . . . . . . . . . . . . . . . . . . $326.9 $ 335.1 $305.1 $ 344.9 $ 373.1 $ 513.6Service cost. . . . . . . . . . . . . . . . . . . . . . 2.0 10.4 2.0 10.9 2.2 5.5Interest cost. . . . . . . . . . . . . . . . . . . . . . 20.9 17.3 18.2 15.9 22.7 28.2Plan participants’ contributions . . . . . . . . — — — 0.3 — —Plan amendments . . . . . . . . . . . . . . . . . — — — 0.2 (19.5) (49.7)Curtailment/settlement (gain) loss . . . . . . 7.5 (0.4) 37.1 (4.7) (10.4) (46.4)Actuarial gain . . . . . . . . . . . . . . . . . . . . . (15.6) (22.7) (11.1) (34.0) (4.1) (44.5)Currency translation . . . . . . . . . . . . . . . . — (49.2) — 16.8 — —Other. . . . . . . . . . . . . . . . . . . . . . . . . . . — 5.8 — 0.8 — —Benefits paid . . . . . . . . . . . . . . . . . . . . . (23.8) (15.9) (24.4) (16.0) (35.5) (33.6)
Projected benefit obligation at end ofyear . . . . . . . . . . . . . . . . . . . . . . . . . . $317.9 $ 280.4 $326.9 $ 335.1 $ 328.5 $ 373.1
Change in plan assets:Fair value of plan assets at beginning of
year . . . . . . . . . . . . . . . . . . . . . . . . . . $338.5 $ 187.0 $349.6 $ 175.0Actual return on plan assets . . . . . . . . . . (83.9) (31.8) 13.1 12.5Employer contribution . . . . . . . . . . . . . . — 13.3 0.2 12.2Plan participants’ contribution. . . . . . . . . — — — 0.3Currency translation . . . . . . . . . . . . . . . . — (38.6) — 3.0Other. . . . . . . . . . . . . . . . . . . . . . . . . . . — — — —Benefits paid . . . . . . . . . . . . . . . . . . . . . (23.8) (15.9) (24.4) (16.0)
Fair value of plan assets at end of year . . $230.8 $ 114.0 $338.5 $ 187.0
Funded status . . . . . . . . . . . . . . . . . . . . $ (87.1) $(166.4) $ 11.6 $(148.1) $(328.5) $(373.1)
Amounts recognized in theConsolidated Balance Sheets consistof:
Non-current assets . . . . . . . . . . . . . . . . — $ 0.5 $ 28.5 $ 0.3 $ — $ —Current liabilities . . . . . . . . . . . . . . . . . . . — (6.8) — (5.7) (31.9) (32.3)Non-current liabilities . . . . . . . . . . . . . . . (87.1) (160.1) (16.9) (142.7) (296.6) (340.8)
Net amount recognized . . . . . . . . . . . . . $ (87.1) $(166.4) $ 11.6 $(148.1) $(328.5) $(373.1)
Amounts recognized in accumulatedother comprehensive loss consist of:
Net actuarial loss . . . . . . . . . . . . . . . . . . $166.5 $ 32.4 $ 72.2 $ 17.0 $ 142.8 $ 158.8Net prior service cost (credit) . . . . . . . . . 0.1 0.2 0.2 0.2 (99.2) (104.8)Net transition obligation . . . . . . . . . . . . . — 0.1 — 0.3 — —
Net amount recognized . . . . . . . . . . . . . $166.6 $ 32.7 $ 72.4 $ 17.5 $ 43.6 $ 54.0
Total accumulated benefit obligation forall plans . . . . . . . . . . . . . . . . . . . . . . . $317.9 $ 265.2 $326.9 $ 322.4
72
NOTES TO CONSOLIDATED FINANCIAL STATEMENTS — (Continued)
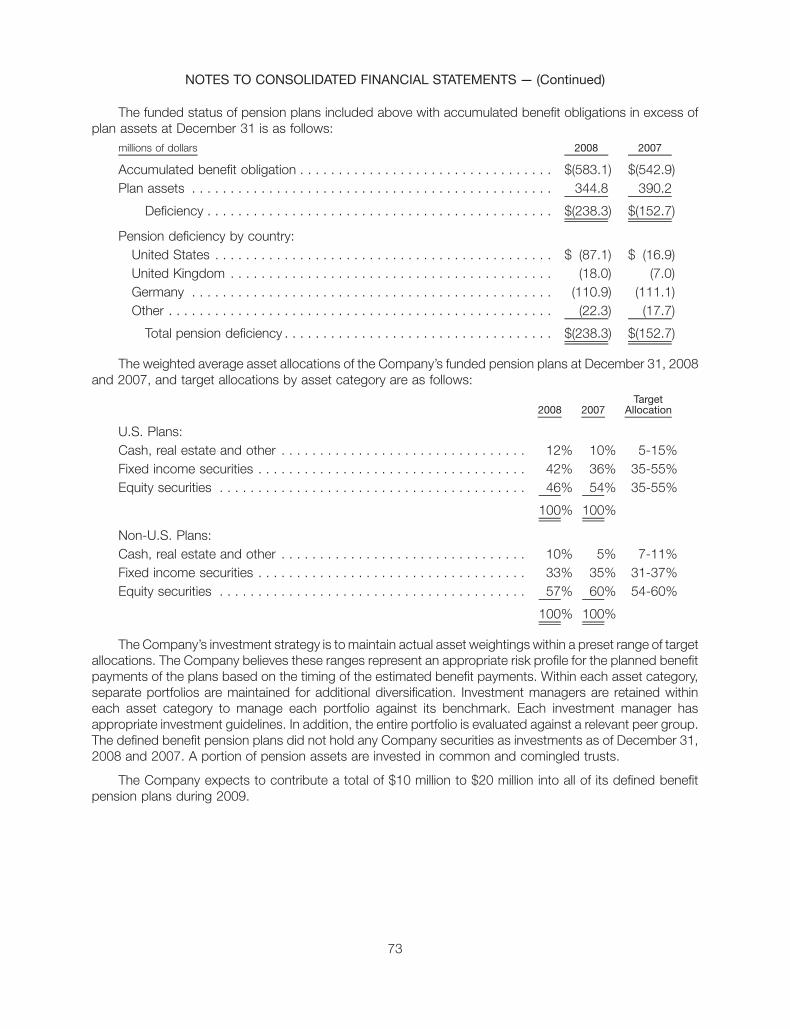
The funded status of pension plans included above with accumulated benefit obligations in excess ofplan assets at December 31 is as follows:
millions of dollars 2008 2007
Accumulated benefit obligation . . . . . . . . . . . . . . . . . . . . . . . . . . . . . . . . . $(583.1) $(542.9)Plan assets . . . . . . . . . . . . . . . . . . . . . . . . . . . . . . . . . . . . . . . . . . . . . . . 344.8 390.2
Deficiency . . . . . . . . . . . . . . . . . . . . . . . . . . . . . . . . . . . . . . . . . . . . . $(238.3) $(152.7)
Pension deficiency by country:United States . . . . . . . . . . . . . . . . . . . . . . . . . . . . . . . . . . . . . . . . . . . . $ (87.1) $ (16.9)United Kingdom . . . . . . . . . . . . . . . . . . . . . . . . . . . . . . . . . . . . . . . . . . (18.0) (7.0)Germany . . . . . . . . . . . . . . . . . . . . . . . . . . . . . . . . . . . . . . . . . . . . . . . (110.9) (111.1)Other . . . . . . . . . . . . . . . . . . . . . . . . . . . . . . . . . . . . . . . . . . . . . . . . . . (22.3) (17.7)
Total pension deficiency . . . . . . . . . . . . . . . . . . . . . . . . . . . . . . . . . . . $(238.3) $(152.7)
The weighted average asset allocations of the Company’s funded pension plans at December 31, 2008and 2007, and target allocations by asset category are as follows:
2008 2007Target
Allocation
U.S. Plans:Cash, real estate and other . . . . . . . . . . . . . . . . . . . . . . . . . . . . . . . . 12% 10% 5-15%Fixed income securities . . . . . . . . . . . . . . . . . . . . . . . . . . . . . . . . . . . 42% 36% 35-55%Equity securities . . . . . . . . . . . . . . . . . . . . . . . . . . . . . . . . . . . . . . . . 46% 54% 35-55%
100% 100%
Non-U.S. Plans:Cash, real estate and other . . . . . . . . . . . . . . . . . . . . . . . . . . . . . . . . 10% 5% 7-11%Fixed income securities . . . . . . . . . . . . . . . . . . . . . . . . . . . . . . . . . . . 33% 35% 31-37%Equity securities . . . . . . . . . . . . . . . . . . . . . . . . . . . . . . . . . . . . . . . . 57% 60% 54-60%
100% 100%
The Company’s investment strategy is to maintain actual asset weightings within a preset range of targetallocations. The Company believes these ranges represent an appropriate risk profile for the planned benefitpayments of the plans based on the timing of the estimated benefit payments. Within each asset category,separate portfolios are maintained for additional diversification. Investment managers are retained withineach asset category to manage each portfolio against its benchmark. Each investment manager hasappropriate investment guidelines. In addition, the entire portfolio is evaluated against a relevant peer group.The defined benefit pension plans did not hold any Company securities as investments as of December 31,2008 and 2007. A portion of pension assets are invested in common and comingled trusts.
The Company expects to contribute a total of $10 million to $20 million into all of its defined benefitpension plans during 2009.
73
NOTES TO CONSOLIDATED FINANCIAL STATEMENTS — (Continued)

See the table below for a breakout between U.S. and non-U.S. pension plans:
millions of dollars
For the Year Ended December 31, US Non-US US Non-US US Non-US 2008 2007 20062008 2007 2006
Pension Benefits Other PostEmployment Benefits
Components of net periodicbenefit cost:
Service cost . . . . . . . . . . . . . . . . . . $ 2.0 $ 10.4 $ 2.0 $ 10.9 $ 2.5 $ 12.8 $ 2.2 $ 5.5 $ 10.8Interest cost. . . . . . . . . . . . . . . . . . 20.9 17.3 18.2 15.9 16.7 14.1 22.7 28.2 31.0Expected return on plan assets . . . (28.2) (13.1) (29.6) (13.2) (28.4) (10.9) — — —Settlements, curtailments and
other . . . . . . . . . . . . . . . . . . . . . 7.5 — 37.1 0.7 6.8 — (8.7) (33.9) —Amortization of unrecognized prior
service cost (benefit) . . . . . . . . . . — — — — 0.9 0.1 (25.0) (17.7) (15.8)Amortization of unrecognized loss. . 2.3 0.1 2.0 1.5 6.4 2.6 10.1 14.4 21.2Other . . . . . . . . . . . . . . . . . . . . . . . — — — — — 0.5 — — —
Net periodic benefit cost (benefit) . . $ 4.5 $ 14.7 $ 29.7 $ 15.8 $ 4.9 $ 19.2 $ 1.3 $ (3.5) $ 47.2
The estimated net loss for the defined benefit pension plans that will be amortized from accumulatedother comprehensive income (loss) into net periodic benefit cost over the next fiscal year is $8.5 million. Theestimated net loss and prior service credit for the other post employment plans that will be amortized fromaccumulated other comprehensive income (loss) into net periodic benefit cost over the next fiscal year are$11.1 million and $(14.0) million, respectively.
The Company’s weighted-average assumptions used to determine the benefit obligations for its definedbenefit pension and other post employment plans as of December 31, 2008 and 2007 were as follows:
Percent 2008 2007
U.S. pension plans:Discount rate . . . . . . . . . . . . . . . . . . . . . . . . . . . . . . . . . . . . . . . . . . . . . . . . . 7.00 6.50Rate of compensation increase . . . . . . . . . . . . . . . . . . . . . . . . . . . . . . . . . . . . 3.50 3.50
U.S. other post employment plans:Discount rate . . . . . . . . . . . . . . . . . . . . . . . . . . . . . . . . . . . . . . . . . . . . . . . . . 7.00 6.50Rate of compensation increase . . . . . . . . . . . . . . . . . . . . . . . . . . . . . . . . . . . . N/A N/A
Non-U.S. pension plans:Discount rate . . . . . . . . . . . . . . . . . . . . . . . . . . . . . . . . . . . . . . . . . . . . . . . . . 5.67 5.42Rate of compensation increase . . . . . . . . . . . . . . . . . . . . . . . . . . . . . . . . . . . . 2.77 3.10
74
NOTES TO CONSOLIDATED FINANCIAL STATEMENTS — (Continued)
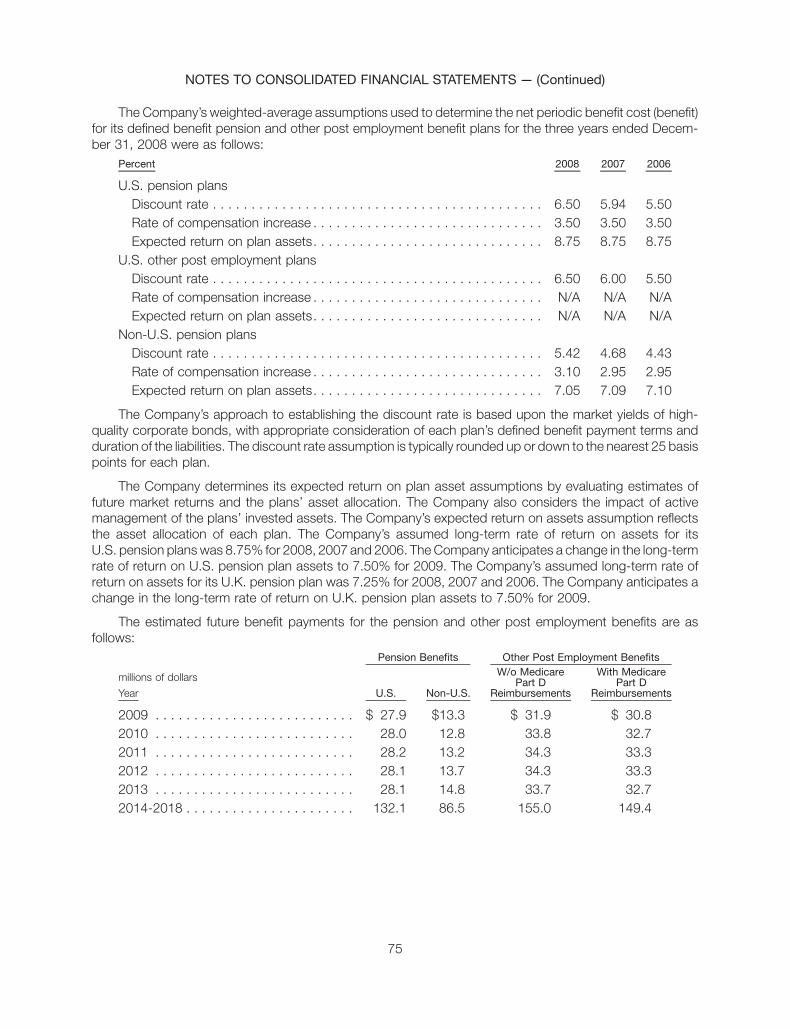
The Company’s weighted-average assumptions used to determine the net periodic benefit cost (benefit)for its defined benefit pension and other post employment benefit plans for the three years ended Decem-ber 31, 2008 were as follows:
Percent 2008 2007 2006
U.S. pension plansDiscount rate . . . . . . . . . . . . . . . . . . . . . . . . . . . . . . . . . . . . . . . . . . . 6.50 5.94 5.50Rate of compensation increase . . . . . . . . . . . . . . . . . . . . . . . . . . . . . . 3.50 3.50 3.50Expected return on plan assets. . . . . . . . . . . . . . . . . . . . . . . . . . . . . . 8.75 8.75 8.75
U.S. other post employment plansDiscount rate . . . . . . . . . . . . . . . . . . . . . . . . . . . . . . . . . . . . . . . . . . . 6.50 6.00 5.50Rate of compensation increase . . . . . . . . . . . . . . . . . . . . . . . . . . . . . . N/A N/A N/AExpected return on plan assets. . . . . . . . . . . . . . . . . . . . . . . . . . . . . . N/A N/A N/A
Non-U.S. pension plansDiscount rate . . . . . . . . . . . . . . . . . . . . . . . . . . . . . . . . . . . . . . . . . . . 5.42 4.68 4.43Rate of compensation increase . . . . . . . . . . . . . . . . . . . . . . . . . . . . . . 3.10 2.95 2.95Expected return on plan assets. . . . . . . . . . . . . . . . . . . . . . . . . . . . . . 7.05 7.09 7.10
The Company’s approach to establishing the discount rate is based upon the market yields of high-quality corporate bonds, with appropriate consideration of each plan’s defined benefit payment terms andduration of the liabilities. The discount rate assumption is typically rounded up or down to the nearest 25 basispoints for each plan.
The Company determines its expected return on plan asset assumptions by evaluating estimates offuture market returns and the plans’ asset allocation. The Company also considers the impact of activemanagement of the plans’ invested assets. The Company’s expected return on assets assumption reflectsthe asset allocation of each plan. The Company’s assumed long-term rate of return on assets for itsU.S. pension plans was 8.75% for 2008, 2007 and 2006. The Company anticipates a change in the long-termrate of return on U.S. pension plan assets to 7.50% for 2009. The Company’s assumed long-term rate ofreturn on assets for its U.K. pension plan was 7.25% for 2008, 2007 and 2006. The Company anticipates achange in the long-term rate of return on U.K. pension plan assets to 7.50% for 2009.
The estimated future benefit payments for the pension and other post employment benefits are asfollows:
millions of dollars
Year U.S. Non-U.S.
W/o MedicarePart D
Reimbursements
With MedicarePart D
Reimbursements
Pension Benefits Other Post Employment Benefits
2009 . . . . . . . . . . . . . . . . . . . . . . . . . . $ 27.9 $13.3 $ 31.9 $ 30.82010 . . . . . . . . . . . . . . . . . . . . . . . . . . 28.0 12.8 33.8 32.72011 . . . . . . . . . . . . . . . . . . . . . . . . . . 28.2 13.2 34.3 33.32012 . . . . . . . . . . . . . . . . . . . . . . . . . . 28.1 13.7 34.3 33.32013 . . . . . . . . . . . . . . . . . . . . . . . . . . 28.1 14.8 33.7 32.72014-2018 . . . . . . . . . . . . . . . . . . . . . . 132.1 86.5 155.0 149.4
75
NOTES TO CONSOLIDATED FINANCIAL STATEMENTS — (Continued)
The weighted-average rate of increase in the per capita cost of covered health care benefits is projectedto be 8.00% in 2009 for pre-65 and post-65 participants, decreasing to 5% by the year 2019. A one-percentage point change in the assumed health care cost trend would have the following effects:
millions of dollars Increase DecreaseOne Percentage Point
Effect on other post employment benefit obligation . . . . . . . . . . . . . . . . . . $18.9 $(16.5)Effect on total service and interest cost components . . . . . . . . . . . . . . . . . $ 1.4 $ (1.2)
NOTE 13 STOCK INCENTIVE PLANS
On January 1, 2006, the Company adopted Statement of Financial Accounting Standards No. 123(Revised 2004), Share-Based Payment (“FAS 123R”), which required the Company to measure all employeestock-based compensation awards using a fair value method and record the related expense in the financialstatements. The Company elected to use the modified prospective transition method, which requires thatcompensation cost be recognized in the financial statements for all awards granted after the date of adoptionas well as for existing awards for which the requisite service has not been rendered as of the date of adoptionand requires that prior periods not be restated. All periods presented prior to January 1, 2006 were accountedfor in accordance with Accounting Principles Board Opinion No. 25, Accounting for Stock Issued toEmployees (“APB No. 25”). Accordingly, no compensation cost was recognized for fixed stock optionsprior to January 1, 2006 because the exercise price of the stock options exceeded or equaled the marketvalue of the Company’s common stock at the date of grant, which is the measurement date.
Under the Company’s 1993 Stock Incentive Plan (“1993 Plan”), the Company granted options topurchase shares of the Company’s common stock at the fair market value on the date of grant. The optionsvest over periods up to three years and have a term of ten years from date of grant. As of December 31, 2003,there were no options available for future grants under the 1993 plan. The 1993 plan expired at the end of2003 and was replaced by the Company’s 2004 Stock Incentive Plan, which was amended at the Company’s2006 Annual Stockholders Meeting, among other things, to increase the number of shares available forissuance under the plan. Under the BorgWarner Inc. Amended and Restated 2004 Stock Incentive Plan(“2004 Stock Incentive Plan”), the number of shares authorized for grant was 10,000,000, of whichapproximately 1,648,000 shares are available for future issuance. As of December 31, 2008, there werea total of 5,797,675 outstanding options under the 1993 and 2004 Stock Incentive Plans.
Stock option compensation expense reduced income before income taxes and net earnings by$12.2 million and $9.1 million $(0.08 per basic and diluted share) and by $16.3 million and $11.9 million$(0.10 per basic and diluted share) for the years ended December 31, 2008 and 2007, respectively. Stockoption compensation expense affected both operating activities $(21.2 million and $16.3 million non-cashcharge backs) and financing activities $(3.1 million and $4.4 million tax benefits) of the ConsolidatedStatements of Cash Flows for the years ended December 31, 2008 and 2007, respectively.
Total unrecognized compensation cost related to nonvested stock options at December 31, 2008 isapproximately $8.7 million. This cost is expected to be recognized over the next 1.1 years. On a weightedaverage basis, this cost is expected to be recognized over 0.5 year.
76
NOTES TO CONSOLIDATED FINANCIAL STATEMENTS — (Continued)

A summary of the plans’ shares under option at December 31, 2008, 2007 and 2006 is as follows:
Shares
AverageExercise
Price
RemainingContractual
Life (in years)IntrinsicValue
(Thousands) (In millions)
Outstanding at January 1, 2006 . . . . . . . . . . 6,418 $21.21 8.1 $ 58.5Granted . . . . . . . . . . . . . . . . . . . . . . . . . . 1,708 29.09Exercised . . . . . . . . . . . . . . . . . . . . . . . . . (994) 16.33 $ 13.6Forfeited . . . . . . . . . . . . . . . . . . . . . . . . . . (190) 25.00
Outstanding at December 31, 2006. . . . . . . . 6,942 $23.74 7.8 $ 40.1
Granted . . . . . . . . . . . . . . . . . . . . . . . . . . 1,816 $34.95Exercised . . . . . . . . . . . . . . . . . . . . . . . . . (1,744) 20.52 $ 36.4Forfeited . . . . . . . . . . . . . . . . . . . . . . . . . . (683) 24.48
Outstanding at December 31, 2007. . . . . . . . 6,331 $27.75 7.7 $130.8
Granted . . . . . . . . . . . . . . . . . . . . . . . . . . — —Exercised . . . . . . . . . . . . . . . . . . . . . . . . . (366) 23.82 $ 8.3Forfeited . . . . . . . . . . . . . . . . . . . . . . . . . . (167) 32.58
Outstanding at December 31, 2008. . . . . . . . 5,798 $27.86 6.7 $ 6.0
Options exerciseable at December 31,2008 . . . . . . . . . . . . . . . . . . . . . . . . . . . . . 3,487 $24.38 5.9 $ 6.0
Proceeds from stock options exercised were $14.1 million, $35.9 million and $16.2 million in 2008, 2007and 2006, respectively. The tax benefit from stock options exercised was $3.0 million, $10.4 million and$10.9 million in 2008, 2007 and 2006, respectively. Proceeds from stock options exercised, including the taxbenefit were $17.1 million, $46.3 million and $27.1 million in 2008, 2007 and 2006, respectively.
The following table summarizes information about stock options outstanding at December 31, 2008:
Range of Exercise PricesNumber
Outstanding
Weighted-AverageRemainingContractualLife (Years)
Weighted-AverageExercise Price
NumberExercisable
Weighted-AverageExercise Price
Options Outstanding Options Exercisable
(Thousands) (Thousands)
$8.17 - 9.90 . . . . . . . . . . . . . . . . 88 1.4 $ 9.09 88 $ 9.09$12.07 - 16.52 . . . . . . . . . . . . . . 644 3.8 14.14 642 $14.14$22.15 - 34.95 . . . . . . . . . . . . . . 5,066 7.2 29.92 2,757 $27.25
5,798 6.7 $27.86 3,487 $24.38
The weighted average fair value at date of grant for options granted during 2007 and 2006 were $10.52and $8.91, respectively, and were estimated using the Black-Scholes options pricing model with the followingweighted average assumptions:
2007 2006
Risk-free interest rate. . . . . . . . . . . . . . . . . . . . . . . . . . . . . . . . . . . . . . 4.82% 5.04%Dividend yield . . . . . . . . . . . . . . . . . . . . . . . . . . . . . . . . . . . . . . . . . . . 0.97% 1.10%Volatility factor . . . . . . . . . . . . . . . . . . . . . . . . . . . . . . . . . . . . . . . . . . . 28.64% 29.06%Weighted average expected life . . . . . . . . . . . . . . . . . . . . . . . . . . . . . . 4.7 years 4.8 years
The expected lives of the awards are based on historical exercise patterns and the terms of the options.The risk-free interest rate is based on zero coupon Treasury bond rates corresponding to the expected life ofthe awards. The expected volatility assumption was derived by referring to changes in the Company’shistorical common stock prices over the same timeframe as the expected life of the awards. The expected
77
NOTES TO CONSOLIDATED FINANCIAL STATEMENTS — (Continued)
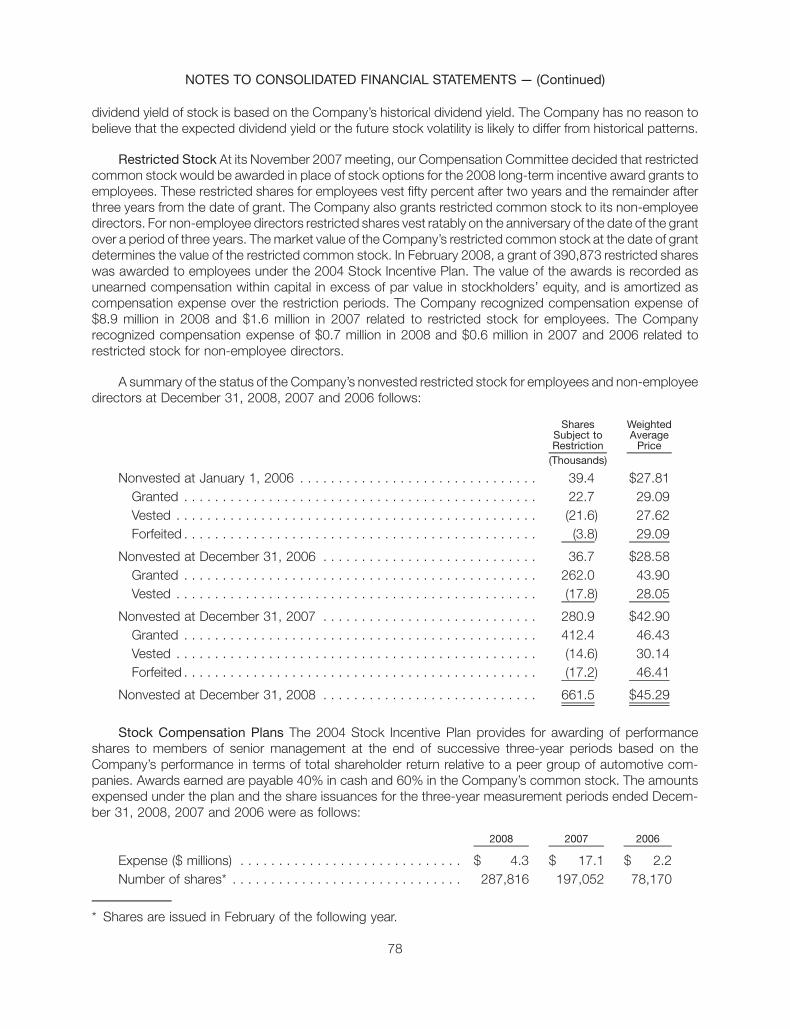
dividend yield of stock is based on the Company’s historical dividend yield. The Company has no reason tobelieve that the expected dividend yield or the future stock volatility is likely to differ from historical patterns.
Restricted Stock At its November 2007 meeting, our Compensation Committee decided that restrictedcommon stock would be awarded in place of stock options for the 2008 long-term incentive award grants toemployees. These restricted shares for employees vest fifty percent after two years and the remainder afterthree years from the date of grant. The Company also grants restricted common stock to its non-employeedirectors. For non-employee directors restricted shares vest ratably on the anniversary of the date of the grantover a period of three years. The market value of the Company’s restricted common stock at the date of grantdetermines the value of the restricted common stock. In February 2008, a grant of 390,873 restricted shareswas awarded to employees under the 2004 Stock Incentive Plan. The value of the awards is recorded asunearned compensation within capital in excess of par value in stockholders’ equity, and is amortized ascompensation expense over the restriction periods. The Company recognized compensation expense of$8.9 million in 2008 and $1.6 million in 2007 related to restricted stock for employees. The Companyrecognized compensation expense of $0.7 million in 2008 and $0.6 million in 2007 and 2006 related torestricted stock for non-employee directors.
A summary of the status of the Company’s nonvested restricted stock for employees and non-employeedirectors at December 31, 2008, 2007 and 2006 follows:
SharesSubject toRestriction
WeightedAverage
Price(Thousands)
Nonvested at January 1, 2006 . . . . . . . . . . . . . . . . . . . . . . . . . . . . . . . 39.4 $27.81Granted . . . . . . . . . . . . . . . . . . . . . . . . . . . . . . . . . . . . . . . . . . . . . . 22.7 29.09Vested . . . . . . . . . . . . . . . . . . . . . . . . . . . . . . . . . . . . . . . . . . . . . . . (21.6) 27.62Forfeited . . . . . . . . . . . . . . . . . . . . . . . . . . . . . . . . . . . . . . . . . . . . . . (3.8) 29.09
Nonvested at December 31, 2006 . . . . . . . . . . . . . . . . . . . . . . . . . . . . 36.7 $28.58Granted . . . . . . . . . . . . . . . . . . . . . . . . . . . . . . . . . . . . . . . . . . . . . . 262.0 43.90Vested . . . . . . . . . . . . . . . . . . . . . . . . . . . . . . . . . . . . . . . . . . . . . . . (17.8) 28.05
Nonvested at December 31, 2007 . . . . . . . . . . . . . . . . . . . . . . . . . . . . 280.9 $42.90Granted . . . . . . . . . . . . . . . . . . . . . . . . . . . . . . . . . . . . . . . . . . . . . . 412.4 46.43Vested . . . . . . . . . . . . . . . . . . . . . . . . . . . . . . . . . . . . . . . . . . . . . . . (14.6) 30.14Forfeited . . . . . . . . . . . . . . . . . . . . . . . . . . . . . . . . . . . . . . . . . . . . . . (17.2) 46.41
Nonvested at December 31, 2008 . . . . . . . . . . . . . . . . . . . . . . . . . . . . 661.5 $45.29
Stock Compensation Plans The 2004 Stock Incentive Plan provides for awarding of performanceshares to members of senior management at the end of successive three-year periods based on theCompany’s performance in terms of total shareholder return relative to a peer group of automotive com-panies. Awards earned are payable 40% in cash and 60% in the Company’s common stock. The amountsexpensed under the plan and the share issuances for the three-year measurement periods ended Decem-ber 31, 2008, 2007 and 2006 were as follows:
2008 2007 2006
Expense ($ millions) . . . . . . . . . . . . . . . . . . . . . . . . . . . . . $ 4.3 $ 17.1 $ 2.2Number of shares* . . . . . . . . . . . . . . . . . . . . . . . . . . . . . . 287,816 197,052 78,170
* Shares are issued in February of the following year.
78
NOTES TO CONSOLIDATED FINANCIAL STATEMENTS — (Continued)
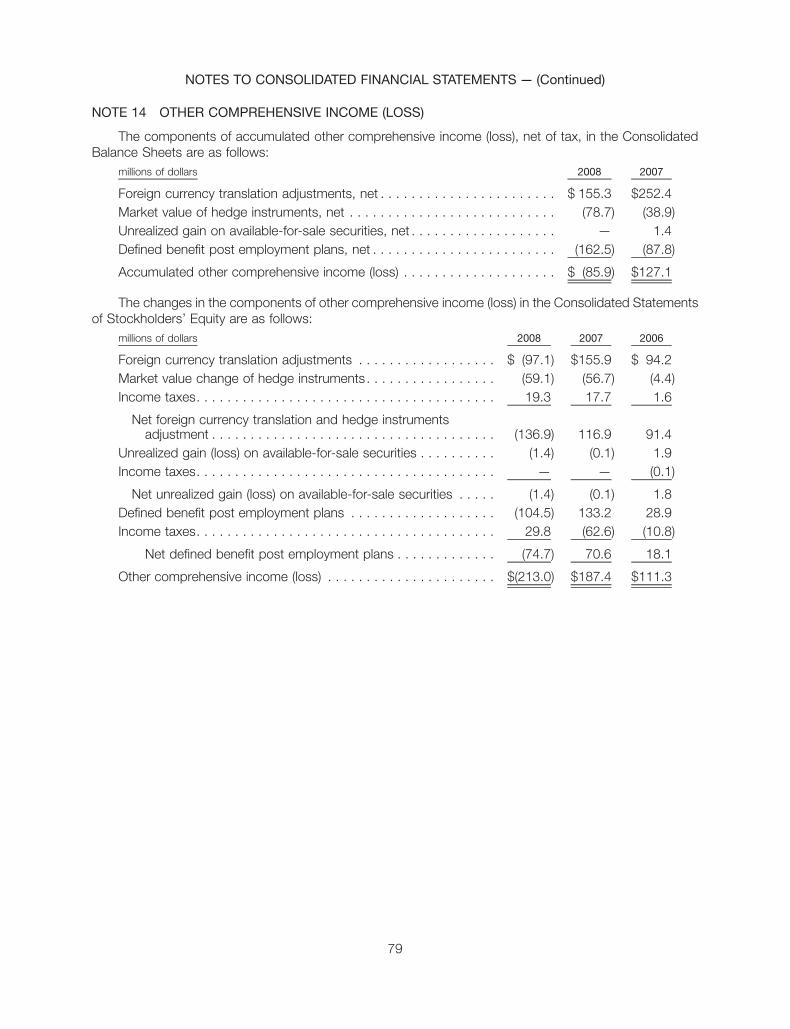
NOTE 14 OTHER COMPREHENSIVE INCOME (LOSS)
The components of accumulated other comprehensive income (loss), net of tax, in the ConsolidatedBalance Sheets are as follows:
millions of dollars 2008 2007
Foreign currency translation adjustments, net . . . . . . . . . . . . . . . . . . . . . . . $ 155.3 $252.4Market value of hedge instruments, net . . . . . . . . . . . . . . . . . . . . . . . . . . . (78.7) (38.9)Unrealized gain on available-for-sale securities, net . . . . . . . . . . . . . . . . . . . — 1.4Defined benefit post employment plans, net . . . . . . . . . . . . . . . . . . . . . . . . (162.5) (87.8)
Accumulated other comprehensive income (loss) . . . . . . . . . . . . . . . . . . . . $ (85.9) $127.1
The changes in the components of other comprehensive income (loss) in the Consolidated Statementsof Stockholders’ Equity are as follows:
millions of dollars 2008 2007 2006
Foreign currency translation adjustments . . . . . . . . . . . . . . . . . . $ (97.1) $155.9 $ 94.2Market value change of hedge instruments. . . . . . . . . . . . . . . . . (59.1) (56.7) (4.4)Income taxes. . . . . . . . . . . . . . . . . . . . . . . . . . . . . . . . . . . . . . . 19.3 17.7 1.6
Net foreign currency translation and hedge instrumentsadjustment . . . . . . . . . . . . . . . . . . . . . . . . . . . . . . . . . . . . . (136.9) 116.9 91.4
Unrealized gain (loss) on available-for-sale securities . . . . . . . . . . (1.4) (0.1) 1.9Income taxes. . . . . . . . . . . . . . . . . . . . . . . . . . . . . . . . . . . . . . . — — (0.1)
Net unrealized gain (loss) on available-for-sale securities . . . . . (1.4) (0.1) 1.8Defined benefit post employment plans . . . . . . . . . . . . . . . . . . . (104.5) 133.2 28.9Income taxes. . . . . . . . . . . . . . . . . . . . . . . . . . . . . . . . . . . . . . . 29.8 (62.6) (10.8)
Net defined benefit post employment plans . . . . . . . . . . . . . (74.7) 70.6 18.1
Other comprehensive income (loss) . . . . . . . . . . . . . . . . . . . . . . $(213.0) $187.4 $111.3
79
NOTES TO CONSOLIDATED FINANCIAL STATEMENTS — (Continued)
NOTE 15 CONTINGENCIES
In the normal course of business the Company and its subsidiaries are parties to various commercial andlegal claims, actions and complaints, including matters involving warranty claims, intellectual property claims,general liability and various other risks. It is not possible to predict with certainty whether or not the Companyand its subsidiaries will ultimately be successful in any of these commercial and legal matters or, if not, whatthe impact might be. The Company’s environmental and product liability contingencies are discussedseparately below. The Company’s management does not expect that the results in any of these commercialand legal claims, actions and complaints will have a material adverse effect on the Company’s results ofoperations, financial position or cash flows.
Litigation Outcome
In January 2006, BorgWarner Diversified Transmission Products Inc (“DTP”), a subsidiary of theCompany, filed a declaratory judgment action in United States District Court, Southern District of Indiana(Indianapolis Division) against the United Automobile, Aerospace, and Agricultural Implements Workers ofAmerica (“UAW”) Local No. 287 and Gerald Poor, individually and as the representative of a defendant class.DTP sought the Court’s affirmation that DTP did not violate the Labor-Management Relations Act or theEmployee Retirement Income Security Act by unilaterally amending certain medical plans effective April 1,2006 and October 1, 2006, prior to the expiration of the current collective bargaining agreements. OnSeptember 10, 2008, the Court found that DTP’s reservation of the right to make such amendments reducingthe level of benefits provided to retirees was limited by its collectively bargained health insurance agreementwith the UAW, which does not expire until April 24, 2009. Thus, the amendments were untimely. In 2008 theCompany recorded a charge of $4.0 million as a result of the Court’s decision.
The Company has communicated its plan to reduce the level of benefits provided to the retirees to makethem comparable to other Company retiree benefit plans. The change will be effective following expiration ofthe health insurance agreement in April 24, 2009.
Environmental
The Company and certain of its current and former direct and indirect corporate predecessors,subsidiaries and divisions have been identified by the United States Environmental Protection Agencyand certain state environmental agencies and private parties as potentially responsible parties (“PRPs”) atvarious hazardous waste disposal sites under the Comprehensive Environmental Response, Compensationand Liability Act (“Superfund”) and equivalent state laws and, as such, may presently be liable for the cost ofclean-up and other remedial activities at 35 such sites. Responsibility for clean-up and other remedialactivities at a Superfund site is typically shared among PRPs based on an allocation formula.
The Company believes that none of these matters, individually or in the aggregate, will have a materialadverse effect on its results of operations, financial position, or cash flows. Generally, this is because either theestimates of the maximum potential liability at a site are not large or the liability will be shared with other PRPs,although no assurance can be given with respect to the ultimate outcome of any such matter.
Based on information available to the Company (which in most cases includes: an estimate of allocationof liability among PRPs; the probability that other PRPs, many of whom are large, solvent public companies,will fully pay the cost apportioned to them; currently available information from PRPs and/or federal or stateenvironmental agencies concerning the scope of contamination and estimated remediation and consultingcosts; remediation alternatives; and estimated legal fees), the Company has established an accrual forindicated environmental liabilities with a balance at December 31, 2008 of $11.9 million. The Company hasaccrued amounts that do not exceed $3.4 million related to any individual site and we do not believe that thecosts related to any of these sites will have a material adverse effect on the Company’s results of operations,cash flows or financial condition. The Company expects to pay out substantially all of the amounts accrued forenvironmental liability over the next three to five years.
80
NOTES TO CONSOLIDATED FINANCIAL STATEMENTS — (Continued)
In connection with the sale of Kuhlman Electric Corporation, the Company agreed to indemnify the buyerand Kuhlman Electric for certain environmental liabilities, then unknown to the Company, relating to certainoperations of Kuhlman Electric that pre-date the Company’s 1999 acquisition of Kuhlman Electric. During2000, Kuhlman Electric notified the Company that it discovered potential environmental contamination at itsCrystal Springs, Mississippi plant while undertaking an expansion of the plant. The Company is continuing towork with the Mississippi Department of Environmental Quality and Kuhlman Electric to investigate andremediate to the extent necessary, historical contamination at the plant and surrounding area. KuhlmanElectric and others, including the Company, were sued in numerous related lawsuits, in which multipleclaimants alleged personal injury and property damage. In 2005, the Company and other defendants enteredinto settlements that resolved approximately 99% of the then known personal injury and property damageclaims relating to the alleged environmental contamination. Those settlements involved payments by theCompany of $28.5 million in the second half of 2005 and $15.7 million in the first quarter of 2006, in exchangefor, among other things, dismissal with prejudice of these lawsuits.
In December 2007, a lawsuit was filed against Kuhlman Electric and others, including the Company, onbehalf of approximately 209 plaintiffs, alleging personal injury relating to the alleged environmental contam-ination. In August 2008, two similar lawsuits were filed against Kuhlman Electric and others, including theCompany, on behalf of approximately 100 plaintiffs and 30 plaintiffs, respectively, alleging personal injuryrelated to the alleged environmental contamination. Given the early stage of the litigation, the Companycannot make any predictions as to the outcome, but its current intent is to vigorously defend against the suits.
Conditional Asset Retirement Obligations
In March 2005, the FASB issued Interpretation No. 47, Accounting for Conditional Asset RetirementObligations — an interpretation of FASB Statement No. 143 (“FIN 47”), which requires the Company torecognize legal obligations to perform asset retirements in which the timing and/or method of settlement areconditional on a future event that may or may not be within the control of the entity. Certain governmentregulations require the removal and disposal of asbestos from an existing facility at the time the facilityundergoes major renovations or is demolished. The liability exists because the facility will not last forever, but itis conditional on future renovations (even if there are no immediate plans to remove the materials, which poseno health or safety hazard in their current condition). Similarly, government regulations require the removal orclosure of underground storage tanks (“USTs”) and above ground storage tanks (“ASTs”) when their useceases, the disposal of polychlorinated biphenyl (“PCB”) transformers and capacitors when their use ceases,and the disposal of used furnace bricks and liners, and lead-based paint in conjunction with facilityrenovations or demolition. The Company currently has 32 manufacturing locations that have been identifiedas containing these items. The fair value to remove and dispose of this material has been estimated andrecorded at $1.4 million as of December 31, 2008 and $1.0 million as of December 31, 2007.
Product Liability
Like many other industrial companies who have historically operated in the U.S., the Company (or partiesthe Company is obligated to indemnify) continues to be named as one of many defendants in asbestos-related personal injury actions. We believe that the Company’s involvement is limited because, in general,these claims relate to a few types of automotive friction products that were manufactured many years ago andcontained encapsulated asbestos. The nature of the fibers, the encapsulation and the manner of use lead theCompany to believe that these products are highly unlikely to cause harm. As of December 31, 2008 and2007, the Company had approximately 27,000 and 42,000 pending asbestos-related product liability claims,respectively. Of the 27,000 outstanding claims at December 31, 2008, approximately 16,000 are pending injust three jurisdictions, where significant tort and judicial reform activities are underway.
The Company’s policy is to aggressively defend against these lawsuits and the Company has beensuccessful in obtaining dismissal of many claims without any payment. The Company expects that the vastmajority of the pending asbestos-related product liability claims where it is a defendant (or has an obligation to
81
NOTES TO CONSOLIDATED FINANCIAL STATEMENTS — (Continued)
indemnify a defendant) will result in no payment being made by the Company or its insurers. In 2008, of theapproximately 17,500 claims resolved, only 210 (1.2%) resulted in any payment being made to a claimant byor on behalf of the Company. In 2007, of the approximately 4,400 claims resolved, only 194 (4.4%) resulted inany payment being made to a claimant by or on behalf of the Company.
Prior to June 2004, the settlement and defense costs associated with all claims were covered by theCompany’s primary layer insurance coverage, and these carriers administered, defended, settled and paid allclaims under a funding arrangement. In June 2004, primary layer insurance carriers notified the Company ofthe alleged exhaustion of their policy limits. This led the Company to access the next available layer ofinsurance coverage. Since June 2004, secondary layer insurers have paid asbestos-related litigation defenseand settlement expenses pursuant to a funding arrangement. To date, the Company has paid $50.1 million indefense and indemnity in advance of insurers’ reimbursement and has received $14.2 million in cash frominsurers. The outstanding balance of $35.9 million is expected to be fully recovered. Timing of the recovery isdependent on final resolution of the declaratory judgment action referred to below. At December 31, 2007,insurers owed $20.6 million in association with these claims.
At December 31, 2008, the Company has an estimated liability of $34.7 million for future claimsresolutions, with a related asset of $34.7 million to recognize the insurance proceeds receivable by theCompany for estimated losses related to claims that have yet to be resolved. Insurance carrier reimbursementof 100% is expected based on the Company’s experience, its insurance contracts and decisions received todate in the declaratory judgment action referred to below. At December 31, 2007, the comparable value of theinsurance receivable and accrued liability was $39.6 million.
The amounts recorded in the Consolidated Balance Sheets related to the estimated future settlement ofexisting claims are as follows:
millions of dollars 2008 2007
Assets:Prepayments and other current assets . . . . . . . . . . . . . . . . . . . . . . . . . . . . $22.1 $20.1Other non-current assets . . . . . . . . . . . . . . . . . . . . . . . . . . . . . . . . . . . . . . 12.6 19.5
Total insurance receivable . . . . . . . . . . . . . . . . . . . . . . . . . . . . . . . . . . . . $34.7 $39.6
Liabilities:Accounts payable and accrued expenses . . . . . . . . . . . . . . . . . . . . . . . . . . $22.1 $20.1Other non-current liabilities . . . . . . . . . . . . . . . . . . . . . . . . . . . . . . . . . . . . . 12.6 19.5
Total accrued liability . . . . . . . . . . . . . . . . . . . . . . . . . . . . . . . . . . . . . . $34.7 $39.6
The Company cannot reasonably estimate possible losses, if any, in excess of those for which it hasaccrued, because it cannot predict how many additional claims may be brought against the Company (orparties the Company has an obligation to indemnify) in the future, the allegations in such claims, the possibleoutcomes, or the impact of tort reform legislation that may be enacted at the State or Federal levels.
A declaratory judgment action was filed in January 2004 in the Circuit Court of Cook County, Illinois byContinental Casualty Company and related companies (“CNA”) against the Company and certain of its otherhistorical general liability insurers. CNA provided the Company with both primary and additional layerinsurance, and, in conjunction with other insurers, is currently defending and indemnifying the Companyin its pending asbestos-related product liability claims. The lawsuit seeks to determine the extent of insurancecoverage available to the Company including whether the available limits exhaust on a “per occurrence” or an“aggregate” basis, and to determine how the applicable coverage responsibilities should be apportioned. OnAugust 15, 2005, the Court issued an interim order regarding the apportionment matter. The interim order hasthe effect of making insurers responsible for all defense and settlement costs pro rata to time-on-the-risk, withthe pro-ration method to hold the insured harmless for periods of bankrupt or unavailable coverage. Appeals
82
NOTES TO CONSOLIDATED FINANCIAL STATEMENTS — (Continued)
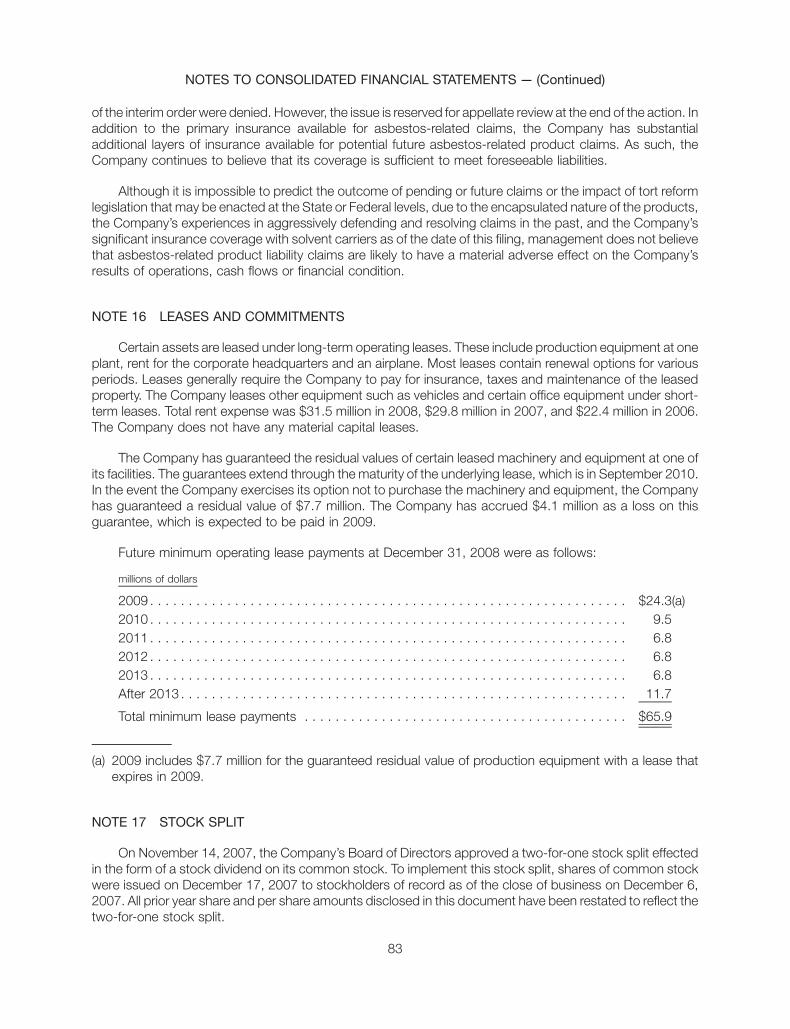
of the interim order were denied. However, the issue is reserved for appellate review at the end of the action. Inaddition to the primary insurance available for asbestos-related claims, the Company has substantialadditional layers of insurance available for potential future asbestos-related product claims. As such, theCompany continues to believe that its coverage is sufficient to meet foreseeable liabilities.
Although it is impossible to predict the outcome of pending or future claims or the impact of tort reformlegislation that may be enacted at the State or Federal levels, due to the encapsulated nature of the products,the Company’s experiences in aggressively defending and resolving claims in the past, and the Company’ssignificant insurance coverage with solvent carriers as of the date of this filing, management does not believethat asbestos-related product liability claims are likely to have a material adverse effect on the Company’sresults of operations, cash flows or financial condition.
NOTE 16 LEASES AND COMMITMENTS
Certain assets are leased under long-term operating leases. These include production equipment at oneplant, rent for the corporate headquarters and an airplane. Most leases contain renewal options for variousperiods. Leases generally require the Company to pay for insurance, taxes and maintenance of the leasedproperty. The Company leases other equipment such as vehicles and certain office equipment under short-term leases. Total rent expense was $31.5 million in 2008, $29.8 million in 2007, and $22.4 million in 2006.The Company does not have any material capital leases.
The Company has guaranteed the residual values of certain leased machinery and equipment at one ofits facilities. The guarantees extend through the maturity of the underlying lease, which is in September 2010.In the event the Company exercises its option not to purchase the machinery and equipment, the Companyhas guaranteed a residual value of $7.7 million. The Company has accrued $4.1 million as a loss on thisguarantee, which is expected to be paid in 2009.
Future minimum operating lease payments at December 31, 2008 were as follows:
millions of dollars
2009 . . . . . . . . . . . . . . . . . . . . . . . . . . . . . . . . . . . . . . . . . . . . . . . . . . . . . . . . . . . . . . $24.3(a)2010 . . . . . . . . . . . . . . . . . . . . . . . . . . . . . . . . . . . . . . . . . . . . . . . . . . . . . . . . . . . . . . 9.52011 . . . . . . . . . . . . . . . . . . . . . . . . . . . . . . . . . . . . . . . . . . . . . . . . . . . . . . . . . . . . . . 6.82012 . . . . . . . . . . . . . . . . . . . . . . . . . . . . . . . . . . . . . . . . . . . . . . . . . . . . . . . . . . . . . . 6.82013 . . . . . . . . . . . . . . . . . . . . . . . . . . . . . . . . . . . . . . . . . . . . . . . . . . . . . . . . . . . . . . 6.8After 2013 . . . . . . . . . . . . . . . . . . . . . . . . . . . . . . . . . . . . . . . . . . . . . . . . . . . . . . . . . . 11.7
Total minimum lease payments . . . . . . . . . . . . . . . . . . . . . . . . . . . . . . . . . . . . . . . . . . $65.9
(a) 2009 includes $7.7 million for the guaranteed residual value of production equipment with a lease thatexpires in 2009.
NOTE 17 STOCK SPLIT
On November 14, 2007, the Company’s Board of Directors approved a two-for-one stock split effectedin the form of a stock dividend on its common stock. To implement this stock split, shares of common stockwere issued on December 17, 2007 to stockholders of record as of the close of business on December 6,2007. All prior year share and per share amounts disclosed in this document have been restated to reflect thetwo-for-one stock split.
83
NOTES TO CONSOLIDATED FINANCIAL STATEMENTS — (Continued)

NOTE 18 EARNINGS PER SHARE
Earnings per share of common stock outstanding were computed as follows:in millions except per share amounts 2008 2007 2006
Basic earnings (loss) per share:Net earnings (loss) . . . . . . . . . . . . . . . . . . . . . . . . . . . . $ (35.6) $ 288.5 $ 211.6
Average shares of common stock outstanding . . . . . . . 116.007 116.002 114.806
Basic earnings (loss) per share of common stock . . . . . $ (0.31) $ 2.49 $ 1.84
Diluted earnings (loss) per share:Net earnings (loss) . . . . . . . . . . . . . . . . . . . . . . . . . . . . $ (35.6) $ 288.5 $ 211.6
Average shares of common stock outstanding . . . . . . . 116.007 116.002 114.806Effect of dilutive securities . . . . . . . . . . . . . . . . . . . . . . — 1.838 1.136
Average shares of common stock outstandingincluding dilutive shares . . . . . . . . . . . . . . . . . . . . . . 116.007 117.840 115.942
Diluted earnings (loss) per share of common stock . . . . $ (0.31)* $ 2.45 $ 1.83
* The Company had a loss for the year ended December 31, 2008. As a result, diluted loss per share is thesame as basic loss per share in the period, as any dilutive securities would reduce the loss per share.
NOTE 19 RESTRUCTURING
On July 31, 2008, the Company announced a restructuring of its operations to align ongoing operationswith a continuing, fundamental market shift in the auto industry. As a continuation of the Company’s thirdquarter restructuring, on December 11, 2008, the Company announced plans for additional restructuringactions. As a result of these third and fourth quarter restructuring actions, the Company has reduced its NorthAmerican workforce by approximately 2,400 people, or 33%; its European workforce by approximately1,600 people, or 18%; and its Asian workforce by approximately 400 people, or 17%. The restructuringexpense recognized for employee termination benefits is $54.6 million, of which $10.3 million was paid out inthe third and fourth quarters of 2008. The remaining liability will be paid out by the middle of 2010. In addition toemployee termination costs, the Company recorded $72.9 million of asset impairment charges related to theNorth American and European restructuring. The combined restructuring expenses of $127.5 million arebroken out by segment as follows: Engine $85.3 million, Drivetrain $40.9 million and Corporate $1.3 million.
On September 22, 2006, the Company announced the reduction of its North American workforce byapproximately 850 people, or 13%, spread across its 19 operations in the U.S., Canada and Mexico. Inaddition to employee related costs of $6.7 million, the Company recorded $4.8 million of asset impairmentcharges related to the North American restructuring. The restructuring expenses broken out by segment wereas follows: Engine $7.3 million, Drivetrain $3.6 million and Corporate $0.6 million.
During the fourth quarter of 2006, the Company recorded restructuring expense associated with closingthe drivetrain plant in Muncie, Indiana and adjusted the carrying values of other assets primarily related to itsfour-wheel drive transfer case product line. Production activity at the Muncie facility is scheduled to cease nolater than the expiration of the current labor contract on April 24, 2009. The Company recorded employeerelated costs of $14.8 million, asset impairments of $51.6 million and pension curtailment expense of$6.8 million in the fourth quarter of 2006. The expenses broken out by segment were as follows: Engine$5.9 million and Drivetrain $67.3 million.
Estimates of restructuring expense are based on information available at the time such charges arerecorded. Due to the inherent uncertainty involved in estimating restructuring expenses, actual amounts paid
84
NOTES TO CONSOLIDATED FINANCIAL STATEMENTS — (Continued)

for such activities may differ from amounts initially recorded. Accordingly, the Company may record revisionsof previous estimates by adjusting previously established reserves.
For the year ended December 31, 2008, the following table summarizes restructuring expense bysegment:
millions of dollarsEmployee
Related CostsAsset
Impairments Total
Drivetrain Group . . . . . . . . . . . . . . . . . . . . . . . . . . . . . . . $18.8 $22.1 $ 40.9Engine Group . . . . . . . . . . . . . . . . . . . . . . . . . . . . . . . . . 34.5 50.8 85.3Corporate . . . . . . . . . . . . . . . . . . . . . . . . . . . . . . . . . . . 1.3 — 1.3
Total provision . . . . . . . . . . . . . . . . . . . . . . . . . . . . . . . . $54.6 $72.9 $127.5
The asset impairment charge of $72.9 million is comprised of a $7.0 million charge in the third quarter and a$65.9 million charge in the fourth quarter.
The following table displays a rollforward of the employee related restructuring accruals recorded withinthe Company’s Consolidated Balance Sheet and the related cash flow activity for the year ended Decem-ber 31, 2008:
millions of dollars Drivetrain Engine CorporateEmployee Related Costs
Balance at December 31, 2007 . . . . . . . . . . . . . . . . . . . . . . . . . $ 9.1 — —Cash payments . . . . . . . . . . . . . . . . . . . . . . . . . . . . . . . . . . . — — —
Balance at March 31, 2008 . . . . . . . . . . . . . . . . . . . . . . . . . . . . 9.1 — —Cash payments . . . . . . . . . . . . . . . . . . . . . . . . . . . . . . . . . . . (0.8) — —
Balance at June 30, 2008 . . . . . . . . . . . . . . . . . . . . . . . . . . . . . $ 8.3 — —Provision . . . . . . . . . . . . . . . . . . . . . . . . . . . . . . . . . . . . . . . . 5.7 12.3 —Cash payments . . . . . . . . . . . . . . . . . . . . . . . . . . . . . . . . . . . (3.0) (4.2) —Translation Adjustment . . . . . . . . . . . . . . . . . . . . . . . . . . . . . . — (0.4) —
Balance at September 30, 2008 . . . . . . . . . . . . . . . . . . . . . . . . $11.0 7.7 —Provision . . . . . . . . . . . . . . . . . . . . . . . . . . . . . . . . . . . . . . . . 13.1 22.2 1.3Cash payments . . . . . . . . . . . . . . . . . . . . . . . . . . . . . . . . . . . (2.2) (0.3) (0.6)Translation Adjustment . . . . . . . . . . . . . . . . . . . . . . . . . . . . . . (0.9) (0.3) —
Balance at December 31, 2008 . . . . . . . . . . . . . . . . . . . . . . . . . $21.0 $29.3 $ 0.7
Future cash payments for these restructuring activities are expected to be complete by the middle of2010.
Due to the asset impairments recorded in 2008, the Company’s depreciation expense will be reduced byapproximately $11 million in 2009.
NOTE 20 RECENT TRANSACTIONS
BERU AG
In 2005, the Company acquired approximately 69.4% of the outstanding shares of BERU Aktiengesell-schaft (“BERU”), headquartered in Ludwigsburg, Germany.
The Company acquired approximately 12.8% of additional BERU shares in 2007. The purchase pricepaid for these shares was $138.8 million, including transaction fees. In connection with the purchase, theCompany recorded fair value of identified intangible assets and beginning inventory of $28.5 million. Of this
85
NOTES TO CONSOLIDATED FINANCIAL STATEMENTS — (Continued)

total, $2.1 million, net of tax, of in process R&D, order backlog and beginning inventory were immediatelywritten off in the selling, general, and administrative line in the Consolidated Statement of Operations. Netliabilities of $1.0 million and goodwill of $48.7 million were also recorded. The Company also recorded areduction in the minority interest of BERU of $62.6 million.
In the second quarter of 2008, the Company and BERU AG (“BERU”) completed a Domination and ProfitTransfer Agreement (“DPTA”), giving BorgWarner full control of BERU. Under this agreement BERU isobligated to transfer 100% of its profits or losses to the Company. Upon request of BERU minorityshareholders, the Company is obligated to purchase their shares for a cash payment of c71.32 per share.Those BERU minority shareholders who do not sell their shares are entitled to receive an annual compen-satory payment (perpetual dividend) of c4.73 (gross) per share, less certain taxes, from the Company. Thetotal obligation associated with the DPTA as of December 31, 2008 was approximately c31.5 $(44.0) million,based upon the present value of the perpetual dividend and approximates the cost if all remaining shareswere purchased by the Company at c71.32 per share. As of December 31, 2008, the DPTA obligation ispresented in the Consolidated Balance Sheet as $44.0 million in current liabilities.
As of June 30, 2008, in connection with the DPTA, the Company recorded the remaining 17.8% of thefair value of BERU. The table below summarizes activity related to the Company’s DPTA obligation as ofDecember 31, 2008 as follows (in millions):
Elimination of Minority Interest . . . . . . . . . . . . . . . . . . . . . . . . . . . . . . . . . . . . . . . . . . $ 86.6Goodwill . . . . . . . . . . . . . . . . . . . . . . . . . . . . . . . . . . . . . . . . . . . . . . . . . . . . . . . . . . 71.2Tangible and Intangible Assets . . . . . . . . . . . . . . . . . . . . . . . . . . . . . . . . . . . . . . . . . . 61.7Liabilities . . . . . . . . . . . . . . . . . . . . . . . . . . . . . . . . . . . . . . . . . . . . . . . . . . . . . . . . . . (19.2)
Domination and Profit Transfer Agreement Obligation at June 30, 2008 . . . . . . . . . . 200.3Shares Purchased During the Three Months Ended September 30, 2008 . . . . . . . . . . (54.4)Translation Adjustment . . . . . . . . . . . . . . . . . . . . . . . . . . . . . . . . . . . . . . . . . . . . . . . . (21.3)
Domination and Profit Transfer Agreement Obligation at September 30, 2008. . . . . . 124.6Shares Purchased During the Three Months Ended December 31, 2008 . . . . . . . . . . . (79.2)Translation Adjustment . . . . . . . . . . . . . . . . . . . . . . . . . . . . . . . . . . . . . . . . . . . . . . . . (1.4)
Domination and Profit Transfer Agreement Obligation at December 31, 2008 . . . . . . $ 44.0
Goodwill is reflected in the Engine segment. The $71.2 million of goodwill represents the excess of theDPTA obligation over the fair value of assets acquired and liabilities assumed.
Of the total tangible and intangible fair value write up of $61.7 million, $3.3 million of in process R&D andorder backlog were written off in the selling, general, and administrative line and $1.8 million of beginninginventory was written off in the cost of sales line in the Condensed Consolidated Statement of Operations inthe second quarter of 2008. The combined pre-tax effect of both items is $5.1 million, $4.5 million net of tax or$0.04 per diluted share for the year ended December 31, 2008.
As of December 31, 2008, the portion of the acquisition related to the DPTA represents a non-cashtransaction of c31.5 $(44.0) million. For the year ended December 31, 2008, the costs related to the annualperpetual dividend arrangement are reflected as expense in the Consolidated Statement of Operations.$4.0 million in interest expense and $0.2 million in income tax expense have been recorded in 2008. Thetendering of approximately 13.4% of BERU shares, at a cost of $133.6 million, has been reflected as aninvesting activity in the Consolidated Statement of Cash Flows for the year ended December 31, 2008. Theannual payment of the perpetual dividend will be reflected as a financing activity. The payment of the annualperpetual dividend is expected to occur in the second quarter of each year, beginning in 2009.
The DPTA is a binding agreement. However, minority shareholders of BERU initiated an appraisalproceeding in the German court system that challenges the c71.32 purchase price and c4.73 annual
86
NOTES TO CONSOLIDATED FINANCIAL STATEMENTS — (Continued)
compensatory payment (perpetual dividend). If a higher price is determined, the excess purchase price wouldbe recorded as additional goodwill with a corresponding increase to the Company’s total DPTA obligation.Any additional goodwill would be subject to impairment testing.
As a result of the tendering of shares in 2008 in accordance with the DPTA, the Company ownsapproximately 96% of all BERU’s outstanding shares. On January 7, 2009 the Company informed BERU of itsintention to purchase the remaining outstanding shares of approximately 4%, using the required Germanlegal process referred to as a “squeeze-out” to complete the 100% ownership.
See Note 7, “Goodwill and Other Intangible Assets”, for further discussion on BERU’s goodwill impair-ment charge recorded in the third and fourth quarters of 2008.
ETEC
The Company acquired the ETEC product lines from Eaton as of the close of business for the quarterended September 30, 2006 for $63.7 million, net of cash acquired. The operating results of ETEC have beenreported within the Drivetrain segment since its acquisition.
Other
In the third quarter of 2008, the Company purchased the remaining 26% interest in its joint venturelocated in India, BorgWarner Morse TEC Murugappa Pvt. Ltd., for $4.4 million.
In the third quarter of 2008, BERU divested its 50% interest in Impco BERU Technologies B.V. (located inthe Netherlands) for $5.5 million, which approximated its carrying value.
On November 18, 2008, we entered into a joint venture agreement with China Automobile DevelopmentUnited Investment Company, a company owned by leading Chinese automakers, to produce various dualclutch transmission modules. The joint venture will be located in Dalian, China and production is scheduled tobegin in 2011. BorgWarner will own 66% of the joint venture.
NOTE 21 REPORTING SEGMENTS AND RELATED INFORMATION
The Company’s business is comprised of two reporting segments: Engine and Drivetrain. Thesesegments are strategic business groups, which are managed separately as each represents a specificgrouping of automotive components and systems. Effective January 1, 2006, the Company assigned anoperating facility previously reported in the Engine segment to the Drivetrain segment due to changes in thefacility’s product mix.
The Company allocates resources to each segment based upon the projected after-tax return oninvested capital (“ROIC”) of its business initiatives. The ROIC is comprised of projected earnings beforeinterest and income taxes (“EBIT”) adjusted for income taxes compared to the projected average capitalinvestment required.
EBIT is considered a “non-GAAP financial measure.” Generally, a non-GAAP financial measure is anumerical measure of a company’s financial performance, financial position or cash flows that excludes (orincludes) amounts that are included in (or excluded from) the most directly comparable measure calculatedand presented in accordance with GAAP. EBIT is defined as earnings before interest, income taxes andminority interest. “Earnings” is intended to mean net earnings as presented in the Consolidated Statements ofOperations under GAAP.
The Company believes that EBIT is useful to demonstrate the operational profitability of its segments byexcluding interest and income taxes, which are generally accounted for across the entire Company on aconsolidated basis. EBIT is also one of the measures used by the Company to determine resource allocationwithin the Company. Although the Company believes that EBITenhances understanding of our business and
87
NOTES TO CONSOLIDATED FINANCIAL STATEMENTS — (Continued)

performance, it should not be considered an alternative to, or more meaningful than, net earnings or cashflows from operations as determined in accordance with GAAP.
The following tables show net sales and segment earnings (loss) before interest and income taxes for theCompany’s reporting segments.
Reporting Segments
millions of dollars CustomersInter-
Segment Net
Earnings/(Loss)BeforeInterest
and TaxesYear-EndAssets (d)
Depr./Amort.
Long-LivedAsset
Expenditures (b)
Net Sales
2008Engine . . . . . . . . . . . . . . . $3,837.5 $ 24.0 $3,861.5 $394.9 $3,065.3 $199.4 $231.0Drivetrain . . . . . . . . . . . . . . 1,426.4 — 1,426.4 (4.9) 1,211.8 78.6 112.2Inter-segment
eliminations . . . . . . . . . . — (24.0) (24.0) — — — —
Total . . . . . . . . . . . . . . . 5,263.9 — 5,263.9 390.0 4,277.1 278.0 343.2Corporate(a) . . . . . . . . . . . — — — (52.9) 366.9 8.8 26.5
Consolidated . . . . . . . . . . . $5,263.9 $ — $5,263.9 $337.1 $4,644.0(a) $286.8 $369.7
Restructuring expense . . . . $127.5Goodwill impairment
charge . . . . . . . . . . . . . . 156.8Interest expense and
finance charges . . . . . . . 38.8
Earnings before incometaxes . . . . . . . . . . . . . . . 14.0
Provision for incometaxes . . . . . . . . . . . . . . . 33.3
Minority interest, net oftax. . . . . . . . . . . . . . . . . 16.3
Net earnings (loss) . . . . . . . $ (35.6)
88
NOTES TO CONSOLIDATED FINANCIAL STATEMENTS — (Continued)

millions of dollars CustomersInter-
Segment Net
EarningsBeforeInterest
and TaxesYear-EndAssets (d)
Depr./Amort.
Long-LivedAsset
Expenditures (b)
Net Sales
2007Engine . . . . . . . . . . . . . . . $3,729.8 $ 31.5 $3,761.3 $418.0 $3,357.9 $148.9 $195.6Drivetrain . . . . . . . . . . . . . . 1,598.8 — 1,598.8 118.1 1,294.2 108.2 103.2Inter-segment
eliminations . . . . . . . . . . — (31.5) (31.5) — — — —
Total . . . . . . . . . . . . . . . 5,328.6 — 5,328.6 536.1 4,652.1 257.1 298.8Corporate(a) . . . . . . . . . . . — — — (71.0) 306.4 7.5 4.9
Consolidated . . . . . . . . . . . $5,328.6 $ — $5,328.6 $465.1 $4,958.5(a) $264.6 $303.7(c)
Interest expense andfinance charges . . . . . . . $ 34.7
Earnings before incometaxes . . . . . . . . . . . . . . . $430.4
Provision for incometaxes . . . . . . . . . . . . . . . 113.9
Minority interest, net oftax. . . . . . . . . . . . . . . . . 28.0
Net earnings . . . . . . . . . . . $288.5
millions of dollars CustomersInter-
Segment Net
EarningsBeforeInterest
and TaxesYear-EndAssets (d)
Depr./Amort.
Long-LivedAsset
Expenditures (b)
Net Sales
2006Engine . . . . . . . . . . . . . . . $3,124.0 $ 30.9 $3,154.9 $365.8 $3,103.1 $166.7 $165.1Drivetrain . . . . . . . . . . . . . . 1,461.4 — 1,461.4 90.6 1,191.0 84.1 84.7Inter-segment
eliminations . . . . . . . . . . — (30.9) (30.9) — — — —
Total . . . . . . . . . . . . . . . 4,585.4 — 4,585.4 456.4 4,294.1 250.8 249.8Corporate(a) . . . . . . . . . . . — — — (61.2) 289.9 5.8 12.9
Consolidated . . . . . . . . . . . $4,585.4 $ — $4,585.4 $395.2 $4,584.0(a) $256.6 $262.7(c)
Restructuring expense . . . . $ 84.7Interest expense and
finance charges . . . . . . . 40.2
Earnings before incometaxes . . . . . . . . . . . . . . . $270.3
Provision for incometaxes . . . . . . . . . . . . . . . 32.4
Minority interest, net oftax. . . . . . . . . . . . . . . . . 26.3
Net earnings . . . . . . . . . . . $211.6
89
NOTES TO CONSOLIDATED FINANCIAL STATEMENTS — (Continued)

(a) Corporate assets, including equity in affiliates’, are net of trade receivables securitized and sold to thirdparties, and include cash, deferred income taxes and investments and advances. EBIT includes Equity inAffiliates Earnings, net of tax.
(b) Long-lived asset expenditures include capital expenditures and tooling outlays.
(c) Amounts differ from those shown on the Consolidated Statement of Cash Flows for 2007 and 2006 by($9.8) million and ($5.6) million, respectively, related to expenditures which are included in accountspayable.
(d) Year-end asset totals include goodwill as follows: Engine segment for 2008, 2007 and 2006: $787.8 mil-lion, $902.2 million and $823.5 million, respectively; and Drivetrain segment for 2008, 2007 and 2006:$264.6 million, $266.0 million and $263.0 million, respectively. In addition to acquisitions, the changes inthe carrying amount of goodwill included translation adjustments for the Engine segment of $32.1 million,$30.0 million, and $33.6 million, respectively, for each of the years in the period ended December 31,2008. Translation adjustments for the Drivetrain segment were not significant. Pursuant to the Compa-ny’s assignment of an operating facility previously reported in the Engine segment, goodwill of $105.9 mil-lion has been reclassified to the Drivetrain segment during 2006.
Geographic Information
No country outside the U.S., other than Germany, Hungary and South Korea, accounts for as much as5% of consolidated net sales, attributing sales to the sources of the product rather than the location of thecustomer. Also, the Company’s 50% equity investment in NSK-Warner (see Note 6) amounting to $192.5 mil-lion, $152.2 million and $157.7 million at December 31, 2008, 2007 and 2006, respectively, are excludedfrom the definition of long-lived assets, as are goodwill and certain other non-current assets.
millions of dollars 2008 2007 2006 2008 2007 2006Net Sales Long-lived Assets
United States . . . . . . . . . . . . . . $1,499.6 $1,827.5 $1,819.4 $ 529.3 $ 556.9 $ 603.3Europe:
Germany . . . . . . . . . . . . . . . 1,948.4 1,802.8 1,567.0 546.7 554.6 534.0Hungary . . . . . . . . . . . . . . . . 398.2 302.2 230.7 55.7 42.2 27.9Other Europe . . . . . . . . . . . . 676.1 687.7 454.2 227.1 243.8 167.4
Total Europe . . . . . . . . . . . . . . 3,022.7 2,792.7 2,251.9 829.5 840.6 729.3South Korea . . . . . . . . . . . . . . 251.8 280.3 224.3 63.1 74.9 56.0Other foreign . . . . . . . . . . . . . . 489.8 428.1 289.8 164.3 136.7 100.3
Total . . . . . . . . . . . . . . . . . . . $5,263.9 $5,328.6 $4,585.4 $1,586.2 $1,609.1 $1,488.9
Sales to Major Customers
Consolidated sales included sales to Volkswagen of approximately 19%, 15%, and 13%; to Ford ofapproximately 9%, 12%, and 13%; and to Daimler of approximately 6%, 6%, and 11% for the years endedDecember 31, 2008, 2007 and 2006, respectively. Daimler divested Chrysler in 2007. Both of the Company’sreporting segments had significant sales to all three of the customers listed above. Accounts receivable fromthese customers at December 31, 2008 comprised approximately 23% ($141.2 million) of total accountsreceivable. Such sales consisted of a variety of products to a variety of customer locations and regions. Noother single customer accounted for more than 10% of consolidated sales in any year of the periodspresented.
90
NOTES TO CONSOLIDATED FINANCIAL STATEMENTS — (Continued)

Sales by Product Line
Sales of turbochargers for light-vehicles represented approximately 24%, 21%, and 18% of theCompany’s total revenues for 2008, 2007 and 2006, respectively. The Company currently supplies light-vehicle turbochargers to many OEMs including Volkswagen, Renault, PSA, Daimler, Hyundai, Fiat and BMW.
Sales of rear-wheel drive based transfer cases and components represented approximately 7%, 9% and10% of the Company’s total revenues for 2008, 2007 and 2006, respectively. The Company supplies rear-wheel drive transfer cases to many OEMs including Ford, General Motors, Hyundai and Volkswagen.
No other single product line accounted for more than 10% of consolidated sales in any year of theperiods presented.
Interim Financial Information (Unaudited)
The following information has been adjusted for the November 14, 2007 stock split.
Quarter Ended Mar-31 Jun-30 Sep-30 Dec-31 Year Mar-31 Jun-30 Sep-30 Dec-31 Year
millions of dollars, except per shareamounts 2008 2007
Net sales . . . . . . . . . . . . . . . . . . $1,498.9 $1,516.6 $1,316.9 $ 931.5 $5,263.9 $1,277.8 $1,364.3 $1,313.6 $1,372.9 $5,328.6Cost of sales . . . . . . . . . . . . . . . . 1,215.4 1,237.8 1,114.6 857.6 4,425.4 1,061.9 1,116.7 1,084.9 1,115.2 4,378.7
Gross profit . . . . . . . . . . . . . . . 283.5 278.8 202.3 73.9 838.5 215.9 247.6 228.7 257.7 949.9Selling, general and administrative
expenses . . . . . . . . . . . . . . . . . 155.7 159.9 134.8 92.5 542.9 126.7 135.2 134.1 135.9 531.9Restructuring expense . . . . . . . . . . — — 25.0 102.5 127.5 — — — — —Goodwill impairment charge . . . . . . . — — 146.8 10.0 156.8 — — — — —Other (income) expense . . . . . . . . . 1.1 (2.1) (2.6) 0.5 (3.1) (0.7) (1.2) (3.7) (1.2) (6.8)
Operating income . . . . . . . . . . . . 126.7 121.0 (101.7) (131.6) 14.4 89.9 113.6 98.3 123.0 424.8Equity in affiliate earnings, net of tax . . (9.1) (11.9) (9.2) (8.2) (38.4) (9.2) (8.8) (9.9) (12.4) (40.3)Interest expense and finance
charges . . . . . . . . . . . . . . . . . . 6.5 10.8 11.2 10.3 38.8 8.9 9.3 8.4 8.1 34.7
Income before income taxes andminority interest. . . . . . . . . . . . 129.3 122.1 (103.7) (133.7) 14.0 90.2 113.1 99.8 127.3 430.4
Provision (benefit) for income taxes . . . 33.6 29.8 24.3 (54.4) 33.3 24.4 30.5 10.9 48.1 113.9Minority interest, net of tax . . . . . . . . 7.0 4.8 2.4 2.1 16.3 7.4 6.9 5.7 8.0 28.0
Net earnings (loss) . . . . . . . . . . . . . $ 88.7 $ 87.5 $ (130.4) $ (81.4) $ (35.6) $ 58.4 $ 75.7 $ 83.2 $ 71.2 $ 288.5
Earnings (loss) per share — basic . . . . $ 0.76 $ 0.75 $ (1.12)* $ (0.70)* $ (0.31)* $ 0.50 $ 0.65 $ 0.72 $ 0.61 $ 2.49Earnings (loss) per share — diluted . . . $ 0.75 $ 0.74 $ (1.12)* $ (0.70)* $ (0.31)* $ 0.50 $ 0.64 $ 0.70 $ 0.60 $ 2.45
* The Company had a loss for the quarters ended September 30, 2008, December 31, 2008 and the yearended December 31, 2008. As a result, diluted loss per share is the same as basic loss per share in eachperiod, as any dilutive securities would reduce the loss per share.
91
NOTES TO CONSOLIDATED FINANCIAL STATEMENTS — (Continued)

Selected Financial Datamillions of dollars, except share and per share data
For the Year Ended December 31, 2008 2007 2006 2005 2004 (a)
Statement of Operations DataNet sales . . . . . . . . . . . . . . . . . . . . . . . . $ 5,263.9 $ 5,328.6 $ 4,585.4 $ 4,293.8 $ 3,525.3Cost of sales . . . . . . . . . . . . . . . . . . . . . 4,425.4 4,378.7 3,735.5 3,440.0 2,874.2
Gross profit . . . . . . . . . . . . . . . . . . . . 838.5 949.9 849.9 853.8 651.1Selling, general and administrative
expenses . . . . . . . . . . . . . . . . . . . . . . 542.9 531.9 498.1 495.9 339.0Restructuring expense . . . . . . . . . . . . . . 127.5 — 84.7 — —Goodwill impairment charge . . . . . . . . . . 156.8 — — — —Other (income) expense . . . . . . . . . . . . . (3.1) (6.8) (7.5) 34.8 3.0
Operating income . . . . . . . . . . . . . . . . 14.4 424.8 274.6 323.1 309.1Equity in affiliates’ earnings, net of tax . . (38.4) (40.3) (35.9) (28.2) (29.2)Interest expense, net . . . . . . . . . . . . . . . 38.8 34.7 40.2 37.1 29.7
Earnings before income taxes andminority interest . . . . . . . . . . . . . . . 14.0 430.4 270.3 314.2 308.6
Provision for income taxes . . . . . . . . . . . 33.3 113.9 32.4 55.1 81.2Minority interest, net of tax . . . . . . . . . . . 16.3 28.0 26.3 19.5 9.1
Net earnings (loss) . . . . . . . . . . . . . . . $ (35.6) $ 288.5 $ 211.6 $ 239.6 $ 218.3
Earnings (Loss) per share — basic . . . . . (0.31)* $ 2.49 $ 1.84 $ 2.11 $ 1.95
Average shares outstanding(thousands) — basic . . . . . . . . . . . . . . 116,007 116,002 114,806 113,416 111,744
Earnings (loss) per share — diluted . . . . (0.31)* $ 2.45 $ 1.83 $ 2.09 $ 1.93
Average shares outstanding(thousands) — diluted . . . . . . . . . . . . . 116,007 117,840 115,942 114,796 113,074
Cash dividend declared and paid pershare . . . . . . . . . . . . . . . . . . . . . . . . . $ 0.44 $ 0.34 $ 0.32 $ 0.28 $ 0.25
Balance Sheet DataTotal assets . . . . . . . . . . . . . . . . . . . . . . $ 4,644.0 $ 4,958.5 $ 4,584.0 $ 4,089.4 $ 3,529.1Total debt . . . . . . . . . . . . . . . . . . . . . . . 780.3 636.3 721.1 740.5 584.5
* The Company had a loss for the year ended December 31, 2008. As a result, diluted loss per share is thesame as basic loss per share in the period, as any dilutive securities would reduce the loss per share.
(a) Results exclude BERU, acquired in the first quarter of 2005.
92
NOTES TO CONSOLIDATED FINANCIAL STATEMENTS — (Continued)

Item 9. Changes in and Disagreements with Accountants on Accounting and Financial Disclosure
The Audit Committee of the Company’s Board of Directors solicited proposals from the four majoraccounting firms and conducted an extensive evaluation process in connection with the selection of theCompany’s independent auditor for the fiscal year ending December 31, 2009. Following this process, onOctober 6, 2008, the Audit Committee (i) elected to replace, and thereby dismissed, Deloitte & Touche LLP(“Deloitte”) as its independent auditor for the Company’s fiscal year ending December 31, 2009, and(ii) appointed PricewaterhouseCoopers LLP (“PwC”) to serve as the Company’s independent auditor for2009. Deloitte continued as the Company’s auditor for the fiscal year ending December 31, 2008. With thefiling on February 12, 2009, of the Company’s Annual Report on Form 10-K for the year ended December 31,2008, Deloitte was dismissed as the Company’s independent auditor and the Company’s auditor-clientrelationship with Deloitte effectively ceased.
Deloitte’s audit report dated February 12, 2009, on the Company’s consolidated financial statements forthe fiscal years ended December 31, 2008 and 2007 did not contain an adverse opinion or disclaimer ofopinion, nor was it qualified or modified as to uncertainty, audit scope or accounting principles, except thatthe audit report included an emphasis of a matter indicating that as discussed in Note 1 to the consolidatedfinancial statements, the Company changed its method of accounting in 2007 for income taxes as a result ofadopting FASB Interpretation No. 48, Accounting for Uncertainty in Income Taxes, and in 2006 for definedbenefit pension and other postretirement plans as a result of adopting SFAS No. 158, Employers’ Accountingfor Defined Benefit Pension and Other Postretirement Plans. The audit report of Deloitte dated February 12,2009 on the effectiveness of internal control over financial reporting as of December 31, 2008 did not containan adverse opinion or disclaimer of opinion, nor was it qualified or modified as to uncertainty, audit scope oraccounting principles.
During the Company’s two most recent fiscal years and the subsequent interim period from January 1,2009 through February 12, 2009, (i) there were no disagreements between the Company and Deloitte on anymatters of accounting principles or practices, financial statement disclosure or auditing scope or procedure,which disagreements, if not resolved to the satisfaction of Deloitte, would have caused Deloitte to makereference to the subject matter of the disagreement in its report on the Company’s consolidated financialstatements, and (ii) there were no “reportable events” as that term is defined in Item 304(a)(1)(v) ofRegulation S-K. Deloitte has provided us with a letter stating that they agree that there were no disagreementsduring our last two fiscal years ended and the subsequent interim period from January 1, 2009 throughFebruary 12, 2009, and we filed a copy of such letter under cover of Form 8-K/A within the time periodprescribed by the SEC.
During the two most recent fiscal years and the subsequent interim period from January 1, 2009 throughFebruary 12, 2009, neither the Company nor anyone acting on behalf of the Company, consulted PwCregarding any of the matters or events set forth in Item 3.04(a)(2) of Regulation S-K.
Item 9A. Controls and Procedures
Disclosure Controls and Procedures
The Company has adopted and maintains disclosure controls and procedures that are designed toprovide reasonable assurance that information required to be disclosed in the reports filed under theExchange Act, such as this Form 10-K, is collected, recorded, processed, summarized and reported withinthe time periods specified in the rules of the Securities and Exchange Commission. The Company’sdisclosure controls and procedures are also designed to ensure that such information is accumulatedand communicated to management to allow timely decisions regarding required disclosure. As requiredunder Exchange Act Rule 13a-15, the Company’s management, including the Chief Executive Officer andChief Financial Officer, has conducted an evaluation of the effectiveness of disclosure controls and proce-dures as of the end of the period covered by this report. Based on that evaluation, the Chief Executive Officerand Chief Financial Officer concluded that the disclosure controls and procedures are effective.
93

Management’s Report on Internal Control Over Financial Reporting
The Company’s management is responsible for establishing and maintaining adequate internal controlover financial reporting, as defined in Exchange Act Rule 13a-15(f). The Company’s internal control overfinancial reporting is designed to provide reasonable assurance to the Company’s management and Board ofDirectors regarding the preparation and fair presentation of published financial statements. Managementconducted an assessment of the Company’s internal control over financial reporting based on the frameworkand criteria established by the Committee of Sponsoring Organizations of the Treadway Commission inInternal Control — Integrated Framework. Based on the assessment, management concluded that, as ofDecember 31, 2008, the Company’s internal control over financial reporting is effective based on thosecriteria. The Company’s management report on internal control over financial reporting is set forth on page 44of this report.
The Company’s management, including its Chief Executive Officer and the Chief Financial Officer, doesnot expect that the Company’s disclosure controls and procedures and its internal control processes willprevent all error and all fraud. A control system, no matter how well conceived and operated, can provide onlyreasonable, not absolute, assurance that the objectives of the control system are met. Further, the design of acontrol system must reflect the fact that there are resource constraints, and the benefits of controls must beconsidered relative to their costs. Because of the inherent limitations in all control systems, no evaluation ofcontrols can provide absolute assurance that all control issues and instances of error or fraud, if any, within theCompany have been detected. These inherent limitations include the realities that judgments in decision-making can be faulty, and that breakdowns can occur because of simple error or mistake. Additionally,controls can be circumvented by the individual acts of some persons, by collusion of two or more people, orby management override of the control. The design of any system of controls also is based in part uponcertain assumptions about the likelihood of future events, and there can be no assurance that any design willsucceed in achieving its stated goals under all potential future conditions. Over time, controls may becomeinadequate because of changes in conditions, or the degree of compliance with the policies or proceduresmay deteriorate. Because of the inherent limitations in a cost-effective control system, misstatements due toerror or fraud may occur and may not be detected. However, these inherent limitations are known features ofthe financial reporting process. Therefore, it is possible to design into the process safeguards to reduce,though not eliminate, this risk.
Deloitte and Touche LLP, an independent registered public accounting firm, has audited the Company’sconsolidated financial statements and the effectiveness of internal controls over financial reporting as ofDecember 31, 2008 as stated in their report below.
Changes in Internal Control
There have been no changes in internal controls over the financial reporting that occurred during themost recent fiscal quarter that have materially affected, or are reasonably likely to materially affect our internalcontrols over financial reporting.
94

REPORT OF INDEPENDENT REGISTERED PUBLIC ACCOUNTING FIRM
To the Board of Directors and Stockholders of BorgWarner Inc.Auburn Hills, Michigan
We have audited the internal control over financial reporting of BorgWarner Inc. and ConsolidatedSubsidiaries (the “Company”) as of December 31, 2008, based on criteria established in Internal Control —Integrated Framework issued by the Committee of Sponsoring Organizations of the Treadway Commission.The Company’s management is responsible for maintaining effective internal control over financial reportingand for its assessment of the effectiveness of internal control over financial reporting, included in theaccompanying Management’s Report on Internal Control Over Financial Reporting. Our responsibility is toexpress an opinion on the Company’s internal control over financial reporting based on our audit.
We conducted our audit in accordance with the standards of the Public Company Accounting OversightBoard (United States). Those standards require that we plan and perform the audit to obtain reasonableassurance about whether effective internal control over financial reporting was maintained in all materialrespects. Our audit included obtaining an understanding of internal control over financial reporting, assessingthe risk that a material weakness exists, testing and evaluating the design and operating effectiveness ofinternal control based on the assessed risk, and performing such other procedures as we considerednecessary in the circumstances. We believe that our audit provides a reasonable basis for our opinion.
A company’s internal control over financial reporting is a process designed by, or under the supervisionof, the company’s principal executive and principal financial officers, or persons performing similar functions,and effected by the company’s board of directors, management, and other personnel to provide reasonableassurance regarding the reliability of financial reporting and the preparation of financial statements for externalpurposes in accordance with generally accepted accounting principles. A company’s internal control overfinancial reporting includes those policies and procedures that (1) pertain to the maintenance of records that,in reasonable detail, accurately and fairly reflect the transactions and dispositions of the assets of thecompany; (2) provide reasonable assurance that transactions are recorded as necessary to permit prep-aration of financial statements in accordance with generally accepted accounting principles, and that receiptsand expenditures of the company are being made only in accordance with authorizations of managementand directors of the company; and (3) provide reasonable assurance regarding prevention or timely detectionof unauthorized acquisition, use, or disposition of the company’s assets that could have a material effect onthe financial statements.
Because of the inherent limitations of internal control over financial reporting, including the possibility ofcollusion or improper management override of controls, material misstatements due to error or fraud may notbe prevented or detected on a timely basis. Also, projections of any evaluation of the effectiveness of theinternal control over financial reporting to future periods are subject to the risk that the controls may becomeinadequate because of changes in conditions, or that the degree of compliance with the policies orprocedures may deteriorate.
In our opinion, the Company maintained, in all material respects, effective internal control over financialreporting as of December 31, 2008, based on the criteria established in Internal Control — IntegratedFramework issued by the Committee of Sponsoring Organizations of the Treadway Commission.
We have also audited, in accordance with the standards of the Public Company Accounting OversightBoard (United States), the consolidated financial statements as of and for the year ended December 31, 2008of the Company and our report dated February 12, 2009 expressed an unqualified opinion on those financialstatements.
/s/ DELOITTE & TOUCHE LLP
Detroit, MichiganFebruary 12, 2009
95

Item 9B. Other Information
Not applicable.
PART III
Item 10. Directors, Executive Officers and Corporate Governance
Information with respect to directors, executive officers and corporate governance that appears in theCompany’s proxy statement for its 2009 Annual Meeting of Stockholders under the captions “Election ofDirectors,” “Information on Nominees for Directors and Continuing Directors,” “Board of Directors and ItsCommittees,” “Section 16(a) Beneficial Ownership Reporting Compliance,” “Code of Ethics,” and “Com-pensation Committee Report” is incorporated herein by this reference and made a part of this report.
Item 11. Executive Compensation
Information with respect to director and executive compensation that appears in the Company’sproxy statement for its 2009 Annual Meeting of Stockholders under the captions “Director Compensation,”“Compensation Committee Interlocks and Insider Participation,” “Executive Compensation,” “CompensationDiscussion and Analysis,” “Restricted Stock,” “Long Term Incentives,” and “Change of Control EmploymentAgreements” is incorporated herein by this reference and made a part of this report.
Item 12. Security Ownership and Certain Beneficial Owners and Management and RelatedStockholders Matters
Information with respect to security ownership and certain beneficial owners and management andrelated stockholders matters that appears in the Company’s proxy statement for its 2009 Annual Meeting ofStockholders under the caption “Security Ownership of Certain Beneficial Owners and Management” isincorporated herein by this reference and made a part of this report.
For information regarding the Company’s equity compensation plans that have been approved by itsstockholders and its equity compensation plans that have not been approved by its stockholders, seeItem 5 “Market for the Registrant’s Common Equity, Related Stockholder Matters and Issuer Purchases ofEquity Securities” in this Annual Report on Form 10-K.
Item 13. Certain Relationships and Related Transactions and Director Independence
Information with respect to certain relationships and related transactions and director independence thatappears in the Company’s proxy statement for its 2009 Annual Meeting of Stockholders under the caption“Board of Directors and Its Committees” is incorporated herein by this reference and made a part of thisreport.
Item 14. Principal Accountant Fees and Services
Information with respect to principal accountant fees and services that appears in the Company’s proxystatement for its 2009 Annual Meeting of Stockholders under the caption “Independent Registered PublicAccounting Firm Fees and Services” is incorporated herein by this reference and made a part of this report.
PART IV
Item 15. Exhibits and Financial Statement Schedules
96

SIGNATURES
Pursuant to the requirements of Section 13 or 15(d) of the Securities Exchange Act of 1934, theregistrant has duly caused this report to be signed on its behalf by the undersigned, thereunto dulyauthorized.
BORGWARNER INC.
By: /s/ TIMOTHY M. MANGANELLO
Timothy M. ManganelloChairman and Chief Executive Officer
Date: February 12, 2009
Pursuant to the requirements of the Securities Exchange Act of 1934, this report has been signed belowby the following persons on behalf of the registrant and in the capacities indicated on the 12th day of February,2009.Signature Title
/s/ TIMOTHY M. MANGANELLO
Timothy M. ManganelloChairman and Chief Executive Officer(Principal Executive Officer)
/s/ ROBIN J. ADAMS
Robin J. AdamsExecutive Vice President, Chief FinancialOfficer and Chief Administrative Officer(Principal Financial Officer) and Director(Principal Financial Officer)
/s/ JEFFREY L. OBERMAYER
Jeffrey L. ObermayerVice President and Controller(Principal Accounting Officer)
/s/ PHYLLIS O. BONANNO
Phyllis O. BonannoDirector
/s/ DAVID T. BROWN
David T. BrownDirector
/s/ JERE A. DRUMMOND
Jere A. DrummondDirector
/s/ ALEXIS P. MICHAS
Alexis P. MichasDirector
/s/ ERNEST J. NOVAK, JR.Ernest J. Novak, Jr.
Director
/s/ RICHARD O. SCHAUM
Richard O. SchaumDirector
/s/ THOMAS T. STALLKAMP
Thomas T. StallkampDirector
Dennis C. CuneoDirector
97

EXHIBIT INDEXExhibit
Number Description
3.1 Restated Certificate of Incorporation of the Company (incorporated by reference to Exhibit No. 3.1of the Company’s Quarterly Report on Form 10-Q for the quarter ended March 31, 2008).
3.2 Amended and Restated By-laws of the Company (incorporated by reference to Exhibit No. 3.1 ofthe Company’s Current Report on Form 8-K filed November 18, 2008).
3.3 Certificate of Designation, Preferences and Rights of Series A Junior Participating Preferred Stock(incorporated by reference to Exhibit 3.3 of the Company’s Annual Report on Form 10-K for the yearended December 31, 1999).
3.4 Certificate of Ownership and Merger Merging BorgWarner Inc. into Borg-Warner Automotive, Inc.(incorporated by reference to Exhibit 99.1 of the Company’s Quarterly Report on Form 10-Q for thequarter ended March 31, 2000).
4.1 Indenture, dated as of February 15, 1999, between Borg-Warner Automotive, Inc. and The FirstNational Bank of Chicago (incorporated by reference to Exhibit No. 4.1 to Amendment No. 1 toRegistration Statement No. 333-66879).
4.2 Indenture, dated as of September 23, 1999, between Borg-Warner Automotive, Inc. and ChaseManhattan Trust Company, National Association, as trustee, (incorporated by reference toExhibit No. 4.1 to the Company’s Current Report on Form 8-K filed October 6, 1999).
4.4 First Supplemental Indenture by and between the registrant and The Bank of New York TrustCompany, N.A., as the indenture trustee (incorporated by reference to Exhibit 4.1 to the Company’sCurrent Report on Form 8-K filed on October 30, 2006).
10.1 Credit Agreement dated as of July 22, 2004 among BorgWarner Inc., as Borrower, the LendersParty Hereto, JPMorgan Chase Bank, Administrative Agent, Bank of America, N.A. as SyndicationAgent and Calyon New York Branch (incorporated by reference to Exhibit No. 10.1 to theCompany’s Quarterly Report on Form 10-Q for the quarter ended September 30, 2004).
†10.2 BorgWarner Inc. 2004 Deferred Compensation Plan (as amended and restated).*10.3 Form of BorgWarner Inc. 2004 Stock Incentive Plan, Non-Qualified Stock Option Award Agreement
(incorporated by reference to Exhibit No. 99.1 to the Company’s Current Report on Form 8-K datedJuly 27, 2005).
†10.4 BorgWarner Inc. Amended and Restated 2004 Stock Incentive Plan (as amended and restated).*10.5 Distribution and Indemnity Agreement dated January 27, 1993 between Borg-Warner Automotive,
Inc. and Borg-Warner Security Corporation (incorporated by reference to Exhibit No. 10.2 to theCompany’s Registration Statement on Form S-3 (“no. 33-64934”)).
10.6 Tax Sharing Agreement dated January 27, 1993 between Borg-Warner Automotive, Inc. and Borg-Warner Security Corporation (incorporated by reference to Exhibit No. 10.3 to the Company’sRegistration Statement on Form S-3 (“no. 33-64934”)).
10.7 Second Amended and Restated Receivables Loan Agreement dated as of December 6, 2004Among BWA Receivables Corporation, as Borrower, BorgWarner Inc., as Collection Agent, ABNAMRO Bank N.V., as Agent, the Banks from time to time party thereto, and Windmill FundingCorporation (incorporated by reference to Exhibit 10.10 of the Company’s Annual Report on Form10-K for the year ended December 31, 2005).
10.8 Fourth Amendment dated as of April 25, 2008 to Second Amended and Restated Receivables LoanAgreement.*
10.9 First Amendment dated as of April 29, 2005 to Second Amended and Restated Receivables LoanAgreement (incorporated by reference to Exhibit 10.11 of the Company’s Annual Report onForm 10-K for the year ended December 31, 2005).
10.10 Second Amendment Dated as of April 28, 2006 to Second Amended and Restated ReceivablesLoan Agreement (incorporated by reference to Exhibit No. 10.1 to the Company’s Quarterly Reporton Form 10-Q for the quarter ended June 30, 2006).
†10.11 Borg-Warner Automotive, Inc. Management Incentive Bonus Plan dated January 1, 1994 (asamended and restated).*
A-1

ExhibitNumber Description
†10.12 Borg-Warner Automotive, Inc. Retirement Savings Excess Benefit Plan dated January 27, 1993 (asamended and restated).*
†10.13 Borg-Warner Automotive, Inc. Retirement Savings Plan dated January 27, 1993 as furtheramended and restated effective as of April 1, 1994 (incorporated by reference to Exhibit 10.18to the Company’s Annual Report on Form 10-K for the year ended December 31, 1995).
†10.14 BorgWarner Inc. Board of Directors Deferred Compensation Plan dated April 18, 1995 (as amendedand restated through January 1, 2009).*
†10.15 Form of Amended and Restated Change of Control Employment Agreement for Executive OfficersAmended and Restated.*
10.16 Assignment of Trademarks and License Agreement (incorporated by reference to Exhibit No. 10.0of the Company’s Quarterly Report on Form 10-Q for the quarter ended September 30, 1994).
10.17 Amendment to Assignment of Trademarks and License Agreement (incorporated by reference toExhibit No. 10.23 of the Company’s Form 10-K for the year ended December 31, 1998).
†10.18 Borg-Warner Automotive, Inc. Executive Stock Performance Plan, Revised and Re-approvedFebruary 2, 2000 (incorporated by reference to Appendix B of the Company’s Proxy Statementdated March 22, 2000 for its 2000 Annual Meeting of Stockholders).
†10.19 BorgWarner Inc. 2005 Executive Incentive Plan (as amended and restated).*†10.20 Form of BorgWarner Inc. 2004 Stock Incentive Plan Performance Share Award Agreement
(incorporated by reference to Exhibit 10.1 of the Company’s Current Report on Form 8-K datedFebruary 7, 2005).
†10.21 Form of BorgWarner Inc. Amended and Restated 2004 Stock Incentive Plan Restricted StockAgreement for Employees (incorporated by reference to Exhibit 10.1 of the Company’s CurrentReport on Form 8-K dated February 7, 2008).
10.22 BorgWarner Inc. 1993 Stock Incentive Plan, as amended.*10.23 Domination and Profit Transfer Agreement between BorgWarner Germany GmbH and BERU AG
dated March 7, 2008 (incorporated by reference to Exhibit 10.1 to the quarterly report filed onForm 10-K for the quarter ended June 30, 2008).
21.1 Subsidiaries of the Company.*23.1 Independent Registered Public Accounting Firm’s Consent.*31.1 Rule 13a-14(a)/15d-14(a) Certification by Chief Executive Officer.*31.2 Rule 13a-14(a)/15d-14(a) Certification by Chief Financial Officer.*32.1 Section 1350 Certifications.*
* Filed herewith.
† Indicates a management contract or compensatory plan or arrangement required to be filed pursuant toItem 14(c).
A-2


BorgWarner Inc.World Headquarters2850 Hamlin RoadAuburn Hills, MI 48326www.borgwarner.com
BW5365_AR 2008 Letter_FINAL.B&W.10K VER2.indd 1-2 3/2/09 4:56 PM