bot budget presentation -final draft-revised - university of kentucky
TRANSCRIPT

1

Directives set at the October 2011 BOT retreat…
1. Improve undergraduate education2. Initiate renewing 150‐year‐old campus facilities
2

The 2012‐2013 Operating and Capital Budget identifies how we will spend resources to advance goals priorities identified in the University’s strategic plan
Goal 1: Prepare students for leading roles in an innovation‐driven economy and global society
Goal 2: Promote research and creative work to increase the intellectual, social, and economic capital of Kentucky and the world beyond its border
Goal 3: Develop the human and physical resources of the University to achieve the institution’s Top 20 goals
Goal 4: Promote diversity and inclusion
Goal 5: Improve the quality of life of Kentuckians through engagement, outreach and service
3

2012‐2014 Budget DevelopmentGuiding Principles
• Affordability for students and their families• Protecting as much as possible the teaching of students• Ensuring that direct patient care is not compromised• Finding ways to invest in our people• Finding ways to invest in our campus ‐‐ better living, learning, research and work space of our faculty, students and staff
• Flexibility and longer‐term planning with biennial budget
• Support excellence and improvement
4

Budget Development TimelineDate ActivityFall 2011 Budget development process began with collecting revenue estimates; fixed
cost increases; and programmatic budget requests
Jan 3 General Assembly convened
Jan 4 Governor’s Budget Address
March 30 General Assembly enacted a budget
April 11 Governor approved budget with line‐item vetoes not impacting UK appropriation
April 20 CPE adopted tuition parameters
May 1 Units submitted preliminary FY13 reallocation plans for review
May 8 UK Board of Trustees approved 2012‐13 tuition and fee rates
June 19 Board of Trustees approves FY 2012‐13 Operating and Capital Budget
June 21 CPE approves 2012‐13 tuition and fee rates
5

$295$289
$288$280
$306$312
$335
$310 $311
$307$303
$200
$220
$240
$260
$280
$300
$320
$340
University of KentuckyState Appropriations Support (in millions)
Actual Original Budget
$284 $284
*Includes ARRA funds of $21.1 million in 2009‐10 and $17.3 million in 2010‐11
Revenues
6
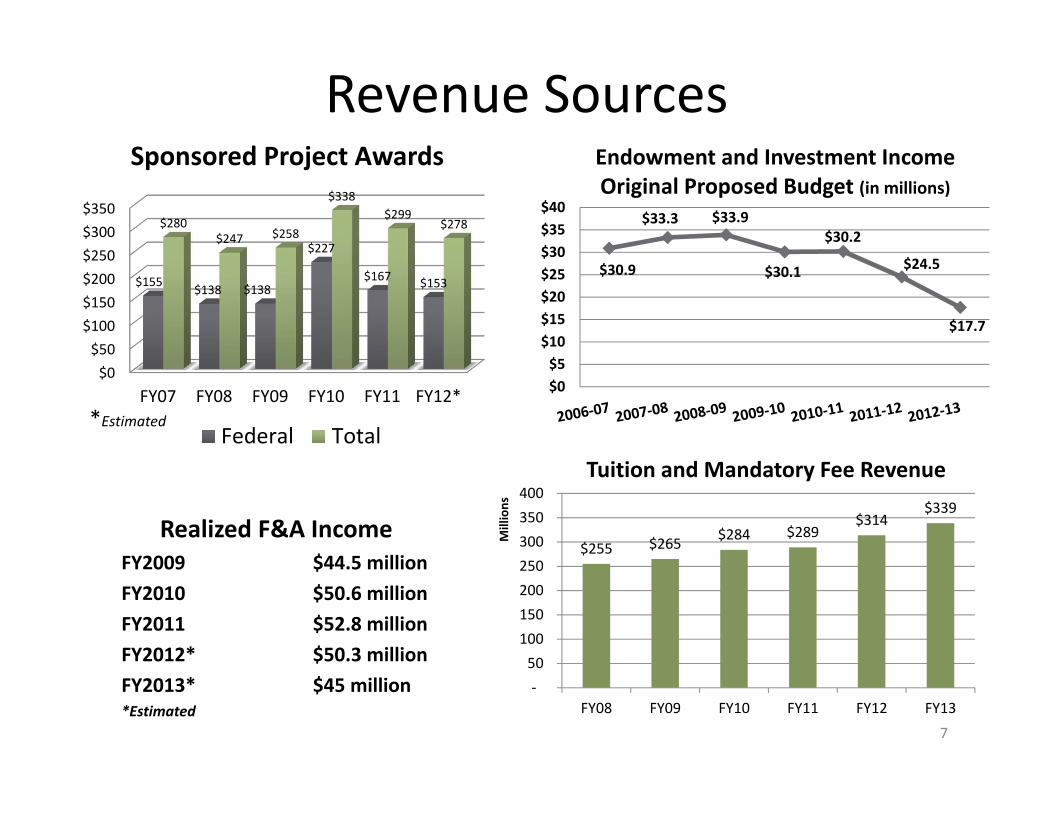
Revenue Sources
$0$50
$100$150$200$250$300$350
FY07 FY08 FY09 FY10 FY11 FY12*
$155 $138 $138
$227
$167 $153
$280$247 $258
$338$299
$278
Sponsored Project Awards
Federal Total*Estimated
$30.9
$33.3 $33.9
$30.1
$30.2
$24.5
$17.7
$0$5
$10$15$20$25$30$35$40
Endowment and Investment IncomeOriginal Proposed Budget (in millions)
Realized F&A IncomeFY2009 $44.5 millionFY2010 $50.6 millionFY2011 $52.8 millionFY2012* $50.3 millionFY2013* $45 million*Estimated
Tuition and Mandatory Fee Revenue
$255 $265 $284 $289$314
$339
‐ 50
100 150 200 250 300 350 400
FY08 FY09 FY10 FY11 FY12 FY13
Millions
7

Student Profile
Status Residency Classification
Part‐time3,010
Non‐resident 7,008
Full‐time25,084
Resident 21,086
Grad/Prof7,942
FTFR*4,139
Other UG16,013
Fall 2011
*FTFR – First‐time freshman 3,8654,110 4,153 4,328 4,139 4,500
4,800
‐
500
1,000
1,500
2,000
2,500
3,000
3,500
4,000
4,500
5,000
Fall First‐time Freshman Cohort
Non‐Resident ResidentFall 07 Fall 08 Fall 09 Fall 10 Fall 11 Fall 12 Fall 13
8

Student Profile(Cost and Affordability)
Percentage ChangeUnder‐graduateResident Annual
4 Year Average
03‐04 $ 2,274 14.4%04‐05 $ 2,583 13.6%05‐06 $ 2,906 12.5%
06‐07 $ 3,255 12.0% 13.1%07‐08 $ 3,548 9.0% 11.8%08‐09 $ 3,868 9.0% 10.6%09‐10 $ 4,062 5.0% 8.8%10‐11 $ 4,305 6.0% 7.3%11‐12 $ 4,564 6.0% 6.5%12‐13 $ 4,843 6.0% 5.8%13‐14* $ 4,983 3.0% 5.3%
*Preliminary
$(948)
$1,209
$2,250 $2,476
$(1,000)
$(500)
$‐
$500
$1,000
$1,500
$2,000
$2,500
$3,000
Lowest AvgFamily Income
$14,544
Low‐Mid AvgFamily Income
$56,873
Mid‐HighFamily Income
$94,191
Highest AvgFamily Income
$171,293
Average gross tuition and mandatory fees billed = $4,579 based on full‐time dependent undergraduate Kentucky resident student and does not includecosts for room and board or other ancillary costs associated with attendance.Net tuition is calculated as the total tuition and mandatory fees billed less total student financial aid from all scholarships & grants. Student loans or work study wages are not included in financial aid amount.
Fall 2011 Full‐time Dependent Undergraduate Kentucky ResidentsAverage Net tuition by Income Quartile
(8,219 students)
9
Tuition & Mandatory Fees Per Semester Rate

University of KentuckyConsolidated Budget (in billions)
$1.3$1.5
$1.8
$2.2$2.5
$2.7 $2.6
$0.0
$0.5
$1.0
$1.5
$2.0
$2.5
$3.0
37%
40%
7%16% Hospital
General Fund
Auxiliary Fund
Restricted
Revenues
48%
42%
5%2%3% Expenditures
Personnel
Operating Expenses
Student Financial Aid
Capital Outlay
Debt Service
The decline in the UK consolidated budget from FY 2011‐12 to FY 2012‐13 is primarily the result of a reduction in projected fund balances and a change in GASB accounting practices regarding the reporting of bad debt expense, both of which are related to UK HealthCare. FY 2011‐12 included an exceptionally high level of fund balances due to the timing of the receipt of patient care reimbursements from prior years during May and June 2011. As a result of the accounting change, patient care revenues are reflected net of bad debt expense effective with FY 2012‐13. In prior years, patient care revenues were reported gross and bad debt was reported as an operating expense. This change in the accounting practice created a $139 million variance in revenues and expenses. If the accounting practice had not changed, the FY 2012‐13 consolidated budget would have increased by $59 million over the FY 2011‐12 budget instead of decreasing by $80 million.
10

Where the money comes from and what it pays for2012‐13 Operating Budget ‐ $2.6 Billion)
6%
13%7%
Auxiliary Funds
Money comes from:• UK Athletics • Housing• Dining• Parking
Pays for:• Self‐supportingauxiliary units pay all theirexpensesand receive no taxpayer or tuitionsupport
Restricted Funds
Money comes from:• Research grants and contracts
• Endowment income• Gifts• Federal and state student aid
Pays for:• Research• Scholarships• Public service
Fund Balance
Money comes from:• Savings from prior years
Pays for:• Capital projects• Faculty start‐up packages• Pilot programs
11

Where the money comes from and what it pays for2012‐13 Operating Budget ‐ $2.6 Billion
51%
23%Undesignated General Funds
Money comes from:• State appropriations• Tuition• Investment income• Service assessments
Pays for:• Instruction• Public service• Administrative support• Scholarships
Designated GeneralFunds
Money comes from:• UK HealthCare• County
appropriations• Mandatory fees• Course and
program fees
Pays for:• Public service• Instruction• Student Services• Academic Support 12
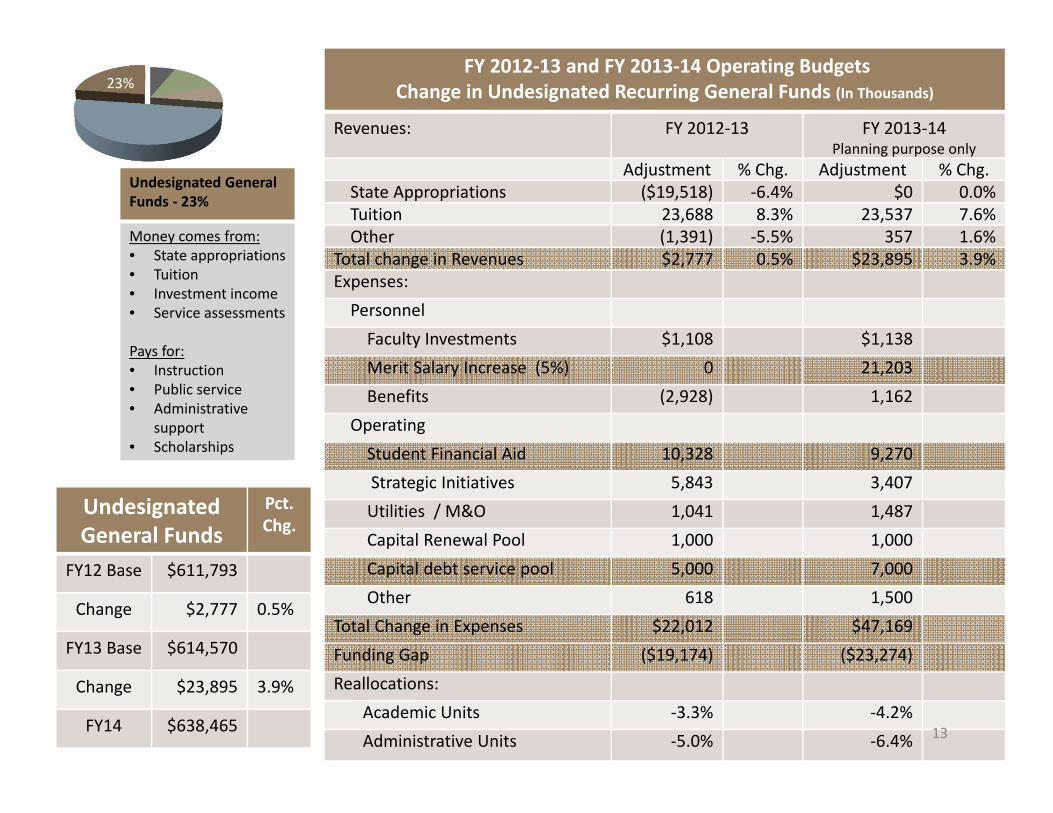
FY 2012‐13 and FY 2013‐14 Operating BudgetsChange in Undesignated Recurring General Funds (In Thousands)
Revenues: FY 2012‐13 FY 2013‐14 Planning purpose only
Adjustment % Chg. Adjustment % Chg.State Appropriations ($19,518) ‐6.4% $0 0.0%Tuition 23,688 8.3% 23,537 7.6%Other (1,391) ‐5.5% 357 1.6%
Total change in Revenues $2,777 0.5% $23,895 3.9%Expenses:PersonnelFaculty Investments $1,108 $1,138Merit Salary Increase (5%) 0 21,203Benefits (2,928) 1,162
OperatingStudent Financial Aid 10,328 9,270Strategic Initiatives 5,843 3,407Utilities / M&O 1,041 1,487Capital Renewal Pool 1,000 1,000Capital debt service pool 5,000 7,000Other 618 1,500
Total Change in Expenses $22,012 $47,169Funding Gap ($19,174) ($23,274)Reallocations:
Academic Units ‐3.3% ‐4.2%Administrative Units ‐5.0% ‐6.4%
Undesignated General Funds
Pct. Chg.
FY12 Base $611,793
Change $2,777 0.5%
FY13 Base $614,570
Change $23,895 3.9%
FY14 $638,465
23%
Undesignated General Funds ‐ 23%
Money comes from:• State appropriations• Tuition• Investment income• Service assessments
Pays for:• Instruction• Public service• Administrative
support• Scholarships
13

2012‐13 Operating BudgetNew or enhanced investments in support of Strategic Plan goals
14
Area Investment(in thousands) Goal 1:
StudentsGoal 2: Research
Goal 3: Faculty, Staff and Facilities
Goal 4: Diversity
Goal 5: Service
Faculty investments (promotions & fighting fund) $1,108 Benefits* ($2,928) Student Scholarship Investments $10,328 Academic Readiness $530 Development staffing initiative $675 Emergency preparedness/planning $120 Enrollment Management investments $1,814 Information technology investments $750 Quality Enhancement Program / SACS $285
TIIF and Summer $2,150 Facility M&O $1,041 Capital renewal $1,000 Capital debt service pool $5,000 Other $139 Total Net Investments $22,012 *Benefits credit is a result of net of a savings created from an updated rate calculation. Employee benefit package was not reduced.

University of KentuckyCurrent Funds Revenue Budget (in thousands)
2011‐12 2012‐13 Change Pct. Chg.
Recurring:Undesignated General Funds $611,793 $614,571 $2,777 0.5%Designated General Funds $1,330,367 $1,298,202 ($32,165)* ‐2.4%Auxiliary Funds $162,137 $170,077 $7,939 4.9%Restricted Funds $343,112 $342,820 ($292) ‐0.1%
Non‐recurring:Fund Balances $251,346 $192,706 ($58,639)* ‐23.3%
Total $2,698,757 $2,618,377 ($80,379) ‐3.0%
*The decline in the UK consolidated budget from FY 2011‐12 to FY 2012‐13 is primarily the result of a reduction in projected fund balances and a change in GASB accounting practices regarding the reporting of bad debt expense, both of which are related to UK HealthCare. FY 2011‐12 included an exceptionally high level of fund balances due to the timing of the receipt of patient care reimbursements from prior years during May and June 2011. As a result of the accounting change, patient care revenues are reflected net of bad debt expense effective with FY 2012‐13. In prior years, patient care revenues were reported gross and bad debt was reported as an operating expense. This change in the accounting practice created a $139 million variance in revenues and expenses. If the accounting practice had not changed, the FY 2012‐13 consolidated budget would have increased by $59 million over the FY 2011‐12 budget instead of decreasing by $80 million.
15

2012‐13 Consolidated Budget
12.8%
10.6%
12.1%
0.9%4.1%
1.5%
5.7%
2.8%4.7%0.7%
6.9%
37.2%
InstructionResearchPublic ServiceLibrariesAcademic SupportStudent ServicesInstitutional SupportOperations & MaintenanceStudent Financial AidDebt ServiceAuxiliary ServicesHospital
4.3%
34.0%
5.5%0.9%
37.8%
6.0%
11.5%
PresidentProvost & CollegesEVPFAResearchUK HealthCareUniversity WideAffiliated Corporations
47.9%
41.9%
4.8%
2.4% 3.0%
Personnel Services
Operating Expenses
Student Financial Aid
Capital Outlay
Mandatory Transfers
Major Function Organization Natural Object
16
s
2012‐13 Operating and Capital Budget Book and Other Budget Information
http://www.uky.edu/OPBPA/
17