bourne and sagamore bridges cape cod canal, massachusetts
TRANSCRIPT
Bourne and Sagamore Bridges Cape Cod Canal, Massachusetts
Major Rehabilitation Evaluation Report
Appendix C
Cost Engineering
March 2020

THIS PAGE LEFT INTENTIONALLY BLANK

Table of Contents COST ENGINEERING ...................................................................................................................................... 1 1.0 COST NARRATIVE ................................................................................................................................... 1 2.0 PROJECT DESCRIPTION ........................................................................................................................... 1 3.0 ALTERNATIVES ........................................................................................................................................ 2
3.1 ALTERNATIVES ELIMINATED FROM FURTHER CONSIDERATION ................................................... 2 3.2 ALTERNATIVES CONSIDERED FOR FURTHER EVALUATION ............................................................ 3 3.3 BRIDGE REHABILITATION ALTERNATIVE ........................................................................................ 3 3.4 BRIDGE REPLACEMENT ALTERNATIVE ........................................................................................... 4
4.0 ALTERNATIVES ROM CONSTRUCTION COST ESTIMATES ....................................................................... 6 6.0 BASIS OF ESTIMATE ................................................................................................................................ 6
6.1 ASSUMED CONSTRUCTION METHODOLOGY ................................................................................. 6 6.2 COST DATA SOURCES ..................................................................................................................... 7 6.2 MAJOR ASSUMPTIONS ................................................................................................................... 8 6.3 MAJOR RISKS .................................................................................................................................. 8
7.0 SCHEDULE ............................................................................................................................................... 9 8.0 CONTINGENCY ........................................................................................................................................ 9 9.0 PLANNING, ENGINEERING, AND DESIGN (PED) ..................................................................................... 9 10.0 CONSTRUCTION MANAGEMENT (S&A) ............................................................................................. 10 11.0 CONDITIONAL COST CERTIFICATION AND TOTAL PROJECT COST SUMMARIES ................................ 10 List of Tables Table C1: Rehabilitation Timeline ................................................................................................................ 4 Table C2: Alternative ROM Cost Estimate Summary .................................................................................. 6
List of Figures
Figure C1: Bridge Replacement Locations ................................................................................................... 5

THIS PAGE LEFT INTENTIONALLY BLANK

C -1
COST ENGINEERING 1.0 COST NARRATIVE Corps of Engineers cost estimates for planning purposes are prepared in accordance with the following guidance:
• Engineer Technical Letter (ETL) 1110-2-573, Construction Cost Estimating Guide for Civil Works, 30 September 2008
• Engineer Regulation (ER) 1110-1-1300, Cost Engineering Policy and General Requirements, 26 March 1993
• ER 1110-2-1302, Civil Works Cost Engineering, 15 September 2008 • ER 1110-2-1150, Engineering and Design For Civil Works Projects, 31 August 1999 • ER 1105-2-100, Planning Guidance Notebook, 22 April 2000, as amended • Engineer Manual (EM) 1110-2-1304 (Tables revised 30 March 2007), Civil Works Construction Cost
Index System, 31 March 2013 • CECW-CP Memorandum For Distribution, Subject: Initiatives To Improve The Accuracy Of Total
Project Costs In Civil Works Feasibility Studies Requiring Congressional Authorization, 19 Sep 2007 • CECW-CE Memorandum For Distribution, Subject: Application of Cost Risk Analysis Methods To
Develop Contingencies For Civil Works Total Project Costs, 3 Jul 2007 • Cost and Schedule Risk Analysis Guidance, 17 May 2009
The goals of the Cost Engineering Section for the Major Rehabilitation Evaluation Report are to present a Total Project Cost (construction and non-construction costs) for the Bridge Rehabilitation Alternative and Bridge Replacement Alternative at the current price level to be used in determining the economically efficient rehabilitation strategy. In addition, the costing efforts are intended to produce a final product, or cost estimate, that is reliable and accurate and that supports the definition of the Government’s obligations. The cost estimates are screening level detail for the purposes of the decision to either rehabilitate or replace the bridges and are not intended, nor adequate, to be used for project budgeting. 2.0 PROJECT DESCRIPTION The Major Rehabilitation Evaluation Study (MRES) will develop and prepare a Major Rehabilitation Evaluation Report (MRER) to develop the engineering requirements, costs, and associated consequences for rehabilitation of the Bourne and Sagamore bridges to determine the economically efficient rehabilitation strategy. The MRES will evaluate the existing condition and reliability of both the Bourne and Sagamore highway bridges of the Cape Cod Canal, MA Federal Navigation Project (FNP). The study will identify the timeline and budget requirements necessary to maintain satisfactory performance of the two bridges, and determine if restoration of the bridges can significantly improve their reliability and extend their physical life. Should the results of the evaluation demonstrate that rehabilitation was not a likely practicable long-term solution, then bridge replacement would need to be considered and alternative replacement plans developed. The MRES would thus include detailed analysis and evaluation of the alternatives for both rehabilitation and replacement, and a direction forward. The analysis will follow the guidance outlined in ER/EP 1130-2-500 and will result in a Major Rehabilitation Evaluation
C -2
Report (MRER). The MRER will look at all alternatives over a 50-year study period as determined by the ER/EP.
The major rehabilitation report compares the base condition against various maintenance scenarios. The base condition assumes that the existing O&M practices continue with emergency repairs of failed components as they occur, or “Fix-as-Fails” baseline. The rehabilitation alternative includes scheduled replacement of major bridge components to avoid emergency repair. The MRER will also include bridge replacement as an alternative for comparison.
3.0 ALTERNATIVES A number of alternatives were initially considered during the early stages of the major rehabilitaton evaluation. These alternatives included: a program of repair and major rehabilitation for both bridges, replacement of one or both bridges with four lanes each, replacement of one or both bridges with four through-traffic lanes and two acceleration/deceleration lanes each, replacement of both bridges with a single bridge, construction of a new third highway bridge by others, replacement of one or both bridges with a tunnel(s), replacement of one or both bridges with low level draw spans or causeways, and finally deauthorization and closure of the canal. These initial alternatives were evaluated and screened to reduce the list to only those plans which in terms of likely cost, impacts on the marine and land transportation systems, traffic and environmental impacts, and overall practicability would be implementable.
3.1 ALTERNATIVES ELIMINATED FROM FURTHER CONSIDERATION Several of the initial alternatives were eliminated from further consideration prior to requiring cost estimate development. The replacement of one or both bridges with a single bridge was screened out due to the need for extensive redesign of the local surface roads and regional highway connections on both the Cape and mainland sides of the Canal. This would require significant real estate takings includes lands from the Massachusetts Military Reservation as well as wetlands alternations and rerouting of utility corridors. The construction of a new third highway bridge by others was screened out due to the fact that USACE has no authority to construct a third highway bridge over the Canal and this alternative would not address the need to continue with repairs and ultimately rehabilitation or replacement of the existing bridge structures as they continue to age. The replacement of one or both bridges with low level draw spans was screened out as they would eliminate the Canal as a navigable channel for deep draft commercial vessels. This would also require construction and expansion of moorings and anchorage areas so the smaller vessels could queue for bridge openings which would also impact vehicular traffic. Similarly, the replacement of one or both bridges with low level causeways was screened out as it would eliminate the Canal as a navigable waterway for all but the smallest recreational craft. Both the low level draw spans and causeways would require most if not all cargo and military vessels and all commercial and military vessels, respectively, to return to the ocean route around the Cape, Islands, and shoals and banks when transitioning between northern New England and ports to the west and south. The alternative to deauthorize and close the canal was screened out as it would eliminate the Canal as a navigable waterway entirely and all navigation between northern New England and ports to the west and south would be required to
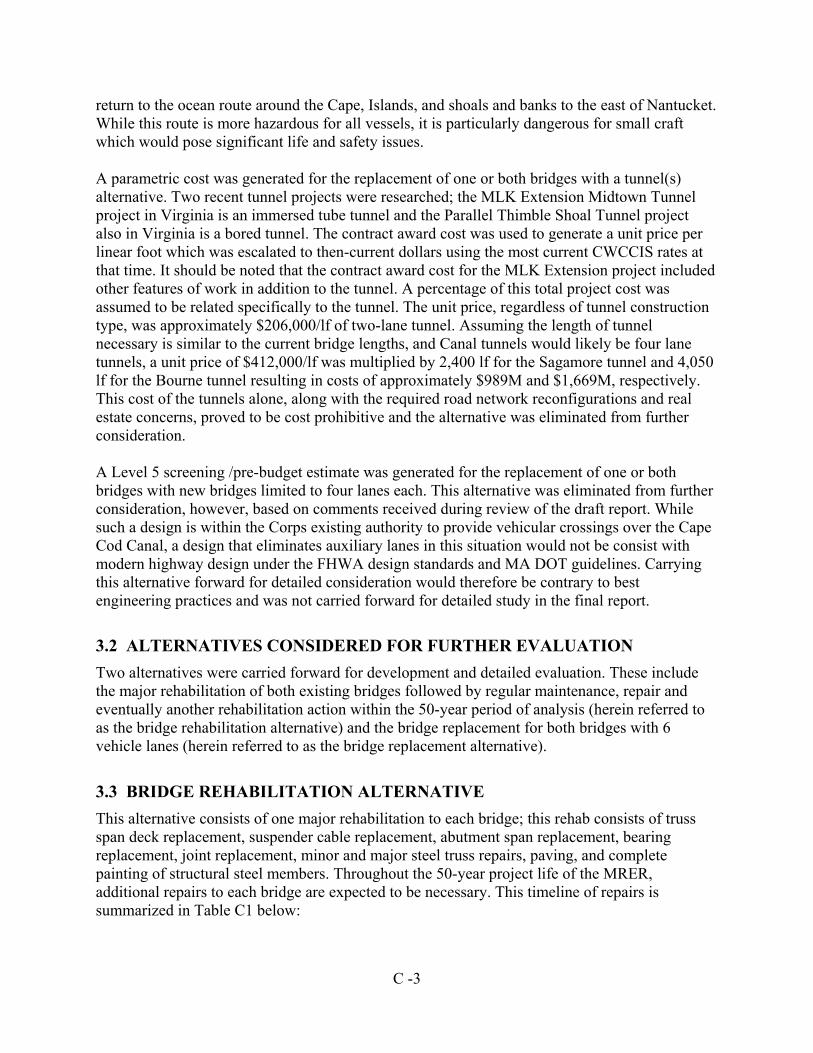
C -3
return to the ocean route around the Cape, Islands, and shoals and banks to the east of Nantucket. While this route is more hazardous for all vessels, it is particularly dangerous for small craft which would pose significant life and safety issues. A parametric cost was generated for the replacement of one or both bridges with a tunnel(s) alternative. Two recent tunnel projects were researched; the MLK Extension Midtown Tunnel project in Virginia is an immersed tube tunnel and the Parallel Thimble Shoal Tunnel project also in Virginia is a bored tunnel. The contract award cost was used to generate a unit price per linear foot which was escalated to then-current dollars using the most current CWCCIS rates at that time. It should be noted that the contract award cost for the MLK Extension project included other features of work in addition to the tunnel. A percentage of this total project cost was assumed to be related specifically to the tunnel. The unit price, regardless of tunnel construction type, was approximately $206,000/lf of two-lane tunnel. Assuming the length of tunnel necessary is similar to the current bridge lengths, and Canal tunnels would likely be four lane tunnels, a unit price of $412,000/lf was multiplied by 2,400 lf for the Sagamore tunnel and 4,050 lf for the Bourne tunnel resulting in costs of approximately $989M and $1,669M, respectively. This cost of the tunnels alone, along with the required road network reconfigurations and real estate concerns, proved to be cost prohibitive and the alternative was eliminated from further consideration. A Level 5 screening /pre-budget estimate was generated for the replacement of one or both bridges with new bridges limited to four lanes each. This alternative was eliminated from further consideration, however, based on comments received during review of the draft report. While such a design is within the Corps existing authority to provide vehicular crossings over the Cape Cod Canal, a design that eliminates auxiliary lanes in this situation would not be consist with modern highway design under the FHWA design standards and MA DOT guidelines. Carrying this alternative forward for detailed consideration would therefore be contrary to best engineering practices and was not carried forward for detailed study in the final report.
3.2 ALTERNATIVES CONSIDERED FOR FURTHER EVALUATION Two alternatives were carried forward for development and detailed evaluation. These include the major rehabilitation of both existing bridges followed by regular maintenance, repair and eventually another rehabilitation action within the 50-year period of analysis (herein referred to as the bridge rehabilitation alternative) and the bridge replacement for both bridges with 6 vehicle lanes (herein referred to as the bridge replacement alternative).
3.3 BRIDGE REHABILITATION ALTERNATIVE This alternative consists of one major rehabilitation to each bridge; this rehab consists of truss span deck replacement, suspender cable replacement, abutment span replacement, bearing replacement, joint replacement, minor and major steel truss repairs, paving, and complete painting of structural steel members. Throughout the 50-year project life of the MRER, additional repairs to each bridge are expected to be necessary. This timeline of repairs is summarized in Table C1 below:

C -4
Table C1: Rehabilitation Timeline
Sagamore Bridge Rehabilitation Timeline Year Repair
2025-2027 Major Rehabilitation 2032 Maintenance Painting 2033 Joint Replacement 2039 Maintenance Painting 2040 Paving and Joint Replacement 2045 Complete Painting 2047 Joint Replacement 2052 Maintenance Painting 2055 Paving and Joint Replacement 2059 Maintenance Painting 2065 Truss Deck Replacement, Floorbeam Repairs, Major
Steel Repairs, Complete Painting, and Joint Replacement
Bourne Bridge Rehabilitation Timeline Year Repair
2029-2031 Major Rehabilitation 2036 Maintenance Painting 2037 Joint Replacement 2043 Maintenance Painting 2044 Paving and Joint Replacement 2049 Complete Painting 2051 Joint Replacement 2056 Maintenance Painting 2059 Paving and Joint Replacement 2063 Maintenance Painting 2069 Truss Deck Replacement, Floorbeam Repairs, Major
Steel Repairs, Complete Painting, Joint Replacement
Because of the existing and anticipated future conditions of the bridges, approximately 40 years after the initial major rehab of each bridge, another significant repair is expected. This repair consists of truss span deck replacement, floorbeam repairs, major steel repairs, joint replacement, and complete painting of structural steel of each bridge.
3.4 BRIDGE REPLACEMENT ALTERNATIVE This alternative consists of the replacement of each bridge with a new cable-stayed -lane bridge with two on/off auxiliary lanes to assist motorists with acceleration and deceleration on and off the bridges to connect with local roads. Presently the right-hand travel lane in each direction

C -5
doubles as the acceleration/deceleration lane which limits unrestricted through traffic flow to one lane in each direction. Adding dedicated acceleration/deceleration lanes to the bridge decks should further ease both through and entering/existing traffic. The replacement bridges would be constructed using the latest safety guidelines from MUTCD and FHWA as far as lane widths, shoulders, sidewalks, etc. For the purposes of this study, it is assumed that the new bridges would be located adjacent to and inshore of the existing bridges, as shown in Figure C1.
Figure C1: Bridge Replacement Locations
These new alignments of the bridges will necessitate significant alterations to the approaches and departures to and from each bridge. The replacement alternatives include demolition of the existing bridges upon completion of the replacements as well as major repair costs every 20 years over the 50-year study period. The major repair costs were assumed necessary and obtained from Philadelphia District and are based off the SR-1 Bridge which is also a cable-stayed bridge of similar length and lane configuration to those proposed in this project. Philadelphia District issued a contract for major repairs approximately 20 years after completion of their bridge. These repairs included cleaning the concrete surface, box girder repairs, drainage repairs, etc. It should be noted these major repair costs will vary in frequency and cost depending on the type of replacement bridge. For the purposes of this study, a cable-stayed bridge was investigated. However, any bridge replacement would require further investigation to ascertain the most economical and favorable bridge type. These conceptual cable-stayed bridges are based on the SR-1 bridge over the Chesapeake and Delaware Canal in Delaware. This bridge type was chose for this study, in part, because it is a USACE-owned bridge over a marine navigation canal (the Chesapeake and Delaware Canal) of similar proportions to the Cape Cod Canal. It provides an alternative similar to what would be required for a new bridge to cross our Canal. A replacement bridge type and

C -6
design have not been accomplished for this study. The bridge replacements described in the Structural Appendix are only representative of what could be used as a replacement structure. 4.0 ALTERNATIVES ROM CONSTRUCTION COST ESTIMATES Rough Order of Magnitude (ROM) construction cost estimates for the two alternatives were developed using quantities provided by the Project Delivery Team (PDT), specifically the Corps of Engineers New England District (CENAE) Structural Engineering Design Section. These quantities were then applied to parametric unit costs that were based upon historical data such as bid abstracts for previously solicitated projects and previously developed construction cost estimates for similar repair work on the Sagamore and/or Bourne Bridges or used along with RSMeans, MII Cost Libraries, and vendor quotations to create new parametric construction cost estimates. The MCACES MII cost estimates are provided as Attachment 1 to this Cost Engineering Appendix. A Cost and Schedule Risk Analysis (CSRA) was performed for each alternative to identify and assess potential risks associated with this project. Table C2 summarizes these ROM costs, presented as the Project First Costs, along with the contingency for each alternative and each bridge developed in the CSRA. Table C2: Alternative ROM Cost Estimate Summary
Project First Costs (FY20) – Sagamore Bridge Construction $ Contingency
% Contingency $ Total
Rehabilitation Alternative
257,997,000 43% 110,939,000 368,936,000
Replacement Alternative 350,174,000 44% 151,722,000 501,895,000 Project First Costs (FY20) – Bourne Bridge
Construction $ Contingency %
Contingency $ Total
RehabilitationAlternative 284,778,000 43% 122,455,000 407,233,000 Replacement Alternative 508,360,000 44% 221,315,000 729,675,000
6.0 BASIS OF ESTIMATE 6.1 ASSUMED CONSTRUCTION METHODOLOGY The assumed construction methodology for both the rehabilitation and replacement alternatives is largely via land-based plant(s). It is assumed there is significant marine traffic in the Canal that would prohibit a majority of the work be done via marine-based plant(s); however, a marine-based plant was included as support equipment for a one-year duration during both the rehabilitation and replacement construction at each bridge location. For the rehabilitation alternatives, there are partial and limited full lane closures on the bridges expected in each spring and fall construction season over the anticipated 3.25-year construction duration per bridge which will result in significant travel delays. There are no delays expected with the construction of the replacement bridges as the existing bridges will be in full operation over the 5-year construction duration per bridge. The bridge rehabilitations are expected to rely on truck-mounted cranes and scissor lifts for above-deck activities and snooper trucks and cable-

C -7
suspended scaffolding for below-deck activities. The bridge replacements, if cable-stayed bridges are ultimately selected, are expected to be constructed using the span-by-span method with an over-head gantry. The superstructure is expected to be erected in one direction cantilever using large ~250 ton cranes. 6.2 COST DATA SOURCES The construction cost estimates were developed using Micro-Computer Aided Cost Estimating System (MCACES), Second Generation (MII) using the appropriate Work Breakdown Structure (WBS). The rehabilitation construction cost is based on cost estimates for each of the individual ten repairs that make up the rehab. These cost estimates were developed utilizing cost resources such as RSMeans, MII Cost Libraries, and historical project costs and are supported by the preferred labor, equipment, materials, and crew/production breakdown. The replacement construction cost is based on bridge construction estimates for smaller projects scaled up to match the scope of this project. Specific features of work relative to the example cable-stayed bridge type were then added to the estimate. The unit cost for demolition of the existing bridges is based on a document from Florida Department of Transportation (FDOT) with bridge demolition costs from 2014. The document provides a range of demo costs, which were averaged, and an area cost factor applied from the latest PAX newsletter to bring the demo cost to current dollars more representive of the study area. The costs associated with the approaches to the new bridges are based on unit cost information provided by Massachusetts Department of Transportation (MASSDOT). The unit costs provided account for new roadway construction, embankment and drainage requirements, retaining walls, and any necessary fly-overs or bridges that might be necessary given the proposed approach layout and the existing roadway network. An additional cost was included in the approaches to account for site restoration, lighting, and beautification of the new roadways. The MASSDOT pricing appeared to be priced at FY17 price levels so these unit costs were also escalated to today’s dollars. The MII cost estimates are based on the 2016 Cost Book, 2016 Region 1 Equipment Book, and the latest prevailing wage information for Suffolk County available at the time the estimates were prepared; General Decision Number: MA20190008 05/17/2019 (for the rehabilitation alternative) and MA20200008 02/21/2020 (for the replacement alternative), Construction Type: Heavy (Heavy and Marine). A significant portion of the tasks associated with the rehabilitation estimates were derived from previous contract actions and bid abstracts, a record of historical repair costs maintained by NAE Structural Engineering Design Section, and previously completed cost estimates for repairs at the Sagamore and/or Bourne Bridges. All costs obtained from sources before FY19 were escalated to today’s dollars using EM 1110-2-1304, CIVIL WORKS CONSTRUCTION COST INDEX SYSTEMS (CWCCIS), dated 30 September 2020. Feature Code 08 (Roads, Railroads & Bridges) was used exclusively to determine those escalation factors. Quantities related to the individual cost estimates for each of the ten bridge repair tasks that comprise the bridge rehabilitation as well as the bridge replacement cost estimate were developed with minimal input from the PDT, except from the Structural Engineering Design Section, as no design work, even conceptual, has been completed for any of the alternatives. Both alternatives considered utility relocations for the existing utilities that run adjacent to the bridge abutments as well as along both the Sagamore and Bourne Bridges across and above the Canal. As part of either alternative, including rehabilitation, the gas lines would be removed from the bridges and new gas lines be constructed under the canal via directional drilling. There is assumed to be 1 line on each bridge that would require relocation. After speaking with several

C -8
representatives from the directional drilling industry who have worked in the greater Boston area as well as the Cape, a lump sum price was assumed for each gas line to be drilled under the Canel It was assumed all other utilities on the bridges would be temporarily relocated to the bridge exteriors to accommodate construction. Under the replacement alternative, there are additional utilities that would require relocation; these costs were generated by assuming a total linear foot of pipe to be demo’ed and installed along with a and unit cost for each. There is also a gas metering station adjacent to the Bourne Bridge and a recitifier and anode bed adjacent to the Sagamore Bridge that would need to be demo’ed and constructed adjacent to the new abutments. The Real Estate Division has provided real estate cost estimates for the anticipated real estate actions in the bridge replacement alternative; these costs include both real estate damages and non-compenable damages. Lastly, the bridge replacement alternative includes an accounting of the potential environmental and cultural restoration and/or mitigation that will likely be required once the NEPA requirements are satisfied in the next phase of design. This cultural resource preservation cost has been estimated as 5% of the bridge replacement cost. 6.2 MAJOR ASSUMPTIONS It was assumed the existing bridges would not be salvaged during construction. They are likely considered historical structures and will likely will be demo’ed and dismantled instead of demo’ed and salvaged. It was also assumed the linear footage of new approach roads considered by MASSDOT in their conceptual cost estimate is appropriate given the proposed locations of the replacement bridges. It was assumed the gas line relocation would run the same route on the mainland and Cape sides to the same point along the Canal where the line would be run under the canal regardless of the alternative selected. It was assumed each gas line would have it’s own line directly drilled under the canal. 6.3 MAJOR RISKS All risks associated with the project have been captured and quantified in the Cost and Schedule Risk Analysis to develop the risk-based contingency for each alternative. Overarching risks to the project as a whole, regardless of which alternative is selected, is certainly project funding related. The current project schedule has funding approval occurring in FY20; given the project first costs of either alterntive, this funding timeline seems unlikely at best. More specific to the estimates themselves, the major risk of the rehabilitation estimate is that the scope of historical projects, and the cost associated with them, matches up with the assumed scope of the rehabilitation tasks. For those rehabilitation tasks we developed new cost estimates for, the risk is that we captured enough of the scope and quantity to develop a defensible estimate. The major risk of the replacement estimate is that our previous bridge estimates for much smaller bridges are scalable in any way to capture the anticipated cost of new cable-stayed bridges and the additional features of work that were added are adequate, in quantity and unit price, to fully capture the anticipated cost of those features.

C -9
7.0 SCHEDULE The construction schedule for both the rehabilitation and replacement alternatives were prepared using Microsoft Excel and are based on years of anticipated work. There are too few details on any individual repair, the major rehab, or the replacement to drill too far into features of work and sub features to be able to generate a more comprehensive schedule. It should be noted that the real estate activities for the replacement are not accounted for in the construction schedule but are expected to take considerable time to complete. The project start for both rehabilitation and replacement are based on input from CENAE Structural Engineering Design Section and their assessment of the current condition of the bridges. The repair or replacement must commence by 2025 in order to avoid having to contract all or part of the initial major rehabilitation to avoid posting load limits on one or both of the bridges. The project schedule is provided as Attachment 2 to this Cost Engineering Appendix. 8.0 CONTINGENCY The goal in contingency development is to identify the uncertainties associated with an item of work or task, forecast the cost/risk relationship, and assign a value to this task that would limit the cost risk to an acceptable degree of confidence. Consideration must be given to the details available at each stage of planning, design, or construction for which a cost estimate is being prepared. A Cost and Schedule Risk Analysis (CSRA) was conducted according to the procedures outlined in the manual entitled “Cost and Schedule Risk Analysis Guidance”, dated 17 May 2009. Members of the New England District Project Delivery Team (PDT) participated in a cost risk analysis brainstorming session to identify risks associated with the project. The Risk Analysis utilized the “HIGH RISK” category as both alternatives represent complex projects involving construction with life safety issues. Assumptions were made to the likelihood and impact of each risk item, as well as the probability of occurrence and magnitude of the impact if it were to occur. Adjustments were made to the analysis upon review by the PDT and the final contingencies were established. The CSRA Report is provided as Attachment 3 to this Cost Engineering Appendix. It should be noted that the subject matter experts applied uncertainty bounds to the deterministic cost estimate in order to characterize overall project uncertainty. There was no uncertainty evaluation at the detailed cost estimate level. 9.0 PLANNING, ENGINEERING, AND DESIGN (PED) The costs were estimated for all activities associated with the planning, engineering and design effort. The planning, engineering and design of the rehabilitation and subsequent repairs is expected to occur in-house while the replacement is expected to be contracted to an architect/engineer firm. The PED costs for all portions of the rehabilitation and replacement alternatives were estimated using a percentage of the construction cost which varies based on the value of the construction. For the rehabilitation alternative, if the construction cost is less than $1M, PED is calculated as 20% of the construction cost, if the construction cost is greater than $1M but less than $2M, PED is calculated as 15% of the construction cost, if the construction cost, if the construction cost is greater than $2M but less than $5M, PED is calculated as 10% of

C -10
the construction cost, and if the contruction cost is greater than $5M, PED is calculated as 5% of the construction cost. For the replacement alternative, the PED for the bridge replacement was calculated as 8% of the bridge replacement cost and PED for the approach roadway construction was calculated as 10% of the approach roadway construction cost. It is expected the PED values generated include the preparation of Design Documentation Reports and plans and specifications for each construction contract and engineering support during construction through project completion. It includes all the in-house labor based upon work-hour requirements, material and facility costs, travel and overhead. 10.0 CONSTRUCTION MANAGEMENT (S&A) The costs were developed for all construction management activities from pre-award requirements through final contract closeout. These costs include the in-house labor based upon work-hour requirements, materials, facility costs, support contracts, travel and overhead. Costs were developed based on the input from the Construction Division in accordance with the CWBS and include but are not limited to anticipated items such as the salaries of the resident engineer and staff, survey men, inspectors, draftsmen, clerical, and custodial personnel; operation, maintenance and fixed charges for transportation and for other field equipment; field supplies; construction management, general construction supervision; project office administration, distributive cost of area office and general overhead charged to the project. The work items and activities would include, but not be limited to: the salaries of all supervisory, engineering (including resident geologist and geological staff), office and safety field personnel; all on site expenses. 11.0 CONDITIONAL COST CERTIFICATION AND TOTAL PROJECT COST SUMMARIES Conditional Cost Certification was obtained from the Walla Walla District Cost Engineering Mandatory Center of Expertise on 02 March 2020. The areas of concerns resulting in a conditional certification are as follows:
• Costs have been developed to a Class 5 screening/pre-budget development level sufficient for MRER evaluation of rehabilitation versus replacement but not to the Class 3 level required for Feasibility Phase Certification/budget authorization.
• Additional design refinement and NEPA documentation will be required prior to
establishment of budget/funding.
• MRER has not been developed to a Feasibility Level Scope and should not be used for budgetary/funding purposes.
The Total Project Cost Summary (TPCS) addresses the inflation through project completion; accomplished by escalation to the mid-point of construction. The TPCS includes costs for all construction features of the project, PED and S&A, along with the appropriate contingencies and escalation associated with each of these activities. The TPCS is formatted according to the CWWBS. The TPCS was prepared using the MCACES/MII cost estimate, contingencies developed through the CSRA, the construction schedule, and estimates of PED and S&A based

C -11
on percentages of the construction cost and input from the Construction Division, respectively. The TPCS for both the bridge rehabilitation and bridge replacement alternatives for the Bourne and Sagamore Bridges are provided as Attachment 4 to this Cost Engineering Appendix.

C -12
Attachment 1
MCACES MII Cost Estimates

Print Date Thu 5 March 2020 U.S. Army Corps of Engineers Time 11:02:00Eff. Date 9/11/2019 Project Estimate: CCC Sagamore Bridge Major Rehab
COE Standard Report Selections Project Cost Summary Report Page 1
Description DirectLabor DirectEQ DirectMatl DirectSubBid DirectCost ContractCost ProjectCost
Project Cost Summary Report 8,876,316 2,045,776 3,459,188 55,246,992 69,628,272 107,392,905 107,392,905
Sagamore Bridge Major Rehab 8,876,316 2,045,776 3,459,188 55,246,992 69,628,272 107,392,905 107,392,905
0 0 0 12,962,692 12,962,692 19,514,751 19,514,751
0 0 0 7,102,467 7,102,467 10,692,445 10,692,445
1,156,076 61,048 2,359,542 947,672 4,524,339 8,192,055 8,192,055
489,900 90,041 47,473 0 627,414 1,167,418 1,167,418
0 0 0 1,064,050 1,064,050 1,979,859 1,979,859
1,403,784 428,190 233,251 1,263,858 3,329,082 6,194,363 6,194,363
5,826,556 1,466,497 818,923 2,667,326 10,779,301 20,056,854 20,056,854
0 0 0 1,555,184 1,555,184 2,341,260 2,341,260
0 0 0 4,697,846 4,697,846 7,072,396 7,072,396
0 0 0 14,235,897 14,235,897 21,431,504 21,431,504
0001 Truss Span Deck Replacement
0002 Suspender Cable Replacement
0003 Replace Abutment Spans
0004 Bearing Replacement
0005 Joint Replacement
0006 Minor Steel Truss Repairs
0007 Major Steel Truss Repairs
0008 Paving
0009 Maintenance Painting of Structural Steel
0010 Complete Painting of Structural Steel
02 Relocations (Utilities) 0 0 0 8,750,000 8,750,000 8,750,000 8,750,000
Labor ID: NLS2016 EQ ID: EP16R01 Currency in US dollars TRACES MII Version 4.4

Print Date Thu 5 March 2020 U.S. Army Corps of Engineers Time 11:00:52Eff. Date 9/11/2019 Project Estimate: CCC Bridge Bourne Major Rehab
COE Standard Report Selections Project Cost Summary Report Page 1
Description DirectLabor DirectEQ DirectMatl DirectSubBid DirectCost ContractCost ProjectCost
Project Cost Summary Report 14,573,133 3,334,088 4,533,515 60,767,376 83,208,112 125,474,766 125,474,766
Bourne Bridge Major Rehab 14,573,133 3,334,088 4,533,515 60,767,376 83,208,112 125,474,766 125,474,766
0001 Truss Span Deck Replacement 0 0 0 20,932,830 20,932,830 30,163,295 30,163,295
0002 Suspender Cable Replacement 0 0 0 7,102,467 7,102,467 10,234,345 10,234,345
0003 Replace Abutment Spans 1,156,076 61,048 2,359,542 947,672 4,524,339 7,841,080 7,841,080
0004 Bearing Replacement 1,530,180 270,124 142,418 0 1,942,722 3,459,918 3,459,918
0005 Joint Replacement 0 0 0 1,087,900 1,087,900 1,937,511 1,937,511
0006 Minor Steel Truss Repairs 2,609,909 604,965 689,625 1,255,726 5,160,225 9,190,177 9,190,177
0007 Major Steel Truss Repairs 9,276,968 2,397,951 1,341,930 2,651,062 15,667,910 27,903,991 27,903,991
0008 Paving 0 0 0 2,237,912 2,237,912 3,224,734 3,224,734
0009 Maintenance Painting of Structural Steel 0 0 0 3,920,749 3,920,749 5,649,628 5,649,628
0010 Complete Painting of Structural Steel 0 0 0 11,881,058 11,881,058 17,120,086 17,120,086
02 Relocations (Utilities) 0 0 0 8,750,000 8,750,000 8,750,000 8,750,000
Labor ID: NLS2016 EQ ID: EP16R01 Currency in US dollars TRACES MII Version 4.4
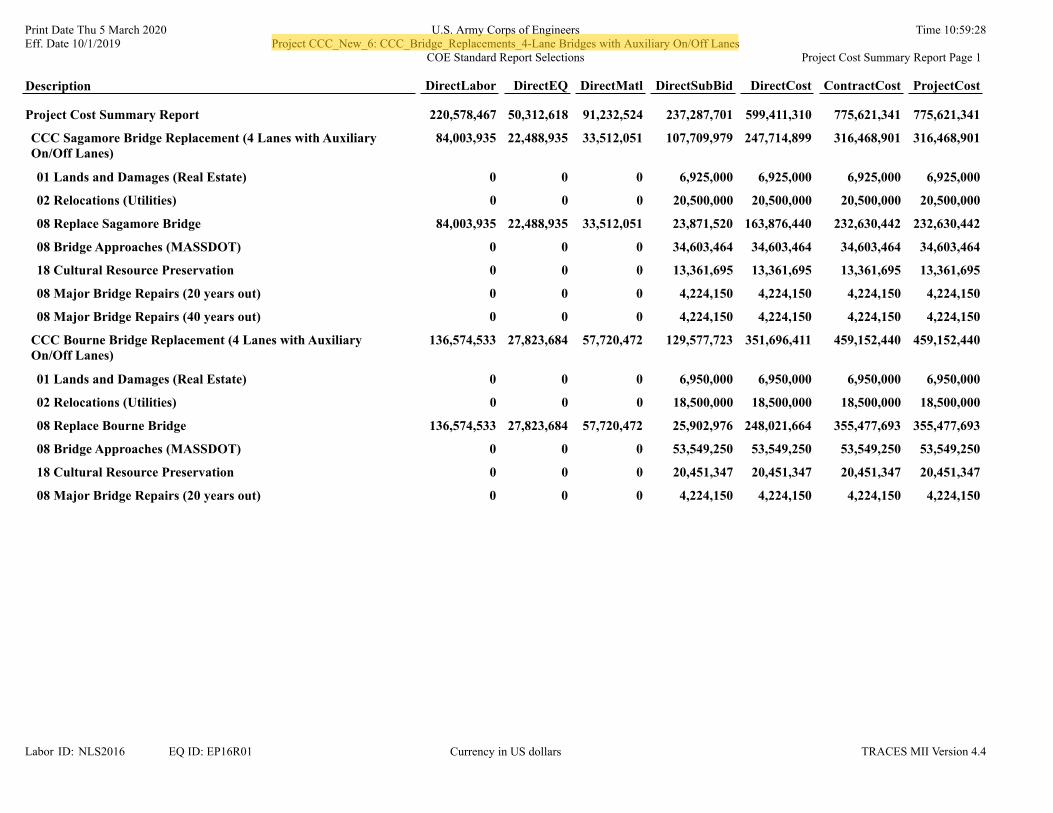
Print Date Thu 5 March 2020 U.S. Army Corps of Engineers Time 10:59:28Eff. Date 10/1/2019 Project CCC_New_6: CCC_Bridge_Replacements_4-Lane Bridges with Auxiliary On/Off Lanes
COE Standard Report Selections Project Cost Summary Report Page 1
Description DirectLabor DirectEQ DirectMatl DirectSubBid DirectCost ContractCost ProjectCost
Project Cost Summary Report 220,578,467 50,312,618 91,232,524 237,287,701 599,411,310 775,621,341 775,621,341
CCC Sagamore Bridge Replacement (4 Lanes with Auxiliary On/Off Lanes)
84,003,935 22,488,935 33,512,051 107,709,979 247,714,899 316,468,901 316,468,901
01 Lands and Damages (Real Estate) 0 0 0 6,925,000 6,925,000 6,925,000 6,925,000
02 Relocations (Utilities) 0 0 0 20,500,000 20,500,000 20,500,000 20,500,000
08 Replace Sagamore Bridge 84,003,935 22,488,935 33,512,051 23,871,520 163,876,440 232,630,442 232,630,442
08 Bridge Approaches (MASSDOT) 0 0 0 34,603,464 34,603,464 34,603,464 34,603,464
18 Cultural Resource Preservation 0 0 0 13,361,695 13,361,695 13,361,695 13,361,695
08 Major Bridge Repairs (20 years out) 0 0 0 4,224,150 4,224,150 4,224,150 4,224,150
08 Major Bridge Repairs (40 years out) 0 0 0 4,224,150 4,224,150 4,224,150 4,224,150
CCC Bourne Bridge Replacement (4 Lanes with Auxiliary On/Off Lanes)
136,574,533 27,823,684 57,720,472 129,577,723 351,696,411 459,152,440 459,152,440
01 Lands and Damages (Real Estate) 0 0 0 6,950,000 6,950,000 6,950,000 6,950,000
02 Relocations (Utilities) 0 0 0 18,500,000 18,500,000 18,500,000 18,500,000
08 Replace Bourne Bridge 136,574,533 27,823,684 57,720,472 25,902,976 248,021,664 355,477,693 355,477,693
08 Bridge Approaches (MASSDOT) 0 0 0 53,549,250 53,549,250 53,549,250 53,549,250
18 Cultural Resource Preservation 0 0 0 20,451,347 20,451,347 20,451,347 20,451,347
08 Major Bridge Repairs (20 years out) 0 0 0 4,224,150 4,224,150 4,224,150 4,224,150
Labor ID: NLS2016 EQ ID: EP16R01 Currency in US dollars TRACES MII Version 4.4

C -13
Attachment 2
Construction Schedule

No. Work Item No. Work Item Work Item Work Item
2023 20232024 20242025 20252026 20262027 20272028 20282029 BRIDGE APPROACHES 20292030 20302031 20312032 02 Maintenance Painting 20322033 03 Joint Replacement 20332034 BRIDGE APPROACHES 20342035 20352036 02 Maintenance Painting 20362037 03 Joint Replacement 20372038 20382039 04 Maintenance Painting 2039
PavingJoint Replacement
2041 20412042 20422043 04 Maintenance Painting 2043
PavingJoint Replacement
2045 06 Complete Painting 20452046 20462047 07 Joint Replacement 20472048 20482049 06 Complete Painting Major Repairs 20492050 20502051 07 Joint Replacement 20512052 08 Maintenance Painting 20522053 20532054 Major Repairs 2054
PavingJoint Replacement
2056 08 Maintenance Painting 20562057 20572058 2058
PavingJoint Replacement
2060 20602061 20612062 20622063 10 Maintenance Painting 20632064 2064
Truss Deck ReplacementFloorbeam RepairMajor Steel RepairsComplete PaintingJoint Replacement
2066 20662067 20672068 2068
Truss Deck ReplacementFloorbeam RepairMajor Steel RepairsComplete PaintingJoint Replacement
Fiscal Year
Fiscal Year
EXISTING SAGAMORE BRIDGE EXISTING BOURNE BRIDGE SAGAMORE REPLACEMENT BOURNE REPLACEMENT
SAGAMORE REPLACEMENT01 SAGAMORE MAJOR REHAB
BOURNE REPLACEMENT
01 BOURNE MAJOR REHAB
2040 05 2040
2055 09 2055
2044 05 2044
09 2059
2065 11 2065
2059 10 Maintenance Painting
20692069 11 Major Repairs
1

C -14
Attachment 3
Cost and Schedule Risk Assessment

Major Rehabilitation Evaluation Report
Cape Cod Canal, Bourne & Sandwich, Massachusetts
Cost and Schedule Risk Analysis Report for the Feasibility Report
Prepared for: U.S. Army Corps of Engineers, New England District
Prepared by: U.S. Army Corps of Engineers, New England District
Date: 05 March 2020

ii
TABLE OF CONTENTS
EXECUTIVE SUMMARY ......................................................................................................................... 1
Project Purpose ...................................................................................................................................... 1
Project Scope .......................................................................................................................................... 1
Risk Analysis Results ............................................................................................................................... 1
BRIDGE REHABILITATION ........................................................................................................................ 3
Key Risk Items, Cost ................................................................................................................................ 3
Key Risk Items, Schedule ........................................................................................................................ 3
BRIDGE REPLACEMENT ........................................................................................................................... 4
Key Risk Items, Cost ................................................................................................................................ 4
Key Risk Items, Schedule ........................................................................................................................ 4
Total Project Cost Summary ................................................................................................................... 5
BRIDGE REHABILITATION – BOURNE BRIDGE ........................................................................................ 6
BRIDGE REHABILITATION – SAGAMORE BRIDGE ................................................................................... 6
BRIDGE REPLACEMENT – BOURNE BRIDGE ........................................................................................... 6
BRIDGE REPLACEMENT – SAGAMORE BRIDGE ...................................................................................... 7
PURPOSE/BACKGROUND ..................................................................................................................... 8
REPORT SCOPE ..................................................................................................................................... 8
Project Scope .......................................................................................................................................... 8
USACE Risk Analysis Process ................................................................................................................... 9
METHODOLOGY/PROCESS ................................................................................................................. 10
Identify and Assess Risk Factors ........................................................................................................... 11
Quantify Risk Factor Impacts ................................................................................................................ 11
Analyze Cost Estimate and Schedule Contingency ............................................................................... 12
KEY CONSIDERATIONS AND ASSUMPTIONS ......................................................................................... 13
RISK ANALYSIS RESULTS ..................................................................................................................... 14
Risk Register ......................................................................................................................................... 14

iii
Cost Risk Analysis - Cost Contingency Results ...................................................................................... 16
Key Risk Items, Cost .............................................................................................................................. 17
Schedule Risk Analysis - Schedule Contingency Results ....................................................................... 22
Key Risk Items, Schedule ...................................................................................................................... 23
LIST OF TABLES
Table 1 - Risk Analysis Results ....................................................................................................................... 1
Table 2 - Cost Summary ................................................................................................................................ 6
Table 3 - PDT Risk Identification Team ....................................................................................................... 10
Table 4 - Work Breakdown Structure by Feature ..................................................................................... 11
Table 5 - Risk Register (High Risk Level) ...................................................................................................... 15
Table 6 - Cost Contingency Analysis at Various Confidence Levels ............................................................ 19
Table 7 - Cost Contingency Analysis at Various Confidence Levels ............................................................ 25
LIST OF FIGURES
Figure 1 - Cost Risk Sensitivity Analysis ....................................................................................................... 16
ATTACHMENTS
ATTACHMENT 1 Detailed Risk Registers

Cape Cod Canal Highway Bridges Major Rehabilitation Report Risk Analysis
ES-1
EXECUTIVE SUMMARY
Project Purpose
The purpose of the Major Rehabilitation Evaluation Study is to evaluate the existing conditions and reliability of both the Bourne and Sagamore highway bridges of the Cape Cod Canal, MA Federal Navigation Project (FNP). The study has identified the timeline and budget requirements necessary to maintain satisfactory performance of the two bridges. The Study has included a detailed analysis and evaluation of the alternatives for both rehabilitation and replacement as well as a direction forward. This Study has resulted in a Major Rehabilitation Evaluation Report. The rehabilitation alternative includes scheduled replacement of major bridge components to avoid emergency repair. The Report also includes bridge replacement as an alternative for comparison.
Project Scope
The study area consists of the Bourne and Sagamore highway bridges as well as the bridge approaches. These bridges are the primary access points to Cape Cod and the Islands from mainland Massachusetts.
Risk Analysis Results
A Cost and Schedule Risk Analysis (CSRA) was performed in April 2017 on this project to identify the 90% confidence level contingencies for the anticipated construction activities. The contingencies considered both cost and schedule risk. The risk analysis analyzed the construction costs only; the subsequent contingency will be applied to the Planning, Engineering & Design (PED) and Supervision & Administration (S&A). Because the Risk Events are nearly identical for either rehabilitation or replacement of the Bourne and Sagamore Bridges, for the purposes of the risk analyses the bridges were combined in each of the analysis spreadsheets. The following results were observed:
Table 1 - Risk Analysis Results
Contingency Amount Contingency %
BRIDGE REHABILITATION1)
Project Construction $204,261,948 43%
Project Schedule 68 Months 94%
BRIDGE REPLACEMENT1)
Project Construction $329,592,512 44%
Project Schedule 71 Months 59%
1) The CSRA for each alternative includes both the Bourne Bridge and the Sagamore Bridge.
It should be noted that typically the 80% confidence level contingency is reported. This is the confidence level required by ER 1110-2-1302 (CIVIL WORKS COST ENGINEERING). Because of the lack of design in both

Cape Cod Canal Highway Bridges Major Rehabilitation Report Risk Analysis
ES-2
the rehab and replacement alternatives as well as the regional impact of the project, NAE Cost Engineering Section feels the 90% confidence level contingency is more appropriate at this time.

Cape Cod Canal Highway Bridges Major Rehabilitation Report Risk Analysis
ES-3
BRIDGE REHABILITATION
Key Risk Items, Cost
The following were high risk items affecting cost for the bridge rehabilitation alternative (the complete risk register can be viewed in Appendix A):
• ES12 – Cost Estimate
Discussion: The level of design is pre-conceptual at this point. Items included in the major rehab have been generated by the Structural Engineering Design Section based on their Structural Reliability Analysis. The cost estimate has been put together in MII using unit prices from Mass DOT as well as other smaller bridge projects from NAE. Several items are estimated using parametric cost data from historical projects. It is very likely the current cost estimate has omitted items, underestimated the quantity, or underestimated the cost. The impacts have the potential to be significant.
Risk Reduction Measures: Build and refine cost estimate as soon as details are flushed out regarding the design. Contacting other USACE districts and possibly the MCX to check on recent estimates built for this type of bridge construction. Reaching out to industry to discuss all facets of the project, in a generic manner of course, could also shed some light on the cost estimate and how it has been prepared to allow for revisions that could reduce the risk.
• TD18 – Current Design Status
Discussion: Current cost is based on unit price data and programmatic costs from other projects; this data may not be scalable to a project this size.
Risk Reduction Measures: Additional review of those historical costs will be beneficial to flush out and refine the cost estimate for this rehab alternative. As each piece of the rehab is actually designed the estimate can be refined.
Key Risk Items, Schedule
The following items were high risk items affecting the project schedule for the bridge rehabilitation alternative.
• ES13 – Schedule
Discussion: The current schedule developed for the project includes only an estimate total duration. It is very likely once a more detailed schedule is developed for the project that there will be significant impacts once all major items have been accounted for.
Risk Reduction Measures: Build and refine the schedule as soon as details are flushed out regarding the design. Contacting other USACE districts and possibly the MCX to check on recent schedules built for this type of bridge construction. Reaching out to industry to discuss all facets of the project, in a generic manner of course, could also shed some light on the schedule and how it has been prepared to allow for revisions that could reduce the risk.
• EX22 – Adequacy of Project Funds

Cape Cod Canal Highway Bridges Major Rehabilitation Report Risk Analysis
ES-4
Discussion: A delay in receiving projects funds would result in schedule delays. This risk is similar to Risk 16 regarding availability of State funding. This likelihood is possible, as this project may not be a national priority which may result in a delay due to funding.
Risk Reduction Measures: Communication with the vertical team will help to finalize a plan going forward on how this project might be funded. A realistic plan and timeline should be established prior to any funding request to ensure the proper escalation is applied.
BRIDGE REPLACEMENT
Key Risk Items, Cost
The following were high risk items affecting cost for the bridge replacement alternative.
• TD24 – Bridge Design/Type
Discussion: The Major Rehabilitation Evaluation Report (MRER) is currently considering a cable-stayed bridge as an alternative to rehabilitation. The cable-stayed bridge is one of the higher-cost bridge replacement alternatives. The design will be limited by some construction budget at the time of design. It is possible something other than cable-stayed will be design/constructed, however the cost impact will be marginal based on the allowable budget.
Risk Reduction Measures: Coordination with the A/E in regards to bridge type and what will be designed and ultimately constructed will be helpful in mitigating this risk. A planning document will need to be completed for the replacement project and a budget established in that document which will help to tie the hands of the A/E to design within a certain budget.
• EX32 – Bidding climate
Discussion: The size and potential value of this project will likely draw any and all qualified contractors to the table. It is unlikely this would be an issue but could have moderate impact on project cost if the competition is not there during the selection process.
Risk Reduction Measures: Market research will help to mitigate this risk to see how much competition there might be around the time of solicitation.
• CA3 – Contract Modifications
Discussion: Due to the project size and complexity, the PDT is certain there will be contract mods during construction; such as differing site conditions for foundation issues or utility issues. Depending on what the modification is for, the impact to cost and schedule could be significant.
Risk Reduction Measures: The easier way to reduce contract modifications is to make the design documents as clear and understandable as possible. This will help reduce contractor questions during solicitation and adjustments during construction. Some issues are unavoidable, but having clear and concise documents will help reduce the risk of mods.
Key Risk Items, Schedule

Cape Cod Canal Highway Bridges Major Rehabilitation Report Risk Analysis
ES-5
The following items were high risk items affecting the project schedule for the bridge replacement alternative. The complete risk register can be viewed in Appendix A.
• EX31 – Adequacy of Project Funds
Discussion: A delay in receiving projects funds would result in schedule delays. This risk is similar to Risk 16 regarding availability of State funding. This likelihood is possible, as this project may not be a national priority which may result in a delay due to funding.
Risk Reduction Measures: Communication with the vertical team will help to finalize a plan going forward on how this project might be funded. A realistic plan and timeline should be established prior to any funding request to ensure the proper escalation is applied.
• ES15 – Schedule
Discussion: The current schedule developed for the project includes only an estimated total duration. It is very likely once a more detailed schedule is developed for the project that there will be significant impacts once all major items have been accounted for.
Risk Reduction Measures: Build and refine the schedule as soon as details are flushed out regarding the design. Contacting other USACE districts and possibly the MCX to check on recent schedules built for a similar type of bridge construction. Reaching out to industry to discuss all facets of the project, in a generic manner of course, could also shed some light on the schedule and how it has been prepared to allow for revisions that could reduce the risk.
• PM16 – Coordinate with State
Discussion: There would be a schedule risk associated with any delays caused by lack of state funding. Being a high priority State project, it is unlikely this will be the case here, but if it were to happen, it would have significant impact to the project schedule.
Risk Reduction Measures: Close contact with the State and open communication can help reduce risk regarding project funding and when we might receive it.
Total Project Cost Summary
The following table portrays the full costs of the project features based on the anticipated contracts for the Program Year (FY20). The costs are intended to address the congressional requests of estimates to complete the project. Costs are in thousands of dollars.
The 43% and 40% contingency for both the Bridge Rehabilitation and Bridge Replacement plans, respectively, is based on the 90% confidence level as stated earlier. A separate Total Project Cost Summary was prepared for the Bourne and Sagamore Bridges for each the rehabilitation and replacement alternatives.

Cape Cod Canal Highway Bridges Major Rehabilitation Report Risk Analysis
ES-6
Table 2 - Cost Summary
BRIDGE REHABILITATION – BOURNE BRIDGE ACCT DESCRIPTION COST ($K) CONTG ($K) TOTALS($K)
01 Lands & Damages 0% 0 0 0 08 Roads, Railroads & Bridges 43% 263,601 113,348 376,949
Non-construction Costs
30 Planning, Engineering & Design** 43% 14,259 6,131 20,390 31 Supervision & Administration** 43% 6,919 2,975 9,894
Summary 30 & 31 Account 21,178 9,106 30,284
Estimated Project First Cost (FY20) 284,778 122,455 407,233
BRIDGE REHABILITATION – SAGAMORE BRIDGE
ACCT DESCRIPTION COST ($K) CONTG ($K) TOTALS($K) 01 Lands & Damages 0% 0 0 0 08 Roads, Railroads & Bridges 43% 238,239 102,443 340,682
Non-construction Costs
30 Planning, Engineering & Design** 43% 12,903 5,548 18,451 31 Supervision & Administration** 43% 6,855 2,948 9,803
Summary 30 & 31 Account 19,758 8,496 28,254
Estimated Project First Cost (FY20) 257,997 110,939 368,936
BRIDGE REPLACEMENT – BOURNE BRIDGE
ACCT DESCRIPTION COST ($K) CONTG ($K) TOTALS($K) 01 Lands & Damages 10% 6,950 695 7,645 08 Roads, Railroads & Bridges 44% 452,202 198,969 651,172
Non-construction Costs
30 Planning, Engineering & Design** 44% 34,216 15,055 49,270 31 Supervision & Administration** 44% 14,992 6,596 21,588
Summary 30 & 31 Account 49,208 21,651 70,858

Cape Cod Canal Highway Bridges Major Rehabilitation Report Risk Analysis
ES-7
Estimated Project First Cost (FY20) 508,360 221,315 729,675
BRIDGE REPLACEMENT – SAGAMORE BRIDGE
ACCT DESCRIPTION COST ($K) CONTG ($K) TOTALS($K) 01 Lands & Damages 10% 6,925 693 7,618 08 Roads, Railroads & Bridges 44% 309,544 136,199 445,743
Non-construction Costs
30 Planning, Engineering & Design** 44% 22,586 9,938 32,524 31 Supervision & Administration** 44% 11,119 4,892 16,011
Summary 30 & 31 Account 33,705 14,830 48,535
Estimated Project First Cost (FY20) 350,174 151,722 501,895

Detailed Risk Register
ES-8
PURPOSE/BACKGROUND
The purpose of the Major Rehabilitation Evaluation Study is to evaluate the existing conditions and reliability of both the Bourne and Sagamore highway bridges of the Cape Cod Canal, MA Federal Navigation Project (FNP). The study has identified the timeline and budget requirements necessary to maintain satisfactory performance of the two bridges. The Study has included a detailed analysis and evaluation of the alternatives for both rehabilitation and replacement as well as a direction forward. This Study has resulted in a Major Rehabilitation Evaluation Report. The rehabilitation alternative includes scheduled replacement of major bridge components to avoid emergency repair. The Report also includes bridge replacement as an alternative for comparison.
REPORT SCOPE
The scope of the risk analysis report is to calculate and present the cost and schedule contingencies at various confidence levels using the risk analysis processes as mandated by U.S. Army Corps of Engineers (USACE) Engineer Regulation (ER) 1110-2-1150, Engineering and Design for Civil Works, ER 1110-2-1302, Civil Works Cost Engineering, and Engineer Technical Letter 1110-2-573, Construction Cost Estimating Guide for Civil Works. The report presents the contingency results for both cost and schedule risks for all project features. The study and presentation can include or exclude consideration for operation and maintenance or life cycle costs, depending upon the program or decision document intended for funding.
Project Scope
Major Project Features for these projects include:
Bridge Rehabilitation:
08 – Roads, Railroads, and Bridges (Truss Span Deck Replacement) 08 – Roads, Railroads, and Bridges (Suspender Cable Replacement) 08 – Roads, Railroads, and Bridges (Replace Abutment Spans) 08 – Roads, Railroads, and Bridges (Bearing Replacement) 08 – Roads, Railroads, and Bridges (Joint Replacement)
08 – Roads, Railroads, and Bridges (Minor Steel Truss Repairs) 08 – Roads, Railroads, and Bridges (Major Steel Truss Repairs) 08 – Roads, Railroads, and Bridges (Paving) 08 – Roads, Railroads, and Bridges (Maintenance Painting of Structural Steel) 08 – Roads, Railroads, and Bridges (Complete Painting of Structural Steel) 02 – Relocations (Utilities)
Bridge Replacement:
08 – Roads, Railroads, and Bridges (General Conditions) 08 – Roads, Railroads, and Bridges (Abutments/Piers) 08 – Roads, Railroads, and Bridges (Structural) 08 – Roads, Railroads, and Bridges (Superstructure) 08 – Roads, Railroads, and Bridges (Demo Existing Bridge)
08 – Roads, Railroads, and Bridges (Approaches [MASSDOT]) 02 – Relocations (Utilities) 22 – Cultural Resource Preservation (Environmental and Cultural Restoration and/or Mitigation)

Detailed Risk Register
ES-9
It should be noted that there are real estate costs and associated contingencies for the bridge replacement alternative both of which were developed by NAE Real Estate Division. The construction contingency developed through the CSRA process will be applied to the Planning, Engineering & Design estimates as well as the Supervision & Administration.
USACE Risk Analysis Process
The risk analysis process follows the USACE Headquarters requirements as well as the guidance provided by the Cost Engineering Directory of Expertise for Civil Works (Cost Engineering MCX). The risk analysis process reflected within the risk analysis report uses probabilistic cost and schedule risk analysis methods within the framework of the Crystal Ball software. The risk analysis results are intended to serve several functions, one being the establishment of reasonable contingencies reflective of an appropriate percent confidence level to successfully accomplish the project work within that established contingency amount. Furthermore, the scope of the report includes the identification and communication of important steps, logic, key assumptions, limitations, and decisions to help ensure that risk analysis results can be appropriately interpreted.
Risk analysis results are also intended to provide project leadership with contingency information for scheduling, budgeting, and project control purposes, as well as provide tools to support decision making and risk management as the project progresses through planning and implementation. To fully recognize its benefits, cost and schedule risk analyses should be considered as an ongoing process conducted concurrent to, and iteratively with, other important project processes such as scope and execution plan development, resource planning, procurement planning, cost estimating, budgeting, and scheduling.
In addition to broadly defined risk analysis standards and recommended practices, the risk analysis is performed to meet the requirements and recommendations of the following documents and sources:
• ER 1110-2-1150, Engineering and Design for Civil Works Projects. • ER 1110-2-1302, Civil Works Cost Engineering. • ETL 1110-2-573, Construction Cost Estimating Guide for Civil Works. • Cost and Schedule Risk Analysis Process guidance prepared by the USACE Cost Engineering MCX. • Memorandum from Major General Don T. Riley (U.S. Army Director of Civil Works), dated July 3, 2007. • Engineering and Construction Bulletin issued by James C. Dalton, P.E. (Chief, Engineering and Construction,
Directorate of Civil Works), dated September 10, 2007.

Detailed Risk Register
ES-10
METHODOLOGY/PROCESS
A CSRA meeting was held in the CENAE office on 20 April 2017. Participants include the following members:
Table 3 - PDT Risk Identification Team
Name Office Representing Martin, Craig CENAE-PPC PPMD/Project Manager
Habel, Mark CENAE-PDP Planning
Oleary, Edward CENAE-REA Real Estate
Kammerer-Cody, Denise NAE CENAE-PDE Economics
Umbrell, Stephen CENAE-EDD Design/Tech Lead
Cullen, Megan CENAE-EDD Civil
Kedzierski, John CENAE-EDD Structural
Nguyen, Thuyen CENAE-EDD Structural
Gaeta, Jeffrey NAE CENAE-EDD Cost Engineering
Coleman, Kevin CENAE-CDS Construction
Johnson, Judy NAE CENAE-PDE Environmental
McDonald, Sean CENAE-ODC Cape Cod Canal
The risk analysis process for this study is intended to determine the probability of various cost outcomes and quantify the required contingency needed in the cost estimate to achieve any desired level of cost confidence. A parallel process is also used to determine the probability of various project schedule duration outcomes and quantify the required schedule contingency (float) needed in the schedule to achieve any desired level of schedule confidence.
In simple terms, contingency is an amount added to an estimate (cost and/or schedule) to allow for items, conditions, or events for which the occurrence or impact is uncertain and that experience suggests will likely result in additional costs being incurred or additional time being required. The amount of contingency included in project control plans depends, at least in part, on the project leadership’s willingness to accept risk of project overruns. The less risk that project leadership is willing to accept the more contingency should be applied in the project control plans. The risk of overrun is expressed, in a probabilistic context, using confidence levels.
The Cost Engineering MCX guidance for cost and schedule risk analysis generally focuses on the 80-percent level of confidence (P80) for cost contingency calculation. It should be noted that use of P80 as a decision criteria is a risk adverse approach (whereas the use of P50 would be a risk neutral approach, and use of levels less than 50 percent would be risk seeking). Thus, a P80 confidence level results in greater contingency as compared to a P50 confidence level. In this particular case, the P90 confidence level will be utilized.
The risk analysis process uses Monte Carlo techniques to determine probabilities and contingency. The Monte Carlo techniques are facilitated computationally by a commercially available risk analysis software package (Crystal Ball) that is an add-in to Microsoft Excel. Cost estimates are packaged into an Excel format and used directly for cost risk analysis purposes. Because Crystal Ball is an Excel add-in, the schedules for each option are recreated in an Excel format from their native format. The level of detail recreated in the Excel-format schedule is sufficient for risk analysis purposes that reflect the established risk register, but generally less than that of the native format.
Detailed Risk Register
ES-11
The primary steps, in functional terms, of the risk analysis process are described in the following subsections. Risk analysis results would be provided in Section 6. It should be stated that the subject matter experts that comprise the PDT applied uncertainty bounds to the deterministic cost estimate in order to characterize over project uncertainty. There was no uncertainty evaluation at the detailed cost estimate level.
Identify and Assess Risk Factors
Identifying the risk factors via the PDT are considered a qualitative process that results in establishing a risk register that serves as the document for the further study using the Crystal Ball risk software. Risk factors are events and conditions that may influence or drive uncertainty in project performance. They may be inherent characteristics or conditions of the project or external influences, events, or conditions such as weather or economic conditions. Risk factors may have either favorable or unfavorable impacts on project cost and schedule.
Checklists or historical databases of common risk factors are sometimes used to facilitate risk factor identification. However, key risk factors are often unique to a project and not readily derivable from historical information. Therefore, input from the entire PDT is obtained using creative processes such as brainstorming or other facilitated risk assessment meetings. In practice, a combination of professional judgment from the PDT and empirical data from similar projects is desirable and is considered.
A formal PDT meeting was held in CENAE on 20 April 2017 for the purposes of identifying and assessing risk factors. The initial formal meeting focused primarily on risk factor identification using brainstorming techniques, but also included some facilitated discussions based on risk factors common to projects of similar scope and geographic location. Discussions focused primarily on risk factor assessment and quantification.
Quantify Risk Factor Impacts
The quantitative impacts of risk factors on project plans are analyzed using a combination of professional judgment, empirical data, and analytical techniques. Risk factor impacts are quantified using probability distributions (density functions), because risk factors are entered into the Crystal Ball software in the form of probability density functions.
Similar to the identification and assessment process, risk factor quantification involves multiple project team disciplines and functions. However, the quantification process relies more extensively on collaboration between cost engineering, designers, and risk analysis team members with lesser inputs from other functions and disciplines.
The following is an example of the PDT quantifying risk factor impacts by using an iterative, consensus-building approach to estimate the elements of each risk factor:
• Maximum possible value for the risk factor. • Minimum possible value for the risk factor. • Most likely value (the statistical mode), if applicable. • Nature of the probability density function used to approximate risk factor uncertainty. • Mathematical correlations between risk factors. • Affected cost estimate and schedule elements.
Risk discussions focused on the various project features as presented within the USACE Civil Works Work Breakdown Structure for cost accounting purposes. It was recognized that the various features carry differing degrees of risk as related to cost, schedule, design complexity, and design progress. The example features under study are presented in Table 4:
Table 4 - Work Breakdown Structure by Feature

Detailed Risk Register
ES-12
Bridge Rehabilitation
08 Roads, Railroads, and Bridges (Truss Span Deck Replacement)
08 Roads, Railroads, and Bridges (Suspender Cable Replacement)
08 Roads, Railroads, and Bridges (Replace Abutment Spans)
08 Roads, Railroads, and Bridges (Bearing Replacement)
08 Roads, Railroads, and Bridges (Joint Replacement)
08 Roads, Railroads, and Bridges (Minor Steel Truss Repairs)
08 Roads, Railroads, and Bridges (Major Steel Truss Repairs)
08 Roads, Railroads, and Bridges (Paving)
08 Roads, Railroads, and Bridges (Maintenance Painting of Structural Steel)
08 Roads, Railroads, and Bridges (Complete Painting of Structural Steel)
02 Relocations (Utilities)
Bridge Replacement
08 Roads, Railroads, and Bridges (General Conditions)
08 Roads, Railroads, and Bridges (Abutments/Piers)
08 Roads, Railroads, and Bridges (Structural)
08 Roads, Railroads, and Bridges (Superstructure)
08 Roads, Railroads, and Bridges (Demo Existing Bridge)
08 Roads, Railroads, and Bridges (Approaches [MASSDOT])
02 Relocations (Utilities)
22 Cultural Resource Preservation (Environmental and Cultural Restoration and/or Mitigation)
The resulting product from the PDT discussions is captured within a risk register as presented in section 6 for both cost and schedule risk concerns. Note that the risk register records the PDT’s risk concerns, discussions related to those concerns, and potential impacts to the current cost and schedule estimates. The concerns and discussions are meant to support the team’s decisions related to event likelihood, impact, and the resulting risk levels for each risk event.
Analyze Cost Estimate and Schedule Contingency
Contingency is analyzed using the Crystal Ball software, an add-in to the Microsoft Excel format of the cost estimate and schedule. Monte Carlo simulations are performed by applying the risk factors (quantified as probability density functions) to the appropriate estimated cost and schedule elements identified by the PDT. Contingencies are calculated by applying only the moderate and high level risks identified for each option (i.e., low-level risks are typically not considered, but remain within the risk register to serve historical purposes as well as support follow-on risk studies as the project and risks evolve).
For the cost estimate, the contingency is calculated as the difference between the P90 cost forecast and the base cost estimate. Each option-specific contingency is then allocated on a civil works feature level based on the dollar-weighted relative risk of each feature as quantified by Monte Carlo simulation. Standard deviation is used as the feature-specific

Detailed Risk Register
ES-13
measure of risk for contingency allocation purposes. This approach results in a relatively larger portion of all the project feature cost contingency being allocated to features with relatively higher estimated cost uncertainty.
For schedule contingency analysis, the option schedule contingency is calculated as the difference between the P90 option duration forecast and the base schedule duration.
KEY CONSIDERATIONS AND ASSUMPTIONS
Key assumptions include the following:
• It is assumed future rehabilitation scope and costs will mimic past projects. • The project schedule for both rehabilitation and replacement are pre-conceptual at this stage of the project. It is
assumed the total duration is accurate. • The design for both alternatives is in the pre-conceptual stage; the cost engineer estimated quantities based on
discussions with Structural Design Section and professional judgment. • There are no applicable Life Cycle costs for this project.

Detailed Risk Register
ES-14
RISK ANALYSIS RESULTS
Risk Register
Risk is unforeseen or unknown factors that can affect a project’s cost or schedule. Time and money have a direct relationship due to the time value of money. A risk register is a tool commonly used in project planning and risk analysis and serves as the basis for the risk studies and Crystal Ball risk models. The risk register describes risks in terms of cost and schedule. A summary risk register that includes typical risk events studied (high and moderate levels) is presented in this section. The risk register reflects the results of risk factor identification and assessment, risk factor quantification, and contingency analysis. A more detailed risk register is provided in Appendix A. The detailed risk registers of Appendix A include low level and unrated risks, as well as additional information regarding the specific nature and impacts of each risk.
It is important to note that a risk register can be an effective tool for managing and communicating identified risks throughout the project life cycle. As such, it is generally recommended that risk registers be updated as the designs, cost estimates, and schedule are further refined, especially on large projects with extended schedules. Recommended uses of the risk register going forward include:
• Documenting risk mitigation strategies being pursued in response to the identified risks and their assessment in terms of probability and impact.
• Providing project sponsors, stakeholders, and leadership/management with a documented framework from which risk status can be reported in the context of project controls.
• Communicating risk management issues. • Providing a mechanism for eliciting risk analysis feedback and project control input. • Identifying risk transfer, elimination, or mitigation actions required for implementation of risk management plans.
A correlation is a dependency that exists between two risks and may be direct or indirect. An indirect correlation is one in which large values of one risk are associated with small values of the other. Indirect correlations have correlation coefficients between 0 and -1. A direct correlation is one in which large values of one risk are associated with large values of the other. Direct correlations have correlation coefficients between 0 and 1. Correlations were not identified in this analysis.
The risk register identifies thirty one different risks that are either moderate or high risks. An abridged version of the risk register is presented below.

Detailed Risk Register
ES-15
Table 5 - Risk Register (High Risk Level)
BRIDGE REHABILITATION ALTERNATIVE
BRIDGE REPLACEMENT ALTERNATIVE

Detailed Risk Register
ES-16
Cost Risk Analysis - Cost Contingency Results
The project Cost Contingency at the 90% confidence level is 43% and 44% for the Bridge Rehabilitation and Bridge Replacement alternatives, respectively, which translates to $204,261,948 and $329,592,512of the estimated construction cost for the Bridge Rehabilitation and Bridge Replacement alternatives, respectively. It should be noted that these contingencies are for both the Bourne Bridge and Sagamore Bridge. These levels were established by analyzing the different cost risk factors that affect both projects. Cost risks that were specific to individual project features were discussed in detail. For example, risk CA1, “Consolidation” references risks associated with the design/build contract costs only; which represent approximately 10% of the total construction cost. Most of the risks apply to the entire project such as CA3, “Contract Modifications” and EX23, “Bidding Climate” which would affect all features of work. Cost contingencies can be either positive or negative. The cost sensitivity chart shows relative cost contingency of individual risks. See the cost sensitivity chart below.
BRIDGE REHABILITATION ALTERNATIVE
Figure 1 - Cost Risk Sensitivity Analysis From this figure, we can see that in the Bridge Rehabilitation Alternative the top two risks that affect cost are:
• ES12 – Cost Estimate and
• TD18 – Current Design Status.

Detailed Risk Register
ES-17
BRIDGE REPLACEMENT ALTERNATIVE
Figure 3 - Cost Risk Sensitivity Analysis For the Bridge Replacement Alternative, the top four risks that affect costs are:
• ES14 – Cost Estimate,
• TD27 – Innovative Design,
• TD24 – Bridge Design/Type,
• EX32 – Bidding Climate.
Key Risk Items, Cost
The following were high risk items affecting the cost of the Bridge Rehabilitation alternative:
• ES12 – Cost Estimate
Discussion: The level of design is pre-conceptual at this point. Items included in the major rehab have been generated by the Structural Section based on their Structural Reliability Analysis. The cost estimate has been put together in MII using unit prices from Mass DOT as well as other smaller bridge projects from NAE. Several items are estimated using parametric cost data from historical projects. It is very likely the current cost estimate has omitted items, underestimated the quantity, or underestimated the cost. The impacts have the potential to be significant.

Detailed Risk Register
ES-18
Risk Reduction Measures: Build and refine cost estimate as soon as details are flushed out regarding the design. Contacting other USACE districts and possibly the MCX to check on recent estimates built for this type of bridge construction. Reaching out to industry to discuss all facets of the project, in a generic manner of course, could also shed some light on the cost estimate and how it has been prepared to allow for revisions that could reduce the risk.
• TD18 – Current Design Status
Discussion: Current cost is based on unit price data and programmatic costs from other projects; this data may not be scalable to a project this size.
Risk Reduction Measures: Additional review of those historical costs will be beneficial to flush out and refine the cost estimate for this rehab alternative. As each piece of the rehab is actually designed the estimate can be refined.
The following were high risk items affecting the cost of the Bridge Replacement alternative:
• ES14 – Cost Estimate
Discussion: The level of design is conceptual at this point. Design documents include an elevation view and a cross section. The cost estimate has been put together in MII using unit prices from Mass DOT as well as other smaller bridge projects from NAE. Several items are estimated using parametric cost data from historical projects. It is very likely the current cost estimate has omitted items, underestimated the quantity, or underestimated the cost. The impacts have the potential to be significant.
Risk Reduction Measures: Build and refine cost estimate as soon as details are flushed out regarding the design. Contacting other USACE districts and possibly the MCX to check on recent estimates built for this type of bridge construction. Reaching out to industry to discuss all facets of the project, in a generic manner of course, could also shed some light on the cost estimate and how it has been prepared to allow for revisions that could reduce the risk.
• TD27 – Innovative Design
Discussion: There is a risk involved with designing the bridges, even if a qualified A/E is completing the design. It is likely this risk will translate to significant impacts to cost and schedule.
Risk Reduction Measures: Coordination with the A/E in regards to bridge type and what will be designed and ultimately constructed will be helpful in mitigating this risk. A planning document will need to be completed for the replacement project and a budget established in that document which will seemlingly tie the hands of the A/E to design within a certain budget.
• TD24 – Bridge Design/Type
Discussion: Cable-stayed bridge is one of the higher-cost alternatives. The design will be limited by some construction budget at the time of design. It is possible something other than cable stayed will be design/constructed, however the cost impact will be marginal based on the allowable budget.
Risk Reduction Measures: Coordination with the A/E in regards to bridge type and what will be designed and ultimately constructed will be helpful in mitigating this risk. A planning document will need to be completed for the replacement project and a budget established in that document which will help to tie the hands of the A/E to design within a certain budget.
• EX32 – Bidding Climate
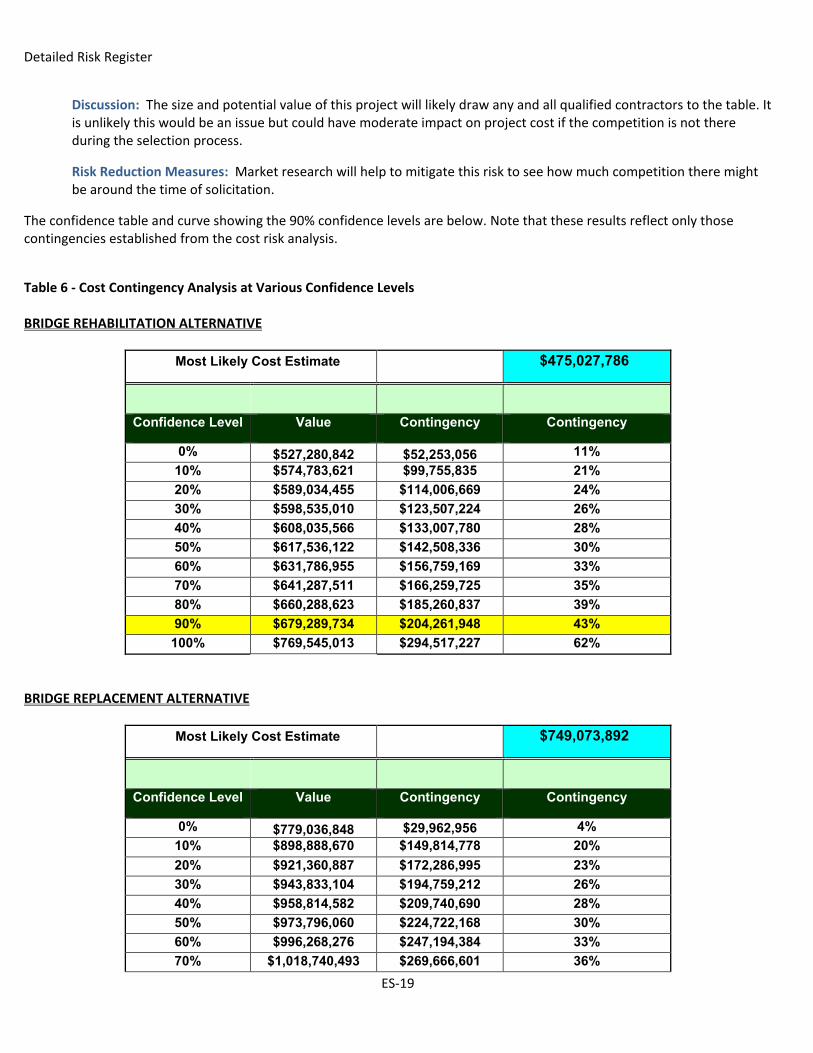
Detailed Risk Register
ES-19
Discussion: The size and potential value of this project will likely draw any and all qualified contractors to the table. It is unlikely this would be an issue but could have moderate impact on project cost if the competition is not there during the selection process.
Risk Reduction Measures: Market research will help to mitigate this risk to see how much competition there might be around the time of solicitation.
The confidence table and curve showing the 90% confidence levels are below. Note that these results reflect only those contingencies established from the cost risk analysis.
Table 6 - Cost Contingency Analysis at Various Confidence Levels BRIDGE REHABILITATION ALTERNATIVE BRIDGE REPLACEMENT ALTERNATIVE
Most Likely Cost Estimate $475,027,786
Confidence Level Value Contingency Contingency
0% $527,280,842 $52,253,056 11% 10% $574,783,621 $99,755,835 21% 20% $589,034,455
$114,006,669
24% 30% $598,535,010 $123,507,224 26% 40% $608,035,566 $133,007,780 28% 50% $617,536,122 $142,508,336 30% 60% $631,786,955 $156,759,169 33% 70% $641,287,511 $166,259,725 35% 80% $660,288,623 $185,260,837 39% 90% $679,289,734 $204,261,948 43% 100% $769,545,013 $294,517,227 62%
Most Likely Cost Estimate $749,073,892
Confidence Level Value Contingency Contingency
0% $779,036,848 $29,962,956 4% 10% $898,888,670 $149,814,778 20% 20% $921,360,887 $172,286,995 23% 30% $943,833,104 $194,759,212 26% 40% $958,814,582 $209,740,690 28% 50% $973,796,060 $224,722,168 30% 60% $996,268,276 $247,194,384 33% 70% $1,018,740,493 $269,666,601 36%

Detailed Risk Register
ES-20
80% $1,041,212,710 $292,138,818 39% 90% $1,078,666,404 $329,595,512 44% 100% $1,250,953,400 $501,879,508 67%

Detailed Risk Register
ES-21
Table 7 - Total Project Cost Risk Analysis
400,000
450,000
500,000
550,000
600,000
650,000
700,000
750,000
800,000
850,000
900,000
0% 10% 20% 30% 40% 50% 60% 70% 80% 90% 100%
Estim
ated
Tot
al P
roje
ct C
ost (
$k)
Total Project Cost Risk Analysis - BRIDGE REHABILITATION ALT
Confidence Level
700,000
800,000
900,000
1,000,000
1,100,000
1,200,000
1,300,000
1,400,000
0% 10% 20% 30% 40% 50% 60% 70% 80% 90% 100%
Thou
sand
s
Total Project Cost Risk Analysis - BRIDGE REPLACEMENT ALT
Confidence Level

Detailed Risk Register
ES-22
Schedule Risk Analysis - Schedule Contingency Results
The project Schedule Contingency at the 90% confidence level is 94% and 59% which translates to 68 months and 71 months of additional project duration for the Bridge Rehabilitation and Bridge Replacement alternatives, respectively. This level was established by analyzing the different schedule risk factors that affect the project. The schedule sensitivity chart shows relative schedule contingency of individual risks. See the schedule sensitivity chart below.
BRIDGE REHABILITATION ALTERNATIVE
Figure 3 - Schedule Risk Sensitivity Analysis From this figure, we can see that in the Bridge Rehabilitation Alternative the top two risks that affect schedule are:
• EX22 – Adequacy of Projects Funds and
• ES13 – Schedule.
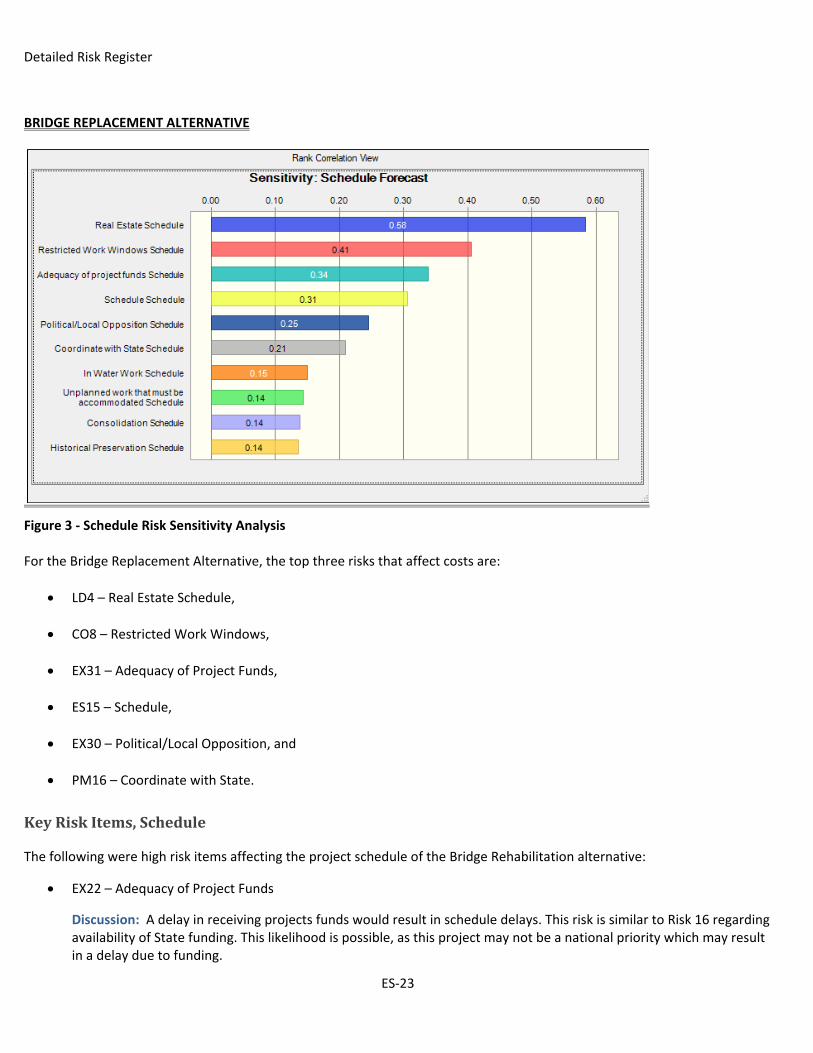
Detailed Risk Register
ES-23
BRIDGE REPLACEMENT ALTERNATIVE
Figure 3 - Schedule Risk Sensitivity Analysis For the Bridge Replacement Alternative, the top three risks that affect costs are:
• LD4 – Real Estate Schedule,
• CO8 – Restricted Work Windows,
• EX31 – Adequacy of Project Funds,
• ES15 – Schedule,
• EX30 – Political/Local Opposition, and
• PM16 – Coordinate with State.
Key Risk Items, Schedule
The following were high risk items affecting the project schedule of the Bridge Rehabilitation alternative:
• EX22 – Adequacy of Project Funds
Discussion: A delay in receiving projects funds would result in schedule delays. This risk is similar to Risk 16 regarding availability of State funding. This likelihood is possible, as this project may not be a national priority which may result in a delay due to funding.

Detailed Risk Register
ES-24
Risk Reduction Measures: Communication with the vertical team will help to finalize a plan going forward on how this project might be funded. A realistic plan and timeline should be established prior to any funding request to ensure the proper escalation is applied.
• ES13 – Schedule
Discussion: The current schedule developed for the project includes only an estimate total duration. It is very likely once a more detailed schedule is developed for the project that there will be significant impacts once all major items have been accounted for.
Risk Reduction Measures: Build and refine the schedule as soon as details are flushed out regarding the design. Contacting other USACE districts and possibly the MCX to check on recent schedules built for this type of bridge construction. Reaching out to industry to discuss all facets of the project, in a generic manner of course, could also shed some light on the schedule and how it has been prepared to allow for revisions that could reduce the risk.
The following were high risk items affecting the schedule of the Bridge Replacement alternative:
• LD4 – Real Estate Schedule
Discussion: Cost and time to acquire lands, whether by USACE or State, will impact total project cost and schedule. Some duration for these acquisitions will be introduced to the project schedule in the formulation of the TPCS, however it is possible that delays will occur.
Risk Reduction Measures: Risk can be mitigated by beginning acquisition as soon as possible after the PPA is completed. Coordination can be started during the planning stages during public notices and meetings.
• CO8 – Restricted Work Windows
Discussion: Construction schedule accounts for delays for holidays and winter weather. Other restrictions on work windows should be known prior to start of construction. Current cost and schedule assumes work 8hrs/day M-F. It is possible additional project cost and schedule impacts will occur with numerous work window restrictions. It is also possible these impacts could be mitigated by allowing the contractor to work weekends and longer days.
Risk Reduction Measures: During PED, any additional work windows will be flushed out and should/will be incorporated in the design documents and can be reflected in the anticipated construction schedule.
• EX31 – Adequacy of Project Funds
Discussion: A delay in receiving projects funds would result in schedule delays. This risk is similar to Risk 16 regarding availability of State funding. This likelihood is possible, as this project may not be a national priority which may result in a delay due to funding.
Risk Reduction Measures: Communication with the vertical team will help to finalize a plan going forward on how this project might be funded. A realistic plan and timeline should be established prior to any funding request to ensure the proper escalation is applied.
• ES15 – Schedule
Discussion: The current schedule developed for the project includes only an estimated total duration. It is very likely once a more detailed schedule is developed for the project that there will be significant impacts once all major items have been accounted for.

Detailed Risk Register
ES-25
Risk Reduction Measures: Build and refine the schedule as soon as details are flushed out regarding the design. Contacting other USACE districts and possibly the MCX to check on recent schedules built for a similar type of bridge construction. Reaching out to industry to discuss all facets of the project, in a generic manner of course, could also shed some light on the schedule and how it has been prepared to allow for revisions that could reduce the risk.
• EX30 – Political/Local Opposition
Discussion: It is very likely there will be opposition to the project, especially from Cape residents, which could result in schedule delays. These impacts could be moderate if the pressure is continuous.
Risk Reduction Measures: Public involvement will be of the utmost importance going forward to get the public involved in the project and ensure they are on the same page as the Corps and the State and help alleviate as many concerns as possible.
• PM16 – Coordinate with State
Discussion: There would be a schedule risk associated with any delays caused by lack of state funding. Being a high priority State project, it is unlikely this will be the case here, but if it were to happen, it would have significant impact to the project schedule.
Risk Reduction Measures: Close contact with the State and open communication can help reduce risk regarding project funding and when we might receive it.
The confidence table showing the 90% confidence level is below. Note that these results reflect only those contingencies established from the schedule risk analysis.
Table 7 - Cost Contingency Analysis at Various Confidence Levels BRIDGE REHABILITATION ALTERNATIVE BRIDGE REPLACEMENT ALTERNATIVE
Most Likely Schedule Duration 72 months
Confidence Level Value Contingency Contingency
0% 96 months 24 months 33% 10% 114 months 42 months 58% 20% 118 months 46 months 64% 30% 121 months 49 months 68% 40% 124 months 52 months 72% 50% 127 months 55 months 76% 60% 129 months 57 months 79% 70% 132 months 60 months 83% 80% 135 months 63 months 87% 90% 140 months 68 months 94% 100% 163 months 91 months 127%

Detailed Risk Register
ES-26
Most Likely Schedule Duration 120 months
Confidence Level Value Contingency Contingency
0% 134 months 14 months 12% 10% 160 months 40 months 33% 20% 164 months 44 months 37% 30% 169 months 49 months 41% 40% 172 months 52 months 43% 50% 175 months 55 months 46% 60% 179 months 59 months 49% 70% 181 months 61 months 51% 80% 186 months 66 months 55% 90% 191 months 71 months 59% 100% 221 months 101 months 84%

Detailed Risk Register
ES-27
ATTACHMENT 1
DETAILED RISK REGISTERS

CCC Bridges Major Rehabilitation Evaluation Report - Bridge Rehabilitation Alternative
RT
Ref
#
CR
EF Risk/Opportunity Event Risk Event Description PDT Discussions on Impact and Likelihood
Impa
ct ©
Like
lihoo
d ©
Ris
k Le
vel ©
Impa
ct (S
)
Like
lihoo
d (S
)
Ris
k Le
vel (
S)
Cos
t Var
ianc
e D
istr
ibut
ion
Sche
dule
Va
rianc
e D
istr
ibut
ion
Low Variance (Min) Likely (C) High Variance
(80%H)
Low Variance (S)
(Min)Likely (S)
High Variance (S)
(80%H)Risk Quantification Discussions Risk Mitigation Measures
CA - 1 Consolidation
Contracting Division at NAE has expressed concern over projects and the idea of consolidation. It is possible we would be required to provide separate contracts.
With the size and complexity of the projects, it is likely the PDT and PM will be able to overcome this concern. It is extremely unlikely we would be forced to utilize two contracts. If we were forced to it is likely we would experience an increase in project cost as this would require two contractors and twice the effort to oversee these efforts. It is possible there would be schedule impact during the solicitation process as NAE may not have the expertise for two simultaneous solicitations.
Moderate Unlikely Low Moderate Unlikely Low Uniform Uniform $0 $0 $14,250,834 0 Months 0 Months 3 Months
Assume design is 10% of construction cost. Assume high variance represents an additional 30% of the design/build contract costs and 3 months to cover additional management of 2nd contract and loss of consistency in process/design. Low variance is $0 and 0 months and likely value is $0 and 0 months as we have assumed one contract action will be sufficient for both bridge replacements.
Risk can be mitigated by completing the acquisition plan as soon as possible. This will be done subsequent to the planning document being finalized but this issue should be resolved as soon as possible.
CA 38 2 Acquisition StrategyThe current assumption is a design/bid/build contract, likely best value procurement.
The initial major rehab would likely be one contract. PDT assumes best value procurement; estimated PED costs in the TPCS will mirror that assumption.
#N/A #N/A N/A -Not Modeled
N/A -Not Modeled N/A - Not Modeled N/A - Not Modeled N/A - Not
ModeledN/A - Not Modeled
CA 44 3 Contract Modifications With a project of this size, contract mods are unavoidable.
Due to the project size and complexity, the PDT is certain there will be contract mods during construction. Depending on what the mod is for, the impact to cost and schedule could be significant.
Significant CertainRelook at Basis of Estimate
Significant CertainRelook at Basis of Schedule
Triangular Triangular $14,250,834 $19,001,111 $47,502,779 2 Months 6 Months 9 Months
A contract of this size and complexity is all but certain to have modifications associated with it. The low variance is assumed to be 3% of the construction cost and the high variance is assumed to be 10% of the construction cost. Schedule impacts are assumed to be 2 months for the low variance and 9 months for the high variance while the likely impact is 6 months.
The easier way to reduce contract modifications is to make the design documents as clear and understable as possible. This will help reduce contractor questions during construction. Some issues are unavoidable, but having clear and concise documents will help reduce the risk of mods.
LD 183 4 Real Estate/Land Acquisition
The Bridge Rehab alternative will take place between the bridge abutments only. No real estate is required.
No risk associated with this item. #N/A #N/A N/A -Not Modeled
N/A -Not Modeled N/A - Not Modeled N/A - Not Modeled N/A - Not
ModeledN/A - Not Modeled
LD - #N/A #N/A N/A - Not Modeled N/A - Not Modeled N/A - Not Modeled
N/A - Not Modeled
CO 103 5 Contractor Staging/Storage Areas
Will the contractor require staging area(s) outside the bridge abutments?
The work that comprises the major rehab has been completed on both bridges in the past. Staging areas/storage areas exist for this type of rehab work on Corps-owned property. Risk not modeled.
#N/A #N/A N/A -Not Modeled
N/A -Not Modeled N/A - Not Modeled N/A - Not Modeled N/A - Not
ModeledN/A - Not Modeled
CO - 6 Construction Means/Methods
USACE would require navigation lanes in the Cape Cod Canal remain open. Means & methods of construction would be left to the contractor.
This is something that would be accounted for by the contractor. Risk not modeled.
#N/A #N/A N/A -Not Modeled
N/A -Not Modeled N/A - Not Modeled N/A - Not Modeled N/A - Not
ModeledN/A - Not Modeled
CO 77 7 Restricted Work Windows
There will be restrictions on work periods throughout the construction (i.e. lane closures are not allowed between Memorial Day and Columbus Day).
Construction schedule accounts for delays for holidays and winter weather. Other restrictions on work windows should be known prior to start of construction. Current cost and schedule assumes work 8hrs/day M-F. Having to work around windows will certainly impact cost and mostly schedule.
Marginal CertainRelook at Basis of Estimate
Significant CertainRelook at Basis of Schedule
Uniform Uniform $0 $0 $9,500,556 0 Months 0 Months 6 Months
The construction schedule currently assumes limited work during the summer months (no lane closures will be permitted during those months). Any additional unknown restrictions on work windows have the ability to put the construcion to the right. The low variance and likely value are assumed to be zero if no additional work windows are imposed on the project. It is assumed additional work restrictions could add 12 months to the construction schedule, resulting in an addiitonal 2% to the construction cost (assumed escalation rate).
During PED, any additional work windows will be flushed out and should/will be incorporated in the design documents and can be reflected in the anticapted construction schedule.
CO 81 8 Weather Impacts Work in this area will experience weather impacts.
While the likelihood of weather impacts are certain, they can be mitigated in the construction schedule by allowing for weather delays in those times of year when they are expected. Large weather events would continue to impact cost and schedule.
Marginal CertainRelook at Basis of Estimate
Marginal CertainRelook at Basis of Schedule
Uniform Uniform $0 $0 $4,750,278 0 Months 0 Months 6 Months
A certain number of weather delays will be allowed per the contract, however extreme adverse weather is possible as the construction duration will stretch over many years with many opportuniities for severe storms. The low variance and likely value are zero assuming the contractor is able to successfully work around any weather events. The risk associated with modifications captures a majority of this risk, however weather impacts have the ability affect cost and schedule. The high variance is assumed to be 1% of the construction cost and 6 months of schedule delay.
Ensure the contractor has a plan in place for emergencies such as severe weather events. This should help reduce life-safety-related emergencies. Otherwise, there isn't much that can be mitigated as far as weather is concerned.
Bridge Rehabilitation Alternative, NAE (New England District) Cost and Schedule Risk Register
CostProject ScheduleProject Cost Other Information
Cost Model Schedule Model
Schedule Duration
Contract Acquisition (CA)
Construction (CO)
Lands and Damages (LD)
COST AND SCHEDULE RISK ANALYSIS - ATTACHMENT 1

CCC Bridges Major Rehabilitation Evaluation Report - Bridge Rehabilitation Alternative
RT
Ref
#
CR
EF Risk/Opportunity Event Risk Event Description PDT Discussions on Impact and Likelihood
Impa
ct ©
Like
lihoo
d ©
Ris
k Le
vel ©
Impa
ct (S
)
Like
lihoo
d (S
)
Ris
k Le
vel (
S)
Cos
t Var
ianc
e D
istr
ibut
ion
Sche
dule
Va
rianc
e D
istr
ibut
ion
Low Variance (Min) Likely (C) High Variance
(80%H)
Low Variance (S)
(Min)Likely (S)
High Variance (S)
(80%H)Risk Quantification Discussions Risk Mitigation Measures
Bridge Rehabilitation Alternative, NAE (New England District) Cost and Schedule Risk Register
CostProject ScheduleProject Cost Other Information
Cost Model Schedule Model
Schedule Duration
CO 88 9 Site Access/Haul RoutesThere are only so many options to access the site for workers and materials.
The work that comprises the major rehab has been completed on both bridges in the past with no issues regarding site access or haul routes. Risk not modeled.
#N/A #N/A N/A -Not Modeled
N/A -Not Modeled N/A - Not Modeled N/A - Not Modeled N/A - Not
ModeledN/A - Not Modeled
CO 89 10 Environmental Restrictions Lead paint will be an issue during any steel repairs and painting.
Lead paint does still exist on the bridges and will have to handled accordingly. This can be mitigated to the extent possible during design of the rehab. The current cost estimate does not adequately account for lead paint abatement as the scope of the repairs is still very much unknown. The impact is expected to be moderate as not all aspects of the repair involve lead paint covered features of the bridge.
Moderate CertainRelook at Basis of Estimate
Marginal CertainRelook at Basis of Schedule
Triangular Triangular $4,750,278 $11,875,695 $23,751,389 2 Months 6 Months 12 Months
There is no accounting for lead paint abatement in the cost estimate. Assuming half of the rehabilitation projects will involve lead paint abatement of some sort, low variance is assumed to repressent 2% of half the rehab cost while the high variance represents 10% of those costs. The likely value is assumed to be 5% of the rehab costs.
This risk can be mitigated by reviewing actual contract awards for work on the bridges to review the impact of lead abatement and incorporate that into the cost estimate and schedule.
CO 105 11 Material availability and delivery
Lead time and availability could be an issue with steel necessary for bridge repairs.
No steel shortage is expected in the next several years however if the material were to become scarce, this could have moderate impact to both the cost and schedule.
Moderate Unlikely Low Moderate Unlikely Low Uniform Uniform $0 $0 $10,619,626 0 Months 0 Months 6 Months
The low variance and the likely value are zero, assuming there are no issues with material availability as there should be sufficient lead time in order to order and deliver any and all materials. In the case there are issues with any materials, the high variance is assumed to be 10% of the assumed material cost and a 6 month schedule delay.
Researching material availability in advance and ordering any long-lead items well in advance of their installation date.
ES - 12 Cost Estimate Basis of Cost Estimate is unit prices and parametric data.
The level of design is pre-conceptual at this point. Items included in the major rehab have been generated by the Structural Section based on their Structural Reliability Analysis. The cost estimate has been put together in MII using unit prices from Mass DOT as well as other smaller bridge projects from NAE. Several items are estimated using parametric cost data from historical projects. It is very likely the current cost estimate has omitted items, underestimated the quantity, or underestimated the cost. The impacts have the potential to be significant.
SignificantVery Likely
High #N/A Triangular N/A -Not Modeled -$23,751,389 $0 $142,508,336 N/A - Not
ModeledN/A - Not Modeled
It is possible the cost estimate is overestimating quantities and unit prices however the cost estimate is based on extremely limited design and contains a majority of unit prices and parametric cost data. Assume low variance for cost estimate represents -5% of the construction cost and the high variance for cost estimate is 30% of the construction cost.
Build and refine cost estimate as soon as details are flushed out regarding the design. Contacting other USACE districts and possibly the MCX to check on recent estimates built for this type of bridge construction. Reaching out to industry to discuss all facets of the project, in a generic manner of course, could also shed some light on the cost estimate and how it has been prepared to allow for revisions that could reduce the risk.
ES - 13 Schedule Schedule is very basic and currently includes only total duration estimation.
The current schedule developed for the project includes only an estimate total duration. It is very likely once a more detailed schedule is developed for the project that there will be significant impacts once all major items have been accounted for.
#N/A Significant Very Likely High N/A -Not Modeled Triangular N/A - Not Modeled N/A - Not Modeled -6 Months 0 Months 18 Months
Similar to the cost estimate risk discussion, the schedule is based on professional judgement of the PDT and construction duration of similar work contracted by the District in the past. Whiel it is not likely to take much less time, assume 6 months less time, but could take more, assume 60 months more time over the 50 year design life for both bridges.
Build and refine the schedule as soon as details are flushed out regarding the design. Contacting other USACE districts and possibly the MCX to check on recent schedules built for this type of bridge construction. Reaching out to industry to discuss all facets of the project, in a generic manner of course, could also shed some light on the schedule and how it has been prepared to allow for revisions that could reduce the risk.
PM - 14 Coordinate with State Coordination with the State will be required for lane closures, etc.
The State has the ability to stop work in the case of extreme traffic delays, however this is unlikely but could have a significant impact to the schedule.
#N/A Significant Unlikely Medium Uniform Uniform $0 $0 $9,500,556 0 Months 3 Months 12 Months
There is significant coordination that will be necessary throughout the life of the project. The State will have constant input to USACE on construction and any traffic delays induced by construction. The State could put pressure on USACE to halt construction during high-traffic events. Low variance and likely values are zero assuming any projects requiring lane closures will not be allowed during summer months; however the high variance is assumed to be 2% of the construction cost, which represents additional escalation costs assumed at 2% per year on average, and 12 month schedule increase.
Close contact with the State and open communication can help reduce risk regarding lane closures and traffic impacts to forewarn them if we anticipate any additional delays or unexpected lane closures during those non-summer periods.
PM 18/19 15 PED and S&A FundingE&D and CM costs will vary significantly from the costs assumed in TPCS.
Recent planning projects have included extensive coordination with the PM, cost engineer, and resource providers to furnish estimates for PED and S&A. With a project of this size, all the project requirements may not be known at that time. This could result in additional project costs for PED and S&A. Based on the size of the individual project compared to the overall project cost, these impacts will likely be marginal.
Marginal Possible Low #N/A Triangular N/A -Not Modeled
N/A - Not Modeled
N/A - Not Modeled
PED and S&A values have been vetted through the Engineering and Construction divisions however it is difficult to accurately guage the design costs with a project of this size. The PED value is based on a percentage of the construction costs and the S&A costs were developed by Construction division but are based on a very rough schedule/duration. The low variance assumes X% decrease in PED and S&A costs while the high variance assumes a Y% increase in those costs. The likely value is zero, assuming the current values are sufficient.
RE - 16 Endangered species
The long eared bat was found near the Sagamore Bridge abutments. Possibility of having to avoid this area during certain times of day/year.
Schedule impact possible. It is possible a limitation may be imposed that no work will permitted during the nighttime hours in the summer months. This would only impact the contractor only if they were trying to work 24/7. The likelihood is unlikely as the contractor will probably not be allowed to work 24/7. If they were, this would have a moderate impact to the schedule.
#N/A Moderate Unlikely Low N/A -Not Modeled Triangular N/A - Not Modeled N/A - Not Modeled N/A - Not
ModeledN/A - Not Modeled
RE - 17 Air quality Timing issues possible to comply with air quality issues.
These issues will likely be addressed with EPA during NEPA process.
#N/A #N/A N/A -Not Modeled
N/A -Not Modeled N/A - Not Modeled N/A - Not Modeled N/A - Not
ModeledN/A - Not Modeled
6 Months
Regulatory & Environmental (RE)
Project & Program Management (PM)
Cost and Schedule (ES)
COST AND SCHEDULE RISK ANALYSIS - ATTACHMENT 1

CCC Bridges Major Rehabilitation Evaluation Report - Bridge Rehabilitation Alternative
RT
Ref
#
CR
EF Risk/Opportunity Event Risk Event Description PDT Discussions on Impact and Likelihood
Impa
ct ©
Like
lihoo
d ©
Ris
k Le
vel ©
Impa
ct (S
)
Like
lihoo
d (S
)
Ris
k Le
vel (
S)
Cos
t Var
ianc
e D
istr
ibut
ion
Sche
dule
Va
rianc
e D
istr
ibut
ion
Low Variance (Min) Likely (C) High Variance
(80%H)
Low Variance (S)
(Min)Likely (S)
High Variance (S)
(80%H)Risk Quantification Discussions Risk Mitigation Measures
Bridge Rehabilitation Alternative, NAE (New England District) Cost and Schedule Risk Register
CostProject ScheduleProject Cost Other Information
Cost Model Schedule Model
Schedule Duration
TD - 18 Current Design Status
The current design is conceptual at this point. There is a high likelihood that that as the design is flushed out, the cost of the project will be impacted.
Current cost is based on unit price data and programmatic costs from other projects; this data may not be scalable to a project this size.
SignificantVery Likely
High #N/A Triangular N/A -Not Modeled $9,500,556 $14,250,834 $47,502,779 N/A - Not
ModeledN/A - Not Modeled
The unit pricing and historical pricing information utilized in the cost estimate may not be scalable to for a project of this size. Assume low variance for current design status is 2% of the construction cost; this is minimal because there might be some "savings" realized by combining several projects into one contract. Assume high variance is 15% of construction cost. The likely value is 5% of the construction cost.
Additional review of those historical costs will be beneficial to flush out and refine the cost estiamte for this rehab alternative. As each piece of the rehab is actually designed the estimate can be refined.
TD - 19 NEPA Documentation vs Design
Is NEPA documentation part of the design documentation. If NEPA is involved in design documentation there would be cost and schedule impacts. If not, then any redesign (not what was included in NEPA documentation) will also have cost and schedule impacts.
Either option has the possibility of cost and schedule impacts.
Marginal Possible Low Marginal Possible Low Triangular Triangular $2,375,139 $4,750,278 $9,500,556 3 Months 6 Months 12 Months
The low variance is assumed to be 0.5% of the construction cost, while the high variance is assumed to be 2% of the construction cost. The likely value is assumed to be low value as there is some cost impact expected to deal with the NEPA documentation.
EX - 20 Stakeholder Input/Coordination
Coordination with the state and local communities is required for traffic control, lane closures and full bridge closures.
Coordination only. No anticipated schedule or cost impact. #N/A #N/A N/A -Not Modeled
N/A -Not Modeled N/A - Not Modeled N/A - Not Modeled N/A - Not
ModeledN/A - Not Modeled
EX 205 21 Political/Local Opposition
There are folks on the Cape that would prefer the project not be constructed. This has the ability to create schedule impacts.
It is very likely there will be opposition to the project which could result in schedule delays. These impacts could be moderate if the pressure is continuous.
NegligibleVery Likely
Low Moderate Very Likely High Uniform Uniform $0 $0 $9,500,556 0 Months 0 Months 12 Months
While it is known the State is very much in favor of this project, it is possible the locals, especially those on the Cape, will be opposed to the project. These local residents have the ability to cause problems through their opposition which could result in delays to the project. The low variance and likely value are zero assuming there are no issues with opposition while the high variance is assumed to be 2% of the construction cost, which represents a 1 year delay to the project.
Public involvement will be of the utmost importance going forward to get the public involved in the project and ensure they are on the same page as the Corps and the State and help allieviate as many concerns as possible.
EX - 22 Adequacy of project funds
There is a possibility of not receiving funds in a timely manner resulting in delays to the design and/or the construction.
A delay in receiving projects funds would result in schedule delays. This risk is similar to Risk 16 regarding availability of State funding. This likelihood is possible, as this project may not be a national priority which may result in a delay due to funding.
Marginal Possible Low Significant Possible Medium Uniform Uniform $0 $0 $14,250,834 0 Months 0 Months 18 Months
While there is concern about the State providing funding in a timely manner, there is also concern about the Federal portion of funding being available. This project represents a vast portion of the available annual funding for all USACE projects. It is likely that if replacement is the option pushed forward that it will take a year or more to orchastrate some funding vehicle. Since it is not clear if this option will be pushed forward, the low variance and likely values are zero, while the high variance is assumed to be 3% of the construction cost (based on 2% escalation) assuming it will take 18 months or so to figure out federal funding for the project.
Communication with the vertical team will help to finalize a plan going forward on how this project might be funded. A realistic plan and timeline should be established prior to any funding request to ensure the proper escalation is applied.
EX 203 23 Bidding ClimateWhat contractors are available and will be available when the project is solicited.
The size and potential value of this project will likely draw any and all qualified contractors to the table. It is unlikely this would be an issue but could have moderate impact on project cost if the competition is not there during the selection process.
Marginal Unlikely Low #N/A Triangular N/A -Not Modeled -$23,751,389 $0 $23,751,389 N/A - Not
ModeledN/A - Not Modeled
Assume cost impact of bidding climate is 5% of construction cost. Assume best value procurement method has the ability to lower costs based on an extremely competitive offeror in a best value contract vehicle where price is an important factor but a lack of competition can also drive up prices. Assume low variance is a 5% reduction in construction cost and assume high variance is a 5% increase in construction cost.
Market research will help to mitigate this risk to see how much competition there might be for contract award.
External
COST AND SCHEDULE RISK ANALYSIS - ATTACHMENT 1
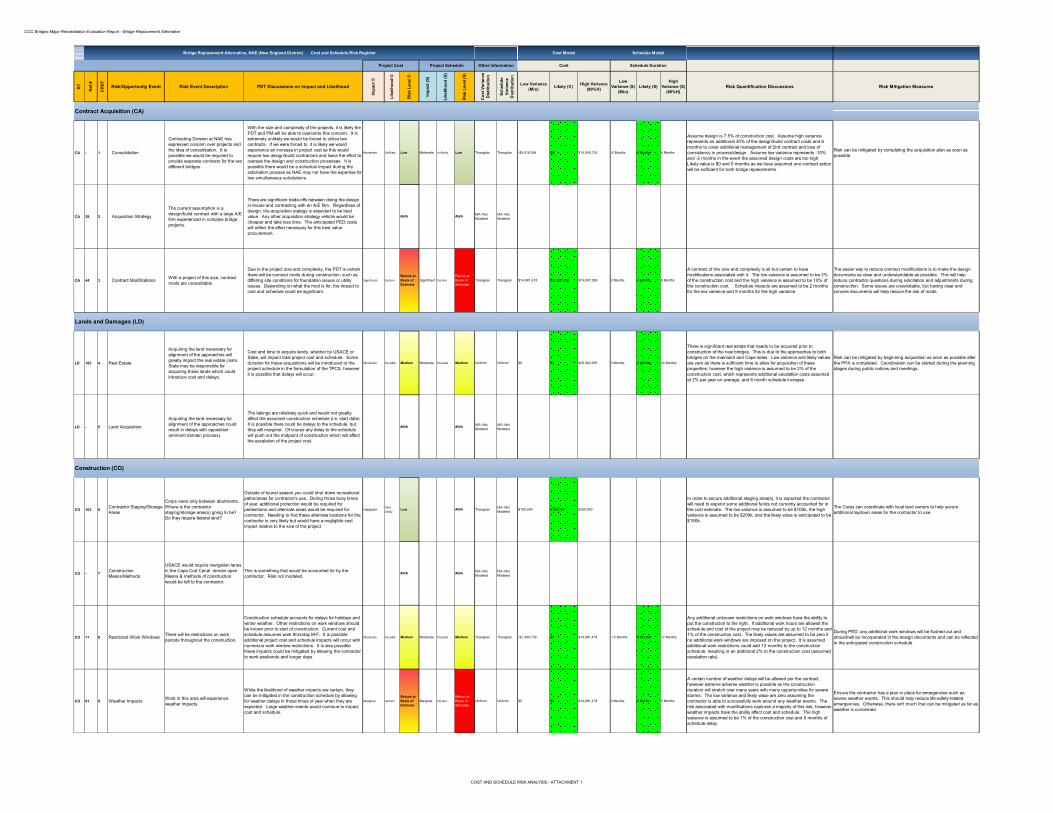
CCC Bridges Major Rehabilitation Evaluation Report - Bridge Replacement Alternative
RT
Ref
#
CR
EF Risk/Opportunity Event Risk Event Description PDT Discussions on Impact and Likelihood
Impa
ct ©
Like
lihoo
d ©
Ris
k Le
vel ©
Impa
ct (S
)
Like
lihoo
d (S
)
Ris
k Le
vel (
S)
Cos
t Var
ianc
e D
istr
ibut
ion
Sche
dule
Va
rianc
e D
istr
ibut
ion
Low Variance (Min) Likely (C) High Variance
(80%H)
Low Variance (S)
(Min)Likely (S)
High Variance (S)
(80%H)Risk Quantification Discussions Risk Mitigation Measures
CA - 1 Consolidation
Contracting Division at NAE has expressed concern over projects and the idea of consolidation. It is possible we would be required to provide separate contracts for the two different bridges.
With the size and complexity of the projects, it is likely the PDT and PM will be able to overcome this concern. It is extremely unlikely we would be forced to utilize two contracts. If we were forced to it is likely we would experience an increase in project cost as this would require two design/build contractors and twice the effort to oversee the design and construction processes. It is possible there would be a schedule impact during the solicitation process as NAE may not have the expertise for two simultaneous solicitations.
Moderate Unlikely Low Moderate Unlikely Low Triangular Triangular -$5,618,054 $0 $14,045,135 -2 Months 0 Months 6 Months
Assume design is 7.5% of construction cost. Assume high variance represents an additional 30% of the design/build contract costs and 6 months to cover additional management of 2nd contract and loss of consistency in process/design. Assume low variance represents -10% and -2 months in the event the assumed design costs are too high. Likely value is $0 and 0 months as we have assumed one contract action will be sufficient for both bridge replacements.
Risk can be mitigated by completing the acquisition plan as soon as possible.
CA 38 2 Acquisition Strategy
The current assumption is a design/build contract with a large A/E firm experienced in complex bridge projects.
There are significant trade-offs between doing the design in-house and contracting with an A/E firm. Regardless of design, the acquisition stategy is expected to be best value. Any other acquisition strategy vehicle would be cheaper and take less time. The anticipated PED costs will reflect the effort necessary for this best value procurement.
#N/A #N/A N/A -Not Modeled
N/A -Not Modeled
CA 44 3 Contract Modifications With a project of this size, contract mods are unavoidable.
Due to the project size and complexity, the PDT is certain there will be contract mods during construction; such as differing site conditions for foundation issues or utility issues. Depending on what the mod is for, the impact to cost and schedule could be significant.
Significant CertainRelook at Basis of Estimate
Significant CertainRelook at Basis of Schedule
Triangular Triangular $14,981,478 $29,962,956 $74,907,389 2 Months 4 Months 9 Months
A contract of this size and complexity is all but certain to have modifications associated with it. The low variance is assumed to be 3% of the construction cost and the high variance is assumed to be 10% of the construction cost. Schedule impacts are assumed to be 2 months for the low variance and 9 months for the high variance.
The easier way to reduce contract modifications is to make the design documents as clear and understandable as possible. This will help reduce contractor questions during solicitation and adjustments during construction. Some issues are unavoidable, but having clear and concise documents will help reduce the risk of mods.
LD 183 4 Real Estate
Acquiring the land necessary for alignment of the approaches will greatly impact the real estate costs. State may be responsible for acquiring these lands which could introduce cost and delays.
Cost and time to acquire lands, whether by USACE or State, will impact total project cost and schedule. Some duration for these acquisitions will be introduced to the project schedule in the formulation of the TPCS, however it is possible that delays will occur.
Moderate Possible Medium Moderate Possible Medium Uniform Uniform $0 $0 $29,962,956 0 Months 0 Months 24 Months
There is significant real estate that needs to be acquired prior to construction of the new bridges. This is due to the approaches to both bridges on the mainland and Cape sides. Low variance and likely values are zero as there is sufficient time to allow for acquisition of these properties; however the high variance is assumed to be 2% of the construction cost, which represents additional escalation costs assumed at 2% per year on average, and 6 month schedule increase.
Risk can be mitigated by beginning acquisition as soon as possible after the PPA is completed. Coordination can be started during the planning stages during public notices and meetings.
LD - 5 Land Acquisition
Acquiring the land necessary for alignment of the approaches could result in delays with opposition (eminent domain process).
The takings are relatively quick and would not greatly affect the assumed construction schedule (i.e. start date). It is possible there could be delays to the schedule, but they will marginal. Of course any delay to the schedule will push out the midpoint of construction which will affect the escalation of the project cost.
#N/A #N/A N/A -Not Modeled
N/A -Not Modeled
CO 103 6 Contractor Staging/Storage Areas
Corps owns only between abutments. Where is the contractor staging/storage area(s) going to be? Do they require federal land?
Outside of tourist season you could shut down recreational paths/areas for contractor's use. During those busy times of year, additional protection would be required for pedestrians and alternate areas would be required for contractor. Needing to find these alternate locations for the contractor is very likely but would have a negligible cost impact relative to the size of the project.
NegligibleVery Likely
Low #N/A Triangular N/A -Not Modeled $100,000 $125,000 $200,000
In order to secure additional staging area(s), it is expected the contractor will need to expend some additional funds not currently accounted for in the cost estimate. The low variance is assumed to be $100k, the high variance is assumed to be $200k, and the likely value is anticipated to be $150k.
The Corps can coordinate with local land owners to help secure additional laydown areas for the contractor to use.
CO - 7 Construction Means/Methods
USACE would require navigation lanes in the Cape Cod Canal remain open. Means & methods of construction would be left to the contractor.
This is something that would be accounted for by the contractor. Risk not modeled.
#N/A #N/A N/A -Not Modeled
N/A -Not Modeled
CO 77 8 Restricted Work Windows There will be restrictions on work periods throughout the construction.
Construction schedule accounts for delays for holidays and winter weather. Other restrictions on work windows should be known prior to start of construction. Current cost and schedule assumes work 8hrs/day M-F. It is possible additional project cost and schedule impacts will occur with numerous work window restrictions. It is also possible these impacts could be mitigated by allowing the contractor to work weekends and longer days.
Moderate Possible Medium Moderate Possible Medium Triangular Triangular -$7,490,739 $0 $14,981,478 -12 Months 0 Months 12 Months
Any additional unknown restrictions on work windows have the ability to put the construcion to the right. If additional work hours are allowed the schedule and cost of the project may be reduced by up to 12 months and 1% of the construction cost. The likely values are assumed to be zero if no additional work windows are imposed on the project. It is assumed additional work restrictions could add 12 months to the construction schedule, resulting in an additonal 2% to the construction cost (assumed escalation rate).
During PED, any additional work windows will be flushed out and should/will be incorporated in the design documents and can be reflected in the anticipated construction schedule.
CO 81 9 Weather Impacts Work in this area will experience weather impacts.
While the likelihood of weather impacts are certain, they can be mitigated in the construction schedule by allowing for weather delays in those times of year when they are expected. Large weather events would continue to impact cost and schedule.
Marginal CertainRelook at Basis of Estimate
Marginal CertainRelook at Basis of Schedule
Uniform Uniform $0 $0 $14,981,478 0 Months 0 Months 6 Months
A certain number of weather delays will be allowed per the contract, however extreme adverse weather is possible as the construction duration will stretch over many years with many opportuniities for severe storms. The low variance and likely value are zero assuming the contractor is able to successfully work around any weather events. The risk associated with modifications captures a majority of this risk, however weather impacts have the ability affect cost and schedule. The high variance is assumed to be 1% of the construction cost and 6 months of schedule delay.
Ensure the contractor has a plan in place for emergencies such as severe weather events. This should help reduce life-safety-related emergencies. Otherwise, there isn't much that can be mitigated as far as weather is concerned.
Contract Acquisition (CA)
Construction (CO)
Lands and Damages (LD)
Bridge Replacement Alternative, NAE (New England District) Cost and Schedule Risk Register
CostProject ScheduleProject Cost Other Information
Cost Model Schedule Model
Schedule Duration
COST AND SCHEDULE RISK ANALYSIS - ATTACHMENT 1
CCC Bridges Major Rehabilitation Evaluation Report - Bridge Replacement Alternative
RT
Ref
#
CR
EF Risk/Opportunity Event Risk Event Description PDT Discussions on Impact and Likelihood
Impa
ct ©
Like
lihoo
d ©
Ris
k Le
vel ©
Impa
ct (S
)
Like
lihoo
d (S
)
Ris
k Le
vel (
S)
Cos
t Var
ianc
e D
istr
ibut
ion
Sche
dule
Va
rianc
e D
istr
ibut
ion
Low Variance (Min) Likely (C) High Variance
(80%H)
Low Variance (S)
(Min)Likely (S)
High Variance (S)
(80%H)Risk Quantification Discussions Risk Mitigation Measures
Bridge Replacement Alternative, NAE (New England District) Cost and Schedule Risk Register
CostProject ScheduleProject Cost Other Information
Cost Model Schedule Model
Schedule Duration
CO - 10 Historical Preservation
There is a risk of uncovering historical, archeological and culturally significant artifacts while excavating for the new bridge abutments.
Finding these items is unlikely but would have significant impacts to the schedule as you would have to stop work and excavate carefully and comply with any applicable regulations.
Moderate Unlikely Low Significant Unlikely Medium Uniform Uniform $0 $0 $5,886,378 0 Months 0 Months 6 Months
The only area(s) of concern for historical preservation lie in the abutment and pier areas. Artifacts would be found during excavaction of these areas. The low variance and likely value are zero assuming no historically significant items are found. The high variance is assumed to be 25% of the excavation costs.
Again, during PED the area can be scanned for historical artifacts. If anything is uncovered, they can be incorporated into the design documents and planned for accordingly.
CO 88 11 Site Access/Haul RoutesThere are only so many options to access the site for workers and materials.
This is a seasonally dependent and time of day risk. These risks can be mitigated in the estimate and schedule. There is also concern over needing to utilize local road and highways which may not be adequate for large construction vehicles/overuse.
Marginal Likely Meduim #N/A Triangular N/A -Not Modeled -$4,407,636 $0 $8,815,271
The replacement bridges will require access to the proposed abutments that don't currently exist. If the new approach roadways are not constructed, the contractor may have to construct temporary access roads not necessarily in the same location as the permenant roads. The low variance is assumed to be -5% if a majority of the temporary and permenant roadways are laid out in the same place. The high variance is assumed to be 10% of the construction of the new approach roads.
The local roadway improvements wilil be paid for by the State. Hopefully they can be planned for and land acquired before the start of bridge construction to allow for usage during construction.
CO 89 12 Environmental Restrictions Lead paint will be an issue during demolition. This is being accounted for in demolition cost. #N/A #N/A N/A -Not
ModeledN/A -Not Modeled
CO 105 13 Material availability and delivery
Lead time and availability could be an issue with cable stay bridge components and steel in general.
Fabrication and delivery of cable stay bridge components, and steel components in general, could be an issue. This will likely be mitigated through construction schedule and ordering long lead items in a timely manner; but this is dependent on having an efficient contractor. It is possible there could be moderate impacts to cost and schedule if steel is not readily available and/or fab/delivery of key components is delayed.
Moderate Possible Medium Moderate Possible Medium Triangular Triangular -$5,000,000 $0 $25,000,000 -2 Months 0 Months 6 Months
The low variance and the likely value are zero, assuming there are no issues with material availability as there should be sufficient lead time in order to order and deliver any and all materials. In the case there are issues with any materials, the high variance is assumed to be 10% of the assumed material cost and a 6 month schedule delay.
Researching material availability in advance and ordering any long-lead items well in advance of their installation date.
ES - 14 Cost Estimate Basis of Cost Estimate is unit prices and parametric data.
The level of design is conceptual at this point. Design documents include an elevation view and a cross section. The cost estimate has been put together in MII using unit prices from Mass DOT as well as other smaller bridge projects from NAE. Several items are estimated using parametric cost data from historical projects. It is very likely the current cost estimate has omitted items, underestimated the quantity, or underestimated the cost. The impacts have the potential to be significant.
SignificantVery Likely
High #N/A Triangular N/A -Not Modeled -$37,453,695 $0 $224,722,168
It is possible the cost estimate is overestimating quantities and unit prices however the cost estimate is based on extremely limited design and contains a majority of unit prices and parametric cost data. Assume low variance for cost estimate represents -5% of the construction cost and the high variance for cost estimate is 50% of the construction cost.
Build and refine cost estimate as soon as details are flushed out regarding the design. Contacting other USACE districts and possibly the MCX to check on recent estimates built for this type of bridge construction. Reaching out to industry to discuss all facets of the project, in a generic manner of course, could also shed some light on the cost estimate and how it has been prepared to allow for revisions that could reduce the risk.
ES - 15 Schedule Schedule is very basic and currently includes only total duration estimation.
The current schedule developed for the project includes only an estimated total duration. It is very likely once a more detailed schedule is developed for the project that there will be significant impacts once all major items have been accounted for.
#N/A Significant Very Likely High N/A -Not Modeled Triangular -6 Months 0 Months 12 Months
Similar to the cost estimate risk discussion, the schedule is based on professional judgement of the PDT and construction duration of similar bridges constructed by others. At 5 years per bridge, it is not likely to take much less time, assume 6 months less time, but could take more, assume 12 months more time.
Build and refine the schedule as soon as details are flushed out regarding the design. Contacting other USACE districts and possibly the MCX to check on recent schedules built for a similar type of bridge construction. Reaching out to industry to discuss all facets of the project, in a generic manner of course, could also shed some light on the schedule and how it has been prepared to allow for revisions that could reduce the risk.
PM - 16 Coordinate with State
There is a risk associated with the State having funds available in timely fashion to coordinate with our construction schedule.
There would be a schedule risk associated with any delays caused by lack of state funding. Being a high priority State project, it is unlikely this will be the case here, but if it were to happen, it would have significant impact to the project schedule.
#N/A Significant Unlikely Medium Uniform Uniform $0 $0 $14,981,478 0 Months 0 Months 12 Months
There is significant coordination that needs to be done in regards to project funding and receiving the State portion. This is due to the approaches to both bridges on the mainland and Cape sides. Low variance and likely values are zero as there is sufficient time to allow for acquisition of these properties; however the high variance is assumed to be 2% of the construction cost, which represents additional escalation costs assumed at 2% per year on average, and 12 month schedule increase.
Close contact with the State and open communication can help reduce risk regarding project funding and when we might receive it.
PM 18/19 17 PED and S&A FundingE&D and CM costs will vary significantly from the costs assumed in TPCS.
Recent planning projects have included extensive coordination with the PM, cost engineer, and resource providers to furnish estimates for PED and S&A. With a project of this size, all the project requirements may not be known at that time. This could result in additional project costs for PED and S&A. Based on the size of the project, these impacts will likely be marginal.
Marginal Possible Low #N/A Triangular N/A -Not Modeled -$7,490,739 $0 $14,981,478 N/A - Not
ModeledN/A - Not Modeled
PED and S&A values have been vetted through the Engineering and Construction divisions however it is difficult to accurately guage the design costs with a project of this size. The PED value is based on a percentage of the construction costs and the S&A costs were developed by Construction division but are based on a very rough schedule/duration. The low variance assumes X% decrease in PED and S&A costs while the high variance assumes a Y% increase in those costs. The likely value is zero, assuming the current values are sufficient.
PM 30 18 Unplanned work that must be accommodated
There is a risk of competing priorities for PDT members.
There are always competing priorities. The likelihood is "very likely" however the impacts will be negligible as this is a high priority project for the District. Other projects will be pushed off in order to have PDT available when necessary.
NegligibleVery Likely
Low Negligible Very Likely Low Uniform Uniform $0 $0 $7,490,739 0 Months 0 Months 6 Months
The design of this project will be a district priority. There is a chance there will other district priorities that may share time in the spotlight. There is a chance this project could be delayed in the design stages by competing work. Assume low variance is zero, likely value is zero (assuming no delays due to unplanned work), and assume unplanned work pushes this design 6 months to the right, which translates to 1% of the construction cost based on a 2% annual escalation impact.
Keeping this project fresh in the minds of upper management will help maintain it as district priority. The public involvement will also go a long way in maintaining that status. To keep the project from falling behind at the working level, the first level supervisors will need to be made aware of, and reminded of, the high priority of this project to keep those PDT members ununcumbered with other high priority projects.
Project & Program Management (PM)
Cost and Schedule (ES)
COST AND SCHEDULE RISK ANALYSIS - ATTACHMENT 1

CCC Bridges Major Rehabilitation Evaluation Report - Bridge Replacement Alternative
RT
Ref
#
CR
EF Risk/Opportunity Event Risk Event Description PDT Discussions on Impact and Likelihood
Impa
ct ©
Like
lihoo
d ©
Ris
k Le
vel ©
Impa
ct (S
)
Like
lihoo
d (S
)
Ris
k Le
vel (
S)
Cos
t Var
ianc
e D
istr
ibut
ion
Sche
dule
Va
rianc
e D
istr
ibut
ion
Low Variance (Min) Likely (C) High Variance
(80%H)
Low Variance (S)
(Min)Likely (S)
High Variance (S)
(80%H)Risk Quantification Discussions Risk Mitigation Measures
Bridge Replacement Alternative, NAE (New England District) Cost and Schedule Risk Register
CostProject ScheduleProject Cost Other Information
Cost Model Schedule Model
Schedule Duration
PM 35 19 Losing Key PersonnelBased on the duration of the project, there is a high likelihood of PDT turnover.
It is likely that, based on the project duration, the District will lose key personnel on this project to retirement or other opportunities. This will result in a loss of institutional knowledge which will require new PDT members ramp up on the project and all the requirements.
#N/A Moderate Very Likely High N/A -Not Modeled Triangular 1 Months 0 Months 6 Months
Based on the attrition rate and the time it takes to hire someone and get them onboard, assume low variance of 1 month to ramp up an existing employee to the project and assume high variance of 6 months if an outside person needs to be brought in and then ramped up on the project. Likely value is 1 month as we expect some transfer of knowledge required through the life of the project.
This risk can be mitigated to the extent possible by keeping those existing PDT members engaged and on the project throughout it's life span. If a PDT member is leaving the project, for whatever reason, there should be some summarization of their work completed to date, such as a design analysis, to inform those taking over of what, exactly, has been done to date and why.
RE - 20 Endangered species
The northern long eared bat was found near the Sagamore Bridge abutments. Possibility of having to avoid this area during certain times of day/year.
It is possible a limitation may be imposed that no work will permitted during the nighttime hours in the summer months. This would only impact the contractor only if they were trying to work 24/7. The likelihood is unlikely as the contractor will probably not be allowed to work 24/7. If they were, this would have a moderate impact to the schedule. It was determined in subsuqent reviews of the risk register that this risk is extremely unlikely and was removed from the analysis.
#N/A Moderate Unlikely Low N/A -Not Modeled Yes-No
RE - 21 Air quality Timing issues possible to comply with air quality issues.
These issues will likely be addressed with EPA during NEPA process. This risk was not modeled.
#N/A #N/A N/A -Not Modeled
N/A -Not Modeled
RE - 22Hazardous waste preliminary site investigation
If hazardous waste is found on any property required for construction, the property owner would be responsible for cleanup prior to construction. This could result in schedule impacts.
It is unlikely there will be any haz material found but if so, could result in moderate impacts to the cost and schedule while the cleanup is complete.
Moderate Unlikely Low Moderate Unlikely Low Yes-No Yes-No $0 $0 $22,472,217
If hazardous waste is found it will be removed prior to the start or continuation of construction for the replacement bridges. It is expected that this would push the construction to the right upwards of 18 months. This translates to a high variance of 3% of the construction cost (based on 2% escalation). The low variance is zero and the likely value is zero as no hazardous waste is expected to be found.
Soil sampling should be done as soon as is practical to ensure no hazardous waste is present on site. If it is found, a quick reaction by the PM can help mitigate any delays that might arise while the site is mitigated before construction.
RE - 23 In Water WorkThere is a possibility of having additional restrictions on water work based on the Fisheries Resources.
If there is any in-water work, it is certain that fisheries would have input on work windows and restrictions. These impacts may be moderate if the Fisheries Resources are not cooperative.
#N/A Moderate CertainRelook at Basis of Schedule
Uniform Uniform $0 $0 $7,490,739 0 Months 0 Months 6 Months
It is unclear how cooperative the fisheries resources will be during application for any in-water work permits. Any delays due to the lack of cooperation from other agencies could push the start of construction to the right, resulting in delays up to 6 months.
Early coordination with the fisheries folks can bring to light what, exactly, USACE is required to do as far as permitting or work restrictions. This requirments can either be handled prior to contract award or rolled into the design documents to provide more informaiton for the contractor for successful project completion.
TD 46 24 Bridge Design/TypeCurrent cost is based on cable stay bridge. What is built could be significantly different.
Cable stay bridge is one of the lower-cost alternatives. The design WILL be limited by some construction budget. It is possible something other than cable stay will be design/constructed, however the cost impact will be marginal based on the allowable budget.
Significant Likely High #N/A Triangular N/A -Not Modeled -$14,981,478 $0 $74,907,389 N/A - Not
ModeledN/A - Not Modeled
Limit of design will be budget, based on approved planning document providing funding for the project. During PED, it will be difficult to design vastly different structures unless the designers can stay within the allowable budget. Assume low variance for bridge design/type is 5% of the construction cost. Assume high variance for bridge design/type is 25% of construction cost. The likely value is 10% of the construction cost.
Coordination with the A/E in regards to bridge type and what will be designed and ultimately constructed will be helpful in mitigating this risk. A planning document will need to be completed for the replacement project and a budget established in that document which will help to tie the hands of the A/E to design within a certain budget.
TD - 25 Current Design Status
The current design is conceptual at this point. There is a high likelihood that as the design is flushed out, the cost of the project will be impacted.
Current cost is based on unit price data and programmatic costs from other projects; this data may not be scalable to a project this size. This risk is modeled already in the "ES14 Cost Estimate" risk.
#N/A #N/A N/A -Not Modeled
N/A -Not Modeled
TD - 26 Design
NEPA document has a conceptual design. Actual design during design/build process may be different than conceptual and require additional coordination/review/approval.
It is likely the designer will coordinate with locals on minor aspects of the project to provide local "flavor" and input.
#N/A #N/A N/A -Not Modeled
N/A -Not Modeled
TD 60 27 Innovative Design Cable stay bridge is a complex project.There is a risk involved with designing the bridges, even if a qualified A/E is completing the design. It is likely this risk will translate to significant impacts to cost and schedule.
Significant Likely High Significant Likely High Triangular Triangular -$37,453,695 $0 $74,907,389 0 Months 0 Months 3 Months
The design of this project, with two cable stay bridges of different lengths, is expected to be a complex and difficult project even for a qualified A/E. The high variance is assumed to be 10% of the construction cost to represent the risk associated with this complex project.
Coordination with the A/E in regards to bridge type and what will be designed and ultimately constructed will be helpful in mitigating this risk. A planning document will need to be completed for the replacement project and a budget established in that document which will seemlingly tie the hands of the A/E to design within a certain budget.
Technical Design (TD) / Project Scope Growth
Regulatory & Environmental (RE)
COST AND SCHEDULE RISK ANALYSIS - ATTACHMENT 1

CCC Bridges Major Rehabilitation Evaluation Report - Bridge Replacement Alternative
RT
Ref
#
CR
EF Risk/Opportunity Event Risk Event Description PDT Discussions on Impact and Likelihood
Impa
ct ©
Like
lihoo
d ©
Ris
k Le
vel ©
Impa
ct (S
)
Like
lihoo
d (S
)
Ris
k Le
vel (
S)
Cos
t Var
ianc
e D
istr
ibut
ion
Sche
dule
Va
rianc
e D
istr
ibut
ion
Low Variance (Min) Likely (C) High Variance
(80%H)
Low Variance (S)
(Min)Likely (S)
High Variance (S)
(80%H)Risk Quantification Discussions Risk Mitigation Measures
Bridge Replacement Alternative, NAE (New England District) Cost and Schedule Risk Register
CostProject ScheduleProject Cost Other Information
Cost Model Schedule Model
Schedule Duration
TD - 28 NEPA Documentation vs Design
Is NEPA documentation part of the design documentation. If NEPA is involved in design documentation there would be cost and schedule impacts. If not, then any redesign (not what was included in NEPA documentation) will also have cost and schedule impacts.
Either option has the possibility of cost and schedule impacts. These impacts will mainly affect cost and schedule of the design. It is possible there would be cost and schedule impacts but these impacts would be marginal when compared to the overall cost and schedule of the project.
Marginal Possible Low Marginal Possible Low Triangular Triangular -$1,404,514 $0 $11,236,108 2 Months 3 Months 6 Months
The low variance is assumed to be 0.5% of the construction cost, while the high variance is assumed to be 2% of the construction cost. The likely value is assumed to be low value as there is some cost impact expected to deal with the NEPA documentation.
EX - 29 Stakeholder Input/Coordination
The State has some input to the design, especially at the approaches due to real estate issues.
The bridge design and approach design would have be designed simultaneously. No risk associated with this item.
#N/A #N/A N/A -Not Modeled
N/A -Not Modeled
EX 205 30 Political/Local Opposition
There are folks on the Cape that would prefer the project not be constructed. This has the ability to create schedule impacts.
It is very likely there will be opposition to the project, especially from Cape residents, which could result in schedule delays. These impacts could be moderate if the pressure is continuous.
MarginalVery Likely
Medium Moderate Very Likely High Uniform Uniform $0 $0 $29,962,956 0 Months 0 Months 12 Months
While it is known the State is very much in favor of this project, it is possible the locals, especially those on the Cape, will be opposed to the project. These local residents have the ability to cause problems through their opposition which could result in delays to the project. The low variance and likely value are zero assuming there are no issues with opposition while the high variance is assumed to be 2% of the construction cost, which represents a 1 year delay to the project.
Public involvement will be of the utmost importance going forward to get the public involved in the project and ensure they are on the same page as the Corps and the State and help alleviate as many concerns as possible.
EX - 31 Adequacy of project funds
There is a possibility of not receiving funds in a timely manner resulting in delays to the design and/or the construction.
A delay in receiving projects funds would result in schedule delays. This risk is similar to Risk 16 regarding availability of State funding. This likelihood is possible, as this project may not be a national priority which may result in a delay due to funding.
Marginal Possible Low Significant Possible Medium Uniform Uniform $0 $0 $29,962,956 0 Months 0 Months 18 Months
While there is concern about the State providing funding in a timely manner, there is also concern about the Federal portion of funding being available. This project represents a vast portion of the available annual funding for all USACE projects. It is likely that if replacement is the option pushed forward that it will take a year or more to orchastrate some funding vehicle. Since it is not clear if this option will be pushed forward, the low variance and likely values are zero, while the high variance is assumed to be 3% of the construction cost (based on 2% escalation) assuming it will take 18 months or so to figure out federal funding for the project.
Communication with the vertical team will help to finalize a plan going forward on how this project might be funded. A realistic plan and timeline should be established prior to any funding request to ensure the proper escalation is applied.
EX 203 32 Bidding ClimateWhat contractors are available and will be available when the project is solicited.
The size and potential value of this project will likely draw any and all qualified contractors to the table. It is unlikely this would be an issue but could have moderate impact on project cost if the competition is not there during the selection process.
Significant Possible Medium #N/A Triangular N/A -Not Modeled -$37,453,695 $0 $37,453,695
Assume cost impact of bidding climate is 5% of construction cost. Assume best value procurement method has the ability to lower costs based on an extremely competitive offeror in a best value contract vehicle where price is an important factor but a lack of competition can also drive up prices. Assume low variance is a 5% reduction in construction cost and assume high variance is a 5% increase in construction cost.
Market research will help to mitigate this risk to see how much competition there might be around the time of solictation.
External
COST AND SCHEDULE RISK ANALYSIS - ATTACHMENT 1

C -15
Attachment 4
Conditional Cost Certification and Total Project Cost Summaries

WALLA WALLA COST ENGINEERING MANDATORY CENTER OF EXPERTISE
COST AGENCY TECHNICAL REVIEW
CONDITIONAL CERTIFICATION STATEMENT
PN 450095 NAE – Cape Cod Canal Highway Bridges
Major Rehabilitation Evaluation Report (MRER)
The Cape Cod Canal Highway Bridges Major Rehabilitation Evaluation Report (MRER), as presented by the New England District, has received a Conditional Cost Agency Technical Review Certification (Cost ATR), as defined by Engineer Regulation 1110-2-1302. The referenced project has undergone a Cost ATR under the supervision of the Walla Walla District Cost Engineering Mandatory Center of Expertise (Cost MCX) team. The Cost ATR included study of the project scope, report, cost estimates, schedules, escalation, and risk-based contingencies. Areas of concern resulting in a Conditional Certification:
- Costs have been developed to a Class 5 screening/pre-budget development level sufficient for MRER evaluation of rehabilitation versus replacement but not to the Class 3 level required for Feasibility Phase Certification/budget authorization.
- Additional design refinement and NEPA documentation will be required prior establishment of budget/funding.
- MRER has not been developed to a Feasibility Level Scope and should not be used for budgetary/funding purposes.
As of March 2, 2020, the Cost MCX conditionally certifies the estimated total project cost: BRIDGE REHABILITATION:
FY20 Project First Cost: $ 776,169,000 Fully Funded Costs: $1,937,229,000
BRIDGE REPLACEMENT: FY20 Project First Cost: $1,231,570,000 Fully Funded Costs: $1,713,512,000
Note: It remains the responsibility of the District to correctly reflect these cost values within the Final Report and to implement effective project management controls and implementation procedures including risk management through the period of Federal participation. Michael P. Jacobs, PE, CCE Chief, Cost Engineering MCX Walla Walla District

**** TOTAL PROJECT COST SUMMARY **** Printed:3/2/2020 Page 1 of 25
Filename: 0_Non-CAP CCCB MRER Rehabilitation TPCS Sep 2019_02Mar2020.xlsxTPCS-BOTH
PROJECT: DISTRICT: NAE District PREPARED: 9/11/2019PROJECT NO:P2# 450095 POC: CHIEF, COST ENGINEERING, Christopher Tilley (Acting)LOCATION: Cape Cod Canal, Massachusetts UPDATED: 2/28/2020
This Estimate reflects the scope and schedule in report; CCC Bridges Major Rehabilitation Evaluation Report September 2018
Program Year (Budget EC): 2020Effective Price Level Date: 1 OCT 19
Spent Thru:WBS Civil Works COST CNTG CNTG TOTAL ESC COST CNTG TOTAL 1-Oct-18 INFLATED COST CNTG FULL
NUMBER Feature & Sub-Feature Description ($K) ($K) (%) ($K) (%) ($K) ($K) ($K) ($K) ($K) (%) ($K) ($K) ($K) A B C D E F G H I J K L M N O
08 ROADS, RAILROADS & BRIDGES All Contrac $475,028 $204,262 43.0% $679,290 1.9% $484,009 $208,124 $692,133 $0 $692,133 147.3% $1,197,168 $514,782 $1,711,95002 RELOCATIONS (Utilities) $17,500 $7,525 43.0% $25,025 1.9% $17,831 $7,667 $25,498 $0 $25,498 25.2% $22,317 $9,596 $31,913
#N/A $0 $0 - $0 - $0 $0 $0 $0 $0 - $0 $0 $0#N/A $0 $0 - $0 - $0 $0 $0 $0 $0 - $0 $0 $0#N/A $0 $0 - $0 - $0 $0 $0 $0 $0 - $0 $0 $0#N/A $0 $0 - $0 - $0 $0 $0 $0 $0 - $0 $0 $0#N/A $0 $0 - $0 - $0 $0 $0 $0 $0 - $0 $0 $0#N/A $0 $0 - $0 - $0 $0 $0 $0 $0 - $0 $0 $0#N/A $0 $0 - $0 - $0 $0 $0 $0 $0 - $0 $0 $0#N/A $0 $0 - $0 - $0 $0 $0 $0 $0 - $0 $0 $0#N/A $0 $0 - $0 - $0 $0 $0 $0 $0 - $0 $0 $0#N/A $0 $0 - $0 - $0 $0 $0 $0 $0 - $0 $0 $0#N/A $0 $0 - $0 - $0 $0 $0 $0 $0 - $0 $0 $0#N/A $0 $0 - $0 - $0 $0 $0 $0 $0 - $0 $0 $0
__________ _________ ____________ _________ _________ __________ ___________ _________ _________ ________________CONSTRUCTION ESTIMATE TOTALS: $492,528 $211,787 $704,315 1.9% $501,840 $215,791 $717,631 $0 $717,631 143.0% $1,219,484 $524,378 $1,743,862
01 LANDS AND DAMAGES $0 $0 - $0 - $0 $0 $0 $0 $0 - $0 $0 $0
30 PLANNING, ENGINEERING & DESIGN $26,267 $11,295 43.0% $37,561 3.4% $27,162 $11,679 $38,841 $0 $38,841 236.6% $91,439 $39,319 $130,758
31 CONSTRUCTION MANAGEMENT $13,321 $5,728 43.0% $19,048 3.4% $13,774 $5,923 $19,697 $0 $19,697 217.9% $43,782 $18,826 $62,608
PROJECT COST TOTALS: $532,115 $228,809 43.0% $760,924 $542,776 $233,394 $776,169 $0 $776,169 149.6% $1,354,706 $582,523 $1,937,229
CHIEF, COST ENGINEERING, Christopher Tilley (Acting)ESTIMATED TOTAL PROJECT COST:
PROJECT MANAGER, Craig Martin
CHIEF, REAL ESTATE, Gaelen Daly
CHIEF, PLANNING, John Kennelly
CHIEF, ENGINEERING, David Margolis
CHIEF, OPERATIONS, Eric Pedersen
CHIEF, CONSTRUCTION, Sean Dolan
CHIEF, CONTRACTING, Sheila Winston-Vincuilla
CHIEF, PM-PB, Janet Harrington
CHIEF, DPM, Scott Acone
Bridge Rehabilitation Alternative
Civil Works Work Breakdown Structure ESTIMATED COST
TOTAL PROJECT COST (FULLY FUNDED)
TOTAL FIRST COST
PROJECT FIRST COST (Constant Dollar Basis)
$1,937,229
BOURNE AND SAGAMORE BRIDGES - REHABILITATION

**** TOTAL PROJECT COST SUMMARY **** Printed:3/2/2020 Page 2 of 25
Filename: 0_Non-CAP CCCB MRER Rehabilitation TPCS Sep 2019_02Mar2020.xlsxTPCS-SAGAMORE
PROJECT: DISTRICT: NAE District PREPARED: 9/11/2019PROJECT NO P2 xxxxxx POC: CHIEF, COST ENGINEERING, Christopher Tilley (Acting)LOCATION: Cape Cod Canal, Massachusetts UPDATED: 2/28/2020
This Estimate reflects the scope and schedule in report; CCC Bridges Major Rehabilitation Evaluation Report September 2018
Program Year (Budget EC): 2020Effective Price Level Date: 1 OCT 19
Spent Thru:WBS Civil Works COST CNTG CNTG TOTAL ESC COST CNTG TOTAL 1-Oct-18 INFLATED COST CNTG FULL
NUMBER Feature & Sub-Feature Description ($K) ($K) (%) ($K) (%) ($K) ($K) ($K) ($K) ($K) (%) ($K) ($K) ($K) A B C D E F G H I J K L M N O
08 ROADS, RAILROADS & BRIDGES Contr 01 $91,571 $39,375 43.0% $130,946 1.9% $93,302 $40,120 $133,422 $0 $133,422 21.3% $113,175 $48,665 $161,84008 ROADS, RAILROADS & BRIDGES Contr 02 $7,072 $3,041 43.0% $10,114 1.9% $7,206 $3,099 $10,305 $0 $10,305 44.8% $10,437 $4,488 $14,92508 ROADS, RAILROADS & BRIDGES Contr 03 $1,980 $851 43.0% $2,831 1.9% $2,017 $867 $2,885 $0 $2,885 49.2% $3,009 $1,294 $4,30408 ROADS, RAILROADS & BRIDGES Contr 04 $7,072 $3,041 43.0% $10,114 1.9% $7,206 $3,099 $10,305 $0 $10,305 78.1% $12,836 $5,520 $18,35608 ROADS, RAILROADS & BRIDGES Contr 05 $4,321 $1,858 43.0% $6,179 1.9% $4,403 $1,893 $6,296 $0 $6,296 83.5% $8,078 $3,474 $11,55208 ROADS, RAILROADS & BRIDGES Contr 06 $21,432 $9,216 43.0% $30,647 1.9% $21,837 $9,390 $31,226 $0 $31,226 112.7% $46,447 $19,972 $66,41908 ROADS, RAILROADS & BRIDGES Contr 07 $1,980 $851 43.0% $2,831 1.9% $2,017 $867 $2,885 $0 $2,885 125.7% $4,552 $1,957 $6,50908 ROADS, RAILROADS & BRIDGES Contr 08 $7,072 $3,041 43.0% $10,114 1.9% $7,206 $3,099 $10,305 $0 $10,305 161.6% $18,851 $8,106 $26,95708 ROADS, RAILROADS & BRIDGES Contr 09 $4,321 $1,858 43.0% $6,179 1.9% $4,403 $1,893 $6,296 $0 $6,296 185.9% $12,585 $5,412 $17,99708 ROADS, RAILROADS & BRIDGES Contr 10 $7,072 $3,041 43.0% $10,114 1.9% $7,206 $3,099 $10,305 $0 $10,305 221.7% $23,184 $9,969 $33,15308 ROADS, RAILROADS & BRIDGES Contr 11 $71,175 $30,605 43.0% $101,780 1.9% $72,521 $31,184 $103,705 $0 $103,705 284.2% $278,595 $119,796 $398,39102 RELOCATIONS (Utilities) $8,750 $3,763 43.0% $12,513 1.9% $8,915 $3,834 $12,749 $0 $12,749 17.8% $10,499 $4,515 $15,014
#N/A $0 $0 - $0 - $0 $0 $0 $0 $0 - $0 $0 $0#N/A $0 $0 - $0 - $0 $0 $0 $0 $0 - $0 $0 $0
__________ _________ ____________ _________ _________ __________ ___________ _________ _________ ________________CONSTRUCTION ESTIMATE TOTALS: $233,819 $100,542 $334,361 1.9% $238,239 $102,443 $340,682 $0 $340,682 127.6% $542,249 $233,167 $775,416
01 LANDS AND DAMAGES $0 $0 - $0 - $0 $0 $0 $0 $0 - $0 $0 $0
30 PLANNING, ENGINEERING & DESIGN $12,477 $5,365 43.0% $17,843 3.4% $12,903 $5,548 $18,451 $0 $18,451 211.0% $40,133 $17,257 $57,390
31 CONSTRUCTION MANAGEMENT $6,629 $2,851 43.0% $9,480 3.4% $6,855 $2,948 $9,803 $0 $9,803 190.7% $19,928 $8,569 $28,497
PROJECT COST TOTALS: $252,926 $108,758 43.0% $361,684 $257,997 $110,939 $368,936 $0 $368,936 133.5% $602,310 $258,993 $861,304
CHIEF, COST ENGINEERING, Christopher Tilley (Acting)ESTIMATED TOTAL PROJECT COST: $861,304
PROJECT MANAGER, Craig Martin
CHIEF, REAL ESTATE, Gaelen Daly
CHIEF, PLANNING, John Kennelly
CHIEF, ENGINEERING, David Margolis
CHIEF, OPERATIONS, Eric Pedersen
CHIEF, CONSTRUCTION, Sean Dolan
CHIEF, CONTRACTING, Sheila Winston-Vincuilla
CHIEF, PM-PB, Janet Harrington
CHIEF, DPM, Scott Acone
Sagamore Bridge Rehabilitation Alternative
Civil Works Work Breakdown Structure ESTIMATED COST PROJECT FIRST COST (Constant Dollar Basis)
TOTAL PROJECT COST (FULLY FUNDED)
SAGAMORE BRIDGE - REHABILITATIONTOTAL FIRST COST

**** TOTAL PROJECT COST SUMMARY **** Printed:3/2/2020 Page 3 of 25
Filename: 0_Non-CAP CCCB MRER Rehabilitation TPCS Sep 2019_02Mar2020.xlsxTPCS-SAGAMORE
**** CONTRACT COST SUMMARY ****
PROJECT: DISTRICT: NAE District PREPARED: 9/11/2019LOCATION: Cape Cod Canal, Massachusetts POC: CHIEF, COST ENGINEERING, Christopher Tilley (AUPDATED: 2/28/2020This Estimate reflects the scope and schedule in report; CCC Bridges Major Rehabilitation Evaluation Report September 2018
11-Sep-19 20201-Oct-18 1 OCT 19
RISK BASED WBS Civil Works COST CNTG CNTG TOTAL ESC COST CNTG TOTAL Mid-Point INFLATED COST CNTG FULL
NUMBER Feature & Sub-Feature Description ($K) ($K) (%) ($K) (%) ($K) ($K) ($K) Date (%) ($K) ($K) ($K) A B C D E F G H I J P L M N O
01 Contract 01: Major Rehab (25-27)08 Truss Span Deck Replacement $19,515 $8,391 43.0% $27,906 1.9% $19,884 $8,550 $28,434 2026Q3 21.3% $24,119 $10,371 $34,49008 Suspender Cable Replacement $10,692 $4,598 43.0% $15,290 1.9% $10,895 $4,685 $15,579 2026Q3 21.3% $13,215 $5,682 $18,89808 Replace Abutment Spans $8,192 $3,523 43.0% $11,715 1.9% $8,347 $3,589 $11,936 2026Q3 21.3% $10,125 $4,354 $14,47808 Bearing Replacement $1,167 $502 43.0% $1,669 1.9% $1,189 $511 $1,701 2026Q3 21.3% $1,443 $620 $2,06308 Joint Replacement $1,980 $851 43.0% $2,831 1.9% $2,017 $867 $2,885 2026Q3 21.3% $2,447 $1,052 $3,49908 Minor Steel Truss Repairs $6,194 $2,664 43.0% $8,858 1.9% $6,311 $2,714 $9,025 2026Q3 21.3% $7,656 $3,292 $10,94808 Major Steel Truss Repairs $20,057 $8,624 43.0% $28,681 1.9% $20,436 $8,788 $29,224 2026Q3 21.3% $24,789 $10,659 $35,44808 Paving $2,341 $1,007 43.0% $3,348 1.9% $2,386 $1,026 $3,411 2026Q3 21.3% $2,894 $1,244 $4,13808 Complete Painting of Structural Steel $21,432 $9,216 43.0% $30,647 1.9% $21,837 $9,390 $31,226 2026Q3 21.3% $26,488 $11,390 $37,87802 RELOCATIONS (Utilities) $8,750 $3,763 43.0% $12,513 1.9% $8,915 $3,834 $12,749 2025Q3 17.8% $10,499 $4,515 $15,014
__________ _________ ________ ____________ _________ _________ __________ _________ _________ ________________CONSTRUCTION ESTIMATE TOTALS: $100,321 $43,138 43.0% $143,458 $102,217 $43,953 $146,171 $123,674 $53,180 $176,854
01 LANDS AND DAMAGES $0 $0 0.0% $0 0.0% $0 $0 $0 0 0.0% $0 $0 $0
30 PLANNING, ENGINEERING & DESIGN4.6% Project Management $4,579 $1,969 43.0% $6,547 3.4% $4,735 $2,036 $6,770 2023Q2 13.0% $5,350 $2,301 $7,651
Planning & Environmental Compliance INC. 43.0% 0.0% $0 $0 0 13.0% $0 $0 $0 Engineering & Design INC. 43.0% 0.0% $0 $0 0 13.0% $0 $0 $0 Reviews, ATRs, IEPRs, VE INC. 43.0% 0.0% $0 $0 0 13.0% $0 $0 $0 Life Cycle Updates (cost, schedule, risks) INC. 43.0% 0.0% $0 $0 0 13.0% $0 $0 $0 Contracting & Reprographics INC. 43.0% 0.0% $0 $0 0 13.0% $0 $0 $0 Engineering During Construction INC. 43.0% 0.0% $0 $0 0 27.7% $0 $0 $0 Planning During Construction INC. 43.0% 0.0% $0 $0 0 27.7% $0 $0 $0 Project Operations INC. 43.0% 0.0% $0 $0 0 13.0% $0 $0 $0
31 CONSTRUCTION MANAGEMENT10.0% Construction Management $2,272 $977 43.0% $3,249 3.4% $2,349 $1,010 $3,360 2026Q3 27.7% $3,000 $1,290 $4,291
Project Operation: INC. 43.0% 0.0% $0 $0 0 27.7% $0 $0 $0 Project Management INC. 43.0% 0.0% $0 $0 0 27.7% $0 $0 $0
CONTRACT COST TOTALS: $107,171 $46,084 $153,255 $109,301 $47,000 $156,301 $132,025 $56,771 $188,796
Sagamore Bridge Rehabilitation Alternative
Civil Works Work Breakdown Structure ESTIMATED COST PROJECT FIRST COST(Constant Dollar Basis) TOTAL PROJECT COST (FULLY FUNDED)
SAGAMORE BRIDGE - REHABILITATION Estimate Prepared: Program Year (Budget EC):Effective Price Level: Effective Price Level Date:

**** TOTAL PROJECT COST SUMMARY **** Printed:3/2/2020 Page 4 of 25
Filename: 0_Non-CAP CCCB MRER Rehabilitation TPCS Sep 2019_02Mar2020.xlsxTPCS-SAGAMORE
**** CONTRACT COST SUMMARY ****
PROJECT: DISTRICT: NAE District PREPARED: 9/11/2019LOCATION: Cape Cod Canal, Massachusetts POC: CHIEF, COST ENGINEERING, Christopher Tilley (AUPDATED: 2/28/2020This Estimate reflects the scope and schedule in report; CCC Bridges Major Rehabilitation Evaluation Report September 2018
11-Sep-19 20201-Oct-18 1 OCT 19
WBS Civil Works COST CNTG CNTG TOTAL ESC COST CNTG TOTAL Mid-Point INFLATED COST CNTG FULLNUMBER Feature & Sub-Feature Description ($K) ($K) (%) ($K) (%) ($K) ($K) ($K) Date (%) ($K) ($K) ($K)
A B C D E F G H I J P L M N O02 Contract 02: Maint Paint (32)
08 Maintenance Painting of Structural Steel $7,072 $3,041 43.0% $10,114 1.9% $7,206 $3,099 $10,305 2032Q3 44.8% $10,437 $4,488 $14,925#N/A#N/A#N/A#N/A#N/A#N/A#N/A#N/A#N/A#N/A#N/A#N/A#N/A
__________ _________ ________ ____________ _________ _________ __________ _________ _________ ________________
CONSTRUCTION ESTIMATE TOTALS: $7,072 $3,041 43.0% $10,114 $7,206 $3,099 $10,305 $10,437 $4,488 $14,925
01 LANDS AND DAMAGES $0 $0 0.0% $0 0.0% $0 $0 $0 0 0.0% $0 $0 $0
30 PLANNING, ENGINEERING & DESIGN5.0% Project Management $354 $152 43.0% $506 3.4% $366 $157 $523 2031Q2 53.3% $561 $241 $802
Planning & Environmental Compliance INC. 43.0% 0.0% $0 $0 0 53.3% $0 $0 $0 Engineering & Design INC. 43.0% 0.0% $0 $0 0 53.3% $0 $0 $0 Reviews, ATRs, IEPRs, VE INC. 43.0% 0.0% $0 $0 0 53.3% $0 $0 $0 Life Cycle Updates (cost, schedule, risks) INC. 43.0% 0.0% $0 $0 0 53.3% $0 $0 $0 Contracting & Reprographics INC. 43.0% 0.0% $0 $0 0 53.3% $0 $0 $0 Engineering During Construction INC. 43.0% 0.0% $0 $0 0 61.1% $0 $0 $0 Planning During Construction INC. 43.0% 0.0% $0 $0 0 61.1% $0 $0 $0 Project Operations INC. 43.0% 0.0% $0 $0 0 53.3% $0 $0 $0
31 CONSTRUCTION MANAGEMENT3.7% Construction Management $261 $112 43.0% $373 3.4% $270 $116 $386 2032Q3 61.1% $434 $187 $621
Project Operation: INC. 43.0% 0.0% $0 $0 0 61.1% $0 $0 $0 Project Management INC. 43.0% 0.0% $0 $0 0 61.1% $0 $0 $0
CONTRACT COST TOTALS: $7,687 $3,305 $10,992 $7,841 $3,372 $11,213 $11,432 $4,916 $16,348
Sagamore Bridge Rehabilitation Alternative
Civil Works Work Breakdown Structure ESTIMATED COST PROJECT FIRST COST(Constant Dollar Basis) TOTAL PROJECT COST (FULLY FUNDED)
SAGAMORE BRIDGE - REHABILITATION Estimate Prepared: Program Year (Budget EC):Effective Price Level: Effective Price Level Date:

**** TOTAL PROJECT COST SUMMARY **** Printed:3/2/2020 Page 5 of 25
Filename: 0_Non-CAP CCCB MRER Rehabilitation TPCS Sep 2019_02Mar2020.xlsxTPCS-SAGAMORE
**** CONTRACT COST SUMMARY ****
PROJECT: DISTRICT: NAE District PREPARED: 9/11/2019LOCATION: Cape Cod Canal, Massachusetts POC: CHIEF, COST ENGINEERING, Christopher Tilley (AUPDATED: 2/28/2020This Estimate reflects the scope and schedule in report; CCC Bridges Major Rehabilitation Evaluation Report September 2018
11-Sep-19 20201-Oct-18 1 OCT 19
WBS Civil Works COST CNTG CNTG TOTAL ESC COST CNTG TOTAL Mid-Point INFLATED COST CNTG FULLNUMBER Feature & Sub-Feature Description ($K) ($K) (%) ($K) (%) ($K) ($K) ($K) Date (%) ($K) ($K) ($K)
A B C D E F G H I J P L M N O03 Contract 03: Joint Replace (33)
08 Joint Replacement $1,980 $851 43.0% $2,831 1.9% $2,017 $867 $2,885 2033Q3 49.2% $3,009 $1,294 $4,304#N/A#N/A#N/A#N/A#N/A#N/A#N/A#N/A#N/A#N/A#N/A#N/A#N/A
__________ _________ ________ ____________ _________ _________ __________ _________ _________ ________________
CONSTRUCTION ESTIMATE TOTALS: $1,980 $851 43.0% $2,831 $2,017 $867 $2,885 $3,009 $1,294 $4,304
01 LANDS AND DAMAGES $0 $0 0.0% $0 0.0% $0 $0 $0 0 0.0% $0 $0 $0
30 PLANNING, ENGINEERING & DESIGN15.0% Project Management $297 $128 43.0% $425 3.4% $307 $132 $439 2032Q2 59.5% $490 $211 $700
Planning & Environmental Compliance INC. 43.0% 0.0% $0 $0 0 59.5% $0 $0 $0 Engineering & Design INC. 43.0% 0.0% $0 $0 0 59.5% $0 $0 $0 Reviews, ATRs, IEPRs, VE INC. 43.0% 0.0% $0 $0 0 59.5% $0 $0 $0 Life Cycle Updates (cost, schedule, risks) INC. 43.0% 0.0% $0 $0 0 59.5% $0 $0 $0 Contracting & Reprographics INC. 43.0% 0.0% $0 $0 0 59.5% $0 $0 $0 Engineering During Construction INC. 43.0% 0.0% $0 $0 0 67.5% $0 $0 $0 Planning During Construction INC. 43.0% 0.0% $0 $0 0 67.5% $0 $0 $0 Project Operations INC. 43.0% 0.0% $0 $0 0 59.5% $0 $0 $0
31 CONSTRUCTION MANAGEMENT18.9% Construction Management $374 $161 43.0% $535 3.4% $387 $166 $553 2033Q3 67.5% $648 $279 $927
Project Operation: INC. 43.0% 0.0% $0 $0 0 67.5% $0 $0 $0 Project Management INC. 43.0% 0.0% $0 $0 0 67.5% $0 $0 $0
CONTRACT COST TOTALS: $2,651 $1,140 $3,791 $2,711 $1,166 $3,877 $4,147 $1,783 $5,931
Sagamore Bridge Rehabilitation Alternative
Civil Works Work Breakdown Structure ESTIMATED COST PROJECT FIRST COST(Constant Dollar Basis) TOTAL PROJECT COST (FULLY FUNDED)
SAGAMORE BRIDGE - REHABILITATION Estimate Prepared: Program Year (Budget EC):Effective Price Level: Effective Price Level Date:

**** TOTAL PROJECT COST SUMMARY **** Printed:3/2/2020 Page 6 of 25
Filename: 0_Non-CAP CCCB MRER Rehabilitation TPCS Sep 2019_02Mar2020.xlsxTPCS-SAGAMORE
**** CONTRACT COST SUMMARY ****
PROJECT: Sagamore Bridge Rehabilitation Alternative DISTRICT: NAE District PREPARED: 9/11/2019LOCATION: Cape Cod Canal, Massachusetts POC: CHIEF, COST ENGINEERING, Christopher Tilley (AUPDATED: 2/28/2020This Estimate reflects the scope and schedule in report; CCC Bridges Major Rehabilitation Evaluation Report September 2018
11-Sep-19 Program Year (Budget EC): 20201-Oct-18 Effective Price Level Date: 1 OCT 19 FULLY FUNDED PROJECT ESTIMATE
WBS Civil Works COST CNTG CNTG TOTAL ESC COST CNTG TOTAL Mid-Point INFLATED COST CNTG FULLNUMBER Feature & Sub-Feature Description ($K) ($K) (%) ($K) (%) ($K) ($K) ($K) Date (%) ($K) ($K) ($K)
A B C D E F G H I J P L M N O04 Contract 04: Maint Paint (39)
08 Maintenance Painting of Structural Steel $7,072 $3,041 43.0% $10,114 1.9% $7,206 $3,099 $10,305 2039Q3 78.1% $12,836 $5,520 $18,356#N/A#N/A#N/A#N/A#N/A#N/A#N/A#N/A#N/A#N/A#N/A#N/A#N/A
__________ _________ ________ ____________ _________ _________ __________ _________ _________ ________________
CONSTRUCTION ESTIMATE TOTALS: $7,072 $3,041 43.0% $10,114 $7,206 $3,099 $10,305 $12,836 $5,520 $18,356
01 LANDS AND DAMAGES $0 $0 0.0% $0 0.0% $0 $0 $0 0 0.0% $0 $0 $0
30 PLANNING, ENGINEERING & DESIGN5.0% Project Management $354 $152 43.0% $506 3.4% $366 $157 $523 2038Q2 102.9% $742 $319 $1,061
Planning & Environmental Compliance INC. 43.0% 0.0% $0 $0 0 102.9% $0 $0 $0 Engineering & Design INC. 43.0% 0.0% $0 $0 0 102.9% $0 $0 $0 Reviews, ATRs, IEPRs, VE INC. 43.0% 0.0% $0 $0 0 102.9% $0 $0 $0 Life Cycle Updates (cost, schedule, risks) INC. 43.0% 0.0% $0 $0 0 102.9% $0 $0 $0 Contracting & Reprographics INC. 43.0% 0.0% $0 $0 0 102.9% $0 $0 $0 Engineering During Construction INC. 43.0% 0.0% $0 $0 0 113.7% $0 $0 $0 Planning During Construction INC. 43.0% 0.0% $0 $0 0 113.7% $0 $0 $0 Project Operations INC. 43.0% 0.0% $0 $0 0 102.9% $0 $0 $0
31 CONSTRUCTION MANAGEMENT3.7% Construction Management $261 $112 43.0% $373 3.4% $270 $116 $386 2039Q3 113.7% $576 $248 $824
Project Operation: INC. 43.0% 0.0% $0 $0 0 113.7% $0 $0 $0 Project Management INC. 43.0% 0.0% $0 $0 0 113.7% $0 $0 $0
CONTRACT COST TOTALS: $7,687 $3,305 $10,992 $7,841 $3,372 $11,213 $14,155 $6,086 $20,241
Civil Works Work Breakdown Structure ESTIMATED COST PROJECT FIRST COST(Constant Dollar Basis) TOTAL PROJECT COST (FULLY FUNDED)
SAGAMORE BRIDGE - REHABILITATIONEstimate Prepared:
Effective Price Level:

**** TOTAL PROJECT COST SUMMARY **** Printed:3/2/2020 Page 7 of 25
Filename: 0_Non-CAP CCCB MRER Rehabilitation TPCS Sep 2019_02Mar2020.xlsxTPCS-SAGAMORE
**** CONTRACT COST SUMMARY ****
PROJECT: Sagamore Bridge Rehabilitation Alternative DISTRICT: NAE District PREPARED: 9/11/2019LOCATION: Cape Cod Canal, Massachusetts POC: CHIEF, COST ENGINEERING, Christopher Tilley (AUPDATED: 2/28/2020This Estimate reflects the scope and schedule in report; CCC Bridges Major Rehabilitation Evaluation Report September 2018
11-Sep-19 Program Year (Budget EC): 20201-Oct-18 Effective Price Level Date: 1 OCT 19 FULLY FUNDED PROJECT ESTIMATE
WBS Civil Works COST CNTG CNTG TOTAL ESC COST CNTG TOTAL Mid-Point INFLATED COST CNTG FULLNUMBER Feature & Sub-Feature Description ($K) ($K) (%) ($K) (%) ($K) ($K) ($K) Date (%) ($K) ($K) ($K)
A B C D E F G H I J P L M N O05 Contract 05: Paving & Joint Replace (40)
08 Paving $2,341 $1,007 43.0% $3,348 1.9% $2,386 $1,026 $3,411 2040Q3 83.5% $4,377 $1,882 $6,25908 Joint Replacement $1,980 $851 43.0% $2,831 1.9% $2,017 $867 $2,885 2040Q3 83.5% $3,701 $1,592 $5,293
#N/A#N/A#N/A#N/A#N/A#N/A#N/A#N/A#N/A#N/A#N/A#N/A
__________ _________ ________ ____________ _________ _________ __________ _________ _________ ________________
CONSTRUCTION ESTIMATE TOTALS: $4,321 $1,858 43.0% $6,179 $4,403 $1,893 $6,296 $8,078 $3,474 $11,552
01 LANDS AND DAMAGES $0 $0 0.0% $0 0.0% $0 $0 $0 0 0.0% $0 $0 $0
30 PLANNING, ENGINEERING & DESIGN12.3% Project Management $531 $228 43.0% $759 3.4% $549 $236 $785 2039Q2 111.5% $1,161 $499 $1,661
Planning & Environmental Compliance INC. 43.0% 0.0% $0 $0 0 111.5% $0 $0 $0 Engineering & Design INC. 43.0% 0.0% $0 $0 0 111.5% $0 $0 $0 Reviews, ATRs, IEPRs, VE INC. 43.0% 0.0% $0 $0 0 111.5% $0 $0 $0 Life Cycle Updates (cost, schedule, risks) INC. 43.0% 0.0% $0 $0 0 111.5% $0 $0 $0 Contracting & Reprographics INC. 43.0% 0.0% $0 $0 0 111.5% $0 $0 $0 Engineering During Construction INC. 43.0% 0.0% $0 $0 0 122.6% $0 $0 $0 Planning During Construction INC. 43.0% 0.0% $0 $0 0 122.6% $0 $0 $0 Project Operations INC. 43.0% 0.0% $0 $0 0 111.5% $0 $0 $0
31 CONSTRUCTION MANAGEMENT11.7% Construction Management $507 $218 43.0% $725 3.4% $525 $226 $750 2040Q3 122.6% $1,168 $502 $1,670
Project Operation: INC. 43.0% 0.0% $0 $0 0 122.6% $0 $0 $0 Project Management INC. 43.0% 0.0% $0 $0 0 122.6% $0 $0 $0
CONTRACT COST TOTALS: $5,360 $2,305 $7,664 $5,477 $2,355 $7,832 $10,407 $4,475 $14,883
PROJECT FIRST COST(Constant Dollar Basis) TOTAL PROJECT COST (FULLY FUNDED)
SAGAMORE BRIDGE - REHABILITATIONEstimate Prepared:
Effective Price Level:
Civil Works Work Breakdown Structure ESTIMATED COST
**** TOTAL PROJECT COST SUMMARY **** Printed:3/2/2020 Page 8 of 25
Filename: 0_Non-CAP CCCB MRER Rehabilitation TPCS Sep 2019_02Mar2020.xlsxTPCS-SAGAMORE
**** CONTRACT COST SUMMARY ****
PROJECT: Sagamore Bridge Rehabilitation Alternative DISTRICT: NAE District PREPARED: 9/11/2019LOCATION: Cape Cod Canal, Massachusetts POC: CHIEF, COST ENGINEERING, Christopher Tilley (AUPDATED: 2/28/2020This Estimate reflects the scope and schedule in report; CCC Bridges Major Rehabilitation Evaluation Report September 2018
11-Sep-19 Program Year (Budget EC): 20201-Oct-18 Effective Price Level Date: 1 OCT 19 FULLY FUNDED PROJECT ESTIMATE
WBS Civil Works COST CNTG CNTG TOTAL ESC COST CNTG TOTAL Mid-Point INFLATED COST CNTG FULLNUMBER Feature & Sub-Feature Description ($K) ($K) (%) ($K) (%) ($K) ($K) ($K) Date (%) ($K) ($K) ($K)
A B C D E F G H I J P L M N O06 Contract 06: Complete Paint (45)
08 Complete Painting of Structural Steel $21,432 $9,216 43.0% $30,647 1.9% $21,837 $9,390 $31,226 2045Q3 112.7% $46,447 $19,972 $66,419#N/A#N/A#N/A#N/A#N/A#N/A#N/A#N/A#N/A#N/A#N/A#N/A#N/A
__________ _________ ________ ____________ _________ _________ __________ _________ _________ ________________
CONSTRUCTION ESTIMATE TOTALS: $21,432 $9,216 43.0% $30,647 $21,837 $9,390 $31,226 $46,447 $19,972 $66,419
01 LANDS AND DAMAGES $0 $0 0.0% $0 0.0% $0 $0 $0 0 0.0% $0 $0 $0
30 PLANNING, ENGINEERING & DESIGN5.0% Project Management $1,072 $461 43.0% $1,532 3.4% $1,108 $476 $1,585 2044Q2 159.7% $2,878 $1,238 $4,116
Planning & Environmental Compliance INC. 43.0% 0.0% $0 $0 0 159.7% $0 $0 $0 Engineering & Design INC. 43.0% 0.0% $0 $0 0 159.7% $0 $0 $0 Reviews, ATRs, IEPRs, VE INC. 43.0% 0.0% $0 $0 0 159.7% $0 $0 $0 Life Cycle Updates (cost, schedule, risks) INC. 43.0% 0.0% $0 $0 0 159.7% $0 $0 $0 Contracting & Reprographics INC. 43.0% 0.0% $0 $0 0 159.7% $0 $0 $0 Engineering During Construction INC. 43.0% 0.0% $0 $0 0 173.5% $0 $0 $0 Planning During Construction INC. 43.0% 0.0% $0 $0 0 173.5% $0 $0 $0 Project Operations INC. 43.0% 0.0% $0 $0 0 159.7% $0 $0 $0
31 CONSTRUCTION MANAGEMENT1.9% Construction Management $415 $179 43.0% $594 3.4% $430 $185 $614 2045Q3 173.5% $1,175 $505 $1,680
Project Operation: INC. 43.0% 0.0% $0 $0 0 173.5% $0 $0 $0 Project Management INC. 43.0% 0.0% $0 $0 0 173.5% $0 $0 $0
CONTRACT COST TOTALS: $22,919 $9,855 $32,773 $23,374 $10,051 $33,425 $50,500 $21,715 $72,215
Civil Works Work Breakdown Structure ESTIMATED COST PROJECT FIRST COST(Constant Dollar Basis) TOTAL PROJECT COST (FULLY FUNDED)
SAGAMORE BRIDGE - REHABILITATIONEstimate Prepared:
Effective Price Level:

**** TOTAL PROJECT COST SUMMARY **** Printed:3/2/2020 Page 9 of 25
Filename: 0_Non-CAP CCCB MRER Rehabilitation TPCS Sep 2019_02Mar2020.xlsxTPCS-SAGAMORE
**** CONTRACT COST SUMMARY ****
PROJECT: Sagamore Bridge Rehabilitation Alternative DISTRICT: NAE District PREPARED: 9/11/2019LOCATION: Cape Cod Canal, Massachusetts POC: CHIEF, COST ENGINEERING, Christopher Tilley (AUPDATED: 2/28/2020This Estimate reflects the scope and schedule in report; CCC Bridges Major Rehabilitation Evaluation Report September 2018
11-Sep-19 Program Year (Budget EC): 20201-Oct-18 Effective Price Level Date: 1 OCT 19 FULLY FUNDED PROJECT ESTIMATE
WBS Civil Works COST CNTG CNTG TOTAL ESC COST CNTG TOTAL Mid-Point INFLATED COST CNTG FULLNUMBER Feature & Sub-Feature Description ($K) ($K) (%) ($K) (%) ($K) ($K) ($K) Date (%) ($K) ($K) ($K)
A B C D E F G H I J P L M N O07 Contract 07: Joint Replace (47)
08 Joint Replacement $1,980 $851 43.0% $2,831 1.9% $2,017 $867 $2,885 2047Q3 125.7% $4,552 $1,957 $6,509#N/A#N/A#N/A#N/A#N/A#N/A#N/A#N/A#N/A#N/A#N/A#N/A#N/A
__________ _________ ________ ____________ _________ _________ __________ _________ _________ ________________
CONSTRUCTION ESTIMATE TOTALS: $1,980 $851 43.0% $2,831 $2,017 $867 $2,885 $4,552 $1,957 $6,509
01 LANDS AND DAMAGES $0 $0 0.0% $0 0.0% $0 $0 $0 0 0.0% $0 $0 $0
30 PLANNING, ENGINEERING & DESIGN15.0% Project Management $297 $128 43.0% $425 3.4% $307 $132 $439 2046Q2 182.0% $866 $372 $1,239
Planning & Environmental Compliance INC. 43.0% 0.0% $0 $0 0 182.0% $0 $0 $0 Engineering & Design INC. 43.0% 0.0% $0 $0 0 182.0% $0 $0 $0 Reviews, ATRs, IEPRs, VE INC. 43.0% 0.0% $0 $0 0 182.0% $0 $0 $0 Life Cycle Updates (cost, schedule, risks) INC. 43.0% 0.0% $0 $0 0 182.0% $0 $0 $0 Contracting & Reprographics INC. 43.0% 0.0% $0 $0 0 182.0% $0 $0 $0 Engineering During Construction INC. 43.0% 0.0% $0 $0 0 197.0% $0 $0 $0 Planning During Construction INC. 43.0% 0.0% $0 $0 0 197.0% $0 $0 $0 Project Operations INC. 43.0% 0.0% $0 $0 0 182.0% $0 $0 $0
31 CONSTRUCTION MANAGEMENT18.9% Construction Management $374 $161 43.0% $535 3.4% $387 $166 $553 2047Q3 197.0% $1,149 $494 $1,643
Project Operation: INC. 43.0% 0.0% $0 $0 0 197.0% $0 $0 $0 Project Management INC. 43.0% 0.0% $0 $0 0 197.0% $0 $0 $0
CONTRACT COST TOTALS: $2,651 $1,140 $3,791 $2,711 $1,166 $3,877 $6,567 $2,824 $9,391
PROJECT FIRST COST(Constant Dollar Basis) TOTAL PROJECT COST (FULLY FUNDED)
SAGAMORE BRIDGE - REHABILITATIONEstimate Prepared:
Effective Price Level:
Civil Works Work Breakdown Structure ESTIMATED COST

**** TOTAL PROJECT COST SUMMARY **** Printed:3/2/2020 Page 10 of 25
Filename: 0_Non-CAP CCCB MRER Rehabilitation TPCS Sep 2019_02Mar2020.xlsxTPCS-SAGAMORE
**** CONTRACT COST SUMMARY ****
PROJECT: Sagamore Bridge Rehabilitation Alternative DISTRICT: NAE District PREPARED: 9/11/2019LOCATION: Cape Cod Canal, Massachusetts POC: CHIEF, COST ENGINEERING, Christopher Tilley (AUPDATED: 2/28/2020This Estimate reflects the scope and schedule in report; CCC Bridges Major Rehabilitation Evaluation Report September 2018
11-Sep-19 Program Year (Budget EC): 20201-Oct-18 Effective Price Level Date: 1 OCT 19 FULLY FUNDED PROJECT ESTIMATE
WBS Civil Works COST CNTG CNTG TOTAL ESC COST CNTG TOTAL Mid-Point INFLATED COST CNTG FULLNUMBER Feature & Sub-Feature Description ($K) ($K) (%) ($K) (%) ($K) ($K) ($K) Date (%) ($K) ($K) ($K)
A B C D E F G H I J P L M N O08 Contract 08: Maint Paint (52)
08 Maintenance Painting of Structural Steel $7,072 $3,041 43.0% $10,114 1.9% $7,206 $3,099 $10,305 2052Q3 161.6% $18,851 $8,106 $26,957#N/A#N/A#N/A#N/A#N/A#N/A#N/A#N/A#N/A#N/A#N/A#N/A#N/A
__________ _________ ________ ____________ _________ _________ __________ _________ _________ ________________
CONSTRUCTION ESTIMATE TOTALS: $7,072 $3,041 43.0% $10,114 $7,206 $3,099 $10,305 $18,851 $8,106 $26,957
01 LANDS AND DAMAGES $0 $0 0.0% -$ 0.0% $0 $0 $0 0 0.0% $0 $0 $0
30 PLANNING, ENGINEERING & DESIGN5.0% Project Management $354 $152 43.0% $506 3.4% $366 $157 $523 2051Q2 246.4% $1,267 $545 $1,812
Planning & Environmental Compliance INC. 43.0% 0.0% $0 $0 0 246.4% $0 $0 $0 Engineering & Design INC. 43.0% 0.0% $0 $0 0 246.4% $0 $0 $0 Reviews, ATRs, IEPRs, VE INC. 43.0% 0.0% $0 $0 0 246.4% $0 $0 $0 Life Cycle Updates (cost, schedule, risks) INC. 43.0% 0.0% $0 $0 0 246.4% $0 $0 $0 Contracting & Reprographics INC. 43.0% 0.0% $0 $0 0 246.4% $0 $0 $0 Engineering During Construction INC. 43.0% 0.0% $0 $0 0 264.8% $0 $0 $0 Planning During Construction INC. 43.0% 0.0% $0 $0 0 264.8% $0 $0 $0 Project Operations INC. 43.0% 0.0% $0 $0 0 246.4% $0 $0 $0
31 CONSTRUCTION MANAGEMENT3.7% Construction Management $261 $112 43.0% 373 3.4% $270 $116 $386 2052Q3 264.8% $984 $423 $1,406
Project Operation: INC. 43.0% 0.0% $0 $0 0 264.8% $0 $0 $0 Project Management INC. 43.0% 0.0% $0 $0 0 264.8% $0 $0 $0
CONTRACT COST TOTALS: $7,687 $3,305 10,992 $7,841 $3,372 $11,213 $21,101 $9,073 $30,175
Civil Works Work Breakdown Structure ESTIMATED COST PROJECT FIRST COST(Constant Dollar Basis) TOTAL PROJECT COST (FULLY FUNDED)
SAGAMORE BRIDGE - REHABILITATIONEstimate Prepared:
Effective Price Level:

**** TOTAL PROJECT COST SUMMARY **** Printed:3/2/2020 Page 11 of 25
Filename: 0_Non-CAP CCCB MRER Rehabilitation TPCS Sep 2019_02Mar2020.xlsxTPCS-SAGAMORE
**** CONTRACT COST SUMMARY ****
PROJECT: Sagamore Bridge Rehabilitation Alternative DISTRICT: NAE District PREPARED: 9/11/2019LOCATION: Cape Cod Canal, Massachusetts POC: CHIEF, COST ENGINEERING, Christopher Tilley (AUPDATED: 2/28/2020This Estimate reflects the scope and schedule in report; CCC Bridges Major Rehabilitation Evaluation Report September 2018
11-Sep-19 Program Year (Budget EC): 20201-Oct-18 Effective Price Level Date: 1 OCT 19 FULLY FUNDED PROJECT ESTIMATE
WBS Civil Works COST CNTG CNTG TOTAL ESC COST CNTG TOTAL Mid-Point INFLATED COST CNTG FULLNUMBER Feature & Sub-Feature Description ($K) ($K) (%) ($K) (%) ($K) ($K) ($K) Date (%) ($K) ($K) ($K)
A B C D E F G H I J P L M N O09 Contract 09: Paving & Joint Replace (55)
08 Paving $2,341 $1,007 43.0% $3,348 1.9% $2,386 $1,026 $3,411 2055Q3 185.9% $6,819 $2,932 $9,75108 Joint Replacement $1,980 $851 43.0% $2,831 1.9% $2,017 $867 $2,885 2055Q3 185.9% $5,766 $2,480 $8,246
#N/A#N/A#N/A#N/A#N/A#N/A#N/A#N/A#N/A#N/A#N/A#N/A
__________ _________ ________ ____________ _________ _________ __________ _________ _________ ________________
CONSTRUCTION ESTIMATE TOTALS: $4,321 $1,858 43.0% $6,179 $4,403 $1,893 $6,296 $12,585 $5,412 $17,997
01 LANDS AND DAMAGES $0 $0 0.0% $0 0.0% $0 $0 $0 0 0.0% $0 $0 $0
30 PLANNING, ENGINEERING & DESIGN12.3% Project Management $531 $228 43.0% $759 3.4% $549 $236 $785 2054Q2 292.0% $2,153 $926 $3,078
Planning & Environmental Compliance INC. 43.0% 0.0% $0 $0 0 292.0% $0 $0 $0 Engineering & Design INC. 43.0% 0.0% $0 $0 0 292.0% $0 $0 $0 Reviews, ATRs, IEPRs, VE INC. 43.0% 0.0% $0 $0 0 292.0% $0 $0 $0 Life Cycle Updates (cost, schedule, risks) INC. 43.0% 0.0% $0 $0 0 292.0% $0 $0 $0 Contracting & Reprographics INC. 43.0% 0.0% $0 $0 0 292.0% $0 $0 $0 Engineering During Construction INC. 43.0% 0.0% $0 $0 0 312.7% $0 $0 $0 Planning During Construction INC. 43.0% 0.0% $0 $0 0 312.7% $0 $0 $0 Project Operations INC. 43.0% 0.0% $0 $0 0 292.0% $0 $0 $0
31 CONSTRUCTION MANAGEMENT11.7% Construction Management $507 $218 43.0% $725 3.4% $525 $226 $750 2055Q3 312.7% $2,165 $931 $3,096
Project Operation: INC. 43.0% 0.0% $0 $0 0 312.7% $0 $0 $0 Project Management INC. 43.0% 0.0% $0 $0 0 312.7% $0 $0 $0
CONTRACT COST TOTALS: $5,360 $2,305 $7,664 $5,477 $2,355 $7,832 $16,903 $7,268 $24,171
Civil Works Work Breakdown Structure ESTIMATED COST PROJECT FIRST COST(Constant Dollar Basis) TOTAL PROJECT COST (FULLY FUNDED)
SAGAMORE BRIDGE - REHABILITATIONEstimate Prepared:
Effective Price Level:

**** TOTAL PROJECT COST SUMMARY **** Printed:3/2/2020 Page 12 of 25
Filename: 0_Non-CAP CCCB MRER Rehabilitation TPCS Sep 2019_02Mar2020.xlsxTPCS-SAGAMORE
**** CONTRACT COST SUMMARY ****
PROJECT: Sagamore Bridge Rehabilitation Alternative DISTRICT: NAE District PREPARED: 9/11/2019LOCATION: Cape Cod Canal, Massachusetts POC: CHIEF, COST ENGINEERING, Christopher Tilley (AUPDATED: 2/28/2020This Estimate reflects the scope and schedule in report; CCC Bridges Major Rehabilitation Evaluation Report September 2018
11-Sep-19 Program Year (Budget EC): 20201-Oct-18 Effective Price Level Date: 1 OCT 19 FULLY FUNDED PROJECT ESTIMATE
WBS Civil Works COST CNTG CNTG TOTAL ESC COST CNTG TOTAL Mid-Point INFLATED COST CNTG FULLNUMBER Feature & Sub-Feature Description ($K) ($K) (%) ($K) (%) ($K) ($K) ($K) Date (%) ($K) ($K) ($K)
A B C D E F G H I J P L M N O10 Contract 10: Maint Paint (59)
08 Maintenance Painting of Structural Steel $7,072 $3,041 43.0% $10,114 1.9% $7,206 $3,099 $10,305 2059Q3 221.7% $23,184 $9,969 $33,153#N/A#N/A#N/A#N/A#N/A#N/A#N/A#N/A#N/A#N/A#N/A#N/A#N/A
__________ _________ ________ ____________ _________ _________ __________ _________ _________ ________________
CONSTRUCTION ESTIMATE TOTALS: $7,072 $3,041 43.0% $10,114 $7,206 $3,099 $10,305 $23,184 $9,969 $33,153
01 LANDS AND DAMAGES $0 $0 0.0% $0 0.0% $0 $0 $0 0 0.0% $0 $0 $0
30 PLANNING, ENGINEERING & DESIGN5.0% Project Management $354 $152 43.0% $506 3.4% $366 $157 $523 2058Q2 362.1% $1,690 $727 $2,416
Planning & Environmental Compliance INC. 43.0% 0.0% $0 $0 0 362.1% $0 $0 $0 Engineering & Design INC. 43.0% 0.0% $0 $0 0 362.1% $0 $0 $0 Reviews, ATRs, IEPRs, VE INC. 43.0% 0.0% $0 $0 0 362.1% $0 $0 $0 Life Cycle Updates (cost, schedule, risks) INC. 43.0% 0.0% $0 $0 0 362.1% $0 $0 $0 Contracting & Reprographics INC. 43.0% 0.0% $0 $0 0 362.1% $0 $0 $0 Engineering During Construction INC. 43.0% 0.0% $0 $0 0 386.5% $0 $0 $0 Planning During Construction INC. 43.0% 0.0% $0 $0 0 386.5% $0 $0 $0 Project Operations INC. 43.0% 0.0% $0 $0 0 362.1% $0 $0 $0
31 CONSTRUCTION MANAGEMENT3.7% Construction Management $261 $112 43.0% $373 3.4% $270 $116 $386 2059Q3 386.5% $1,312 $564 $1,876
Project Operation: INC. 43.0% 0.0% $0 $0 0 386.5% $0 $0 $0 Project Management INC. 43.0% 0.0% $0 $0 0 386.5% $0 $0 $0
CONTRACT COST TOTALS: $7,687 $3,305 $10,992 $7,841 $3,372 $11,213 $26,185 $11,260 $37,445
Civil Works Work Breakdown Structure ESTIMATED COST PROJECT FIRST COST(Constant Dollar Basis) TOTAL PROJECT COST (FULLY FUNDED)
SAGAMORE BRIDGE - REHABILITATIONEstimate Prepared:
Effective Price Level:

**** TOTAL PROJECT COST SUMMARY **** Printed:3/2/2020 Page 13 of 25
Filename: 0_Non-CAP CCCB MRER Rehabilitation TPCS Sep 2019_02Mar2020.xlsxTPCS-SAGAMORE
**** CONTRACT COST SUMMARY ****
PROJECT: DISTRICT: NAE District PREPARED: 9/11/2019LOCATION: Cape Cod Canal, Massachusetts POC: CHIEF, COST ENGINEERING, Christopher Tilley (AUPDATED: 2/28/2020This Estimate reflects the scope and schedule in report; CCC Bridges Major Rehabilitation Evaluation Report September 2018
11-Sep-19 20201-Oct-18 1 OCT 19
WBS Civil Works COST CNTG CNTG TOTAL ESC COST CNTG TOTAL Mid-Point INFLATED COST CNTG FULLNUMBER Feature & Sub-Feature Description ($K) ($K) (%) ($K) (%) ($K) ($K) ($K) Date (%) ($K) ($K) ($K)
A B C D E F G H I J P L M N O11 Contract 11: Truss Deck, Floorbeam, Major Steel, Complete Paint & Joint Replace (65)
08 Truss Span Deck Replacement $19,515 $8,391 43.0% $27,906 1.9% $19,884 $8,550 $28,434 2065Q3 284.2% $76,385 $32,846 $109,23108 Replace Abutment Spans $8,192 $3,523 43.0% $11,715 1.9% $8,347 $3,589 $11,936 2065Q3 284.2% $32,066 $13,788 $45,85408 Major Steel Truss Repairs $20,057 $8,624 43.0% $28,681 1.9% $20,436 $8,788 $29,224 2065Q3 284.2% $78,507 $33,758 $112,26508 Complete Painting of Structural Steel $21,432 $9,216 43.0% $30,647 1.9% $21,837 $9,390 $31,226 2065Q3 284.2% $83,888 $36,072 $119,95908 Joint Replacement $1,980 $851 43.0% $2,831 1.9% $2,017 $867 $2,885 2065Q3 284.2% $7,750 $3,332 $11,082
#N/A#N/A#N/A#N/A#N/A#N/A#N/A#N/A#N/A
__________ _________ ________ ____________ _________ _________ __________ _________ _________ ________________
CONSTRUCTION ESTIMATE TOTALS: $71,175 $30,605 43.0% $101,780 $72,521 $31,184 $103,705 $278,595 $119,796 $398,391
01 LANDS AND DAMAGES $0 $0 0.0% $0 0.0% $0 $0 $0 0 0.0% $0 $0 $0
30 PLANNING, ENGINEERING & DESIGN5.3% Project Management $3,757 $1,615 43.0% $5,372 3.4% $3,885 $1,670 $5,555 2064Q2 491.4% $22,976 $9,880 $32,855
Planning & Environmental Compliance INC. 43.0% 0.0% $0 $0 0 491.4% $0 $0 $0 Engineering & Design INC. 43.0% 0.0% $0 $0 0 491.4% $0 $0 $0 Reviews, ATRs, IEPRs, VE INC. 43.0% 0.0% $0 $0 0 491.4% $0 $0 $0 Life Cycle Updates (cost, schedule, risks) INC. 43.0% 0.0% $0 $0 0 491.4% $0 $0 $0 Contracting & Reprographics INC. 43.0% 0.0% $0 $0 0 491.4% $0 $0 $0 Engineering During Construction INC. 43.0% 0.0% $0 $0 0 522.7% $0 $0 $0 Planning During Construction INC. 43.0% 0.0% $0 $0 0 522.7% $0 $0 $0 Project Operations INC. 43.0% 0.0% $0 $0 0 491.4% $0 $0 $0
31 CONSTRUCTION MANAGEMENT1.6% Construction Management $1,136 $489 43.0% $1,625 3.4% $1,175 $505 $1,680 2065Q3 522.7% $7,317 $3,146 $10,464
Project Operation: INC. 43.0% 0.0% $0 $0 0 522.7% $0 $0 $0 Project Management INC. 43.0% 0.0% $0 $0 0 522.7% $0 $0 $0
CONTRACT COST TOTALS: $76,068 $32,709 $108,777 $77,580 $33,360 $110,940 $308,888 $132,822 $441,710
Sagamore Bridge Rehabilitation Alternative
TOTAL PROJECT COST (FULLY FUNDED)
SAGAMORE BRIDGE - REHABILITATION Estimate Prepared: Program Year (Budget EC):Effective Price Level: Effective Price Level Date:
Civil Works Work Breakdown Structure ESTIMATED COST PROJECT FIRST COST(Constant Dollar Basis)

**** TOTAL PROJECT COST SUMMARY **** Printed:3/2/2020 Page 14 of 25
Filename: 0_Non-CAP CCCB MRER Rehabilitation TPCS Sep 2019_02Mar2020.xlsxTPCS-BOURNE
PROJECT: DISTRICT: NAE District PREPARED: 9/11/2019PROJECT NO P2 xxxxxx POC: CHIEF, COST ENGINEERING, Christopher Tilley (Acting)LOCATION: Cape Cod Canal, Massachusetts UPDATED: 2/28/2020
This Estimate reflects the scope and schedule in report; CCC Bridges Major Rehabilitation Evaluation Report September 2018
Program Year (Budget EC): 2020Effective Price Level Date: 1 OCT 19
Spent Thru:WBS Civil Works COST CNTG CNTG TOTAL ESC COST CNTG TOTAL 1-Oct-18 INFLATED COST CNTG FULL
NUMBER Feature & Sub-Feature Description ($K) ($K) (%) ($K) (%) ($K) ($K) ($K) ($K) ($K) (%) ($K) ($K) ($K) A B C D E F G H I J K L M N O
08 ROADS, RAILROADS & BRIDGES Contr 01 $111,075 $47,762 43.0% $158,837 1.9% $113,175 $48,665 $161,841 $0 $161,841 36.5% $154,511 $66,440 $220,95108 ROADS, RAILROADS & BRIDGES Contr 02 $5,650 $2,429 43.0% $8,079 1.9% $5,756 $2,475 $8,232 $0 $8,232 63.0% $9,384 $4,035 $13,41908 ROADS, RAILROADS & BRIDGES Contr 03 $1,938 $833 43.0% $2,771 1.9% $1,974 $849 $2,823 $0 $2,823 67.9% $3,315 $1,425 $4,74008 ROADS, RAILROADS & BRIDGES Contr 04 $5,650 $2,429 43.0% $8,079 1.9% $5,756 $2,475 $8,232 $0 $8,232 100.5% $11,541 $4,963 $16,50408 ROADS, RAILROADS & BRIDGES Contr 05 $5,162 $2,220 43.0% $7,382 1.9% $5,260 $2,262 $7,522 $0 $7,522 106.5% $10,862 $4,671 $15,53208 ROADS, RAILROADS & BRIDGES Contr 06 $17,120 $7,362 43.0% $24,482 1.9% $17,444 $7,501 $24,945 $0 $24,945 139.4% $41,760 $17,957 $59,71608 ROADS, RAILROADS & BRIDGES Contr 07 $1,938 $833 43.0% $2,771 1.9% $1,974 $849 $2,823 $0 $2,823 154.0% $5,014 $2,156 $7,17008 ROADS, RAILROADS & BRIDGES Contr 08 $5,650 $2,429 43.0% $8,079 1.9% $5,756 $2,475 $8,232 $0 $8,232 194.4% $16,948 $7,288 $24,23608 ROADS, RAILROADS & BRIDGES Contr 09 $5,162 $2,220 43.0% $7,382 1.9% $5,260 $2,262 $7,522 $0 $7,522 221.7% $16,922 $7,277 $24,19908 ROADS, RAILROADS & BRIDGES Contr 10 $5,650 $2,429 43.0% $8,079 1.9% $5,756 $2,475 $8,232 $0 $8,232 262.1% $20,844 $8,963 $29,80808 ROADS, RAILROADS & BRIDGES Contr 11 $84,966 $36,535 43.0% $121,501 1.9% $86,572 $37,226 $123,798 $0 $123,798 332.4% $374,317 $160,956 $535,27302 RELOCATIONS (Utilities) $8,750 $3,763 43.0% $12,513 1.9% $8,915 $3,834 $12,749 $0 $12,749 32.5% $11,817 $5,081 $16,899
#N/A $0 $0 - $0 - $0 $0 $0 $0 $0 - $0 $0 $0#N/A $0 $0 - $0 - $0 $0 $0 $0 $0 - $0 $0 $0
__________ _________ ____________ _________ _________ __________ ___________ _________ _________ ________________CONSTRUCTION ESTIMATE TOTALS: $258,709 $111,245 $369,954 1.9% $263,601 $113,348 $376,949 $0 $376,949 156.9% $677,235 $291,211 $968,446
01 LANDS AND DAMAGES $0 $0 - $0 - $0 $0 $0 $0 $0 - $0 $0 $0
30 PLANNING, ENGINEERING & DESIGN $13,789 $5,929 43.0% $19,719 3.4% $14,259 $6,131 $20,390 $0 $20,390 259.8% $51,306 $22,062 $73,368
31 CONSTRUCTION MANAGEMENT $6,691 $2,877 43.0% $9,568 3.4% $6,919 $2,975 $9,894 $0 $9,894 244.8% $23,854 $10,257 $34,111
PROJECT COST TOTALS: $279,189 $120,051 43.0% $399,241 $284,778 $122,455 $407,233 $0 $407,233 164.2% $752,395 $323,530 $1,075,925
CHIEF, COST ENGINEERING, Christopher Tilley (Acting)ESTIMATED TOTAL PROJECT COST:
PROJECT MANAGER, Craig Martin
CHIEF, REAL ESTATE, Gaelen Daly
CHIEF, PLANNING, John Kennelly
CHIEF, ENGINEERING, David Margolis
CHIEF, OPERATIONS, Eric Pedersen
CHIEF, CONSTRUCTION, Sean Dolan
CHIEF, CONTRACTING, Sheila Winston-Vincuilla
CHIEF, PM-PB, Janet Harrington
CHIEF, DPM, Scott Acone
Bourne Bridge Rehabilitation Alternative
Civil Works Work Breakdown Structure ESTIMATED COST PROJECT FIRST COST (Constant Dollar Basis)
TOTAL PROJECT COST (FULLY FUNDED)
BOURNE BRIDGE - REHABILITATIONTOTAL FIRST COST
$1,075,925

**** TOTAL PROJECT COST SUMMARY **** Printed:3/2/2020 Page 15 of 25
Filename: 0_Non-CAP CCCB MRER Rehabilitation TPCS Sep 2019_02Mar2020.xlsxTPCS-BOURNE
**** CONTRACT COST SUMMARY ****
PROJECT: DISTRICT: NAE District PREPARED: 9/11/2019LOCATION: Cape Cod Canal, Massachusetts POC: CHIEF, COST ENGINEERING, Christopher Tilley (AUPDATED: 2/28/2020This Estimate reflects the scope and schedule in report; CCC Bridges Major Rehabilitation Evaluation Report September 2018
11-Sep-19 20201-Oct-18 1 OCT 19
RISK BASED WBS Civil Works COST CNTG CNTG TOTAL ESC COST CNTG TOTAL Mid-Point INFLATED COST CNTG FULL
NUMBER Feature & Sub-Feature Description ($K) ($K) (%) ($K) (%) ($K) ($K) ($K) Date (%) ($K) ($K) ($K) A B C D E F G H I J P L M N O
01 Contract 01: Major Rehab (29-31)08 Truss Span Deck Replacement $30,163 $12,970 43.0% $43,134 1.9% $30,734 $13,215 $43,949 2030Q3 36.5% $41,959 $18,042 $60,00108 Suspender Cable Replacement $10,234 $4,401 43.0% $14,635 1.9% $10,428 $4,484 $14,912 2030Q3 36.5% $14,236 $6,122 $20,35808 Replace Abutment Spans $7,841 $3,372 43.0% $11,213 1.9% $7,989 $3,435 $11,425 2030Q3 36.5% $10,907 $4,690 $15,59708 Bearing Replacement $3,460 $1,488 43.0% $4,948 1.9% $3,525 $1,516 $5,041 2030Q3 36.5% $4,813 $2,070 $6,88208 Joint Replacement $1,938 $833 43.0% $2,771 1.9% $1,974 $849 $2,823 2030Q3 36.5% $2,695 $1,159 $3,85408 Minor Steel Truss Repairs $9,190 $3,952 43.0% $13,142 1.9% $9,364 $4,026 $13,390 2030Q3 36.5% $12,784 $5,497 $18,28108 Major Steel Truss Repairs $27,904 $11,999 43.0% $39,903 1.9% $28,432 $12,226 $40,657 2030Q3 36.5% $38,816 $16,691 $55,50708 Paving $3,225 $1,387 43.0% $4,611 1.9% $3,286 $1,413 $4,699 2030Q3 36.5% $4,486 $1,929 $6,41508 Complete Painting of Structural Steel $17,120 $7,362 43.0% $24,482 1.9% $17,444 $7,501 $24,945 2030Q3 36.5% $23,815 $10,240 $34,05502 RELOCATIONS (Utilities) $8,750 $3,763 43.0% $12,513 1.9% $8,915 $3,834 $12,749 2029Q3 32.5% $11,817 $5,081 $16,899
__________ _________ ________ ____________ _________ _________ __________ _________ _________ ________________CONSTRUCTION ESTIMATE TOTALS: $119,825 $51,525 43.0% $171,350 $122,091 $52,499 $174,590 $166,328 $71,521 $237,849
01 LANDS AND DAMAGES $0 $0 0.0% $0 0.0% $0 $0 $0 0 0.0% $0 $0 $0
30 PLANNING, ENGINEERING & DESIGN4.6% Project Management $5,554 $2,388 43.0% $7,942 3.4% $5,743 $2,469 $8,212 2023Q2 13.0% $6,490 $2,791 $9,281
Planning & Environmental Compliance INC. 43.0% 0.0% $0 $0 0 13.0% $0 $0 $0 Engineering & Design INC. 43.0% 0.0% $0 $0 0 13.0% $0 $0 $0 Reviews, ATRs, IEPRs, VE INC. 43.0% 0.0% $0 $0 0 13.0% $0 $0 $0 Life Cycle Updates (cost, schedule, risks) INC. 43.0% 0.0% $0 $0 0 13.0% $0 $0 $0 Contracting & Reprographics INC. 43.0% 0.0% $0 $0 0 13.0% $0 $0 $0 Engineering During Construction INC. 43.0% 0.0% $0 $0 0 48.9% $0 $0 $0 Planning During Construction INC. 43.0% 0.0% $0 $0 0 48.9% $0 $0 $0 Project Operations INC. 43.0% 0.0% $0 $0 0 13.0% $0 $0 $0
31 CONSTRUCTION MANAGEMENT1.9% Construction Management $2,278 $980 43.0% $3,258 3.4% $2,356 $1,013 $3,369 2030Q3 48.9% $3,508 $1,508 $5,017
Project Operation: INC. 43.0% 0.0% $0 $0 0 48.9% $0 $0 $0 Project Management INC. 43.0% 0.0% $0 $0 0 48.9% $0 $0 $0
CONTRACT COST TOTALS: $127,657 $54,893 $182,550 $130,190 $55,982 $186,171 $176,326 $75,820 $252,147
Bourne Bridge Rehabilitation Alternative
Civil Works Work Breakdown Structure ESTIMATED COST PROJECT FIRST COST(Constant Dollar Basis) TOTAL PROJECT COST (FULLY FUNDED)
BOURNE BRIDGE - REHABILITATION Estimate Prepared: Program Year (Budget EC):Effective Price Level: Effective Price Level Date:

**** TOTAL PROJECT COST SUMMARY **** Printed:3/2/2020 Page 16 of 25
Filename: 0_Non-CAP CCCB MRER Rehabilitation TPCS Sep 2019_02Mar2020.xlsxTPCS-BOURNE
**** CONTRACT COST SUMMARY ****
PROJECT: DISTRICT: NAE District PREPARED: 9/11/2019LOCATION: Cape Cod Canal, Massachusetts POC: CHIEF, COST ENGINEERING, Christopher Tilley (AUPDATED: 2/28/2020This Estimate reflects the scope and schedule in report; CCC Bridges Major Rehabilitation Evaluation Report September 2018
11-Sep-19 20201-Oct-18 1 OCT 19
WBS Civil Works COST CNTG CNTG TOTAL ESC COST CNTG TOTAL Mid-Point INFLATED COST CNTG FULLNUMBER Feature & Sub-Feature Description ($K) ($K) (%) ($K) (%) ($K) ($K) ($K) Date (%) ($K) ($K) ($K)
A B C D E F G H I J P L M N O02 Contract 02: Maint Paint (36)
08 Maintenance Painting of Structural Steel $5,650 $2,429 43.0% $8,079 1.9% $5,756 $2,475 $8,232 2036Q3 63.0% $9,384 $4,035 $13,419#N/A#N/A#N/A#N/A#N/A#N/A#N/A#N/A#N/A#N/A#N/A#N/A#N/A
__________ _________ ________ ____________ _________ _________ __________ _________ _________ ________________
CONSTRUCTION ESTIMATE TOTALS: $5,650 $2,429 43.0% $8,079 $5,756 $2,475 $8,232 $9,384 $4,035 $13,419
01 LANDS AND DAMAGES $0 $0 0.0% $0 0.0% $0 $0 $0 0 0.0% $0 $0 $0
30 PLANNING, ENGINEERING & DESIGN5.0% Project Management $282 $121 43.0% $404 3.4% $292 $126 $418 2035Q2 79.7% $525 $226 $751
Planning & Environmental Compliance INC. 43.0% 0.0% $0 $0 0 79.7% $0 $0 $0 Engineering & Design INC. 43.0% 0.0% $0 $0 0 79.7% $0 $0 $0 Reviews, ATRs, IEPRs, VE INC. 43.0% 0.0% $0 $0 0 79.7% $0 $0 $0 Life Cycle Updates (cost, schedule, risks) INC. 43.0% 0.0% $0 $0 0 79.7% $0 $0 $0 Contracting & Reprographics INC. 43.0% 0.0% $0 $0 0 79.7% $0 $0 $0 Engineering During Construction INC. 43.0% 0.0% $0 $0 0 89.0% $0 $0 $0 Planning During Construction INC. 43.0% 0.0% $0 $0 0 89.0% $0 $0 $0 Project Operations INC. 43.0% 0.0% $0 $0 0 79.7% $0 $0 $0
31 CONSTRUCTION MANAGEMENT4.6% Construction Management $261 $112 43.0% $374 3.4% $270 $116 $386 2036Q3 89.0% $511 $220 $730
Project Operation: INC. 43.0% 0.0% $0 $0 0 89.0% $0 $0 $0 Project Management INC. 43.0% 0.0% $0 $0 0 89.0% $0 $0 $0
CONTRACT COST TOTALS: $6,193 $2,663 $8,857 $6,319 $2,717 $9,036 $10,420 $4,480 $14,900
Bourne Bridge Rehabilitation Alternative
Civil Works Work Breakdown Structure ESTIMATED COST PROJECT FIRST COST(Constant Dollar Basis) TOTAL PROJECT COST (FULLY FUNDED)
BOURNE BRIDGE - REHABILITATION Estimate Prepared: Program Year (Budget EC):Effective Price Level: Effective Price Level Date:
**** TOTAL PROJECT COST SUMMARY **** Printed:3/2/2020 Page 17 of 25
Filename: 0_Non-CAP CCCB MRER Rehabilitation TPCS Sep 2019_02Mar2020.xlsxTPCS-BOURNE
**** CONTRACT COST SUMMARY ****
PROJECT: DISTRICT: NAE District PREPARED: 9/11/2019LOCATION: Cape Cod Canal, Massachusetts POC: CHIEF, COST ENGINEERING, Christopher Tilley (AUPDATED: 2/28/2020This Estimate reflects the scope and schedule in report; CCC Bridges Major Rehabilitation Evaluation Report September 2018
11-Sep-19 20201-Oct-18 1 OCT 19
WBS Civil Works COST CNTG CNTG TOTAL ESC COST CNTG TOTAL Mid-Point INFLATED COST CNTG FULLNUMBER Feature & Sub-Feature Description ($K) ($K) (%) ($K) (%) ($K) ($K) ($K) Date (%) ($K) ($K) ($K)
A B C D E F G H I J P L M N O03 Contract 03: Joint Replace (37)
08 Joint Replacement $1,938 $833 43.0% $2,771 1.9% $1,974 $849 $2,823 2037Q3 67.9% $3,315 $1,425 $4,740#N/A#N/A#N/A#N/A#N/A#N/A#N/A#N/A#N/A#N/A#N/A#N/A#N/A
__________ _________ ________ ____________ _________ _________ __________ _________ _________ ________________
CONSTRUCTION ESTIMATE TOTALS: $1,938 $833 43.0% $2,771 $1,974 $849 $2,823 $3,315 $1,425 $4,740
01 LANDS AND DAMAGES $0 $0 0.0% $0 0.0% $0 $0 $0 0 0.0% $0 $0 $0
30 PLANNING, ENGINEERING & DESIGN15.0% Project Management $291 $125 43.0% $416 3.4% $301 $129 $430 2036Q2 87.1% $562 $242 $804
Planning & Environmental Compliance INC. 43.0% 0.0% $0 $0 0 87.1% $0 $0 $0 Engineering & Design INC. 43.0% 0.0% $0 $0 0 87.1% $0 $0 $0 Reviews, ATRs, IEPRs, VE INC. 43.0% 0.0% $0 $0 0 87.1% $0 $0 $0 Life Cycle Updates (cost, schedule, risks) INC. 43.0% 0.0% $0 $0 0 87.1% $0 $0 $0 Contracting & Reprographics INC. 43.0% 0.0% $0 $0 0 87.1% $0 $0 $0 Engineering During Construction INC. 43.0% 0.0% $0 $0 0 96.8% $0 $0 $0 Planning During Construction INC. 43.0% 0.0% $0 $0 0 96.8% $0 $0 $0 Project Operations INC. 43.0% 0.0% $0 $0 0 87.1% $0 $0 $0
31 CONSTRUCTION MANAGEMENT19.3% Construction Management $375 $161 43.0% $536 3.4% $387 $167 $554 2037Q3 96.8% $762 $328 $1,090
Project Operation: INC. 43.0% 0.0% $0 $0 0 96.8% $0 $0 $0 Project Management INC. 43.0% 0.0% $0 $0 0 96.8% $0 $0 $0
CONTRACT COST TOTALS: $2,603 $1,119 $3,722 $2,662 $1,145 $3,807 $4,639 $1,995 $6,634
Bourne Bridge Rehabilitation Alternative
Civil Works Work Breakdown Structure ESTIMATED COST PROJECT FIRST COST(Constant Dollar Basis) TOTAL PROJECT COST (FULLY FUNDED)
BOURNE BRIDGE - REHABILITATION Estimate Prepared: Program Year (Budget EC):Effective Price Level: Effective Price Level Date:
**** TOTAL PROJECT COST SUMMARY **** Printed:3/2/2020 Page 18 of 25
Filename: 0_Non-CAP CCCB MRER Rehabilitation TPCS Sep 2019_02Mar2020.xlsxTPCS-BOURNE
**** CONTRACT COST SUMMARY ****
PROJECT: Bourne Bridge Rehabilitation Alternative DISTRICT: NAE District PREPARED: 9/11/2019LOCATION: Cape Cod Canal, Massachusetts POC: CHIEF, COST ENGINEERING, Christopher Tilley (AUPDATED: 2/28/2020This Estimate reflects the scope and schedule in report; CCC Bridges Major Rehabilitation Evaluation Report September 2018
11-Sep-19 Program Year (Budget EC): 20201-Oct-18 Effective Price Level Date: 1 OCT 19 FULLY FUNDED PROJECT ESTIMATE
WBS Civil Works COST CNTG CNTG TOTAL ESC COST CNTG TOTAL Mid-Point INFLATED COST CNTG FULLNUMBER Feature & Sub-Feature Description ($K) ($K) (%) ($K) (%) ($K) ($K) ($K) Date (%) ($K) ($K) ($K)
A B C D E F G H I J P L M N O04 Contract 04: Maint Paint (43)
08 Maintenance Painting of Structural Steel $5,650 $2,429 43.0% $8,079 1.9% $5,756 $2,475 $8,232 2043Q3 100.5% $11,541 $4,963 $16,504#N/A#N/A#N/A#N/A#N/A#N/A#N/A#N/A#N/A#N/A#N/A#N/A#N/A
__________ _________ ________ ____________ _________ _________ __________ _________ _________ ________________
CONSTRUCTION ESTIMATE TOTALS: $5,650 $2,429 43.0% $8,079 $5,756 $2,475 $8,232 $11,541 $4,963 $16,504
01 LANDS AND DAMAGES $0 $0 0.0% $0 0.0% $0 $0 $0 0 0.0% $0 $0 $0
30 PLANNING, ENGINEERING & DESIGN5.0% Project Management $282 $121 43.0% $404 3.4% $292 $126 $418 2042Q2 139.2% $699 $300 $999
Planning & Environmental Compliance INC. 43.0% 0.0% $0 $0 0 139.2% $0 $0 $0 Engineering & Design INC. 43.0% 0.0% $0 $0 0 139.2% $0 $0 $0 Reviews, ATRs, IEPRs, VE INC. 43.0% 0.0% $0 $0 0 139.2% $0 $0 $0 Life Cycle Updates (cost, schedule, risks) INC. 43.0% 0.0% $0 $0 0 139.2% $0 $0 $0 Contracting & Reprographics INC. 43.0% 0.0% $0 $0 0 139.2% $0 $0 $0 Engineering During Construction INC. 43.0% 0.0% $0 $0 0 151.9% $0 $0 $0 Planning During Construction INC. 43.0% 0.0% $0 $0 0 151.9% $0 $0 $0 Project Operations INC. 43.0% 0.0% $0 $0 0 139.2% $0 $0 $0
31 CONSTRUCTION MANAGEMENT4.6% Construction Management $261 $112 43.0% $374 3.4% $270 $116 $386 2043Q3 151.9% $681 $293 $973
Project Operation: INC. 43.0% 0.0% $0 $0 0 151.9% $0 $0 $0 Project Management INC. 43.0% 0.0% $0 $0 0 151.9% $0 $0 $0
CONTRACT COST TOTALS: $6,193 $2,663 $8,857 $6,319 $2,717 $9,036 $12,920 $5,556 $18,476
Civil Works Work Breakdown Structure ESTIMATED COST PROJECT FIRST COST(Constant Dollar Basis) TOTAL PROJECT COST (FULLY FUNDED)
BOURNE BRIDGE - REHABILITATIONEstimate Prepared:
Effective Price Level:

**** TOTAL PROJECT COST SUMMARY **** Printed:3/2/2020 Page 19 of 25
Filename: 0_Non-CAP CCCB MRER Rehabilitation TPCS Sep 2019_02Mar2020.xlsxTPCS-BOURNE
**** CONTRACT COST SUMMARY ****
PROJECT: Bourne Bridge Rehabilitation Alternative DISTRICT: NAE District PREPARED: 9/11/2019LOCATION: Cape Cod Canal, Massachusetts POC: CHIEF, COST ENGINEERING, Christopher Tilley (AUPDATED: 2/28/2020This Estimate reflects the scope and schedule in report; CCC Bridges Major Rehabilitation Evaluation Report September 2018
11-Sep-19 Program Year (Budget EC): 20201-Oct-18 Effective Price Level Date: 1 OCT 19 FULLY FUNDED PROJECT ESTIMATE
WBS Civil Works COST CNTG CNTG TOTAL ESC COST CNTG TOTAL Mid-Point INFLATED COST CNTG FULLNUMBER Feature & Sub-Feature Description ($K) ($K) (%) ($K) (%) ($K) ($K) ($K) Date (%) ($K) ($K) ($K)
A B C D E F G H I J P L M N O05 Contract 05: Paving & Joint Replace (44)
08 Paving $3,225 $1,387 43.0% $4,611 1.9% $3,286 $1,413 $4,699 2044Q3 106.5% $6,785 $2,918 $9,70308 Joint Replacement $1,938 $833 43.0% $2,771 1.9% $1,974 $849 $2,823 2044Q3 106.5% $4,077 $1,753 $5,830
#N/A#N/A#N/A#N/A#N/A#N/A#N/A#N/A#N/A#N/A#N/A#N/A
__________ _________ ________ ____________ _________ _________ __________ _________ _________ ________________
CONSTRUCTION ESTIMATE TOTALS: $5,162 $2,220 43.0% $7,382 $5,260 $2,262 $7,522 $10,862 $4,671 $15,532
01 LANDS AND DAMAGES $0 $0 0.0% $0 0.0% $0 $0 $0 0 0.0% $0 $0 $0
30 PLANNING, ENGINEERING & DESIGN11.9% Project Management $613 $264 43.0% $877 3.4% $634 $273 $907 2043Q2 149.3% $1,580 $680 $2,260
Planning & Environmental Compliance INC. 43.0% 0.0% $0 $0 0 149.3% $0 $0 $0 Engineering & Design INC. 43.0% 0.0% $0 $0 0 149.3% $0 $0 $0 Reviews, ATRs, IEPRs, VE INC. 43.0% 0.0% $0 $0 0 149.3% $0 $0 $0 Life Cycle Updates (cost, schedule, risks) INC. 43.0% 0.0% $0 $0 0 149.3% $0 $0 $0 Contracting & Reprographics INC. 43.0% 0.0% $0 $0 0 149.3% $0 $0 $0 Engineering During Construction INC. 43.0% 0.0% $0 $0 0 162.5% $0 $0 $0 Planning During Construction INC. 43.0% 0.0% $0 $0 0 162.5% $0 $0 $0 Project Operations INC. 43.0% 0.0% $0 $0 0 149.3% $0 $0 $0
31 CONSTRUCTION MANAGEMENT9.8% Construction Management $508 $218 43.0% $726 3.4% $525 $226 $751 2044Q3 162.5% $1,378 $593 $1,971
Project Operation: INC. 43.0% 0.0% $0 $0 0 162.5% $0 $0 $0 Project Management INC. 43.0% 0.0% $0 $0 0 162.5% $0 $0 $0
CONTRACT COST TOTALS: $6,283 $2,702 $8,985 $6,419 $2,760 $9,179 $13,821 $5,943 $19,763
PROJECT FIRST COST(Constant Dollar Basis) TOTAL PROJECT COST (FULLY FUNDED)
BOURNE BRIDGE - REHABILITATIONEstimate Prepared:
Effective Price Level:
Civil Works Work Breakdown Structure ESTIMATED COST

**** TOTAL PROJECT COST SUMMARY **** Printed:3/2/2020 Page 20 of 25
Filename: 0_Non-CAP CCCB MRER Rehabilitation TPCS Sep 2019_02Mar2020.xlsxTPCS-BOURNE
**** CONTRACT COST SUMMARY ****
PROJECT: Bourne Bridge Rehabilitation Alternative DISTRICT: NAE District PREPARED: 9/11/2019LOCATION: Cape Cod Canal, Massachusetts POC: CHIEF, COST ENGINEERING, Christopher Tilley (AUPDATED: 2/28/2020This Estimate reflects the scope and schedule in report; CCC Bridges Major Rehabilitation Evaluation Report September 2018
11-Sep-19 Program Year (Budget EC): 20201-Oct-18 Effective Price Level Date: 1 OCT 19 FULLY FUNDED PROJECT ESTIMATE
WBS Civil Works COST CNTG CNTG TOTAL ESC COST CNTG TOTAL Mid-Point INFLATED COST CNTG FULLNUMBER Feature & Sub-Feature Description ($K) ($K) (%) ($K) (%) ($K) ($K) ($K) Date (%) ($K) ($K) ($K)
A B C D E F G H I J P L M N O06 Contract 06: Complete Paint (49)
08 Complete Painting of Structural Steel $17,120 $7,362 43.0% $24,482 1.9% $17,444 $7,501 $24,945 2049Q3 139.4% $41,760 $17,957 $59,716#N/A#N/A#N/A#N/A#N/A#N/A#N/A#N/A#N/A#N/A#N/A#N/A#N/A
__________ _________ ________ ____________ _________ _________ __________ _________ _________ ________________
CONSTRUCTION ESTIMATE TOTALS: $17,120 $7,362 43.0% $24,482 $17,444 $7,501 $24,945 $41,760 $17,957 $59,716
01 LANDS AND DAMAGES $0 $0 0.0% $0 0.0% $0 $0 $0 0 0.0% $0 $0 $0
30 PLANNING, ENGINEERING & DESIGN5.0% Project Management $856 $368 43.0% $1,224 3.4% $885 $381 $1,266 2048Q2 206.2% $2,711 $1,166 $3,876
Planning & Environmental Compliance INC. 43.0% 0.0% $0 $0 0 206.2% $0 $0 $0 Engineering & Design INC. 43.0% 0.0% $0 $0 0 206.2% $0 $0 $0 Reviews, ATRs, IEPRs, VE INC. 43.0% 0.0% $0 $0 0 206.2% $0 $0 $0 Life Cycle Updates (cost, schedule, risks) INC. 43.0% 0.0% $0 $0 0 206.2% $0 $0 $0 Contracting & Reprographics INC. 43.0% 0.0% $0 $0 0 206.2% $0 $0 $0 Engineering During Construction INC. 43.0% 0.0% $0 $0 0 222.4% $0 $0 $0 Planning During Construction INC. 43.0% 0.0% $0 $0 0 222.4% $0 $0 $0 Project Operations INC. 43.0% 0.0% $0 $0 0 206.2% $0 $0 $0
31 CONSTRUCTION MANAGEMENT2.4% Construction Management $417 $179 43.0% $596 3.4% $431 $185 $617 2049Q3 222.4% $1,391 $598 $1,988
Project Operation: INC. 43.0% 0.0% $0 $0 0 222.4% $0 $0 $0 Project Management INC. 43.0% 0.0% $0 $0 0 222.4% $0 $0 $0
CONTRACT COST TOTALS: $18,393 $7,909 $26,302 $18,760 $8,067 $26,827 $45,861 $19,720 $65,581
Civil Works Work Breakdown Structure ESTIMATED COST PROJECT FIRST COST(Constant Dollar Basis) TOTAL PROJECT COST (FULLY FUNDED)
BOURNE BRIDGE - REHABILITATIONEstimate Prepared:
Effective Price Level:
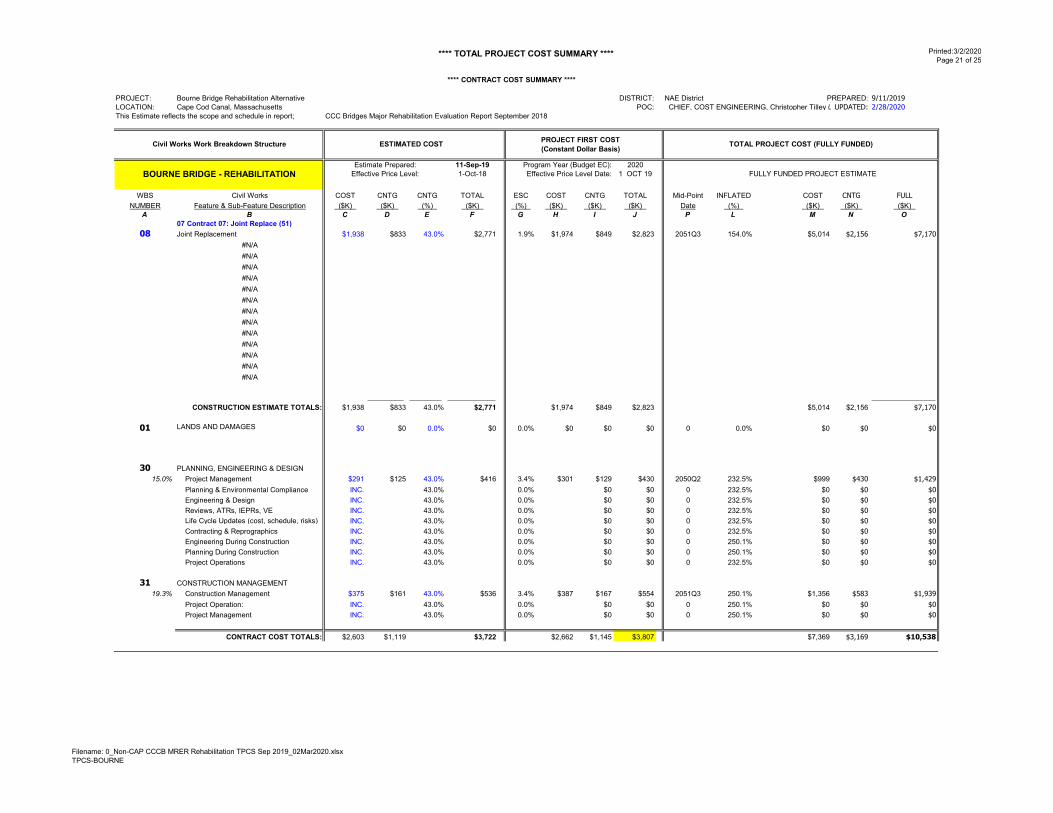
**** TOTAL PROJECT COST SUMMARY **** Printed:3/2/2020 Page 21 of 25
Filename: 0_Non-CAP CCCB MRER Rehabilitation TPCS Sep 2019_02Mar2020.xlsxTPCS-BOURNE
**** CONTRACT COST SUMMARY ****
PROJECT: Bourne Bridge Rehabilitation Alternative DISTRICT: NAE District PREPARED: 9/11/2019LOCATION: Cape Cod Canal, Massachusetts POC: CHIEF, COST ENGINEERING, Christopher Tilley (AUPDATED: 2/28/2020This Estimate reflects the scope and schedule in report; CCC Bridges Major Rehabilitation Evaluation Report September 2018
11-Sep-19 Program Year (Budget EC): 20201-Oct-18 Effective Price Level Date: 1 OCT 19 FULLY FUNDED PROJECT ESTIMATE
WBS Civil Works COST CNTG CNTG TOTAL ESC COST CNTG TOTAL Mid-Point INFLATED COST CNTG FULLNUMBER Feature & Sub-Feature Description ($K) ($K) (%) ($K) (%) ($K) ($K) ($K) Date (%) ($K) ($K) ($K)
A B C D E F G H I J P L M N O07 Contract 07: Joint Replace (51)
08 Joint Replacement $1,938 $833 43.0% $2,771 1.9% $1,974 $849 $2,823 2051Q3 154.0% $5,014 $2,156 $7,170#N/A#N/A#N/A#N/A#N/A#N/A#N/A#N/A#N/A#N/A#N/A#N/A#N/A
__________ _________ ________ ____________ _________ _________ __________ _________ _________ ________________
CONSTRUCTION ESTIMATE TOTALS: $1,938 $833 43.0% $2,771 $1,974 $849 $2,823 $5,014 $2,156 $7,170
01 LANDS AND DAMAGES $0 $0 0.0% $0 0.0% $0 $0 $0 0 0.0% $0 $0 $0
30 PLANNING, ENGINEERING & DESIGN15.0% Project Management $291 $125 43.0% $416 3.4% $301 $129 $430 2050Q2 232.5% $999 $430 $1,429
Planning & Environmental Compliance INC. 43.0% 0.0% $0 $0 0 232.5% $0 $0 $0 Engineering & Design INC. 43.0% 0.0% $0 $0 0 232.5% $0 $0 $0 Reviews, ATRs, IEPRs, VE INC. 43.0% 0.0% $0 $0 0 232.5% $0 $0 $0 Life Cycle Updates (cost, schedule, risks) INC. 43.0% 0.0% $0 $0 0 232.5% $0 $0 $0 Contracting & Reprographics INC. 43.0% 0.0% $0 $0 0 232.5% $0 $0 $0 Engineering During Construction INC. 43.0% 0.0% $0 $0 0 250.1% $0 $0 $0 Planning During Construction INC. 43.0% 0.0% $0 $0 0 250.1% $0 $0 $0 Project Operations INC. 43.0% 0.0% $0 $0 0 232.5% $0 $0 $0
31 CONSTRUCTION MANAGEMENT19.3% Construction Management $375 $161 43.0% $536 3.4% $387 $167 $554 2051Q3 250.1% $1,356 $583 $1,939
Project Operation: INC. 43.0% 0.0% $0 $0 0 250.1% $0 $0 $0 Project Management INC. 43.0% 0.0% $0 $0 0 250.1% $0 $0 $0
CONTRACT COST TOTALS: $2,603 $1,119 $3,722 $2,662 $1,145 $3,807 $7,369 $3,169 $10,538
Civil Works Work Breakdown Structure ESTIMATED COST PROJECT FIRST COST(Constant Dollar Basis) TOTAL PROJECT COST (FULLY FUNDED)
BOURNE BRIDGE - REHABILITATIONEstimate Prepared:
Effective Price Level:

**** TOTAL PROJECT COST SUMMARY **** Printed:3/2/2020 Page 22 of 25
Filename: 0_Non-CAP CCCB MRER Rehabilitation TPCS Sep 2019_02Mar2020.xlsxTPCS-BOURNE
**** CONTRACT COST SUMMARY ****
PROJECT: Bourne Bridge Rehabilitation Alternative DISTRICT: NAE District PREPARED: 9/11/2019LOCATION: Cape Cod Canal, Massachusetts POC: CHIEF, COST ENGINEERING, Christopher Tilley (AUPDATED: 2/28/2020This Estimate reflects the scope and schedule in report; CCC Bridges Major Rehabilitation Evaluation Report September 2018
11-Sep-19 Program Year (Budget EC): 20201-Oct-18 Effective Price Level Date: 1 OCT 19 FULLY FUNDED PROJECT ESTIMATE
WBS Civil Works COST CNTG CNTG TOTAL ESC COST CNTG TOTAL Mid-Point INFLATED COST CNTG FULLNUMBER Feature & Sub-Feature Description ($K) ($K) (%) ($K) (%) ($K) ($K) ($K) Date (%) ($K) ($K) ($K)
A B C D E F G H I J P L M N O08 Contract 08: Maint Paint (56)
08 Maintenance Painting of Structural Steel $5,650 $2,429 43.0% $8,079 1.9% $5,756 $2,475 $8,232 2056Q3 194.4% $16,948 $7,288 $24,236#N/A#N/A#N/A#N/A#N/A#N/A#N/A#N/A#N/A#N/A#N/A#N/A#N/A
__________ _________ ________ ____________ _________ _________ __________ _________ _________ ________________
CONSTRUCTION ESTIMATE TOTALS: $5,650 $2,429 43.0% $8,079 $5,756 $2,475 $8,232 $16,948 $7,288 $24,236
01 LANDS AND DAMAGES $0 $0 0.0% -$ 0.0% $0 $0 $0 0 0.0% $0 $0 $0
30 PLANNING, ENGINEERING & DESIGN5.0% Project Management $282 $121 43.0% $404 3.4% $292 $126 $418 2055Q2 308.4% $1,193 $513 $1,706
Planning & Environmental Compliance INC. 43.0% 0.0% $0 $0 0 308.4% $0 $0 $0 Engineering & Design INC. 43.0% 0.0% $0 $0 0 308.4% $0 $0 $0 Reviews, ATRs, IEPRs, VE INC. 43.0% 0.0% $0 $0 0 308.4% $0 $0 $0 Life Cycle Updates (cost, schedule, risks) INC. 43.0% 0.0% $0 $0 0 308.4% $0 $0 $0 Contracting & Reprographics INC. 43.0% 0.0% $0 $0 0 308.4% $0 $0 $0 Engineering During Construction INC. 43.0% 0.0% $0 $0 0 330.0% $0 $0 $0 Planning During Construction INC. 43.0% 0.0% $0 $0 0 330.0% $0 $0 $0 Project Operations INC. 43.0% 0.0% $0 $0 0 308.4% $0 $0 $0
31 CONSTRUCTION MANAGEMENT4.6% Construction Management $261 $112 43.0% 374 3.4% $270 $116 $386 2056Q3 330.0% $1,162 $500 $1,661
Project Operation: INC. 43.0% 0.0% $0 $0 0 330.0% $0 $0 $0 Project Management INC. 43.0% 0.0% $0 $0 0 330.0% $0 $0 $0
CONTRACT COST TOTALS: $6,193 $2,663 8,857 $6,319 $2,717 $9,036 $19,303 $8,300 $27,604
PROJECT FIRST COST(Constant Dollar Basis) TOTAL PROJECT COST (FULLY FUNDED)
BOURNE BRIDGE - REHABILITATIONEstimate Prepared:
Effective Price Level:
Civil Works Work Breakdown Structure ESTIMATED COST

**** TOTAL PROJECT COST SUMMARY **** Printed:3/2/2020 Page 23 of 25
Filename: 0_Non-CAP CCCB MRER Rehabilitation TPCS Sep 2019_02Mar2020.xlsxTPCS-BOURNE
**** CONTRACT COST SUMMARY ****
PROJECT: Bourne Bridge Rehabilitation Alternative DISTRICT: NAE District PREPARED: 9/11/2019LOCATION: Cape Cod Canal, Massachusetts POC: CHIEF, COST ENGINEERING, Christopher Tilley (AUPDATED: 2/28/2020This Estimate reflects the scope and schedule in report; CCC Bridges Major Rehabilitation Evaluation Report September 2018
11-Sep-19 Program Year (Budget EC): 20201-Oct-18 Effective Price Level Date: 1 OCT 19 FULLY FUNDED PROJECT ESTIMATE
WBS Civil Works COST CNTG CNTG TOTAL ESC COST CNTG TOTAL Mid-Point INFLATED COST CNTG FULLNUMBER Feature & Sub-Feature Description ($K) ($K) (%) ($K) (%) ($K) ($K) ($K) Date (%) ($K) ($K) ($K)
A B C D E F G H I J P L M N O09 Contract 09: Paving & Joint Replace (59)
08 Paving $3,225 $1,387 43.0% $4,611 1.9% $3,286 $1,413 $4,699 2059Q3 221.7% $10,571 $4,546 $15,11708 Joint Replacement $1,938 $833 43.0% $2,771 1.9% $1,974 $849 $2,823 2059Q3 221.7% $6,351 $2,731 $9,082
#N/A#N/A#N/A#N/A#N/A#N/A#N/A#N/A#N/A#N/A#N/A#N/A
__________ _________ ________ ____________ _________ _________ __________ _________ _________ ________________
CONSTRUCTION ESTIMATE TOTALS: $5,162 $2,220 43.0% $7,382 $5,260 $2,262 $7,522 $16,922 $7,277 $24,199
01 LANDS AND DAMAGES $0 $0 0.0% $0 0.0% $0 $0 $0 0 0.0% $0 $0 $0
30 PLANNING, ENGINEERING & DESIGN11.9% Project Management $613 $264 43.0% $877 3.4% $634 $273 $907 2058Q2 362.1% $2,929 $1,260 $4,189
Planning & Environmental Compliance INC. 43.0% 0.0% $0 $0 0 362.1% $0 $0 $0 Engineering & Design INC. 43.0% 0.0% $0 $0 0 362.1% $0 $0 $0 Reviews, ATRs, IEPRs, VE INC. 43.0% 0.0% $0 $0 0 362.1% $0 $0 $0 Life Cycle Updates (cost, schedule, risks) INC. 43.0% 0.0% $0 $0 0 362.1% $0 $0 $0 Contracting & Reprographics INC. 43.0% 0.0% $0 $0 0 362.1% $0 $0 $0 Engineering During Construction INC. 43.0% 0.0% $0 $0 0 386.5% $0 $0 $0 Planning During Construction INC. 43.0% 0.0% $0 $0 0 386.5% $0 $0 $0 Project Operations INC. 43.0% 0.0% $0 $0 0 362.1% $0 $0 $0
31 CONSTRUCTION MANAGEMENT9.8% Construction Management $508 $218 43.0% $726 3.4% $525 $226 $751 2059Q3 386.5% $2,555 $1,099 $3,653
Project Operation: INC. 43.0% 0.0% $0 $0 0 386.5% $0 $0 $0 Project Management INC. 43.0% 0.0% $0 $0 0 386.5% $0 $0 $0
CONTRACT COST TOTALS: $6,283 $2,702 $8,985 $6,419 $2,760 $9,179 $22,407 $9,635 $32,041
Civil Works Work Breakdown Structure ESTIMATED COST PROJECT FIRST COST(Constant Dollar Basis) TOTAL PROJECT COST (FULLY FUNDED)
BOURNE BRIDGE - REHABILITATIONEstimate Prepared:
Effective Price Level:

**** TOTAL PROJECT COST SUMMARY **** Printed:3/2/2020 Page 24 of 25
Filename: 0_Non-CAP CCCB MRER Rehabilitation TPCS Sep 2019_02Mar2020.xlsxTPCS-BOURNE
**** CONTRACT COST SUMMARY ****
PROJECT: Bourne Bridge Rehabilitation Alternative DISTRICT: NAE District PREPARED: 9/11/2019LOCATION: Cape Cod Canal, Massachusetts POC: CHIEF, COST ENGINEERING, Christopher Tilley (AUPDATED: 2/28/2020This Estimate reflects the scope and schedule in report; CCC Bridges Major Rehabilitation Evaluation Report September 2018
11-Sep-19 Program Year (Budget EC): 20201-Oct-18 Effective Price Level Date: 1 OCT 19 FULLY FUNDED PROJECT ESTIMATE
WBS Civil Works COST CNTG CNTG TOTAL ESC COST CNTG TOTAL Mid-Point INFLATED COST CNTG FULLNUMBER Feature & Sub-Feature Description ($K) ($K) (%) ($K) (%) ($K) ($K) ($K) Date (%) ($K) ($K) ($K)
A B C D E F G H I J P L M N O10 Contract 10: Maint Paint (63)
08 Maintenance Painting of Structural Steel $5,650 $2,429 43.0% $8,079 1.9% $5,756 $2,475 $8,232 2063Q3 262.1% $20,844 $8,963 $29,808#N/A#N/A#N/A#N/A#N/A#N/A#N/A#N/A#N/A#N/A#N/A#N/A#N/A
__________ _________ ________ ____________ _________ _________ __________ _________ _________ ________________
CONSTRUCTION ESTIMATE TOTALS: $5,650 $2,429 43.0% $8,079 $5,756 $2,475 $8,232 $20,844 $8,963 $29,808
01 LANDS AND DAMAGES $0 $0 0.0% $0 0.0% $0 $0 $0 0 0.0% $0 $0 $0
30 PLANNING, ENGINEERING & DESIGN5.0% Project Management $282 $121 43.0% $404 3.4% $292 $126 $418 2062Q2 444.7% $1,591 $684 $2,275
Planning & Environmental Compliance INC. 43.0% 0.0% $0 $0 0 444.7% $0 $0 $0 Engineering & Design INC. 43.0% 0.0% $0 $0 0 444.7% $0 $0 $0 Reviews, ATRs, IEPRs, VE INC. 43.0% 0.0% $0 $0 0 444.7% $0 $0 $0 Life Cycle Updates (cost, schedule, risks) INC. 43.0% 0.0% $0 $0 0 444.7% $0 $0 $0 Contracting & Reprographics INC. 43.0% 0.0% $0 $0 0 444.7% $0 $0 $0 Engineering During Construction INC. 43.0% 0.0% $0 $0 0 473.6% $0 $0 $0 Planning During Construction INC. 43.0% 0.0% $0 $0 0 473.6% $0 $0 $0 Project Operations INC. 43.0% 0.0% $0 $0 0 444.7% $0 $0 $0
31 CONSTRUCTION MANAGEMENT4.6% Construction Management $261 $112 43.0% $374 3.4% $270 $116 $386 2063Q3 473.6% $1,550 $666 $2,216
Project Operation: INC. 43.0% 0.0% $0 $0 0 473.6% $0 $0 $0 Project Management INC. 43.0% 0.0% $0 $0 0 473.6% $0 $0 $0
CONTRACT COST TOTALS: $6,193 $2,663 $8,857 $6,319 $2,717 $9,036 $23,985 $10,314 $34,299
TOTAL PROJECT COST (FULLY FUNDED)
BOURNE BRIDGE - REHABILITATIONEstimate Prepared:
Effective Price Level:
Civil Works Work Breakdown Structure ESTIMATED COST PROJECT FIRST COST(Constant Dollar Basis)
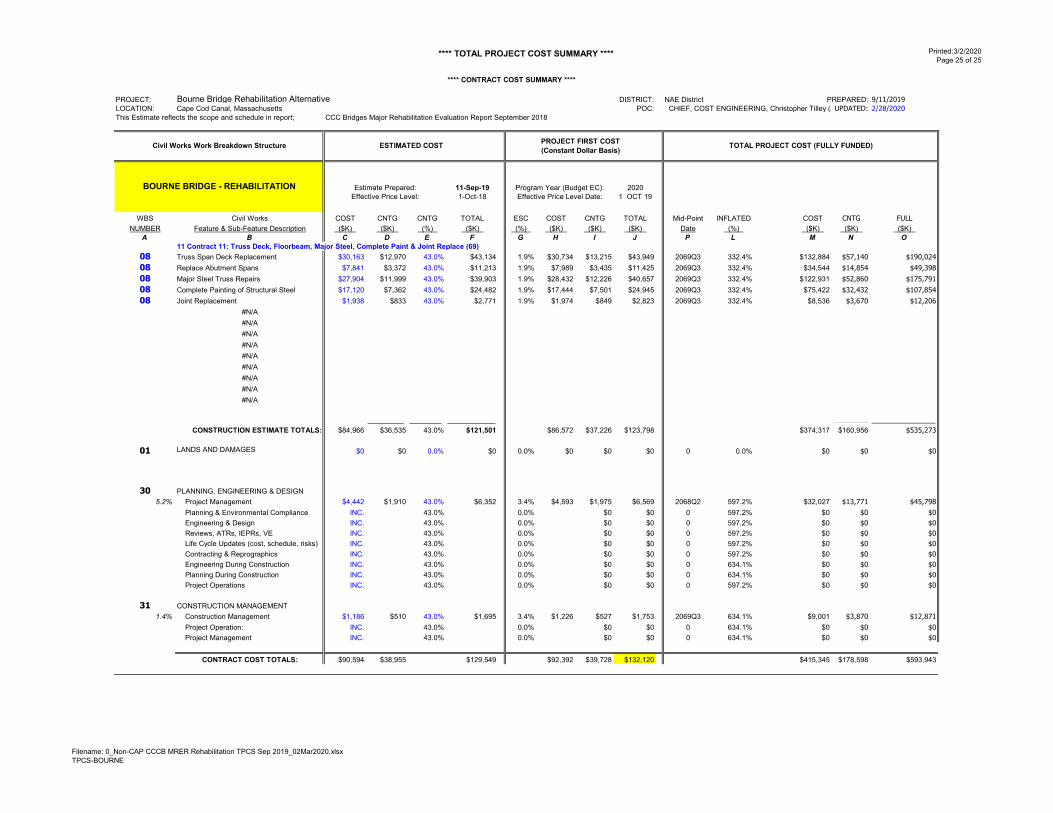
**** TOTAL PROJECT COST SUMMARY **** Printed:3/2/2020 Page 25 of 25
Filename: 0_Non-CAP CCCB MRER Rehabilitation TPCS Sep 2019_02Mar2020.xlsxTPCS-BOURNE
**** CONTRACT COST SUMMARY ****
PROJECT: DISTRICT: NAE District PREPARED: 9/11/2019LOCATION: Cape Cod Canal, Massachusetts POC: CHIEF, COST ENGINEERING, Christopher Tilley (AUPDATED: 2/28/2020This Estimate reflects the scope and schedule in report; CCC Bridges Major Rehabilitation Evaluation Report September 2018
11-Sep-19 20201-Oct-18 1 OCT 19
WBS Civil Works COST CNTG CNTG TOTAL ESC COST CNTG TOTAL Mid-Point INFLATED COST CNTG FULLNUMBER Feature & Sub-Feature Description ($K) ($K) (%) ($K) (%) ($K) ($K) ($K) Date (%) ($K) ($K) ($K)
A B C D E F G H I J P L M N O11 Contract 11: Truss Deck, Floorbeam, Major Steel, Complete Paint & Joint Replace (69)
08 Truss Span Deck Replacement $30,163 $12,970 43.0% $43,134 1.9% $30,734 $13,215 $43,949 2069Q3 332.4% $132,884 $57,140 $190,02408 Replace Abutment Spans $7,841 $3,372 43.0% $11,213 1.9% $7,989 $3,435 $11,425 2069Q3 332.4% $34,544 $14,854 $49,39808 Major Steel Truss Repairs $27,904 $11,999 43.0% $39,903 1.9% $28,432 $12,226 $40,657 2069Q3 332.4% $122,931 $52,860 $175,79108 Complete Painting of Structural Steel $17,120 $7,362 43.0% $24,482 1.9% $17,444 $7,501 $24,945 2069Q3 332.4% $75,422 $32,432 $107,85408 Joint Replacement $1,938 $833 43.0% $2,771 1.9% $1,974 $849 $2,823 2069Q3 332.4% $8,536 $3,670 $12,206
#N/A#N/A#N/A#N/A#N/A#N/A#N/A#N/A#N/A
__________ _________ ________ ____________ _________ _________ __________ _________ _________ ________________
CONSTRUCTION ESTIMATE TOTALS: $84,966 $36,535 43.0% $121,501 $86,572 $37,226 $123,798 $374,317 $160,956 $535,273
01 LANDS AND DAMAGES $0 $0 0.0% $0 0.0% $0 $0 $0 0 0.0% $0 $0 $0
30 PLANNING, ENGINEERING & DESIGN5.2% Project Management $4,442 $1,910 43.0% $6,352 3.4% $4,593 $1,975 $6,569 2068Q2 597.2% $32,027 $13,771 $45,798
Planning & Environmental Compliance INC. 43.0% 0.0% $0 $0 0 597.2% $0 $0 $0 Engineering & Design INC. 43.0% 0.0% $0 $0 0 597.2% $0 $0 $0 Reviews, ATRs, IEPRs, VE INC. 43.0% 0.0% $0 $0 0 597.2% $0 $0 $0 Life Cycle Updates (cost, schedule, risks) INC. 43.0% 0.0% $0 $0 0 597.2% $0 $0 $0 Contracting & Reprographics INC. 43.0% 0.0% $0 $0 0 597.2% $0 $0 $0 Engineering During Construction INC. 43.0% 0.0% $0 $0 0 634.1% $0 $0 $0 Planning During Construction INC. 43.0% 0.0% $0 $0 0 634.1% $0 $0 $0 Project Operations INC. 43.0% 0.0% $0 $0 0 597.2% $0 $0 $0
31 CONSTRUCTION MANAGEMENT1.4% Construction Management $1,186 $510 43.0% $1,695 3.4% $1,226 $527 $1,753 2069Q3 634.1% $9,001 $3,870 $12,871
Project Operation: INC. 43.0% 0.0% $0 $0 0 634.1% $0 $0 $0 Project Management INC. 43.0% 0.0% $0 $0 0 634.1% $0 $0 $0
CONTRACT COST TOTALS: $90,594 $38,955 $129,549 $92,392 $39,728 $132,120 $415,345 $178,598 $593,943
Bourne Bridge Rehabilitation Alternative
Civil Works Work Breakdown Structure ESTIMATED COST PROJECT FIRST COST(Constant Dollar Basis) TOTAL PROJECT COST (FULLY FUNDED)
BOURNE BRIDGE - REHABILITATION Estimate Prepared: Program Year (Budget EC):Effective Price Level: Effective Price Level Date:

**** TOTAL PROJECT COST SUMMARY **** Printed:3/2/2020 Page 1 of 10
Filename: 0_Non-CAP CCCB MRER Replacement TPCS Sep 2019_02Mar2020.xlsxTPCS-BOTH
PROJECT: DISTRICT: NAE District PREPARED: 10/2/2018PROJECT NO:P2# 450095 POC: CHIEF, COST ENGINEERING, Christopher Tilley (Acting)LOCATION: Cape Cod Canal, Massachusetts UPDATED: 2/28/2020
This Estimate reflects the scope and schedule in report; CCC Bridges Major Rehabilitation Evaluation Report September 2018
Program Year (Budget EC): 2020Effective Price Level Date: 1 OCT 19
Spent Thru:WBS Civil Works COST CNTG CNTG TOTAL ESC COST CNTG TOTAL 1-Oct-19 INFLATED COST CNTG FULL
NUMBER Feature & Sub-Feature Description ($K) ($K) (%) ($K) (%) ($K) ($K) ($K) ($K) ($K) (%) ($K) ($K) ($K) A B C D E F G H I J K L M N O
08 ROADS, RAILROADS & BRIDGES Replacem $588,108 $258,768 44.0% $846,876 0.0% $588,108 $258,768 $846,876 $0 $846,876 37.0% $805,512 $354,425 $1,159,93808 ROADS, RAILROADS & BRIDGES Approache $88,153 $38,787 44.0% $126,940 0.0% $88,153 $38,787 $126,940 $0 $126,940 37.0% $120,793 $53,149 $173,94208 ROADS, RAILROADS & BRIDGES Major Rep $12,672 $5,576 44.0% $18,248 0.0% $12,672 $5,576 $18,248 $0 $18,248 216.4% $40,100 $17,644 $57,74302 RELOCATIONS (Utilities) $39,000 $17,160 44.0% $56,160 0.0% $39,000 $17,160 $56,160 $0 $56,160 26.7% $49,399 $21,736 $71,13518 CULTURAL RESOURCE PRESERVATION (E $33,813 $14,878 44.0% $48,691 0.0% $33,813 $14,878 $48,691 $0 $48,691 37.0% $46,315 $20,379 $66,694
#N/A $0 $0 - $0 - $0 $0 $0 $0 $0 - $0 $0 $0#N/A $0 $0 - $0 - $0 $0 $0 $0 $0 - $0 $0 $0#N/A $0 $0 - $0 - $0 $0 $0 $0 $0 - $0 $0 $0#N/A $0 $0 - $0 - $0 $0 $0 $0 $0 - $0 $0 $0#N/A $0 $0 - $0 - $0 $0 $0 $0 $0 - $0 $0 $0#N/A $0 $0 - $0 - $0 $0 $0 $0 $0 - $0 $0 $0#N/A $0 $0 - $0 - $0 $0 $0 $0 $0 - $0 $0 $0#N/A $0 $0 - $0 - $0 $0 $0 $0 $0 - $0 $0 $0#N/A $0 $0 - $0 - $0 $0 $0 $0 $0 - $0 $0 $0#N/A
__________ _________ ____________ _________ _________ __________ ___________ _________ _________ ________________CONSTRUCTION ESTIMATE TOTALS: $761,746 $335,168 $1,096,915 0.0% $761,746 $335,168 $1,096,915 $0 $1,096,915 39.4% $1,062,119 $467,332 $1,529,451
01 LANDS AND DAMAGES $13,875 $1,388 10.0% $15,263 0.0% $13,875 $1,388 $15,263 $0 $15,263 10.2% $15,287 $1,529 $16,816
30 PLANNING, ENGINEERING & DESIGN $56,802 $24,993 44.0% $81,794 0.0% $56,802 $24,993 $81,794 $0 $81,794 20.7% $68,585 $30,178 $98,763
31 CONSTRUCTION MANAGEMENT $26,110 $11,489 44.0% $37,599 0.0% $26,110 $11,489 $37,599 $0 $37,599 82.1% $47,557 $20,925 $68,482
PROJECT COST TOTALS: $858,533 $373,037 43.5% $1,231,570 $858,533 $373,037 $1,231,570 $0 $1,231,570 39.1% $1,193,548 $519,964 $1,713,512
CHIEF, COST ENGINEERING, Christopher Tilley (Acting)ESTIMATED TOTAL PROJECT COST:
PROJECT MANAGER, Craig Martin
CHIEF, REAL ESTATE, Gaelen Daly
CHIEF, PLANNING, John Kennelly
CHIEF, ENGINEERING, David Margolis
CHIEF, OPERATIONS, Eric Pedersen
CHIEF, CONSTRUCTION, Sean Dolan
CHIEF, CONTRACTING, Sheila Winston-Vincuilla
CHIEF, PM-PB, Janet Harrington
CHIEF, DPM, Scott Acone
TOTAL PROJECT COST (FULLY FUNDED)
TOTAL FIRST COST
PROJECT FIRST COST (Constant Dollar Basis)
Bridge Replacement Alternative - 4 Lane Bridge with Auxiliary On/Off Lanes
Civil Works Work Breakdown Structure ESTIMATED COST
$1,713,512
BOURNE AND SAGAMORE BRIDGE - REPLACEMENT
(4 LANES WITH AUXILIARY ON/OFF LANES)

**** TOTAL PROJECT COST SUMMARY **** Printed:3/2/2020 Page 2 of 10
Filename: 0_Non-CAP CCCB MRER Replacement TPCS Sep 2019_02Mar2020.xlsxTPCS-SAGAMORE
PROJECT: DISTRICT: NAE District PREPARED: 10/2/2018PROJECT NO P2 xxxxxx POC: CHIEF, COST ENGINEERING, Christopher Tilley (Acting)LOCATION: Cape Cod Canal, Massachusetts UPDATED: 2/28/2020
This Estimate reflects the scope and schedule in report; CCC Bridges Major Rehabilitation Evaluation Report September 2018
Program Year (Budget EC): 2020Effective Price Level Date: 1 OCT 19
Spent Thru:WBS Civil Works COST CNTG CNTG TOTAL ESC COST CNTG TOTAL 1-Oct-19 INFLATED COST CNTG FULL
NUMBER Feature & Sub-Feature Description ($K) ($K) (%) ($K) (%) ($K) ($K) ($K) ($K) ($K) (%) ($K) ($K) ($K) A B C D E F G H I J K L M N O
08 ROADS, RAILROADS & BRIDGES Replacem $232,630 $102,357 44.0% $334,988 0.0% $232,630 $102,357 $334,988 $0 $334,988 24.9% $290,645 $127,884 $418,52908 ROADS, RAILROADS & BRIDGES Approache $34,603 $15,226 44.0% $49,829 0.0% $34,603 $15,226 $49,829 $0 $49,829 24.9% $43,233 $19,023 $62,25608 ROADS, RAILROADS & BRIDGES Major Rep $4,224 $1,859 44.0% $6,083 0.0% $4,224 $1,859 $6,083 $0 $6,083 139.4% $10,112 $4,449 $14,56208 ROADS, RAILROADS & BRIDGES Major Rep $4,224 $1,859 44.0% $6,083 0.0% $4,224 $1,859 $6,083 $0 $6,083 332.4% $18,264 $8,036 $26,30002 RELOCATIONS (Utilities) $20,500 $9,020 44.0% $29,520 0.0% $20,500 $9,020 $29,520 $0 $29,520 17.8% $24,142 $10,623 $34,76518 CULTURAL RESOURCE PRESERVATION (E $13,362 $5,879 44.0% $19,241 0.0% $13,362 $5,879 $19,241 $0 $19,241 24.9% $16,694 $7,345 $24,039
#N/A $0 $0 - $0 - $0 $0 $0 $0 $0 - $0 $0 $0#N/A $0 $0 - $0 - $0 $0 $0 $0 $0 - $0 $0 $0#N/A $0 $0 - $0 - $0 $0 $0 $0 $0 - $0 $0 $0#N/A $0 $0 - $0 - $0 $0 $0 $0 $0 - $0 $0 $0#N/A $0 $0 - $0 - $0 $0 $0 $0 $0 - $0 $0 $0#N/A $0 $0 - $0 - $0 $0 $0 $0 $0 - $0 $0 $0#N/A $0 $0 - $0 - $0 $0 $0 $0 $0 - $0 $0 $0#N/A $0 $0 - $0 - $0 $0 $0 $0 $0 - $0 $0 $0#N/A
__________ _________ ____________ _________ _________ __________ ___________ _________ _________ ________________CONSTRUCTION ESTIMATE TOTALS: $309,544 $136,199 $445,743 0.0% $309,544 $136,199 $445,743 $0 $445,743 30.2% $403,091 $177,360 $580,451
01 LANDS AND DAMAGES $6,925 $693 10.0% $7,618 0.0% $6,925 $693 $7,618 $0 $7,618 10.2% $7,630 $763 $8,393
30 PLANNING, ENGINEERING & DESIGN $22,586 $9,938 44.0% $32,524 0.0% $22,586 $9,938 $32,524 $0 $32,524 27.5% $28,808 $12,675 $41,483
31 CONSTRUCTION MANAGEMENT $11,119 $4,892 44.0% $16,011 0.0% $11,119 $4,892 $16,011 $0 $16,011 92.7% $21,422 $9,426 $30,847
PROJECT COST TOTALS: $350,174 $151,722 43.3% $501,895 $350,174 $151,722 $501,895 $0 $501,895 31.7% $460,950 $200,224 $661,174
CHIEF, COST ENGINEERING, Christopher Tilley (Acting)ESTIMATED TOTAL PROJECT COST:
PROJECT MANAGER, Craig Martin
CHIEF, REAL ESTATE, Gaelen Daly
CHIEF, PLANNING, John Kennelly
CHIEF, ENGINEERING, David Margolis
CHIEF, OPERATIONS, Eric Pedersen
CHIEF, CONSTRUCTION, Sean Dolan
CHIEF, CONTRACTING, Sheila Winston-Vincuilla
CHIEF, PM-PB, Janet Harrington
CHIEF, DPM, Scott Acone
Sagamore Bridge Replacement Alternative - 4 Lane Bridge with Auxiliary On/Off Lanes
Civil Works Work Breakdown Structure ESTIMATED COST PROJECT FIRST COST (Constant Dollar Basis)
TOTAL PROJECT COST (FULLY FUNDED)
SAGAMORE BRIDGE - REPLACEMENT(4 LANES WITH AUXILIARY ON/OFF LANES) TOTAL
FIRST COST
$661,174

**** TOTAL PROJECT COST SUMMARY **** Printed:3/2/2020 Page 3 of 10
Filename: 0_Non-CAP CCCB MRER Replacement TPCS Sep 2019_02Mar2020.xlsxTPCS-SAGAMORE
**** CONTRACT COST SUMMARY ****
PROJECT: DISTRICT: NAE District PREPARED: 10/2/2018LOCATION: Cape Cod Canal, Massachusetts POC: CHIEF, COST ENGINEERING, Christopher Tilley (AUPDATED: 2/28/2020This Estimate reflects the scope and schedule in report; CCC Bridges Major Rehabilitation Evaluation Report September 2018
28-Feb-20 20201-Oct-19 1 OCT 19
RISK BASED WBS Civil Works COST CNTG CNTG TOTAL ESC COST CNTG TOTAL Mid-Point INFLATED COST CNTG FULL
NUMBER Feature & Sub-Feature Description ($K) ($K) (%) ($K) (%) ($K) ($K) ($K) Date (%) ($K) ($K) ($K) A B C D E F G H I J P L M N O
01 Contract 01: Bridge Replacement (25-29)08 ROADS, RAILROADS & BRIDGES Replacem $232,630 $102,357 44.0% $334,988 0.0% $232,630 $102,357 $334,988 2027Q3 24.9% $290,645 $127,884 $418,52902 RELOCATIONS (Utilities) $20,500 $9,020 44.0% $29,520 0.0% $20,500 $9,020 $29,520 2025Q3 17.8% $24,142 $10,623 $34,76518 CULTURAL RESOURCE PRESERVATION (E $13,362 $5,879 44.0% $19,241 0.0% $13,362 $5,879 $19,241 2027Q3 24.9% $16,694 $7,345 $24,039
__________ _________ ________ ____________ _________ _________ __________ _________ _________ ________________CONSTRUCTION ESTIMATE TOTALS: $266,492 $117,257 44.0% $383,749 $266,492 $117,257 $383,749 $331,481 $145,852 $477,333
01 LANDS AND DAMAGES $6,925 $693 10.0% $7,618 0.0% $6,925 $693 $7,618 2023Q2 10.2% $7,630 $763 $8,393
30 PLANNING, ENGINEERING & DESIGN7.1% Project Management $18,973 $8,348 44.0% $27,321 0.0% $18,973 $8,348 $27,321 2023Q2 13.0% $21,441 $9,434 $30,875
Planning & Environmental Compliance INC. 44.0% 0.0% $0 $0 0 13.0% $0 $0 $0 Engineering & Design INC. 44.0% 0.0% $0 $0 0 13.0% $0 $0 $0 Reviews, ATRs, IEPRs, VE INC. 44.0% 0.0% $0 $0 0 13.0% $0 $0 $0 Life Cycle Updates (cost, schedule, risks) INC. 44.0% 0.0% $0 $0 0 13.0% $0 $0 $0 Contracting & Reprographics INC. 44.0% 0.0% $0 $0 0 13.0% $0 $0 $0 Engineering During Construction INC. 44.0% 0.0% $0 $0 0 32.6% $0 $0 $0 Planning During Construction INC. 44.0% 0.0% $0 $0 0 32.6% $0 $0 $0 Project Operations INC. 44.0% 0.0% $0 $0 0 13.0% $0 $0 $0
31 CONSTRUCTION MANAGEMENT2.5% Construction Management $6,662 $2,931 44.0% $9,594 0.0% $6,662 $2,931 $9,594 2027Q3 32.6% $8,834 $3,887 $12,721
Project Operation: INC. 44.0% 0.0% $0 $0 0 32.6% $0 $0 $0 Project Management INC. 44.0% 0.0% $0 $0 0 32.6% $0 $0 $0
CONTRACT COST TOTALS: $299,052 $129,229 $428,281 $299,052 $129,229 $428,281 $369,386 $159,936 $529,321
TOTAL PROJECT COST (FULLY FUNDED)
SAGAMORE BRIDGE - REPLACEMENT(4 LANES WITH AUXILIARY ON/OFF LANES)
Estimate Prepared: Program Year (Budget EC):Effective Price Level: Effective Price Level Date:
Sagamore Bridge Replacement Alternative - 4 Lane Bridge with Auxiliary On/Off Lanes
Civil Works Work Breakdown Structure ESTIMATED COST PROJECT FIRST COST(Constant Dollar Basis)

**** TOTAL PROJECT COST SUMMARY **** Printed:3/2/2020 Page 4 of 10
Filename: 0_Non-CAP CCCB MRER Replacement TPCS Sep 2019_02Mar2020.xlsxTPCS-SAGAMORE
**** CONTRACT COST SUMMARY ****
PROJECT: DISTRICT: NAE District PREPARED: 10/2/2018LOCATION: Cape Cod Canal, Massachusetts POC: CHIEF, COST ENGINEERING, Christopher Tilley (AUPDATED: 2/28/2020This Estimate reflects the scope and schedule in report; CCC Bridges Major Rehabilitation Evaluation Report September 2018
28-Feb-20 20201-Oct-19 1 OCT 19
WBS Civil Works COST CNTG CNTG TOTAL ESC COST CNTG TOTAL Mid-Point INFLATED COST CNTG FULLNUMBER Feature & Sub-Feature Description ($K) ($K) (%) ($K) (%) ($K) ($K) ($K) Date (%) ($K) ($K) ($K)
A B C D E F G H I J P L M N O01 Contract 01: Bridge Approaches (25-29, State Funded)
#N/A08 ROADS, RAILROADS & BRIDGES Approache $34,603 $15,226 44.0% $49,829 0.0% $34,603 $15,226 $49,829 2027Q3 24.9% $43,233 $19,023 $62,256
#N/A#N/A#N/A#N/A#N/A#N/A#N/A#N/A#N/A#N/A#N/A#N/A
__________ _________ ________ ____________ _________ _________ __________ _________ _________ ________________
CONSTRUCTION ESTIMATE TOTALS: $34,603 $15,226 44.0% $49,829 $34,603 $15,226 $49,829 $43,233 $19,023 $62,256
01 LANDS AND DAMAGES $0 $0 0.0% $0 0.0% $0 $0 $0 0 0.0% $0 $0 $0
30 PLANNING, ENGINEERING & DESIGN8.0% Project Management $2,768 $1,218 44.0% $3,986 0.0% $2,768 $1,218 $3,986 2023Q2 13.0% $3,128 $1,376 $4,505
Planning & Environmental Compliance INC. 44.0% 0.0% $0 $0 0 13.0% $0 $0 $0 Engineering & Design INC. 44.0% 0.0% $0 $0 0 13.0% $0 $0 $0 Reviews, ATRs, IEPRs, VE INC. 44.0% 0.0% $0 $0 0 13.0% $0 $0 $0 Life Cycle Updates (cost, schedule, risks) INC. 44.0% 0.0% $0 $0 0 13.0% $0 $0 $0 Contracting & Reprographics INC. 44.0% 0.0% $0 $0 0 13.0% $0 $0 $0 Engineering During Construction INC. 44.0% 0.0% $0 $0 0 32.6% $0 $0 $0 Planning During Construction INC. 44.0% 0.0% $0 $0 0 32.6% $0 $0 $0 Project Operations INC. 44.0% 0.0% $0 $0 0 13.0% $0 $0 $0
31 CONSTRUCTION MANAGEMENT8.0% Construction Management $2,768 $1,218 44.0% $3,986 0.0% $2,768 $1,218 $3,986 2027Q3 32.6% $3,671 $1,615 $5,286
Project Operation: INC. 44.0% 0.0% $0 $0 0 32.6% $0 $0 $0 Project Management INC. 44.0% 0.0% $0 $0 0 32.6% $0 $0 $0
CONTRACT COST TOTALS: $40,140 $17,662 $57,802 $40,140 $17,662 $57,802 $50,032 $22,014 $72,046
TOTAL PROJECT COST (FULLY FUNDED)
SAGAMORE BRIDGE - REPLACEMENT(4 LANES WITH AUXILIARY ON/OFF LANES) Estimate Prepared: Program Year (Budget EC):
Effective Price Level: Effective Price Level Date:
Sagamore Bridge Replacement Alternative - 4 Lane Bridge with Auxiliary On/Off Lanes
Civil Works Work Breakdown Structure ESTIMATED COST PROJECT FIRST COST(Constant Dollar Basis)

**** TOTAL PROJECT COST SUMMARY **** Printed:3/2/2020 Page 5 of 10
Filename: 0_Non-CAP CCCB MRER Replacement TPCS Sep 2019_02Mar2020.xlsxTPCS-SAGAMORE
**** CONTRACT COST SUMMARY ****
PROJECT: DISTRICT: NAE District PREPARED: 10/2/2018LOCATION: Cape Cod Canal, Massachusetts POC: CHIEF, COST ENGINEERING, Christopher Tilley (AUPDATED: 2/28/2020This Estimate reflects the scope and schedule in report; CCC Bridges Major Rehabilitation Evaluation Report September 2018
28-Feb-20 20201-Oct-19 1 OCT 19
WBS Civil Works COST CNTG CNTG TOTAL ESC COST CNTG TOTAL Mid-Point INFLATED COST CNTG FULLNUMBER Feature & Sub-Feature Description ($K) ($K) (%) ($K) (%) ($K) ($K) ($K) Date (%) ($K) ($K) ($K)
A B C D E F G H I J P L M N O02 Contract 02: Major Repairs (49)
#N/A#N/A
08 ROADS, RAILROADS & BRIDGES Major Rep $4,224 $1,859 44.0% $6,083 0.0% $4,224 $1,859 $6,083 2049Q3 139.4% $10,112 $4,449 $14,562#N/A#N/A#N/A#N/A#N/A#N/A#N/A#N/A#N/A#N/A#N/A
__________ _________ ________ ____________ _________ _________ __________ _________ _________ ________________
CONSTRUCTION ESTIMATE TOTALS: $4,224 $1,859 44.0% $6,083 $4,224 $1,859 $6,083 $10,112 $4,449 $14,562
01 LANDS AND DAMAGES $0 $0 0.0% $0 0.0% $0 $0 $0 0 0.0% $0 $0 $0
30 PLANNING, ENGINEERING & DESIGN10.0% Project Management $422 $186 44.0% $608 0.0% $422 $186 $608 2048Q2 206.2% $1,293 $569 $1,863
Planning & Environmental Compliance INC. 44.0% 0.0% $0 $0 0 206.2% $0 $0 $0 Engineering & Design INC. 44.0% 0.0% $0 $0 0 206.2% $0 $0 $0 Reviews, ATRs, IEPRs, VE INC. 44.0% 0.0% $0 $0 0 206.2% $0 $0 $0 Life Cycle Updates (cost, schedule, risks) INC. 44.0% 0.0% $0 $0 0 206.2% $0 $0 $0 Contracting & Reprographics INC. 44.0% 0.0% $0 $0 0 206.2% $0 $0 $0 Engineering During Construction INC. 44.0% 0.0% $0 $0 0 222.4% $0 $0 $0 Planning During Construction INC. 44.0% 0.0% $0 $0 0 222.4% $0 $0 $0 Project Operations INC. 44.0% 0.0% $0 $0 0 206.2% $0 $0 $0
31 CONSTRUCTION MANAGEMENT20.0% Construction Management $844 $371 44.0% $1,215 0.0% $844 $371 $1,215 2049Q3 222.4% $2,721 $1,197 $3,919
Project Operation: INC. 44.0% 0.0% $0 $0 0 222.4% $0 $0 $0 Project Management INC. 44.0% 0.0% $0 $0 0 222.4% $0 $0 $0
CONTRACT COST TOTALS: $5,491 $2,416 $7,906 $5,491 $2,416 $7,906 $14,127 $6,216 $20,343
TOTAL PROJECT COST (FULLY FUNDED)
SAGAMORE BRIDGE - REPLACEMENT(4 LANES WITH AUXILIARY ON/OFF LANES)
Estimate Prepared: Program Year (Budget EC):Effective Price Level: Effective Price Level Date:
Sagamore Bridge Replacement Alternative - 4 Lane Bridge with Auxiliary On/Off Lanes
Civil Works Work Breakdown Structure ESTIMATED COST PROJECT FIRST COST(Constant Dollar Basis)

**** TOTAL PROJECT COST SUMMARY **** Printed:3/2/2020 Page 6 of 10
Filename: 0_Non-CAP CCCB MRER Replacement TPCS Sep 2019_02Mar2020.xlsxTPCS-SAGAMORE
**** CONTRACT COST SUMMARY ****
PROJECT: Sagamore Bridge Replacement Alternative - 4 Lane Bridge with Auxiliary On/Off Lanes DISTRICT: NAE District PREPARED: 10/2/2018LOCATION: Cape Cod Canal, Massachusetts POC: CHIEF, COST ENGINEERING, Christopher Tilley (AUPDATED: 2/28/2020This Estimate reflects the scope and schedule in report; CCC Bridges Major Rehabilitation Evaluation Report September 2018
28-Feb-20 Program Year (Budget EC): 20201-Oct-19 Effective Price Level Date: 1 OCT 19 FULLY FUNDED PROJECT ESTIMATE
WBS Civil Works COST CNTG CNTG TOTAL ESC COST CNTG TOTAL Mid-Point INFLATED COST CNTG FULLNUMBER Feature & Sub-Feature Description ($K) ($K) (%) ($K) (%) ($K) ($K) ($K) Date (%) ($K) ($K) ($K)
A B C D E F G H I J P L M N O03 Contract 03: Major Repairs (69)
#N/A#N/A#N/A
08 ROADS, RAILROADS & BRIDGES Major Rep $4,224 $1,859 44.0% $6,083 0.0% $4,224 $1,859 $6,083 2069Q3 332.4% $18,264 $8,036 $26,300#N/A#N/A#N/A#N/A#N/A#N/A#N/A#N/A#N/A#N/A
__________ _________ ________ ____________ _________ _________ __________ _________ _________ ________________
CONSTRUCTION ESTIMATE TOTALS: $4,224 $1,859 44.0% $6,083 $4,224 $1,859 $6,083 $18,264 $8,036 $26,300
01 LANDS AND DAMAGES $0 $0 0.0% $0 0.0% $0 $0 $0 0 0.0% $0 $0 $0
30 PLANNING, ENGINEERING & DESIGN10.0% Project Management $422 $186 44.0% $608 0.0% $422 $186 $608 2068Q2 597.2% $2,945 $1,296 $4,241
Planning & Environmental Compliance INC. 44.0% 0.0% $0 $0 0 597.2% $0 $0 $0 Engineering & Design INC. 44.0% 0.0% $0 $0 0 597.2% $0 $0 $0 Reviews, ATRs, IEPRs, VE INC. 44.0% 0.0% $0 $0 0 597.2% $0 $0 $0 Life Cycle Updates (cost, schedule, risks) INC. 44.0% 0.0% $0 $0 0 597.2% $0 $0 $0 Contracting & Reprographics INC. 44.0% 0.0% $0 $0 0 597.2% $0 $0 $0 Engineering During Construction INC. 44.0% 0.0% $0 $0 0 634.1% $0 $0 $0 Planning During Construction INC. 44.0% 0.0% $0 $0 0 634.1% $0 $0 $0 Project Operations INC. 44.0% 0.0% $0 $0 0 597.2% $0 $0 $0
31 CONSTRUCTION MANAGEMENT20.0% Construction Management $844 $371 44.0% $1,215 0.0% $844 $371 $1,215 2069Q3 634.1% $6,196 $2,726 $8,922
Project Operation: INC. 44.0% 0.0% $0 $0 0 634.1% $0 $0 $0 Project Management INC. 44.0% 0.0% $0 $0 0 634.1% $0 $0 $0
CONTRACT COST TOTALS: $5,491 $2,416 $7,906 $5,491 $2,416 $7,906 $27,405 $12,058 $39,464
SAGAMORE BRIDGE - REPLACEMENT(4 LANES WITH AUXILIARY ON/OFF LANES)
Estimate Prepared:Effective Price Level:
Civil Works Work Breakdown Structure ESTIMATED COST PROJECT FIRST COST(Constant Dollar Basis) TOTAL PROJECT COST (FULLY FUNDED)

**** TOTAL PROJECT COST SUMMARY **** Printed:3/2/2020 Page 7 of 10
Filename: 0_Non-CAP CCCB MRER Replacement TPCS Sep 2019_02Mar2020.xlsxTPCS-BOURNE
PROJECT: DISTRICT: NAE District PREPARED: 10/2/2018PROJECT NO P2 xxxxxx POC: CHIEF, COST ENGINEERING, Christopher Tilley (Acting)LOCATION: Cape Cod Canal, Massachusetts UPDATED: 2/28/2020
This Estimate reflects the scope and schedule in report; CCC Bridges Major Rehabilitation Evaluation Report September 2018
Program Year (Budget EC): 2020Effective Price Level Date: 1 OCT 19
Spent Thru:WBS Civil Works COST CNTG CNTG TOTAL ESC COST CNTG TOTAL 1-Oct-19 INFLATED COST CNTG FULL
NUMBER Feature & Sub-Feature Description ($K) ($K) (%) ($K) (%) ($K) ($K) ($K) ($K) ($K) (%) ($K) ($K) ($K) A B C D E F G H I J K L M N O
08 ROADS, RAILROADS & BRIDGES Replacem $355,478 $156,410 44.0% $511,888 0.0% $355,478 $156,410 $511,888 $0 $511,888 44.8% $514,867 $226,541 $741,40808 ROADS, RAILROADS & BRIDGES Approache $53,549 $23,562 44.0% $77,111 0.0% $53,549 $23,562 $77,111 $0 $77,111 44.8% $77,560 $34,126 $111,68608 ROADS, RAILROADS & BRIDGES Major Rep $4,224 $1,859 44.0% $6,083 0.0% $4,224 $1,859 $6,083 $0 $6,083 177.5% $11,723 $5,158 $16,88102 RELOCATIONS (Utilities) $18,500 $8,140 44.0% $26,640 0.0% $18,500 $8,140 $26,640 $0 $26,640 36.5% $25,257 $11,113 $36,37018 CULTURAL RESOURCE PRESERVATION (E $20,451 $8,999 44.0% $29,450 0.0% $20,451 $8,999 $29,450 $0 $29,450 44.8% $29,621 $13,033 $42,655
#N/A $0 $0 - $0 - $0 $0 $0 $0 $0 - $0 $0 $0#N/A $0 $0 - $0 - $0 $0 $0 $0 $0 - $0 $0 $0#N/A $0 $0 - $0 - $0 $0 $0 $0 $0 - $0 $0 $0#N/A $0 $0 - $0 - $0 $0 $0 $0 $0 - $0 $0 $0#N/A $0 $0 - $0 - $0 $0 $0 $0 $0 - $0 $0 $0#N/A $0 $0 - $0 - $0 $0 $0 $0 $0 - $0 $0 $0#N/A $0 $0 - $0 - $0 $0 $0 $0 $0 - $0 $0 $0#N/A $0 $0 - $0 - $0 $0 $0 $0 $0 - $0 $0 $0#N/A $0 $0 - $0 - $0 $0 $0 $0 $0 - $0 $0 $0#N/A
__________ _________ ____________ _________ _________ __________ ___________ _________ _________ ________________CONSTRUCTION ESTIMATE TOTALS: $452,202 $198,969 $651,172 0.0% $452,202 $198,969 $651,172 $0 $651,172 45.7% $659,028 $289,972 $949,000
01 LANDS AND DAMAGES $6,950 $695 10.0% $7,645 0.0% $6,950 $695 $7,645 $0 $7,645 10.2% $7,657 $766 $8,423
30 PLANNING, ENGINEERING & DESIGN $34,216 $15,055 44.0% $49,270 0.0% $34,216 $15,055 $49,270 $0 $49,270 16.3% $39,777 $17,502 $57,280
31 CONSTRUCTION MANAGEMENT $14,992 $6,596 44.0% $21,588 0.0% $14,992 $6,596 $21,588 $0 $21,588 74.3% $26,135 $11,499 $37,634
PROJECT COST TOTALS: $508,360 $221,315 43.5% $729,675 $508,360 $221,315 $729,675 $0 $729,675 44.2% $732,598 $319,740 $1,052,337
CHIEF, COST ENGINEERING, Christopher Tilley (Acting)ESTIMATED TOTAL PROJECT COST:
PROJECT MANAGER, Craig Martin
CHIEF, REAL ESTATE, Gaelen Daly
CHIEF, PLANNING, John Kennelly
CHIEF, ENGINEERING, David Margolis
CHIEF, OPERATIONS, Eric Pedersen
CHIEF, CONSTRUCTION, Sean Dolan
CHIEF, CONTRACTING, Sheila Winston-Vincuilla
CHIEF, PM-PB, Janet Harrington
CHIEF, DPM, Scott Acone
Bourne Bridge Replacement Alternative - 4 Lane Bridge with Auxiliary On/Off Lanes
Civil Works Work Breakdown Structure ESTIMATED COST PROJECT FIRST COST (Constant Dollar Basis)
TOTAL PROJECT COST (FULLY FUNDED)
BOURNE BRIDGE - REPLACEMENT(4 LANES WITH AUXILIARY ON/OFF LANES) TOTAL
FIRST COST
$1,052,337

**** TOTAL PROJECT COST SUMMARY **** Printed:3/2/2020 Page 8 of 10
Filename: 0_Non-CAP CCCB MRER Replacement TPCS Sep 2019_02Mar2020.xlsxTPCS-BOURNE
**** CONTRACT COST SUMMARY ****
PROJECT: DISTRICT: NAE District PREPARED: 10/2/2018LOCATION: Cape Cod Canal, Massachusetts POC: CHIEF, COST ENGINEERING, Christopher Tilley (AUPDATED: 2/28/2020This Estimate reflects the scope and schedule in report; CCC Bridges Major Rehabilitation Evaluation Report September 2018
28-Feb-20 20201-Oct-19 1 OCT 19
RISK BASED WBS Civil Works COST CNTG CNTG TOTAL ESC COST CNTG TOTAL Mid-Point INFLATED COST CNTG FULL
NUMBER Feature & Sub-Feature Description ($K) ($K) (%) ($K) (%) ($K) ($K) ($K) Date (%) ($K) ($K) ($K) A B C D E F G H I J P L M N O
01 Contract 01: Bridge Replacement (30-34)08 ROADS, RAILROADS & BRIDGES Replacem $355,478 $156,410 44.0% $511,888 0.0% $355,478 $156,410 $511,888 2032Q3 44.8% $514,867 $226,541 $741,40802 RELOCATIONS (Utilities) $18,500 $8,140 44.0% $26,640 0.0% $18,500 $8,140 $26,640 2030Q3 36.5% $25,257 $11,113 $36,37018 CULTURAL RESOURCE PRESERVATION (E $20,451 $8,999 44.0% $29,450 0.0% $20,451 $8,999 $29,450 2032Q3 44.8% $29,621 $13,033 $42,655
__________ _________ ________ ____________ _________ _________ __________ _________ _________ ________________CONSTRUCTION ESTIMATE TOTALS: $394,429 $173,549 44.0% $567,978 $394,429 $173,549 $567,978 $569,745 $250,688 $820,433
01 LANDS AND DAMAGES $6,950 $695 10.0% $7,645 0.0% $6,950 $695 $7,645 2023Q2 10.2% $7,657 $766 $8,423
30 PLANNING, ENGINEERING & DESIGN7.2% Project Management $28,438 $12,513 44.0% $40,951 0.0% $28,438 $12,513 $40,951 2023Q2 13.0% $32,137 $14,140 $46,277
Planning & Environmental Compliance INC. 44.0% 0.0% $0 $0 0 13.0% $0 $0 $0 Engineering & Design INC. 44.0% 0.0% $0 $0 0 13.0% $0 $0 $0 Reviews, ATRs, IEPRs, VE INC. 44.0% 0.0% $0 $0 0 13.0% $0 $0 $0 Life Cycle Updates (cost, schedule, risks) INC. 44.0% 0.0% $0 $0 0 13.0% $0 $0 $0 Contracting & Reprographics INC. 44.0% 0.0% $0 $0 0 13.0% $0 $0 $0 Engineering During Construction INC. 44.0% 0.0% $0 $0 0 61.1% $0 $0 $0 Planning During Construction INC. 44.0% 0.0% $0 $0 0 61.1% $0 $0 $0 Project Operations INC. 44.0% 0.0% $0 $0 0 13.0% $0 $0 $0
31 CONSTRUCTION MANAGEMENT2.5% Construction Management $9,861 $4,339 44.0% $14,199 0.0% $9,861 $4,339 $14,199 2032Q3 61.1% $15,881 $6,988 $22,868
Project Operation: INC. 44.0% 0.0% $0 $0 0 61.1% $0 $0 $0 Project Management INC. 44.0% 0.0% $0 $0 0 61.1% $0 $0 $0
CONTRACT COST TOTALS: $439,678 $191,095 $630,773 $439,678 $191,095 $630,773 $625,421 $272,582 $898,002
TOTAL PROJECT COST (FULLY FUNDED)
BOURNE BRIDGE - REPLACEMENT(4 LANES WITH AUXILIARY ON/OFF LANES)
Estimate Prepared: Program Year (Budget EC):Effective Price Level: Effective Price Level Date:
Civil Works Work Breakdown Structure ESTIMATED COST PROJECT FIRST COST(Constant Dollar Basis)
Bourne Bridge Replacement Alternative - 4 Lane Bridge with Auxiliary On/Off Lanes

**** TOTAL PROJECT COST SUMMARY **** Printed:3/2/2020 Page 9 of 10
Filename: 0_Non-CAP CCCB MRER Replacement TPCS Sep 2019_02Mar2020.xlsxTPCS-BOURNE
**** CONTRACT COST SUMMARY ****
PROJECT: DISTRICT: NAE District PREPARED: 10/2/2018LOCATION: Cape Cod Canal, Massachusetts POC: CHIEF, COST ENGINEERING, Christopher Tilley (AUPDATED: 2/28/2020This Estimate reflects the scope and schedule in report; CCC Bridges Major Rehabilitation Evaluation Report September 2018
28-Feb-20 20201-Oct-19 1 OCT 19
WBS Civil Works COST CNTG CNTG TOTAL ESC COST CNTG TOTAL Mid-Point INFLATED COST CNTG FULLNUMBER Feature & Sub-Feature Description ($K) ($K) (%) ($K) (%) ($K) ($K) ($K) Date (%) ($K) ($K) ($K)
A B C D E F G H I J P L M N O01 Contract 01: Bridge Approaches (30-34, State Funded)
#N/A08 ROADS, RAILROADS & BRIDGES Approache $53,549 $23,562 44.0% $77,111 0.0% $53,549 $23,562 $77,111 2032Q3 44.8% $77,560 $34,126 $111,686
#N/A#N/A#N/A#N/A#N/A#N/A#N/A#N/A#N/A#N/A#N/A#N/A
__________ _________ ________ ____________ _________ _________ __________ _________ _________ ________________
CONSTRUCTION ESTIMATE TOTALS: $53,549 $23,562 44.0% $77,111 $53,549 $23,562 $77,111 $77,560 $34,126 $111,686
01 LANDS AND DAMAGES $0 $0 0.0% $0 0.0% $0 $0 $0 0 0.0% $0 $0 $0
30 PLANNING, ENGINEERING & DESIGN10.0% Project Management $5,355 $2,356 44.0% $7,711 0.0% $5,355 $2,356 $7,711 2023Q2 13.0% $6,051 $2,663 $8,714
Planning & Environmental Compliance INC. 44.0% 0.0% $0 $0 0 13.0% $0 $0 $0 Engineering & Design INC. 44.0% 0.0% $0 $0 0 13.0% $0 $0 $0 Reviews, ATRs, IEPRs, VE INC. 44.0% 0.0% $0 $0 0 13.0% $0 $0 $0 Life Cycle Updates (cost, schedule, risks) INC. 44.0% 0.0% $0 $0 0 13.0% $0 $0 $0 Contracting & Reprographics INC. 44.0% 0.0% $0 $0 0 13.0% $0 $0 $0 Engineering During Construction INC. 44.0% 0.0% $0 $0 0 61.1% $0 $0 $0 Planning During Construction INC. 44.0% 0.0% $0 $0 0 61.1% $0 $0 $0 Project Operations INC. 44.0% 0.0% $0 $0 0 13.0% $0 $0 $0
31 CONSTRUCTION MANAGEMENT8.0% Construction Management $4,284 $1,885 44.0% $6,169 0.0% $4,284 $1,885 $6,169 2032Q3 61.1% $6,899 $3,036 $9,935
Project Operation: INC. 44.0% 0.0% $0 $0 0 61.1% $0 $0 $0 Project Management INC. 44.0% 0.0% $0 $0 0 61.1% $0 $0 $0
CONTRACT COST TOTALS: $63,188 $27,803 $90,991 $63,188 $27,803 $90,991 $90,510 $39,825 $130,335
TOTAL PROJECT COST (FULLY FUNDED)
BOURNE BRIDGE - REPLACEMENT(4 LANES WITH AUXILIARY ON/OFF LANES) Estimate Prepared: Program Year (Budget EC):
Effective Price Level: Effective Price Level Date:
Bourne Bridge Replacement Alternative - 4 Lane Bridge with Auxiliary On/Off Lanes
Civil Works Work Breakdown Structure ESTIMATED COST PROJECT FIRST COST(Constant Dollar Basis)
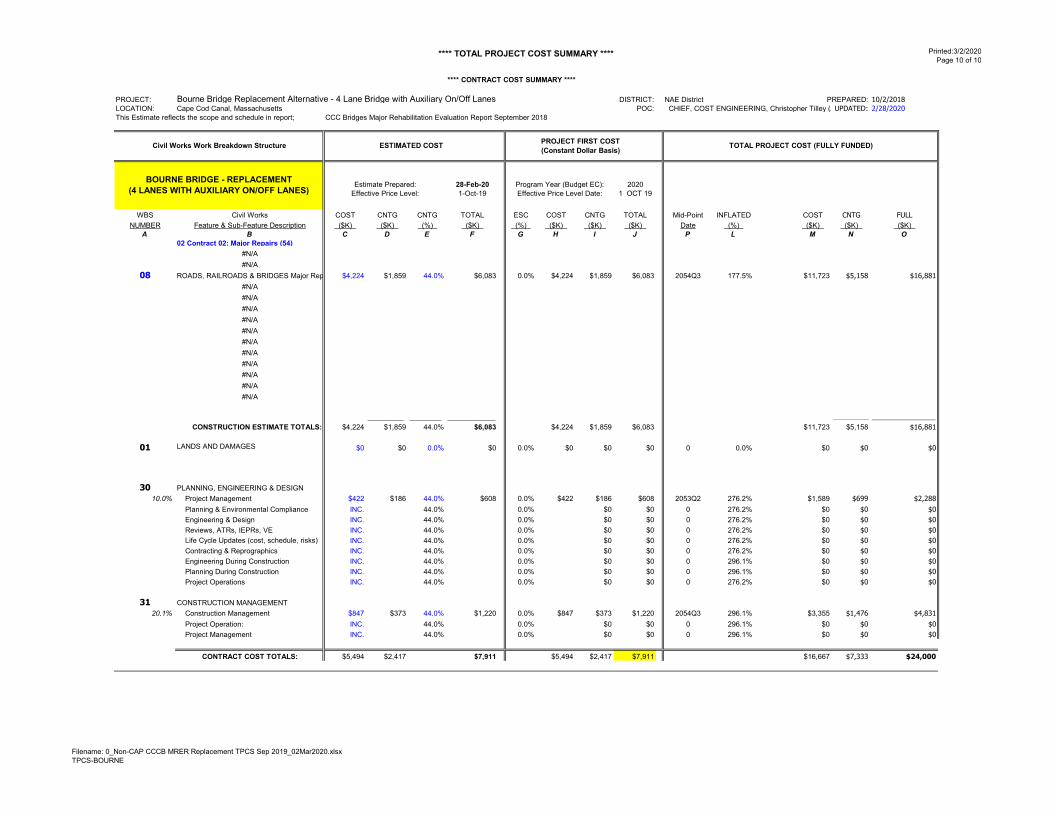
**** TOTAL PROJECT COST SUMMARY **** Printed:3/2/2020 Page 10 of 10
Filename: 0_Non-CAP CCCB MRER Replacement TPCS Sep 2019_02Mar2020.xlsxTPCS-BOURNE
**** CONTRACT COST SUMMARY ****
PROJECT: DISTRICT: NAE District PREPARED: 10/2/2018LOCATION: Cape Cod Canal, Massachusetts POC: CHIEF, COST ENGINEERING, Christopher Tilley (AUPDATED: 2/28/2020This Estimate reflects the scope and schedule in report; CCC Bridges Major Rehabilitation Evaluation Report September 2018
28-Feb-20 20201-Oct-19 1 OCT 19
WBS Civil Works COST CNTG CNTG TOTAL ESC COST CNTG TOTAL Mid-Point INFLATED COST CNTG FULLNUMBER Feature & Sub-Feature Description ($K) ($K) (%) ($K) (%) ($K) ($K) ($K) Date (%) ($K) ($K) ($K)
A B C D E F G H I J P L M N O02 Contract 02: Major Repairs (54)
#N/A#N/A
08 ROADS, RAILROADS & BRIDGES Major Rep $4,224 $1,859 44.0% $6,083 0.0% $4,224 $1,859 $6,083 2054Q3 177.5% $11,723 $5,158 $16,881#N/A#N/A#N/A#N/A#N/A#N/A#N/A#N/A#N/A#N/A#N/A
__________ _________ ________ ____________ _________ _________ __________ _________ _________ ________________
CONSTRUCTION ESTIMATE TOTALS: $4,224 $1,859 44.0% $6,083 $4,224 $1,859 $6,083 $11,723 $5,158 $16,881
01 LANDS AND DAMAGES $0 $0 0.0% $0 0.0% $0 $0 $0 0 0.0% $0 $0 $0
30 PLANNING, ENGINEERING & DESIGN10.0% Project Management $422 $186 44.0% $608 0.0% $422 $186 $608 2053Q2 276.2% $1,589 $699 $2,288
Planning & Environmental Compliance INC. 44.0% 0.0% $0 $0 0 276.2% $0 $0 $0 Engineering & Design INC. 44.0% 0.0% $0 $0 0 276.2% $0 $0 $0 Reviews, ATRs, IEPRs, VE INC. 44.0% 0.0% $0 $0 0 276.2% $0 $0 $0 Life Cycle Updates (cost, schedule, risks) INC. 44.0% 0.0% $0 $0 0 276.2% $0 $0 $0 Contracting & Reprographics INC. 44.0% 0.0% $0 $0 0 276.2% $0 $0 $0 Engineering During Construction INC. 44.0% 0.0% $0 $0 0 296.1% $0 $0 $0 Planning During Construction INC. 44.0% 0.0% $0 $0 0 296.1% $0 $0 $0 Project Operations INC. 44.0% 0.0% $0 $0 0 276.2% $0 $0 $0
31 CONSTRUCTION MANAGEMENT20.1% Construction Management $847 $373 44.0% $1,220 0.0% $847 $373 $1,220 2054Q3 296.1% $3,355 $1,476 $4,831
Project Operation: INC. 44.0% 0.0% $0 $0 0 296.1% $0 $0 $0 Project Management INC. 44.0% 0.0% $0 $0 0 296.1% $0 $0 $0
CONTRACT COST TOTALS: $5,494 $2,417 $7,911 $5,494 $2,417 $7,911 $16,667 $7,333 $24,000
TOTAL PROJECT COST (FULLY FUNDED)
BOURNE BRIDGE - REPLACEMENT(4 LANES WITH AUXILIARY ON/OFF LANES)
Estimate Prepared: Program Year (Budget EC):Effective Price Level: Effective Price Level Date:
Bourne Bridge Replacement Alternative - 4 Lane Bridge with Auxiliary On/Off Lanes
Civil Works Work Breakdown Structure ESTIMATED COST PROJECT FIRST COST(Constant Dollar Basis)

US Army Corps Of Engineers ®
CAPE COD CANAL HIGHWAY BRIDGES
BOURNE, MASSACHUSETTS
MAJOR REHABILITATION EVALUATION REPORT
APPENDIX D ECONOMICS

This Page Intentionally Left Blank

Cape Cod Canal Highway Bridges, MA Final Appendix D - Economics Major Rehabilitation Evaluation Report D-i March 2020
TABLE OF CONTENTS
1 CONTENTS
2 Executive Summary ................................................................................................................. 1 Methodology .................................................................................................................... 1 Cost Comparison .............................................................................................................. 2 Conclusion ........................................................................................................................ 6
3 INTRODUCTION ................................................................................................................... 7
Geographic Scope ............................................................................................................ 8 Federal Interest ................................................................................................................. 8
Purpose ...................................................................................................................... 8
Need .......................................................................................................................... 9 Cost-Benefit Analysis Framework ................................................................................... 9
Methodology ........................................................................................................... 10
Alternatives Considered .......................................................................................... 11
Discounting ............................................................................................................. 14
Time Period ............................................................................................................. 14
Value of Time ......................................................................................................... 15
4 BASE CONDITION (ALTERNATIVE A) .......................................................................... 15
Existing Condition.......................................................................................................... 15 Future Without-Project Condition .................................................................................. 17
Probability of Unsatisfactory Performance ............................................................. 17
Probabilistic Scenario Analysis .............................................................................. 20
Sagamore Bridge – Bridge Deck Deterioration ...................................................... 21 Sagamore Bridge – Substructure Deterioration ...................................................... 22
Sagamore Bridge – Superstructure Deterioration ................................................... 24 Bourne Bridge Deck Deterioration ......................................................................... 27
Bourne Bridge – Substructure Deterioration .......................................................... 27
Bourne Bridge – Superstructure Deterioration ....................................................... 30
Traffic Analysis .............................................................................................................. 32 Traffic Data Collection ........................................................................................... 32
Conditions with No Traffic Impediments ............................................................... 34

Cape Cod Canal Highway Bridges, MA Final Appendix D - Economics Major Rehabilitation Evaluation Report D-ii March 2020
Value of Time with Traffic Impediments ............................................................... 35
Vehicle Operational Costs ...................................................................................... 41 Impacts to Navigation .................................................................................................... 41
Vessel Trips ............................................................................................................ 42
Commodity Statistics .............................................................................................. 43 Origin/Destinations ................................................................................................. 45
Methods................................................................................................................... 45 Annual Navigation Benefits of the Canal ............................................................... 46
Navigation Impacts of Temporary Canal Closure .................................................. 48 Annual Maintenance Costs ............................................................................................. 48 Results of Monte Carlo Simulation ................................................................................ 49 Summary of Future Without Project Condition ............................................................. 50
5 ALTERNATIVE B – MAJOR REHABILITATION ............................................................ 50
Benefits ........................................................................................................................... 50 Probability of Unsatisfactory Performance ............................................................. 50
Probabilistic Scenario Analysis .............................................................................. 54
Results of Monte Carlo Simulation......................................................................... 54
Cost................................................................................................................................. 59 Construction Costs .................................................................................................. 59
Value of Time ......................................................................................................... 60 Total Annualized Cost ............................................................................................ 62
Major Rehabilitation – Analysis Results ........................................................................ 63 Results – Sagamore Bridge ..................................................................................... 63
Summary of Major Rehabilitation Project ..................................................................... 67 6 ALTERNATIVE C – REPLACEMENT WITH 4 LANES (2 each direction) ..................... 67
Benefits ........................................................................................................................... 67 Probability of Unsatisfactory Performance ............................................................. 67 Probabilistic Scenario Analysis .............................................................................. 71
Results of Monte Carlo Simulation......................................................................... 75 Cost of Alternative ......................................................................................................... 76
Engineering Costs ................................................................................................... 76 Value of Time ......................................................................................................... 76

Cape Cod Canal Highway Bridges, MA Final Appendix D - Economics Major Rehabilitation Evaluation Report D-iii March 2020
Total Annualized Cost ............................................................................................ 77
Four Lane Replacement Bridge – Analysis Results ....................................................... 78 Benefit Cost Ratio (BCR) ....................................................................................... 78
Summary of New Bridges Project .................................................................................. 81 7 ALTERNATIVE D – REPLACEMENT WITH 4 LANES AND 2 AUXILIARY ON/OFF LANES .......................................................................................................................................... 82
Benefits ........................................................................................................................... 82 Probability of Unsatisfactory Performance ............................................................. 82 Probabilistic Scenario Analysis .............................................................................. 82
Results of Monte Carlo Simulation......................................................................... 82 Cost of Alternative ......................................................................................................... 84
Engineering Costs ................................................................................................... 84
Value of Time ......................................................................................................... 85
Total Annualized Cost ............................................................................................ 86
Bridge Replacement with Acceleration Lanes – Analysis Results ................................ 86 Benefit Cost Ratio (BCR) ....................................................................................... 87
Summary of New Bridges Project .................................................................................. 89 8 Extended Life Value .............................................................................................................. 90
9 2020 Model Updates .............................................................................................................. 90 Elimination of Alternative C .......................................................................................... 91 Update to Discount Rate ................................................................................................ 91 Update to Annual O&M Costs ....................................................................................... 91 Update to Project Costs .................................................................................................. 92 8.5 Alternative A Model Results .................................................................................... 93 Alternative B Model Results .......................................................................................... 94 Alternative D Model Results .......................................................................................... 96
10 SUMMARY OF RESULTS .............................................................................................. 98
Tables and Charts ........................................................................................................... 98 Rank of Alternatives ....................................................................................................... 99 Conclusion ...................................................................................................................... 99
11 APPENDIX ........................................................................................................................ 99
Assumptions ................................................................................................................... 99 Sensitivity Analysis ...................................................................................................... 101

Cape Cod Canal Highway Bridges, MA Final Appendix D - Economics Major Rehabilitation Evaluation Report D-iv March 2020
Sensitivity Analysis on the Hazard Functions ...................................................... 102
Sensitivity Analysis on the Event Tree Probabilities ............................................ 103 Sensitivity Analysis on Project Start Year ............................................................ 105
Sensitivity Analysis on the Value of Time ........................................................... 105 Sensitivity Analysis on Concurrent Replacement Bridge Construction ............... 106
Sensitivity Analysis on Weight Restrictions......................................................... 107

Cape Cod Canal Highway Bridges, MA Final Appendix D - Economics Major Rehabilitation Evaluation Report D-v March 2020
List of Tables
Table D - 1 Costs Associated with Unscheduled Repairs-Results from Monte Carlo Simulations 3 Table D - 2 Costs Associated with Scheduled Construction .......................................................... 4 Table D - 3 Sagamore Bridge Summary Results ............................................................................ 5 Table D - 4 Bourne Bridge Summary Results ................................................................................ 5 Table D - 5 List of Alternatives .................................................................................................... 11 Table D - 6: Federal Highway Administration’s National Bridge Inventory Condition Ratings . 16 Table D - 7: Component Failure Impacts ..................................................................................... 21 Table D - 8: Average Travel Time of Major Routes .................................................................... 35 Table D - 9: Average Travel Time by Closure 2014 .................................................................... 37 Table D - 10: Average Travel Time by Closure 2040 .................................................................. 37 Table D - 11: Percent of Hourly Income and Hourly Value of Time ($/hour) ............................. 38 Table D - 12: Value of Time per Hour by Trip Type in 2016 Dollars ......................................... 39 Table D - 13: GDP Deflator .......................................................................................................... 39 Table D - 14: Value of Time per hour by Trip Type in 2020 Dollars .......................................... 39 Table D - 15: Cost of Emergency Repairs .................................................................................... 40 Table D - 16: Number of Vessels transiting Cape Cod Canal ...................................................... 42 Table D - 17: Cargo Vessel Trips 2012-2017 ............................................................................... 43 Table D - 18: Cape Cod Freight Traffic, 2012-2017 .................................................................... 44 Table D - 19: Cape Cod Canal Freight Traffic, 2012-2017 .......................................................... 45 Table D - 20: Steps to Estimate Impact to Navigation ................................................................. 47 Table D - 21: Navigation Impacts ................................................................................................. 48 Table D - 22: Sagamore Bridge Base Condition Costs ................................................................. 49 Table D - 23: Bourne Bridge Base Condition Costs ..................................................................... 49 Table D - 24: Sagamore Bridge Rehabilitation Costs ................................................................... 58 Table D - 25: Bourne Bridge Rehabilitation Costs ....................................................................... 58 Table D - 26: Sagamore Bridge Rehabilitation Benefits .............................................................. 58 Table D - 27: Bourne Bridge Rehabilitation Benefits .................................................................. 58 Table D - 28: Sagamore Bridge Rehabilitation Engineering Costs .............................................. 59 Table D - 29: Bourne Bridge Rehabilitation Engineering Costs .................................................. 60 Table D - 30: Rehabilitation Lane Closure Durations Estimates .................................................. 60 Table D - 31: Sagamore Bridge Rehabilitation Construction and Travel Costs ........................... 61 Table D - 32: Bourne Bridge Rehabilitation Construction and Travel Costs ............................... 61 Table D - 33: Sagamore Bridge Rehabilitation Total Annualized Costs ...................................... 62 Table D - 34: Bourne Bridge Rehabilitation Total Annualized Costs .......................................... 63 Table D - 35: Sagamore Bridge Rehabilitation Costs and BCR ................................................... 64 Table D - 36: Bourne Bridge Rehabilitation Costs and BCR ....................................................... 65 Table D - 37: Sagamore Bridge Replacement 4 Lanes Costs ....................................................... 75 Table D - 38: Bourne Bridge Replacement 4 Lanes Costs ........................................................... 75 Table D - 39: Sagamore Bridge Replacement 4 Lanes Benefits .................................................. 75 Table D - 40: Bourne Bridge Replacement 4 Lanes Benefits ....................................................... 75

Cape Cod Canal Highway Bridges, MA Final Appendix D - Economics Major Rehabilitation Evaluation Report D-vi March 2020
Table D - 41: Sagamore Bridge Replacement 4 Lanes Engineering Costs .................................. 76 Table D - 42: Bourne Bridge Replacement 4 Lanes Engineering Costs ....................................... 76 Table D - 43: Sagamore Bridge Replacement 4 Lanes Costs ....................................................... 77 Table D - 44: Bourne Bridge Replacement 4 Lanes Costs ........................................................... 77 Table D - 45: Sagamore Bridge Replacement 4 Lanes Total Annualized Cost ............................ 77 Table D - 46: Bourne Bridge Replacement 4 Lanes Total Annualized Cost ................................ 78 Table D - 47: Sagamore Bridge Replacement 4 Lanes Annual Costs and BCR .......................... 79 Table D - 48: Bourne Bridge Replacement 4 Lanes Annual Costs and BCR ............................... 80 Table D - 49: Sagamore Bridge Replacement 4 Lanes with 2 Auxiliary Annual Costs ............... 83 Table D - 50: Bourne Bridge Replacement 4 Lanes with 2 Auxiliary Annual Costs ................... 83 Table D - 51: Benefits of Reduced Congestion ............................................................................ 83 Table D - 52: Sagamore Bridge Replacement 4 Lanes with 2 Auxiliary Benefits ....................... 84 Table D - 53: Bourne Bridge Replacement 4 Lanes with 2 Auxiliary Benefits ........................... 84 Table D - 54: Sagamore Bridge Replacement 4 Lanes with 2 Auxiliary Engineering Costs d. ... 84 Table D - 55: Bourne Bridge Replacement 4 Lanes with 2 Auxiliary Engineering Costs ........... 85 Table D - 56: Sagamore Bridge Replacement 4 Lanes with 2 Auxiliary Costs ........................... 85 Table D - 57: Bourne Bridge Replacement 4 Lanes with 2 Auxiliary Costs ................................ 85 Table D - 58: Sagamore Bridge Replacement 4 Lanes with 2 Auxiliary Total Annualized Cost 86 Table D - 59: Bourne Bridge Replacement 4 Lanes with 2 Auxiliary Total Annualized Cost .... 86 Table D - 60: Sagamore Bridge Replacement 4 Lanes with 2 Auxiliary Annual Cost and BCR 87 Table D - 61: Bourne Bridge Replacement 4 Lanes with 2 Auxiliary Annual Cost and BCR ..... 88 Table D - 62: Sagamore Bridge Updated Rehabilitation Engineering Costs ................................ 92 Table D - 63: Bourne Bridge Updated Rehabilitation Engineering Costs .................................... 92 Table D - 64: Sagamore Bridge Replacement 4 Lanes with 2 Auxiliary Updated Engineering Costs .............................................................................................................................................. 93 Table D - 65: Bourne Bridge Replacement 4 Lanes with 2 Auxiliary Updated Engineering Costs....................................................................................................................................................... 93 Table D - 66: Updated Base Condition Life Cycle Costs ............................................................. 93 Table D - 67: Updated Rehabilitation Life Cycle Costs ............................................................... 94 Table D - 68: Updated Rehabilitation Benefits ............................................................................. 94 Table D - 69: Updated Sagamore Bridge Rehabilitation Total Annualized Costs ....................... 94 Table D - 70: Updated Bourne Bridge Rehabilitation Total Annualized Costs ........................... 95 Table D - 71: Updated Benefits, Costs, and Benefit-Cost Ratio .................................................. 95 Table D - 72: Updated Replacement Life Cycle Costs ................................................................. 96 Table D - 73: Updated Replacement Benefits .............................................................................. 96 Table D - 74: Updated Sagamore Bridge Rehabilitation Total Annualized Costs ....................... 96 Table D - 75: Updated Bourne Bridge Rehabilitation Total Annualized Costs ........................... 97 Table D - 76: Updated Benefits, Costs, and Benefit-Cost Ratio .................................................. 97 Table D - 77: Sagamore Bridge Summary Results ....................................................................... 98 Table D - 78: Bourne Bridge Summary Results ........................................................................... 98 Table D - 79: Sensitivity Analysis Hazard Functions Mean BCRs ............................................ 102 Table D - 80: Sensitivity Analysis Event Tree Probabilities Mean BCRs ................................. 103

Cape Cod Canal Highway Bridges, MA Final Appendix D - Economics Major Rehabilitation Evaluation Report D-vii March 2020
Table D - 81: Sensitivity Analysis Project Start Year Mean BCRs ............................................ 105 Table D - 82: Sensitivity Analysis Value of Time Mean BCRs ................................................. 106 Table D - 83: Sensitivity Analysis Replacement Bridges Built Concurrently ............................ 107 Table D - 84: Sensitivity Analysis Weight Restrictions ............................................................. 108
List of Figures
Figure D - 1 Location of Corps-operated Facilities and Property Boundaries ............................... 7 Figure D - 2 Geographic Scope ...................................................................................................... 9 Figure D - 3: Bridge Components ................................................................................................. 17 Figure D - 4: Base Condition Probability of a Bridge Deck Failure ............................................ 18 Figure D - 5: Base Condition Probability of a Substructure Failure ............................................. 19 Figure D - 6: Base Condition Probability of a Superstructure Failure ......................................... 19 Figure D - 7: Sagamore Bridge Deck Deterioration Event Tree .................................................. 23 Figure D - 8: Sagamore Bridge Substructure Deterioration Event Tree ....................................... 25 Figure D - 9: Sagamore Superstructure Deterioration Event Tree ............................................... 26 Figure D - 10: Bourne Bridge Deck Deterioration Event Tree ..................................................... 28 Figure D - 11: Bourne Bridge Substructure Deterioration Event Tree ......................................... 29 Figure D - 12: Bourne Superstructure Deterioration Event Tree .................................................. 31 Figure D - 13: Traffic Routes ........................................................................................................ 33 Figure D - 14: Average Daily Volume of Traffic ......................................................................... 34 Figure D - 15: Sagamore Rehabilitation Probability of a Bridge Deck Failure ............................ 51 Figure D - 16: Bourne Rehabilitation Probability of a Bridge Deck Failure ................................ 51 Figure D - 17: Sagamore Rehabilitation Probability of a Substructure Failure ............................ 52 Figure D - 18: Bourne Rehabilitation Probability of a Substructure Failure ................................ 52 Figure D - 19: Sagamore Rehabilitation Probability of a Superstructure Failure ......................... 53 Figure D - 20: Bourne Rehabilitation Probability of a Superstructure Failure ............................. 53 Figure D - 21: Rehabilitation Bridge Deck Event Tree ................................................................ 55 Figure D - 22: Rehabilitation Substructure Event Tree ................................................................ 56 Figure D - 23: Rehabilitation Superstructure Event Tree ............................................................. 57 Figure D - 24: Sagamore Major Rehabilitation @RISK Output BCR ......................................... 64 Figure D - 25: Sagamore Major Rehabilitation @RISK Output Net Benefit ............................... 65 Figure D - 26: Bourne Major Rehabilitation @RISK Output BCR .............................................. 66 Figure D - 27: Bourne Major Rehabilitation @RISK Output Net Benefits .................................. 66 Figure D - 28: Sagamore Replacement Probability of a Bridge Deck Failure ............................. 68 Figure D - 29: Bourne Replacement Probability of a Bridge Deck Failure.................................. 68 Figure D - 30: Sagamore Replacement Probability of a Substructure Failure ............................. 69 Figure D - 31: Bourne Replacement Probability of a Substructure Failure .................................. 69 Figure D - 32: Sagamore Replacement Probability of a Superstructure Failure .......................... 70 Figure D - 33: Bourne Replacement Probability of a Superstructure Failure ............................... 70 Figure D - 34: Replacement Bridge Deck Event Tree .................................................................. 72 Figure D - 35: Replacement Substructure Event Tree .................................................................. 73

Cape Cod Canal Highway Bridges, MA Final Appendix D - Economics Major Rehabilitation Evaluation Report D-viii March 2020
Figure D - 36: Replacement Superstructure Event Tree ............................................................... 74 Figure D - 37: Sagamore 4 Lane Replacement @RISK Output BCR .......................................... 79 Figure D - 38: Sagamore 4 Lane Replacement @RISK Output Net Benefits .............................. 80 Figure D - 39: Bourne 4 Lane Replacement @RISK Output BCR .............................................. 81 Figure D - 40: Bourne 4 Lane Replacement @RISK Output Net Benefits .................................. 81 Figure D - 41: Sagamore 6 Lane Replacement @RISK Output BCR .......................................... 87 Figure D - 42: Sagamore 6 Lane Replacement @RISK Output BCR Net Benefits ..................... 88 Figure D - 43: Bourne 6 Lane Replacement @RISK Output BCR .............................................. 89 Figure D - 44: Bourne 6 Lane Replacement @RISK Output Net Benefits .................................. 89

Cape Cod Canal Highway Bridges, MA Final Appendix D - Economics Major Rehabilitation Evaluation Report D-1 March 2020
2 EXECUTIVE SUMMARY
The U.S. Army Corps of Engineers (USACE), New England District, is conducting a multi-year Major Rehabilitation Evaluation Study of the Bourne and Sagamore highway bridges spanning the Cape Cod Canal. The study evaluates the current conditions of the bridges and what alternatives are feasible for the future. The economic analysis is extended over a 50-year period using 2020 as the base year and the Federal Discount Rate currently set at 2. 750 percent for Fiscal Year 2020.
The existing bridges were constructed more than 85 years ago and require frequent maintenance, which is costly and causes significant impacts to traffic crossing the Cape Cod Canal. The highway bridges, and the companion Railroad Bridge constructed during the same era, provide the only means of access to the towns on Cape Cod and Nantucket and Martha’s Vineyard. Approximately 215,000 residents and 5 million visitors use these bridges each year.
To better understand the condition of its Civil Works projects the USACE completes a Major Rehabilitation Evaluation Report (MRER) whenever infrastructure maintenance construction costs are expected to exceed $20 million and take more than 2 years of construction to complete. The MRER is based on four pillars of evaluation: a structural engineering risk and reliability analysis of the current structures, cost engineering, economic analysis, and environmental evaluation of all feasible alternatives. An MRER identifies operational and potential reliability issues, as well as opportunities for efficiency improvement, over a 50-year period of analysis.
This study will determine whether standard operation and maintenance, major rehabilitation, or replacement of both bridges will provide the most reliable, fiscally responsible solution for the future. The MRER will provide the basis of decision-making for USACE and Congress on the most cost-effective, safe alternative for critical public transportation across Cape Cod Canal for the next several decades.
As part of the MRER, an economic evaluation was performed to analyze the costs and benefits of the “base” condition and compare it to alternatives. The “base” condition refers to a baseline of continued regular inspections and standard maintenance construction on the bridges. Below is a brief summary of the findings of the economic analysis.
Methodology The initial economic analysis focused on four conditions:
1. Alternative A: Base (or without project) condition - continue to maintain the bridges with regularly scheduled maintenance and make emergency funding available for repairs when there is a component failure.
2. Alternative B: major rehabilitation of existing bridges 3. Alternative C: replacement with two 4-lane bridges (eliminated in final evaluation) 4. Alternative D: replacement with two 4-lane bridges with auxiliary on/off lanes

Cape Cod Canal Highway Bridges, MA Final Appendix D - Economics Major Rehabilitation Evaluation Report D-2 March 2020
The economic analysis evaluates the base condition and then compares that condition to the alternatives. Annual benefits considered for each alternative include the reduction in emergency repair spending, the decrease in traffic delays, and changes in cost to waterway navigation. The annual benefit of each alternative is then compared to its respective cost. An alternative is considered economically justified if it maximizes net annual benefits and its benefit cost ratio (annual benefit divided by annual cost) is greater than one.
The analysis is performed using a risk based approach to compare costs and benefits of each alternative to the base condition. Reliability functions from engineering event trees are utilized to simulate possible component failures and associated repair costs. The three engineering components that could experience failure are the bridge deck, substructure, and superstructure. This analysis is evaluated over a 50-year period using Monte Carlo Simulation to determine long-term costs of the future base condition without-project and the future with alternatives. The model was approved for single-use by the USACE Planning Center of Expertise for Inland Navigation and Risk Informed Economics Division in July 2018. The memo documenting this approval pursuant to EC 1105-2-412 is attached as an addendum to this appendix.
The overall cost of each alternative includes several elements; the cost of the repair itself, the economic cost to vessels that cannot use the canal (navigation costs), operation & maintenance costs, and the change in value of time incurred by drivers in traffic delays (travel costs) during lane closures for repairs or construction phases.
The value of time is determined using USACE regulation (ER 1105-2-100). Traffic data was modeled by TrafInfo; a transportation consulting company familiar with the Massachusetts Department of Transportation (MassDOT) data. TrafInfo provided Cape Cod traffic study data and forecasts. This traffic data was used to determine the total hours of traffic delay incurred during construction for all travelers crossing the bridges. A monetary value was attributed to these lost productive hours using the average hourly household median income of the surrounding towns as sourced from the US Census Bureau.
Cost Comparison A comparison of mean annual costs for the base condition and three alternatives is provided in Table D-1 below. These costs represent the economic impacts of unscheduled component failures and unscheduled maintenance events that will occur over the 50 year period of analysis. Maintaining the bridges in the current, base condition would result in annual repair costs of $123.9 million and $65.2 million for the Sagamore and Bourne Bridge respectively. Under the Major Rehabilitation scenario, those expenses would decrease to $8.7 million for the Sagamore Bridge and $6.1 million for the Bourne Bridge. Replacing the bridges, both with and without the auxiliary lanes, reduces the annual costs further to approximately $4.5 million for the Sagamore Bridge and $7 million for the Bourne Bridge.

Cape Cod Canal Highway Bridges, MA Final Appendix D - Economics Major Rehabilitation Evaluation Report D-3 March 2020
Table D - 1 Costs Associated with Unscheduled Repairs-Results from Monte Carlo Simulations
Mean Annual Costs, ($000)
Repair Cost
Navigation Cost Travel Cost O&M
Costs Total Alt A: Base Condition Sagamore 2,800 0.7 120,700 400 123,900 Bourne 3,200 0.7 61,700 300 65,200 Alt B: Major Rehabilitation Sagamore 300 0.6 8,000 400 8,700 Bourne 400 0.6 5,400 300 6,100 Alt D: Replacement 4 Lanes with on/off Auxiliary Sagamore 300 0.1 4,000 200 4,500 Bourne 500 0.2 6,300 200 7,000
Table D-2 below presents the annual costs for all scheduled construction planned during the major rehabilitation and the replacement alternatives. These costs include the dollar amounts for replacing bridge components in the major rehabilitation, or replacing the entire bridge for the other two alternatives. Costs also include traffic impacts for all scheduled construction periods.
In the major rehabilitation alternative, construction costs of $144.3 million (Sagamore) and $158.9 million (Bourne) are included for additional major repairs that would be required approximately 30 years after the major rehabilitation. Repairs include painting and major steel replacement for floor beams and truss deck. These costs are reduced significantly to $15.8 million and $7.9 million respectively in Alternative D.
Tables D-3 and D-4 provide summary detail of all costs, benefits, and benefit to cost ratios (BCRs) for the major rehabilitation and two bridge replacement alternatives. More detail for the benefit calculations can be found throughout the economic appendix.

Cape Cod Canal Highway Bridges, MA Final Appendix D - Economics Major Rehabilitation Evaluation Report D-4 March 2020
Table D - 2 Costs Associated with Scheduled Construction
Sagamore Bridge Cost ($000)
Alternative B: Rehabilitation
Alt D: Replacement 4 Lanes with
On/Off Auxiliary Construction cost (2020 dollars) 156,300 486,100 Construction cost of additional repair work (2020 dollars)
144,400 15,800
Travel delay costs (2020 dollars) 1,281,000 92,800 Discount factor 2.75% 2.75% Capital Recovery Factor 0.0370 0.0370 Discounted construction cost 132,900 402,300 Discounted additional repair work 49,700 5,700 Discounted travel delay cost 782,600 33,500 Interest During Construction (IDC) 4,300 27,500
Total Cost 969,500 469,000 Annualized Cost 35,900 17,400 Bourne Bridge Construction cost (2020 dollars) 186,200 721,800 Construction cost of additional repair work (2020 dollars)
158,900 7,900
Travel delay costs (2020 dollars) 948,400 22,200
Discount factor 2.75% 2.75% Capital Recovery Factor 0.0370 0.0370 Discounted construction cost 142,000 521,600 Discounted additional rehab work 47,200 3,100
Discounted travel delay cost 536,700 8,900 Interest During Construction (IDC) 5,200 40,800
Total Cost 731,100 574,400 Annualized Cost 27,100 21,300

Cape Cod Canal Highway Bridges, MA Final Appendix D - Economics Major Rehabilitation Evaluation Report D-5 March 2020
Table D - 3 Sagamore Bridge Summary Results
Scenario Simulation Comparison
Annual Life Cycle Cost* ($000) (from Table 1)
Annualized Costs ($000)
(from Table 2)
Annualized Benefits ($000)
Annualized Net
Benefits ($000)
BCR
Alt A: Base Condition Mean 123,900 - - - - Median 119,000 - - - - Alt B: Major Rehabilitation Mean 8,800 35,900 115,100 79,200 3.2 Median 6,600 35,900 112,400 76,500 3.1 Alt D: Replacement 4 Lanes with on/off Auxiliary Mean 4,400 17,400 119,500 102,100 6.9 Median 2,900 17,400 116,100 98,700 6.7
Table D - 4 Bourne Bridge Summary Results
Scenario Simulation Comparison
Annual Life Cycle Cost* ($000) (from
Table 1)
Annualized Costs ($000)
(from Table 2)
Annualized Benefits ($000)
Annualized Net
Benefits ($000)
BCR
Alt A: Base Condition Mean 65,200 - - - - Median 62,700 - - - - Alt B: Major Rehabilitation Mean 6,100 27,100 59,100 32,000 2.2 Median 4,800 27,100 57,900 30,800 2.1 Alt D: Replacement 4 Lanes with on/off Auxiliary Mean 6,900 21,300 58,300 37,000 2.7 Median 4,200 21,300 58,500 37,200 2.7
* Life Cycle Cost includes costs to repair structure components as well as the travel delay costs associated with the repair activity.

Cape Cod Canal Highway Bridges, MA Final Appendix D - Economics Major Rehabilitation Evaluation Report D-6 March 2020
Conclusion Rank of Alternatives:
Based on Net Benefits, the rank of alternatives (with 1 being the most desirable) is:
1. Alternative D: Replacement with two 4-lane bridges with auxiliary on/off lanes 2. Alternative B: Major rehabilitation of existing bridges 3. Alternative A: Base Condition - continue to maintain the bridges with regularly
scheduled maintenance and make emergency funding available when there is a component failure to repair the failure.
The economic analysis suggests that fixing the current bridges as components deteriorate will lead to significant costs, particularly costs for travelers delayed in traffic.
The first alternative evaluated was major rehabilitation of the existing bridges. This scenario demonstrated positive net benefits and a benefit-cost-ratio of 3.2 for the Sagamore Bridge and 2.2 for the Bourne Bridge. One advantage of the rehabilitation is a lower initial construction cost for the project when compared to replacing the bridges. The disadvantages are the impact it will have on traffic patterns during the time of construction due to lane and full bridge closures as well as the bridges not being brought up to current engineering standards and regulations.
Alternatives for replacement bridges were also evaluated for two 4-lane bridges (Alternative C) and for two 4-lane bridges with auxiliary on/off lanes (Alternative D). Alternative C was eliminated as this design will not meet current highway safety requirements. Alternative D had higher net benefits and BCRs than the rehabilitation scenario. One disadvantage of the new bridges is the high initial cost of construction. On the other hand, advantages of the replacement bridges are minimal disturbances to traffic during construction and replacing the aging infrastructure with bridges at current engineering standards and regulations.
The analysis suggests that the two 4-lane bridges with auxiliary lanes are more economically justifiable given the lower annual costs over 50 years of analysis.

Cape Cod Canal Highway Bridges, MA Final Appendix D - Economics Major Rehabilitation Evaluation Report D-7 March 2020
3 INTRODUCTION
Since 1928, the New England District of the Army Corps of Engineers has been responsible for the operation and maintenance of the Cape Cod Canal. The canal is located in Barnstable County with the majority of the Canal in the town of Bourne and the northern boundary located in Sandwich which includes the Scusset Beach State Reservation. With annual visitation exceeding three million, the Cape Cod Canal is one of the Corps’ busiest projects and serves as the gateway to historic Cape Cod. The primary mission of the Corps at the Cape Cod Canal is to provide safe navigation to the 14,000 commercial and recreational vessels that transit the 17.5 mile waterway each year. The Corps also owns and operates over 1,000 acres of land surrounding the Canal that provides diverse recreational opportunities such as hiking, biking, and fishing. Figure D-1 shows the location of the Cape Cod Canal and the Corps property boundary.
The canal is spanned by the Cape Cod Canal Railroad Bridge, the Bourne Bridge, and the Sagamore Bridge. The Sagamore Bridge is located in the town of Bourne and carries traffic along Route 6. The bridge is 1,408 feet long and has 4 traffic lanes, 2 in each direction. The Bourne Bridge is also located in Bourne, along Route 28. The Bourne Bridge is larger than the Sagamore Bridge, spanning 2,384 feet and similarly includes 4 lanes of traffic, 2 in each direction. The bridges were constructed between 1933 and 1935. They are owned and operated by the Army Corps of Engineers. Figure D - 1 Location of Corps-operated Facilities and Property Boundaries

Cape Cod Canal Highway Bridges, MA Final Appendix D - Economics Major Rehabilitation Evaluation Report D-8 March 2020
The Bourne and Sagamore bridges are the primary means of transportation on and off Cape Cod and provide access to the ferry terminals on the Cape for the islands of Nantucket and Martha’s Vineyard. The bridges provide a daily route for commuters in the surrounding area and the livelihoods of many residents in the area are dependent on access to these bridges. Tourism also plays a vital role in the region’s economy. Tourism on the Cape and Islands generated over 100 million state and local tax dollars in 2018. In addition, more than 10,000 jobs were supported by the tourism industry, generating over 350 million dollars in wages in 2018i. Therefore, disruption to bridge traffic would be detrimental to the economic prosperity in the region.
The Corps’ mission is to provide safe transport to the 215,000 full time Cape Cod residents and millions of annual visitors. With both bridges now over 80 years old and despite ongoing maintenance, they have deteriorated over time and require increasingly more frequent repairs. Therefore this economic appendix will evaluate options for ensuring safe access across the canal.
This economic appendix evaluates the base case condition and compares the base condition to the various alternatives under consideration. The term base condition is synonymous to the without-project condition term used in other USACE documentation. The evaluation is done by comparing the annual benefit of each alternative to its respective cost. An alternative is considered economically justified if it maximizes net annual benefits and its benefit cost ratio (annual benefit divided by annual cost) is greater than one. The cost of each alternative includes the value of time incurred by traffic delays (travel costs) during lane closures for repairs or construction phases. This analysis follows guidance from EP 1130-2-500, Appendix B “Rehabilitation Evaluation Report.” Costs and benefits are evaluated at the 2020 price level using the 2019 Federal interest rate for water resources projects of 2.875% and then updated in Section 8.2 Update to Discount Rate using the 2020 interest rate of 2.750%.
Geographic Scope The study area consists of the region between Route 3 Exit 2 (Herring Pond Road) in Plymouth and Route 6 Exit 2 (Route 130, Forestdale Road) in Sandwich, as well as the area between Route 25 Exit 2 (Glen Charlie Road) in Wareham and Route 151 in Mashpee, as illustrated in Figure D – 2.
Federal Interest Purpose
The purpose of the Cape Cod Canal Bridges Major Rehabilitation Study is to analyze opportunities for improving the existing deteriorated bridges to provide structures which will maintain reliability of service, improve safety and ease of maintenance, and provide safe, secure, and cost effective access across the Cape Cod Canal. The purpose of this analysis is to evaluate and compare the costs and benefits of the various alternative measures and recommend the most economically justifiable solution.

Cape Cod Canal Highway Bridges, MA Final Appendix D - Economics Major Rehabilitation Evaluation Report D-9 March 2020
Figure D - 2 Geographic Scope
Need The Bourne and Sagamore Bridges provide the only vehicular access to 15 towns and nearly 215,000 full time residents and millions of annual visitors to Cape Cod. The bridges also provide access to 8 offshore island municipalities through the ferry terminals located on Cape Cod. The Bourne and Sagamore Bridges were constructed in 1933. Both bridges are now over 80 years old and despite ongoing maintenance, they have deteriorated over time and require increasingly more frequent repairs. Routine and emergency maintenance activities requiring lane closures cause significant restrictions of each bridge’s carrying capacity during these maintenance/repair events. While some maintenance can be performed outside of normal commuting hours, other emergency repairs cannot. Without major rehabilitation or replacement, travelers will experience more frequent delays and lane closures and the bridges may reach a point where load restrictions may need to be imposed; adversely impacting traffic over both bridges. Routine bridge maintenance will not extend the useful life or improve the reliability of the bridges.
Cost-Benefit Analysis Framework The basic criteria for an economically viable project are that the present value of the benefits exceeds the present value of the costs, and/or that the rate of return on the investment exceeds the cost of capital. The benefits represent the incremental economic payoff of the project. The costs are opportunity costs—that is, the value of the foregone alternative investment. The Federal Discount Rate, based on the rate of return on risk-free Treasury securities and currently set at 2.875 percent for Fiscal Year 2019, is used to discount the scenarios. It is updated in Section 8.2 Update to Discount Rate using the 2020 interest rate of 2.750%.

Cape Cod Canal Highway Bridges, MA Final Appendix D - Economics Major Rehabilitation Evaluation Report D-10 March 2020
For this project, the federal government’s contribution to operate, repair, rehabilitate or build a bridge represents the cost. The benefits refer to the quantifiable, incremental gains that accrue to the society as a result of the project (“with-project” condition), as compared to the base condition of maintaining the bridges as needed (“without-project” condition). Under the base condition where no improvements are made, it is anticipated that service disruptions will continue and the bridges will eventually close. This is the “baseline” scenario that will be compared to the proposed alternatives of rehabilitation and construction of new bridges. The net benefits are calculated by taking the difference between the base condition and with-project conditions. A benefit-cost ratio greater than one indicates that the project’s net benefits outweigh the costs.
Methodology Economic analysis is performed using a risk based approach. The model was approved for single-use by the USACE Planning Center of Expertise for Inland Navigation and Risk Informed Economics Division in July 2018. The memo documenting this approval pursuant to EC 1105-2-412 is attached as an addendum to this appendix.
Reliability functions from engineering event trees are utilized to simulate life cycle of components and associated repair costs. This analysis is extended over a 50-year period to determine long-term costs of the future base condition without project and the future with alternatives. The costs are estimated in Excel using an add-in, @RISK, to generate Monte Carlo simulations. The outputs of the simulation are the additional costs for the base case and each alternative, the benefit and net benefit of each alternative, and a benefit-cost ratio for each alternative. The net benefit of each alternative is the difference between annual benefit and annual cost. The benefit-cost ratio for an alternative is the annual benefit divided by the annual cost of each alternative. The mean and standard deviation of each output variable is also calculated.
Inputs into the economic analysis are the component failure rates developed in Appendix A – Engineering Reliability Analysis. The three engineering components that could experience failure are the bridge deck, substructure, and superstructure. Component failures are the same for both the Bourne Bridge and the Sagamore Bridge. Hazard rates were developed for each component, which indicate the probability of component failure at a point in time.
Monte Carlo Simulation generates a random number between 0 and 1 for each of the 50 years of project life. The random decimal correlates to the probability of failure signaling either a repair is required or no repair is required. Associated with each component failure is a repair cost as well as the value cost of time spent in traffic delays. In some scenarios additional navigation costs would be incurred if the canal were to be closed for vessel traffic. The additional costs due to component failures are discounted in the year of failure. For each iteration of the model these costs are summed over the project life. The model is iterated 100,000 times each year over the fifty years and the average annual costs are obtained by summing the costs over the fifty years and annualizing using the capital recovery factor of 0.0379 based on the 2019 discount rate and updated in Section 8.2 to 0.0370 based on the 2020 discount rate.

Cape Cod Canal Highway Bridges, MA Final Appendix D - Economics Major Rehabilitation Evaluation Report D-11 March 2020
In the event of a component failure, subsequent years will continue to show deteriorating conditions and therefore hazard rates are not reset after repairs. Through engineering expert elicitation, it was determined that failures in one component of the bridge deck, substructure, or superstructure do not prevent failure in another area of that component. Hazard functions are instead adjusted after construction is complete in the major rehabilitation and replacement alternatives indicating increased structural soundness.
Benefits are reductions in repair and maintenance costs and travel delay costs between the proposed alternatives and the base condition. Each alternative is evaluated against the base case. Each alternative and the base case have separate sets of hazard indices for each system component. The hazard rates increase over time reflecting the increased probability of failure due to deteriorating conditions.
Alternatives Considered A number of alternatives were initially considered and are listed in the table provided below.
Table D - 5 List of Alternatives
Description Special Considerations Base
A Continued Maintenance and Repairs (Fix as Fails) to Both Existing Bridges as Needed to Maintain Safety. All alternatives are measured against this plan.
This is the Federal Base Plan – the Without Project Condition
B A Program of Repairs and Major Rehabilitation for Both Bridges to Maintain Safety and Avoid Future Restrictions on Bridge Weight Postings
Major Rehabilitation of Each Bridge is Required about every 45 Years.
C Replacement of One or Both Highway Bridges with New Bridges Limited to Four Lanes Each
Each Old Bridge would Remain in Service until the New Bridge was Completed
D Replacement of One or Both Highway Bridges with New Bridges with Four Through-Traffic Lanes and Two Auxiliary Lanes
Each Old Bridge would Remain in Service until the New Bridge was Completed
E Replacement of One or Both Highway Bridges with New Bridges with Additional (More than Four) Non-Federally Funded Through Traffic Lanes, plus Two Auxiliary Lanes
Each Old Bridge would Remain in Service until the New Bridge was Completed
F Replacement of Both Highway Bridges with a Single New Bridge
Both Old Bridges would Remain in Service until the New Bridge was Completed
G Non-USACE Construction of a New Third Highway Bridge
This would be a State implemented Alternative.
H Replacement of One or Both Highway Bridges with Tunnels
Each Old Bridge would Remain in Service until the New Tunnel was Completed
I Replacement of Both Bridges with a Single Tunnel Both Old Bridges would Remain in Service until the New Tunnel was Completed

Cape Cod Canal Highway Bridges, MA Final Appendix D - Economics Major Rehabilitation Evaluation Report D-12 March 2020
J Replacement of One or Both High Level Bridges with Low Level Draw Spans
Each Old Bridge would Remain in Service until the New Bridge was Completed
K Replacement of Both Bridges with Low Level Crossings on Causeways with Draw Spans for Shallow Draft Navigation
Both Old Bridges would Remain in Service until the New Causeway was Completed
L Deauthorization and Closure of the Cape Cod Canal, Filling the Land Cut, and Restoration of Surface Highways, Drainage and Estuarine Ecosystems
Includes Retention of the Shallow Draft Harbors at Each End of the Canal (East Boat Basin, Buttermilk Bay and Onset Bay Projects
These initial alternatives were evaluated and screened to reduce the list to only those plans which in terms of likely cost, impacts on the marine and land transportation systems, traffic and environmental impacts, and overall practicability would be implementable.
For a more detailed description of the screening out process please refer to the Major Rehabilitation Evaluation Report and Environmental Assessment section 5.1 Alternatives Considered but Not Carried Forward.
Alternative E was not carried forward because additional through-traffic lanes would not be in accordance with the existing authority for the Federal government for the Cape Cod Canal navigation project. New Federal legislation would be required for any expansion of capacity to be implemented. Additional through traffic lanes would not generate appreciable benefits to traffic without extensive state improvements to region’s highway capacity on both side of the Canal, which would carry high costs and greater impact to the environment and the communities. This plan was therefore eliminated from further consideration.
Alternative F was eliminated because a single bridge crossing would require substantial and significant infrastructure construction and involve extensive redesign and major realignment of local surface roads and regional highway connections on both the Cape and mainland sides of the Canal. Additional costs include expensive approach work for navigation clearance and real estate takings including lands from the Massachusetts Military Reservation as well as historical and environmental lands.
The construction of a third bridge, Alternative G was not carried forward. MassDOT initially studied this concept and determined there were significant resource impact issues. Additionally, this alternative does not provide a solution for the existing Bourne and Sagamore Bridges.
Alternatives H and I were eliminated from detailed analysis based on the high cost and extensive impacts on the environment and land uses. Initial cost estimates determined a tunnel would cost at least twice the cost of new bridges.
Alternatives (J, K and L) which involved closure of the Canal by filling, or construction of causeways or low-level fixed bridges or draw spans were eliminated from further consideration. Some of these plans would also constrain or eliminate the Canal as a shallow draft waterway.

Cape Cod Canal Highway Bridges, MA Final Appendix D - Economics Major Rehabilitation Evaluation Report D-13 March 2020
These alternatives would degrade the efficiency and safety of coastwise navigation. Restricting or closing the Canal to navigation would be inconsistent with the Congressional authorization for the Canal as a deep-draft waterway and would require legislation to implement.
Alternatives Carried Forward for Economic Evaluation:
Alternative A – Fix as Fails
Alternative B – Rehabilitation of Bridges
Alternative C – Replacement of Bridges with 4 lanes
Alternative D – Replacement of Bridges with 4 lanes plus auxiliary on/off lanes
Elimination of Alternative C
The two existing bridges with their four through traffic lanes were designed and built in the 1930s to serve far lower traffic volumes than those served by the bridges today. Modern highway design guidance, including AASHTO highway and bridge design specifications and MassDOT design guidance require that entrance and exit ramps include auxiliary lanes for entering and exiting traffic to transition into or out of through traffic safely. Today’s higher traffic volumes and vehicle speeds require greater distances for traffic to transition. Distance between the on and off ramps, grades, and ramp turn diameters are all typical factors.
The FHWA stated the following in their comment letter:
Based on the close proximity of the interchanges and intersections at the end of each bridge, current standards for this type of facility include acceleration and deceleration lanes (also known as auxiliary lanes) going onto the bridges in most, if not all, four ends of the bridges. In final design, analysis will need to be done to determine if the auxiliary lanes should be continuous across each bridge for operational weaving and structural efficiency needs pending on the structure type, long span bridges such as these may gain cost efficiency with a uniform width.
MassDOT states the following with respect to the need for auxiliary lanes:
The design requirements used for the roadways, intersections, and interchanges shall be in accordance with and the 2006 MassDOT Project Development and Design Guide as well as 2018 American Association of State Highway and Transportation Officials (AASHTO) Policy on Geometric Design of Highway and Streets (“the Green Book”). See Chapter 10 of The Green Book which includes Tables 10-4 Minimum Acceleration Lane Lengths for Entrance Terminals…, Table 10-5 Speed Change Lane adjustment factors as a function of grade…, and Table 10-6 Minimum deceleration lane lengths for exit terminals…; these dictate the required lengths for this type of facility include acceleration and deceleration lanes (also known as auxiliary lanes).

Cape Cod Canal Highway Bridges, MA Final Appendix D - Economics Major Rehabilitation Evaluation Report D-14 March 2020
Providing a replacement for the existing spans in-kind with respect to the number of through traffic lanes would not conform to current design guidance for bridges and highways. For this reason, providing new bridges without auxiliary lanes would not be consistent with best practices for traffic safety, and Plan C will not be carried forward into detailed analysis.
Final Array of Alternatives
Alternative A – Fix as Fails
Alternative B – Rehabilitation of Bridges
Alternative D – Replacement of Bridges with 4 lanes plus auxiliary on/off lanes
Discounting For most transportation investments, costs are incurred in the initial years, while the benefits from the investment accrue over many years into the future. When assessing the costs and benefits of a project, it is necessary to take into account the time value of money by converting the costs and benefits that take place in different years into a common year. This process is known as discounting. Discounting converts future costs and benefits that occur in different years into a value for a common year (present value). The year 2020 was selected as the base year because the decision on the recommended plan contained within the MRER is expected to be made in 2020. Base year dollars are valued in dollars that are directly comparable to the current dollars for a given year. The base year can be adjusted by multiplying costs and benefits by the respective rate. Ultimately, how the alternatives compare will not change and therefore, adjusting the base year does not impact the final decision made within the report. The interest rate for discounting, that is, converting benefits and costs to a common time basis, is set each fiscal year in accordance with Section 80 of Public Law 93-251. HQUSACE obtains the rate from U.S. Department of the Treasury, which computes it as the average market yields on interest-bearing marketable securities of the United States that have 15 or more years remaining to maturity.
Time Period According to ER 1105-2-100, “Planning Guidance Notebook”, US Army Corps reports require a period of analysis. A 50-year analysis is a common timeframe used when analyzing USACE Civil Works construction projects. The analysis will cover a 50-year period from 2020 – 2069. The year 2020 was selected as the start of the economic analysis period because this marks the point at which a decision on the recommended plan contained within the MRER must be made in order to initiate the next phase (PED) of the project and avoid significant expenditures on major rehabilitation of the current Sagamore and Bourne bridges (2025-2030). Once the recommended plan is adopted the next phase of the planning and design process can begin.

Cape Cod Canal Highway Bridges, MA Final Appendix D - Economics Major Rehabilitation Evaluation Report D-15 March 2020
Value of Time The cost of each alternative includes the value of time incurred by traffic delays (travel costs) during lane closures for repairs or construction phases. The value of time is determined using USACE regulation (ER 1105-2-100).
Traffic data was modeled by TrafInfo; a transportation consulting company familiar with the Massachusetts Department of Transportation (MassDOT) data. TrafInfo provided Cape Cod traffic study data and forecasts. This traffic data was used to determine the total hours of traffic delay incurred during construction for all travelers crossing the bridges. A monetary value was attributed to these lost productive hours using the average hourly household median income of the surrounding towns. A more detailed description of this process can be found in section 3.3.3 Value of Time with Traffic Impediments.
4 BASE CONDITION (ALTERNATIVE A)
The base condition refers to the scenario in which the Sagamore and Bourne bridges are operated in the most efficient manner in their current states without the proposed rehabilitation project. The bridges will be repaired as structural failures occur.
Existing Condition The overall condition of both the Bourne and Sagamore bridges is becoming worse as the bridges age and major maintenance projects become more frequent. As the condition deteriorates, this leads to the bridges becoming structurally deficient. Both bridges are functionally obsolete and are routinely unable to provide an efficient flow of traffic in conjunction with the current State and local roadway network leading to the bridge approaches.
Bridges are considered “structurally deficient” if significant load-carrying elements are found to be in poor or worse condition due to deterioration and/or damage. A “deficient” bridge typically requires maintenance and repair and eventual rehabilitation or replacement to address deficiencies. To remain open to traffic, structurally deficient bridges are often posted with reduced weight limits that restrict the gross weight of vehicles using the bridges. If unsafe conditions are identified during a physical inspection, the structure could be closed.
Bridges are considered “functionally obsolete” when the geometry of the roadway no longer meets today’s minimum design standards for either width or vertical clearance for that roadway classification. A functionally obsolete bridge is one that was built to standards that are not used today. Functionally obsolete bridges are those that do not have adequate lane widths, shoulder widths, or vertical clearances to serve current traffic demand, or those that may be occasionally flooded.
As discussed in Appendix A – Engineering Reliability Analysis, the Bourne Bridge is both structurally deficient and functionally obsolete. Using the Federal Highway Administration’s National Highway Bridge Inventory Ratings outlined in

Cape Cod Canal Highway Bridges, MA Final Appendix D - Economics Major Rehabilitation Evaluation Report D-16 March 2020
Figure D - 6, the deck is in fair condition with a condition rating of 5. The superstructure is in poor condition with a condition rating of 4, and the substructure is in good condition with a condition rating of 7.
The Sagamore Bridge is functionally obsolete. The deck, superstructure, and substructure are in fair condition with condition ratings of 5.
More details on the current bridge conditions can be found in Appendix A – Engineering Reliability Analysis.
Table D - 6: Federal Highway Administration’s National Bridge Inventory Condition Ratings
Code Description Commonly Employed
Feasible Actions
9 EXCELLENT CONDITION Preventive
Maintenance 8 VERY GOOD CONDITION No problems noted.
7 GOOD CONDITION Some minor problems.
6 SATISFACTORY CONDITION Structural elements show some minor deterioration. Preventive
Maintenance; and/or Repairs
5 FAIR CONDITION All primary structural elements are sound but may have some minor section loss, cracking, spalling or scour.
4 POOR CONDITION Advanced section loss, deterioration, spalling or scour.
Rehabilitation or Replacement
3
SERIOUS CONDITION Loss of section, deterioration, spalling or scour have seriously affected primary structural components. Local failures are possible. Fatigue cracks in steel or shear cracks in concrete may be present.
2
CRITICAL CONDITION Advanced deterioration of primary structural elements. Fatigue cracks in steel or shear cracks in concrete may be present or scour may have removed substructure support. Unless closely monitored the bridge may have to be closed until corrective action is taken.
1
IMMINENT FAILURE CONDITION Major deterioration or section loss present in critical structural components or obvious vertical or horizontal movement affecting structure stability. Bridge is closed to traffic but corrective action may put back in light service.
0 FAILED CONDITION Out of service - beyond corrective action.

Cape Cod Canal Highway Bridges, MA Final Appendix D - Economics Major Rehabilitation Evaluation Report D-17 March 2020
Future Without-Project Condition The future without-project condition outlines the condition in which there is no major rehabilitation or replacement of the existing bridges. It is assumed that continual, regularly-scheduled maintenance will be performed on the existing structures and emergency funds will be provided in the event of performance failure. Travel delays due to lane or bridge closures are expected during necessary maintenance and repair projects.
Probability of Unsatisfactory Performance The three bridge components with potential for unsatisfactory performance (or failure) on the Cape Cod bridges include the bridge deck, the substructure, and the superstructure.
• Bridge deck is the section on the bridge that traffic travels on • Superstructure is the section of the bridge that supports the bridge deck and connects the
substructure components • Substructure is the section of the bridge that supports the superstructure and distributes
the loads to below-ground footingsii
Figure D - 3: Bridge Components
Source: The Michigan Department of Transportation (http://www.michigan.gov/mdot/0,4616,7-151-9618_47418-173584--,00.html) Probability of unsatisfactory performance (PUP) functions exhibit instantaneous probabilities of components not performing as designed. PUP functions are related to age or number of operations. Unsatisfactory performance must also have measurable consequences. The PUP functions are determined during engineering reliability analysis through expert elicitation. For a

Cape Cod Canal Highway Bridges, MA Final Appendix D - Economics Major Rehabilitation Evaluation Report D-18 March 2020
more detailed description of the consequences of unsatisfactory performance please refer to Appendix A – Engineering Reliability Analysis.iii
For this study, unsatisfactory performance is defined as the physical condition where any of the bridges’ critical elements is assigned a Condition Rating of 4 (Poor Condition) or less in accordance with protocols of the Federal Highway Administration’s (FHWA) National Bridge Inventory (NBI). The NBI contains data reported annually to the FHWA by each state. Each of these bridge features is given a rating between 0 and 9 when inspected, with 9 signifying the best condition and a condition rating of 4 or less considered structurally deficient. A structurally deficient bridge requires maintenance and repair. Below are charts depicting probability of unsatisfactory or failure curves of the three components.
Figure D - 4: Base Condition Probability of a Bridge Deck Failure
Figure D - 4 displays the bridge deck failure rate over time. The probability of failure is 1.6% in 2020 and if no major repairs are conducted, the probability of failure increases to 37.4% in 2069.
0%
5%
10%
15%
20%
25%
30%
35%
40%
45%
2020
2022
2024
2026
2028
2030
2032
2034
2036
2038
2040
2042
2044
2046
2048
2050
2052
2054
2056
2058
2060
2062
2064
2066
2068
2070
Probability of a Bridge Deck Failure

Cape Cod Canal Highway Bridges, MA Final Appendix D - Economics Major Rehabilitation Evaluation Report D-19 March 2020
Figure D - 5: Base Condition Probability of a Substructure Failure
Figure D - 5 displays the substructure failure rate overtime. The probability of failure is 0.4% in 2020 and increases to 1.6% in 2069.
Figure D - 6: Base Condition Probability of a Superstructure Failure
Figure D - 6 displays the superstructure failure rate overtime. The probability of failure is 7.9% in 2020 and increases to 64.9% in 2069.
0.0%
0.2%
0.4%
0.6%
0.8%
1.0%
1.2%
1.4%
1.6%
1.8%
2020
2022
2024
2026
2028
2030
2032
2034
2036
2038
2040
2042
2044
2046
2048
2050
2052
2054
2056
2058
2060
2062
2064
2066
2068
2070
Probability of Substructure Failure
0%
10%
20%
30%
40%
50%
60%
70%
80%
2020
2022
2024
2026
2028
2030
2032
2034
2036
2038
2040
2042
2044
2046
2048
2050
2052
2054
2056
2058
2060
2062
2064
2066
2068
2070
Probability of Superstructure Failure

Cape Cod Canal Highway Bridges, MA Final Appendix D - Economics Major Rehabilitation Evaluation Report D-20 March 2020
Probabilistic Scenario Analysis Engineering reliability must be integrated with economic costs to ensure that impacts related to all possible consequences are accurate for final cost-benefit analysis. Event trees are the primary tool used to identify and estimate risk. A logical progression of events flows through the depiction beginning with an initiating event and continuing through a set of outcomes. Probabilities and consequences are assigned to each possible outcome of an event. Outcomes are mutually exclusive and collectively exhaustive. Probabilities of an event must be between 0 and 1 and will sum to 1 for each node.iv
For this study, event trees were designed to predict individual component performance (see Appendix A for detailed engineering reliability analysis). The three bridge components (superstructure, bridge deck, and substructure) were further evaluated for which failures could trigger significant or catastrophic rehabilitation or replacement costs. The failures are described as: bridge deck deterioration, substructure deterioration, and superstructure deterioration. Probabilities of localized or widespread deterioration of each were created through engineering reliability analysis. Resulting action to restore performance from each deterioration scenario is also evaluated. Costs of these repair or replacement scenarios are included in the event tree. For each construction scenario there are additional expected traffic delays due to lane or bridge closures. Costs for closures were calculated (see: traffic analysis Section 3.3) and incorporated into the event tree. The resulting end nodes depict the probability of each event and the total cost which includes the rehabilitation cost and travel delay costs. Event trees were created for each bridge: the Sagamore Bridge and the Bourne Bridge, as well as for each engineering component. The event trees were modeled using Palisade PrecisionTree software and are presented in the following sections.
A rating of 4 or below may trigger the need for a repair, however, the year in which costs are allocated and when the repair work is completed can vary depending a variety of factors including severity and budgetary constraints. If the “failure” is minimal the repair work could take several years for funding to be approved and construction to begin. For more severe failures, emergency funds could be approved and implemented more quickly. A detailed description of the current and historical ratings of the bridge components can be found in Appendix A-Engineering Reliability, section 4.
Given the uncertainty and complexity of predicting when funds and repairs will occur, the economic modeling assumes costs and improvements are triggered in the same year as the component failure. This assumption could overestimate minor failure costs if those were to be delayed for several years as costs are discounted in future years. The impact will not be significant and will not change the final recommendation of this report.
Table D - 7 below summarizes the component failures and the impacts to traffic.

Cape Cod Canal Highway Bridges, MA Final Appendix D - Economics Major Rehabilitation Evaluation Report D-21 March 2020
Table D - 7: Component Failure Impacts
Component and Failure Description
Cost to Repair ($000)
Sagamore Bridge
Cost to Repair ($000)
Bourne Bridge
Traffic Impact
Traffic Cost in 2020 ($000)
Sagamore Bridge
Traffic Cost in 2020 ($000)
Bourne Bridge
Superstructure Advanced deterioration of secondary member, non-critical Gusset Plate, Stringer, Floorbeam, or Hanger Cable
$6,600 $6,200
9 months lane closure - no closures Memorial Day to Columbus Day
$32,700 $21,100
Advanced deterioration of Main Truss Member or Critical Gusset Plate
$15,300 $20,200
18 months lane closures, divert trucks over 16 ton to sister bridge for 12 months
$321,200 $186,200
Catastrophic Damage to Main Truss Member or Critical Gusset Plate
$310,300 $547,700 60 months bridge Closure $10,343,400 $4,584,000
Substructure Localized Concrete Defects such as Cracks or Spalls on Vertical Surfaces of Piers or Degradation of Concrete under Bearings on the Piers
$368 $526
6 months of lane closures, no closures Memorial Day to Columbus Day, lane closures limited to non-peak hours, weekdays
$18,300 $13,400
Widespread Concrete Defects such as Cracks or Spalls on Vertical Surfaces of Piers or Degradation on Concrete under Bearings on the Piers
$737 $1,053
12 months of lane closures, no closures Memorial Day to Columbus Day, Lane Closures limited to non-peak hours, weekdays
$36,600 $26,700
Bridge Deck Localized deterioration of Roadway Joint(s), Granite Curbs, Concrete-filled Steel Grid over Bridge Spans, or Reinforced Concrete Deck at Abutments
$5,100 $5,800
6 months of temporary lane closures, no closures Memorial Day to Columbus Day
$21,800 $14,100
Widespread Deterioration of Concrete-filled Steel Grid Deck over Bridge Spans and Reinforced Concrete Deck at the Abutments
$5,900 $7,600
15 months of temporary lane closures, no closures Memorial Day to Columbus Day
$54,400 $35,200
Sagamore Bridge – Bridge Deck Deterioration Figure D - 7 below depicts the Sagamore Bridge event tree for bridge deck deterioration. The hazard function provides a probability that the bridge will receive a rating of less than or equal to

Cape Cod Canal Highway Bridges, MA Final Appendix D - Economics Major Rehabilitation Evaluation Report D-22 March 2020
4, signaling that there is a component failure. If a failure occurs, there is a probability of 0.8 that there is localized deterioration of the roadway joint(s), granite curbs, concrete-filled steel grid over the bridge spans, or reinforced concrete deck at the abutments. This probability decreases to 0.55 in 2031 and beyond.
This failure scenario initiates a repair project to extend the life of the deficient component(s). Estimated construction costs for this action is $5.1 million. This repair results in 6 months of temporary lane closures on the Sagamore Bridge with no lane closures Memorial Day to Columbus Day triggering a time value cost from traffic delay of $21.8 million in 2020 and will increase over time.
If the bridge is rated at or below 4 under the NBI rating system, there is a probability of 0.2 of widespread deterioration of concrete-filled steel grid deck over bridge spans and reinforced concrete deck at the abutments. This probability increases to 0.45 beyond 2031. In this scenario, a repair project is initiated to replace the bridge deck at a cost of $5.9 million. This repair will require 15 months of temporary lane closures on the Sagamore Bridge with no closures from Memorial Day to Columbus Day at a traffic delay cost of $54.4 million in 2020 and increasing overtime.
Sagamore Bridge – Substructure Deterioration
Figure D - 8 depicts the Sagamore Bridge event tree for substructure deterioration. The hazard function provides a probability that the bridge will receive a rating of less than or equal to 4, signaling that there is a component failure. If a failure occurs there is a probability of 0.9 that there is localized concrete defects such as cracks or spalls on vertical surfaces of piers or degradation of concrete under bearings on the piers. This would initiate a repair project to extend the life of the deficient component(s). Estimated construction costs for this action are $368,000. This repair would result in 6 months of temporary lane closures on the Sagamore Bridge with no lane closures Memorial Day to Columbus Day, lane closures will be limited to Monday through Friday during non-peak hours as well as 14 day closure or delay to marine vessels. This results in a time value cost from traffic delay of $18.3 million in 2020 and $78,400 in navigation costs.

Cape Cod Canal Highway Bridges, MA Final Appendix D - Economics Major Rehabilitation Evaluation Report D-23 March 2020
Figure D - 7: Sagamore Bridge Deck Deterioration Event Tree

Cape Cod Canal Highway Bridges, MA Final Appendix D - Economics Major Rehabilitation Evaluation Report D-24 March 2020
If the bridge is rated at or below 4 under the NBI rating system, there is a probability of 0.1 of widespread deterioration of defects such as cracks and spalls on vertical surfaces of piers or degradation of concrete under bearings on the piers. In this scenario, a repair project is initiated to extend the service life of the deficient component(s) at a cost of $737,000. This will require 12 months of temporary lane closures on the Sagamore Bridge with no closures from Memorial Day to Columbus Day, lane closures are limited to Monday through Friday during non-peak hours, as well as 28 day closure or delay to marine vessels. This comes at a traffic delay cost of $36.6 million in 2020 and $156,800 in navigation costs.
Sagamore Bridge – Superstructure Deterioration
Figure D - 9 depicts the Sagamore Bridge event tree for superstructure deterioration. The hazard function provides a probability that the bridge will receive a rating of less than or equal to 4, signaling that there is a component failure. If a failure occurs there is a probability of 0.9 between 2020 to 2030 and 0.70 in years 2031 and beyond that there is advanced deterioration of secondary member, non-critical gusset plate, stringer, floorbeam, or hanger cable. This would initiate a repair project to extend the life of the deficient component(s). Estimated construction costs for this action is $6.6 million. This repair would result in 9 months of temporary lane closures on the Sagamore Bridge with no lane closures Memorial Day to Columbus Day. This results in a time value cost from traffic delay of $32.6 million in 2020.
If the bridge is rated at or below 4 under the NBI rating system, there is a probability of 0.0999 of advanced deterioration of main truss member or critical gusset plate from 2020 to 2030 and a probability 0.299 for the same occurrence in years 2031 and beyond. In this scenario, a repair project is initiated to extend the service life of deficient component(s) at a cost of $15.3 million and there will be temporary load restriction of 16 tons until corrective action is taken. Trucks will be diverted to the Bourne Bridge. This will require 18 months of temporary lane closures on the Sagamore Bridge with 12 months of restrictive load postings at a total cost of $321.2 million in 2020.
Finally, if the bridge is deemed in poor condition, there is a probability of 0.0001 of catastrophic damage to the main truss member or critical gusset plate in years 2020 to 2030 and 0.001 in years 2031 and beyond. This will result in permanent closure of the Sagamore Bridge to initiate construction of a new bridge at a total cost of $310.3 million. Traffic will be delayed for 60 months for design and construction of the new bridge at a total travel cost of $10.3 billion in 2020 and navigation costs of $168,000 due to 30 days of closures to the canal.

Cape Cod Canal Highway Bridges, MA Final Appendix D - Economics Major Rehabilitation Evaluation Report D-25 March 2020
Figure D - 8: Sagamore Bridge Substructure Deterioration Event Tree

Cape Cod Canal Highway Bridges, MA Final Appendix D - Economics Major Rehabilitation Evaluation Report D-26 March 2020
Figure D - 9: Sagamore Superstructure Deterioration Event Tree

Cape Cod Canal Highway Bridges, MA Final Appendix D - Economics Major Rehabilitation Evaluation Report D-27 March 2020
Bourne Bridge Deck Deterioration Figure D - 10 below depicts the Bourne Bridge event tree for bridge deck deterioration. The hazard function provides a probability that the bridge will receive a rating of less than or equal to 4, signaling that there is a component failure. If a failure occurs there is a probability of 0.8 that there is localized deterioration of the roadway joint(s), granite curbs, concrete-filled steel grid over the bridge spans, or reinforced concrete deck at the abutments. The probability decreases to 0.55 in 2031 and beyond. This would initiate a repair project to extend the life of the deficient component(s). Estimated construction costs for this action is a cost of $5.8 million. This repair would result in 6 months of temporary lane closures on the Bourne Bridge with no lane closures Memorial Day to Columbus Day resulting and a time value cost from traffic delay of $14.1 million in 2020 and increasing over time.
If the bridge is rated at or below 4 under the NBI rating system, there is a probability of 0.2 of widespread deterioration of concrete-filled steel grid deck over bridge spans and reinforced concrete deck at the abutments. This probability increases to 0.45 in 2031 and beyond. In this scenario, a repair project is initiated to replace the damaged section of the bridge deck at a cost of $7.6 million. This repair will require 15 months of temporary lane closures on the Bourne Bridge with no closures from Memorial Day to Columbus Day at a traffic delay cost of $35.2 million in 2020 and increasing through 2069.
Bourne Bridge – Substructure Deterioration Figure D - 11 depicts the Bourne Bridge event tree for substructure deterioration. The hazard function provides a probability that the bridge will receive a rating of less than or equal to 4, signaling that there is a component failure. If a failure occurs there is a probability of 0.9 that there is localized concrete defects such as cracks or spalls on vertical surfaces of piers or degradation of concrete under bearings on the piers. This would initiate a repair project with estimated construction costs of $526,000. This repair would result in 6 months of temporary lane closures on the Bourne Bridge with no lane closures Memorial Day to Columbus Day, lane closures will be limited to Monday through Friday during non-peak hours as well as 14 day closure or delay to marine vessels. This results in a time value cost from traffic delay of $13.4 million in 2020 and $78,400 in navigation costs.
If the bridge is rated at or below 4 under the NBI rating system, there is a probability of 0.1 of widespread deterioration of defects such as cracks and spalls on vertical surfaces of piers or degradation of concrete under bearings on the piers. In this scenario, a repair project is initiated to extend the service life of the deficient component(s) at a cost of $1.1 million. This will require 12 months of temporary lane closures on the Bourne Bridge with no closures from Memorial Day to Columbus Day, lane closures are limited to Monday through Friday during non-peak hours, as well as 28 day closure or delay to marine vessels. This comes at a traffic delay cost of $26.7 million in 2020 and $156,800 in navigation costs.

Cape Cod Canal Highway Bridges, MA Final Appendix D - Economics Major Rehabilitation Evaluation Report D-28 March 2020
Figure D - 10: Bourne Bridge Deck Deterioration Event Tree

Cape Cod Canal Highway Bridges, MA Final Appendix D - Economics Major Rehabilitation Evaluation Report D-29 March 2020
Figure D - 11: Bourne Bridge Substructure Deterioration Event Tree
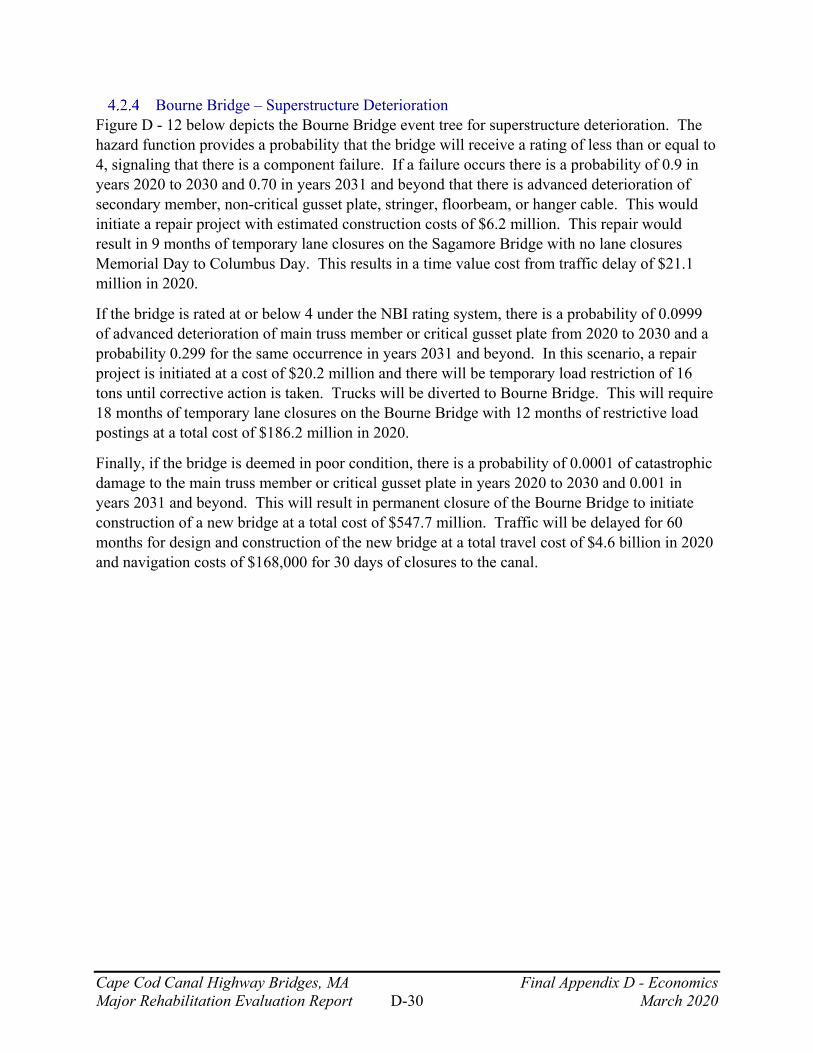
Cape Cod Canal Highway Bridges, MA Final Appendix D - Economics Major Rehabilitation Evaluation Report D-30 March 2020
Bourne Bridge – Superstructure Deterioration Figure D - 12 below depicts the Bourne Bridge event tree for superstructure deterioration. The hazard function provides a probability that the bridge will receive a rating of less than or equal to 4, signaling that there is a component failure. If a failure occurs there is a probability of 0.9 in years 2020 to 2030 and 0.70 in years 2031 and beyond that there is advanced deterioration of secondary member, non-critical gusset plate, stringer, floorbeam, or hanger cable. This would initiate a repair project with estimated construction costs of $6.2 million. This repair would result in 9 months of temporary lane closures on the Sagamore Bridge with no lane closures Memorial Day to Columbus Day. This results in a time value cost from traffic delay of $21.1 million in 2020.
If the bridge is rated at or below 4 under the NBI rating system, there is a probability of 0.0999 of advanced deterioration of main truss member or critical gusset plate from 2020 to 2030 and a probability 0.299 for the same occurrence in years 2031 and beyond. In this scenario, a repair project is initiated at a cost of $20.2 million and there will be temporary load restriction of 16 tons until corrective action is taken. Trucks will be diverted to Bourne Bridge. This will require 18 months of temporary lane closures on the Bourne Bridge with 12 months of restrictive load postings at a total cost of $186.2 million in 2020.
Finally, if the bridge is deemed in poor condition, there is a probability of 0.0001 of catastrophic damage to the main truss member or critical gusset plate in years 2020 to 2030 and 0.001 in years 2031 and beyond. This will result in permanent closure of the Bourne Bridge to initiate construction of a new bridge at a total cost of $547.7 million. Traffic will be delayed for 60 months for design and construction of the new bridge at a total travel cost of $4.6 billion in 2020 and navigation costs of $168,000 for 30 days of closures to the canal.
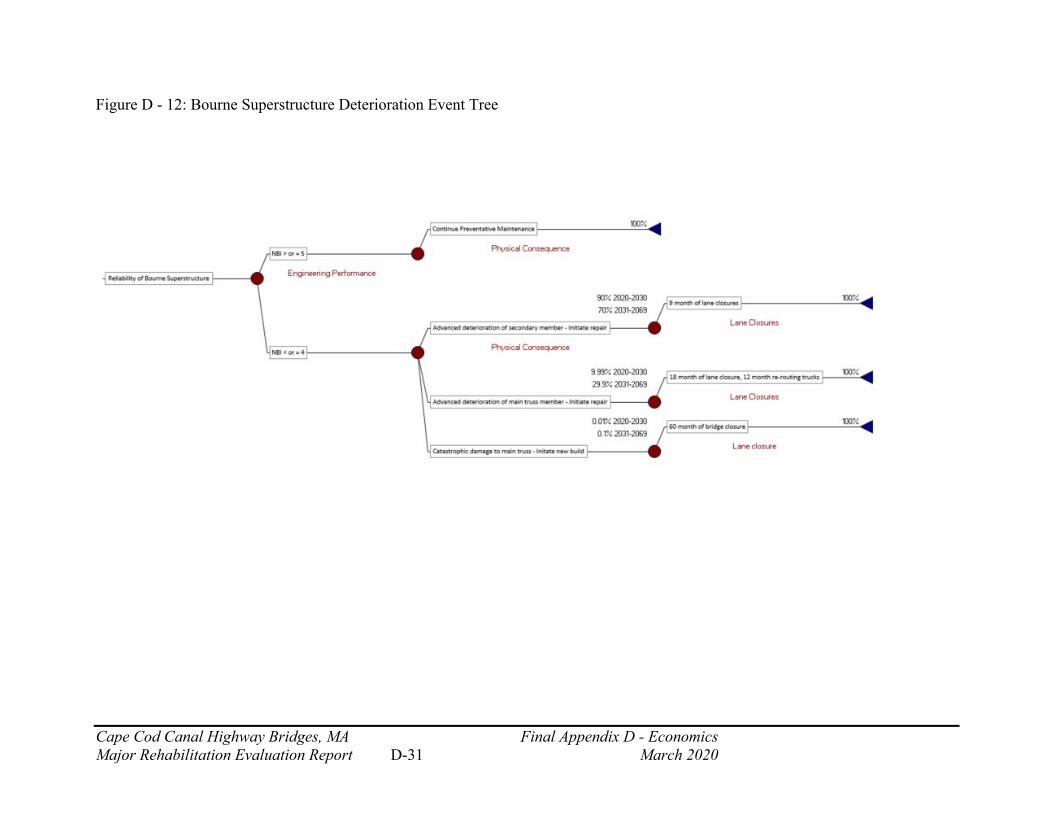
Cape Cod Canal Highway Bridges, MA Final Appendix D - Economics Major Rehabilitation Evaluation Report D-31 March 2020
Figure D - 12: Bourne Superstructure Deterioration Event Tree

Cape Cod Canal Highway Bridges, MA Final Appendix D - Economics Major Rehabilitation Evaluation Report D-32 March 2020
Traffic Analysis The Sagamore and Bourne Bridges provide the only access to Cape Cod for travelers in automobiles. Therefore traffic restrictions during construction projects will likely disrupt the local economy. Lane or total bridge closures are required when construction is performed on one or both of the bridges. This occurs in the event of emergency maintenance after a component failure. Commuters and travelers over the bridges will experience a loss of time due to traffic delays. Following Guidance from ER 1105-2-100 Appendix D, Table D-4; a value is determined for this loss of time incurred.
Traffic Data Collection The Massachusetts Department of Transportation (MassDOT) is conducting a Cape Cod Canal Transportation Study to examine current traffic conditions in the area surrounding the Sagamore and Bourne Bridges. The Army Corps of Engineers worked with a contractor, TrafInfo, to collect this data for existing traffic conditions (2014) and future conditions (2040) matching the MassDOT framework. TrafInfo designed a regional travel demand model using TransCAD, a modeling software which simulates traffic volumes at various times of the day in the existing and future conditions with partial lane closures and full bridge closures.
The study area of the traffic analysis is comprised of the Bourne and Sagamore Bridges as well as the seven major connecting routes. More specifically, the routes which are depicted in Figure D - 13, include:
Between Bridges (East to West) • Scenic Highway (Route 6): from Route 28 on/off ramps to Route 3 (where Route 6 and
Route 3 merge to go over the Sagamore bridge), both directions • Sandwich Road: from Bourne Rotary (the intersection between Sandwich Road and Route
28) to Route 6 ramps, both directions North Bourne Rotary (Belmont Circle) • Buzzards Bay Bypass (Route 6 and 28): from Glen Charlie Road in Wareham to the Route
28 on-ramp, eastbound Bourne Bridge Entrances • Route 25: From Exit 2 on Route 25 (Glen Charlie Road in Wareham) to the entrance of the
Bourne Bridge, southbound • Route 28: From Route 151 (Nathan Ellis Highway in Falmouth) to the entrance of the
Bourne Bridge, northbound Bourne Bridge • The bridge itself south and northbound

Cape Cod Canal Highway Bridges, MA Final Appendix D - Economics Major Rehabilitation Evaluation Report D-33 March 2020
Sagamore Bridge Entrances • Route 3: from Exit 2 (Herring Pond Road in Plymouth) to the entrance of the Sagamore
Bridge, southbound • Pilgrims Highway (Route 3 and 6): from Exit 2 (Forestdale Road/Route 130 in Sandwich)
to the entrance of the Sagamore, northbound Sagamore Bridge • The bridge itself, south and northbound
Figure D - 13: Traffic Routes
Data was extracted for weekdays (WD) and weekends (WE) for three seasons- summer, fall and winter during four daily time periods-morning (6AM-9AM; called AM), mid-day (9AM-3PM; called MD), afternoon (3PM-6PM; called PM) and night time (6PM-6AM; called NT). The model was run and data extracted under the conditions that there are full and partial lane closures for the Sagamore Bridge with no restrictions for the Bourne Bridge and vice versa. By definition, partial lane closure is described as passage of vehicles in one lane in each direction (2 lanes total) over the bridge identified under repair. While, full lane closure constitutes no

Cape Cod Canal Highway Bridges, MA Final Appendix D - Economics Major Rehabilitation Evaluation Report D-34 March 2020
vehicular traffic passage (0 lanes total) on the bridge identified under repair. The term “Open” denotes no lane closures associated with rehabilitation activities.
The original MassDOT Canal Transportation Study collected traffic data representative of summer and fall seasons, however TrafInfo modeled traffic conditions during the winter months (specifically January). Winter traffic modeling was calibrated using values input from existing data (MassDOT Canal Transportation Study and other data available through MassDOT’s Traffic Collection Data Unit). Winter traffic volume and travel times were input for the four daily time periods, as well as weekends.
Conditions with No Traffic Impediments Cape Cod is a vacation destination in the summer months, meaning the volume of traffic increases in the summer, particularly on weekends as visitors travel on and off the Cape.
Figure D - 14 displays the average daily traffic by season and day of the week (weekday or weekend). The volume of traffic is expected to increase over the forecast horizon and traffic will be at its maximum on summer weekends. Future traffic trends for visitors were projected based on data on employment trends in the Accommodations and Food Services and through discussions with the Cape Cod Commission. Future trends in non-visitor trips were escalated using population, household, and employment data.
Figure D - 14: Average Daily Volume of Traffic
Travelers over the Sagamore and Bourne bridges use 11 major routes. The 11 routes are:
1. From the mainland Route 3 to Cape Cod Route 6 via the Sagamore Bridge (2.8 miles) 2. From the mainland Route 25 to Cape Cod Route 6 via the Bourne Bridge (9.9 miles) 3. From the mainland Route 25 to Cape Cod Route 6 via the Sagamore Bridge (9.9 miles) 4. From the mainland Route 25 to Cape Cod Route 28 via the Bourne Bridge (6.9 miles) 5. From Cape Cod Route 28 to the mainland Route 25 via the Bourne Bridge (4.7 miles)
-
5,000
10,000
15,000
20,000
25,000
30,000
35,000
40,000
Fall Weekday Fall Weekend SummerWeekday
SummerWeekend
WinterWeekday
WinterWeekend
Average Daily Volume of Traffic
2014 2040

Cape Cod Canal Highway Bridges, MA Final Appendix D - Economics Major Rehabilitation Evaluation Report D-35 March 2020
6. From Cape Cod Route 6 to the mainland Route 25 via the Sagamore Bridge (10.3 miles) 7. From Cape Cod Route 6 to the mainland Route 25 via the Bourne Bridge (7.4 miles) 8. From Cape Cod Route 6 to the mainland Route 3 via the Sagamore Bridge (4.2 miles) 9. From the mainland Belmont Circle to Cape Cod Route 6 via the Bourne Bridge (8.0
miles) 10. From the mainland Belmont Circle to Cape Cod Route 6 via the Sagamore Bridge (8.0
miles) 11. From the mainland Belmont Circle to Cape Cod Route 28 via the Bourne Bridge(5.0
miles)
The average travel time for a driver going over either the Sagamore Bridge or Bourne Bridge using one of the 11 routes described above is exhibited in Table D-7 below. Note that this includes only the length of the routes described (average 7.6 miles directly correlated to bridge traffic) not the total travel time drivers experience over their entire journey.
Table D - 8: Average Travel Time of Major Routes
Average Travel Time (Minutes) Fall Weekday Fall Weekend AM MD PM NT AM MD PM NT Base Condition - 2014 9.5 9.0 9.8 8.9 9.1 9.2 9.6 8.9
Base Condition - 2040 9.9 9.1 10.4 9.0 9.3 9.5 10.6 9.2
Summer Weekday Summer Weekend AM MD PM NT AM MD PM NT Base Condition - 2014 9.8 9.5 10.2 9.0 10.0 15.2 14.7 9.3
Base Condition - 2040
10.5 10.1 11.4 9.4 10.7 19.2 19.5 10.3
Winter Weekday Winter Weekend AM MD PM NT AM MD PM NT Base Condition - 2014 9.7 8.9 9.5 8.8 8.9 9.0 9.1 8.8
Base Condition - 2040 10.1 8.9 9.9 8.9 9.0 9.0 9.4 8.9
MD = midday; NT = night time Weekend=Saturday and Sunday
Value of Time with Traffic Impediments
The data collected and modeled by TrafInfo is used to determine the value of time due to traffic delays. The event trees described in section 3.2 outline probabilities of unsatisfactory performance by bridge component. Associated with each unsatisfactory performance is a resulting repair project to restore performance. The repair projects require lane or total bridge

Cape Cod Canal Highway Bridges, MA Final Appendix D - Economics Major Rehabilitation Evaluation Report D-36 March 2020
closures. Therefore the value of time for individuals adversely affected by traffic delays is determined by the amount of time bridges and lanes are closed. The procedure for this calculation follows guidance from USACE Engineering Regulation - ER 1105-2-100, Appendix D.
Outputs from TrafInfo Used in Risk Analysis Model One output from Trafinfo that is an input into the risk model is Vehicle Hours Traveled (VHT) for all vehicles in a given time period by season and day of the week (weekday or weekend). VHT is also provided for the existing condition and for lane and full bridge closures of each bridge. The data is provided for year 2014 and a forecast year of 2040, intermediate values were linearly interpolated and years after 2040 were held constant. Values were held constant after 2040 to provide a conservative estimate of traffic growth and to prevent a forecast that could reflect traffic volumes higher than the maximum capacity of the road network.
VHT is also separated by the driver’s trip purpose, either Visitor or Regular as defined by the State Planning Agency-Central Transportation Planning Staff (CTPS). Based on the 2010 Census Journey to Work and the Massachusetts Travel Survey, Visitor and Regular are defined as:
• Non-visitor or “Regular” – Trips by people who live on the Cape and commute to the mainland daily for work/school; trips by people who live on the mainland and commute to the Cape daily for work/school; trips by people who live on the Cape and travel across the bridge to the mainland to shop and other commercial activities on a regular basis; trips by people who live on the mainland and travel across the bridge to the Cape to shop and for other commercial activities on a regular basis.
• Visitor – all other travelers, they generally do not live or work on the Cape and do not otherwise cross the bridge on a regular daily basis.
The next traffic analysis input is the average travel time in minutes which is the travel time for a driver going over either the Sagamore Bridge or Bourne Bridge over the 11 major routes listed in section 3.3.2. Travel times vary depending on whether there is a partial bridge closure (one lane closed on either side) or full bridge closure (all lanes closed). The difference between lane or bridge closure and non-closure traffic is a key input in determining the value of time in traffic. TrafInfo provided these travel times for years 2014 and 2040, linear interpolation was used for years 2015-2039 and held constant for years 2040-2069. Again, values were held constant after 2040 to provide a conservative estimate of traffic growth and to prevent a forecast that could reflect traffic volumes higher than the maximum capacity of the road network.

Cape Cod Canal Highway Bridges, MA Final Appendix D - Economics Major Rehabilitation Evaluation Report D-37 March 2020
Table D - 9: Average Travel Time by Closure 2014
Average Travel Time in 2014 (Minutes) Fall Summer Winter Alternatives Weekday Weekend Weekday Weekend Weekday Weekend Existing Hwy 9.3 9.2 9.6 12.3 9.3 9.0 Partial Bourne 12.3 12.3 14.5 25.5 12.1 10.3 Full Bourne 16.6 15.7 20.8 37.0 16.3 13.0 Partial Sagamore 9.8 9.5 11.7 30.5 9.9 9.0 Full Sagamore 19.1 18.5 40.0 77.6 18.0 12.5 Difference (min) Alternatives Weekday Weekend Weekday Weekend Weekday Weekend Existing Hwy - - - - - - Partial Bourne 3.0 3.1 4.9 13.2 2.8 1.4 Full Bourne 7.3 6.5 11.2 24.8 7.1 4.0 Partial Sagamore 0.5 0.3 2.1 18.2 0.6 0.0 Full Sagamore 9.8 9.3 30.4 65.3 8.7 3.5
Table D - 10: Average Travel Time by Closure 2040
Average Travel Time in 2040 (Minutes) Fall Summer Winter Alternatives Weekday Weekend Weekday Weekend Weekday Weekend Existing Hwy 9.6 9.6 10.3 14.9 9.5 9.1 Partial Bourne 15.8 23.5 61.8 85.2 21.9 11.4 Full Bourne 25.2 26.2 53.5 76.1 27.4 16.6 Partial Sagamore 31.5 32.3 85.3 106.2 31.2 10.8 Full Sagamore 47.8 58.8 125.6 177.2 59.8 29.6 Difference (min) Alternatives Weekday Weekend Weekday Weekend Weekday Weekend Existing Hwy - - - - - - Partial Bourne 6.2 13.9 51.5 70.3 12.4 2.4 Full Bourne 15.6 16.6 43.2 61.2 17.9 7.5 Partial Sagamore 21.9 22.7 75.0 91.3 21.7 1.7 Full Sagamore 38.2 49.2 115.3 162.2 50.4 20.5

Cape Cod Canal Highway Bridges, MA Final Appendix D - Economics Major Rehabilitation Evaluation Report D-38 March 2020
Value of Time Inputs The calculated dollar value of time is based on several inputs including: median family income, passengers per vehicle, and the reason for travel. Hourly annual income is calculated using the average annual household income sourced from the U.S. Census then divided by the number of weeks in the year (52 weeks per year) and by the hours worked in a week (assuming 40 hours per week).
• Median family income: o Visitors – used the Massachusetts average household income of $70,954 (in 2016
dollars), 2012-2016, sourced from the U.S. Census. v o Regulars – used the average household income of the towns surrounding Cape Cod:
Bourne ($70,304), Sandwich ($89,461), Wareham ($65,641), and Plymouth ($80,905) for a total average of $76,578, sourced from the U.S. Census.
• Following the process described in ER 1105-2-100 (D-20), the total value of worked time saved per vehicle requires multiplication by the adults per car. According to the US Department of Transportation, 2001 National Household Travel Survey, average passengers per vehicle for work trips is 1.14.vi For social/recreation, vacation, and other trips, the value of time saved is on a per vehicle basis.
• Value of time saved adjusted to hourly basis (% of hourly family income of driver) from ER 1105-2-100 (D-20). Table D-10 summarizes the percent of hourly income used.
The following table from ER1105-2-100 was used as guidance:
Table D - 11: Percent of Hourly Income and Hourly Value of Time ($/hour)
Massachusetts average hourly income ($/hour)
Average hourly income ($/hour) -
Bourne, Sandwich, Wareham, Plymouth
Value of time saved % of
hourly family income
Low time (0-5 min) Work Trips $ 2.18 $ 2.36 6.4% Soc/rec Trips $ 0.44 $ 0.48 1.3% Other Trips $ 0.03 $ 0.04 0.1% Medium time (5-15 min) Work Trips $ 10.98 $ 11.85 32.2% Soc/rec Trips $ 7.88 $ 8.50 23.1% Other Trips $ 4.95 $ 5.34 14.5% High time (over 15 mins) Work Trips $ 18.35 $ 19.81 53.8% Soc/rec Trips $ 20.47 $ 22.09 60.0% Other Trips $ 22.00 $ 23.75 64.5% Vacation All value of time $ 25.62 $ 27.65 75.1%

Cape Cod Canal Highway Bridges, MA Final Appendix D - Economics Major Rehabilitation Evaluation Report D-39 March 2020
Visitor value of time is the average of social/recreational trips, other trips, and vacation using the Massachusetts household income. “Other trips” include all trips not otherwise determined to be work, social/recreational, or vacation. Regular value of time was determined to be the average of social/recreational, other, and work (multiplied by 1.14 for occupancy) for the average of Bourne, Sandwich, Wareham, and Plymouth.
Using those calculations, the following value of time totals were determined (in 2016 dollars) at an hourly rate:
Table D - 12: Value of Time per Hour by Trip Type in 2016 Dollars
Visitors Regulars Low $ 8.70 $ 1.07 Medium $ 12.82 $ 9.12 High $ 22.70 $ 22.81
Travel time for vacation is a higher cost because there is a scarcity factor for the amount of vacation time households have and therefore the value of an hour of vacation time is higher than for work, social/recreation, and other trips. The regular travelers caught in relatively short traffic delays is pointedly lower because this time is not considered scarce.
The computed 2016 value of time is then converted into 2020 dollars using the implicit GDP deflator as forecasted by the President’s budget office and presented in Table D - 13 belowvii.
Table D - 13: GDP Deflator
2015 2016 2017 2018 2019 2020 Nominal GDP $18,037 $18,566 $19,372 $20,262 $21,263 $22,345 Real GDP (2009 Dollars) $16,397 $16,660 $17,090 $17,601 $18,157 $18,727
Implicit Deflator 1.10 1.11 1.13 1.15 1.17 1.19
Value of time in 2020 dollars: Table D - 14: Value of Time per hour by Trip Type in 2020 Dollars
Visitors Regulars Low $ 9.31 $ 1.14 Medium $ 13.72 $ 9.76 High $ 24.30 $ 24.42

Cape Cod Canal Highway Bridges, MA Final Appendix D - Economics Major Rehabilitation Evaluation Report D-40 March 2020
Value of Time Due to Traffic Delays The following calculations were performed in order to determine the total travel costs incurred by drivers when there is a lane or bridge closure for construction repair.
1. VHTdelay x VOT = Cost of Delay per Day (by day and season) 2. Cost of Delay per Day x Days of Closure = Total Travel Costs
• VHTdelay = VHT with lane or bridge closure – VHT with no closure for all drivers (available by year, season, time of day, weekend/weekday, visitor/regular)
• VOT = Value of time (uses the values determined in Table D - 14 above. The high/medium/low times categories are determined by taking the Travel Time with closures minus the Travel Time with no closures to determine the average delay.
• Days of Closure – number of days during construction that there will be a lane or bridge closure which varies by project
Table D - 15: Cost of Emergency Repairs
Component and Failure Description Traffic Impact
Cost in 2020 (000)
Sagamore Bridge
Cost in 2020 (000) Bourne
Bridge
Superstructure Advanced deterioration of secondary member, non-critical Gusset Plate, Stringer, Floorbeam, or Hanger Cable
9 months lane closure - no closures Memorial Day to Columbus Day
$32,700 $21,100
Advanced deterioration of Main Truss Member or Critical Gusset Plate
18 months lane closures, divert trucks over 16 ton to sister bridge for 12 months *
$321,200 $186,200
Catastrophic Damage to Main Truss Member or Critical Gusset Plate
60 months bridge Closure $10,343,400 $4,584,000
Substructure
Localized Concrete Defects such as Cracks or Spalls on Vertical Surfaces of Piers or Degradation of Concrete under Bearings on the Piers
6 months of lane closures, no closures Memorial Day to Columbus Day, lane closures limited to non-peak hours, weekdays
$18,300 $13,400

Cape Cod Canal Highway Bridges, MA Final Appendix D - Economics Major Rehabilitation Evaluation Report D-41 March 2020
Widespread Concrete Defects such as Cracks or Spalls on Vertical Surfaces of Piers or Degradation on Concrete under Bearings on the Piers
12 months of lane closures, no closures Memorial Day to Columbus Day, Lane Closures limited to non-peak hours, weekdays
$36,600 $26,700
Bridge Deck Localized deterioration of Roadway Joint(s), Granite Curbs, Concrete-filled Steel Grid over Bridge Spans, or Reinforced Concrete Deck at Abutments
6 months of temporary lane closures, no closures Memorial Day to Columbus Day
$21,800 $14,100
Widespread Deterioration of Concrete-filled Steel Grid Deck over Bridge Spans and Reinforced Concrete Deck at the Abutments
15 months of temporary lane closures, no closures Memorial Day to Columbus Day
$54,400 $35,200
* According to MassDOT trucks account for roughly 6% of traffic traveling over the bridges. Therefore 6% of traffic was rerouted as if full bridge closure for 12 months. Further detail provided in section 10.1.6.
Vehicle Operational Costs Additional travel costs incurred by delay are considered vehicle operational costs. Operational costs are expenditures spent on operating and maintaining a vehicle for additional usage. Costs include fuel, maintenance, repairs, and depreciation to vehicle valueviii. Operating cost used in this model is $0.57 per mile; the 2016 cost of owning and operating an auto sourced from the American Automobile Association. The computed 2016 value of time is then converted into 2020 dollars using the implicit GDP deflator as forecasted by the President's budget office.
If there is a required full bridge closure to repair a component failure, commuters may need to travel further to the other canal bridge incurring additional mileage. The operational cost was determined by subtracting the Vehicle Miles Traveled (VMT) when there is no closure from the VMTs traveled when there is a closure to determine the additional miles traveled. These miles were multiplied by $0.57.
Impacts to Navigation The Cape Cod Canal is a key transportation link for vessel traffic transiting the US east coast, between southern New England, New York, or points south, and Boston, northern New England, and points north. Without the canal, vessels would have to transit around the arm of Cape Cod, increasing vessel travel distances by approximately 60 nautical miles, an 18 percent increase for vessels traveling between New York and Boston. Each year the canal is used by more than

Cape Cod Canal Highway Bridges, MA Final Appendix D - Economics Major Rehabilitation Evaluation Report D-42 March 2020
1,000 cargo vessels, at least 400 fishing vessels, 150 – 200 military vessels, and more than 4,000 recreational vessels, all of which benefit significantly from the shorter and safer travel route. Since its completion in 1914, the canal has greatly increased the efficiency of waterborne commerce shipments in the Northeast, contributing greatly to the national economy. The Canal also increases navigation safety. Prior to construction of the Canal, many shipwrecks occurred along the route around the Cape, since fog, shoals and exposure to bad weather are significantly worse in the areas off Cape compared to the interior. The navigation benefits provided by the canal are extremely important to the economies of Massachusetts, New Hampshire, and Maine, with critical shipments of petroleum products making up the majority of cargo traffic through the canal, and with vessels of all types benefiting from the shorter and safer transit route.
Vessel Trips Canal Records Records of vessel trips through the Cape Cod Canal are kept at the canal office. The data collected at the canal shows the number of vessels with a length of 65-feet or greater of various types, as well as estimates for the number of vessels under 65-feet. Table D - 16 below presents the wide range of vessel types and sizes of approximately 22,000 vessels that transited the canal between 2013 and 2018.
Table D - 16: Number of Vessels transiting Cape Cod Canal
Vessels Over 65 Feet in Length 2013 2014 2015 2016 2017 2018
Passenger, Dry Cargos 1,025 1,084 1,043 1,063 1,064 1,102
Tankers 55 34 15 39 49 68
Towing Vessels 3,191 3,407 3,242 3,293 3,057 3,225
Dry Cargos, Scows 384 330 294 308 238 265
Tanker Barges 1,302 1,270 1,225 1,249 1,259 1,334
Fishing Vessels 780 756 811 848 877 492
Yachts 684 680 726 665 695 720
Military Vessels 147 202 169 223 156 165
Others 90 83 145 210 88 74
TOTAL 7,658 7,846 7,670 7,898 7,483 7,445
Vessels Under 65 Feet in Length (Estimated) 2013 2014 2015 2016 2017 2018
Fishing Vessels 139 225 333 308 344 422
Pleasure Craft 4,205 4,458 5,580 7,304 7,380 7,911
Misc. Vessels 5,483 6,397 6,089 3,804 5,798 5,985
TOTAL 9,827 11,080 12,002 11,416 13,522 14,318

Cape Cod Canal Highway Bridges, MA Final Appendix D - Economics Major Rehabilitation Evaluation Report D-43 March 2020
WCSC Cargo Records The Army Corps of Engineers Waterborne Commerce Statistics Center (WCSC) publishes data showing vessel trips. The WCSC data reflects only cargo vessels, so the figures are not directly comparable to the vessel data collected at the canal office. However, both sets of data are valuable and so both are presented in this report to show the full usage of the Canal for navigation. From 2012 through 2017 (latest data available as of August 2019), foreign flag commercial cargo vessel trips peaked in 2013 with fewer trips in 2014 - 2017. Traffic on US-flag vessels declined at a compound annual rate of -2% over the six years, versus -30% for foreign traffic. Cargo vessel trips through the canal are shown in the table below.
Table D - 17: Cargo Vessel Trips 2012-2017
Cape Cod Canal Cargo Vessel Trips, 2012-2017
Year Upbound Trips Downbound Trips Total Trips
Foreign Domestic Total Foreign Domestic Total Foreign Domestic Total
2012 1,328 721 2,049 1,324 522 1,846 2,665 1,243 3,908 2013 1,693 868 2,561 1,739 513 2,252 3,432 1,381 4,813 2014 701 878 1,579 740 534 1,274 1,441 1,412 2,853 2015 107 804 911 179 528 707 286 1,332 1,618 2016 141 939 1,080 129 627 756 270 1,566 1,836 2017 168 683 851 140 441 581 308 1,124 1,432
Commodity Statistics Types and Tonnage WCSC publishes annual statistics showing commodity volumes and commercial cargo vessel trips to major ports, and through major waterways including the Cape Cod Canal. An average of 7,800,000 tons of cargo were shipped through the Canal annually between 2012 and 2017. Commodity shipments through the Canal have been dominated primarily by petroleum and petroleum products, which accounted for 83.9% of all freight tonnage in 2017. Chemicals were the next largest category at 11.6%, followed by primary manufactured goods at 2.8%. Together, these top three categories accounted for 98.3% of total freight tonnages in 2017, the most recent year for which WCSC data is available.
Petroleum and petroleum products shipped through the canal declined by a compound annual rate of 5.4% from 2012 to 2017, with a gain in the first year followed by large declines in 2014 and 2015 and finally a slight increase in 2016 before declining again in 2017. Chemical traffic increased annually in 2014, 2015, and 2016 before declining in 2017. Total freight traffic declined at a rate of 5.9% compounded annually from 2012 to 2017, with a drop-off starting in 2014 that was largely due to sluggish traffic in the petroleum segment. Cargo volumes through the canal for the past six years are shown in the table below.

Cape Cod Canal Highway Bridges, MA Final Appendix D - Economics Major Rehabilitation Evaluation Report D-44 March 2020
Table D - 18: Cape Cod Freight Traffic, 2012-2017
Cape Cod Freight Traffic, 2012-2017
2012 2013 2014 2015 2016 2017
Commodity Short tons
% total
Short tons
% total
Short tons
% total
Short tons
% total
Short tons
% total
Short tons
% total
Petroleum & petroleum products
7,113,000 81.2% 8,657,000 85.3% 6,484,000 80.7% 5,365,000 77.2% 5,409,000 78.7% 5,097,000 83.9%
Chemicals 812,000 9.3% 743,000 7.3% 1,015,000 12.6% 1,119,000 16.1% 1,126,000 16.4% 703,000 11.6% Crude materials 286,000 3.3% 155,000 1.5% 66,000 0.8% 49,000 0.7% 15,000 0.2% 39,000 0.6%
Primary manufactured goods
365,000 4.2% 394,000 3.9% 391,000 4.9% 355,000 5.1% 246,000 3.6% 168,000 2.8%
Food & farm products 2,000 0.0% 13,000 0.1% 6,000 0.1% - 0.0% - 0.0% 4,000 0.1%
Manufactured equipment & machinery
174,000 2.0% 141,000 1.4% 73,000 0.9% 63,000 0.9% 36,000 0.5% 63,000 1.0%
Coal 10,000 0.1% 45,000 0.4% - 0.0% - 0.0% 43,000 0.6% - 0.0%
TOTAL 8,762,000 100.0% 10,148,000 100.0% 8,035,000 100.0% 6,951,000 100.0% 6,875,000 100.0% 6,074,000 100.0%
Source: US Army Corps of Engineers, Waterborne Commerce of the United States, 2012-2017
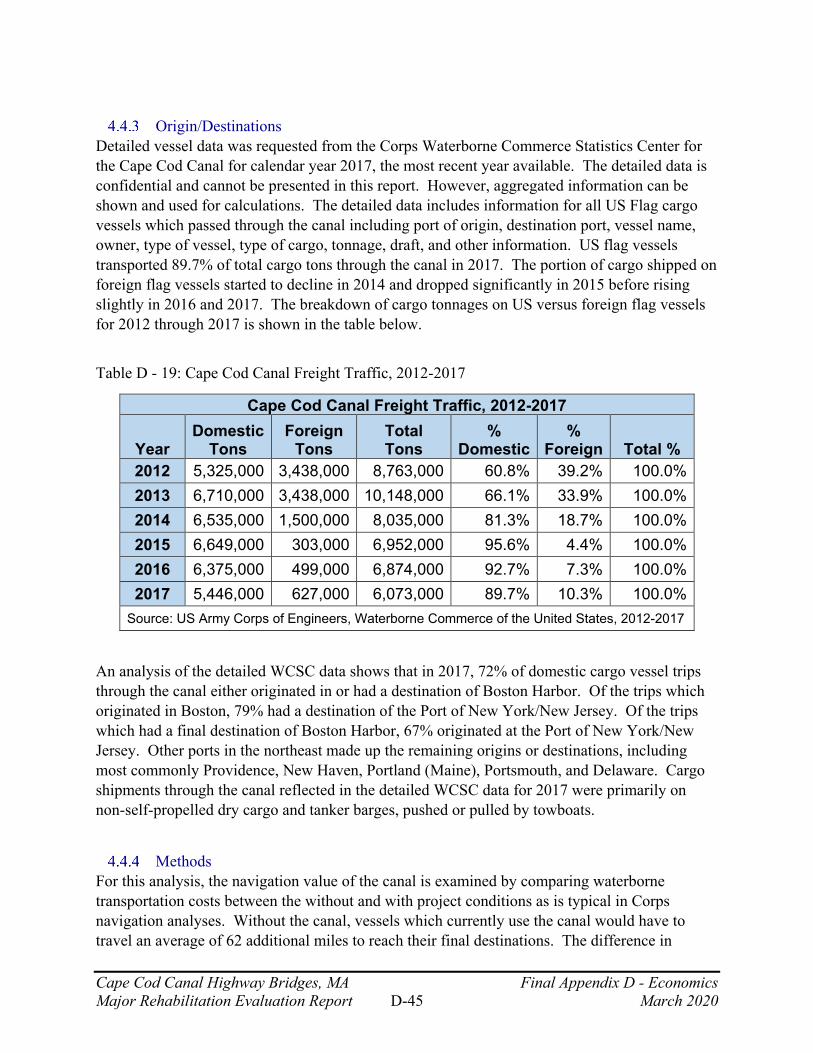
Cape Cod Canal Highway Bridges, MA Final Appendix D - Economics Major Rehabilitation Evaluation Report D-45 March 2020
Origin/Destinations
Detailed vessel data was requested from the Corps Waterborne Commerce Statistics Center for the Cape Cod Canal for calendar year 2017, the most recent year available. The detailed data is confidential and cannot be presented in this report. However, aggregated information can be shown and used for calculations. The detailed data includes information for all US Flag cargo vessels which passed through the canal including port of origin, destination port, vessel name, owner, type of vessel, type of cargo, tonnage, draft, and other information. US flag vessels transported 89.7% of total cargo tons through the canal in 2017. The portion of cargo shipped on foreign flag vessels started to decline in 2014 and dropped significantly in 2015 before rising slightly in 2016 and 2017. The breakdown of cargo tonnages on US versus foreign flag vessels for 2012 through 2017 is shown in the table below.
Table D - 19: Cape Cod Canal Freight Traffic, 2012-2017
Cape Cod Canal Freight Traffic, 2012-2017
Year Domestic
Tons Foreign
Tons Total Tons
% Domestic
% Foreign Total %
2012 5,325,000 3,438,000 8,763,000 60.8% 39.2% 100.0% 2013 6,710,000 3,438,000 10,148,000 66.1% 33.9% 100.0% 2014 6,535,000 1,500,000 8,035,000 81.3% 18.7% 100.0% 2015 6,649,000 303,000 6,952,000 95.6% 4.4% 100.0% 2016 6,375,000 499,000 6,874,000 92.7% 7.3% 100.0% 2017 5,446,000 627,000 6,073,000 89.7% 10.3% 100.0%
Source: US Army Corps of Engineers, Waterborne Commerce of the United States, 2012-2017
An analysis of the detailed WCSC data shows that in 2017, 72% of domestic cargo vessel trips through the canal either originated in or had a destination of Boston Harbor. Of the trips which originated in Boston, 79% had a destination of the Port of New York/New Jersey. Of the trips which had a final destination of Boston Harbor, 67% originated at the Port of New York/New Jersey. Other ports in the northeast made up the remaining origins or destinations, including most commonly Providence, New Haven, Portland (Maine), Portsmouth, and Delaware. Cargo shipments through the canal reflected in the detailed WCSC data for 2017 were primarily on non-self-propelled dry cargo and tanker barges, pushed or pulled by towboats.
Methods
For this analysis, the navigation value of the canal is examined by comparing waterborne transportation costs between the without and with project conditions as is typical in Corps navigation analyses. Without the canal, vessels which currently use the canal would have to travel an average of 62 additional miles to reach their final destinations. The difference in

Cape Cod Canal Highway Bridges, MA Final Appendix D - Economics Major Rehabilitation Evaluation Report D-46 March 2020
waterborne transportation costs between the without and with canal conditions can be considered a partial measure of the value of the canal. The value of the canal can in turn be considered a partial measure of the value of the vehicle bridges, since construction of the canal was dependent on construction of the bridges. The cost of the longer travel distance without the canal can also be used to evaluate navigation impacts if bridge repairs require temporary closure of the canal, in the extreme case of a catastrophic failure and a new bridge must be constructed, that will also require canal closures.
Annual Navigation Benefits of the Canal For this analysis, waterborne transportation costs in the without and with canal conditions are calculated for cargo vessels which transited the canal in 2017, using detailed WCSC data. The difference between the costs of the two conditions represents only a portion of the navigation value of the canal, since cargo vessels are only a portion of vessel traffic using the canal. However, detailed data on cargo vessel traffic is readily available from the Corps WCSC, and waterborne transportation cost savings can be calculated using standard Corps methods.
The elements that make up waterborne transportation costs include the number of trips, trip distance, vessel speed, and vessel costs per day. Since the cargo vessels which used the canal in 2016 were primarily barges and towboats with relatively shallow drafts, the Corps Shallow Draft Vessel Operating Costs were used for this analysis. Those costs were last updated and released by the Corps in November 2004, in Economic Guidance Memorandum 05-06, “Shallow Draft Vessel Operating Costs, Fiscal Year 2004.” Those costs were more recently revised and updated to the 2015 price level by Informa Economics, under contract to the Corps Center of Expertise for Inland Navigation. The price levels were then escalated to 2020 values using a GDP deflator in order to allow for comparability between all other costs in the analysis.
The shallow draft vessel operating costs for towboats include daily costs for various types and sizes of towboats, organized by the horsepower of the towboat. The costs for barges include daily operating costs for various types of barges, organized by the carrying capacity of the barge. It should be noted that the vessels represented in the cost tables are inland tow boats and barges, which are generally smaller than the coastal barges that operate between ports on the US east coast. The towboat and barge categories were matched to the best extent possible to vessels transiting through the Canal. Information regarding horsepower for specific towboats which used the canal was obtained from the WCSC publication, “Waterborne Transportation Lines of the United States, volume 3 – Vessel Characteristics, Calendar Year 2016.” Towboats transiting the Canal had an average horsepower of between 4,000 to 5,999. Based on the Informa Economics cost tables, average daily costs for towboats with a horsepower of 4,000 to 5,999 equal $20,290 per day under maximum fuel cost, and $13,680 per day under actual daily fuel cost. For this analysis, the actual daily fuel cost category was used.
Since more than 70% of US flag cargo vessel trips through the Canal in 2017 were between the ports of Boston and New York/New Jersey that travel distance is used as a representative trip distance for this analysis. Based on the nautical trip calculator available at www.sea-distances.org, the trip distance between New York and Boston without the Canal is 378 nautical

Cape Cod Canal Highway Bridges, MA Final Appendix D - Economics Major Rehabilitation Evaluation Report D-47 March 2020
miles. With the Canal, a trip distance of 316 nautical miles is used, a distance savings of 62 nautical miles. An average trip speed of 7.5 knots is estimated based on an analysis of trip durations in the detailed WCSC data.
Total waterborne transportation costs for cargo vessel traffic using the canal equal towboat costs plus barge costs. Annual barge costs were estimated separately for tanker barges and dry cargo barges. The costs were converted to 2020 values. The number of trips for each was determined using the detailed WCSC data. Daily operating costs were used for the barges which most closely matched the barges which transited the canal in 2017, to the extent possible. Liquid tanker barge transportation costs were calculated using costs of $1,672 per day for a 390’x70’x22’ tanker barge. Dry cargo barge transportation costs were calculated using a cost of $866 per day for a 360’x70’x21’ tanker barge. Costs for foreign flag vessel trips were not calculated because the WCSC detailed data for the canal did not include information for those vessels.
Based on the detailed WCSC data, there were 230 towboat trips through the canal and 894 barge trips (833 tanker barges and 61 dry cargo barges) under US flag vessels in 2017. There is a greater number of barge trips because towboats can pull more than one barge. Total waterborne transportation costs for towboats and barge trips are calculated for the without and with canal conditions as shown in the table below. Annual waterborne transportation cost savings for US flag cargo vessels transiting the canal are estimated at $1,698,700 as presented in Table D-19 below ($10,369,200 - $8,670,500). This reflects cost savings on US flag vessels only, which in 2017 included 90 percent of total cargo tonnage and 78 percent of cargo vessel trips.
Table D - 20: Steps to Estimate Impact to Navigation
Annual Waterborne Transportation Costs Without Canal Condition
# Vessel Trips, 2017
Distance (Nautical
Miles)
Average Trip
Length (Days)
Daily Operating
Costs Annual Costs Towboats 230 378 2.1 $15,185 $7,334,300 Tanker Barges 833 378 2.1 $1,672 $2,924,000 Dry Cargo Barges 61 378 2.1 $866 $110,900 Total 1,124 $10,369,200 With Canal Condition
# vessel trips, 2017
distance (nautical miles)
average trip length (days)
Daily Operating Costs Annual Costs
Towboats 230 316 1.76 $15,185 $6,132,800 Tanker Barges 833 316 1.76 $1,672 $2,445,000 Dry Cargo Barges 61 316 1.76 $866 $92,700 Total 1,124 $8,670,500 Annual Transportation Cost Savings, US Flag Cargo Vessels $1,698,700

Cape Cod Canal Highway Bridges, MA Final Appendix D - Economics Major Rehabilitation Evaluation Report D-48 March 2020
Without the Canal, the economic efficiencies of the shorter transit routes would be lost. The value of the bridges is that car traffic does not interrupt waterway traffic.
It should be noted that this simplified analysis did not consider factors including, some cargo traffic currently transiting by towboat and barge could be shipped by other means, such as over land by truck, in which case these benefits may be understated, or on larger self-propelled vessels, in which case these benefits may be overstated. There may be factors such as terminal capacity, terminal facilities, access channel depths, or berth depths that require or favor towboat and barge shipments. Since the $1,698,700 in transportation cost savings reflect only US flag vessel trips, this is used as the lower bound estimate of the navigation benefits provided by the canal. In 2017, there were roughly 3.6 times more domestic vessel trips than foreign flag vessel trips through the canal. There are also trips by many other types of vessels. The economic value derived from these other trips is estimated to be roughly 28% to the cost savings to US flag vessels, an additional $471,900, for a total estimate of $2,170,600 in 2020 dollars.
Navigation Impacts of Temporary Canal Closure
With a bridge collapse or other major failure, the Canal would likely be closed for some period of time. In addition, some of the repair/rehabilitation alternatives require temporary closure of the canal to stage equipment or for other reasons. In these cases, existing vessel traffic through the canal would be stopped temporarily, and the economic and safety benefits provided by the canal would be lost for that time period.
The impacts on navigation traffic of temporary canal closure for different time periods are summarized in Table D - 21 below.
Table D - 21: Navigation Impacts
Navigation Impacts, Cape Cod Canal
Annual Value
Daily Value
Hourly Value
2020 Value $2,170,600 $5,900 $200
Annual Maintenance Costs In addition to the costs associated with emergency repairs, there are annual maintenance costs to upkeep the bridges each year. Annual maintenance include activities such as maintenance painting, paving, and joint replacement.
Currently, average annual maintenance costs are $411,000 (in 2020 dollars) for the Sagamore Bridge and $295,000 for the Bourne Bridge. These numbers were assumed to remain constant for the without project condition. The annual maintenance costs were determined by the study’s engineering expert by evaluating total maintenance of the current bridges over the last 50 years and finding an average annual cost.

Cape Cod Canal Highway Bridges, MA Final Appendix D - Economics Major Rehabilitation Evaluation Report D-49 March 2020
In the event tree scenario in which there is catastrophic failure in the superstructure, the result is immediate closure of the bridge with the design and construction of a replacement bridge. Annual maintenance for replacement bridges will cost $38,000 each.
Results of Monte Carlo Simulation The emergency repair costs (from Table D-1) and regularly scheduled O&M costs (see page D-44) as well as the value of time due to traffic and navigation costs were used as inputs for the Monte Carlo simulation as described in sections 1.1 and 2.3.1.Table D - 22 and Table D - 23 summarize the results.
Table D - 22: Sagamore Bridge Base Condition Costs
Annual Costs (rounded), ($000) FY2020 Repair
Cost Navigation
Cost Travel Cost O&M Cost Total Base Condition 2,800 0.7 118,900 400 122,100
Table D - 23: Bourne Bridge Base Condition Costs
Annual Costs (rounded), ($000) FY2020 Repair
Cost Navigation
Cost Travel Cost O&M Cost Total
Base Condition 3,200 0.7 60,700 300 64,200
The Monte Carlo Simulation was run with 100,000 iterations. In the base condition, continual maintenance is performed on the existing structures and emergency funds are provided in the event of performance failure. As the bridges age over time their conditions will deteriorate and emergency funds will be needed more frequently.
The travel costs are substantially higher for the Sagamore Bridge when compared to the Bourne Bridge. This is due to the fact that a lane or bridge closure on the Sagamore would strain the infrastructure around the Bourne Bridge, particularly the Bourne Rotary causing significant time delay for travelers waiting in traffic.
As the bridges continue to deteriorate in the base condition, weight restrictions are likely to be enforced and increased over time. Large cargo will need to either be shipped via marine traffic or separated into multiple smaller load trucks when crossing the bridges. It is difficult to predict what the load restrictions will be in a given year, particularly in the later years of the study, as well as predict the actions of heavy load traffic. Therefore, weight restrictions are not incorporated into the model resulting in a conservative estimate of travel impacts in Alternative A. This assumption does not impact the final conclusion determined within the report.

Cape Cod Canal Highway Bridges, MA Final Appendix D - Economics Major Rehabilitation Evaluation Report D-50 March 2020
Summary of Future Without Project Condition The base case condition stipulates that the bridges be maintained but their aging condition will continue to deteriorate over the 50-year study. The bridges will become increasingly unreliable resulting in higher occurrences of expensive emergency repairs. Impacts to travelers will be associated with the repairs. The total annual cost of operating the Sagamore and Bourne Bridges over 50 years is an estimated $186.3 million ($122.1 + 64.2 million) of which $6 million ($2.8 + $3.2 million) are direct emergency repair costs for component failures.
5 ALTERNATIVE B – MAJOR REHABILITATION
An alternative to the base condition is a major rehabilitation of both the Sagamore and Bourne bridges. The rehabilitation would avoid some of the emergency repair costs of a potential failure because the rehabilitated bridges will have improved reliability functions, meaning that the probability of component failure will decrease.
The rehabilitation project would include the following projects:
• Truss Span Deck Replacement • Stringer Replacement/Repair • Floorbeam Replacement/Repair • Suspender Cable Replacement • Abutment Span T-Beam Rehabilitation • Abutment Span Deck Rehabilitation • Bearing Repairs • Joint Replacement • Steel Truss Repairs • Paving (Overlay) • Painting of Structural Steel
The recommended timeline for the major rehabilitation is 2025 through 2027 for the Sagamore Bridge and 2029 to 2031 for the Bourne Bridge. For more details on the major rehabilitation project see Appendix A – Engineering Reliability Analysis.
Benefits The benefits are the direct and quantifiable gains under the with-project scenario. The major rehabilitation project will improve the reliability of bridge components and therefore decrease the probability of unsatisfactory performance. Benefits represent a reduction in emergency repair costs following a component failure and associated time value costs from lane closures related to these repairs. Modelling these phenomena provides a method to quantify the net benefits for current and future users.
Probability of Unsatisfactory Performance The rehabilitation project would result in more reliable bridges with significantly smaller probabilities of component failures over the life of the bridges. Below are probability of unsatisfactory performance charts exemplifying improved reliability functions.

Cape Cod Canal Highway Bridges, MA Final Appendix D - Economics Major Rehabilitation Evaluation Report D-51 March 2020
Figure D - 15: Sagamore Rehabilitation Probability of a Bridge Deck Failure
Figure D - 16: Bourne Rehabilitation Probability of a Bridge Deck Failure
As exhibited in Figure D - 15 and Figure D - 16, the probability of a failure for any type of bridge deck failure will be reset to 0% when the major rehabilitation project is complete. The probability of failure will rise throughout the forecast but will be reset to 0% when the second scheduled major repairs occurs. The probabilities of failure for both the Sagamore and Bourne Bridges remain below 1.5% following the major rehabilitation, compared to 37.4% at the end of the 50-years in the base condition.
0.0%
0.5%
1.0%
1.5%
2.0%
2.5%
3.0%20
2020
2220
2420
2620
2820
3020
3220
3420
3620
3820
4020
4220
4420
4620
4820
5020
5220
5420
5620
5820
6020
6220
6420
6620
6820
70
Probability of a Bridge Deck Failure Sagamore Rehabilitation
0.0%
0.5%
1.0%
1.5%
2.0%
2.5%
3.0%
3.5%
4.0%
2020
2022
2024
2026
2028
2030
2032
2034
2036
2038
2040
2042
2044
2046
2048
2050
2052
2054
2056
2058
2060
2062
2064
2066
2068
2070
Probability of a Bridge Deck Failure Bourne Rehabilitation

Cape Cod Canal Highway Bridges, MA Final Appendix D - Economics Major Rehabilitation Evaluation Report D-52 March 2020
Figure D - 17: Sagamore Rehabilitation Probability of a Substructure Failure
Figure D - 18: Bourne Rehabilitation Probability of a Substructure Failure
The major rehabilitation will not improve the substructure failure rate. It will continue to increase for both the Sagamore and Bourne Bridges over the 50-years similar to the base condition. According to expert engineering elicitation, even with the major rehabilitation project, the substructure component of the bridge will continue to show its age and will continue to deteriorate given its material composition.
0.0%
0.2%
0.4%
0.6%
0.8%
1.0%
1.2%
1.4%
1.6%
1.8%20
2020
2220
2420
2620
2820
3020
3220
3420
3620
3820
4020
4220
4420
4620
4820
5020
5220
5420
5620
5820
6020
6220
6420
6620
6820
70
Probability of a Substructure FailureSagamore Rehabilitation
0.0%
0.2%
0.4%
0.6%
0.8%
1.0%
1.2%
1.4%
1.6%
1.8%
2020
2022
2024
2026
2028
2030
2032
2034
2036
2038
2040
2042
2044
2046
2048
2050
2052
2054
2056
2058
2060
2062
2064
2066
2068
2070
Probability of a Substructure FailureBourne Rehabilitation

Cape Cod Canal Highway Bridges, MA Final Appendix D - Economics Major Rehabilitation Evaluation Report D-53 March 2020
Figure D - 19: Sagamore Rehabilitation Probability of a Superstructure Failure
Figure D - 20: Bourne Rehabilitation Probability of a Superstructure Failure
0%
2%
4%
6%
8%
10%
12%20
2020
2220
2420
2620
2820
3020
3220
3420
3620
3820
4020
4220
4420
4620
4820
5020
5220
5420
5620
5820
6020
6220
6420
6620
6820
70
Probability of a Superstructure FailureSagamore Rehabilitation
0%
2%
4%
6%
8%
10%
12%
14%
16%
2020
2022
2024
2026
2028
2030
2032
2034
2036
2038
2040
2042
2044
2046
2048
2050
2052
2054
2056
2058
2060
2062
2064
2066
2068
2070
Probability of a Superstructure FailureBourne Rehabilitation

Cape Cod Canal Highway Bridges, MA Final Appendix D - Economics Major Rehabilitation Evaluation Report D-54 March 2020
As depicted in Figure D - 19 and Figure D - 20, the probability of a failure for any type of superstructure will be reduced to 0.3% following the rehabilitation to be in line with the failure rate in 1981, the historical last major rehab project. The probability of failure will rise throughout the forecast horizon before being adjusted back to 0.3% in the second scheduled major repair project. Failure rates will remain below 8% following the rehabilitation in both the Sagamore and Bourne Bridges, compared to 64.9% in the final year of the base condition.
Probabilistic Scenario Analysis Following the major rehabilitation, the event trees used to predict the severity of a component failure will be different than in the base condition. The major rehabilitation will hinder the occurrence of more severe component failures. Figures D-21, D-22 and D-23 below are the event trees for the three bridge components.
Results of Monte Carlo Simulation The repair, navigation, and travel costs are determined using Monte Carlo Simulation. After each failure, there is an associated emergency repair cost, possible navigation cost, and travel delay costs. These costs are consistent with the costs described in Section 3 of the base condition. This is because the bridges are structurally the same and initial costs for repairs will be the same before and after the major rehabilitation. The frequency in which failures occur, however, does decline. There will be fewer occurrences of component failures and the severity of the failures will also decrease after the rehabilitation projects. The O&M costs will remain the same in the rehabilitation scenario.

Cape Cod Canal Highway Bridges, MA Final Appendix D - Economics Major Rehabilitation Evaluation Report D-55 March 2020
Figure D - 21: Rehabilitation Bridge Deck Event Tree
For both bridges after the major rehabilitation the probability that a bridge deck failure will lead to widespread deterioration compared to localized deterioration will decrease from 20% to 10% whereas in the base condition the probability of widespread deterioration increases over time as the component continues to worsen from 20% to 45%.

Cape Cod Canal Highway Bridges, MA Final Appendix D - Economics Major Rehabilitation Evaluation Report D-56 March 2020
Figure D - 22: Rehabilitation Substructure Event Tree
The major rehabilitation will not lead to a change in the event tree probabilities in the substructure for both bridges. The probability of widespread concrete defects will remain 10%, as with the base condition.

Cape Cod Canal Highway Bridges, MA Final Appendix D - Economics Major Rehabilitation Evaluation Report D-57 March 2020
Figure D - 23: Rehabilitation Superstructure Event Tree
The event tree for the superstructure will remain constant after the major rehabilitation rather than have the probability of a severe failure increase overtime as in the base condition. Therefore the major rehabilitation will help to prevent more severe failures from occurring particularly in later years.

Cape Cod Canal Highway Bridges, MA Final Appendix D - Economics Major Rehabilitation Evaluation Report D-58 March 2020
The Monte Carlo Simulation was done over the 50-year period for the major rehabilitation scenario with 100,000 iterations. The resulting emergency repair costs for the major rehabilitation alternative are described in Table D-24 and Table D-25 below.
Table D - 24: Sagamore Bridge Rehabilitation Costs
Annual Costs (rounded), ($000) Repair
Cost Navigation
Cost Travel Cost O&M Costs Total Alternative B 300 0.6 8,000 400 8,700
Table D - 25: Bourne Bridge Rehabilitation Costs
Annual Costs (rounded), ($000) Repair
Cost Navigation
Cost Travel Cost O&M Costs Total Alternative B 400 0.6 5,400 300 6,100
To determine the benefit of the alternative, the cost savings of emergency repairs in the base case and the major rehab are compared by subtracting the costs of major rehab from the base case total costs. These calculations are shown in Tables D-26 and D-27.
Table D - 26: Sagamore Bridge Rehabilitation Benefits
Annual Costs, ($000) Total Cost -
Base Case Total Cost - Major
Rehab Benefit Alternative B 122,100 8,700 113,300
Table D - 27: Bourne Bridge Rehabilitation Benefits
Annual Costs, ($000) Total Cost -
Base Case Total Cost - Major
Rehab Benefit Alternative B 64,200 6,100 58,100
The costs for repairing the bridges after the major rehabilitation declines significantly as fewer failures are simulated over the 50-years. In addition, the travel delay costs incurred by lane and bridge closures during these emergency repairs is also reduced. The measurable benefit of doing the rehabilitation is the total cost savings of $113.3 million annually for the Sagamore Bridge and $58.1 million annually for the Bourne Bridge.

Cape Cod Canal Highway Bridges, MA Final Appendix D - Economics Major Rehabilitation Evaluation Report D-59 March 2020
Cost The cost of the major rehabilitation comprises the total construction cost of the major rehabilitation and the time-value cost of the lane and bridge closures associated with the major rehabilitation construction.
The recommended timeline for the major rehabilitation is 2025 through 2027 for the Sagamore Bridge and 2029 to 2031 for the Bourne Bridge.
Construction Costs The majority of costs for the alternative will be incurred at the beginning of the construction timeline. The construction cost of the major rehabilitation for the Sagamore Bridge is $258.3 million (2020 dollars). The cost of the project for the Bourne Bridge is $269.7 million. These costs are based on estimates from Cost Engineering as of August 2019. More details on cost are provided in Appendix C.
Over the 50 years, the bridges will begin to deteriorate resulting in necessary action to prevent component failures. At the time of the failure, the bridges will need to undergo various major repair projects that are fairly extensive and not considered to be regular annual maintenance repairs. Table D - 28 and Table D - 29 summarize the costs for the major rehabilitation projects, costs for subsequent major repairs, and the years in which they occur.
Note: there are additional scheduled repairs referenced in Appendix C: Cost Engineering that include maintenance painting, joint replacement, and paving. Those out-year projects are considered part of annual operation and maintenance (O&M) for the purpose of the economic analysis. Table D - 28: Sagamore Bridge Rehabilitation Engineering Costs
Sagamore Bridge Construction Cost
Project Years Cost (000) 2020 dollars
Major Rehab 2025-2027 $ 153,300 Complete painting 2045 $ 22,900 Truss Deck Replacement, floor beam repair, complete painting 2065 $ 82,100

Cape Cod Canal Highway Bridges, MA Final Appendix D - Economics Major Rehabilitation Evaluation Report D-60 March 2020
Table D - 29: Bourne Bridge Rehabilitation Engineering Costs
Bourne Bridge Construction Cost
Project Years Cost (000) 2020 dollars
Major Rehab 2029-2031 $ 155,400 Complete painting 2049 $ 19,300 Truss Deck Replacement, floor beam repair, complete painting 2069 $ 95,000
Value of Time Table D - 30 displays estimated closure timeframes necessary for each project.
Table D - 30: Rehabilitation Lane Closure Durations Estimates
MAJOR REHAB ACTIVITY BOURNE SAGAMORE
LANE CLOSURE DURATION (DAYS) BRIDGE SUPERSTRUCTURE DECK REPLACEMENT (INCLUDING STRINGER REPLACEMENT); ABUTMENT SPAN REPLACEMENT; (CONCRETE T-BEAMS) MISC. STEEL REPAIRS, ETC.; EXTERIOR GUSSET PLATE RETROFITS; INTERIOR GUSSET PLATE REPAIRS; MISC. CONCRETE REPAIRS, ETC.
165 135
SUSPENDER CABLE REPLACEMENT 65 70 PAVING 30 25 PAINTING 220 150 TOTAL DAYS OF LANE CLOSURES 480 380
FULL BRIDGE CLOSURE DURATION (DAYS)
INTERIOR GUSSET PLATE REPLACEMENT 70 95
FLOORBEAM REPLACEMENT 110 35 TOTAL DAYS OF FULL BRIDGE CLOSURE 180 130
Total Days of Disrupted Traffic 660 510

Cape Cod Canal Highway Bridges, MA Final Appendix D - Economics Major Rehabilitation Evaluation Report D-61 March 2020
Lane closures and bridge closures will not occur Memorial Day through Columbus Day to avoid impacting the busy tourist travel seasons as well as Patriots Day and Thanksgiving weekends. While construction will occur on most winter days, there will be some days in which inclement weather will prevent construction activity. For modeling purposes, an estimated roughly three-quarters of winter days will allow for construction activity while the remaining constitute no construction due to holidays or severe winter weather conditions.
The lane and bridge closures will negatively impact commuters and vacationers traveling on and off the bridge. The calculations were done as described in Section 3.3.3.
Table D - 31 and Table D - 32 display the construction activities included in the major rehabilitation during the 50-year study period and the associated travel costs for each activity. Cost of Construction is carried forward from Table D - 28 and Table D - 29 above. Travel costs incorporates the number of days for lane and bridge closures from Table D - 30 above and the calculated Value of Time; discounted for the year in which the costs are incurred.
Table D - 31: Sagamore Bridge Rehabilitation Construction and Travel Costs
Years Cost of
Construction ($000)
Travel Cost ($000)
Total Cost by Year Incurred
2025-2027 153,300 661,800 815,100 2045 22,900 124,000 146,900 2065 82,100 495,200 577,300 Total 258,300 1,281,000 1,539,300
* Costs are discounted in final analysis
Table D - 32: Bourne Bridge Rehabilitation Construction and Travel Costs
Years Cost of
Construction ($000)
Travel Cost ($000)
Total Cost by Year Incurred
2029-2031 155,400 530,100 685,500 2049 19,300 87,000 106,300 2069 95,100 331,200 426,300 Total 269,800 948,300 1,218,100
* Costs are discounted in final analysis
Traffic disruptions associated with construction activities may cause some visitors to choose an alternate travel destination away from Cape Cod. There would be a substitution effect as these vacationers may decide to travel to other areas such as Maine, New Hampshire or Rhode Island. This impact is expected to be minimal as scheduled construction activities during construction of the proposed alternatives will avoid peak visitor travel times in the summer and on holidays.

Cape Cod Canal Highway Bridges, MA Final Appendix D - Economics Major Rehabilitation Evaluation Report D-62 March 2020
Travelers driving to the Cape for work or non-vacation reasons will still need to commute over the bridges because they provide the only access on and off Cape Cod. The economic analysis does not reflect the possible substitution effect of visitor volume. The current analysis provides a more conservative estimate in the case of the alternatives. If visitor traffic were to decline as a result of project construction in the alternatives, traffic flows would actually improve for the non-visitors and in turn reduce the value of time cost of the project. Therefore, the final decision will not change with this assumption.
Total Annualized Cost The total cost of the rehabilitation will be $35.6 million annually for the Sagamore Bridge and $25.8 million annually for the Bourne Bridge.
Table D - 33 and Table D - 34). The impact of traffic delays is a major component in adding costs, highlighting the importance of these structures in traffic flows. Traffic delays on the Sagamore Bridge amounted to 510 days of disrupted traffic at an additional economic cost of $1.3 billion. Traffic delays on the Bourne Bridge amounted to 660 days of disrupted traffic for an additional cost of $948 million.
Interest during construction (IDC) is the cost incurred as interest while the disbursement of payments is distributed over the course of the project construction, as costs do not hit in one year but rather is assumed over the duration of the construction period. The time period for the IDC calculation was 3 years.
Table D - 33: Sagamore Bridge Rehabilitation Total Annualized Costs
Cost ($000) Construction cost of rehabilitation – 2025 through 2027 (2020 dollars) 153,300
Construction cost of additional rehab work – 2045 through 2069 (2020 dollars) 105,000
Travel delay costs (2020 dollars) 1,281,000 Discount factor 2.875% Capital Recovery Factor 0.0379 Discounted cost of rehabilitation 129,400 Discounted additional rehab work 34,200 Discounted travel delay cost 769,200 Interest During Construction (IDC) 4,400 Total Cost 937,300 Annualized Cost 35,600
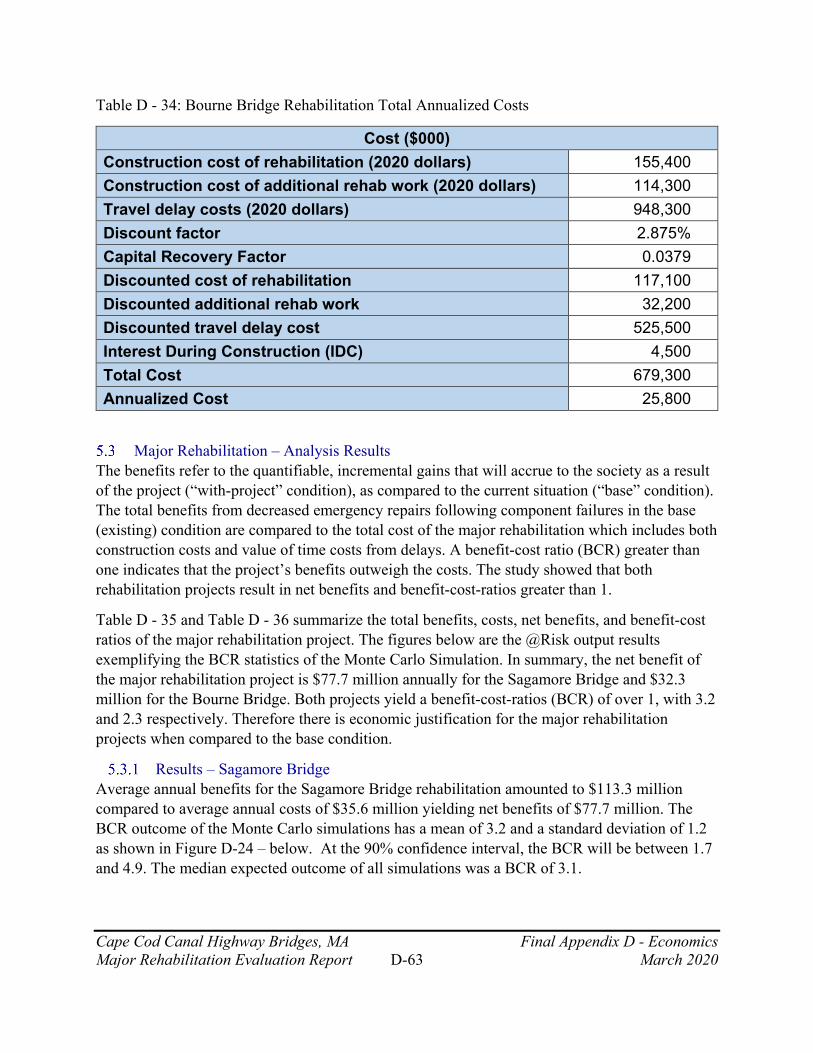
Cape Cod Canal Highway Bridges, MA Final Appendix D - Economics Major Rehabilitation Evaluation Report D-63 March 2020
Table D - 34: Bourne Bridge Rehabilitation Total Annualized Costs
Cost ($000) Construction cost of rehabilitation (2020 dollars) 155,400 Construction cost of additional rehab work (2020 dollars) 114,300 Travel delay costs (2020 dollars) 948,300 Discount factor 2.875% Capital Recovery Factor 0.0379 Discounted cost of rehabilitation 117,100 Discounted additional rehab work 32,200 Discounted travel delay cost 525,500 Interest During Construction (IDC) 4,500 Total Cost 679,300 Annualized Cost 25,800
Major Rehabilitation – Analysis Results The benefits refer to the quantifiable, incremental gains that will accrue to the society as a result of the project (“with-project” condition), as compared to the current situation (“base” condition). The total benefits from decreased emergency repairs following component failures in the base (existing) condition are compared to the total cost of the major rehabilitation which includes both construction costs and value of time costs from delays. A benefit-cost ratio (BCR) greater than one indicates that the project’s benefits outweigh the costs. The study showed that both rehabilitation projects result in net benefits and benefit-cost-ratios greater than 1.
Table D - 35 and Table D - 36 summarize the total benefits, costs, net benefits, and benefit-cost ratios of the major rehabilitation project. The figures below are the @Risk output results exemplifying the BCR statistics of the Monte Carlo Simulation. In summary, the net benefit of the major rehabilitation project is $77.7 million annually for the Sagamore Bridge and $32.3 million for the Bourne Bridge. Both projects yield a benefit-cost-ratios (BCR) of over 1, with 3.2 and 2.3 respectively. Therefore there is economic justification for the major rehabilitation projects when compared to the base condition.
Results – Sagamore Bridge Average annual benefits for the Sagamore Bridge rehabilitation amounted to $113.3 million compared to average annual costs of $35.6 million yielding net benefits of $77.7 million. The BCR outcome of the Monte Carlo simulations has a mean of 3.2 and a standard deviation of 1.2 as shown in Figure D-24 – below. At the 90% confidence interval, the BCR will be between 1.7 and 4.9. The median expected outcome of all simulations was a BCR of 3.1.

Cape Cod Canal Highway Bridges, MA Final Appendix D - Economics Major Rehabilitation Evaluation Report D-64 March 2020
Figure D - 25 similarly shows the @RISK results for the net benefits. At the 90% confidence interval, the net benefits will be between $24.7 million and $136.9 million with the median value of $73.4 million.
Table D - 35: Sagamore Bridge Rehabilitation Costs and BCR
Annual ($000) Benefit Cost Net Benefit BCR
Alternative B 113,300 35,600 77,700 3.2
Figure D - 24: Sagamore Major Rehabilitation @RISK Output BCR

Cape Cod Canal Highway Bridges, MA Final Appendix D - Economics Major Rehabilitation Evaluation Report D-65 March 2020
Figure D - 25: Sagamore Major Rehabilitation @RISK Output Net Benefit
Average annual benefits for the Bourne Bridge rehabilitation amounted to $58.1 million compared to average annual costs of $25.8 million yielding net benefits of $32.3 million. The BCR outcome of the Monte Carlo simulations has a mean of 2.3 and a standard deviation of 0.9 as shown in Figure D - 26 below. At the 90% confidence interval, the BCR will be between 1.1 and 3.5. The median expected outcome of all simulations was a BCR of 2.2.
Figure D - 25 exhibits the @RISK results for the net benefits. At the 90% confidence interval, the net benefits will be between $3.2 million and $65 million with the median value of $30.1 million.
Table D - 36: Bourne Bridge Rehabilitation Costs and BCR
Annual Cost ($000) Benefit Cost Net Benefit BCR Alternative B 58,100 25,800 32,300 2.3

Cape Cod Canal Highway Bridges, MA Final Appendix D - Economics Major Rehabilitation Evaluation Report D-66 March 2020
Figure D - 26: Bourne Major Rehabilitation @RISK Output BCR
Figure D - 27: Bourne Major Rehabilitation @RISK Output Net Benefits
Cape Cod Canal Highway Bridges, MA Final Appendix D - Economics Major Rehabilitation Evaluation Report D-67 March 2020
Summary of Major Rehabilitation Project The analysis supports the major rehabilitation projects for both bridges over maintaining the bridges in the “fix-as-fails” Base Condition. The study showed that both rehabilitation projects result in net benefits and benefit-cost-ratios greater than 1. The impact of traffic delays is a major component in adding costs highlighting the importance of these structures in traffic flows.
6 ALTERNATIVE C – REPLACEMENT WITH 4 LANES (2 EACH DIRECTION)
A proposed alternative to the base condition and the major rehabilitation is the construction of new bridges adjacent to the current bridges. This scenario has a greater upfront cost but also allows for a more reliable bridge structure that meets current standards and regulations. The first proposed bridge is a directly comparable replacement with 4 lanes total (2 each direction), but would be wider to meet current standards. The new bridges do not require lane and bridge closures during the construction process and will therefore not impact traffic or incur travel delays during construction. This alternative also has lower annual maintenance costs after the replacement bridges are erected. However construction costs are higher than the costs of rehabilitation.
The recommended timeline for the construction of the new bridges is 2025 through 2029 for the Sagamore Bridge and 2030 to 2034 for the Bourne Bridge.
Benefits The benefits are the direct and quantifiable gains under the with-project scenario. Replacement of the bridges will improve the reliability of bridge components and therefore significantly decrease the probability of failure. In this situation, failure is defined as unsatisfactory conditions that would require limiting the weight (load-posting) allowed to be carried over the bridges. Benefits represent a reduction in emergency repair costs following a component failure and associated time value costs from lane closures related to these repairs. In addition, the new bridges will also have lower annual maintenance costs throughout the 50-year forecast. Modelling these phenomena provides a method to quantify the net benefits for current and future users.
Probability of Unsatisfactory Performance The replacement bridge project will result in more reliable bridges with significantly smaller probabilities of component failures over the life of the bridges. Below are probability of unsatisfactory performance charts exemplifying improved reliability functions.

Cape Cod Canal Highway Bridges, MA Final Appendix D - Economics Major Rehabilitation Evaluation Report D-68 March 2020
Figure D - 28: Sagamore Replacement Probability of a Bridge Deck Failure
Figure D - 29: Bourne Replacement Probability of a Bridge Deck Failure
0.0%
0.5%
1.0%
1.5%
2.0%
2.5%
3.0%
3.5%
2020
2022
2024
2026
2028
2030
2032
2034
2036
2038
2040
2042
2044
2046
2048
2050
2052
2054
2056
2058
2060
2062
2064
2066
2068
2070
Probability of a Bridge Deck FailureSagamore Replacement
0.0%
1.0%
2.0%
3.0%
4.0%
5.0%
6.0%
2020
2022
2024
2026
2028
2030
2032
2034
2036
2038
2040
2042
2044
2046
2048
2050
2052
2054
2056
2058
2060
2062
2064
2066
2068
2070
Probability of a Bridge Deck FailureBourne Replacement
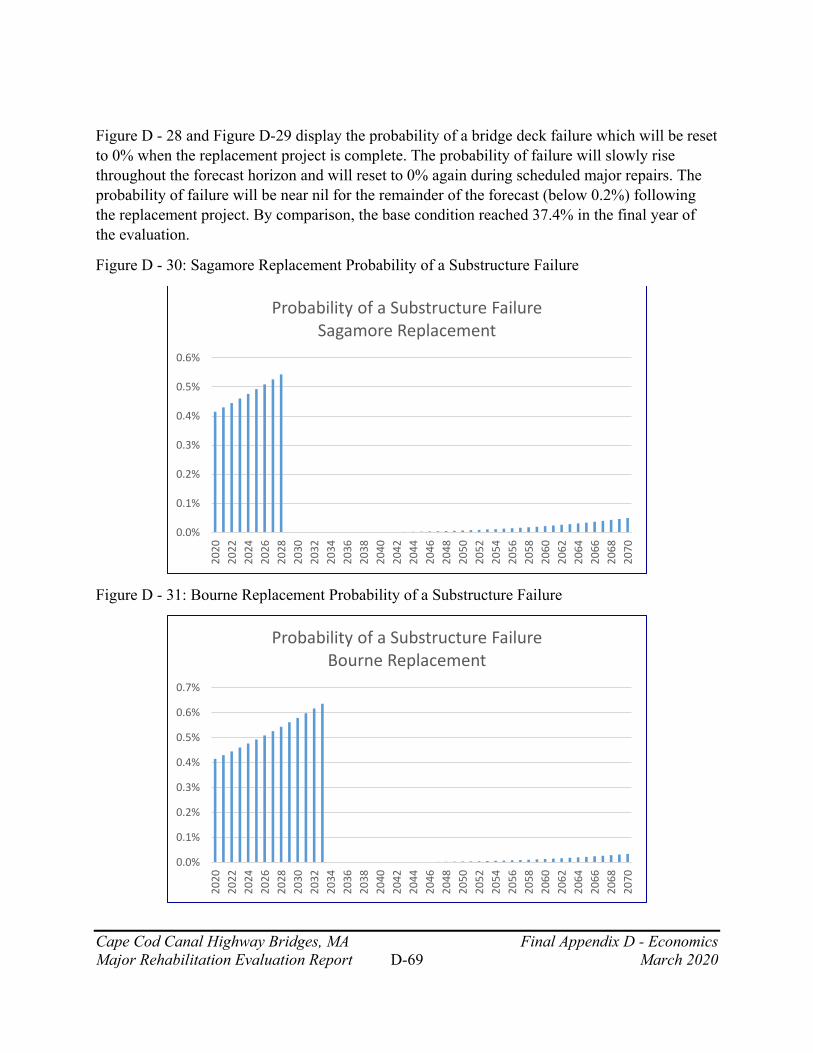
Cape Cod Canal Highway Bridges, MA Final Appendix D - Economics Major Rehabilitation Evaluation Report D-69 March 2020
Figure D - 28 and Figure D-29 display the probability of a bridge deck failure which will be reset to 0% when the replacement project is complete. The probability of failure will slowly rise throughout the forecast horizon and will reset to 0% again during scheduled major repairs. The probability of failure will be near nil for the remainder of the forecast (below 0.2%) following the replacement project. By comparison, the base condition reached 37.4% in the final year of the evaluation.
Figure D - 30: Sagamore Replacement Probability of a Substructure Failure
Figure D - 31: Bourne Replacement Probability of a Substructure Failure
0.0%
0.1%
0.2%
0.3%
0.4%
0.5%
0.6%
2020
2022
2024
2026
2028
2030
2032
2034
2036
2038
2040
2042
2044
2046
2048
2050
2052
2054
2056
2058
2060
2062
2064
2066
2068
2070
Probability of a Substructure FailureSagamore Replacement
0.0%
0.1%
0.2%
0.3%
0.4%
0.5%
0.6%
0.7%
2020
2022
2024
2026
2028
2030
2032
2034
2036
2038
2040
2042
2044
2046
2048
2050
2052
2054
2056
2058
2060
2062
2064
2066
2068
2070
Probability of a Substructure FailureBourne Replacement
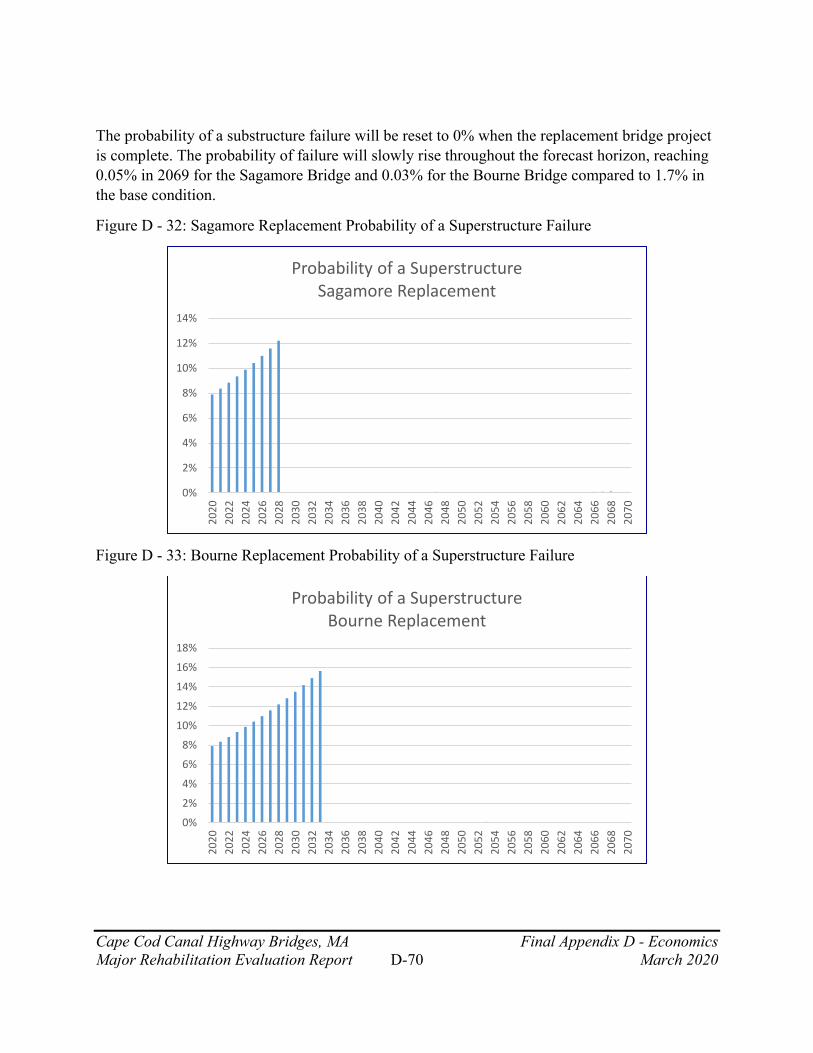
Cape Cod Canal Highway Bridges, MA Final Appendix D - Economics Major Rehabilitation Evaluation Report D-70 March 2020
The probability of a substructure failure will be reset to 0% when the replacement bridge project is complete. The probability of failure will slowly rise throughout the forecast horizon, reaching 0.05% in 2069 for the Sagamore Bridge and 0.03% for the Bourne Bridge compared to 1.7% in the base condition.
Figure D - 32: Sagamore Replacement Probability of a Superstructure Failure
Figure D - 33: Bourne Replacement Probability of a Superstructure Failure
0%
2%
4%
6%
8%
10%
12%
14%
2020
2022
2024
2026
2028
2030
2032
2034
2036
2038
2040
2042
2044
2046
2048
2050
2052
2054
2056
2058
2060
2062
2064
2066
2068
2070
Probability of a SuperstructureSagamore Replacement
0%
2%
4%
6%
8%
10%
12%
14%
16%
18%
2020
2022
2024
2026
2028
2030
2032
2034
2036
2038
2040
2042
2044
2046
2048
2050
2052
2054
2056
2058
2060
2062
2064
2066
2068
2070
Probability of a SuperstructureBourne Replacement

Cape Cod Canal Highway Bridges, MA Final Appendix D - Economics Major Rehabilitation Evaluation Report D-71 March 2020
Figure D - 32 and Figure D - 33 exhibit the probability of a superstructure failure which will be reset to 0 when the bridge replacement project is complete. The probability of failure will slowly rise throughout the forecast horizon and will again be reset after the scheduled second major repair. The probability of failure in the superstructure will remain below 0.1% in the years following the replacement. By comparison, the base condition probability of failure raises to 64.9% by 2069.
Probabilistic Scenario Analysis Following the replacement project, the event trees used to predict the severity of a component failure will be different for the new bridges constructed. The replacement project will hinder the occurrence of more severe component failures. Below are the event trees for the three bridge components for the new bridges.

Cape Cod Canal Highway Bridges, MA Final Appendix D - Economics Major Rehabilitation Evaluation Report D-72 March 2020
Figure D - 34: Replacement Bridge Deck Event Tree
For both replacement bridges, the probability that a bridge deck failure will lead to widespread deterioration will be 0.5% whereas in the base condition the probability of widespread deterioration increases over time as the component continues to worsen, increasing from 20% to 45%.
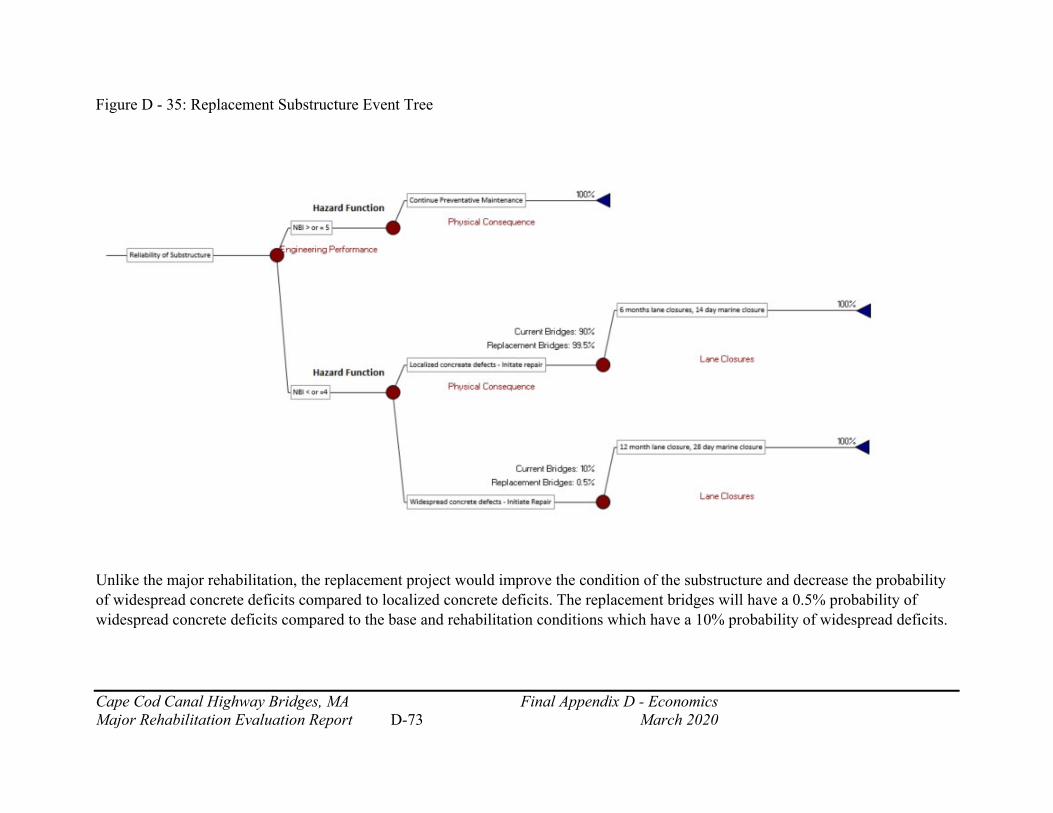
Cape Cod Canal Highway Bridges, MA Final Appendix D - Economics Major Rehabilitation Evaluation Report D-73 March 2020
Figure D - 35: Replacement Substructure Event Tree
Unlike the major rehabilitation, the replacement project would improve the condition of the substructure and decrease the probability of widespread concrete deficits compared to localized concrete deficits. The replacement bridges will have a 0.5% probability of widespread concrete deficits compared to the base and rehabilitation conditions which have a 10% probability of widespread deficits.

Cape Cod Canal Highway Bridges, MA Final Appendix D - Economics Major Rehabilitation Evaluation Report D-74 March 2020
Figure D - 36: Replacement Superstructure Event Tree
The event tree for the superstructure improves in the replacement bridge scenario rather than remaining constant in the rehabilitation or worsening over time as in the base condition. There will be a 0% chance that the new bridge will have catastrophic damage to the superstructure over the 50-year study period. 99.5% of failures of the superstructure will be minor.

Cape Cod Canal Highway Bridges, MA Final Appendix D - Economics Major Rehabilitation Evaluation Report D-75 March 2020
Results of Monte Carlo Simulation The repair, navigation, and travel costs are determined as described in the same process as the existing condition using Monte Carlo Simulation. The results for the replacement bridges are presented in Table D - 37 and Table D - 38.
Table D - 37: Sagamore Bridge Replacement 4 Lanes Costs
Annual Costs (Rounded) ($000)
Repair Cost
Navigation Cost Travel Cost O&M Total
Alternative C 300 0.1 4,000 200 4,400
Table D - 38: Bourne Bridge Replacement 4 Lanes Costs
Annual Costs (Rounded) ($000)
Repair Cost
Navigation Cost Travel Cost O&M Total
Alternative C 500 0.2 6,300 200 7,000
To determine the benefit of the alternative, the cost savings of emergency repairs in the base case and the new bridge alternative are compared by subtracting the costs of the new bridge scenario from the base case total costs. The benefits are detailed in Table D - 39 and Table D - 40.
Table D - 39: Sagamore Bridge Replacement 4 Lanes Benefits
Annual Costs ($000)
Total Cost Base Case
Total Cost New Bridge (4) Benefit
Alternative C 122,100 4,400 117,600
Table D - 40: Bourne Bridge Replacement 4 Lanes Benefits
Annual Costs, ($000) Total Cost
Base Case Total Cost
New Bridge (4) Benefit Alternative C 64,200 7,000 57,200
The occurrence of a component failure declines significantly over the study period after the replacement bridges are constructed. Therefore travel delay costs typically associated with these failures similarly are reduced. In addition, annual O&M costs to upkeep the new bridges are
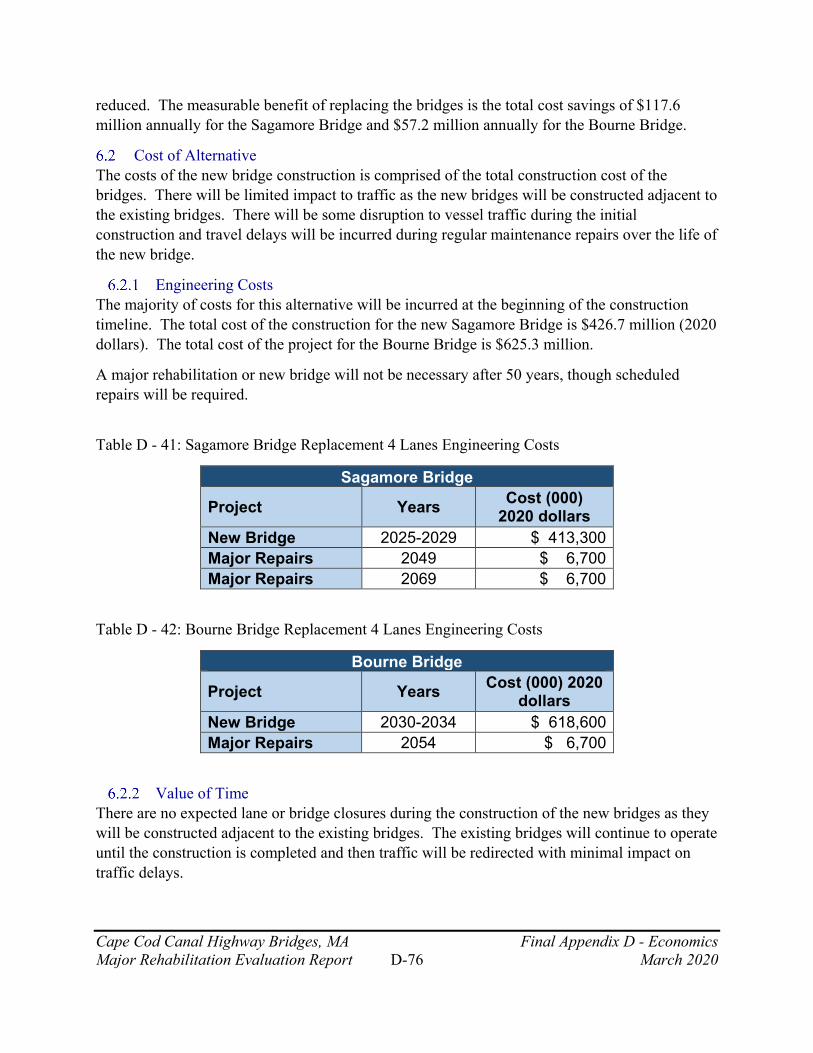
Cape Cod Canal Highway Bridges, MA Final Appendix D - Economics Major Rehabilitation Evaluation Report D-76 March 2020
reduced. The measurable benefit of replacing the bridges is the total cost savings of $117.6 million annually for the Sagamore Bridge and $57.2 million annually for the Bourne Bridge.
Cost of Alternative The costs of the new bridge construction is comprised of the total construction cost of the bridges. There will be limited impact to traffic as the new bridges will be constructed adjacent to the existing bridges. There will be some disruption to vessel traffic during the initial construction and travel delays will be incurred during regular maintenance repairs over the life of the new bridge.
Engineering Costs The majority of costs for this alternative will be incurred at the beginning of the construction timeline. The total cost of the construction for the new Sagamore Bridge is $426.7 million (2020 dollars). The total cost of the project for the Bourne Bridge is $625.3 million.
A major rehabilitation or new bridge will not be necessary after 50 years, though scheduled repairs will be required.
Table D - 41: Sagamore Bridge Replacement 4 Lanes Engineering Costs
Sagamore Bridge
Project Years Cost (000) 2020 dollars
New Bridge 2025-2029 $ 413,300 Major Repairs 2049 $ 6,700 Major Repairs 2069 $ 6,700
Table D - 42: Bourne Bridge Replacement 4 Lanes Engineering Costs
Bourne Bridge
Project Years Cost (000) 2020 dollars
New Bridge 2030-2034 $ 618,600 Major Repairs 2054 $ 6,700
Value of Time There are no expected lane or bridge closures during the construction of the new bridges as they will be constructed adjacent to the existing bridges. The existing bridges will continue to operate until the construction is completed and then traffic will be redirected with minimal impact on traffic delays.

Cape Cod Canal Highway Bridges, MA Final Appendix D - Economics Major Rehabilitation Evaluation Report D-77 March 2020
However, during the scheduled repairs that are expected to occur later in the 50-year timeframe, there will be impacts to traffic. Table D - 43 and Table D - 44 show the construction costs and associated travel costs.
Table D - 43: Sagamore Bridge Replacement 4 Lanes Costs
Years Cost of
Construction ($000)
Navigation Cost ($000)
Travel Cost ($000)
Total Cost by Year Incurred
2025-2029 413,300 200 0 413,500 2049 6,700 0 46,300 53,000 2069 6,700 0 46,300 53,000 Total 426,700 200 92,600 519,500
* Costs are discounted in final analysis Table D - 44: Bourne Bridge Replacement 4 Lanes Costs
Years Cost of
Construction ($000)
Navigation Cost ($000)
Travel Cost ($000)
Total Cost by Year Incurred
2030-2034 618,600 200 0 618,800 2054 6,700 0 22,200 28,900 Total 625,300 200 22,200 647,700
* Costs are discounted in final analysis
Total Annualized Cost The total costs are annualized to determine the annual cost over the 50 year study. Table D - 45 and Table D - 46 exhibit the model Monte Carlo results and economic factors used to annualize costs. The construction time duration used for the interest during construction (IDC) is five years.
Table D - 45: Sagamore Bridge Replacement 4 Lanes Total Annualized Cost
Cost ($000) Construction cost of replacement (2020 dollars) 413,300 Construction cost of additional repair work (2020 dollars) 13,500 Travel and navigation delay costs (2020 dollars) 92,600 Discount factor 2.875% Capital Recovery Factor 0.0379 Discounted cost of replacement cost 339,200

Cape Cod Canal Highway Bridges, MA Final Appendix D - Economics Major Rehabilitation Evaluation Report D-78 March 2020
Discounted additional repair work 4,600 Discounted travel and navigation delay cost 31,900 Interest During Construction (IDC) 24,500 Total Cost 400,200 Annualized Cost 15,200
Table D - 46: Bourne Bridge Replacement 4 Lanes Total Annualized Cost
Cost ($000) Construction cost of replacement (2020 dollars) 618,600 Construction cost of additional repair work (2020 dollars) 6,700 Travel delay and navigation costs (2020 dollars) 22,200 Discount factor 2.875% Capital Recovery Factor 0.0379 Discounted cost of replacement 440,600 Discounted additional repair work 2,600 Discounted travel delay and navigation cost 8,500 Interest During Construction (IDC) 36,600 Total Cost 488,300 Annualized Cost 18,500
Four Lane Replacement Bridge – Analysis Results The total benefits from decreased emergency repairs following component failures on the existing bridge is compared to the total cost of the new bridge construction which includes engineering costs and scheduled repairs.
Benefit Cost Ratio (BCR) Table D - 47 and Table D - 48 summarize the total benefits, costs, net benefits, and benefit-cost ratios of the replacement project. Figure D-37 and Figure D-38 are the @Risk output results exemplifying the BCR statistics of the Monte Carlo Simulation.
Average annual benefits for the Sagamore Bridge replacement amounted to $117.6 million compared to average annual costs of $15.2 million yielding net benefits of $102.4 million. The BCR outcome of the Monte Carlo simulations has a mean of 7.7 and a standard deviation of 2.7 as shown in
Figure D - 37 below. At the 90% confidence interval, the BCR will be between 4.3 and 11.6, with a median expected outcome of all simulations of 7.5.

Cape Cod Canal Highway Bridges, MA Final Appendix D - Economics Major Rehabilitation Evaluation Report D-79 March 2020
Figure D - 38 displays the @RISK results for the net benefits. At the 90% confidence interval, the net benefits will be between $49.9 million and $160.8 million with the median value of $98.1 million.
Table D - 47: Sagamore Bridge Replacement 4 Lanes Annual Costs and BCR
Annual ($000) Benefit Cost Net Benefit BCR
Alternative C 117,600 15,200 102,400 7.7
Figure D - 37: Sagamore 4 Lane Replacement @RISK Output BCR

Cape Cod Canal Highway Bridges, MA Final Appendix D - Economics Major Rehabilitation Evaluation Report D-80 March 2020
Figure D - 38: Sagamore 4 Lane Replacement @RISK Output Net Benefits
Average annual benefits for the Bourne Bridge replacement amounted to $57.2 million compared to average annual costs of $18.5 million yielding net benefits of $38.7 million. The BCR outcome of the Monte Carlo simulations has a mean of 3.1 and a standard deviation of 1.2 as shown in Figure D - 39 below. At the 90% confidence interval, the BCR will be between 1.4 and 4.9, with a median expected outcome of all simulations of 3.0 (2.98).
Figure D - 40 displays the @RISK results for the net benefits. At the 90% confidence interval, the net benefits will be between $8.2 million and $72.2 million with the median value of $36.7 million.
Table D - 48: Bourne Bridge Replacement 4 Lanes Annual Costs and BCR
Annual Cost ($000) Benefit Cost Net Benefit BCR
Alternative C 57,200 18,500 38,700 3.1

Cape Cod Canal Highway Bridges, MA Final Appendix D - Economics Major Rehabilitation Evaluation Report D-81 March 2020
Figure D - 39: Bourne 4 Lane Replacement @RISK Output BCR
Figure D - 40: Bourne 4 Lane Replacement @RISK Output Net Benefits
Summary of New Bridges Project
The results indicate that replacement of the existing bridges with construction of new 4-lane bridges has a higher benefit to cost ratio than maintaining the bridges in a “fix-as-fails” base condition. In addition, the cost-benefit ratios are also higher than the option to perform a major

Cape Cod Canal Highway Bridges, MA Final Appendix D - Economics Major Rehabilitation Evaluation Report D-82 March 2020
rehabilitation on the current bridges. The study showed that replacement of both bridges result in positive net benefits and benefit-cost-ratios greater than 1. The impact of traffic delays is a major component in adding economic costs, highlighting the importance of these structures in traffic flows. The replacement alternative limits the impact on traffic which economically outweighs the higher upfront cost.
7 ALTERNATIVE D – REPLACEMENT WITH 4 LANES AND 2 AUXILIARY ON/OFF LANES
In addition to the 4-lane replacement bridge scenario, there is also a proposed alternative to the base condition and the major rehabilitation that is the construction of new bridges adjacent to the current bridges with 4-lanes plus an auxiliary on/off lane in each direction. This scenario has a greater upfront cost but also allows for a more reliable bridge structure that meets current standards and regulations. The proposed bridge would also add one lane on both sides (6 lanes total) to alleviate traffic congestion. The new bridge alternative also includes a wider foot-bridge for walking or bike traffic. The new bridges would not require extended lane and bridge closures and have a lower maintenance cost when compared to the current bridges.
The recommended timeline for the construction of the new bridges is 2025 through 2029 for the Sagamore Bridge and 2030 to 2034 for the Bourne Bridge.
Benefits The benefits are the direct and quantifiable gains under the with-project scenario. The new bridges project will improve the reliability of bridge components and therefore significantly decrease the probability of failure. Benefits represent a reduction in emergency repair costs following a component failure and associated time value costs from lane closures related with these repairs. In addition, the new bridges will also have lower annual maintenance costs throughout the 50-year forecast. Modelling these phenomena provides a method to quantify the net benefits for current and future users.
Probability of Unsatisfactory Performance The probability of failure in this scenario is the same as described in the 4-lane replacement bridges, section 4.1.1.
Probabilistic Scenario Analysis The event trees used for this scenario are the same as described in the 4-lane replacement bridges, section 4.1.2.
Results of Monte Carlo Simulation The repair, navigation, and travel costs are determined as described in the existing condition using Monte Carlo Simulation. The results are detailed in Table D - 49 and Table D - 50.

Cape Cod Canal Highway Bridges, MA Final Appendix D - Economics Major Rehabilitation Evaluation Report D-83 March 2020
Table D - 49: Sagamore Bridge Replacement 4 Lanes with 2 Auxiliary Annual Costs
Annual Costs (rounded), ($000) Repair
Cost Navigation
Cost Travel Cost O&M Total
Alternative D 300 0.1 4,000 200 4,400
Table D - 50: Bourne Bridge Replacement 4 Lanes with 2 Auxiliary Annual Costs
Annual Costs (rounded), ($000) Repair
Cost Navigation
Cost Travel Cost O&M Total
Alternative D 500 0.2 6,300 200 7,000
Benefit of reduced congestion One additional benefit of the 6-lane replacement bridge is the improved traffic patterns with the additional acceleration/deceleration lane.
A similar method described in section 3.3, using TrafInfo analysis of vehicle hours traveled, was used to compare the value of time in traffic with the 6-lane bridge and compared it to the base condition. The annual total time savings is displayed in Table D - 51.
Table D - 51: Benefits of Reduced Congestion
Cost ($000) Both Replacement
Bridges Sagamore
Bridge Bourne Bridge Total Benefit 4,200 3,500 800 Annual Benefit 200 100 30
The benefits are fairly minimal due mainly to the fact that the approach infrastructure, owned by the State of Massachusetts, is not assumed to be improved. The current infrastructure, especially around the Bourne Rotary, is limited.
To determine the benefits of the alternative, the cost savings of emergency repairs in the base case and the new bridge alternative are compared by subtracting the costs of new bridge scenario from the base case total costs. The benefits of the replacement bridges are summarized in Table D - 52 and Table D - 53.

Cape Cod Canal Highway Bridges, MA Final Appendix D - Economics Major Rehabilitation Evaluation Report D-84 March 2020
Table D - 52: Sagamore Bridge Replacement 4 Lanes with 2 Auxiliary Benefits
Annual Costs, ($000) Total Cost - Base
Case Total Cost – New
Bridges Benefit Alternative D 122,100 4,400 117,800
Table D - 53: Bourne Bridge Replacement 4 Lanes with 2 Auxiliary Benefits
Annual Costs, ($000) Total Cost - Base
Case Total Cost – New
Bridges Benefit Alternative D 64,200 7,000 57,300
The occurrence of a component failure declines significantly over the study period after the replacement bridges are constructed. Therefore travel delay costs typically associated with these failures similarly are reduced. In addition, annual O&M costs for upkeep of the new bridges is reduced. The measurable benefit of replacing the bridges is the total cost savings of $117.8 million annually for the Sagamore Bridge and $57.3 million annually for the Bourne Bridge.
Cost of Alternative There will be limited impact to traffic as the new bridges will be constructed adjacent to the existing bridges. Therefore travel costs will not be included in the analysis.
Engineering Costs The majority of costs for this alternative will be incurred at the beginning of the construction timeline. The total cost of the construction for the new Sagamore Bridge is $468.6 million (2020 dollars). The total cost of the project for the Bourne Bridge is $696.2 million.
A major rehabilitation or new bridge will not be necessary after 50 years, though there will be subsequent scheduled repairs. The costs of the new bridges and subsequent major repairs are listed in Table D - 54 and Table D - 55.re
Table D - 54: Sagamore Bridge Replacement 4 Lanes with 2 Auxiliary Engineering Costs d.
Sagamore Bridge
Project Years Cost (000) 2020 dollars
New Bridge 2025-2029 $ 452,800 Major Repairs 2049 $ 7,900 Major Repairs 2069 $ 7,900
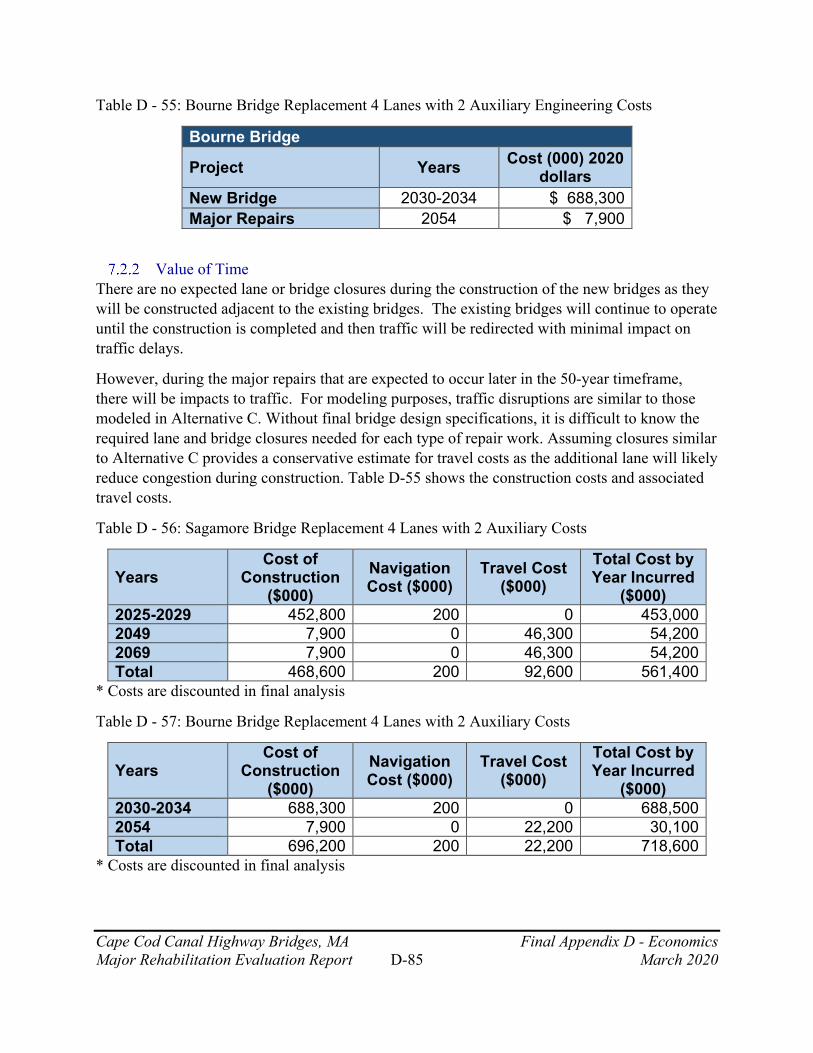
Cape Cod Canal Highway Bridges, MA Final Appendix D - Economics Major Rehabilitation Evaluation Report D-85 March 2020
Table D - 55: Bourne Bridge Replacement 4 Lanes with 2 Auxiliary Engineering Costs
Bourne Bridge
Project Years Cost (000) 2020 dollars
New Bridge 2030-2034 $ 688,300 Major Repairs 2054 $ 7,900
Value of Time There are no expected lane or bridge closures during the construction of the new bridges as they will be constructed adjacent to the existing bridges. The existing bridges will continue to operate until the construction is completed and then traffic will be redirected with minimal impact on traffic delays.
However, during the major repairs that are expected to occur later in the 50-year timeframe, there will be impacts to traffic. For modeling purposes, traffic disruptions are similar to those modeled in Alternative C. Without final bridge design specifications, it is difficult to know the required lane and bridge closures needed for each type of repair work. Assuming closures similar to Alternative C provides a conservative estimate for travel costs as the additional lane will likely reduce congestion during construction. Table D-55 shows the construction costs and associated travel costs.
Table D - 56: Sagamore Bridge Replacement 4 Lanes with 2 Auxiliary Costs
Years Cost of
Construction ($000)
Navigation Cost ($000)
Travel Cost ($000)
Total Cost by Year Incurred
($000) 2025-2029 452,800 200 0 453,000 2049 7,900 0 46,300 54,200 2069 7,900 0 46,300 54,200 Total 468,600 200 92,600 561,400
* Costs are discounted in final analysis
Table D - 57: Bourne Bridge Replacement 4 Lanes with 2 Auxiliary Costs
Years Cost of
Construction ($000)
Navigation Cost ($000)
Travel Cost ($000)
Total Cost by Year Incurred
($000) 2030-2034 688,300 200 0 688,500 2054 7,900 0 22,200 30,100 Total 696,200 200 22,200 718,600
* Costs are discounted in final analysis
Cape Cod Canal Highway Bridges, MA Final Appendix D - Economics Major Rehabilitation Evaluation Report D-86 March 2020
Total Annualized Cost The total costs are annualized to determine the annual cost over the 50 year study. Table D - 58 and Table D-58 exhibit the calculation. The time period used to calculate the interest during construction is 5 years.
Table D - 58: Sagamore Bridge Replacement 4 Lanes with 2 Auxiliary Total Annualized Cost
Cost ($000) Construction cost of replacement (2020 dollars) 452,800 Construction cost of additional repair work (2020 dollars) 15,800 Travel and navigation delay costs (2020 dollars) 92,600 Discount factor 2.875% Capital Recovery Factor 0.0379 Discounted cost of replacement cost 371,600 Discounted additional repair work 5,400 Discounted travel and navigation delay cost 31,900 Interest During Construction (IDC) 26,800 Total Cost 435,900 Annualized Cost 16,500
Table D - 59: Bourne Bridge Replacement 4 Lanes with 2 Auxiliary Total Annualized Cost
Cost ($000) Construction cost of replacement (2020 dollars) 688,300 Construction cost of additional repair work (2020 dollars) 7,900 Travel delay and navigation costs (2020 dollars) 22,200 Discount factor 2.875% Capital Recovery Factor 0.0379 Discounted cost of replacement 490,300 Discounted additional repair work 3,000 Discounted travel delay and navigation cost 8,500 Interest During Construction (IDC) 40,700 Total Cost 542,600 Annualized Cost 20,600
Bridge Replacement with Acceleration Lanes – Analysis Results The total benefits from decreased emergency repairs following component failures is compared to the total cost of the new bridge construction which includes engineering costs and scheduled repairs.

Cape Cod Canal Highway Bridges, MA Final Appendix D - Economics Major Rehabilitation Evaluation Report D-87 March 2020
Benefit Cost Ratio (BCR) Table D - 60 and Table D - 61 summarize the total benefits, costs, net benefits, and benefit-cost ratios of the replacement project.
Average annual benefits for the Sagamore Bridge replacement amounted to $117.8 million compared to average annual costs of $16.5 million yielding net benefits of $101.2 million. The BCR outcome of the Monte Carlo simulations has a mean of 7.1 and a standard deviation of 2.5 as shown in Figure D-41 below. At the 90% confidence interval, the BCR will be between 4.0 and 10.7, with a median expected outcome of all simulations of 6.9. Figure D - 42 displays the @RISK results for the net benefits. At the 90% confidence interval, the net benefits will be between $48.9 million and $159.7 million with the median value of $96.8 million.
Table D - 60: Sagamore Bridge Replacement 4 Lanes with 2 Auxiliary Annual Cost and BCR
Annual Cost ($000) Benefit Cost Net Benefit BCR
Alternative D 117,800 16,500 101,200 7.1
Figure D - 41: Sagamore 6 Lane Replacement @RISK Output BCR

Cape Cod Canal Highway Bridges, MA Final Appendix D - Economics Major Rehabilitation Evaluation Report D-88 March 2020
Figure D - 42: Sagamore 6 Lane Replacement @RISK Output BCR Net Benefits
Average annual benefits for the Bourne Bridge replacement amounted to $57.3 million compared to average annual costs of $20.6 yielding net benefits of $36.7 million. The BCR outcome of the Monte Carlo simulations has a mean of 2.8 and a standard deviation of 1.1 as shown in Figure D - 43 below. At the 90% confidence interval, the BCR will be between 1.3 and 4.4, with a median expected outcome of all simulations of 2.7. Figure D - 44 displays the @RISK results for the net benefits. At the 90% confidence interval, the net benefits will be between $6.3 million and $70 million with the median value of $34.6 million.
Table D - 61: Bourne Bridge Replacement 4 Lanes with 2 Auxiliary Annual Cost and BCR
Annual Cost ($000) Benefit Cost Net Benefit BCR
Alternative D 57,300 20,600 36,700 2.8
Cape Cod Canal Highway Bridges, MA Final Appendix D - Economics Major Rehabilitation Evaluation Report D-89 March 2020
Figure D - 43: Bourne 6 Lane Replacement @RISK Output BCR
Figure D - 44: Bourne 6 Lane Replacement @RISK Output Net Benefits
Summary of New Bridges Project The analysis supports construction of new 6-lane bridges for both bridges over maintaining the bridges in a “fix-as-fails” base condition. In addition, the cost-benefit ratios are also higher than

Cape Cod Canal Highway Bridges, MA Final Appendix D - Economics Major Rehabilitation Evaluation Report D-90 March 2020
the option to rehabilitate the current bridges. The study showed that both replacement projects result in positive net benefits and benefit-cost-ratios of greater than 1. The BCRs are slightly less than those experienced in the 4-lane replacement bridge scenario, this is due to the more expensive cost to build the bridges.
8 EXTENDED LIFE VALUE
The fifty year study period (2020-2069) is used to compare alternatives with the base condition. Fifty years captures the economic environment expected during that standardized time and does not measure the life of each alternative. It is important to highlight at the end of the fifty-year study period, 2069, the bridges will not be in equal condition across all alternatives. According to the American Association of State Highway and Transportation Office (AASHTO) Load and Resistance Factor Design (LRFD) the design life of bridges constructed today is seventy-five years. Therefore, the replacement bridge alternatives have an expected life significantly beyond the 2069. Given that construction on the replacement Sagamore Bridge is expected to be completed in 2029, the design life of the bridge will be through year 2103. Similarly, the Bourne Bridge is expected to be completed in 2034 and therefore the life of the bridge will be through year 2108. In addition over the fifty year study period there will be two scheduled major repairs that will help to extend the lives of the new bridges.
In contrast, the current bridges have already exceeded seventy-five years. Major rehabilitation projects can extend the life of the bridges but will be required more frequently as time progresses. In addition, the size of the continual rehabilitation projects are significantly more expensive than the scheduled repairs to extend the life of the new replacement bridges.
For more information, sections 3.2.1, 4.1.1, 5.1.1, and 6.1.1 above discuss the probability of unsatisfactory performance by alternative and bridge component. In these sections it is shown that by the end of the study period the probability of failure is not equal across all alternatives with the replacement bridge providing the lowest probabilities of failure at the end of the fifty-year period.
Ultimately, at the end of the study period the bridges for each alternative will not be in equivalent condition. The replacement bridges provide extended life value beyond the base condition and rehabilitation alternative.
9 2020 MODEL UPDATES
The draft version of this Major Rehabilitation or Replacement Evaluation Report was released to the public in October 2019. Following the release, the report was subject to various levels of review both internally and externally as well as public comments. Therefore, some inputs to the economic modelling have been updated. In the following sections (8.1 through 8.7) a summary of the updates are described as well as the final updated model results.

Cape Cod Canal Highway Bridges, MA Final Appendix D - Economics Major Rehabilitation Evaluation Report D-91 March 2020
Elimination of Alternative C The two existing bridges with their four through traffic lanes were designed and built in the 1930s to serve far lower traffic volumes than those served by the bridges today. Modern highway design guidance, including AASHTO highway and bridge design specifications and MassDOT design guidance require that entrance and exit ramps include auxiliary lanes for entering and exiting traffic to transition into or out of through traffic safely. Today’s higher traffic volumes and vehicle speeds require greater distances for traffic to transition. Distance between the on and off ramps, grades, and ramp turn diameters are all typical factors.
The FHWA stated the following in their comment letter:
Based on the close proximity of the interchanges and intersections at the end of each bridge, current standards for this type of facility include acceleration and deceleration lanes (also known as auxiliary lanes) going onto the bridges in most, if not all, four ends of the bridges. In final design, analysis will need to be done to determine if the auxiliary lanes should be continuous across each bridge for operational weaving and structural efficiency needs pending on the structure type, long span bridges such as these may gain cost efficiency with a uniform width.
MassDOT states the following with respect to the need for auxiliary lanes:
The design requirements used for the roadways, intersections, and interchanges shall be in accordance with and the 2006 MassDOT Project Development and Design Guide as well as 2018 American Association of State Highway and Transportation Officials (AASHTO) Policy on Geometric Design of Highway and Streets (“the Green Book”). See Chapter 10 of The Green Book which includes Tables 10-4 Minimum Acceleration Lane Lengths for Entrance Terminals…, Table 10-5 Speed Change Lane adjustment factors as a function of grade…, and Table 10-6 Minimum deceleration lane lengths for exit terminals…; these dictate the required lengths for this type of facility include acceleration and deceleration lanes (also known as auxiliary lanes).
Providing a replacement for the existing spans in-kind with respect to the number of through traffic lanes would not conform to current design guidance for bridges and highways. For this reason, providing new bridges without auxiliary lanes would not be consistent with best practices for traffic safety, and Alternative C will not be carried forward into detailed analysis.
Update to Discount Rate The discount rate used to convert future monetary values to present values was updated using the fiscal year 2020 rate of 2.750 percent (compared to 2.875 percent in fiscal year 2019). The associated 2020 capital recovery factor of 0.0370 was included in the model.
Update to Annual O&M Costs In the draft release of this Appendix, annual O&M costs were assumed to be $38,000 for both the Bourne and Sagamore Bridges in both Alternative C (4 lane) and Alternative D (4 lane with

Cape Cod Canal Highway Bridges, MA Final Appendix D - Economics Major Rehabilitation Evaluation Report D-92 March 2020
on/off auxiliary lanes). In this final model run, O&M estimates were re-evaluated for a more accurate estimate. O&M costs were updated to $21,600 annually in Alternative D for the Sagamore Bridge and $36,500 annually for the Bourne Bridge.
Update to Project Costs The cost of the major rehabilitation and replacement as well as scheduled major repairs for Alternatives B and D were updated during the Agency Technical Review (ATR), Independent External Peer Review (IEPR), Vertical Team Review (VT), and separate North Atlantic Division Cost Engineer review. For a detailed description of the changes to project costs refer to Appendix C – Cost Engineering. The tables below summarize the new cost numbers.
Alternative B – Major Rehabilitation
Table D - 62: Sagamore Bridge Updated Rehabilitation Engineering Costs
Sagamore Bridge Construction Cost
Project Years Cost (000) 2020 dollars
Major Rehab 2025-2027 $ 156,300 Complete painting 2045 $ 33,400 Truss Deck Replacement, floor beam repair, complete painting 2065 $ 110,900
The cost of the Sagamore Bridge major rehabilitation increased from $153.3 million to $156.3 million. The complete paining in 2045 increased from $22.9 million to $33.4 million. Finally, the cost of the major repairs in 2065 increased from $82.1 million to $110.9 million.
Table D - 63: Bourne Bridge Updated Rehabilitation Engineering Costs
Bourne Bridge Construction Cost
Project Years Cost (000) 2020 dollars
Major Rehab 2029-2031 $ 186,200 Complete painting 2049 $ 26,800 Truss Deck Replacement, floor beam repair, complete painting 2069 $ 132,100

Cape Cod Canal Highway Bridges, MA Final Appendix D - Economics Major Rehabilitation Evaluation Report D-93 March 2020
The cost of the Bourne Bridge major rehabilitation increased from $155.4 million to $186.2 million. The complete paining in 2049 increased from $19.3 million to $26.8 million. Additionally, the cost of the major repairs in 2069 increased from $95 million to $132.1 million.
Alternative D – Replacement with 4 lanes plus auxiliary on/off lanes
Table D - 64: Sagamore Bridge Replacement 4 Lanes with 2 Auxiliary Updated Engineering Costs
Sagamore Bridge
Project Years Cost (000) 2020 dollars
New Bridge 2025-2029 $ 486,100 Major Repairs 2049 $ 7,900 Major Repairs 2069 $ 7,900
The cost of replacing the Sagamore Bridge increased from $452.8 million to $486.1 million with subsequent major repairs remaining at $7.9 million.
Table D - 65: Bourne Bridge Replacement 4 Lanes with 2 Auxiliary Updated Engineering Costs
Bourne Bridge
Project Years Cost (000) 2020 dollars
New Bridge 2030-2034 $ 721,800 Major Repairs 2054 $ 7,900
The cost of replacing the Bourne Bridge increased from $688.3 million to $721.8 million with the major repair in 2054 remaining at $7.9 million.
8.5 Alternative A Model Results Table D - 66: Updated Base Condition Life Cycle Costs
Annual Costs (rounded), ($000) FY2020 Repair
Cost Navigation
Cost Travel Cost O&M Cost Total Sagamore Bridge Base Condition 2,800 0.7 120,700 400 123,900 Bourne Bridge Base Condition 3,200 0.7 61,700 300 65,200

Cape Cod Canal Highway Bridges, MA Final Appendix D - Economics Major Rehabilitation Evaluation Report D-94 March 2020
Annual costs in Alternative A increased from $122.1 million to $123.9 million for the Sagamore Bridge and increased from $64.2 million to $65.2 million for the Bourne Bridge.
Alternative B Model Results Table D - 67: Updated Rehabilitation Life Cycle Costs
Annual Costs (rounded), ($000) FY2020 Repair
Cost Navigation
Cost Travel Cost O&M Cost Total Sagamore Bridge Alternative B 300 0.6 8,000 400 8,700 Bourne Bridge Alternative B 400 0.6 5,400 300 6,100
Table D - 68: Updated Rehabilitation Benefits
Annual Costs, ($000)
Total Life
Cycle Cost – Alt. A
Total Life Cycle Cost – Alt. B Benefit
Sagamore Bridge Alternative B 123,900 8,800 115,100 Bourne Bridge Alternative B 65,200 6,100 59,100
Table D - 69: Updated Sagamore Bridge Rehabilitation Total Annualized Costs
Sagamore Bridge Cost ($000)
Alternative B: Rehabilitation
Construction cost (2020 dollars) 156,300 Construction cost of additional repair work (2020 dollars)
144,400
Travel delay costs (2020 dollars) 1,281,000 Discount factor 2.75% Capital Recovery Factor 0.0370 Discounted construction cost 132,900 Discounted additional repair work 49,700 Discounted travel delay cost 782,600

Cape Cod Canal Highway Bridges, MA Final Appendix D - Economics Major Rehabilitation Evaluation Report D-95 March 2020
Interest During Construction (IDC) 4,300
Total Cost 969,500 Annualized Cost 35,900
Table D - 70: Updated Bourne Bridge Rehabilitation Total Annualized Costs Bourne Bridge
Cost ($000) Alternative B:
Rehabilitation Construction cost (2020 dollars) 186,200 Construction cost of additional repair work (2020 dollars)
158,900
Travel delay costs (2020 dollars) 948,400
Discount factor 2.75% Capital Recovery Factor 0.0370 Discounted construction cost 142,000 Discounted additional rehab work 47,200
Discounted travel delay cost 536,700 Interest During Construction (IDC) 5,200
Total Cost 731,100 Annualized Cost 27,100
Table D - 71: Updated Benefits, Costs, and Benefit-Cost Ratio
Annual ($000) Benefit Cost Net Benefit BCR
Sagamore Bridge Alternative B 115,100 35,900 79,200 3.2 Bourne Bridge Alternative B 59,100 27,100 32,000 2.2
Updated values resulted in improved net benefits for the Sagamore Bridge major rehabilitation from $77.7 million annually to $79.2 million while net benefits declined slightly for the Bourne

Cape Cod Canal Highway Bridges, MA Final Appendix D - Economics Major Rehabilitation Evaluation Report D-96 March 2020
Bridge from $32.3 million annually to $32.0 million. The benefit-cost-ratio (BCR) remained at 3.2 for the Sagamore Bridge and went from 2.3 to 2.2 for the Bourne Bridge.
Alternative D Model Results Table D - 72: Updated Replacement Life Cycle Costs
Annual Costs (rounded), ($000) FY2020 Repair
Cost Navigation
Cost Travel Cost O&M Cost Total Sagamore Bridge Alternative D 300 0.1 4,000 200 4,500 Bourne Bridge Alternative D 500 0.2 6,300 200 7,000
Table D - 73: Updated Replacement Benefits
Annual Costs, ($000)
Total Life
Cycle Cost – Alt. A
Total Life Cycle Cost – Alt. D Benefit
Sagamore Bridge Alternative D 123,900 4,400 119,500 Bourne Bridge Alternative D 65,200 6,900 58,300
Table D - 74: Updated Sagamore Bridge Rehabilitation Total Annualized Costs
Sagamore Bridge Cost ($000)
Alt D: Replacement
4 Lanes with On/Off Auxiliary
Construction cost (2020 dollars) 486,100 Construction cost of additional repair work (2020 dollars)
15,800
Travel delay costs (2020 dollars) 92,800 Discount factor 2.75% Capital Recovery Factor 0.0370 Discounted construction cost 402,300 Discounted additional repair work 5,700
Cape Cod Canal Highway Bridges, MA Final Appendix D - Economics Major Rehabilitation Evaluation Report D-97 March 2020
Discounted travel delay cost 33,500 Interest During Construction (IDC) 27,500
Total Cost 469,000 Annualized Cost 17,400
Table D - 75: Updated Bourne Bridge Rehabilitation Total Annualized Costs Bourne Bridge
Cost ($000)
Alt D: Replacement
4 Lanes with On/Off Auxiliary
Construction cost (2020 dollars) 721,800 Construction cost of additional repair work (2020 dollars)
7,900
Travel delay costs (2020 dollars) 22,200
Discount factor 2.75% Capital Recovery Factor 0.0370 Discounted construction cost 521,600 Discounted additional rehab work 3,100
Discounted travel delay cost 8,900 Interest During Construction (IDC) 40,800
Total Cost 574,400 Annualized Cost 21,300
Table D - 76: Updated Benefits, Costs, and Benefit-Cost Ratio
Annual ($000) Benefit Cost Net Benefit BCR
Sagamore Bridge Alternative D 119,500 17,400 102,100 6.9 Bourne Bridge Alternative D 58,300 21,300 37,000 2.7

Cape Cod Canal Highway Bridges, MA Final Appendix D - Economics Major Rehabilitation Evaluation Report D-98 March 2020
Revisions to model inputs resulted in improved net benefits for both bridges. The Sagamore Bridge had net benefits increase from $101.2 million annually to $102.1 million while the Bourne Bridge net benefits went from $36.7 million annually to $37.0 million. The benefit-cost-ratio (BCR) dropped from 7.1 for the Sagamore Bridge and went from 2.8 to 2.7 for the Bourne Bridge.
10 SUMMARY OF RESULTS
Tables and Charts Table D - 77: Sagamore Bridge Summary Results
Scenario Simulation Comparison
Annual Life Cycle Cost* ($000) (from Table 1)
Annualized Costs ($000)
(from Table 2)
Annualized Benefits ($000)
Annualized Net
Benefits ($000)
BCR
Alt A: Base Condition Mean 123,900 - - - - Median 119,000 - - - - Alt B: Major Rehabilitation Mean 8,800 35,900 115,100 79,200 3.2 Median 6,600 35,900 112,400 76,500 3.1 Alt D: Replacement 4 Lanes with on/off Auxiliary Mean 4,400 17,400 119,500 102,100 6.9 Median 2,900 17,400 116,100 98,700 6.7
Table D - 78: Bourne Bridge Summary Results
Scenario Simulation Comparison
Annual Life Cycle Cost* ($000) (from
Table 1)
Annualized Costs ($000)
(from Table 2)
Annualized Benefits ($000)
Annualized Net
Benefits ($000)
BCR
Alt A: Base Condition Mean 65,200 - - - - Median 62,700 - - - - Alt B: Major Rehabilitation Mean 6,100 27,100 59,100 32,000 2.2 Median 4,800 27,100 57,900 30,800 2.1 Alt D: Replacement 4 Lanes with on/off Auxiliary

Cape Cod Canal Highway Bridges, MA Final Appendix D - Economics Major Rehabilitation Evaluation Report D-99 March 2020
Mean 6,900 21,300 58,300 37,000 2.7 Median 4,200 21,300 58,500 37,200 2.7
Rank of Alternatives Based on BCRs and Net Benefits, the rank of alternatives (with 1 being the most desirable) is:
1. Replacement bridges – 4 lanes with 2 auxiliary on/off lanes (Alternative D) 2. Rehabilitation of bridges (Alternative B) 3. Fix as fails base condition (Alternative A)
Conclusion The Sagamore and Bourne Bridges connect mainland Massachusetts to Cape Cod and provide vital routes of transportation for both residents and travelers on and off the Cape. The economic analysis suggests that fixing the current bridges as components deteriorate will lead to significant costs, particularly costs for travelers delayed in traffic.
The first alternative evaluated was major rehabilitation of the existing bridges. This scenario was supported by positive net benefits and a benefit-cost-ratio of 3.2 for the Sagamore Bridge and 2.2 for the Bourne Bridge. The advantage of the rehabilitation is a lower initial construction cost for the project when compared to replacing the bridges. The disadvantages are the high impact it will have on traffic patterns during the time of construction due to lane and full bridge closures. In addition, the bridges will not be brought up to current engineering standards and regulations. The major rehabilitation alternative is a higher risk option due to the faster rate of deterioration in the future. Deterioration of these structures can increase exponentially as these bridges age and may warrant the need for replacement in the future.
Alternatives for replacement bridges were also evaluated for 4-lane bridges (Alternative C) and for 4-lane bridges with auxiliary on/off lanes (Alternative D). Alternative C was eliminated as this design will not meet current highway safety requirements. Alternative D had higher net benefits and BCRs than the rehabilitation scenario. The disadvantage of the replacement bridges is the high initial cost of construction. The advantages of the replacement bridges are minimal disturbances to traffic during construction and replacing the aging infrastructure with bridges at current engineering standards and regulations.
The analysis suggests that the 4-lane bridges with auxiliary on/off lanes (Alternative D) are more economically justifiable given the lower annual costs over 50 years of analysis.
11 APPENDIX
Assumptions Assumptions include:

Cape Cod Canal Highway Bridges, MA Final Appendix D - Economics Major Rehabilitation Evaluation Report D-100 March 2020
Value of Time Calculation
• There was an assumption in the calculation done for Regulars and Visitors. Regulars live in the four surrounding towns of the bridges and visitors uses the Massachusetts state average household income.
• Visitors: average of vacation, social/recreation, and other (or all other activities not considered vacation, social/recreational, or work)
• Regular: average of work, social/recreation, and other • Traffic volumes increase linearly from 2014 to 2040 then are held constant after 2040. The
final year of forecast provided by TrafInfo is 2040. • Visitor trips within each trip table were projected from 2014 to 2040 using an annual growth
rate of 0.7% or a factor of 1.2 over the 26 year horizon. As part of the MassDOT’s Cape Cod Canal Crossing Study project, a detailed assessment was conducted into employment trends in Accommodations and Food Services as a proxy for visitor activity. A regression model was developed relating employment in Accommodations and Food Services with traffic volumes over the Bourne and Sagamore Bridges. The analysis indicated the visitor growth to be in the range of 0.12% to 0.7%. Based on discussions with the Cape Cod Commission and their inhouse estimates of visitor growth, the high end growth rate was used to allow for a more conservative analysis of the necessary highway improvements and to ensure the growth potential in the Cape was not constrained by the proposed highway infrastructure. The same factor was applied to all time periods and during both weekday and weekend.
• The non-visitor trip tables were projected using a three-step process. MassDOT Planning provided the population, household and employment projections for each TAZ for the year 2040. The employment data was broken into retail and non-retail employment. Using trip generation equations contained within the model, total trips generated at each TAZ were computed. The trip generation equations estimate the number of Home-Based Work (HBW) trips, Home-Based Other (HBO) trips, and Non Home-Based (NHB) trips. Each of these trip trips are broken into productions and attractions. The six trip types were computed for each of the four time periods (AM, MD, PM and NT) and were combined to obtain the total trips generated by each TAZ in 2014 and in 2040 for each time period.
• Expected travel times per vehicle over the major routes cannot exceed the given study time period. For example, the “AM” study period is between 6:00 AM to 9:00 AM therefore average travel times during this period are capped at 180 minutes.
• Real income was held constant over the 50 year study period. Though real income is likely to increase over time, holding real income constant is a more conservative estimate. Increasing income overtime would increase the value of time costs and therefore make travel costs associated with construction especially in Alternative A (base condition) and Alternative B (rehabilitation) larger. The results would not change the final recommendation for replacement of the bridges.

Cape Cod Canal Highway Bridges, MA Final Appendix D - Economics Major Rehabilitation Evaluation Report D-101 March 2020
• Volume of traffic held constant over the alternatives – in reality, travelers will likely choose not to travel over the bridge in the case of closures but held volume constant for comparison. There is the exception in peak summer time periods during closures where the number of trips decreased slightly as roads either met their capacity or drivers seek alternate routes to cross the bridges.
• For modeling purposes, traffic disruptions for Alternative D are similar to those modeled in Alternative C. Without final bridge design specifications, it is difficult to know the required lane and bridge closures needed for each type of repair work. Assuming closures similar to Alternative C provides a conservative estimate for travel costs as the additional lane will likely reduce congestion during construction. This assumption does not change the final recommendation for replacement bridges.
Monte Carlo Model
• Emergency repair costs are incurred in year of failure • Rehabilitation will reduce hazard years in reliability functions while replacement will reset
functions. Existing condition will continue to deteriorate. • All values in real 2020 dollars but discounted over time and final values annualized for
comparison • A rating of 4 or below may trigger the need for a repair, however, the year in which costs
are allocated and when the repair work is completed can vary depending a variety of factors including severity and budgetary constraints. If the “failure” is minimal the repair work could take several years for funding to be approved and construction to begin. For more severe failures, emergency funds could be approved and implemented more quickly. A detailed description of the current and historical ratings of the bridge components can be found in Appendix A-Engineering Reliability, section 4. Given the uncertainty and complexity of predicting when funds and repairs will occur, the economic modeling assumes costs and improvements are triggered in the same year as the component failure. This assumption could overestimate minor failure costs if those were to be delayed for several years as costs are discounted in future years. The impact will not be significant and will not change the final recommendation of this report as the assumption is held constant for all alternatives modeled. Additionally, in the base condition where there are more instances of failures, there is also a higher likelihood of severe failures in later years that will need to be addressed promptly.
Sensitivity Analysis Sensitivity analysis was performed to confirm that the assumptions underlying the model were appropriate. The sensitivity analysis in sections 10.1.1 through 10.1.5 were performed prior to the 2020 updated values described in section 8. Given there was minimal change in the resulting

Cape Cod Canal Highway Bridges, MA Final Appendix D - Economics Major Rehabilitation Evaluation Report D-102 March 2020
net benefits and BCRs, the sensitivity analysis is considered appropriate and updating the values would not change the conclusions.
Sensitivity Analysis on the Hazard Functions One topic of discussion between the economics, engineering, and risk team members was the effect of emergency repairs on the hazard functions. In early versions of the model, the hazard rates were reset or brought back a number of years in order to show that if repairs were done, the reliability of the bridge was improved. However, after further discussion the team determined that this method was lacking for two reasons. First, there can be a failure on one part of the bridge component and the repair does not fix the entire component and another failure can occur in the subsequent year on another section of the same component. Second, resetting the hazard rates was not accurately capturing a deteriorating base condition and not accurately showing how the bridge would weaken in the later years of the forecast horizon.
To test the sensitivity of changes to the reset of the hazard functions, the model was run with a maximum and minimum reset of the hazard functions after a component failure, holding all else constant. The resulting BCRs are shown in Table D-63.
The maximum reset (HF Reset Max) calls for repairs after a failure in the superstructure and substructures to reset the hazard year 20 years respectively, repairs after failures in the bridge deck resets the hazard year back to hazard year 1.
The minimum reset (HF Reset Min) scenario is a more conservative estimate in which all repairs after a component failure reset the hazard year back 10 years.
Table D - 79: Sensitivity Analysis Hazard Functions Mean BCRs
Major Rehabilitation
(Alt B)
Replacement Bridge 4
Lanes (Alt C)
Replacement Bridge 4
Lanes with Auxiliary
Lanes (Alt D) Sagamore Selected Scenario 3.2 7.7 7.1 HF Reset Max 0.4 1.2 1.1 HF Reset Min 0.8 2.2 2.0 Bourne Selected Scenario 2.3 3.1 2.8 HF Reset Max 0.3 0.4 0.4 HF Reset Min 0.5 0.8 0.7
Resetting the hazard function following an emergency repair had notable impact on the BCRs. The replacement BCRs remained higher than the major rehabilitation scenario’s BCRs and were

Cape Cod Canal Highway Bridges, MA Final Appendix D - Economics Major Rehabilitation Evaluation Report D-103 March 2020
positive with both the maximum and minimum reset options in the Sagamore Bridges. As mentioned previously, the justification for ultimately not resetting the hazard functions was based on engineering expertise in which resetting the functions did not accurately portray a deteriorating bridge in the later years of the study.
Sensitivity Analysis on the Event Tree Probabilities After determining that the hazard function should not be reset, the event tree probabilities, particularly the later existing condition years, were examined. In the later years of the base condition, the bridges should deteriorate with increasing severity but not experience an unrealistic number of severe failures.
The substructure probabilities remained at 90% of widespread deterioration if there was a substructure failure in any year, and 10% probability that it will be severe deterioration of the substructure. The existing condition conditions for the superstructure and bridge deck were investigated based on advice from engineering and risk experts.
Table D - 80 examines the mean BCRs of the review.
Table D - 80: Sensitivity Analysis Event Tree Probabilities Mean BCRs
Major Rehabilitation
(Alt B)
Replacement Bridge
4 Lanes (Alt C)
Replacement Bridge
4 Lanes with Auxiliary
Lanes (Alt D)
Average Critical/adv
Failures over 50 Years
Sagamore
Scenario 1 4.5 11.6 10.6 7.9 superstructure 3.7 bridge deck
Scenario 2 3.8 9.8 9.0 5.8 superstructure 3.7 bridge deck
Scenario 3 3.3 8.6 7.9 4.3 superstructure 3.7 bridge deck
Scenario 4 4.4 11.5 10.6 7.9 superstructure 3.1 bridge deck
Selected Scenario 3.2 7.7 7.1 4.3 superstructure
3.1 bridge deck Bourne
Scenario 1 3.4 4.9 4.4 7.9 superstructure 3.8 bridge deck
Scenario 2 2.8 4.0 3.6 5.8 superstructure 3.8 bridge deck
Scenario 3 2.4 3.5 3.1 4.4 superstructure 3.8 bridge deck

Cape Cod Canal Highway Bridges, MA Final Appendix D - Economics Major Rehabilitation Evaluation Report D-104 March 2020
Scenario 4 3.3 4.8 4.3 7.9 superstructure 3.1 bridge deck
Selected Scenario 2.3 3.1 2.8 4.4 superstructure
3.1 bridge deck
Scenario 1: Superstructure probability of non-critical failure at 0.9, critical failure at 0.0999, and catastrophic failure at 0.0001 in years 2020-2030. Superstructure probability of non-critical failure at 0.45, critical failure at 0.549, and catastrophic failure at 0.001 in years after 2030. Bridge deck probability of localized deterioration at 0.8 and widespread at 0.2 in years 2020-2030. Bridge deck probability of localized deterioration at 0.45 and widespread at 0.55 in after 2030.
Scenario 2: Superstructure probability of non-critical failure at 0.9, critical failure at 0.0999, and catastrophic failure at 0.0001 in years 2020-2030. Superstructure probability of non-critical failure at 0.6, critical failure at 0.399, and catastrophic failure at 0.001 in years after 2030. Bridge deck probability of localized deterioration at 0.8 and widespread at 0.2 in years 2020-2030. Bridge deck probability of localized deterioration at 0.45 and widespread at 0.55 in after 2030.
Scenario 3: Superstructure probability of non-critical failure at 0.9, critical failure at 0.0999, and catastrophic failure at 0.0001 in years 2020-2030. Superstructure probability of non-critical failure at 0.7, critical failure at 0.299, and catastrophic failure at 0.001 in years after 2030. Bridge deck probability of localized deterioration at 0.8 and widespread at 0.2 in years 2020-2030. Bridge deck probability of localized deterioration at 0.45 and widespread at 0.55 in after 2030.
Scenario 4: Superstructure probability of non-critical failure at 0.9, critical failure at 0.0999, and catastrophic failure at 0.0001 in years 2020-2030. Superstructure probability of non-critical failure at 0.45, critical failure at 0.549, and catastrophic failure at 0.001 in years after 2030. Bridge deck probability of localized deterioration at 0.8 and widespread at 0.2 in years 2020-2030. Bridge deck probability of localized deterioration at 0.55 and widespread at 0.45 in after 2030.
Selected Scenario: Superstructure probability of non-critical failure at 0.9, critical failure at 0.0999, and catastrophic failure at 0.0001 in years 2020-2030. Superstructure probability of non-critical failure at 0.7, critical failure at 0.299, and catastrophic failure at 0.001 in years after 2030. Bridge deck probability of localized deterioration at 0.8 and widespread at 0.2 in years 2020-2030. Bridge deck probability of localized deterioration at 0.55 and widespread at 0.45 in after 2030.
After analyzing the results and reviewing the average number of failures for each scenario it was determined that the more conservative estimate listed in Table D-70 as “Selected Scenario” was the best option.

Cape Cod Canal Highway Bridges, MA Final Appendix D - Economics Major Rehabilitation Evaluation Report D-105 March 2020
Sensitivity Analysis on Project Start Year Another analysis was performed on the project start date, moving out the start date of the rehabilitation and replacement projects three and five years to determine the optimal starting period. For the rehabilitation the Sagamore Bridge project was pushed out from 2025 to 2028 and 2030 respectively. The major rehabilitation for the Bourne Bridge was moved from 2029 to 2031 and 2034 respectively. For the replacement bridge scenario, the start of construction on the Sagamore Bridge was adjusted from 2025 to 2028 and 2030. The start of construction for the Bourne replacement bridge was pushed out from 2030 to 2033 and 2035. The analysis was still performed over 50 years 2020-2069. Table D-81 displays the results of the mean BCRs.
Table D - 81: Sensitivity Analysis Project Start Year Mean BCRs
Major Rehabilitation
(Alt B)
Replacement Bridge 4
Lanes (Alt C)
Replacement Bridge 4
Lanes with Auxiliary
Lanes (Alt D) Sagamore Selected Scenario 3.2 7.7 7.1 Start date out 3 years 3.1 8.5 7.8 Start date out 5 years 3.6 8.9 8.1 Bourne Selected Scenario 2.3 3.1 2.8 Start date out 3 years 2.9 3.5 3.2 Start date out 5 years 2.6 3.4 3.0
Moving the start date out three or five years had a minimal impact on the BCRs. The slight positive response when dates are moved out correlates to the shifting of some scheduled maintenance in the further out years that no longer are in the fifty year study period.
Sensitivity Analysis on the Value of Time The value of time calculation used to determine the cost of travelers stuck in traffic during emergency and planned construction included assumptions. The first assumption was to hold the forecast 2040 vehicle hours traveled (VHT) constant for years after 2040. To test the sensitivity of this assumption, the VHTs were linearly expanded for years after 2040 and the model was run again holding all else constant. Results for changes in BCRs are shown in Table D-66.
The second assumption made in the value of time calculation was to equally weight regulars as the average of social/recreational, work, and other while visitors were the average or social/recreational, other, and vacation. To test the sensitivity of these weights, the regulars were set to just work and the visitors were just vacationers. Both instances were looked at

Cape Cod Canal Highway Bridges, MA Final Appendix D - Economics Major Rehabilitation Evaluation Report D-106 March 2020
individually then again together to determine how much this assumption impacted the final BCRs. The results are shown in Table D-82.
Table D - 82: Sensitivity Analysis Value of Time Mean BCRs
Major Rehabilitation
(Alt B)
Replacement Bridge 4
Lanes (Alt C)
Replacement Bridge 4
Lanes with Auxiliary
Lanes (Alt D) Sagamore Selected Scenario 3.2 7.7 7.1 VHT linearly grown 4.0 12.1 11.1 Regulars – all work 3.2 7.8 7.1 Visitors – all vacation 3.2 8.1 7.5 Regulars – all work, and Visitors – all vacation 3.2 8.0 7.2
Bourne Selected Scenario 2.3 3.1 2.8 VHT linearly grown 2.9 4.6 4.1 Regulars – all work 2.3 3.2 2.8 Visitors – all vacation 2.3 3.3 3.0 Regulars – all work, and Visitors – all vacation 2.3 3.2 3.0
After analyzing the value of time assumption in the model it was determined that the assumptions were not extremely sensitive to changes and the selected assumptions tended on the more conservative side.
Sensitivity Analysis on Concurrent Replacement Bridge Construction Rehabilitation construction work cannot occur concurrently on both bridges given the need for lane and bridge closures. For this reason, it is proposed that the Sagamore Bridge undergoes the major rehabilitation starting in 2025, once completed there will be one year break from construction to allow some reprieve from traffic woes before commencement starts again on the Bourne Bridge starting in 2029.
In the replacement alternatives the assumption was made to construct the replacement Sagamore Bridge first starting in 2025 and once completed commence the construction to build the replacement Bourne Bridge in 2030. This assumption was made because there may be limited resources (ie. funding, construction personal, and/or equipment) and therefore there may only be capacity to build one bridge at a time.

Cape Cod Canal Highway Bridges, MA Final Appendix D - Economics Major Rehabilitation Evaluation Report D-107 March 2020
If resources were made available, the two replacement bridges could be constructed at the same time since there is no impact on traffic. Under this scenario both replacement projects would start in 2025 and be completed in 2029. This has no impact on the BCR for the Sagamore Bridge but would shift up the construction date of the Bourne Bridge. The resulting BCRs of this analysis is in Table D - 83 below.
Table D - 83: Sensitivity Analysis Replacement Bridges Built Concurrently
Replacement Bridge 4 Lanes (Alt C)
Replacement Bridge 4 Lanes with Auxiliary Lanes (Alt D)
Sagamore Selected Scenario 7.7 7.1 Bridges Built Concurrently 7.7 7.1 Bourne Selected Scenario 3.1 2.8 Bridges Built Concurrently 2.8 2.6
Shifting the start date of the replacement Bourne Bridge construction to 2025 has a minor negative impact on the BCR. The study period remained the same (2020-2069) and therefore if construction is completed in 2029 there will be additional repair work required every twenty years at 2049 and 2069 as compared to the selected scenario which only had one additional repair during the study period.
Sensitivity Analysis on Weight Restrictions
In the instance of a superstructure failure when there is an advanced deterioration of the main truss member or critical gusset plate, there will be 18 months of lane closures and trucks over 16 ton will be diverted to the sister bridge. The analysis estimates that 6% of traffic are trucks over 16 tons according to a MassDOT estimate. The model therefore routes 6% of traffic to the sister bridge, as if there is a full bridge closure for 12 months. The review process brought to light the concern that this method may be overstating the traffic implications for those trucks as traffic will not be as significant as a full bridge closure. In addition, in some instances two smaller trucks may be used in place of the larger trucks. To test the impact of this assumption a sensitivity analysis was performed.
First a sensitivity model (SA 1 in table below) was run as if all traffic was limited by a lane closure. This assumes two smaller trucks would be used in the place of one larger truck. The

Cape Cod Canal Highway Bridges, MA Final Appendix D - Economics Major Rehabilitation Evaluation Report D-108 March 2020
volume was held constant as there are capacity limitations. This model therefore will likely underestimate the cost to trucks in traffic.
The second sensitivity model (SA 2 in table below) was run in which 6% of traffic was rerouted to a free-flowing second bridge. This similarly underestimates the cost to trucks.
Table D - 84: Sensitivity Analysis Weight Restrictions
Major Rehabilitation
(Alt B)
Replacement Bridge 4
Lanes with Auxiliary
Lanes (Alt D) Sagamore Selected Scenario 3.2 6.9 SA 1 2.9 6.3 SA 2 2.8 6.2 Bourne Selected Scenario 2.2 2.7 SA 1 2.0 2.5 SA 2 2.0 2.3
The complexity of rerouting a percentage of traffic is difficult to accurately model within the traffic modeling framework. The assumption used in the main methodology is likely to overstate the impact of traffic while the methods used in the sensitivity analysis likely underestimate the impact of traffic. Ultimately, however the assumption used in the report does not impact the final conclusion made within the report. Replacement provides the highest benefits.

Cape Cod Canal Highway Bridges, MA Final Appendix D - Economics Major Rehabilitation Evaluation Report D-109 March 2020

Cape Cod Canal Highway Bridges, MA Final Appendix D - Economics Major Rehabilitation Evaluation Report D-110 March 2020
References:
i Massachusetts Office of Travel and Tourism, Economic Impact of Travel on Massachusetts Counties. Retrieved from https://www.massvacation.com/travel-trade/getting-around/stats-reports/ ii Michigan Department of Transportation. Bridge Structural Elements Diagram. Retrieved June 10, 2018, from https://www.michigan.gov/mdot/0,4616,7-151-9618_47418-173584--,00.html iii US Army Corps of Engineers. Engineering Pamphlet EP1130-2-500. December 27, 1996. F-2 iv US Army Corps of Engineers. Risk Reliability Engineering for Major Rehabilitation Studies. EC1110-2-6062. February 1, 2011. Chapter 5, 5-2 Consequence Event Trees and I-5. Event Trees 5.7.2015 v United States Census Bureau. American Fact Finder. Retrieved on August 31, 2018 from https://factfinder.census.gov/faces/nav/jsf/pages/index.xhtml vi US Department of Transportation. 2001 National Household Travel Survey. Retrieved on January 10, 2018, from https://www.rita.dot.gov/bts/sites/rita.dot.gov.bts/files/publications/highlights_of_the_2001_national_household_travel_survey/html/figure_09.html vii Office of Management and Budget. Fiscal Year 2018 President’s Budget. Economic Assumptions and Interactions with the Budget. Retrieved on January 11, 2018 from https://www.whitehouse.gov/sites/whitehouse.gov/files/omb/budget/fy2018/ap_2_assumptions.pdf viii Transportation Benefit-Cost Analysis. Retrieved on August 31, 2018, from http://bca.transportationeconomics.org/benefits/vehicle-operating-cost