bp second quarter 2011 results
TRANSCRIPT
8/3/2019 Bp Second Quarter 2011 Results
http://slidepdf.com/reader/full/bp-second-quarter-2011-results 1/43
BP p.l.c.Group resultsSecond quarter and half year 2011(a)
London 26 July 2011
FOR IMMEDIATE RELEASE
Second First Secondquarter quarter quarter First half
2010 2011 2011 2011 2010
$ million
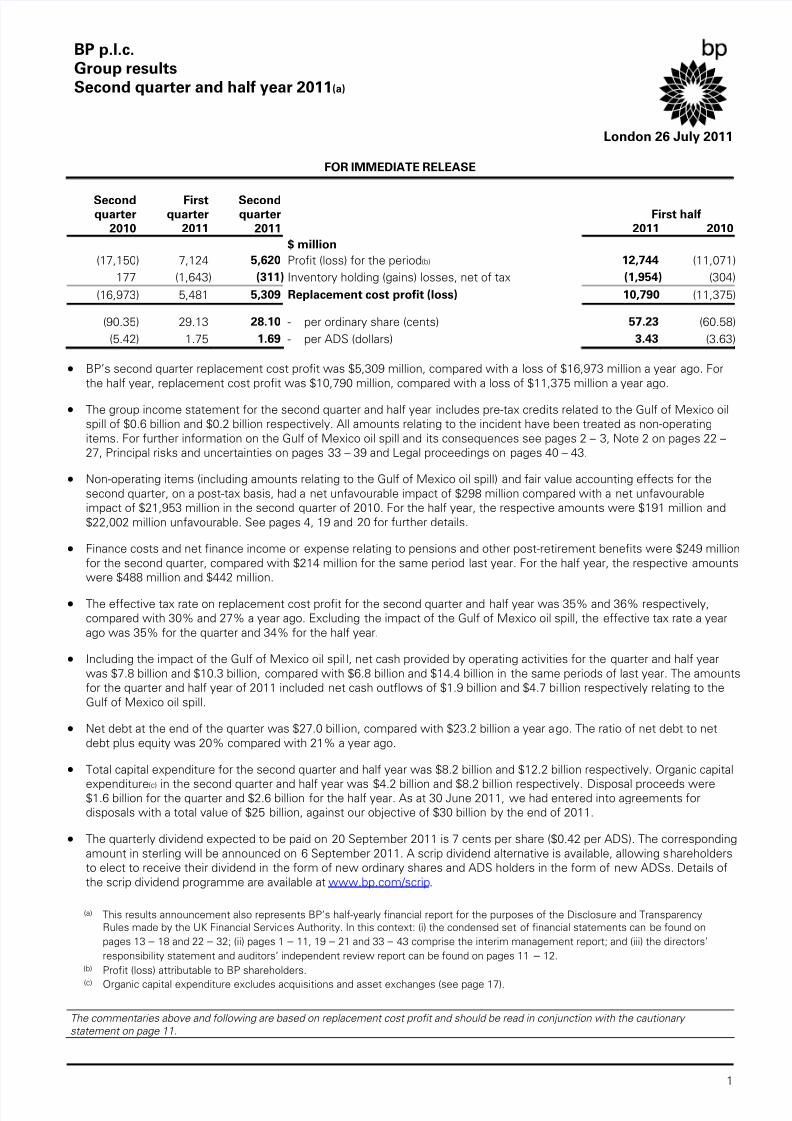
(17,150) 7,124 5,620 Profit (loss) for the period(b) 12,744 (11,071)
177 (1,643) (311) Inventory holding (gains) losses, net of tax (1,954) (304)
(16,973) 5,481 5,309 Replacement cost profit (loss) 10,790 (11,375)
(90.35) 29.13 28.10 - per ordinary share (cents) 57.23 (60.58)
(5.42) 1.75 1.69 - per ADS (dollars) 3.43 (3.63)
BP’s second quarter replacement cost profit was $5,309 million, compared with a loss of $16,973 million a year ago. Forthe half year, replacement cost profit was $10,790 million, compared with a loss of $11,375 million a year ago.
The group income statement for the second quarter and half year includes pre-tax credits related to the Gulf of Mexico oilspill of $0.6 billion and $0.2 billion respectively. All amounts relating to the incident have been treated as non-operatingitems. For further information on the Gulf of Mexico oil spill and its consequences see pages 2 – 3, Note 2 on pages 22 –27, Principal risks and uncertainties on pages 33 – 39 and Legal proceedings on pages 40 – 43.
Non-operating items (including amounts relating to the Gulf of Mexico oil spill) and fair value accounting effects for thesecond quarter, on a post-tax basis, had a net unfavourable impact of $298 million compared with a net unfavourableimpact of $21,953 million in the second quarter of 2010. For the half year, the respective amounts were $191 million and$22,002 million unfavourable. See pages 4, 19 and 20 for further details.
Finance costs and net finance income or expense relating to pensions and other post-retirement benefits were $249 millionfor the second quarter, compared with $214 million for the same period last year. For the half year, the respective amountswere $488 million and $442 million.
The effective tax rate on replacement cost profit for the second quarter and half year was 35% and 36% respectively,compared with 30% and 27% a year ago. Excluding the impact of the Gulf of Mexico oil spill, the effective tax rate a yearago was 35% for the quarter and 34% for the half year.
Including the impact of the Gulf of Mexico oil spil l, net cash provided by operating activities for the quarter and half yearwas $7.8 billion and $10.3 billion, compared with $6.8 billion and $14.4 billion in the same periods of last year. The amountsfor the quarter and half year of 2011 included net cash outflows of $1.9 billion and $4.7 billion respectively relating to theGulf of Mexico oil spill.
Net debt at the end of the quarter was $27.0 bill ion, compared with $23.2 billion a year ago. The ratio of net debt to netdebt plus equity was 20% compared with 21% a year ago.
Total capital expenditure for the second quarter and half year was $8.2 billion and $12.2 billion respectively. Organic capital
expenditure(c) in the second quarter and half year was $4.2 billion and $8.2 billion respectively. Disposal proceeds were$1.6 billion for the quarter and $2.6 billion for the half year. As at 30 June 2011, we had entered into agreements fordisposals with a total value of $25 billion, against our objective of $30 billion by the end of 2011.
The quarterly dividend expected to be paid on 20 September 2011 is 7 cents per share ($0.42 per ADS). The correspondingamount in sterling will be announced on 6 September 2011. A scrip dividend alternative is available, allowing shareholdersto elect to receive their dividend in the form of new ordinary shares and ADS holders in the form of new ADSs. Details ofthe scrip dividend programme are available at www.bp.com/scrip.
(a) This results announcement also represents BP’s half-yearly financial report for the purposes of the Disclosure and TransparencyRules made by the UK Financial Services Authority. In this context: (i) the condensed set of financial statements can be found onpages 13 – 18 and 22 – 32; (ii) pages 1 – 11, 19 – 21 and 33 – 43 comprise the interim management report; and (iii) the directors’responsibility statement and auditors’ independent review report can be found on pages 11 – 12.
(b) Profit (loss) attributable to BP shareholders.
(c) Organic capital expenditure excludes acquisitions and asset exchanges (see page 17).
The commentaries above and following are based on replacement cost profit and should be read in conjunction with the cautionary
statement on page 11.
1

8/3/2019 Bp Second Quarter 2011 Results
http://slidepdf.com/reader/full/bp-second-quarter-2011-results 2/43
Gulf of Mexico oil spill
Completing the response
The majority of the shoreline clean-up phase of the incident response was completed during the first quarter. During thesecond quarter, limited work continued to clean impacted marshes and barrier islands, and access to some areas wasrestricted due to wildlife breeding seasons. Patrolling is ongoing to respond to any further residual tar balls. Monitoringagainst established criteria continues, with the aim of assigning cleaned shorelines to a status in which no further treatment(NFT) is required. The majority of impacted shoreline has already been transitioned to NFT. Further shoreline surveys arescheduled for the fourth quarter of 2011, after the hurricane season, to identify any remaining clean-up needs.
The pilot project to retrieve remaining boom anchors from the coastal waters of Louisiana was completed and the Federal On-Scene Coordinator (FOSC) has confirmed that further action is not warranted.
Following the completion of the majority of the subsea work during the first quarter, decontamination of the Enterprise drillingrig and seabed survey work were completed during the second quarter. No further activity is planned at the well site.
The phased transition from the Gulf Coast incident management team (GC-IMT) to BP’s Gulf Coast Restoration Organization(GCRO) continues, and the response organization continues to maintain resources in line with operational requirements.
Economic restoration
A total of $6.8 billion has been paid out to fund economic and environmental restoration of the Gulf of Mexico. Thesepayments are for claims from individuals, businesses and government entities. $0.3 billion of this is for natural resourcedamage assessment.
Trust update
During the first half, BP made two scheduled contributions totalling $2.5 billion to the Deepwater Horizon Oil Spill Trust fund.The Trust was established in 2010 to satisfy legitimate individual and business claims administered by the Gulf Coast ClaimsFacility (GCCF), state and local government claims resolved by BP, final judgments and settlements, state and local responsecosts, and natural resource damages (NRD) and related costs. In early July, BP received a $1.1 billion settlement paymentfrom MOEX which was also paid into the Trust.
Payments from the Trust during the second quarter and half year respectively totalled $1.0 billion and $2.1 billion, of which inthe second quarter $873 million was paid through the GCCF to individual and business claimants, $87 million for NRDassessment costs, $17 million in relation to state and local government claims, and $33 million for other resolved items. As of30 June 2011, the cumulative amount paid from the Trust since its inception was $5.1 billion and BP’s cumulative
contributions to the Trust were $7.5 billion.
On 21 April 2011, BP announced a commitment of up to $1 billion for projects that will restore injured natural resources in theGulf at the earliest opportunity. These projects will undergo public review before they are funded.
Claims update
As of 30 June 2011, a total of $6.3 billion had been paid for individual, business and government claims. This includesamounts paid directly by BP prior to the establishment of the Trust.
During the emergency advance phase in 2010, the GCCF paid 169,172(a) claimants amounts totalling $2.6 billion. In the firstquarter of 2011, the GCCF issued its protocol for the resolution and finalization of claims allowing claimants submittinglegitimate claims to elect to (i) receive interim payments for substantiated past losses, or (ii) receive an offer for full and finalsettlement payment and release, with certain exceptions, their right to sue all potentially liable entities including BP. During
the second quarter, an additional 40,152 claimants filed claims at this second and final phase, taking the total number ofclaimants in this phase to 308,112 as of 30 June 2011. Of these, 150,672 claims have been paid and finalized for $1.7 billion,88,873 have been denied by the GCCF, 8,776 have been determined to have no loss and 559 claims were withdrawn. Theclaims of the remaining 59,232 claimants have not yet been finalized and are at various stages of the GCCF’s claims reviewprocess. Claimants electing to receive interim payments have been paid $208 million. As of 30 June 2011, $5.0 bill ion hadbeen paid either by the GCCF or by BP to individual and business claimants.
BP received 76 new claims from government entities during the second quarter, and has processed 88% of the total 965claims filed. Government entities have received $1.3 billion in payments for 797 claims since the incident occurred. Theremaining government claims are at various stages of the claims process.
Following the first-quarter agreement with the state of Alabama to provide $16 million for tourism promotion, BP completedsimilar agreements during the second quarter with the states of Florida and Mississippi for $30 million and $16 millionrespectively. Discussions are currently under way with the state of Mississippi regarding contributions for seafood testing and
marketing.
(a) Number of claimants updated from 169,005 as published in our first-quarter results announcement, reflecting a small number ofpayments made in the second quarter 2011 as a result of the resolution of outstanding claims from the emergency advance phase.At the end of the second quarter 2011, 273 emergency advance phase claims remained unresolved.
2

8/3/2019 Bp Second Quarter 2011 Results
http://slidepdf.com/reader/full/bp-second-quarter-2011-results 3/43
Gulf of Mexico oil spill (continued)
Environmental restoration
Last year, BP announced the creation of the independent Gulf of Mexico Research Initiative (GRI), a ten-year, $500-millionscientific research programme directed at studying the potential environmental and public health impacts of the DeepwaterHorizon accident. The master research agreement was signed in March 2011 and three Requests for Proposals (RFPs) fromresearch consortia or individual researchers are planned for this year, two of which were issued during the second quarter.
Financial update
In the second quarter we recognized a $0.6 billion reduction in the pre-tax charge for the incident. This reflects thesettlements with MOEX USA Corporation, the parent company of one of our partners in the MC252 exploration block, andWeatherford, a contractor on the Macondo well, partially offset by an incremental charge for spill response costs includingprovisioning for shoreline patrolling and maintenance costs, plus a charge for the ongoing quarterly expenses of the GulfCoast Restoration Organization. For the half year, the reduction in the pre-tax charge was $0.2 billion. In 2010, the pre-taxcharge recognized was $40.9 billion, which included the $20-billion Trust commitment.
Under the above settlement agreements, MOEX USA Corporation paid BP $1.1 billion in early July, which was subsequentlypaid to the Trust, and Weatherford have paid BP $75 million which will also be contributed to the $20-billion Trust.
The total amounts that will be paid by BP in relation to all obligations relating to the incident are subject to significantuncertainty as described further in Note 2 on pages 22 – 27. Also see Note 2, on page 27 under Contingent assets, for
information on partner recovery.
Legal proceedings and investigations
See Gulf of Mexico oil spill on pages 34 – 39 of BP’s Annual Report and Form 20-F 2010 and Legal proceedings onpages 40 – 43 herein for details of legal proceedings, including external investigations relating to the incident.
3

8/3/2019 Bp Second Quarter 2011 Results
http://slidepdf.com/reader/full/bp-second-quarter-2011-results 4/43
Analysis of replacement cost profit (loss) before interest and tax andreconciliation to profit (loss) for the period
Second First Secondquarter quarter quarter First half
2010 2011 2011 2011 2010
$ million
6,244 8,420 6,614 Exploration and Production 15,034 14,536
2,075 2,079 1,338 Refining and Marketing 3,417 2,804(70) (478) (598) Other businesses and corporate (1,076) (398)
(32,192) (384) 617 Gulf of Mexico oil spill response(a) 233 (32,192)
98 (542) 515 Consolidation adjustment (27) 306
(23,845) 9,095 8,486 RC profit (loss) before interest and tax(b) 17,581 (14,944)
Finance costs and net finance income orexpense relating to pensions and other
(214) (239) (249) post-retirement benefits (488) (442)
7,188 (3,314) (2,858) Taxation on a replacement cost basis (6,172) 4,222
(102) (61) (70) Minority interest (131) (211)
Replacement cost profit (loss) attributable
(16,973) 5,481 5,309 to BP shareholders 10,790 (11,375)
(284) 2,412 493 Inventory holding gains (losses) 2,905 421
Taxation (charge) credit on inventory holding107 (769) (182) gains and losses (951) (117)
Profit (loss) for the period attributable
(17,150) 7,124 5,620 to BP shareholders 12,744 (11,071)
(a) See Note 2 on pages 22 – 27 for further information on the accounting for the Gulf of Mexico oil spill response.(b) Replacement cost profit or loss reflects the replacement cost of supplies. For further information see page 18.
Total of non-operating items and fair value accounting effects (a)(b)
Second First Secondquarter quarter quarter First half
2010 2011 2011 2011 2010
$ million
(61) 739 (699) Exploration and Production 40 43
351 (117) (54) Refining and Marketing (171) 291
71 (181) (263) Other businesses and corporate (444) (47)
(32,192) (384) 617 Gulf of Mexico oil spill response 233 (32,192)
(31,831) 57 (399) Total before interest and taxation (342) (31,905)
– (16) (15) Finance costs(c) (31) –
(31,831) 41 (414) Total before taxation (373) (31,905)
9,878 66 116 Taxation credit (charge)(d) 182 9,903
(21,953) 107 (298) Total after taxation for the period (191) (22,002)
(a) An analysis of non-operating items by type is provided on page 19 and an analysis by region is shown on pages 7, 9 and 10.(b) Information on fair value accounting effects is non-GAAP. For further details, see page 20.(c) Finance costs relate to the Gulf of Mexico oil spill. See Note 2 on pages 22 – 27 for further details.(d) Tax is calculated using the quarter’s effective tax rate (excluding the impact of the Gulf of Mexico oil spill and, for the first quarter
2011, the impact of a $683-million one-off deferred tax adjustment in respect of the recently enacted increase in the supplementarycharge on UK oil and gas production) on replacement cost profit or loss. However, the US statutory tax rate has been used forexpenditures relating to the Gulf of Mexico oil spill that qualify for tax relief.
4

8/3/2019 Bp Second Quarter 2011 Results
http://slidepdf.com/reader/full/bp-second-quarter-2011-results 5/43
Per share amounts
Second First Secondquarter quarter quarter First half
2010 2011 2011 2011 2010
Per ordinary share (cents)(a)
(91.29) 37.86 29.75 Profit (loss) for the period 67.60 (58.96)
(90.35) 29.13 28.10 RC profit (loss) for the period 57.23 (60.58)
Per ADS (dollars)(a) (5.48) 2.27 1.79 Profit (loss) for the period 4.06 (3.54)
(5.42) 1.75 1.69 RC profit (loss) for the period 3.43 (3.63)
(a) See Note 6 on page 30 for details of the calculation of earnings per share.
Net debt ratio – net debt: net debt + equity
Second First Secondquarter quarter quarter First half
2010 2011 2011 2011 2010
$ million
30,580 47,102 46,890 Gross debt 46,890 30,58053 870 1,173 Less: fair value asset of hedges related to finance debt 1,173 53
30,527 46,232 45,717 45,717 30,527
7,310 18,726 18,749 Cash and cash equivalents 18,749 7,310
23,217 27,506 26,968 Net debt 26,968 23,217
86,362 103,183 108,408 Equity 108,408 86,362
21% 21% 20% Net debt ratio 20% 21%
See Note 7 on page 31 for further details on finance debt.
Net debt and net debt ratio are non-GAAP measures. Net debt includes the fair value of associated derivative financialinstruments that are used to hedge foreign exchange and interest rate risks relating to finance debt, for which hedgeaccounting is claimed. The derivatives are reported on the balance sheet within the headings ‘Derivative financial
instruments’. We believe that net debt and net debt ratio provide useful information to investors. Net debt enables investorsto see the economic effect of gross debt, related hedges and cash and cash equivalents in total. The net debt ratio enablesinvestors to see how significant net debt is relative to equity from shareholders.
Dividends
Dividends payable
BP today announced a dividend of 7 cents per ordinary share expected to be paid in September. The corresponding amount insterling will be announced on 6 September 2011, calculated based on the average of the market exchange rates for the fourdealing days commencing on 31 August 2011. Holders of American Depositary Shares (ADSs) will receive $0.42 per ADS. Thedividend is due to be paid on 20 September 2011 to shareholders and ADS holders on the register on 5 August 2011. A scripdividend alternative is available, allowing shareholders to elect to receive their dividend in the form of new ordinary shares andADS holders in the form of new ADSs. Details of the scrip dividend programme including the second-quarter dividend andtimetable are available at www.bp.com/scrip.
Dividends paid
Second First Secondquarter quarter quarter First half
2010 2011 2011 2011 2010
Dividends paid per ordinary share
– 7.000 7.000 cents 14.000 14.000
– 4.3372 4.2809 pence 8.6181 8.679
– 42.00 42.00 Dividends paid per ADS (cents) 84.00 84.00
Scrip dividends– 66.6 72.8 Number of shares issued (millions) 139.4 –
– 510 525 Value of shares issued ($ million) 1,035 –
5

8/3/2019 Bp Second Quarter 2011 Results
http://slidepdf.com/reader/full/bp-second-quarter-2011-results 6/43
Exploration and Production
Second First Secondquarter quarter quarter First half
2010 2011 2011 2011 2010
$ million 6,189 8,535 6,619 Profit before interest and tax 15,154 14,505
55 (115) (5) Inventory holding (gains) losses (120) 31
6,244 8,420 6,614 Replacement cost profit before interest and tax 15,034 14,536
By region1,798 1,875 731 US 2,606 4,560
4,446 6,545 5,883 Non-US 12,428 9,976
6,244 8,420 6,614 15,034 14,536
The replacement cost profit before interest and tax for the second quarter and half year was $6,614 million and$15,034 million respectively, increases of 6% and 3% compared with the same periods in 2010. The second quarter wasimpacted by net non-operating charges of $664 million, mainly comprising impairment and other related charges in NorthAmerica, partially offset by gains on disposals and fair value gains on embedded derivatives. The half year included a net non-operating gain of $46 million, with disposal gains more than offsetting impairment and other non-operating charges. In thesecond quarter and half year, fair value accounting effects had unfavourable impacts of $35 million and $6 million respectivelycompared with unfavourable impacts of $122 million and $59 million in the same periods of last year.
The primary additional factors impacting replacement cost profit for both periods, compared with a year ago, were higher
realizations partially offset by lower production volumes including the impact of divestments. In addition, there were higherearnings from equity-accounted entities (mainly TNK-BP) and an improved contribution from gas marketing and trading, partlyoffset by higher costs including rig standby costs in the Gulf of Mexico, higher turnaround and related maintenanceexpenditure, higher exploration write-offs, and certain other one-off charges. In the third quarter, we expect costs to continueto be impacted by rig standby costs, and by turnaround and related maintenance expenditure.
Production for the quarter was 3,433mboe/d, 11% lower than the second quarter of 2010. After adjusting for the effect ofacquisitions and divestments and entitlement impacts in our production-sharing agreements (PSAs), the decrease was 7%.This primarily reflects lower Gulf of Mexico production, as a result of ongoing decline owing to the suspension of drillingactivity and also the impact of turnaround and maintenance activity, and continuing maintenance and turnaround activityweighted towards other higher-margin areas, including the Greater Plutonio turnaround in Angola and the North Sea. This waspartly offset by Iraq production.
For the first half of the year, production was 3,505mboe/d, also 11% lower than in the same period last year. After adjustingfor the effect of acquisitions and divestments and PSA entitlement impacts, first-half production was 7% lower than in 2010.
Looking ahead, production in the third quarter is expected to reflect the continuation of the divestment programme, ongoingseasonal turnaround activity across the portfolio and the ongoing decline in the Gulf of Mexico. We continue to expectproduction in 2011 to be in line with our February guidance of around 3.4 million barrels of oil equivalent per day, with theexact outcome depending on the timing of acquisitions and divestments and PSA entitlement impacts.
We continue to make strategic progress. In May, we received final regulatory approval and completed the purchase of tenexploration and production blocks in Brazil from Devon Energy, announced in March last year.
Also in May, the Republic of Azerbaijan ratified the new PSA between BP and SOCAR on joint exploration and developmentof the Shafag-Asiman structure in the Azerbaijan sector of the Caspian Sea, which was originally signed in October 2010.Under the 30-year PSA, BP will be the operator with a 50% interest while SOCAR will hold the remaining 50% equity.
On 6 July, BP sold half of the 3.29% interest in the ACG development in the Caspian Sea, which had been acquired fromDevon Energy last year, to Azerbaijan (ACG) Limited (an affiliate wholly owned and controlled by the State Oil Company of theRepublic of Azerbaijan) for $585 million subject to completion adjustments.
On 22 July, the Indian Minister of Petroleum announced approval for BP’s alliance with Reliance Industries. While we await
formal written approval, we understand the acquisition by BP of a 30% interest in 21 blocks, including the already producingKG-D6, have been unconditionally approved. Upon receipt of written approval, we can proceed with obtaining final regulatoryapproval of the Reserve Bank of India and then proceed to completion. The Sales and Purchase Agreement dated 21 February2011 concerned 23 blocks and the Minister's decision on the final two blocks will be taken in due course.
On 25 July, BP announced it had been awarded a 100% interest, under PSAs, in Trinidad and Tobago deepwater blocks 23(a)and TTDAA 14.
In line with UK regulatory requirements, the following is a summary of the principal disclosures made in our first-quarterresults announcement. We were awarded four deepwater offshore exploration blocks in the Ceduna Sub Basin, off the coastof South Australia. Reliance Industries Limited and BP announced an alliance involving BP taking a 30% stake in 23 oil and gasPSAs operated by Reliance in India, and the formation of a 50:50 joint venture for the sourcing and marketing of gas in India.These agreements are subject to regulatory and other approvals. The joint venture will also endeavour to accelerate thecreation of infrastructure for receiving, transporting and marketing of natural gas in India. BP confirmed that it has beenawarded interests in four new coalbed methane PSAs in South Kalimantan, Indonesia. Following BP’s announced intention of
selling its interests in Wytch Farm and all of BP’s operated gas fields in the southern North Sea, including associated pipelineinfrastructure and the Dimlington terminal. BP agreed in May to sell its interests in the Wytch Farm, Wareham, Beacon andKimmeridge fields to Perenco UK Ltd for up to $610 million in cash.
6

8/3/2019 Bp Second Quarter 2011 Results
http://slidepdf.com/reader/full/bp-second-quarter-2011-results 7/43
Exploration and Production
Second First Secondquarter quarter quarter First half
2010 2011 2011 2011 2010
$ million Non-operating items
(156) 4 (730) US (726) (218)
217 706 66 Non-US 772 320
61 710 (664) 46 102
Fair value accounting effects(a)
(35) 25 (18) US 7 46
(87) 4 (17) Non-US (13) (105)
(122) 29 (35) (6) (59)
Exploration expense
64 308 625 US(b) 933 133
68 91 54 Non-US(c) 145 119
132 399 679 1,078 252
Production (net of royalties)(d)
Liquids (mb/d)(e) 581 523 465 US 494 623
184 166 151 Europe 158 199
859 856 860 Russia 858 854
759 725 653 Rest of World 689 779
2,383 2,270 2,129 2,199 2,455
Natural gas (mmcf/d)
2,240 1,905 1,833 US 1,869 2,231
551 373 391 Europe 382 575
647 719 675 Russia 697 660
5,046 4,589 4,664 Rest of World 4,626 5,0768,484 7,586 7,563 7,574 8,542
Total hydrocarbons (mboe/d)(f)
968 851 781 US 816 1,007
279 230 218 Europe 224 298
971 980 976 Russia 978 968
1,628 1,517 1,458 Rest of World 1,487 1,655
3,846 3,578 3,433 3,505 3,928
Average realizations(g)
72.90 93.93 106.99 Total liquids ($/bbl) 99.98 72.35
3.76 4.21 4.54 Natural gas ($/mcf) 4.37 4.01
47.08 59.00 63.23 Total hydrocarbons ($/boe)(h) 61.05 48.16
(a) These effects represent the favourable (unfavourable) impact relative to management’s measure of performance. Furtherinformation on fair value accounting effects is provided on page 20.
(b) First quarter and first half 2011 include $93 million related to decommissioning of idle infrastructure, as required by BOEMRE’sNotice to Lessees No. 2010-GO5 issued in October 2010. Second quarter and first half 2011 include $395 million classified withinthe ‘other’ category of non-operating items.
(c) First quarter and first half 2011 include $44 million classified within the ‘other’ category of non-operating items.(d) Includes BP’s share of production of equity-accounted entities.(e) Crude oil and natural gas liquids.(f) Natural gas is converted to oil equivalent at 5.8 billion cubic feet = 1 million barrels.(g) Based on sales of consolidated subsidiaries only - this excludes equity-accounted entities.(h) A minor amendment has been made in the first quarter 2011.
Because of rounding, some totals may not agree exactly with the sum of their component parts.
7

8/3/2019 Bp Second Quarter 2011 Results
http://slidepdf.com/reader/full/bp-second-quarter-2011-results 8/43
Refining and Marketing
Second First Secondquarter quarter quarter First half
2010 2011 2011 2011 2010
$ million
1,850 4,367 1,820 Profit before interest and tax 6,187 3,258
225 (2,288) (482) Inventory holding (gains) losses (2,770) (454)
2,075 2,079 1,338 Replacement cost profit before interest and tax 3,417 2,804By region
757 640 (17) US 623 694
1,318 1,439 1,355 Non-US 2,794 2,110
2,075 2,079 1,338 3,417 2,804
The replacement cost profit before interest and tax for the second quarter and half year was $1,338 million and $3,417 millionrespectively, compared with $2,075 million and $2,804 million for the same periods last year.
The 2011 results included net non-operating charges of $218 million for the second quarter and $235 million for the half year,mainly comprising impairment charges, primarily associated with our US divestment programme, partly offset by gains ondisposal. A year ago, there were net non-operating gains of $232 million and $162 million respectively. Fair value accounting
effects had favourable impacts of $164 million for the second quarter and $64 million for the half year. The correspondingperiods in 2010 reflected favourable impacts of $119 million and $129 million respectively.
Compared with a year ago, the second-quarter result reflected an improved refining environment, which was more than offsetby the swing to a small loss in supply and trading, reduced economic utilization at the Texas City refinery following the recentweather-related power outage, higher turnaround activities, and certain one-off charges. In addition to the factors mentionedabove, the first half benefited from a particularly strong first-quarter supply and trading contribution, which more than offsetthe weak contribution in the second quarter, strong refining feedstock optimization in the US due to BP’s location advantagein accessing WTI-priced crude grades and higher petrochemicals’ aromatics margins.
In the second quarter, refining throughputs in the fuels value chains reduced by over 170mb/d compared with the sameperiod last year primarily due to operational issues following the recent power outage at the Texas City refinery. Solomonrefining availability (as defined in footnote (b) on page 9) was 94.8% for the quarter.
In the international businesses, petrochemicals production volumes were down in the second quarter by approximately 8%compared with the same period last year, driven primarily by shutdowns following the power outage at the Texas Citypetrochemicals site, a tornado strike at the Decatur plant and turnaround activity at the Cooper River plant.
Looking ahead, we expect a typical seasonal decline in refining margins in the third quarter. Throughput at the Texas Cityrefinery has been largely restored and we expect the last of the impacted units to return to full capacity during August. Weexpect petrochemicals production volumes to improve compared with the second quarter following the recent full recovery ofoperations at our Decatur, Texas City and Cooper River petrochemicals sites. The planned turnaround activity in the secondhalf of 2011 is expected to be lower than in the first half.
Early last year we announced our exit from five countries in southern Africa. The sale of BP Zambia and BP Malawi to PumaEnergy was completed in the second quarter of 2011, with completion of BP Tanzania, the last piece of this disposal, tofollow.
Following a strategic review, we announced earlier this year our intent to divest the Texas City refinery and the southern partof our US West Coast fuels value chain, including the Carson refinery.
In the second quarter, we also executed agreements confirming the sale of 33 refined products terminals and 992 miles ofpipelines as part of the ongoing divestment programme of a number of non-strategic pipelines and terminals in the US.
8

8/3/2019 Bp Second Quarter 2011 Results
http://slidepdf.com/reader/full/bp-second-quarter-2011-results 9/43
Refining and Marketing
Second First Secondquarter quarter quarter First half
2010 2011 2011 2011 2010
$ millionNon-operating items
151 (16) (239) US (255) 148
81 (1) 21 Non-US 20 14
232 (17) (218) (235) 162
Fair value accounting effects(a)
37 (48) 71 US 23 53
82 (52) 93 Non-US 41 76
119 (100) 164 64 129
Refinery throughputs (mb/d)1,350 1,194 1,190 US 1,192 1,358
770 768 749 Europe 758 775
309 307 314 Rest of World 311 295
2,429 2,269 2,253 Total throughput 2,261 2,428
94.6 93.9 94.8 Refining availability (%)(b) 94.3 94.9Sales volumes (mb/d)(c) Marketing sales by region
1,466 1,375 1,407 US 1,391 1,442
1,312 1,267 1,298 Europe 1,283 1,369
622 610 613 Rest of World 611 626
3,400 3,252 3,318 Total marketing sales 3,285 3,437
2,544 2,256 2,729 Trading/supply sales 2,494 2,583
5,944 5,508 6,047 Total refined product sales 5,779 6,020
Refining Marker Margin (RMM) ($/bbl)(d)
15.02 16.18 15.75 US West Coast 15.96 12.44
11.24 10.81 16.81 US Gulf Coast 13.83 10.787.24 3.55 13.00 US Midwest 8.31 6.13
11.21 11.07 11.69 North West Europe 11.38 10.51
9.59 9.09 8.49 Mediterranean 8.79 8.93
10.48 14.69 15.00 Singapore 14.85 10.54
11.04 11.02 13.92 BP Average RMM 12.48 10.06
Chemicals production (kte) 1,088 1,135 766 US 1,901 2,028
1,067 985 1,050 Europe(e) 2,035 2,130
1,846 1,918 1,846 Rest of World 3,764 3,734
4,001 4,038 3,662 Total production(e) 7,700 7,892
(a) These effects represent the favourable (unfavourable) impact relative to management’s measure of performance. Further informationon fair value accounting effects is provided on page 20.
(b) Refining availability represents Solomon Associates’ operational availability, which is defined as the percentage of the year that a unitis available for processing after subtracting the annualized time lost due to turnaround activity and all planned mechanical, processand regulatory maintenance downtime.
(c) Does not include volumes relating to crude oil.(d) The Refining Marker Margin (RMM) is the average of regional indicator margins weighted for BP's crude refining capacity in each
region. Each regional marker margin is based upon product yields and a marker crude oil deemed appropriate for the region. Theregional marker margins may not be representative of the margins achieved by BP in any period because of BP’s particular refineryconfigurations and crude and product slate.
(e) A minor amendment has been made in the second quarter and first half 2010.
9
8/3/2019 Bp Second Quarter 2011 Results
http://slidepdf.com/reader/full/bp-second-quarter-2011-results 10/43
Other businesses and corporate
Second First Secondquarter quarter quarter First half
2010 2011 2011 2011 2010
$ million
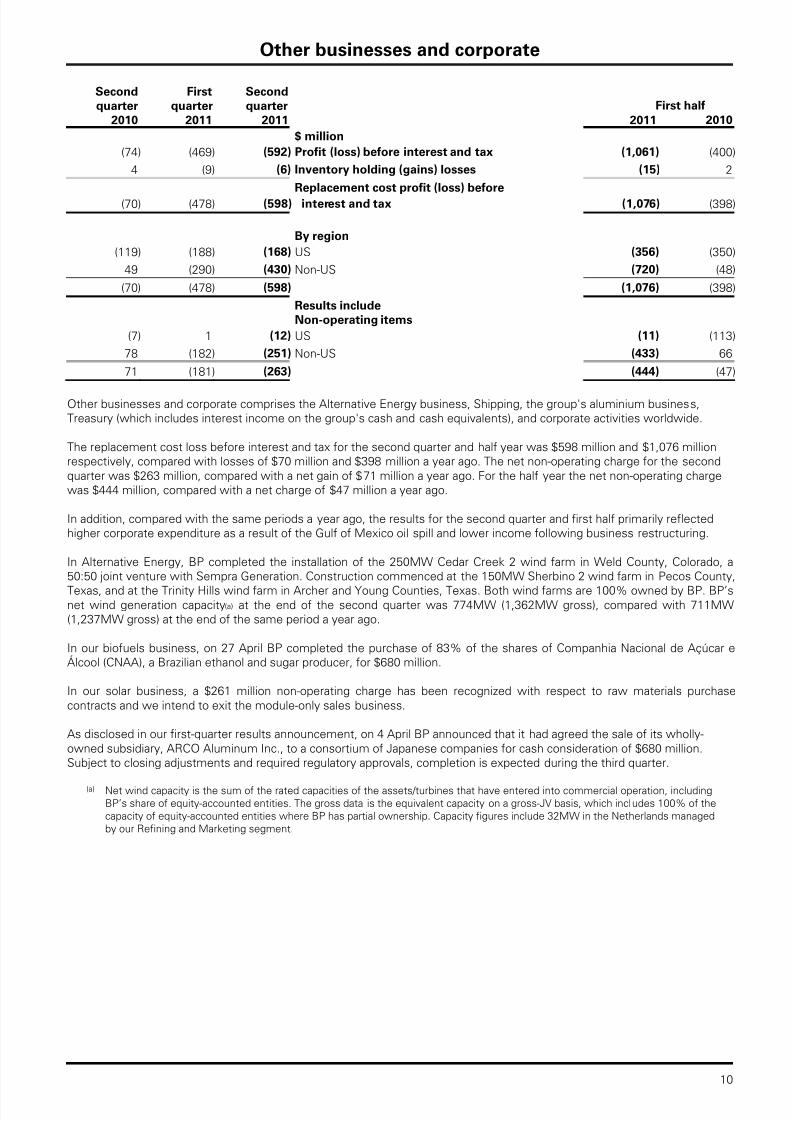
(74) (469) (592) Profit (loss) before interest and tax (1,061) (400)
4 (9) (6) Inventory holding (gains) losses (15) 2
Replacement cost profit (loss) before
(70) (478) (598) interest and tax (1,076) (398)
By region
(119) (188) (168) US (356) (350)
49 (290) (430) Non-US (720) (48)
(70) (478) (598) (1,076) (398)
Results includeNon-operating items
(7) 1 (12) US (11) (113)
78 (182) (251) Non-US (433) 66
71 (181) (263) (444) (47)
Other businesses and corporate comprises the Alternative Energy business, Shipping, the group's aluminium business,Treasury (which includes interest income on the group's cash and cash equivalents), and corporate activities worldwide.
The replacement cost loss before interest and tax for the second quarter and half year was $598 million and $1,076 millionrespectively, compared with losses of $70 million and $398 million a year ago. The net non-operating charge for the secondquarter was $263 million, compared with a net gain of $71 million a year ago. For the half year the net non-operating chargewas $444 million, compared with a net charge of $47 million a year ago.
In addition, compared with the same periods a year ago, the results for the second quarter and first half primarily reflectedhigher corporate expenditure as a result of the Gulf of Mexico oil spill and lower income following business restructuring.
In Alternative Energy, BP completed the installation of the 250MW Cedar Creek 2 wind farm in Weld County, Colorado, a50:50 joint venture with Sempra Generation. Construction commenced at the 150MW Sherbino 2 wind farm in Pecos County,
Texas, and at the Trinity Hills wind farm in Archer and Young Counties, Texas. Both wind farms are 100% owned by BP. BP’snet wind generation capacity(a) at the end of the second quarter was 774MW (1,362MW gross), compared with 711MW(1,237MW gross) at the end of the same period a year ago.
In our biofuels business, on 27 April BP completed the purchase of 83% of the shares of Companhia Nacional de Açúcar eÁlcool (CNAA), a Brazilian ethanol and sugar producer, for $680 million.
In our solar business, a $261 million non-operating charge has been recognized with respect to raw materials purchasecontracts and we intend to exit the module-only sales business.
As disclosed in our first-quarter results announcement, on 4 April BP announced that it had agreed the sale of its wholly-owned subsidiary, ARCO Aluminum Inc., to a consortium of Japanese companies for cash consideration of $680 million.Subject to closing adjustments and required regulatory approvals, completion is expected during the third quarter.
(a) Net wind capacity is the sum of the rated capacities of the assets/turbines that have entered into commercial operation, includingBP’s share of equity-accounted entities. The gross data is the equivalent capacity on a gross-JV basis, which includes 100% of thecapacity of equity-accounted entities where BP has partial ownership. Capacity figures include 32MW in the Netherlands managedby our Refining and Marketing segment.
10

8/3/2019 Bp Second Quarter 2011 Results
http://slidepdf.com/reader/full/bp-second-quarter-2011-results 11/43
Cautionary statement
Cautionary statement regarding forward-looking statements: The discussion in this results announcement contains forward-lookingstatements particularly those regarding the quarterly dividend payment; the timing of surveys of shoreline impacted by the Gulf of Mexicooil spill; the segregation of an additional $500 million of the Trust balance to cover costs associated with projects that will restore injured natural resources in the Gulf; the issuance of further Requests for Proposals pursuant to the Gulf of Mexico Research Initiative and themaster research agreement thereunder; expectations regarding the impacts on costs of rig standby costs and of turnaround and related maintenance expenditures; the expected impact on third-quarter production of the divestment programme, ongoing seasonal turnaround activity across BP’s portfolio, and the ongoing decline of production in the Gulf of Mexico; expected full-year 2011 production, and theimpact of acquisitions and divestments and PSA entitlement on full-year 2011 production; the magnitude and timing of remaining
remediation costs related to the Gulf of Mexico oil spill; the factors that could affect the magnitude of BP’s ultimate exposure and the cost to BP in relation to the spill and any potential mitigation resulting from BP’s partners or others involved in the spill; the potentialliabilities resulting from pending and future legal proceedings and potential investigations and civil or criminal actions that US stateand/or local governments could seek to take against BP as a result of the spill; the timing of claims and litigation outcomes and of payment of legal costs; the anticipated timing for completion of the disposition of certain BP assets; contributions to and payments from the trust fund and the setting aside of assets while the fund is building; expectations for third-quarter refining margins; expectations for operationsat the Texas City refinery; expected improvements in petrochemicals production volumes following the recent full recovery of operations at BP’s Decatur, Texas City and Cooper River petrochemicals sites; lower anticipated planned turnaround activity in the second half of 2011; the sale of BP Tanzania; the intentions of BP’s solar business to exit its module-only sales business; the anticipated timing of thecompletion of the disposition of ARCO Aluminum Inc.; exploration activity in four deepwater offshore blocks off of Australia; the timing for publication of investigation reports; the impact of BP’s potential liabilities relating to the Gulf of Mexico oil spill on the group,including its business, results and financial condition; the anticipated commencement of the trial regarding allegations pertaining to the Atlantis platform; and BP’s intentions to strongly defend itself against any claim for breach of the TNK-BP shareholders agreement that may be brought by Alfa, Access and Renova. By their nature, forward-looking statements involve risk and uncertainty because they relate
to events and depend on circumstances that will or may occur in the future. Actual results may differ from those expressed in suchstatements, depending on a variety of factors including the timing of bringing new fields onstream; future levels of industry product supply;demand and pricing; OPEC quota restrictions; PSA effects; operational problems; general economic conditions; political stability and economic growth in relevant areas of the world; changes in laws and governmental regulations; regulatory or legal actions including thetypes of enforcement action pursued and the nature of remedies sought; the impact on our reputation following the Gulf of Mexico oil spill;exchange rate fluctuations; development and use of new technology; the success or otherwise of partnering; the actions of competitors,trading partners, creditors, rating agencies and others; natural disasters and adverse weather conditions; changes in public expectationsand other changes to business conditions; wars and acts of terrorism or sabotage; and other factors discussed under “Risk factors” in our Annual Report and Form 20-F 2010 as filed with the US Securities and Exchange Commission (SEC).
Statement of directors’ responsibilities
The directors confirm that, to the best of their knowledge, the condensed set of financial statements on pages
13 – 18 and 22 – 32 has been prepared in accordance with IAS 34 ‘Interim Financial Reporting’, and that the interimmanagement report on pages 1 – 11, 19 – 21 and 33 – 43 includes a fair review of the information required by the Disclosureand Transparency Rules.
The directors draw attention to Note 2 to the condensed set of financial statements on pages 22 – 27 which describes theuncertainties surrounding the amounts and timings of liabilities arising from the Gulf of Mexico oil spill.
The directors of BP p.l.c. are listed on page 84 of BP Annual Report and Form 20-F 2010, with the exception of DJ Flint andDS Julius who retired at the 2011 Annual General Meeting.
By order of the board
Bob Dudley Byron GroteGroup Chief Executive Chief Financial Officer25 July 2011 25 July 2011
11

8/3/2019 Bp Second Quarter 2011 Results
http://slidepdf.com/reader/full/bp-second-quarter-2011-results 12/43
Independent review report to BP p.l.c.
We have been engaged by the company to review the condensed set of financial statements in the half-yearly financial reportfor the six months ended 30 June 2011 which comprises the group income statement, group statement of comprehensiveincome, group statement of changes in equity, group balance sheet, condensed group cash flow statement, the related tableson pages 17 and 18, and Notes 1 to 9. We have read the other information contained in the half-yearly financial report andconsidered whether it contains any apparent misstatements or material inconsistencies with the information in thecondensed set of financial statements.
This report is made solely to the company in accordance with guidance contained in International Standard on ReviewEngagements (UK and Ireland) 2410, ‘Review of Interim Financial Information Performed by the Independent Auditor of theEntity’ issued by the Auditing Practices Board for use in the United Kingdom (ISRE 2410). To the fullest extent permitted bylaw, we do not accept or assume responsibility to anyone other than the company, for our work, for this report, or for theconclusions we have formed.
Directors’ responsibilities
The half-yearly financial report is the responsibility of, and has been approved by, the directors. The directors are responsiblefor preparing the half-yearly financial report in accordance with the Disclosure and Transparency Rules of the UnitedKingdom’s Financial Services Authority.
As disclosed in Note 1, the annual financial statements of the group are prepared in accordance with International FinancialReporting Standards (IFRS) as issued by the International Accounting Standards Board (IASB) and IFRS as adopted by the
European Union (EU). The condensed set of financial statements included in this half-yearly financial report has been preparedin accordance with International Accounting Standard 34, ‘Interim Financial Reporting’, as issued by the IASB and as adoptedby the EU.
Our responsibility
Our responsibility is to express to the company a conclusion on the condensed set of financial statements in the half-yearlyfinancial report based on our review.
Scope of review
We conducted our review in accordance with ISRE 2410. A review of interim financial information consists of makingenquiries, primarily of persons responsible for financial and accounting matters, and applying analytical and other reviewprocedures. A review is substantially less in scope than an audit conducted in accordance with International Standards onAuditing (UK and Ireland) and consequently does not enable us to obtain assurance that we would become aware of al lsignificant matters that might be identified in an audit. Accordingly, we do not express an audit opinion.
Conclusion
Based on our review, nothing has come to our attention that causes us to believe that the condensed set of financialstatements in the half-yearly financial report for the six months ended 30 June 2011 is not prepared, in all material respects,in accordance with International Accounting Standard 34 as issued by the IASB and as adopted by the EU and the Disclosureand Transparency Rules of the United Kingdom’s Financial Services Authority.
Emphasis of matter – significant uncertainty over provisions and contingencies related to the Gulf of Mexico oil spill
In forming our review conclusion we have considered the adequacy of the disclosures made in Note 2 to the financial
statements concerning the provisions, future expenditures for which reliable estimates cannot be made and othercontingencies related to the Gulf of Mexico oil spill significant event. The total amounts that will ultimately be paid by BP inrelation to all obligations relating to the incident are subject to significant uncertainty and the ultimate exposure and cost to BPwill be dependent on many factors. Actual costs could ultimately be significantly higher or lower than those recorded as theclaims and settlement process progresses. Our review conclusion is not qualified in respect of these matters.
Ernst & Young LLPLondon25 July 2011
The maintenance and integrity of the BP p.l.c. website are the responsibility of the directors; the review work carried out bythe auditors does not involve consideration of these matters and, accordingly, the auditors accept no responsibility for anychanges that may have occurred to the financial statements since they were initially presented on the website.
Legislation in the United Kingdom governing the preparation and dissemination of financial statements may differ fromlegislation in other jurisdictions
12

8/3/2019 Bp Second Quarter 2011 Results
http://slidepdf.com/reader/full/bp-second-quarter-2011-results 13/43
Group income statement
Second First Secondquarter quarter quarter First half
2010 2011 2011 2011 2010
$ million
73,725 85,329 101,364 Sales and other operating revenues (Note 4) 186,693 146,796
Earnings from jointly controlled entities – after257 262 303 interest and tax 565 660
Earnings from associates – after interest760 1,409 1,255 and tax 2,664 1,523
158 124 151 Interest and other income 275 300
971 1,188 775 Gains on sale of businesses and fixed assets 1,963 1,009
75,871 88,312 103,848 Total revenues and other income 192,160 150,288
54,536 61,721 78,281 Purchases 140,002 106,177
Production and manufacturing37,979 6,508 6,200 expenses(a)(b) 12,708 43,719
1,238 1,831 2,356 Production and similar taxes (Note 5) 4,187 2,514
2,780 2,835 2,671 Depreciation, depletion and amortization 5,506 5,776
Impairment and losses on sale of businesses(56) 59 1,383 and fixed assets 1,442 108
132 399 679 Exploration expense 1,078 252
2,939 2,907 3,448 Distribution and administration expenses(b) 6,355 5,959
452 545 (149) Fair value (gain) loss on embedded derivatives 396 306
(24,129) 11,507 8,979 Profit (loss) before interest and taxation 20,486 (14,523)
225 308 314 Finance costs(a) 622 463
Net finance income relating to(11) (69) (65) pensions and other post-retirement benefits (134) (21)
(24,343) 11,268 8,730 Profit (loss) before taxation 19,998 (14,965)
(7,295) 4,083 3,040 Taxation(a) 7,123 (4,105)
(17,048) 7,185 5,690 Profit (loss) for the period 12,875 (10,860)
Attributable to
(17,150) 7,124 5,620 BP shareholders 12,744 (11,071)
102 61 70 Minority interest 131 211
(17,048) 7,185 5,690 12,875 (10,860)
Earnings per share – cents (Note 6)
Profit for the period attributable to BP shareholders
(91.29) 37.86 29.75 Basic 67.60 (58.96)
(91.29) 37.42 29.39 Diluted 66.82 (58.96)
(a)
See Note 2 on pages 22 – 27 for further details of the impact of the Gulf of Mexico oil spill on the income statement line items.(b) Cash costs for the second quarter of 2011 increased significantly compared to the same period a year ago and reflected higherturnaround and related maintenance spend, rig standby costs in the Gulf of Mexico and certain one-off charges. Cash costs are asubset of production and manufacturing expenses plus distribution and administration expenses. They represent the substantialmajority of the expenses in these line items but exclude associated non-operating items (including amounts relating to the Gulf ofMexico oil spill), and certain costs that are variable, primarily with volumes (such as freight costs). They are the principal operatingand overhead costs that management considers to be most directly under their control although they include certain foreignexchange and commodity price effects.
13

8/3/2019 Bp Second Quarter 2011 Results
http://slidepdf.com/reader/full/bp-second-quarter-2011-results 14/43
Group statement of comprehensive income
Second First Secondquarter quarter quarter First half
2010 2011 2011 2011 2010
$ million
(17,048) 7,185 5,690 Profit (loss) for the period 12,875 (10,860)
(1,000) 657 401 Currency translation differences 1,058 (1,526)
Exchange (gains) losses on translation offoreign operations transferred to gain or loss39 11 2 on sales of businesses and fixed assets 13 39
Available-for-sale investments marked to(230) 266 (95) market 171 (323)
Available-for-sale investments – recycled to(143) (2) (3) the income statement (5) (143)
(245) 118 75 Cash flow hedges marked to market 193 (407)
Cash flow hedges – recycled to the income21 (16) (112) statement (128) (73)
Cash flow hedges – recycled to the balance18 2 (5) sheet (3) 31
(48) (5) 57 Taxation 52 (167)
(1,588) 1,031 320 Other comprehensive income (expense) 1,351 (2,569)
(18,636) 8,216 6,010 Total comprehensive income (expense) 14,226 (13,429)
Attributable to
(18,737) 8,139 5,946 BP shareholders 14,085 (13,632)
101 77 64 Minority interest 141 203
(18,636) 8,216 6,010 14,226 (13,429)
Group statement of changes in equity
BPshareholders’ Minority Total
equity interest equity
$ million
At 1 January 2011 94,987 904 95,891
Total comprehensive income 14,085 141 14,226
Dividends (1,603) (132) (1,735)
Share-based payments (net of tax) 25 – 25
Transactions involving minority interests – 1 1
At 30 June 2011 107,494 914 108,408
BPshareholders’ Minority Total
equity interest equity
$ million
At 1 January 2010 101,613 500 102,113
Total comprehensive income (expense) (13,632) 203 (13,429)
Dividends (2,626) (131) (2,757)
Share-based payments (net of tax) 135 – 135
Transactions involving minority interests – 300 300At 30 June 2010 85,490 872 86,362
14

8/3/2019 Bp Second Quarter 2011 Results
http://slidepdf.com/reader/full/bp-second-quarter-2011-results 15/43
Group balance sheet
30 June 31 December2011 2010
$ million Non-current assets
Property, plant and equipment 112,205 110,163
Goodwill 9,470 8,598
Intangible assets 16,768 14,298
Investments in jointly controlled entities 12,483 12,286Investments in associates 14,093 13,335
Other investments 1,366 1,191
Fixed assets 166,385 159,871
Loans 868 894
Other receivables 5,804 6,298
Derivative financial instruments 4,267 4,210
Prepayments 1,521 1,432
Deferred tax assets 546 528
Defined benefit pension plan surpluses 2,573 2,176
181,964 175,409
Current assetsLoans 256 247
Inventories 27,477 26,218
Trade and other receivables 42,922 36,549
Derivative financial instruments 3,796 4,356
Prepayments 3,983 1,574
Current tax receivable 268 693
Other investments 1,413 1,532
Cash and cash equivalents 18,749 18,556
98,864 89,725
Assets classified as held for sale (Note 3) 10,167 7,128
109,031 96,853
Total assets 290,995 272,262
Current liabilities
Trade and other payables 51,010 46,329
Derivative financial instruments 3,273 3,856
Accruals 6,126 5,612
Finance debt 12,445 14,626
Current tax payable 3,883 2,920
Provisions 9,060 9,489
85,797 82,832Liabilities directly associated with assets classified as held for sale (Note 3) 1,127 1,047
86,924 83,879
Non-current liabilitiesOther payables 10,259 14,285
Derivative financial instruments 3,705 3,677
Accruals 391 637
Finance debt 34,445 30,710
Deferred tax liabilities 13,751 10,908
Provisions 23,287 22,418
Defined benefit pension plan and other post-retirement benefit plan deficits 9,825 9,85795,663 92,492
Total liabilities 182,587 176,371
Net assets 108,408 95,891
Equity
BP shareholders’ equity 107,494 94,987Minority interest 914 904
108,408 95,891
15

8/3/2019 Bp Second Quarter 2011 Results
http://slidepdf.com/reader/full/bp-second-quarter-2011-results 16/43
Condensed group cash flow statement
Second First Secondquarter quarter quarter First half
2010 2011 2011 2011 2010
$ million Operating activities
(24,343) 11,268 8,730 Profit (loss) before taxation 19,998 (14,965)Adjustments to reconcile profit before taxation
to net cash provided by operating activitiesDepreciation, depletion and amortization
2,833 3,127 3,275 and exploration expenditure written off 6,402 5,850
Impairment and (gain) loss on sale of(1,027) (1,129) 608 businesses and fixed assets (521) (901)
Earnings from equity-accounted entities,(92) (1,446) 666 less dividends received (780) (761)
Net charge for interest and other finance(61) 51 (121) expense, less net interest paid (70) (15)
150 (124) 113 Share-based payments (11) 4
Net operating charge for pensions and otherpost-retirement benefits, less contributions
(171) (439) (159) and benefit payments for unfunded plans (598) (661)
17,739 273 (64) Net charge for provisions, less payments 209 17,691
Movements in inventories and other current13,464 (7,823) (3,283) and non-current assets and liabilities(a) (11,106) 11,524
(1,739) (1,354) (1,917) Income taxes paid (3,271) (3,320)
6,753 2,404 7,848 Net cash provided by operating activities 10,252 14,446
Investing activities
(4,273) (5,774) (4,289) Capital expenditure(b) (10,063) (8,562)
(1,268) (2) (3,884) Acquisitions, net of cash acquired (3,886) (1,268)
(100) (89) (66) Investment in jointly controlled entities (155) (182)
(19) (11) (19) Investment in associates (30) (25)
636 384 1,273 Proceeds from disposal of fixed assets(c) 1,657 744
Proceeds from disposal of businesses, net of87 586 376 cash disposed(c) 962 87
203 35 116 Proceeds from loan repayments 151 259
(4,734) (4,871) (6,493) Net cash used in investing activities (11,364) (8,947)
Financing activities
31 12 18 Net issue of shares 30 159
756 4,917 2,696 Proceeds from long-term financing 7,613 1,098
(192) (2,622) (3,102) Repayments of long-term financing (5,724) (2,687)
(1,855) 949 (157) Net increase (decrease) in short-term debt 792 (2,102)
– (808) (795) Dividends paid – BP shareholders (1,603) (2,626)
(128) (6) (96) – Minority interest (102) (131)
(1,388) 2,442 (1,436) Net cash provided by (used in) financing activities 1,006 (6,289)
Currency translation differences relating to(162) 195 104 cash and cash equivalents 299 (239)
Increase (decrease) in cash and cash469 170 23 equivalents 193 (1,029)
Cash and cash equivalents at beginning6,841 18,556 18,726 of period 18,556 8,339
7,310 18,726 18,749 Cash and cash equivalents at end of period 18,749 7,310
(a) Includes: 284 (2,412) (493) Inventory holding (gains) losses (2,905) (421)452 545 (149) Fair value (gain) loss on embedded derivatives 396 306
12,430 (2,864) (2,912) Movements related to Gulf of Mexico oil spill response (5,776) 12,430
Inventory holding gains and losses and fair value gains and losses on embedded derivatives are also included within profit before
taxation. See Note 2 for further information on the cash flow impacts of the Gulf of Mexico oil spill.(b) First quarter 2011 included $2,000 million paid as a deposit relating to the transact ion with Reliance Industries Limited.
See page 6 for further information.(c) Included in disposal proceeds are deposits received in respect of disposal transactions expected to complete in subsequent periods
as follows: second quarter 2011 $568 million; first quarter 2011 $57.5 million; second quarter 2010 nil. For further information seeNote 7.
16

8/3/2019 Bp Second Quarter 2011 Results
http://slidepdf.com/reader/full/bp-second-quarter-2011-results 17/43
Capital expenditure and acquisitions
Second First Secondquarter quarter quarter First half
2010 2011 2011 2011 2010
$ million By business
Exploration and Production
3,024 1,023 1,001 US(a) 2,024 4,157
2,172 2,111 5,439 Non-US(b) 7,550 4,987
5,196 3,134 6,440 9,574 9,144
Refining and Marketing
704 522 626 US 1,148 1,232
221 215 313 Non-US 528 365
925 737 939 1,676 1,597
Other businesses and corporate
30 130 126 US 256 58
61 20 689 Non-US(c) 709 100
91 150 815 965 1586,212 4,021 8,194 12,215 10,899
By geographical area
3,758 1,675 1,753 US(a) 3,428 5,447
2,454 2,346 6,441 Non-US(b)(c) 8,787 5,452
6,212 4,021 8,194 12,215 10,899
Included above:
1,767 9 4,005 Acquisitions and asset exchanges(a)(b)(c) 4,014 1,767
(a) Second quarter and first half 2010 included capital expenditure of $1,767 million in the US Deepwater Gulf of Mexico as part of thetransaction with Devon Energy announced in first quarter 2010.
(b) Second quarter and first half 2011 include capital expenditure of $3,236 million in Brazil as part of the transaction with Devon Energyannounced in first quarter 2010.
(c) Second quarter and first half 2011 include capital expenditure of $680 million in Brazil relating to the acquisition of CNAA. See page10 for further information.
Exchange rates
Second First Secondquarter quarter quarter First half
2010 2011 2011 2011 2010
1.49 1.60 1.63 US dollar/sterling average rate for the period 1.62 1.52
1.51 1.61 1.60 US dollar/sterling period-end rate 1.60 1.511.27 1.37 1.44 US dollar/euro average rate for the period 1.40 1.32
1.22 1.41 1.44 US dollar/euro period-end rate 1.44 1.22
17

8/3/2019 Bp Second Quarter 2011 Results
http://slidepdf.com/reader/full/bp-second-quarter-2011-results 18/43
Analysis of replacement cost profit (loss) before interest and tax andreconciliation to profit (loss) before taxation(a)
Second First Secondquarter quarter quarter First half
2010 2011 2011 $ million 2011 2010
By businessExploration and Production
1,798 1,875 731 US 2,606 4,560
4,446 6,545 5,883 Non-US 12,428 9,976
6,244 8,420 6,614 15,034 14,536
Refining and Marketing
757 640 (17) US 623 694
1,318 1,439 1,355 Non-US 2,794 2,110
2,075 2,079 1,338 3,417 2,804
Other businesses and corporate
(119) (188) (168) US (356) (350)
49 (290) (430) Non-US (720) (48)
(70) (478) (598) (1,076) (398)
8,249 10,021 7,354 17,375 16,942
(32,192) (384) 617 Gulf of Mexico oil spill response 233 (32,192)98 (542) 515 Consolidation adjustment (27) 306
Replacement cost profit (loss) before(23,845) 9,095 8,486 interest and tax(b) 17,581 (14,944)
Inventory holding gains (losses)(c)
(55) 115 5 Exploration and Production 120 (31)
(225) 2,288 482 Refining and Marketing 2,770 454
(4) 9 6 Other businesses and corporate 15 (2)
(24,129) 11,507 8,979 Profit (loss) before interest and tax 20,486 (14,523)
225 308 314 Finance costs 622 463
Net finance income relating to pensions and other(11) (69) (65) post-retirement benefits (134) (21)
(24,343) 11,268 8,730 Profit (loss) before taxation 19,998 (14,965)Replacement cost profit (loss) beforeinterest and tax
By geographical area
(29,171) 1,813 1,361 US 3,174 (26,581)
5,326 7,282 7,125 Non-US 14,407 11,637
(23,845) 9,095 8,486 17,581 (14,944)
(a) IFRS requires that the measure of profit or loss disclosed for each operating segment is the measure that is provided regularly to the
chief operating decision maker for the purposes of performance assessment and resource allocation. For BP, this measure of profitor loss is replacement cost profit or loss before interest and tax. In addition, a reconciliation is required between the total of theoperating segments' measures of profit or loss and the group profit or loss before taxation.
(b) Replacement cost profit or loss reflects the replacement cost of supplies. The replacement cost profit or loss for the period is arrived
at by excluding from profit or loss inventory holding gains and losses and their associated tax effect. Replacement cost profit or lossfor the group is not a recognized GAAP measure.
(c) Inventory holding gains and losses represent the difference between the cost of sales calculated using the average cost to BP ofsupplies acquired during the period and the cost of sales calculated on the first-in first-out (FIFO) method after adjusting for anychanges in provisions where the net realizable value of the inventory is lower than its cost. Under the FIFO method, which we usefor IFRS reporting, the cost of inventory charged to the income statement is based on its historic cost of purchase, or manufacture,rather than its replacement cost. In volatile energy markets, this can have a significant distorting effect on reported income. Theamounts disclosed represent the difference between the charge (to the income statement) for inventory on a FIFO basis (afteradjusting for any related movements in net real izable value provisions) and the charge that would have arisen if an average cost ofsupplies was used for the period. For this purpose, the average cost of supplies during the period is principally calculated on amonthly basis by dividing the total cost of inventory acquired in the period by the number of barrels acquired. The amounts disclosedare not separately reflected in the financial statements as a gain or loss. No adjustment is made in respect of the cost of inventoriesheld as part of a trading position and certain other temporary inventory positions.
Management believes this information is useful to illustrate to investors the fact that crude oil and product prices can vary
significantly from period to period and that the impact on our reported result under IFRS can be significant. Inventory holding gainsand losses vary from period to period due principally to changes in oil prices as well as changes to underlying inventory levels. Inorder for investors to understand the operating performance of the group excluding the impact of oil price changes on thereplacement of inventories, and to make comparisons of operating performance between reporting periods, BP’s managementbelieves it is helpful to disclose this information.
18

8/3/2019 Bp Second Quarter 2011 Results
http://slidepdf.com/reader/full/bp-second-quarter-2011-results 19/43
Non-operating items(a)
Second First Secondquarter quarter quarter First half
2010 2011 2011 2011 2010
$ millionExploration and Production
Impairment and gain (loss) on sale of660 1,089 (403) businesses and fixed assets(b) 686 647
– – – Environmental and other provisions – –
Restructuring, integration and(13) – – rationalization costs – (117)
(452) (328) 142 Fair value gain (loss) on embedded derivatives (186) (306)
(134) (51) (403) Other (454) (122)
61 710 (664) 46 102
Refining and Marketing
Impairment and gain (loss) on sale of270 5 (209) businesses and fixed assets (204) 225
– – (1) Environmental and other provisions (1) –
Restructuring, integration and(30) (1) (4) rationalization costs (5) (18)
– – – Fair value gain (loss) on embedded derivatives – –
(8) (21) (4) Other (25) (45)
232 (17) (218) (235) 162
Other businesses and corporate
Impairment and gain (loss) on sale of97 35 4 businesses and fixed assets 39 29
(4) – (12) Environmental and other provisions (12) (4)
Restructuring, integration and(22) 1 2 rationalization costs 3 (60)
– (217) 7 Fair value gain (loss) on embedded derivatives (c) (210) –– – (264) Other (264) (12)
71 (181) (263) (444) (47)
(32,192) (384) 617 Gulf of Mexico oil spill response 233 (32,192)
(31,828) 128 (528) Total before interest and taxation (400) (31,975)
– (16) (15) Finance costs(d) (31) –
(31,828) 112 (543) Total before taxation (431) (31,975)
9,877 44 160 Taxation credit (charge)(e) 204 9,927
(21,951) 156 (383) Total after taxation for period (227) (22,048)
(a) An analysis of non-operating items by region is shown on pages 7, 9 and 10.(b) Second quarter 2011 included impairment charges of $1,049 million, partially offset by net gains on disposals of $646 million.(c) Relates to an embedded derivative arising from a financing arrangement.(d) Finance costs relate to the Gulf of Mexico oil spill. See Note 2 on pages 22 – 27 for further details.(e) Tax is calculated using the quarter’s effective tax rate (excluding the impact of the Gulf of Mexico oil spill and, for the first quarter
2011, the impact of a $683-million one-off deferred tax adjustment in respect of the recently enacted increase in the supplementarycharge on UK oil and gas production) on replacement cost profit or loss. However, the US statutory tax rate has been used forexpenditures relating to the Gulf of Mexico oil spill that qualify for tax relief.
Non-operating items are charges and credits arising in consolidated entities that BP discloses separately because it considerssuch disclosures to be meaningful and relevant to investors. These disclosures are provided in order to enable investorsbetter to understand and evaluate the group’s financial performance.
19

8/3/2019 Bp Second Quarter 2011 Results
http://slidepdf.com/reader/full/bp-second-quarter-2011-results 20/43
Non-GAAP information on fair value accounting effects
Second First Secondquarter quarter quarter First half
2010 2011 2011 2011 2010
$ million Favourable (unfavourable) impact relative tomanagement’s measure of performance
(122) 29 (35) Exploration and Production (6) (59)
119 (100) 164 Refining and Marketing 64 129(3) (71) 129 58 701 22 (44) Taxation credit (charge)(a) (22) (24)(2) (49) 85 36 46
(a) Tax is calculated using the quarter’s effective tax rate (excluding the impact of the Gulf of Mexico oil spill and, for the first quarter2011, the impact of a $683-million one-off deferred tax adjustment in respect of the recently enacted increase in the supplementarycharge on UK oil and gas production) on replacement cost profit or loss.
BP uses derivative instruments to manage the economic exposure relating to inventories above normal operatingrequirements of crude oil, natural gas and petroleum products. Under IFRS, these inventories are recorded at historic cost.The related derivative instruments, however, are required to be recorded at fair value with gains and losses recognized inincome because hedge accounting is either not permitted or not followed, principally due to the impracticality of effectivenesstesting requirements. Therefore, measurement differences in relation to recognition of gains and losses occur. Gains and
losses on these inventories are not recognized until the commodity is sold in a subsequent accounting period. Gains andlosses on the related derivative commodity contracts are recognized in the income statement from the time the derivativecommodity contract is entered into on a fair value basis using forward prices consistent with the contract maturity.
BP enters into commodity contracts to meet certain business requirements, such as the purchase of crude for a refinery orthe sale of BP’s gas production. Under IFRS these contracts are treated as derivatives and are required to be fair valued whenthey are managed as part of a larger portfolio of similar transactions. Gains and losses arising are recognized in the incomestatement from the time the derivative commodity contract is entered into.
IFRS requires that inventory held for trading be recorded at its fair value using period end spot prices whereas any relatedderivative commodity instruments are required to be recorded at values based on forward prices consistent with the contractmaturity. Depending on market conditions, these forward prices can be either higher or lower than spot prices resulting inmeasurement differences.
BP enters into contracts for pipelines and storage capacity, oil and gas processing and liquefied natural gas (LNG) that, underIFRS, are recorded on an accruals basis. These contracts are risk-managed using a variety of derivative instruments, which arefair valued under IFRS. This results in measurement differences in relation to recognition of gains and losses.
The way that BP manages the economic exposures described above, and measures performance internally, differs from theway these activities are measured under IFRS. BP calculates this difference for consolidated entities by comparing the IFRSresult with management’s internal measure of performance. Under management’s internal measure of performance theinventory, capacity, oil and gas processing and LNG contracts in question are valued based on fair value using relevantforward prices prevailing at the end of the period and the commodity contracts for business requirements are accounted foron an accruals basis. We believe that disclosing management’s estimate of this difference provides useful information forinvestors because it enables investors to see the economic effect of these activities as a whole. The impacts of fair valueaccounting effects, relative to management’s internal measure of performance, are shown in the table above. A reconciliationto GAAP information is set out below.
Reconciliation of non-GAAP information
Second First Secondquarter quarter quarter First half
2010 2011 2011 2011 2010
$ million Exploration and Production
Replacement cost profit before interest and tax6,366 8,391 6,649 adjusted for fair value accounting effects 15,040 14,595(122) 29 (35) Impact of fair value accounting effects (6) (59)
Replacement cost profit before interest and6,244 8,420 6,614 tax 15,034 14,536
Refining and Marketing
Replacement cost profit before interest and tax1,956 2,179 1,174 adjusted for fair value accounting effects 3,353 2,675119 (100) 164 Impact of fair value accounting effects 64 129
Replacement cost profit before interest and2,075 2,079 1,338 tax 3,417 2,804
20

8/3/2019 Bp Second Quarter 2011 Results
http://slidepdf.com/reader/full/bp-second-quarter-2011-results 21/43
Realizations and marker prices
Second First Secondquarter quarter quarter First half
2010 2011 2011 2011 2010
Average realizations(a) Liquids ($/bbl)(b)
70.77 86.53 101.40 US 93.51 70.23
75.46 102.37 114.43 Europe 108.14 75.59
74.44 99.68 111.12 Rest of World 104.81 73.67
72.90 93.93 106.99 BP Average 99.98 72.35
Natural gas ($/mcf)
3.52 3.20 3.61 US 3.40 4.19
5.14 6.96 7.82 Europe(c) 7.41 5.02
3.71 4.41 4.63 Rest of World 4.52 3.80
3.76 4.21 4.54 BP Average 4.37 4.01
Total hydrocarbons ($/boe)
50.87 60.30 68.43 US 64.20 52.80
59.89 84.94 92.91 Europe(c) 88.84 60.16
41.47 52.79 53.45 Rest of World 53.11 41.84
47.08 59.00 63.23 BP Average(c) 61.05 48.16
Average oil marker prices ($/bbl)
78.24 105.43 117.04 Brent 111.09 77.31
77.81 94.49 102.22 West Texas Intermediate 98.39 78.32
78.31 103.22 115.26 Alaska North Slope 109.29 78.72
77.42 101.95 111.68 Mars 106.85 76.64
76.92 102.55 113.73 Urals (NWE– cif) 108.00 76.12
35.61 49.18 50.26 Russian domestic oil 49.75 35.57
Average natural gas marker prices
4.09 4.11 4.32 Henry Hub gas price ($/mmBtu)(d) 4.21 4.69
38.26 56.94 57.47 UK Gas – National Balancing Point (p/therm) 57.20 36.96
(a) Based on sales of consolidated subsidiaries only – this excludes equity-accounted entities.(b) Crude oil and natural gas liquids.(c) A minor amendment has been made in the first quarter 2011.(d) Henry Hub First of Month Index.
21

8/3/2019 Bp Second Quarter 2011 Results
http://slidepdf.com/reader/full/bp-second-quarter-2011-results 22/43
Notes
1. Basis of preparation
The interim financial information included in this report has been prepared in accordance with IAS 34 ‘InterimFinancial Reporting’.
The results for the interim periods are unaudited and in the opinion of management include all adjustmentsnecessary for a fair presentation of the results for the periods presented. All such adjustments are of a normal
recurring nature. After making enquiries, the directors have a reasonable expectation that the group has adequateresources to continue in operational existence for the foreseeable future. Accordingly, they continue to adopt thegoing concern basis of accounting in preparing the interim financial statements. This report should be read inconjunction with the consolidated financial statements and related notes for the year ended 31 December 2010included in the BP Annual Report and Form 20-F 2010 .
BP prepares its consolidated financial statements included within its Annual Report and Accounts on the basis ofInternational Financial Reporting Standards (IFRS) as issued by the International Accounting Standards Board (IASB),IFRS as adopted by the European Union (EU) and in accordance with the provisions of the UK Companies Act 2006.IFRS as adopted by the EU differs in certain respects from IFRS as issued by the IASB, however, the differenceshave no impact on the group’s consolidated financial statements for the periods presented. The financial informationpresented herein has been prepared in accordance with the accounting policies expected to be used in preparing BP Annual Report and Form 20-F 2011, which do not differ significantly from those used in the BP Annual Report and
Form 20-F 2010 .
New or amended International Financial Reporting Standards adopted
There are no new or amended standards or interpretations adopted with effect from 1 January 2011 that have asignificant impact on the financial statements.
2. Gulf of Mexico oil spill
(a) Overview
As a consequence of the Gulf of Mexico oil spill, BP continues to incur costs and has also recognized liabilities forfuture costs. The information presented in this note should be read in conjunction with BP Annual Report and
Form 20-F 2010 – Financial Statements – Note 2, Note 37 and Note 44, and Legal proceedings on pages 40 – 43herein.
The group income statement includes a pre-tax credit of $602 million for the second quarter in relation to the Gulf ofMexico oil spill, and a pre-tax credit of $202 million for the first half of 2011. The amount for the second quarterincludes credits of $1.1 billion relating to the settlement reached with MOEX Offshore 2007 LLC (MOEX), one ofBP’s co-owners in the Macondo well, and $75 million relating to the settlement with Weatherford U.S., L.P., thecontractor that manufactured the float collar used in the well. These amounts are partially offset by higher costsassociated with the ongoing spill response, mainly increased costs of patrolling and maintenance of shoreline, aswell as functional expenses of the GCRO. The total pre-tax income statement charge in 2010 amounted to$40.9 billion.
The settlement amounts with MOEX and Weatherford were not received during the second quarter, but wererecorded as receivables on the balance sheet at 30 June 2011.
The amounts set out below reflect the impacts on the financial statements of the Gulf of Mexico oil spill for theperiods presented, as described on pages 2 – 3. The income statement, balance sheet and cash flow statementimpacts are included within the relevant line items in those statements as set out below.
Second First Secondquarter quarter quarter First half
2010 2011 2011 2011 2010
$ million Income statement
32,192 384 (617) Production and manufacturing expenses (233) 32,192
(32,192) (384) 617 Profit (loss) before interest and taxation 233 (32,192)
– 16 15 Finance costs 31 –(32,192) (400) 602 Profit (loss) before taxation 202 (32,192)
10,003 201 (234) Less: Taxation (33) 10,003
(22,189) (199) 368 Profit (loss) for the period 169 (22,189)
22

8/3/2019 Bp Second Quarter 2011 Results
http://slidepdf.com/reader/full/bp-second-quarter-2011-results 23/43
Notes
2. Gulf of Mexico oil spill (continued)
30 June 2011 31 December 2010Of which: Of which:
amount related amount relatedTotal to the trust fund Total to the trust fund
$ million
Balance sheet
Current assetsTrade and other receivables 7,170 6,030 5,943 5,943
Current liabilitiesTrade and other payables (6,796) (6,146) (6,587) (5,002)
Provisions (7,414) – (7,938) –
Net current assets (liabilities) (7,040) (116) (8,582) 941Non-current assets
Other receivables 2,667 2,667 3,601 3,601Non-current liabilitiesOther payables (6,307) (6,307) (9,899) (9,899)
Provisions (6,964) – (8,397) –Deferred tax 10,497 – 11,255 –
Net non-current assets (liabilities) (107) (3,640) (3,440) (6,298)
Net assets (7,147) (3,756) (12,022) (5,357)
Second First Secondquarter quarter quarter First half
2010 2011 2011 2011 2010
$ million Cash flow statement – Operating activities
(32,192) (400) 602 Profit (loss) before taxation 202 (32,192)
Adjustments to reconcile profit (loss)before taxation to net cash providedby operating activities
Net charge for interest and other finance– 16 15 expense, less net interest paid 31 –
17,646 202 (90) Net charge for provisions, less payments 112 17,646
Movements in inventories and other current12,430 (2,864) (2,912) and non-current assets and liabilities (5,776) 12,430
(2,116) (3,046) (2,385) Pre-tax cash flows (5,431) (2,116)
Net cash used in operating activities relating to the Gulf of Mexico oil spill, on a post-tax basis, amounted to$1,898 million and $4,706 million in the second quarter and half year 2011 respectively.
Trust fund
In 2010, BP established the Deepwater Horizon Oil Spill Trust (the Trust) to be funded in the amount of $20 billionover the period to the fourth quarter of 2013, which is available to satisfy legitimate individual and business claimsadministered by the Gulf Coast Claims Facility (GCCF), state and local government claims resolved by BP, finaljudgments and settlements, state and local response costs, and natural resource damages and related costs. In 2010BP contributed $5 billion to the fund, and further contributions of $2.5 billion were made in the first half of 2011. Theincome statement charge for 2010 included $20 billion in relation to the trust fund, adjusted to take account of thetime value of money. Fines, penalties and claims administration costs are not covered by the trust fund.
Under the settlement agreement noted above, MOEX paid BP $1.1 billion in early July, which was subsequentlycontributed to the trust fund, and Weatherford have paid BP $75 million which will also be contributed to the trustfund.
23

8/3/2019 Bp Second Quarter 2011 Results
http://slidepdf.com/reader/full/bp-second-quarter-2011-results 24/43
Notes
2. Gulf of Mexico oil spill (continued)
The table below shows movements in the funding obligation during the period to 30 June 2011. This liability isrecognized within other payables on the balance sheet apportioned between current and non-current elementsaccording to the agreed schedule of contributions.
Second First
quarter half2011 2011
$ million
Opening balance 13,668 14,901
Unwinding of discount 14 28
Contribution (1,250) (2,500)
Other 21 24
At 30 June 2011 12,453 12,453
Of which – current 6,146 6,146
– non-current 6,307 6,307
An asset has been recognized representing BP’s right to receive reimbursement from the trust fund. This is theportion of the estimated future expenditure provided for that will be settled by payments from the trust fund. Weuse the term “reimbursement asset” to describe this asset. BP will not actually receive any reimbursements fromthe trust fund, instead payments will be made directly to claimants from the trust fund, and BP will be released fromits corresponding obligation. The reimbursement asset is recorded within other receivables on the balance sheetapportioned between current and non-current elements. The table below shows movements in the reimbursementasset during the period to 30 June 2011. The amount of the reimbursement asset at 30 June 2011 is equal to theamount of provisions recognized at that date that will be covered by the trust fund – see below.
Second Firstquarter half
2011 2011
$ million
Opening balance 9,544 9,544Increase in provision for items covered by the trust fund 163 1,225
Amounts paid directly by the trust fund (1,010) (2,072)
At 30 June 2011 8,697 8,697
Of which – current 6,030 6,030
– non-current 2,667 2,667
As noted above, the obligation to fund the $20-billion trust fund has been recognized in full. Any increases in theprovision that will be covered by the trust fund (up to the amount of $20 billion) have no net income statement effectas a reimbursement asset is also recognized, as described above. As at 30 June 2011, the cumulative charges forprovisions, and the associated reimbursement asset recognized, amounted to $13,792 million. Thus, a further$6,208 million could be provided in subsequent periods for items covered by the trust fund with no net impact onthe income statement. Such future increases in amounts provided could arise from adjustments to existingprovisions, or from the initial recognition of provisions for items that currently cannot be estimated reliably, namelyfinal judgments and settlements and natural resource damages and related costs. Further information on those itemsthat currently cannot be reliably estimated is provided under Provisions and contingencies below.
It is not possible at this time to conclude whether the $20-billion trust fund will be sufficient to satisfy all claimsunder the Oil Pollution Act 1990 (OPA 90) that will ultimately be paid.
The Trust agreement does not require BP to make further contributions to the trust fund in excess of the agreed $20billion should this be insufficient to cover all claims administered by the GCCF, or to settle other items that arecovered by the trust fund, as described above. Should the $20-billion trust fund not be sufficient, BP wouldcommence settling legitimate claims and other costs by making payments directly to claimants. In this case,increases in estimated future expenditure above $20 billion would be recognized as provisions with a corresponding
charge in the income statement. The provisions would be utilized and derecognized at the point that BP made thepayments.
24

8/3/2019 Bp Second Quarter 2011 Results
http://slidepdf.com/reader/full/bp-second-quarter-2011-results 25/43
Notes
2. Gulf of Mexico oil spill (continued)
(b) Provisions and contingencies
BP has recorded certain provisions and disclosed certain contingencies as a consequence of the Gulf of Mexico oilspill. These are described below and in more detail in BP Annual Report and Form 20-F 2010 – Financial statements –Notes 2, 37 and 44.
Provisions
BP has recorded provisions relating to the Gulf of Mexico oil spill in relation to environmental expenditure, spillresponse costs, litigation and claims, and Clean Water Act penalties.
On 21 April 2011, BP entered a framework agreement with natural resource trustees for the United States and fiveGulf coast states, providing for up to $1 billion to be spent on early restoration projects to address natural resourceinjuries resulting from the Gulf of Mexico oil spill. Funding for these projects will come from the $20-billionDeepwater Horizon Oil Spill Trust.
BP considers that it is not possible, at this time, to measure reliably any obligation in relation to Natural ResourcesDamages claims under OPA 90 (other than the estimated costs of the assessment phase and the costs of the earlyand emergency restoration agreements referred to above) or litigation arising from alleged violations of OPA 90, anyamounts in relation to fines and penalties except for those relating to the Clean Water Act and any obligation inrelation to litigation or in relation to legal fees beyond 2012. These items are therefore disclosed as contingentliabilities – see below.
Movements in the provision during the second quarter and the half year are presented in the tables below.
Spill Litigation Clean WaterEnvironmental response and claims Act penalties Total
$ million
At 1 April 2011 1,740 470 9,757 3,510 15,477
Increase in provision – items notcovered by the trust fund 30 338 (9) – 359
Increase in provision – items coveredby the trust fund – – 163 – 163
Unwinding of discount 1 – – – 1
Utilization – paid by BP (7) (270) (335) – (612)
– paid by the trust fund (89) – (921) – (1,010)
At 30 June 2011 1,675 538 8,655 3,510 14,378
Of which – current 773 538 6,103 – 7,414
– non-current 902 – 2,552 3,510 6,964
Of which – payable from the trust fund 1,226 – 7,471 – 8,697
25

8/3/2019 Bp Second Quarter 2011 Results
http://slidepdf.com/reader/full/bp-second-quarter-2011-results 26/43
Notes
2. Gulf of Mexico oil spill (continued)
Spill Litigation Clean WaterEnvironmental response and claims Act penalties Total
$ million
At 1 January 2011 809 1,043 10,973 3,510 16,335
Increase in provision – items notcovered by the trust fund 30 640 (9) – 661
Increase in provision – items coveredby the trust fund 1,000 – 225 – 1,225
Unwinding of discount 3 – – – 3
Utilization – paid by BP (10) (1,145) (619) – (1,774)
– paid by the trust fund (157) – (1,915) – (2,072)
At 30 June 2011 1,675 538 8,655 3,510 14,378
The total charge in the income statement is analysed in the table below.
Second Firstquarter half2011 2011
$ million
Increase in provision 522 1,886
Recognition of reimbursement asset (163) (1,225)
Other costs charged directly to the income statement 199 281
Settlements credited to the income statement (1,175) (1,175)
(Profit) loss before interest and taxation (617) (233)
Finance costs 15 31
(Profit) loss before taxation (602) (202)
The total amounts that will ultimately be paid by BP in relation to all obligations relating to the incident are subject tosignificant uncertainty and the ultimate exposure and cost to BP will be dependent on many factors. Furthermore,the amount of claims that become payable by BP, the amount of fines ultimately levied on BP (including anydetermination of BP’s negligence), the outcome of litigation and arbitration proceedings, and any costs arising fromany longer-term environmental consequences of the oil spill, will also impact upon the ultimate cost for BP.
In estimating the amount of the provision at 30 June 2011 for Individual and Business Claims, as administered by theGCCF, and State and Local Claims, BP has concluded that a reasonable range of possible outcomes is $4.4 billion to$10.8 billion. BP believes that the provision recorded at 30 June 2011 of $7.2 billion represents a reliable bestestimate from within this range of possible outcomes. This amount is included within amounts payable from thetrust fund under Litigation and claims in the table above.
Although the provision recognized is the current best reliable estimate of expenditures required to settle certain
present obligations at the end of the reporting period, there are future expenditures for which it is not possible tomeasure the obligation reliably as noted below under Contingent liabilities .
As noted above, an agreement has been reached with MOEX, one of the co-owners of the Macondo prospectleasehold, to settle all claims between the companies related to the incident and the prospect. The settlement hasbeen recorded in the income statement in the second quarter. No amount has been recognized for recovery of costsfrom the other co-owner, Anadarko Petroleum Corporation (Anadarko), because under IFRS the recovery must bevirtually certain before such receivables can be recognized. This item is therefore disclosed as a contingent asset.
Further information on provisions is provided in BP Annual Report and Form 20-F 2010 – Financial statements – Note37.
26

8/3/2019 Bp Second Quarter 2011 Results
http://slidepdf.com/reader/full/bp-second-quarter-2011-results 27/43
Notes
2. Gulf of Mexico oil spill (continued)
Contingent liabilities
BP has provided for its best estimate of certain claims under OPA 90 that will be paid through the $20-billion trustfund. It is not possible, at this time, to measure reliably any other items that will be paid from the trust fund, namelyany obligation in relation to Natural Resource Damages claims (except for the estimated costs of the assessment
phase and the costs relating to early and emergency restoration agreements as described above under Provisions) and claims resolved by civil l itigation, nor is it practicable to estimate their magnitude or possible timing of payment.Therefore no amounts have been provided for these items as of 30 June 2011.
For those items not covered by the trust fund it is not possible to measure reliably any obligation in relation to otherlitigation or potential fines and penalties except, subject to certain assumptions, for those relating to the Clean WaterAct. It is also not possible to reliably estimate legal fees beyond 2012. Therefore no amounts have been provided forthese items as of 30 June 2011.
See Legal proceedings on pages 40 – 43 and BP Annual Report and Form 20-F 2010 – Financial statements –Note 44 for further information on contingent liabilities.
Contingent assets
See Legal proceedings on pages 40 – 43 and BP Annual Report and Form 20-F 2010 – Financial statements –Note 44 for information on contingent assets.
As of 30 June 2011, $5.5 billion had been billed to our co-owner, Anadarko, which BP believes to be contractuallyrecoverable pursuant to the terms of the Macondo Prospect Offshore Deepwater Operating Agreement. Billings toco-owners under this Operating Agreement are based upon costs incurred to date rather than amounts provided inthe period. As further costs are incurred, BP believes that certain of the costs will be billable to Anadarko under theOperating Agreement. No recovery amounts from Anadarko have been recognized in the financial statements as at30 June 2011.
On 4 April 2011, BP initiated contractual out-of-court dispute resolution proceedings against Anadarko, claiming thatit has breached the parties’ contract by failing to reimburse BP for their working-interest share of incident-relatedcosts. These procedures will culminate in arbitration if the parties cannot resolve their disputes through negotiation.
On 19 April 2011, Anadarko filed a cross-claim against BP, alleging gross negligence and 15 other counts under stateand federal laws. Anadarko seeks a declaration that it is excused from its contractual obligation to pay incident-related costs. Anadarko also seeks damages from alleged economic losses and contribution or indemnity for claimsfiled against it by other parties. BP disputes Anadarko’s cross-claims and intends to defend against them vigorously.
On 15 July 2011, the judge in the federal multi-district litigation proceeding in New Orleans stayed Anadarko’s claimsagainst BP pursuant to the arbitration clause in the operating agreement between the parties pertaining to theMacondo well.
There are also audit rights concerning billings under the Operating Agreement which may be exercised by Anadarko,and which may or may not lead to an adjustment of the amount billed. BP may ultimately need to enforce its rightsto collect payment from Anadarko following any successful arbitration proceedings as provided for in the OperatingAgreement. There is a risk that amounts billed to Anadarko may not ultimately be recovered should Anadarko befound not liable for these costs or be unable to pay them. Moreover, negotiations with Anadarko could result in
settlement of these claims, which if reached, may result in amounts to be received by BP differing from the amountsbilled.
3. Non-current assets held for sale
As a result of the group’s disposal programme following the Gulf of Mexico oil spill, various assets, and associatedliabilities, have been presented as held for sale in the group balance sheet at 30 June 2011. The carrying amount ofthe assets held for sale is $10,167 million, with associated liabilities of $1,127 million. Included within these amountsare the following items, all of which relate to the Exploration and Production segment unless otherwise stated.
On 14 December 2010, BP announced that it had reached agreement to sell its exploration and production assets inPakistan to United Energy Group Limited for $775 million in cash. These assets, and associated liabilities, have been
classified as held for sale in the group balance sheet at 30 June 2011. An interim injuction entered by the IslamabadHigh Court on 9 March 2011 in a preferential rights dispute affecting the Mirpur Khas and Khipro concessions hasnow been lifted. The sale is expected to be completed in the third quarter of 2011, subject to certain conditionsprecedent, including the satisfaction of closing conditions and the receipt of government and regulatory approvals.
27

8/3/2019 Bp Second Quarter 2011 Results
http://slidepdf.com/reader/full/bp-second-quarter-2011-results 28/43
3. Non-current assets held for sale (continued)
On 18 October 2010, BP announced that it had reached agreement to sell its upstream and midstream assets inVietnam, together with its upstream businesses and associated interests in Venezuela, to TNK-BP for $1.8 billion incash, subject to post-closing adjustments. The sale of the Venezuelan business completed during the second quarterof 2011. The sale of the Vietnam business is expected to be completed in the third quarter of 2011, subject toregulatory and other approvals and conditions. The assets, and associated liabilities, of the Vietnam business have
been classified as held for sale in the group balance sheet at 30 June 2011.
On 28 November 2010, BP announced that it had reached agreement to sell its interests in Pan American Energy(PAE) to Bridas Corporation for $7.06 billion in cash. PAE is an Argentina-based oil and gas company owned by BP(60%) and Bridas Corporation (40%). The transaction excludes the shares of PAE E&P Bolivia Ltd. BP’s investment inPAE has been classified as held for sale in the group balance sheet at 30 June 2011. The sale is expected to becompleted in 2011, subject to closing conditions and government and regulatory approvals.
On 4 April 2011, BP announced that it had agreed the sale of its wholly-owned subsidiary, ARCO Aluminum Inc.(reported within Other businesses and corporate), to a consortium of Japanese companies for cash consideration of$680 million, subject to closing adjustments. The assets, and associated liabilities, of this subsidiary have beenclassified as held for sale in the group balance sheet at 30 June 2011. Subject to obtaining required regulatoryapprovals, the parties expect to complete the transaction in the third quarter of 2011.
In Canada, BP intends to dispose of its NGL business. The assets, and associated liabilities, of this business havebeen classified as held for sale in the group balance sheet at 30 June 2011. The sale is expected to be completed in2011.
On 17 May 2011, BP announced that it had reached agreement to sell its interests in the Wytch Farm, Wareham,Beacon and Kimmeridge fields to Perenco UK Ltd ('Perenco') for up to $610 million in cash. The price includes$55 million contingent on Perenco's future development of the Beacon field and on oil prices in 2011-13. The sale isexpected to be completed in early 2012, subject to a number of third party and regulatory approvals. These assets,and associated liabilities, have been classified as held for sale in the group balance sheet at 30 June 2011.
As previously announced, following a strategic review of our Refining and Marketing business, BP intends to divestthe Texas City refinery. The non-current assets, together with the inventories, of this business have been classified
as held for sale in the group balance sheet at 30 June 2011. The sale is expected to be completed in 2012.
Disposal proceeds of $4.6 billion ($6.2 billion at 31 December 2010) received in advance of completion of certain ofthese transactions have been classified as finance debt on the group balance sheet. See Note 7 for furtherinformation.
The majority of the transactions noted above are subject to post-closing adjustments, which may includeadjustments for working capital and adjustments for profits attributable to the purchaser between the agreedeffective date and the closing date of the transaction. Such post-closing adjustments may result in the final amountsreceived by BP from the purchasers differing from the disposal proceeds noted above.
28
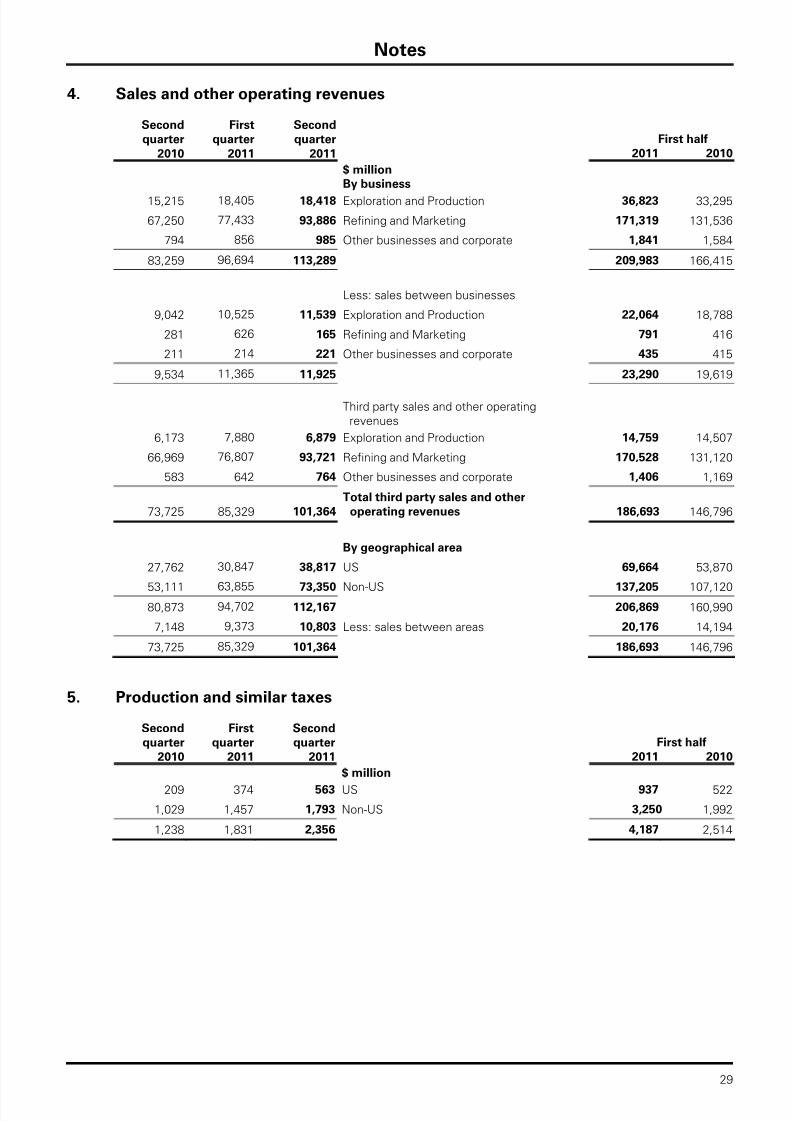
8/3/2019 Bp Second Quarter 2011 Results
http://slidepdf.com/reader/full/bp-second-quarter-2011-results 29/43
Notes
4. Sales and other operating revenues
Second First Secondquarter quarter quarter First half
2010 2011 2011 2011 2010
$ million By business
15,215 18,405 18,418 Exploration and Production 36,823 33,295
67,250 77,433 93,886 Refining and Marketing 171,319 131,536
794 856 985 Other businesses and corporate 1,841 1,584
83,259 96,694 113,289 209,983 166,415
Less: sales between businesses
9,042 10,525 11,539 Exploration and Production 22,064 18,788
281 626 165 Refining and Marketing 791 416
211 214 221 Other businesses and corporate 435 415
9,534 11,365 11,925 23,290 19,619
Third party sales and other operatingrevenues
6,173 7,880 6,879 Exploration and Production 14,759 14,507
66,969 76,807 93,721 Refining and Marketing 170,528 131,120
583 642 764 Other businesses and corporate 1,406 1,169
Total third party sales and other
73,725 85,329 101,364 operating revenues 186,693 146,796
By geographical area
27,762 30,847 38,817 US 69,664 53,870
53,111 63,855 73,350 Non-US 137,205 107,12080,873 94,702 112,167 206,869 160,990
7,148 9,373 10,803 Less: sales between areas 20,176 14,194
73,725 85,329 101,364 186,693 146,796
5. Production and similar taxes
Second First Secondquarter quarter quarter First half
2010 2011 2011 2011 2010
$ million
209 374 563 US 937 522
1,029 1,457 1,793 Non-US 3,250 1,992
1,238 1,831 2,356 4,187 2,514
29

8/3/2019 Bp Second Quarter 2011 Results
http://slidepdf.com/reader/full/bp-second-quarter-2011-results 30/43
Notes
6. Earnings per share and shares in issue
Basic earnings per ordinary share (EpS) amounts are calculated by dividing the profit or loss for the periodattributable to ordinary shareholders by the weighted average number of ordinary shares outstanding during theperiod. The calculation of EpS is performed separately for each discrete quarterly period, and for the year-to-dateperiod. As a result, the sum of the discrete quarterly EpS amounts in any particular year-to-date period may not beequal to the EpS amount for the year-to-date period.
For the diluted EpS calculation the weighted average number of shares outstanding during the period is adjusted forthe number of shares that are potentially issuable in connection with employee share-based payment plans using thetreasury stock method. If the inclusion of potentially issuable shares would decrease the loss per share, thepotentially issuable shares are excluded from the diluted EpS calculation.
Second First Secondquarter quarter quarter First half
2010 2010 2011 2011 2010
$ million Results for the period Profit (loss) for the period attributable
(17,150) 7,124 5,620 to BP shareholders 12,744 (11,071)
1 – 1 Less: preference dividend 1 1Profit (loss) attributable to BP ordinary
(17,151) 7,124 5,619 shareholders 12,743 (11,072)
Inventory holding (gains) losses,177 (1,643) (311) net of tax (1,954) (304)
RC profit (loss) attributable to BP(16,974) 5,481 5,308 ordinary shareholders 10,789 (11,376)
Basic weighted average number of18,787,629 18,816,868 18,886,382 shares outstanding (thousand)(a) 18,851,483 18,779,227
3,131,272 3,136,145 3,147,730 ADS equivalent (thousand)(a) 3,141,914 3,129,871
Weighted average number of sharesoutstanding used to calculate diluted
19,031,671 19,038,387 19,118,850 earnings per share (thousand)(a) 19,071,882 19,007,478
3,171,945 3,173,065 3,186,475 ADS equivalent (thousand)(a) 3,178,647 3,167,913
Shares in issue at period-end18,791,926 18,866,532 18,940,090 (thousand)(a) 18,940,090 18,791,926
3,131,988 3,144,422 3,156,682 ADS equivalent (thousand)(a) 3,156,682 3,131,988
(a) Excludes treasury shares and the shares held by the Employee Share Ownership Plans and includes certain shares thatwill be issued in the future under employee share plans.
30

8/3/2019 Bp Second Quarter 2011 Results
http://slidepdf.com/reader/full/bp-second-quarter-2011-results 31/43
Notes
7. Analysis of changes in net debt
Second First Secondquarter quarter quarter First half
2010 2011 2011 2011 2010
$ million
Opening balance
32,153 45,336 47,102 Finance debt 45,336 34,627
6,841 18,556 18,726 Less: Cash and cash equivalents 18,556 8,339
Less: FV asset of hedges related152 916 870 to finance debt 916 127
25,160 25,864 27,506 Opening net debt 25,864 26,161
Closing balance
30,580 47,102 46,890 Finance debt 46,890 30,580
7,310 18,726 18,749 Less: Cash and cash equivalents 18,749 7,310
Less: FV asset of hedges related
53 870 1,173 to finance debt 1,173 5323,217 27,506 26,968 Closing net debt 26,968 23,217
1,943 (1,642) 538 Decrease (increase) in net debt (1,104) 2,944
Movement in cash and cash equivalents631 (25) (81) (excluding exchange adjustments) (106) (790)
Net cash outflow (inflow) from financing1,291 (3,244) 563 (excluding share capital) (2,681) 3,691
Movement in finance debt relating to– 1,595 2 investing activities(a) 1,597 –
20 (21) 5 Other movements (16) 27
Movement in net debt before exchange1,942 (1,695) 489 effects (1,206) 2,928
1 53 49 Exchange adjustments 102 16
1,943 (1,642) 538 Decrease (increase) in net debt (1,104) 2,944
(a) During the second quarter 2011 disposal transactions were completed in respect of which deposits of $502 million (firstquarter 2011 $1,595 million) had been received in 2010. In addition, deposits of $500 mil lion were received in the secondquarter 2011, in respect of disposals expected to complete within the next year.
At 30 June 2011, $626 million of finance debt ($796 million at 31 March 2011, $1,155 million at 30 June 2010) wassecured by the pledging of assets, and $3,530 million was secured in connection with deposits received relating tocertain disposal transactions expected to complete in subsequent periods ($3,530 million at 31 March 2011). Inaddition, in connection with $3,014 million of finance debt ($3,799 million at 31 March 2011), BP has entered into
crude oil sales contracts in respect of oil produced from certain fields in offshore Angola and Azerbaijan to providesecurity to the lending banks. The remainder of finance debt was unsecured.
During the first quarter 2011 the company signed new three-year committed standby facilities totalling $6.8 billion,available to draw and repay until mid-March 2014, largely replacing existing arrangements. At 30 June 2011 the totalavailable undrawn committed borrowing facilities stood at $7.2 billion ($7.5 billion at 31 March 2011).
31

8/3/2019 Bp Second Quarter 2011 Results
http://slidepdf.com/reader/full/bp-second-quarter-2011-results 32/43
Notes
8. TNK-BP operational and financial information
Second First Secondquarter quarter quarter First half
2010 2011 2011 2011 2010
Production (Net of royalties) (BP share)
859 856 860 Crude oil (mb/d) 858 854647 719 675 Natural gas (mmcf/d) 697 660
971 980 976 Total hydrocarbons (mboe/d)(a) 978 968
$ million
Income statement (BP share)
843 1,526 1,419 Profit before interest and tax 2,945 1,631
(34) (35) (34) Finance costs (69) (72)
(266) (246) (238) Taxation (484) (434)
(53) (59) (84) Minority interest (143) (92)
490 1,186 1,063 Net income 2,249 1,033
Cash flow
505 – 1,634 Dividends received 1,634 761
Balance sheet 30 June 31 December2011 2010
Investments in associates 10,536 9,995
(a) Natural gas is converted to oil equivalent at 5.8 billion cubic feet = 1 million barrels.
9. Statutory accounts
The financial information shown in this publication, which was approved by the Board of Directors on 25 July 2011, is
unaudited and does not constitute statutory financial statements. BP Annual Report and Form 20-F 2010 has beenfiled with the Registrar of Companies in England and Wales; the report of the auditors on those accounts wasunqualified and did not contain a statement under section 498(2) or section 498(3) of the UK Companies Act 2006.
32

8/3/2019 Bp Second Quarter 2011 Results
http://slidepdf.com/reader/full/bp-second-quarter-2011-results 33/43
Principal risks and uncertainties
The principal risks and uncertainties for the remaining six months of the financial year are set out below.
We urge you to consider these risks carefully. The potential impact of their occurrence could be for our business, financialcondition and results of operations to suffer and the trading price and liquidity of our securities to decline.
Our system of risk management identifies and provides the response to risks of group significance through the establishmentof standards and other controls. Any failure of this system could lead to the occurrence, or re-occurrence, of any of the risks
described below and a consequent material adverse effect on BP’s business, financial position, results of operations,competitive position, cash flows, prospects, liquidity, shareholder returns and/or implementation of its strategic agenda.
The risks are categorized against the following areas: strategic; compliance and control; and safety and operational. Inaddition, we have also set out two further risks for your attention – those resulting from the 2010 Gulf of Mexico oil spill (theIncident) and those related to the general macroeconomic outlook.
The Gulf of Mexico oil spill has had and could continue to have a material adverse impact on BP.There is significant uncertainty in the extent and timing of costs and liabilities relating to the Incident, the impact of theIncident on our reputation and the resulting possible impact on our ability to access new opportunities. There is alsosignificant uncertainty regarding potential changes in applicable regulations and the operating environment that may resultfrom the Incident. These increase the risks to which the group is exposed and may cause our costs to increase. Theseuncertainties are likely to continue for a significant period. Thus, the Incident has had, and could continue to have, a materialadverse impact on the group’s business, competitive position, financial performance, cash flows, prospects, liquidity,
shareholder returns and/or implementation of its strategic agenda, particularly in the US.
We recognized charges totalling $40.9 billion in 2010 and a credit of $0.2 billion during the first half of 2011 as a result of theIncident. The total amounts that will ultimately be paid by BP in relation to all obligations relating to the Incident are subject tosignificant uncertainty and the ultimate exposure and cost to BP will be dependent on many factors. Furthermore, the amountof claims that become payable by BP, the amount of fines ultimately levied on BP (including any determination of BP’snegligence), the outcome of litigation, and any costs arising from any longer-term environmental consequences of the oil spill,will also impact upon the ultimate cost for BP. Although the provision recognized is the current best estimate of expendituresrequired to settle certain present obligations at the end of the reporting period, there are future expenditures for which it isnot possible to measure the obligation reliably. The risks associated with the Incident could also heighten the impact of theother risks to which the group is exposed as further described below.
The general macroeconomic outlook can affect BP’s results given the nature of our business.In the continuing uncertain financial and economic environment, certain risks may gain more prominence either individually orwhen taken together. Oil and gas prices can be very volatile, with average prices and margins influenced by changes in supplyand demand. This is likely to exacerbate competition in all businesses, which may impact costs and margins. At the sametime, governments are facing greater pressure on public finances, which may increase their motivation to intervene in thefiscal and regulatory frameworks of the oil and gas industry, including the risk of increased taxation, nationalization andexpropriation. The global financial and economic situation may have a negative impact on third parties with whom we do, ormay do, business. Any of these factors may affect our results of operations, financial condition, business prospects andliquidity and may result in a decline in the trading price and liquidity of our securities.
Capital markets have regained some confidence after the banking crisis of 2008 but are still subject to volatility and if thereare extended periods of constraints in these markets, or if we are unable to access the markets, including due to our financialposition or market sentiment as to our prospects, at a time when cash flows from our business operations may be underpressure, our ability to maintain our long-term investment programme may be impacted with a consequent effect on ourgrowth rate, and may impact shareholder returns, including dividends and share buybacks, or share price. Decreases in the
funded levels of our pension plans may also increase our pension funding requirements.
Strategic risks
Access and renewal – BP’s future hydrocarbon production depends on our ability to renew and reposition ourportfolio. Increasing competition for access to investment opportunities, the effects of the Gulf of Mexico oil spill onour reputation and cash flows, and more stringent regulation could result in decreased access to opportunitiesglobally.Successful execution of our group strategy depends on implementing activities to renew and reposition our portfolio. Thechallenges to renewal of our upstream portfolio are growing due to increasing competition for access to opportunities globallyamong both national and international oil companies, and heightened political and economic risks in certain countries wheresignificant hydrocarbon basins are located. Lack of material positions in new markets could impact our future hydrocarbonproduction.
33

8/3/2019 Bp Second Quarter 2011 Results
http://slidepdf.com/reader/full/bp-second-quarter-2011-results 34/43
Principal risks and uncertainties (continued)
Moreover, the Gulf of Mexico oil spill has damaged BP’s reputation, which may have a long-term impact on the group’s abilityto access new opportunities, both in the US and elsewhere. Adverse public, political and industry sentiment towards BP, andtowards oil and gas drilling activities generally, could damage or impair our existing commercial relationships withcounterparties, partners and host governments and could impair our access to new investment opportunities, explorationproperties, operatorships or other essential commercial arrangements with potential partners and host governments,particularly in the US. In addition, responding to the Incident has placed, and will continue to place, a significant burden on ourcash flow over the next several years, which could also impede our ability to invest in new opportunities and deliver long-term
growth.
More stringent regulation of the oil and gas industry generally, and of BP’s activities specifically, arising from the Incident,could increase this risk.
Prices and markets – BP’s financial performance is subject to the fluctuating prices of crude oil and gas as well as thevolatile prices of refined products and the profitability of our refining and petrochemicals operations.Oil, gas and product prices are subject to international supply and demand. Political developments and the outcome ofmeetings of OPEC can particularly affect world supply and oil prices. Previous oil price increases have resulted in increasedfiscal take, cost inflation and more onerous terms for access to resources. As a result, increased oil prices may not improvemargin performance. In addition to the adverse effect on revenues, margins and profitability from any fall in oil and natural gasprices, a prolonged period of low prices or other indicators would lead to further reviews for impairment of the group’s oil andnatural gas properties. Such reviews would reflect management’s view of long-term oil and natural gas prices and could resultin a charge for impairment that could have a significant effect on the group’s results of operations in the period in which it
occurs. Rapid material or sustained change in oil, gas and product prices can impact the validity of the assumptions on whichstrategic decisions are based and, as a result, the ensuing actions derived from those decisions may no longer be appropriate.A prolonged period of low oil prices may impact our ability to maintain our long-term investment programme with aconsequent effect on our growth rate and may impact shareholder returns, including dividends and share buybacks, or shareprice. Periods of global recession could impact the demand for our products, the prices at which they can be sold and affectthe viability of the markets in which we operate.
Refining profitability can be volatile, with both periodic over-supply and supply tightness in various regional markets, coupledwith fluctuations in demand. Sectors of the petrochemicals industry are also subject to fluctuations in supply and demand,with a consequent effect on prices and profitability.
Climate change and carbon pricing – climate change and carbon pricing policies could result in higher costs andreduction in future revenue and strategic growth opportunities.Compliance with changes in laws, regulations and obligations relating to climate change could result in substantial capital
expenditure, taxes, reduced profitability from changes in operating costs, and revenue generation and strategic growthopportunities being impacted. Our commitment to the transition to a lower-carbon economy may create expectations for ouractivities, and the level of participation in alternative energies carries reputational, economic and technology risks.
Socio-political – the diverse nature of our operations around the world exposes us to a wide range of politicaldevelopments and consequent changes to the operating environment, regulatory environment and law.We have operations, and are seeking new opportunities, in countries where political, economic and social transition is takingplace. Some countries have experienced, or may experience in the future, political instability, changes to the regulatoryenvironment, changes in taxation, expropriation or nationalization of property, civil strife, strikes, acts of war and insurrections.Any of these conditions occurring could disrupt or terminate our operations, causing our development activities to be curtailedor terminated in these areas, or our production to decline, could limit our ability to pursue new opportunities and could causeus to incur additional costs. In particular, our investments in the US, Russia, Iraq, Egypt, Libya and other countries could beadversely affected by heightened political and economic environment risks. See Annual Report and Form 20-F 2010 pages
14 – 15 for information on the locations of our major assets and activities.We set ourselves high standards of corporate citizenship and aspire to contribute to a better quality of life through theproducts and services we provide. If it is perceived that we are not respecting or advancing the economic and social progressof the communities in which we operate, our reputation and shareholder value could be damaged.
Competition – BP’s group strategy depends upon continuous innovation in a highly competitive market.The oil, gas and petrochemicals industries are highly competitive. There is strong competition, both within the oil and gasindustry and with other industries, in supplying the fuel needs of commerce, industry and the home. Competition putspressure on product prices, affects oil products marketing and requires continuous management focus on reducing unit costsand improving efficiency, while ensuring safety and operational risk is not compromised. The implementation of groupstrategy requires continued technological advances and innovation including advances in exploration, production, refining,petrochemicals manufacturing technology and advances in technology related to energy usage. Our performance could beimpeded if competitors developed or acquired intellectual property rights to technology that we required or if our innovation
lagged the industry.
Investment efficiency – poor investment decisions could negatively impact our business.Our organic growth is dependent on creating a portfolio of quality options and investing in the best options. Ineffectiveinvestment selection and development could lead to loss of value and higher capital expenditure.
34

8/3/2019 Bp Second Quarter 2011 Results
http://slidepdf.com/reader/full/bp-second-quarter-2011-results 35/43
Principal risks and uncertainties (continued)
Reserves replacement – inability to progress upstream resources in a timely manner could adversely affect our long-term replacement of reserves and negatively impact our business.Successful execution of our group strategy depends critically on sustaining long-term reserves replacement. If upstreamresources are not progressed in a timely and efficient manner, we will be unable to sustain long-term replacement ofreserves.
Liquidity, financial capacity and financial exposure – failure to operate within our financial framework could impact
our ability to operate and result in financial loss. Exchange rate fluctuations can impact our underlying costs andrevenues.The group seeks to maintain a financial framework to ensure that it is able to maintain an appropriate level of liquidity andfinancial capacity. This framework constrains the level of assessed capital at risk for the purposes of positions taken infinancial instruments. Failure to accurately forecast or maintain sufficient liquidity and credit to meet these needs couldimpact our ability to operate and result in a financial loss. Commercial credit risk is measured and controlled to determine thegroup’s total credit risk. Inability to determine adequately our credit exposure could lead to financial loss. A credit crisisaffecting banks and other sectors of the economy could impact the ability of counterparties to meet their financial obligationsto the group. It could also affect our ability to raise capital to fund growth and to meet our obligations. The change in thegroup’s financial framework during 2010 to make it more prudent may not be sufficient to avoid a substantial and unexpectedcash call.
BP’s clean-up costs and potential liabilities resulting from pending and future claims, lawsuits and enforcement actionsrelating to the Gulf of Mexico oil spill, together with the potential cost of implementing remedies sought in the various
proceedings, cannot be fully estimated at this time but they have had, and could continue to have, a material adverse impacton the group’s business, competitive position, financial performance, cash flows, prospects, liquidity, shareholder returnsand/or implementation of its strategic agenda, particularly in the US. Furthermore, we have recognized a total charge of$40.9 billion during 2010 and a credit of $0.2 billion during the first half of 2011, and further potential liabilities may continue tohave a material adverse effect on the group’s results of operations and financial condition. See Note 2 on page 22 – 27 andLegal proceedings on pages 40 – 43. More stringent regulation of the oil and gas industry arising from the Incident, and ofBP’s activities specifically, could increase this risk.
Crude oil prices are generally set in US dollars, while sales of refined products may be in a variety of currencies. Fluctuationsin exchange rates can therefore give rise to foreign exchange exposures, with a consequent impact on underlying costs andrevenues.
For more information on financial instruments and financial risk factors see Annual Report and Form 20-F 2010 – Note 27 onpage 185.
Insurance – BP’s insurance strategy means that the group could, from time to time, be exposed to material uninsuredlosses which could have a material adverse effect on BP’s financial condition and results of operations.In the context of the limited capacity of the insurance market, many significant risks are retained by BP. The group generallyrestricts its purchase of insurance to situations where this is required for legal or contractual reasons. This means that thegroup could be exposed to material uninsured losses, which could have a material adverse effect on its financial condition andresults of operations. In particular, these uninsured costs could arise at a time when BP is facing material costs arising out ofsome other event which could put pressure on BP’s liquidity and cash flows. For example, BP has borne and will continue tobear the entire burden of its share of any property damage, well control, pollution clean-up and third-party liability expensesarising out of the Gulf of Mexico oil spill incident.
Compliance and control risks
Regulatory – the oil industry in general, and in particular the US industry following the Gulf of Mexico oil spill, mayface increased regulation that could increase the cost of regulatory compliance and limit our access to newexploration properties.The Gulf of Mexico oil spill is likely to result in more stringent regulation of oil and gas activities in the US and elsewhere,particularly relating to environmental, health and safety controls and oversight of drilling operations, as well as access to newdrilling areas. Regulatory or legislative action may impact the industry as a whole and could be directed specifically towardsBP. The US government imposed a moratorium on certain offshore drilling activities, which was subsequently lifted inOctober 2010. While the industry has resumed drilling activity, BP has not yet done so. BP has, however, restarted rigoperations. Similar actions may be taken by governments elsewhere in the world. New regulations and legislation, as well asevolving practices, could increase the cost of compliance and may require changes to our drilling operations, exploration,development and decommissioning plans, and could impact our ability to capitalize on our assets and limit our access to newexploration properties or operatorships, particularly in the deepwater Gulf of Mexico. In addition, increases in taxes, royaltiesand other amounts payable to governments or governmental agencies, or restrictions on availability of tax relief, could also beimposed as a response to the Incident.
35

8/3/2019 Bp Second Quarter 2011 Results
http://slidepdf.com/reader/full/bp-second-quarter-2011-results 36/43
Principal risks and uncertainties (continued)
In addition, the oil industry is subject to regulation and intervention by governments throughout the world in such matters asthe award of exploration and production interests, the imposition of specific drilling obligations, environmental, health andsafety controls, controls over the development and decommissioning of a field (including restrictions on production) and,possibly, nationalization, expropriation, cancellation or non-renewal of contract rights. We buy, sell and trade oil and gasproducts in certain regulated commodity markets. Failure to respond to changes in trading regulations could result inregulatory action and damage to our reputation. The oil industry is also subject to the payment of royalties and taxation, whichtend to be high compared with those payable in respect of other commercial activities, and operates in certain tax
jurisdictions that have a degree of uncertainty relating to the interpretation of, and changes to, tax law. As a result of newlaws and regulations or other factors, we could be required to curtail or cease certain operations, or we could incur additionalcosts.
For more information on environmental regulation, see Annual Report and Form 20-F 2010 pages 78 – 81.
Ethical misconduct and non-compliance – ethical misconduct or breaches of applicable laws by our employees couldbe damaging to our reputation and shareholder value.
Our code of conduct, which applies to all employees, defines our commitment to integrity, compliance with all applicable legalrequirements, high ethical standards and the behaviours and actions we expect of our businesses and people wherever weoperate. Incidents of ethical misconduct or non-compliance with applicable laws and regulations, including non-compliancewith anti-bribery, anti-corruption and other applicable laws could be damaging to our reputation and shareholder value.Multiple events of non-compliance could call into question the integrity of our operations. For example, in our tradingbusinesses, there is the risk that a determined individual could operate as a ‘rogue trader’, acting outside BP’s delegations,
controls or code of conduct in pursuit of personal objectives that could be to the detriment of BP and its shareholders.For certain legal proceedings involving the group, see Legal proceedings on pages 40 – 43. For further information on therisks involved in BP’s trading activities, see Operational risks – Treasury and trading activities on page 39.
Liabilities and provisions – BP’s potential liabilities resulting from pending and future claims, lawsuits andenforcement actions relating to the Gulf of Mexico oil spill, together with the potential cost and burdens ofimplementing remedies sought in the various proceedings, cannot be fully estimated at this time but they have had,and are expected to continue to have, a material adverse impact on the group’s business.Under the OPA 90 BP Exploration & Production Inc. is one of the parties financially responsible for the clean-up of the Gulf ofMexico oil spill and for certain economic damages as provided for in OPA 90, as well as any natural resource damagesassociated with the spill and certain costs incurred by federal and state trustees engaged in a joint assessment of suchnatural resource damages.
BP and certain of its subsidiaries have also been named as defendants in numerous lawsuits in the US arising out of the
Incident, including actions for personal injury and wrongful death, purported class actions for commercial or economic injury,actions for breach of contract, violations of statutes, property and other environmental damage, securities law claims andvarious other claims. See Legal proceedings on pages 40 – 43.
BP is subject to a number of investigations related to the Incident by numerous federal and State agencies. See Legalproceedings on pages 40 – 43. The types of enforcement action pursued and the nature of the remedies sought will dependon the discretion of the prosecutors and regulatory authorities and their assessment of BP’s culpability following theirinvestigations. Such enforcement actions could include criminal proceedings against BP and/or employees of the group. Inaddition to fines and penalties, such enforcement actions could result in the suspension of operating licences and debarmentfrom government contracts. Debarment of BP Exploration & Production Inc. would prevent it from bidding on or entering intonew federal contracts or other federal transactions, and from obtaining new orders or extensions to existing federal contracts,including federal procurement contracts or leases. Dependent on the circumstances, debarment or suspension may also besought against affiliated entities of BP Exploration & Production Inc. Although BP believes that there are costs arising out of
the spill that are recoverable from its partners and other parties responsible under OPA 90, and although settlements havebeen agreed with one partner and one contractor during the second quarter, further recoveries are not certain and so have notbeen recognized in the financial statements (see Note 2 on pages 22 – 27).
Any finding of gross negligence for purposes of penalties sought against the group under the Clean Water Act would alsohave a material adverse impact on the group’s reputation, would affect our ability to recover costs relating to the Incidentfrom our partners and other parties responsible under OPA 90 and could affect the fines and penalties payable by the groupwith respect to the Incident under enforcement actions outside the Clean Water Act context.
The Gulf of Mexico oil spill has damaged BP’s reputation. This, combined with other recent events in the US (including the2005 explosion at the Texas City refinery and the 2006 pipeline leaks in Alaska), may lead to an increase in the number ofcitations and/or the level of fines imposed in relation to the Gulf of Mexico oil spill and any future alleged breaches of safety orenvironmental regulations.
36

8/3/2019 Bp Second Quarter 2011 Results
http://slidepdf.com/reader/full/bp-second-quarter-2011-results 37/43
Principal risks and uncertainties (continued)
Claims by individuals and businesses under OPA 90 are adjudicated by the Gulf Coast Claims Facility (GCCF) headed byKenneth Feinberg, who was jointly appointed by BP and the US Administration. On 18 February 2011, the GCCF announcedits final rules governing payment options, eligibility and substantiation criteria, and final payment methodology. The impact ofthese rules, or other events related to the adjudication of claims, on future payments by the GCCF is uncertain. Paymentscould ultimately be significantly higher or lower than the amount we have estimated for individual and business claims underOPA 90 included in the provision BP recognized for litigation and claims. See Note 2 on pages 22 – 27.
Changes in external factors could affect our results of operations and the adequacy of our provisions.We remain exposed to changes in the external environment, such as new laws and regulations (whether imposed byinternational treaty or by national or local governments in the jurisdictions in which we operate), changes in tax or royaltyregimes, price controls, government actions to cancel or renegotiate contracts, market volatility or other factors. Such factorscould reduce our profitability from operations in certain jurisdictions, limit our opportunities for new access, require us todivest or write-down certain assets or affect the adequacy of our provisions for pensions, tax, environmental and legalliabilities. Potential changes to pension or financial market regulation could also impact funding requirements of the group.
Reporting – failure to accurately report our data could lead to regulatory action, legal liability and reputationaldamage.External reporting of financial and non-financial data is reliant on the integrity of systems and people. Failure to report dataaccurately and in compliance with external standards could result in regulatory action, legal liability and damage to ourreputation.
Safety and operational risks
The risks inherent in our operations include a number of hazards that, although many may have a low probability ofoccurrence, can have extremely serious consequences if they do occur, such as the Gulf of Mexico incident. The occurrenceof any such risks could have a consequent material adverse impact on the group’s business, competitive position, cash flows,results of operations, financial position, prospects, liquidity, shareholder returns and/or implementation of the group’sstrategic goals.
Process safety, personal safety and environmental risks – the nature of our operations exposes us to a wide range ofsignificant health, safety, security and environmental risks, the occurrence of which could result in regulatory action,legal liability and increased costs and damage to our reputation.The nature of the group’s operations exposes us to a wide range of significant health, safety, security and environmentalrisks. The scope of these risks is influenced by the geographic range, operational diversity and technical complexity of our
activities. In addition, in many of our major projects and operations, risk allocation and management is shared with thirdparties, such as contractors, sub-contractors, joint venture partners and associates. See ‘Joint ventures and other contractualarrangements – BP may not have full operational control and may have exposure to counterparty credit risk and disruptions toour operations due to the nature of some of its business relationships’ on page 39.
There are risks of technical integrity failure as well as risk of natural disasters and other adverse conditions in many of theareas in which we operate, which could lead to loss of containment of hydrocarbons and other hazardous material, as well asthe risk of fires, explosions or other incidents.
In addition, inability to provide safe environments for our workforce and the public could lead to injuries or loss of life andcould result in regulatory action, legal liability and damage to our reputation.Our operations are often conducted in difficult or environmentally sensitive locations, in which the consequences of a spill,explosion, fire or other incident could be greater than in other locations. These operations are subject to variousenvironmental laws, regulations and permits and the consequences of failure to comply with these requirements can include
remediation obligations, penalties, loss of operating permits and other sanctions. Accordingly, inherent in our operations is therisk that if we fail to abide by environmental and safety and protection standards, such failure could lead to damage to theenvironment and could result in regulatory action, legal liability, material costs and damage to our reputation or licence tooperate.
To help address health, safety, security, environmental and operations risks, and to provide a consistent framework withinwhich the group can analyze the performance of its activities and identify and remediate shortfalls, BP implemented a group-wide operating management system (OMS). The embedding of OMS continues and following the Gulf of Mexico oil spill anenhanced S&OR function has been established, reporting directly to the group chief executive. There can be no assurancethat OMS will adequately identify all process safety, personal safety and environmental risk or provide the correct mitigations,or that all operations will be in compliance with OMS at all times.
Security – hostile activities against our staff and activities could cause harm to people and disrupt our operations.Security threats require continuous oversight and control. Acts of terrorism, piracy, sabotage and similar activities directed
against our operations and offices, pipelines, transportation or computer systems could cause harm to people and couldseverely disrupt business and operations. Our business activities could also be severely disrupted by civil strife and politicalunrest in areas where we operate.
37

8/3/2019 Bp Second Quarter 2011 Results
http://slidepdf.com/reader/full/bp-second-quarter-2011-results 38/43
Principal risks and uncertainties (continued)
Product quality – failure to meet product quality standards could lead to harm to people and the environment andloss of customers.Supplying customers with on-specification products is critical to maintaining our licence to operate and our reputation in themarketplace. Failure to meet product quality standards throughout the value chain could lead to harm to people and theenvironment and loss of customers.
Drilling and production – these activities require high levels of investment and are subject to natural hazards and
other uncertainties. Activities in challenging environments heighten many of the drilling and production risksincluding those of integrity failures, which could lead to curtailment, delay or cancellation of drilling operations, orinadequate returns from exploration expenditure.Exploration and production require high levels of investment and are subject to natural hazards and other uncertainties,including those relating to the physical characteristics of an oil or natural gas field. Our exploration and production activitiesare often conducted in extremely challenging environments, which heighten the risks of technical integrity failure and naturaldisasters discussed above. The cost of drilling, completing or operating wells is often uncertain. We may be required tocurtail, delay or cancel drilling operations because of a variety of factors, including unexpected drilling conditions, pressure orirregularities in geological formations, equipment failures or accidents, adverse weather conditions and compliance withgovernmental requirements. In addition, exploration expenditure may not yield adequate returns, for example in the case ofunproductive wells or discoveries that prove uneconomic to develop. The Gulf of Mexico incident illustrates the risks we facein our drilling and production activities.
Transportation – all modes of transportation of hydrocarbons involve inherent and significant risks.
All modes of transportation of hydrocarbons involve inherent risks. An explosion or fire or loss of containment ofhydrocarbons or other hazardous material could occur during transportation by road, rail, sea or pipeline. This is a significantrisk due to the potential impact of a release on the environment and people and given the high volumes involved.
Major project delivery – our group plan depends upon successful delivery of major projects, and failure to delivermajor projects successfully could adversely affect our financial performance.Successful execution of our group plan depends critically on implementing the activities to deliver the major projects over theplan period. Poor delivery of any major project that underpins production or production growth, including maintenanceturnaround programmes, and/or a major programme designed to enhance shareholder value could adversely affect ourfinancial performance. Successful project delivery requires, among other things, adequate engineering and other capabilitiesand therefore successful recruitment and development of staff is central to our plans. See ‘People and capability – successfulrecruitment and development of staff is central to our plans’ below.
Digital infrastructure is an important part of maintaining our operations, and a breach of our digital security could
result in serious damage to business operations, personal injury, damage to assets, harm to the environment andbreaches of regulations.The reliability and security of our digital infrastructure are critical to maintaining the availability of our business applications. Abreach of our digital security could cause serious damage to business operations and, in some circumstances, could result ininjury to people, damage to assets, harm to the environment and breaches of regulations.
Business continuity and disaster recovery – the group must be able to recover quickly and effectively from anydisruption or incident, as failure to do so could adversely affect our business and operations.
Contingency plans are required to continue or recover operations following a disruption or incident. Inability to restore orreplace critical capacity to an agreed level within an agreed timeframe would prolong the impact of any disruption and couldseverely affect business and operations.
Crisis management – crisis management plans are essential to respond effectively to emergencies and to avoid apotentially severe disruption in our business and operations.
Crisis management plans and capability are essential to deal with emergencies at every level of our operations. If we do notrespond, or are perceived not to respond, in an appropriate manner to either an external or internal crisis, our business andoperations could be severely disrupted.
People and capability – successful recruitment and development of staff is central to our plans.Successful recruitment of new staff, employee training, development and long-term renewal of skills, in particular technicalcapabilities such as petroleum engineers and scientists, are key to implementing our plans. Inability to develop humancapacity and capability, both across the organization and in specific operating locations, could jeopardize performance delivery.In addition, significant management focus is required in responding to the Gulf of Mexico oil spill Incident. Although BP set upthe Gulf Coast Restoration Organization to manage the group’s long-term response, key management and operatingpersonnel will need to continue to devote substantial attention to responding to the Incident and to address the associatedconsequences for the group. The group relies on recruiting and retaining high-quality employees to execute its strategic plansand to operate its business. The Incident response has placed significant demands on our employees, and the reputational
damage suffered by the group as a result of the Incident and any consequent adverse impact on our performance could affectemployee recruitment and retention.
38

8/3/2019 Bp Second Quarter 2011 Results
http://slidepdf.com/reader/full/bp-second-quarter-2011-results 39/43
Principal risks and uncertainties (continued)
Treasury and trading activities – control of these activities depends on our ability to process, manage and monitor alarge number of transactions. Failure to do this effectively could lead to business disruption, financial loss, regulatoryintervention or damage to our reputation.In the normal course of business, we are subject to operational risk around our treasury and trading activities. Control of theseactivities is highly dependent on our ability to process, manage and monitor a large number of complex transactions acrossmany markets and currencies. Shortcomings or failures in our systems, risk management methodology, internal controlprocesses or people could lead to disruption of our business, financial loss, regulatory intervention or damage to our
reputation.
Following the Gulf of Mexico oil spill, Moody’s Investors Service, Standard and Poor’s and Fitch Ratings downgraded thegroup’s long-term credit ratings. Since that time, the group’s credit ratings have improved somewhat but are still lower thanthey were immediately before the Gulf of Mexico oil spill. The impact that a significant operational incident can have on thegroup’s credit ratings, taken together with the reputational consequences of any such incident, the ratings and assessmentspublished by analysts and investors’ concerns about the group’s costs arising from any such incident, ongoing contingencies,liquidity, financial performance and volatile credit spreads, could increase the group’s financing costs and limit the group’saccess to financing. The group’s ability to engage in its trading activities could also be impacted due to counterparty concernsabout the group’s financial and business risk profile in such circumstances. Such counterparties could require that the groupprovide collateral or other forms of financial security for its obligations, particularly if the group’s credit ratings aredowngraded. Certain counterparties for the group’s non-trading businesses could also require that the group provide collateralfor certain of its contractual obligations, particularly if the group’s credit ratings were downgraded below investment grade orwhere a counterparty had concerns about the group’s financial and business risk profile following a significant operational
incident. In addition, BP may be unable to make a drawdown under certain of its committed borrowing facilities in the eventwe are aware that there are pending or threatened legal, arbitration or administrative proceedings which, if determinedadversely, might reasonably be expected to have a material adverse effect on our ability to meet the payment obligationsunder any of these facilities. Credit rating downgrades could trigger a requirement for the company to review its fundingarrangements with the BP pension trustees. Extended constraints on the group’s ability to obtain financing and to engage inits trading activities on acceptable terms (or at all) would put pressure on the group’s liquidity. In addition, this could occur at atime when cash flows from our business operations would be constrained following a significant operational incident, and thegroup could be required to reduce planned capital expenditures and/or increase asset disposals in order to provide additionalliquidity, as the group did following the Gulf of Mexico oil spill.
Joint ventures and other contractual arrangements – BP may not have full operational control and may haveexposure to counterparty credit risk and disruptions to our operations and strategic objectives due to the nature ofsome of its business relationships.Many of our major projects and operations are conducted through joint ventures or associates and through contracting and
sub-contracting arrangements. These arrangements often involve complex risk allocation, decision-making processes andindemnification arrangements. In certain cases, we may have less control of such activities than we would have if BP had fulloperational control. Our partners may have economic or business interests or objectives that are inconsistent with or opposedto, those of BP, and may exercise veto rights to block certain key decisions or actions that BP believes are in its or the jointventure’s or associate’s best interests, or approve such matters without our consent. Additionally, our joint venture partnersor associates or contractual counterparties are primarily responsible for the adequacy of the human or technical competenciesand capabilities which they bring to bear on the joint project, and in the event these are found to be lacking, our joint venturepartners or associates may not be able to meet their financial or other obligations to their counterparties or to the relevantproject, potentially threatening the viability of such projects. Furthermore, should accidents or incidents occur in operations inwhich BP participates, whether as operator or otherwise, and where it is held that our sub-contractors or joint-venturepartners are legally liable to share any aspects of the cost of responding to such incidents, the financial capacity of these thirdparties may prove inadequate to fully indemnify BP against the costs we incur on behalf of the joint venture or contractualarrangement. Should a key sub-contractor, such as a lessor of drilling rigs, be no longer able to make these assets available to
BP, this could result in serious disruption to our operations. Where BP does not have operational control of a venture, BP maynonetheless still be pursued by regulators or claimants in the event of an incident.
39

8/3/2019 Bp Second Quarter 2011 Results
http://slidepdf.com/reader/full/bp-second-quarter-2011-results 40/43
Legal proceedings
Proceedings relating to the Gulf of Mexico oil spill
BP p.l.c., BP Exploration & Production Inc. (BP E&P) and various other BP entities (collectively referred to as BP) are amongthe companies named as defendants in more than 500 private civil lawsuits resulting from the 20 April 2010 explosions andfire on the semi-submersible rig Deepwater Horizon and resulting oil spill (the Incident) and further actions are likely to bebrought. BP E&P is lease operator of Mississippi Canyon, Block 252 in the Gulf of Mexico (Macondo), where the DeepwaterHorizon was deployed at the time of the Incident, and holds a 65% working interest. The other working interest owners are
Anadarko Petroleum Company (Anadarko) and MOEX Offshore 2007 LLC (MOEX). The Deepwater Horizon, which wasowned and operated by certain affiliates of Transocean, Ltd. (Transocean), sank on 22 April 2010. The pending lawsuits and/orclaims arising from the Incident have been brought in US federal and state courts. Plaintiffs include individuals, corporationsand governmental entities and many of the lawsuits purport to be class actions. The lawsuits assert, among other things,claims for personal injury in connection with the Incident itself and the response to it, wrongful death, commercial andeconomic injury, breach of contract and violations of statutes. The lawsuits seek various remedies including compensation toinjured workers and families of deceased workers, recovery for commercial losses and property damage, claims forenvironmental damage, remediation costs, injunctive relief, treble damages and punitive damages. Purported classes ofclaimants include residents of the states of Louisiana, Mississippi, Alabama, Florida, Texas, Tennessee, Kentucky, Georgiaand South Carolina, property owners and rental agents, fishermen and persons dependent on the fishing industry, charterboat owners and deck hands, marina owners, gasoline distributors, shipping interests, restaurant and hotel owners, cruiselines and others who are property and/or business owners alleged to have suffered economic loss. Among other claimsarising from the spill response efforts, lawsuits have been filed claiming that additional payments are due by BP under certainMaster Vessel Charter Agreements entered into in the course of the Vessels of Opportunity Program.
Shareholder derivative lawsuits related to the Incident have also been filed in US federal and state courts against variouscurrent and former officers and directors of BP alleging, among other things, breach of fiduciary duty, gross mismanagement,abuse of control and waste of corporate assets. Purported class action lawsuits have also been filed in US federal courtsagainst BP entities and various current and former officers and directors alleging, among other things, securities fraud claims,violations of the Employee Retirement Income Security Act (ERISA) and contractual and quasi-contractual claims related tothe cancellation of the dividend on 16 June 2010. In addition, BP has been named in several lawsuits alleging claims underthe Racketeer-Influenced and Corrupt Organizations Act (RICO). In August 2010, many of the lawsuits pending in federal courtwere consolidated by the Federal Judicial Panel on Multidistrict Litigation into two multi-district litigation proceedings, one infederal court in Houston for the securities, derivative and ERISA cases and another in federal court in New Orleans for theremaining cases. Since late September 2010, most of the Deepwater Horizon related cases have been pending before thesecourts.
On 1 June 2010, the US Department of Justice (DoJ) announced that it is conducting an investigation into the Incidentencompassing possible violations of US civil or criminal laws. The United States filed a civil complaint against BP E&P andothers on 15 December 2010 (DoJ Action). The complaint seeks a declaration of liability under the Oil Pollution Act of 1990(OPA 90) and civil penalties under the Clean Water Act and sets forth a purported reservation of rights on behalf of the US toamend the complaint or file additional complaints seeking various remedies under various US federal laws and statutes.
On 18 February 2011, Transocean filed a third party complaint against BP, the US government, and other corporationsinvolved in the Incident, naming those entities as formal parties in its Limitation of Liability action pending in federal court inNew Orleans.
On 4 April 2011, BP initiated contractual out-of-court dispute resolution proceedings against Anadarko and MOEX, claimingthat they have breached the parties’ contract by failing to reimburse BP for their working-interest share of Incident-relatedcosts. On 19 April 2011, Anadarko filed a cross-claim against BP, alleging gross negligence and 15 other counts under stateand federal laws. Anadarko seeks a declaration that it is excused from its contractual obligation to pay Incident-related costs.
Anadarko also seeks damages from alleged economic losses and contribution or indemnity for claims filed against it by otherparties. On 20 May 2011, BP and MOEX announced a settlement agreement of all claims between them, including a cross-claim brought by MOEX on 19 April 2011 similar to the Anadarko claim. On 15 July 2011, the judge in the federal multi-districtlitigation proceeding in New Orleans stayed Anadarko’s claims against BP pursuant to the arbitration clause in the operatingagreement between the parties pertaining to the Macondo well.
On 20 April 2011, Transocean filed claims in its Limitation of Liability action alleging that BP had breached BP AmericaProduction Company’s contract with Transocean Holdings LLC by BP not agreeing to indemnify Transocean against liabilityrelated to the Incident and by not paying certain invoices. Transocean also asserted claims against BP under state law,maritime law, and OPA 90 for contribution.
On 20 April 2011, Halliburton Energy Services, Inc. (Halliburton), filed claims in Transocean’s Limitation of Liability actionseeking indemnification from BP for claims brought against Halliburton in that action, and Cameron International Corporation(Cameron) asserted claims against BP for contribution under state law, maritime law, and OPA 90, as well as for contribution
on the basis of comparative fault. Halliburton also asserted a claim for negligence, gross negligence and willful misconductagainst BP and others. On 19 April 2011, Halliburton filed a separate lawsuit in Texas state court seeking indemnification fromBP E&P for certain tort and pollution-related liabilities resulting from the Incident and resulting oil spill.
40

8/3/2019 Bp Second Quarter 2011 Results
http://slidepdf.com/reader/full/bp-second-quarter-2011-results 41/43
Legal proceedings (continued)
On 20 April 2011, BP asserted claims against Cameron, Halliburton, and Transocean in the Limitation of Liability action. BP’sclaims against Transocean include breach of contract, unseaworthiness of the Deepwater Horizon vessel, negligence (orgross negligence and/or gross fault as may be established at trial based upon the evidence), contribution and subrogation forcosts (including those arising from litigation claims) resulting from the Incident and oil spill, as well as a declaratory claim thatTransocean is wholly or partly at fault for the Incident and responsible for its proportionate share of the costs and damages.BP’s claims against Cameron assert that Cameron is liable under maritime law for providing a Blowout Preventer (BOP) thatwas unreasonably dangerous in design based on certain design defects, that Cameron was negligent with respect to certain
maintenance and repair that it conducted on the Deepwater Horizon BOP, and that Cameron is liable to BP for contributionand subrogation of the damages, costs and expenses that BP has paid and will continue to pay relating to BP’s responseefforts and the various claims brought against BP. BP asserted claims against Halliburton for fraud and fraudulentconcealment based on Halliburton’s misrepresentations to BP concerning, among other things, the stability testing on thefoamed cement used at the Macondo well; for negligence (or, if established by the evidence at trial, gross negligence) basedon Halliburton’s performance of its professional services, including cementing and mud logging services; and for contributionand subrogation for amounts that BP has paid in responding to the Incident and oil spill, as well as in OPA assessments and inpayments to plaintiffs. BP filed a similar complaint in federal court in the Southern District of Texas, Houston Division, againstHalliburton, and the action was transferred on 4 May 2011 to the federal multi-district litigation proceedings pending in NewOrleans.
On 20 April 2011, BP filed claims against Cameron, Halliburton, and Transocean in the DoJ Action, seeking contribution forany assessments against BP under OPA 90 based on those entities’ fault. On 20 June 2011, Cameron moved to strike BP’stender of Cameron as liable to the US. That motion remains pending.
On 20 May 2011, Dril-Quip, Inc. and M-I L.L.C. filed claims against BP in Transocean’s Limitation of Liability action, eachclaiming a right to contribution from BP for damages assessed against them as a result of the Incident, based on allegationsof negligence. M-I L.L.C. also claimed a right to indemnity for such damages based on their well services contracts with BP.On 20 June 2011, BP filed counter-complaints against Dril-Quip, Inc. and M-I L.L.C., asking for contribution and subrogationbased on those entities’ fault in connection with the Incident and under OPA, and seeking declaratory judgment that Dril-Quip,Inc. and M-I L.L.C. caused or contributed to, and are responsible in whole or in part for damages incurred by BP in relation to,the Incident.
On 30 May 2011, Transocean filed claims against BP in the DoJ Action alleging that BP America Production Company hadbreached its contract with Transocean Holdings LLC by not agreeing to indemnify Transocean against liability related to theIncident. Transocean also asserted claims against BP under state law, maritime law, and OPA 90 for contribution. On20 June 2011, Cameron filed similar claims against BP in the DoJ Action.
The State of Alabama has filed a lawsuit seeking damages for alleged economic and environmental harms, including naturalresource damages, civil penalties under state law, declaratory and injunctive relief, and punitive damages as a result of theIncident. The State of Louisiana has filed a lawsuit to declare various BP entities (as well as other entities) liable for removalcosts and damages, including natural resource damages under federal and state law, to recover civil penalties, attorney’sfees, and response costs under state law, and to recover for alleged negligence, nuisance, trespass, fraudulent concealmentand negligent misrepresentation of material facts regarding safety procedures and BP’s (and other defendants’) ability tomanage the oil spill, unjust enrichment from economic and other damages to the State of Louisiana and its citizens, andpunitive damages. The Louisiana Department of Environmental Quality has issued an administrative order seeking injunctiverelief and environmental civil penalties under state law, and several local governments in the State of Louisiana have filedsuits under state wildlife statutes seeking penalties for damage to wildlife as a result of the spill. On 10 December 2010, theMississippi Department of Environmental Quality issued a Complaint and Notice of Violation alleging violations of severalState environmental statutes.
On 15 September 2010, three Mexican states bordering the Gulf of Mexico (Veracruz, Quintana Roo, and Tamaulipas) filed
lawsuits in federal court in Texas against several BP entities. These lawsuits allege that the Incident harmed their tourism,fishing, and commercial shipping industries (resulting in, among other things, diminished tax revenue), damaged naturalresources and the environment, and caused the states to incur expenses in preparing a response to the Incident. On 5April 2011, the State of Yucatan submitted a claim to the GCCF alleging potential damage to its natural resources andenvironment, and seeking to recover the cost of assessing the alleged damage.
Citizens groups have also filed either lawsuits or notices of intent to file lawsuits seeking civil penalties and injunctive reliefunder the Clean Water Act and other environmental statutes. On 16 June 2011, the judge in the federal multi-district litigationproceeding in New Orleans granted BP’s motion to dismiss a master complaint raising claims for injunctive relief undervarious federal environmental statutes brought by various citizens groups and others. The judge did not, however, lift anearlier stay on the underlying individual complaints raising those claims for injunctive relief or otherwise apply his dismissal ofthe master complaint to those individual complaints. A motion for clarification has been filed asking the judge to clarifywhether the dismissal of the master complaint also applies to the individual complaints. On 15 July 2011, the judge grantedBP’s motion to dismiss a master complaint raising RICO claims against BP. The court’s order dismissed the claims of the
plaintiffs in four RICO cases encompassed by the master complaint.
The DoJ announced on 7 March 2011 that it created a unified task force of federal agencies, led by the DoJ Criminal Division,to investigate the Gulf of Mexico incident. Other US federal agencies may commence investigations relating to the Incident.The SEC and DoJ are investigating securities matters arising in relation to the Incident.
41

8/3/2019 Bp Second Quarter 2011 Results
http://slidepdf.com/reader/full/bp-second-quarter-2011-results 42/43
Legal proceedings (continued)
On 21 April 2011, BP entered a framework agreement with natural resource trustees for the United States and five Gulf coaststates, providing for up to $1 billion to be spent on early restoration projects to address natural resource injuries resulting fromthe Gulf of Mexico oil spill. Funding for these projects will come from the $20-billion Deepwater Horizon Oil Spill Trust.
BP’s potential liabilities resulting from threatened, pending and potential future claims, lawsuits and enforcement actionsrelating to the Incident, together with the potential cost of implementing remedies sought in the various proceedings, cannotbe fully estimated at this time but they have had and are expected to have a material adverse impact on the group’s business,competitive position, cash flows, prospects, liquidity, shareholder returns and/or implementation of its strategic agenda,particularly in the US. These potential liabilities may continue to have a material adverse effect on the group’s results andfinancial condition. See Note 2 on pages 22 – 27 for information regarding the financial impact in 2011 of the Incident and seethe financial statements contained in BP’s Annual Report and Form 20-F 2010 for information regarding 2010.
Investigations and reports relating to the Gulf of Mexico Oil Spill
BP is subject to a number of investigations related to the Incident by numerous agencies of the US government. The relatedpublished reports are available on the websites of the agencies and commissions referred to below.
On 11 January 2011, the National Commission on the BP Deepwater Horizon Oil Spill and Offshore Drilling (NationalCommission), established by President Obama, published its report on the causes of the Incident and its recommendationsfor policy and regulatory changes for offshore drilling. On 17 February 2011, the National Commission’s Chief Counselpublished a separate report on his investigation that provides additional information regarding the causes of the Incident.
In a report dated 20 March 2011, with an Addendum dated 30 April 2011, the Joint Investigation Team (JIT) for the MarineBoard of Investigation established by the US Coast Guard and Bureau of Ocean Energy Management (BOEMRE) issued theFinal Report of the Forensic Examination of the Deepwater Horizon Blowout Preventer (BOP) prepared by Det Norske Veritas(BOP Report). The BOP Report concludes that the position of the drill pipe against the blind shear rams prevented the BOPfrom functioning as intended. Subsequently, BP helped to sponsor additional BOP testing conducted by Det Norske Veritasunder court auspices, which concluded on 21 June 2011. BP continues to review the BOP Report and is in the process ofevaluating the data obtained from the additional testing.
On 22 April 2011, the US Coast Guard issued its report (Maritime Report) focused upon the maritime aspects of the Incident.The Maritime Report criticizes Transocean’s maintenance operations and safety culture, while also criticizing the Republic ofthe Marshall Islands — the flag state responsible for certifying Transocean’s Deepwater Horizon vessel. The BOEMRE isexpected to issue a subsequent report that will likely focus more heavily on the drilling aspects of the Incident and hence theroles of BP, Halliburton and Cameron.
The US Chemical Safety and Hazard Investigation Board (CSB) is also conducting an investigation of the Incident that isfocused on the explosions and fire, and not the resulting oil spill or response efforts. The CSB is expected to issue a singleinvestigation report in late 2011 or early 2012 that will seek to identify the alleged root cause(s) of the Incident, andrecommend improvements to BP and industry practices and to regulatory programmes to prevent recurrence and mitigatepotential consequences.
Also, at the request of the Department of the Interior, the National Academy of Engineering/National Research Councilestablished a Committee (Committee) to examine the performance of the technologies and practices involved in the probablecauses of the Incident and to identify and recommend technologies, practices, standards and other measures to avoid similarfuture events. On 17 November 2010 the Committee publicly released its interim report setting forth the Committee’spreliminary findings and observations on various actions and decisions including well design, cementing operations, wellmonitoring, and well control actions. The interim report also considers management, oversight, and regulation of offshoreoperations. The Committee has stated that it will issue its final report, including findings and/or recommendations, in late
summer 2011 (a public pre-publication version of report), with a published version to follow by 30 December 2011. A second,unrelated National Academies’ Committee will be looking at the methodologies available for assessing spill impacts onecosystems in the Gulf of Mexico, with a final report expected in the latter part of 2012, and a third National Academies’Committee will be studying methods for assessing the effectiveness of safety and environmental management systems(SEMS) established by offshore oil and gas operators. This third Committee expects to complete the final report ofrecommendations by 30 December 2011.
On 10 March 2011, the Flow Rate Technical Group (FRTG), Department of the Interior, issued its final report titled“Assessment of Flow Rate Estimates for the Deepwater Horizon/Macondo Well Oil Spill.” The report provides a summary ofthe strengths and limitations of the different methods used by the US government to estimate the flow rate and a range ofestimates from 13mb/d to over 100mb/d. The report concludes that the most accurate estimate was 53mb/d just prior to shutin, with an uncertainty on that value of ±10% based on FRTG collective experience and judgment, and, based on modeling,the flow on day one of the Incident was 62mb/d. BP is currently reviewing the report.
On 18 March 2011 the US Coast Guard ISPR team released its final report capturing lessons learned from the incident as wellas making recommendations on how to improve future oil spill response and recovery efforts.
Additionally, BP representatives have appeared before multiple committees of the US Congress that have been conductinginquiries into the Incident. BP has provided documents and written information in response to requests by these committeesand will continue to do so.
42

8/3/2019 Bp Second Quarter 2011 Results
http://slidepdf.com/reader/full/bp-second-quarter-2011-results 43/43
Legal proceedings (continued)
Other legal proceedings
The following discussion sets forth the developments in the group's other material legal proceedings during the recent period.Other pending material legal proceedings are described in the group's results announcement for the period ended 31 March2011.
A shareholder derivative action was filed against several current and former BP officers and directors based on alleged
violations of the US Clean Air Act (CAA) and Occupational Safety and Health Administration (OSHA) regulations at the TexasCity refinery subsequent to the March 2005 explosion and fire. An investigation by a special committee of BP’s board into theshareholder allegations has been completed and the committee has recommended that the allegations do not warrant actionby BP against the officers and directors. BP has filed a motion to dismiss the shareholder derivative action and a plea to thejurisdiction. On 16 June 2011, the court granted BP’s plea to the jurisdiction and dismissed the action in its entirety.
On 29 November 2007, BP Exploration (Alaska) Inc. (BPXA) entered into a criminal plea agreement with the DoJ relating toleaks of crude oil in March and August 2006. BPXA’s guilty plea, to a misdemeanour violation of the US Water PollutionControl Act, included a term of three years’ probation. On 29 November, 2009 a spill of approximately 360 barrels of crude oiland produced water was discovered beneath a line running from a well pad to the Lisburne Processing Center in PrudhoeBay, Alaska. On 17 November 2010, the US Probation Officer filed a petition in federal district court to revoke BPXA’sprobation based on an allegation that the Lisburne event was a criminal violation of state or federal law. A hearing isscheduled for the week of 11 October 2011. On 12 May 2008, a BP p.l.c. shareholder filed a consolidated complaint allegingviolations of federal securities law on behalf of a putative class of BP p.l.c. shareholders against BP p.l.c., BPXA, BP America,
and four officers of the companies, based on alleged misrepresentations concerning the integrity of the Prudhoe Bay pipelinebefore its shutdown on 6 August 2006. On 8 February 2010, the Ninth Circuit Court of Appeals accepted BP’s appeal from adecision of the lower court granting in part and denying in part BP’s motion to dismiss the lawsuit. On 29 June 2011, theNinth Circuit ruled in BP’s favor that the filing of a trust related agreement with the SEC containing contractual obligations onthe part of BP was not a misrepresentation which violated federal securities laws. On 31 March 2009, the State of Alaskafiled a complaint seeking civil penalties and damages relating to these events. The complaint alleges that the two releasesand BPXA’s corrosion management practices violated various statutory, contractual and common law duties to the State,resulting in penalty liability, damages for lost royalties and taxes, and liability for punitive damages.
In April 2009, Kenneth Abbott, as relator, filed a US False Claims Act lawsuit against BP, alleging that BP violated federalregulations, and made false statements in connection with its compliance with those regulations, by failing to have necessarydocumentation for the Atlantis subsea and other systems. BP is the operator and 56% interest owner of the Atlantis unit inproduction in the Gulf of Mexico. That complaint was unsealed in May 2010 and served on BP in June 2010. In September2010, Kenneth Abbott and Food & Water Watch filed an amended complaint in the False Claims Act lawsuit seeking aninjunction shutting down the Atlantis platform. The court denied BP’s motion to dismiss the complaint in March 2011.Separately, also in March 2011, BOEMRE issued its investigation report of the Abbott Atlantis allegations, which concludedthat Mr. Abbott’s allegations that Atlantis operations personnel lacked access to critical, engineer-approved drawings werewithout merit and that his allegations about false submissions by BP to BOEMRE were unfounded. Trial is scheduled to beginon 5 March 2012.
On 17 May 2011, BP announced that both the Rosneft Share Swap Agreement and the Arctic Opportunity, originallyannounced on 14 January 2011, had terminated. This termination was as a result of the deadline for the satisfaction ofconditions precedent having expired following delays resulting from interim orders granted by the English High Court and aUNCITRAL arbitration tribunal after applications brought by Alfa Petroleum Holdings Limited (Alfa) and OGIP Ventures Limited(OGIP) against BP International Limited (BPIL) and BP Russian Investments Limited (BPRIL) alleging breach of the relatedTNK-BP shareholders agreement (SHA). These interim orders did not address the question of whether or not BP breached theSHA.
The UNCITRAL arbitration proceedings with Alfa, Access and Renova (AAR) are still ongoing and AAR has now providednotice of its intention to bring a claim for breach of the SHA in the arbitration although they have stated they do not requirethe tribunal to determine the question of loss or quantum of damages. BP intends to strongly defend any such action or claim.No procedural timetable for the resolution of this dispute has yet been determined.
Contacts
London United States
Press Office David Nicholas Scott Dean
+44 (0)20 7496 4708 +1 630 821 3212