bpt feb06 survey report 6-30-06ph final - bptrends.com feb06... · the development of business rule...
TRANSCRIPT

2
Contents
1. Foreword 4
2. Introduction 5
3. The Respondents 6
Job Title or Function The Scope of the Respondent’s Coverage The Size of the Organizations Being Described Industries Represented in the Survey The Geographical Locations of the Respondent’s Companies Comments on Respondents
4. How Corporations Understand BPM 10
The Meaning of “BPM” The Current Interest in BPM Business Drivers of BPM Organizational Maturity and Process Performance Are Work Processes Documented? Do Units that Perform Similar Activities Use Standard or Similar Processes? Are Standard Process Models Defined for Each Major Process? Are Standard Measures Defined for the Major Processes? Is Support Provided by Automated Applications Consistent with the Processes? Are Skills Needed to Perform Tasks Defined? Is Skill Training Provided for Tasks That Will Require It? Do Process Managers Use Performance Data to Manage Processes? Are Process Improvement Programs in Place to Maintain Processes? Do Major Process Models Include Activities Performed by Outside Vendors/Partners? Process Standards
5. BPM Spending in 2005 24
How Much Are Companies Spending on BPM? How Are Companies Allocating Their BPM Money?
6. Corporate BPM Activity Today 26
The Existence and Location of BPM Groups Use of BPM Strategy and Planning Consultants The Use of Consultants at the Process/Project Level BPM Products and Services Currently Being Used Which Tools Were Most Valuable in 2005
7. Plans for the Future 33
The Development of an Enterprise Process Architecture The Development of an Enterprise Performance Measurement System Coordinating Enterprise Process Change Efforts Coordinating Process Management Efforts Process Manager Training Balanced Scorecard
Copyright (c) 2005 Business Process Trends. www.bptrends.com
3
Major Process Redesign Projects Redesign Projects Using OR Frameworks (SCOR, ITIL) Six Sigma Process Improvement Projects Major Process Automation Projects Process Analysis and Design Training (Non-Six Sigma) Lean Six Sigma Training The Development of Business Rule Systems The Development of BAM or Real-Time Monitoring Systems BPM Product and Services Being Considered for 2006
8. Summary 40
Appendix I. Concepts Used in the Report 42
BPTrends Pyramid – Enterprise, Process, Implementation Levels CMMI – Organization/Process Maturity Levels BPTrends Business Process Software Tools Classification Geoffrey Moore’s Technology Lifecycle Model
Appendix II. The Questionnaire Used in the Survey 49

4
Foreword This survey summarizes information provided by 348 respondents working in large, medium, and small companies, representing a broad cross section of industries from around the world. Given the size and diversity of the respondents, we believe this is the most comprehensive and representative overview of how organizations understand BPM, what BPM activities companies are currently engaged in and what BPM activities companies are planning for the future.
Like other BPTrends Reports, this BPTrends Survey Report on The State of BPM – 2006 is available FREE to all registered members of BPTrends. We hope the information provided in this Survey Report will provide readers with insight into the kinds of BPM development efforts currently underway and how their company’s BPM efforts compare to the overall market..
We are grateful to our many BPTrends members and readers who worked with us to make this Survey Report a reality. Without the many respondents who took the time to fill out our Questionnaire, we couldn’t have produced this Survey Report. For our part, we have reported and summarized the data as accurately and fairly as we could
Finally, we hope this Survey Report will provide BPM practitioners with insights that will suggest new ideas for future development in their organizations.
As always, we welcome your comments and suggestions regarding this Survey Report as well as your suggestions for topics and issues you would like to see included in future Survey Reports.
Celia Wolf CEO/Publisher/BPTrends [email protected]

Copyright (c) 2005 Business Process Trends. www.bptrends.com
5
Introduction Business Process Management (BPM) has been a hot business topic since 2003. Most people think of it as the logical continuation of the interest in business processes that started in the Eighties and reached a crescendo in the mid-Nineties with Six Sigma, Business Process Reengineering, Workflow, and ERP. Because of its extensive roots, and because there are several new aspects included in today’s discussions of BPM, it can be very difficult to develop a clear picture of BPM. Like any phrase that is comprised of familiar words and embraced by a number of rather different communities – including executives, process consultants, Six Sigma practitioners, enterprise architects, CIOs, and software architects – the phrase Business Process Management, or BPM, means different things to different people. There’s nothing we can do to force uniformity on such a diverse and rapidly changing market. The best we can hope to do is to define the different ways the term BPM is used and report on the different goals of the different groups using the term.
BPTrends has tried to establish a common BPM vocabulary. In spite of our best efforts, however, authors we publish still regularly use a variety of terms in different ways. Thus, for example, process or framework mean whatever the author wants them to mean. To minimize confusion, we wrote multiple-choice questions and tended to provide very descriptive choices in an effort to assure that everyone understood the choices. Overall, we believe we succeeded. Hopefully, as we undertake future surveys, respondents will become even better at discriminating among the various BPM terms we use and the responses will become even more consistent.
This report summarizes data gathered during the month of February, 2006. The respondents to this survey were either members of the 25,000 member BPTrends community or they were readers of BPTrends. While we cover the entire range of topics that a business process manager or practitioner needs to know, we tend to draw more managers and practitioners interested in the latest concepts in BPM than we draw from the more specialized communities, like Six Sigma or Business Process Outsourcing. Therefore, our results reflect the response of a broad base of business managers interested in Business Process Management.
Throughout this report, we use a number of terms we assume are familiar to most readers.. Specifically, we have assumed readers will be familiar with the BPTrends way of classifying business process software products - with CMM process maturity levels, the concept of Enterprise, Process and Implementation Levels, as used on the BPTrends pyramid, and Geoffrey Moore’s way of classifying the development of technology markets. For readers who are unfamiliar with any of these terms and concepts, we have included explanations in Appendix I.
The actual questions included in the Questionnaire are reproduced in Appendix II.
Paul Harmon Market Analyst/Executive Editor - BPTrends [email protected]
6
The Respondents BPTrends conducted this survey in February of 2006. We sent an email to our membership inviting them to participate and posted a pointer on the BPTrends website to encourage participation from both members and visitors. The questionnaire remained available for a little over one month. During that period 348 people took the survey. Four times that number looked at the survey and answered a few questions, but we have ignored those visits and report only on the responses of those who took the time to complete the entire questionnaire.
Job Title or Function
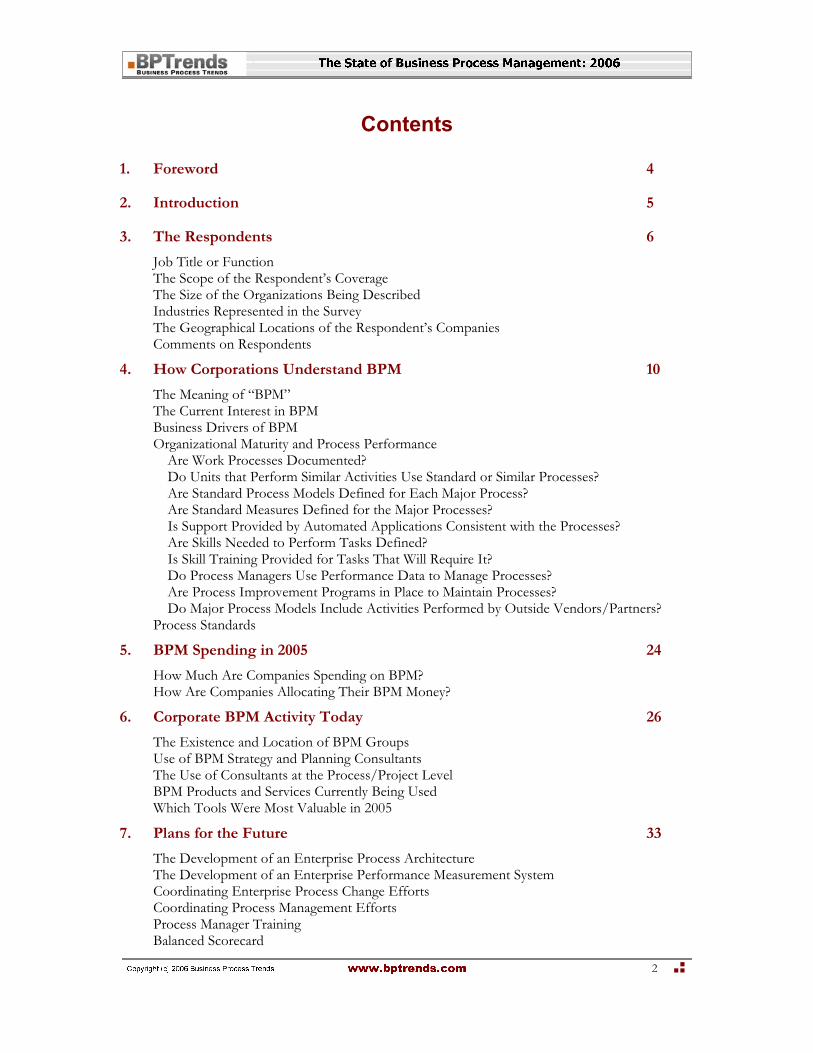
Each respondent was asked to describe his or her job or function within his or her organization. Fifty percent of the respondents identified themselves as Business Analysts or Process Practitioners. Roughly equal numbers identified themselves as an Executive (17%), Business or Line of Business Managers (18%), or IT Managers/IT Developer (14%). Only 1% identified themselves as an HR Manager or a Human Performance Practitioner. (See Figure 1.)
Executive ( CEO, COO, CFO)
IT Manager/ IT Developer
HR Manager or Human Performance
Practitioner1 % Business or Line of
Business Manager
Process Practitioner/ Business Analyst50%
18%
17%
14%
Figure 1. Respondent’s job title/function
The nature of the respondents’ jobs means that this survey tilted slightly toward an IT/business perspective, as opposed to an HR or Human Performance perspective. We believe that reflects the market in general, although we were surprised that we didn’t get a slightly larger participation from HR and Human Performance practitioners.
We were particularly impressed by the number of executives and line of business managers who took part in the survey.

Copyright (c) 2005 Business Process Trends. www.bptrends.com
7
The Scope of the Respondent’s Coverage
We asked respondents to tell us if they would be describing their entire organization, or simply a division or business unit within a larger organization. Two-thirds of our respondents (64%) indicated that they would be reporting on their entire organization. That’s a bit unusual, but it corresponds with the fact that so many respondents were executives or line managers. (See Figure 2.)
Figure 2. The business unit the respondent is describing
The Size of the Organizations Being Described
We asked each respondent to indicate the overall size of the organization he or she would be describing. A slightly larger group reported that they would be describing large organizations (41%) while a slightly smaller group said they would be describing small organizations (26%). Overall, we thought it was a nice balance. We might have expected the number of large companies to be more extensively represented, as large companies are more likely to be engaged in the exploration of new technology, but this was clearly balanced by companies doing other types of business process work, and by consultants, who generally come from smaller organizations. (See Figure 3.)
Large41%
Medium 33%
Small 26%
Figure 3. The size of the respondent’s organization
Industries Represented in the Survey
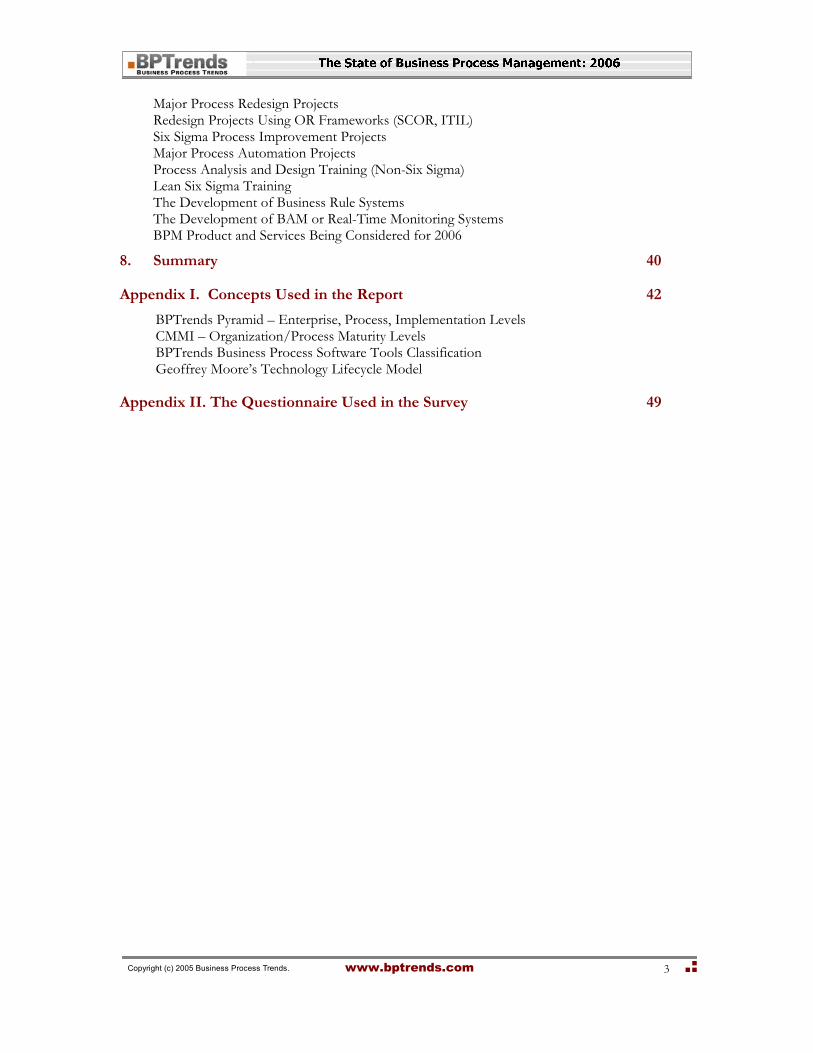
The survey provides the perspective of individuals from a wide range of industries. Financial Services and Insurance is best represented industry (19%), followed by Computers and Software (17%) and Business and Consulting Services (16%). Other notable industries are the Government/Military (9%) and Telecommunications (8%). (See Figure 4.)
Copyright (c) 2005 Business Process Trends. www.bptrends.com
8
FoodBeverage
Light Manufacturing
2%
LeisureEntertainmentTravel
AerospaceDefense
Heavy Manufacturing1%
HealthcareMedical Equipment
2%
Utilities3%
Retail and Wholesale
3%Education3%
ChemicalsEnergy
5%Other 8%
Telecommunications8%
GovernmentMilitary
9%
Professional Business Services Consulting
16%
Computers Consumer Electronics Software
17%Financial Services
Insurance
19%
2%
1%
1%
Figure 4. The range of industries represented in the Survey
Given the overall respondent population of 348 – not all of whom answered every question -- we could compare and contrast the answers given by individuals from the Financial Services industry (63 responses) and individuals in the Computers and Software industry (56 responses). The specific number of individuals responding from most of the industry groups was too small, however, to make statistically valid comparisons possible. Thus, we couldn’t conclude anything significant by looking at how the responses by individuals from the Chemicals/Energy industry (17 respondents) varied from the responses of those in the Healthcare area (8 respondents). We will occasionally look at how the answers provided by respondents from the Computer/Software industry compared with responses from individuals for the Financial Services and Insurance industry, but will not, in general, make statements about the position or activities of industry segments in this survey.
The Geographical Location of the Respondent’s Companies
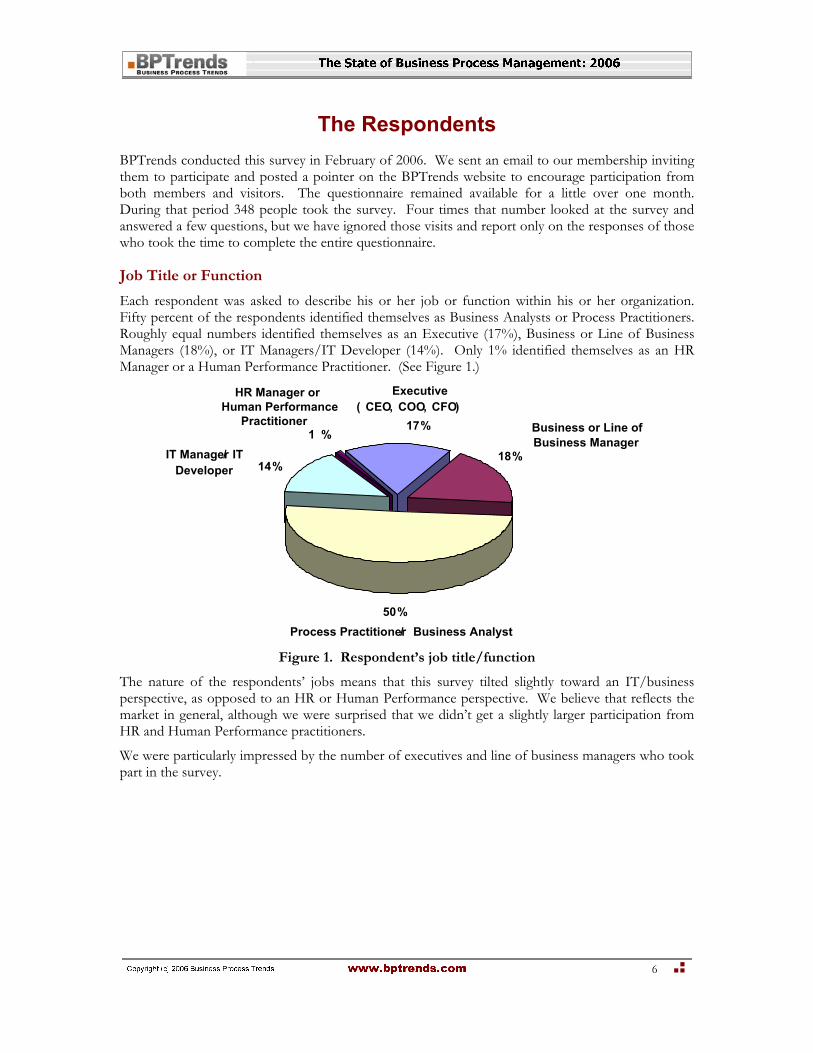
We also asked respondents to tell us where their organizations were located. The largest group – nearly half – were from North America. Twenty-Nine percent (29%) were from Europe. The Smallest groups were from South America and Africa and the Middle East.
Figure 5. Where respondents’ organizations are located
In this case, comparisons between responses from individuals from North America (156), Europe (101), and Asia/Australia, South America, and Africa/Middle East, taken together (91) are quite
Copyright (c) 2005 Business Process Trends. www.bptrends.com
9
valid. When we make comments about how individuals from South America, Africa/Middle East, or Asia/Australia responded, however, readers will want to be more skeptical, as we do not have enough responses from those individual regions to reach significant conclusions.
Comments on Respondents
We have already suggested that we are impressed by both the size of the sample – the number of people who responded – and the distribution of the sample among industries, geographical locations, and company size. These elements all suggest that the data will be representative of the broad scope of BPM today.
We do want to suggest a couple of qualifications readers should consider in reviewing the data.
First, we failed to ask each respondent to identify his or her company. Thus, we don’t know how many respondents come from the same company. We have generally assumed that each respondent represents a different company. Thus, if 20% of the respondents said their companies used Business Process Modeling tools, we have assumed that 20% of the companies used those tools. This assumption is reasonable, even if a few of the respondents do come from the same company, but readers should be aware that we are actually reporting on the responses of individuals, and not responses from 348 different companies.
Second, a large number of respondents were from Computers/Consumer Electronics/Software (16%) and Professional/Business Services/Consulting (17%). Many of these respondents are probably consultants and software vendors who are not actually doing BPM work themselves, but helping others in their BPM efforts. We checked several questions and did not find that their responses were very different than those of obvious end users, like those from Finance or Manufacturing. Where it does seem to skew the data a bit is in the number of Executives included in the survey. Of the 56 respondents from Computers and Software, 16 were Executives. Of the 52 respondents from Professional and Consulting, 20 were Executives. Of the 63 respondents from Financial Services and Insurance, only 7 were Executives. Only 2 of the 13 respondents from manufacturing listed themselves as Executives.
Something similar happens when you consider the relationship between company size and job titles. Most of the executives come from small companies. And most of the professional and consulting companies are small companies. Thus, readers shouldn’t focus too much on the number of Executives taking part in the survey, as they probably represent executives from consulting companies and software vendors and not executives from end user companies. On the other hand, the Business Line Managers are mostly from larger companies and are more broadly representative of the entire range of industries involved in the survey.

10
How Corporations Understand BPM Today
The Meaning of BPM
Different people use the term BPM in different ways. Some use BPM to refer to Business Process Management, for example, while others use it to refer to Business Performance Management. Some use BPM to refer to a general approach to the management of business process change, while others use it more narrowly, to refer to the use of software techniques to manage the runtime execution of business processes. To better understand how our respondents were using the term, we asked them to choose among four options, or to suggest an alternative to the four options we presented.
Figure 6 provides an overview of what the results.
Figure 6. How organizations understand BPM
As you can see, a significant majority (40%) of our respondents indicated that their organizations understand BPM to refer to a “top-down methodology designed to organize, manage, and measure the organization, based on the organization’s core processes.”
The next largest segment associated BPM with the analysis and redesign of processes, and with the management of redesign or improvement projects.
Only 16% of our respondents suggested that their organizations thought of BPM as a specific software technology for the automation and management of runtime business processes, and still fewer (12%) simply associated BPM with cost-saving initiatives focused on improving the productivity of specific processes.
We looked at the responses to this question by geographical region and found the preference for defining BPM as a top-down methodology was even more pronounced in South America (52%) and in Asia and Australia (55%) than in North America (40%) and Europe (40%). Otherwise there was little difference, except for the fact that respondents in South America were even more reluctant than others to describe BPM as a set of software technologies. 17.9% of North American respondents
Copyright (c) 2005 Business Process Trends. www.bptrends.com
11
said BPM was a set of software technologies, 14% of European respondents agreed, but only 9.5% of South American respondents though of BPM that way.
This represents an emerging understanding of BPM. In the past few years we have attended “BPM Conferences” where speakers and participants assumed that BPM referred to a specific software technology, or where they assumed that it was virtually synonymous with Six Sigma or other process redesign project work.
Those that avoided the four options on offer, and chose to enter an alternative, were divided between those who said their organization did not have a clear understanding of BPM, and those who suggested that BPM referred to a specific process change methodology. A few cited the confusion between Business Process Management and Business Performance Management, but most seemed to suggest that the term was new and that their company simply hadn’t developed any consensus about what BPM meant.
When you consider the articles that people are writing about BPM, and the pronouncements being made about BPM, you realize that the rather significant differences in the use of the term BPM has got to lead to quite a bit of misunderstanding. Thus, for example, vendors who describe BPM as an IT technology are hardly communicating with executives or middle managers who think BPM is a top down methodology for organizing, managing, and measuring an organization’s performance, and vice versa.
It’s not surprising that business process modeling tools are outselling BPM Suites, when you consider the large number of individuals who think BPM is about analyzing and redesigning processes (modeling), and not, primarily, about automating and managing the execution of processes (BPM Suites).
We witness these divergent perspectives each month. When we attend an IT-oriented BPM conference we encounter people who are primarily interested in BPM Suites and IT solutions to business process problems. When we attend Six Sigma or Management-oriented BPM conferences we meet people who have little knowledge or interest in BPM Suites, but are vitally concerned with business process management and measurement issues. Managers attending Supply Chain Council events, for example, are almost entirely Supply Chain managers. They are interested in how to model and improve the efficiency of supply chain processes, but aren’t very interested in IT or Six Sigma issues.
The “BPM market or community,” today, isn’t a single market or community. It’s several different market segments or communities, some focused on management issues, some focused on process improvement issues, and some focused on ERP or BPM application development. Community may be emerging, but, for the present, those seeking to communicate with “BPM practitioners” need to be aware that they, in fact, will probably communicate with only one or a few segments of the overall BPM market.
The Current Interest in BPM
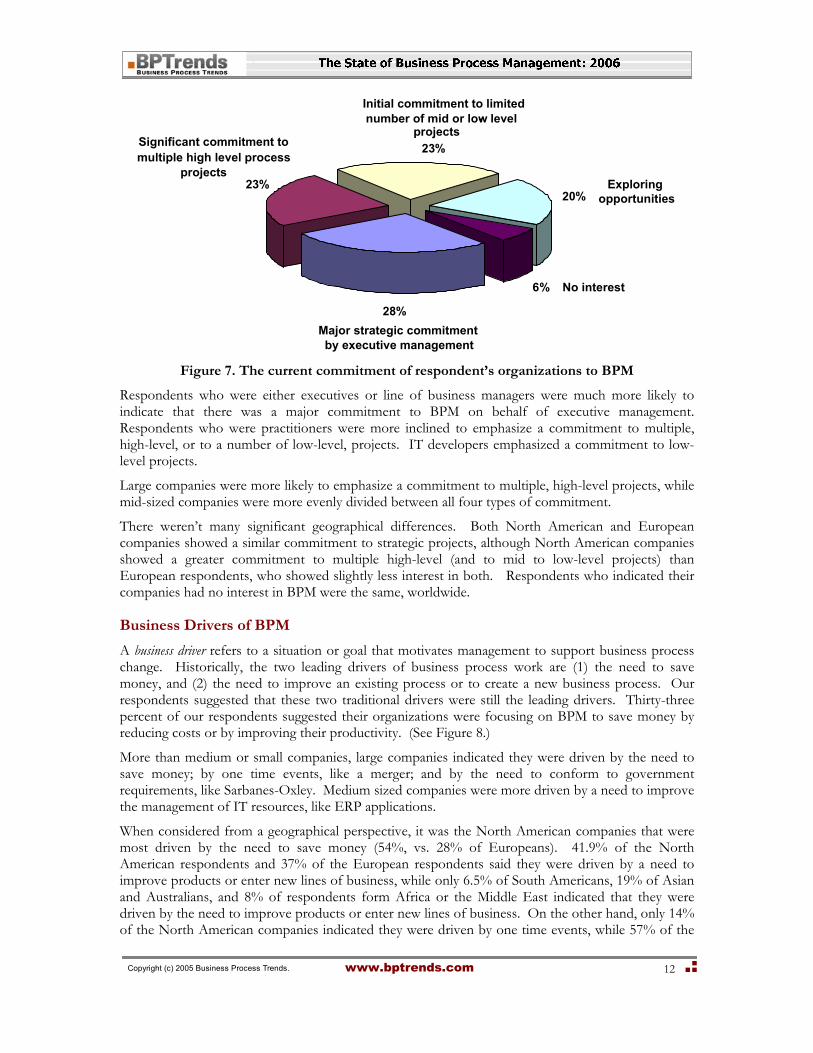
We asked all respondents to describe their organization’s current interest in BPM. The largest segment (28%) indicated that their organization regarded BPM as a “major strategic commitment by executive management.” Slightly smaller groups (23%, 23%, 20%) suggested that their organization either had a significant commitment to multiple high level projects, an initial commitment to a limited number of mid or low-level projects, or were just exploring opportunities. Six percent of the respondents (19 individuals) indicated that their organizations had no interest in BPM at this time. (See Figure 7.)
Copyright (c) 2005 Business Process Trends. www.bptrends.com
12
No interest 6%
Major strategic commitment by executive management
28%
Significant commitment to multiple high level process
projects 23%
Initial commitment to limited number of mid or low- level
projects 23%
Exploring opportunities 20%
Figure 7. The current commitment of respondent’s organizations to BPM
Respondents who were either executives or line of business managers were much more likely to indicate that there was a major commitment to BPM on behalf of executive management. Respondents who were practitioners were more inclined to emphasize a commitment to multiple, high-level, or to a number of low-level, projects. IT developers emphasized a commitment to low-level projects.
Large companies were more likely to emphasize a commitment to multiple, high-level projects, while mid-sized companies were more evenly divided between all four types of commitment.
There weren’t many significant geographical differences. Both North American and European companies showed a similar commitment to strategic projects, although North American companies showed a greater commitment to multiple high-level (and to mid to low-level projects) than European respondents, who showed slightly less interest in both. Respondents who indicated their companies had no interest in BPM were the same, worldwide.
Business Drivers of BPM
A business driver refers to a situation or goal that motivates management to support business process change. Historically, the two leading drivers of business process work are (1) the need to save money, and (2) the need to improve an existing process or to create a new business process. Our respondents suggested that these two traditional drivers were still the leading drivers. Thirty-three percent of our respondents suggested their organizations were focusing on BPM to save money by reducing costs or by improving their productivity. (See Figure 8.)
More than medium or small companies, large companies indicated they were driven by the need to save money; by one time events, like a merger; and by the need to conform to government requirements, like Sarbanes-Oxley. Medium sized companies were more driven by a need to improve the management of IT resources, like ERP applications.
When considered from a geographical perspective, it was the North American companies that were most driven by the need to save money (54%, vs. 28% of Europeans). 41.9% of the North American respondents and 37% of the European respondents said they were driven by a need to improve products or enter new lines of business, while only 6.5% of South Americans, 19% of Asian and Australians, and 8% of respondents form Africa or the Middle East indicated that they were driven by the need to improve products or enter new lines of business. On the other hand, only 14% of the North American companies indicated they were driven by one time events, while 57% of the

Copyright (c) 2005 Business Process Trends. www.bptrends.com
13
Europeans indicated that was a major driver. Similarly, only 31% of the North American respondents indicated their companies were especially driven by a need to improve the management of IT resources, while 44.8% of the European companies were so driven.
Figure 8. Business drivers causing organizations to focus on business process change
There was substantial agreement among all respondents – whatever their job titles – on the drivers leading to BPM.
Respondents that elected to suggest alternative (other) drivers spread over quite a range. Several were consultants, and they indicated they were focused on BPM because their clients were focused on BPM. Others suggest more generic concerns, like a desire to innovate or a desire to develop global or international capabilities.
Organizational Maturity and Process Performance
We asked respondents to tell us how their organization performed a number of business process activities, ranging from process documentation, through modeling, to process management. In each case we asked respondents to tell us if their organization simply Never did it, did it Occasionally (1-30% of the time), did it Frequently (31-60% of the time), did it Most of the Time (61-99%), or Always did it (100% of the time).
We asked this question because we wanted to get an idea of where most organizations were in mastering and performing common business process activities. We set the question up as a matrix to suggest a maturity scale, like CMMI. If organizations Never performed common BPM activities, we assumed they were immature organizations that weren’t focused on processes. If organizations Frequently performed most of the common business process activities, we figured that would suggest they were between 2-4 on a CMM scale. If organizations performed most of the activities Most of the Time, we assumed that would suggest that they were between 3-5 on the CMM scale. (For those unfamiliar with CMMI and the CMM maturity scale, it is described in Appendix I.)
Overall, the most popular response to each item on this question was 2 (Occasionally). In a few cases, responses were nearly evenly balanced between 2 and 3. We took this to suggest that most of our respondents would measure between 2 and 3 on the CMMI scale, and that corresponds to most of the research by SEI on organizational maturity.
In this case, we’ll consider each part of the question independently.
Copyright (c) 2005 Business Process Trends. www.bptrends.com
14
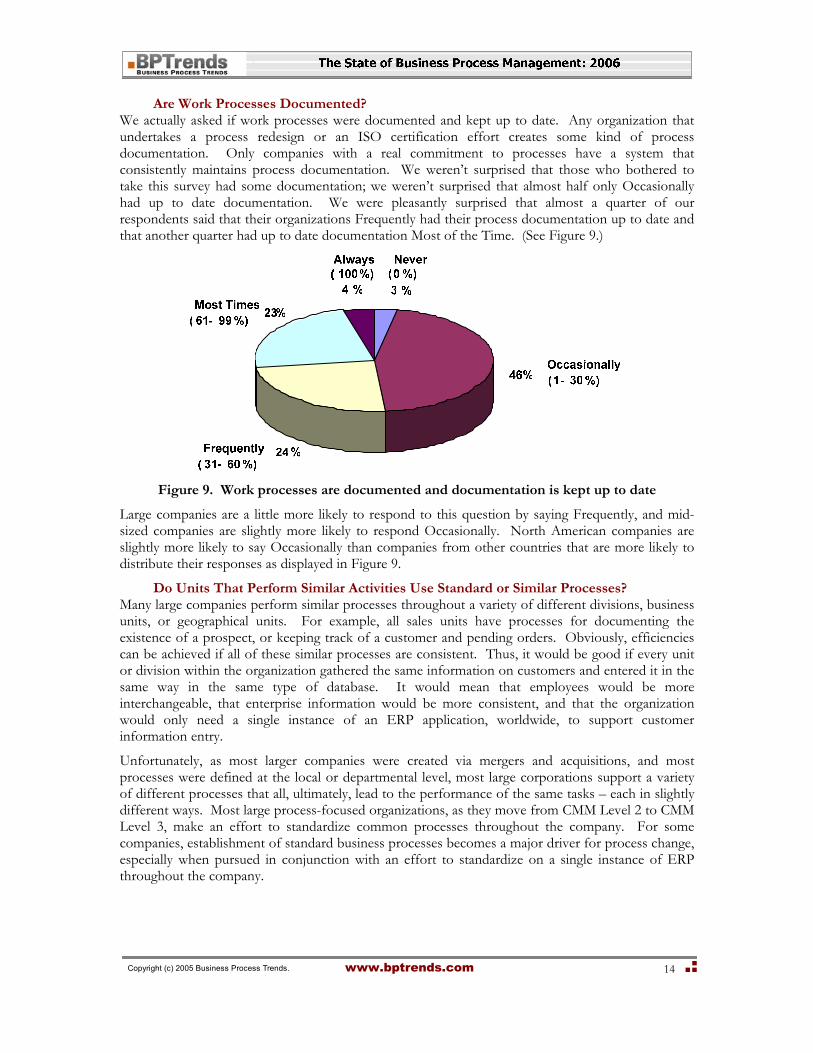
Are Work Processes Documented? We actually asked if work processes were documented and kept up to date. Any organization that undertakes a process redesign or an ISO certification effort creates some kind of process documentation. Only companies with a real commitment to processes have a system that consistently maintains process documentation. We weren’t surprised that those who bothered to take this survey had some documentation; we weren’t surprised that almost half only Occasionally had up to date documentation. We were pleasantly surprised that almost a quarter of our respondents said that their organizations Frequently had their process documentation up to date and that another quarter had up to date documentation Most of the Time. (See Figure 9.)
Figure 9. Work processes are documented and documentation is kept up to date
Large companies are a little more likely to respond to this question by saying Frequently, and mid-sized companies are slightly more likely to respond Occasionally. North American companies are slightly more likely to say Occasionally than companies from other countries that are more likely to distribute their responses as displayed in Figure 9.
Do Units That Perform Similar Activities Use Standard or Similar Processes? Many large companies perform similar processes throughout a variety of different divisions, business units, or geographical units. For example, all sales units have processes for documenting the existence of a prospect, or keeping track of a customer and pending orders. Obviously, efficiencies can be achieved if all of these similar processes are consistent. Thus, it would be good if every unit or division within the organization gathered the same information on customers and entered it in the same way in the same type of database. It would mean that employees would be more interchangeable, that enterprise information would be more consistent, and that the organization would only need a single instance of an ERP application, worldwide, to support customer information entry.
Unfortunately, as most larger companies were created via mergers and acquisitions, and most processes were defined at the local or departmental level, most large corporations support a variety of different processes that all, ultimately, lead to the performance of the same tasks – each in slightly different ways. Most large process-focused organizations, as they move from CMM Level 2 to CMM Level 3, make an effort to standardize common processes throughout the company. For some companies, establishment of standard business processes becomes a major driver for process change, especially when pursued in conjunction with an effort to standardize on a single instance of ERP throughout the company.
Copyright (c) 2005 Business Process Trends. www.bptrends.com
15
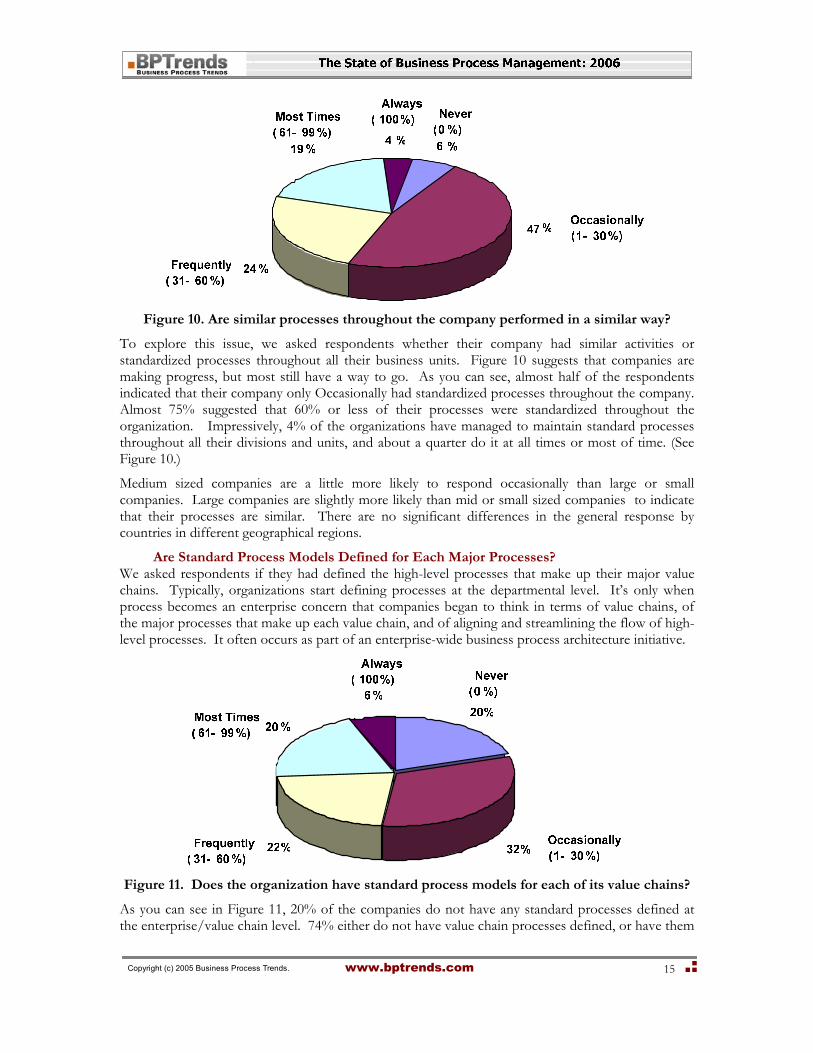
Figure 10. Are similar processes throughout the company performed in a similar way?
To explore this issue, we asked respondents whether their company had similar activities or standardized processes throughout all their business units. Figure 10 suggests that companies are making progress, but most still have a way to go. As you can see, almost half of the respondents indicated that their company only Occasionally had standardized processes throughout the company. Almost 75% suggested that 60% or less of their processes were standardized throughout the organization. Impressively, 4% of the organizations have managed to maintain standard processes throughout all their divisions and units, and about a quarter do it at all times or most of time. (See Figure 10.)
Medium sized companies are a little more likely to respond occasionally than large or small companies. Large companies are slightly more likely than mid or small sized companies to indicate that their processes are similar. There are no significant differences in the general response by countries in different geographical regions.
Are Standard Process Models Defined for Each Major Processes? We asked respondents if they had defined the high-level processes that make up their major value chains. Typically, organizations start defining processes at the departmental level. It’s only when process becomes an enterprise concern that companies began to think in terms of value chains, of the major processes that make up each value chain, and of aligning and streamlining the flow of high-level processes. It often occurs as part of an enterprise-wide business process architecture initiative.
Figure 11. Does the organization have standard process models for each of its value chains?
As you can see in Figure 11, 20% of the companies do not have any standard processes defined at the enterprise/value chain level. 74% either do not have value chain processes defined, or have them

Copyright (c) 2005 Business Process Trends. www.bptrends.com
16
defined only Occasionally or Frequently. Only 26% of the respondents indicated that their organizations had more than 61% of their high-level business processes defined.
North American companies are less likely to Always have standard process models, while other countries are more likely, and Europeans are most likely, to have standard process models. There are no significant variations in the basic patterns that reflect company size.
Are Standard Measures Defined for Each of Major Processes? We asked participants if their companies had standard measures defined for evaluating the performance of value chains and major processes and subprocesses. Most companies have a set of KPIs (Critical Performance Indicators) that are used to evaluate corporate performance. Too often, however, the performance metrics are not related to specific value chains or business processes. Thus, a change in a KPI does not automatically suggest which value chair or process should be examined or which needs improvement. The shift to a process perspective depends on a tight linkage between measures and processes.
Figure 12. Does the organization have standard measures to evaluate the performance of
major processes?
Figure 12 suggests that very few organizations have tight, comprehensive process performance systems. Almost half (42%) only have their measures and processes aligned Occasionally. Only 24% manage to have performance measures aligned to processes between 31 and 60% of the time.
Large and small companies respond to this question in very similar ways. Mid-sized companies are more likely to not have standard measures. While most countries from the various geographical regions reflect the standard pattern described in Figure 12, North American companies are slightly more likely to have measures in place Most Times or Occasionally.
Is Support Provided by Automated Applications Consistent With the Processes? We also asked how well the existing software applications served the company’s processes. In an ideal world, business people would define the best possible processes and then IT would create tailored applications to support those processes. In the real world, processes are constantly changing and applications are often purchased from vendors and prove hard to tailor. Thus, in many cases, companies find themselves “fighting” the software applications that are supposed to help them. We run into this all the time, as customers, when sales or service people try to enter something, find it isn’t accepted, and then wink at us and explain that “the system” doesn’t like the entry, but that they know how to get around the problem, and then they proceed to enter the data in some round-about manner.
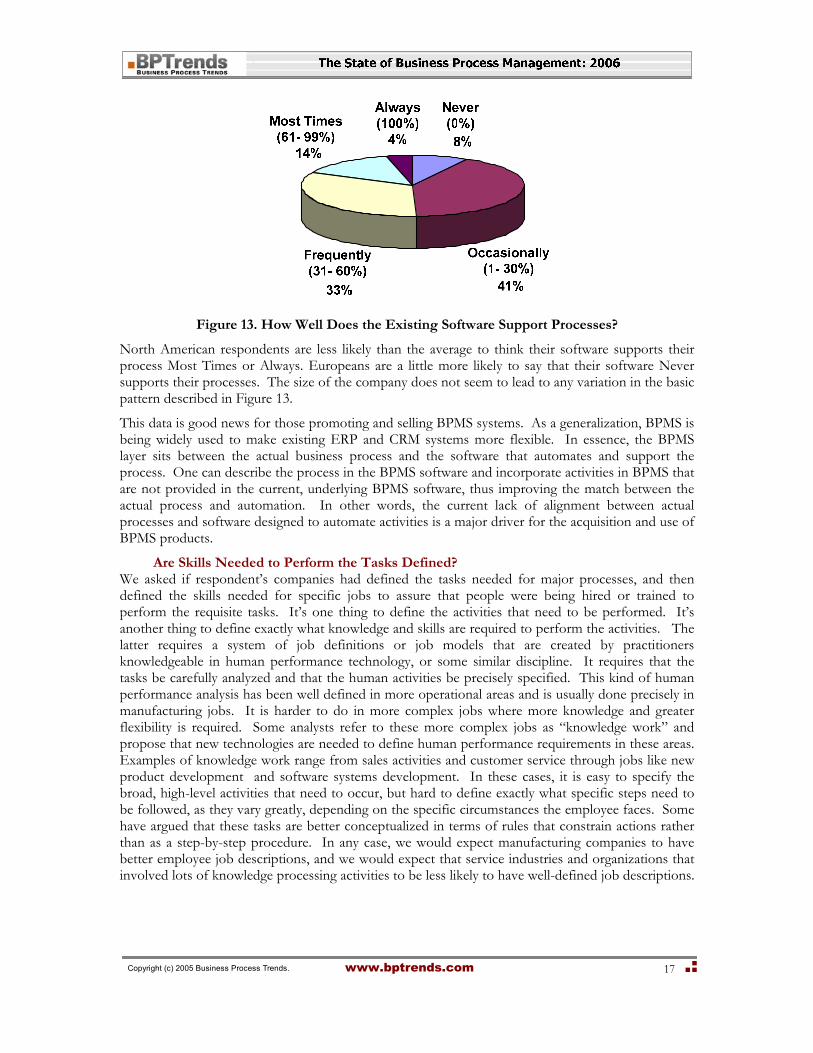
As you can see from Figure 13, most respondents feel that their software only Occasionally (41%) or, at most, Frequently (33%) supports their business processes. Only 18% think that their company’s software Always or Mostly supports company processes.
Copyright (c) 2005 Business Process Trends. www.bptrends.com
17
Figure 13. How Well Does the Existing Software Support Processes?
North American respondents are less likely than the average to think their software supports their process Most Times or Always. Europeans are a little more likely to say that their software Never supports their processes. The size of the company does not seem to lead to any variation in the basic pattern described in Figure 13.
This data is good news for those promoting and selling BPMS systems. As a generalization, BPMS is being widely used to make existing ERP and CRM systems more flexible. In essence, the BPMS layer sits between the actual business process and the software that automates and support the process. One can describe the process in the BPMS software and incorporate activities in BPMS that are not provided in the current, underlying BPMS software, thus improving the match between the actual process and automation. In other words, the current lack of alignment between actual processes and software designed to automate activities is a major driver for the acquisition and use of BPMS products.
Are Skills Needed to Perform the Tasks Defined? We asked if respondent’s companies had defined the tasks needed for major processes, and then defined the skills needed for specific jobs to assure that people were being hired or trained to perform the requisite tasks. It’s one thing to define the activities that need to be performed. It’s another thing to define exactly what knowledge and skills are required to perform the activities. The latter requires a system of job definitions or job models that are created by practitioners knowledgeable in human performance technology, or some similar discipline. It requires that the tasks be carefully analyzed and that the human activities be precisely specified. This kind of human performance analysis has been well defined in more operational areas and is usually done precisely in manufacturing jobs. It is harder to do in more complex jobs where more knowledge and greater flexibility is required. Some analysts refer to these more complex jobs as “knowledge work” and propose that new technologies are needed to define human performance requirements in these areas. Examples of knowledge work range from sales activities and customer service through jobs like new product development and software systems development. In these cases, it is easy to specify the broad, high-level activities that need to occur, but hard to define exactly what specific steps need to be followed, as they vary greatly, depending on the specific circumstances the employee faces. Some have argued that these tasks are better conceptualized in terms of rules that constrain actions rather than as a step-by-step procedure. In any case, we would expect manufacturing companies to have better employee job descriptions, and we would expect that service industries and organizations that involved lots of knowledge processing activities to be less likely to have well-defined job descriptions.
Copyright (c) 2005 Business Process Trends. www.bptrends.com
18
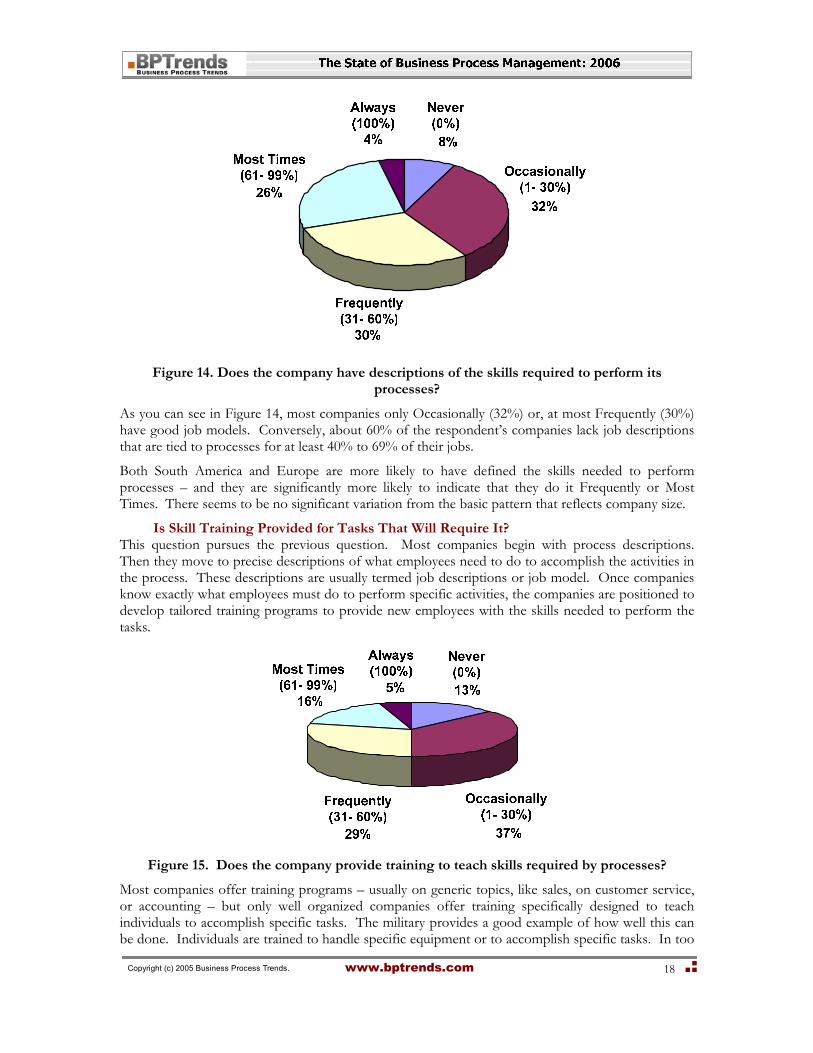
Figure 14. Does the company have descriptions of the skills required to perform its
processes?
As you can see in Figure 14, most companies only Occasionally (32%) or, at most Frequently (30%) have good job models. Conversely, about 60% of the respondent’s companies lack job descriptions that are tied to processes for at least 40% to 69% of their jobs.
Both South America and Europe are more likely to have defined the skills needed to perform processes – and they are significantly more likely to indicate that they do it Frequently or Most Times. There seems to be no significant variation from the basic pattern that reflects company size.
Is Skill Training Provided for Tasks That Will Require It? This question pursues the previous question. Most companies begin with process descriptions. Then they move to precise descriptions of what employees need to do to accomplish the activities in the process. These descriptions are usually termed job descriptions or job model. Once companies know exactly what employees must do to perform specific activities, the companies are positioned to develop tailored training programs to provide new employees with the skills needed to perform the tasks.
Figure 15. Does the company provide training to teach skills required by processes?
Most companies offer training programs – usually on generic topics, like sales, on customer service, or accounting – but only well organized companies offer training specifically designed to teach individuals to accomplish specific tasks. The military provides a good example of how well this can be done. Individuals are trained to handle specific equipment or to accomplish specific tasks. In too

Copyright (c) 2005 Business Process Trends. www.bptrends.com
19
many civilian jobs, the company simply hires someone who has done something similar in the past and assumes that the person can figure out how to perform the new task the way the company wants it done.
A glance at Figure 15 suggests that only 5% of the respondents’
companies have succeeded in aligning processes with job descriptions and training in all cases and that only 21% of the companies either Always or most often achieve this. A surprising number, 13%, Never manage it, and most do it only Occasionally (37%) or Frequently (29%).
Large companies are most likely to have tailored training for defined skills, and medium and small companies are less likely to have tailored training. North American and South American respondents suggest that their companies are less likely to have tailored training, while Europeans are in between, and Asian, Australian, African, and Middle East respondents suggest that their companies are slightly more likely to do so.
Do Process Managers Use Performance Data to Manage Processes? Shifting to managers, we asked if the managers at companies used performance data to manage their processes. Implicitly, this assumes that the processes are monitored and that the data is organized in a manner that can supports decisions. In most companies this kind of data is more common at the lower levels of the organization and less likely to be available at higher levels. Thus, for example, supervisors usually monitor the performance of workers and can usually point to specific instances where employees succeeded or failed to perform specific activities. The problem becomes more complex as one looks at higher-level managers, who, in effect, manage other managers. Higher-level managers can only manage their subordinates, using process performance measures, if their subordinates are assigned responsibilities for specific processes and know what measures are to be used to evaluate the success or failure of the process they must manage.
In CMM terms, this question probes the extent to which the company is moving from CMM level 3 to level 4 and is focusing on measuring and managing processes in a systematic manner.
Figure 16. Do managers use performance data to manager their processes?
A glance at Figure 16 shows that the pattern we have observed over the course of the last several questions continues here. A few companies Always manage to do this (4%). A slightly larger number (16%) do it most of the time. A little over half do it between 1% and 60% of the time, and a number (16%) Never manage it. One could generalize, based on this pattern, that about 4% of the companies being considered in this survey are between CMM levels 4-5; that about 16% are moving between 3-4,; and that most companies 80% are between levels 2 and 3.
Large companies and small companies are both more likely to have process managers that use performance data Most Times to manage their processes, while mid-sized companies are less likely to
Copyright (c) 2005 Business Process Trends. www.bptrends.com
20
do so. North American, South America, Asia/Australia, and Europe are more likely to use performance data in management decisions Most Times than Africa and the Middle East.
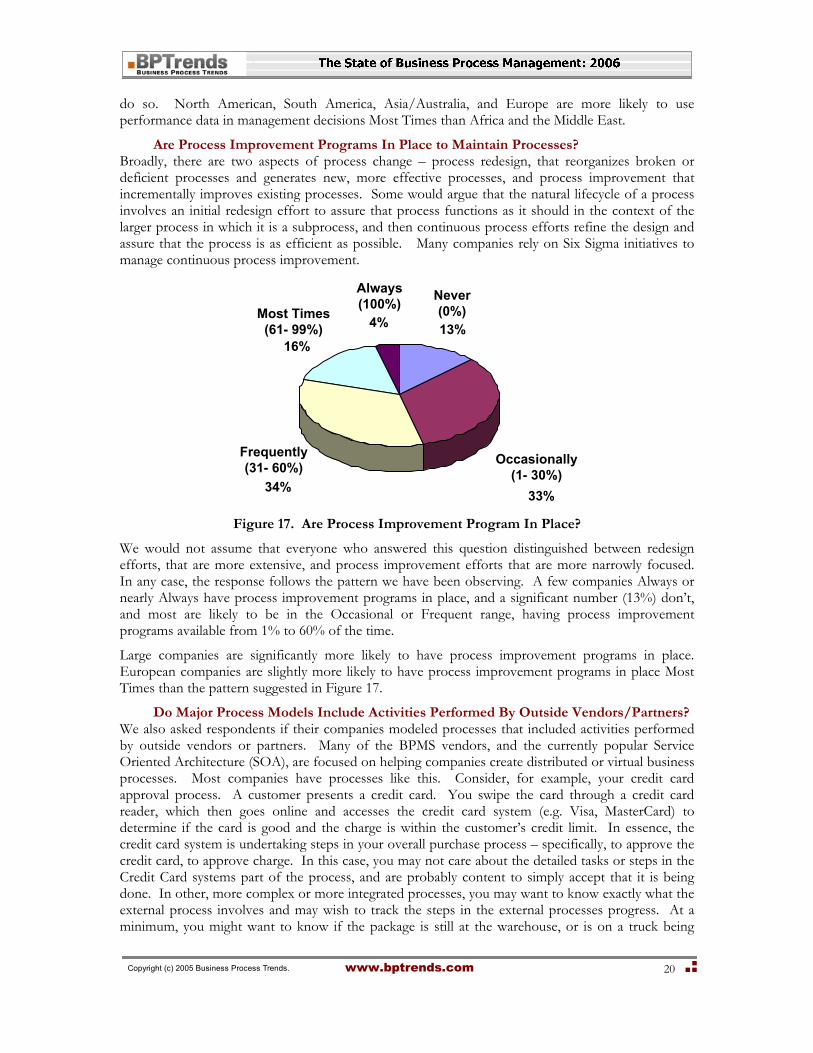
Are Process Improvement Programs In Place to Maintain Processes? Broadly, there are two aspects of process change – process redesign, that reorganizes broken or deficient processes and generates new, more effective processes, and process improvement that incrementally improves existing processes. Some would argue that the natural lifecycle of a process involves an initial redesign effort to assure that process functions as it should in the context of the larger process in which it is a subprocess, and then continuous process efforts refine the design and assure that the process is as efficient as possible. Many companies rely on Six Sigma initiatives to manage continuous process improvement.
Never (0%)
Occasionally(1- 30%)
Frequently (31- 60%)
Most Times (61- 99%)
Always (100%)
13%
33%34%
16%
4%
Figure 17. Are Process Improvement Program In Place?
We would not assume that everyone who answered this question distinguished between redesign efforts, that are more extensive, and process improvement efforts that are more narrowly focused. In any case, the response follows the pattern we have been observing. A few companies Always or nearly Always have process improvement programs in place, and a significant number (13%) don’t, and most are likely to be in the Occasional or Frequent range, having process improvement programs available from 1% to 60% of the time.
Large companies are significantly more likely to have process improvement programs in place. European companies are slightly more likely to have process improvement programs in place Most Times than the pattern suggested in Figure 17.
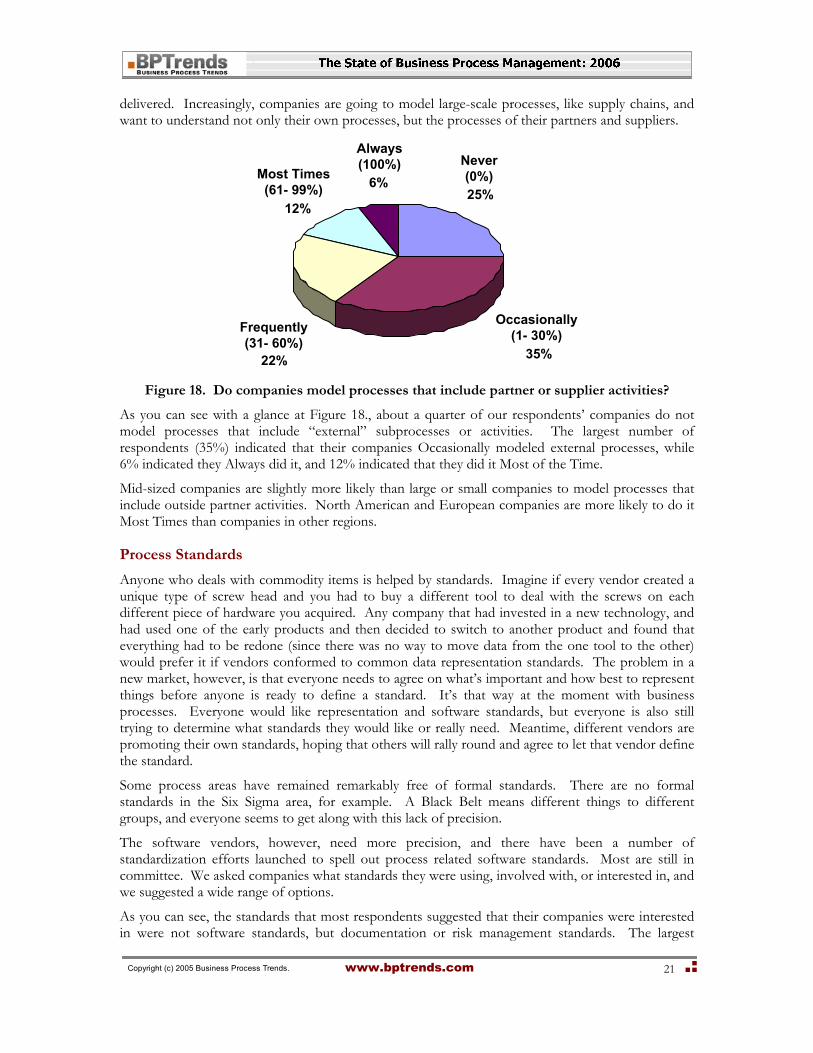
Do Major Process Models Include Activities Performed By Outside Vendors/Partners? We also asked respondents if their companies modeled processes that included activities performed by outside vendors or partners. Many of the BPMS vendors, and the currently popular Service Oriented Architecture (SOA), are focused on helping companies create distributed or virtual business processes. Most companies have processes like this. Consider, for example, your credit card approval process. A customer presents a credit card. You swipe the card through a credit card reader, which then goes online and accesses the credit card system (e.g. Visa, MasterCard) to determine if the card is good and the charge is within the customer’s credit limit. In essence, the credit card system is undertaking steps in your overall purchase process – specifically, to approve the credit card, to approve charge. In this case, you may not care about the detailed tasks or steps in the Credit Card systems part of the process, and are probably content to simply accept that it is being done. In other, more complex or more integrated processes, you may want to know exactly what the external process involves and may wish to track the steps in the external processes progress. At a minimum, you might want to know if the package is still at the warehouse, or is on a truck being
Copyright (c) 2005 Business Process Trends. www.bptrends.com
21
delivered. Increasingly, companies are going to model large-scale processes, like supply chains, and want to understand not only their own processes, but the processes of their partners and suppliers.
Never (0%)
Occasionally(1- 30%)Frequently
(31- 60%)
Most Times (61- 99%)
Always (100%)
25%
35%22%
12%
6%
Figure 18. Do companies model processes that include partner or supplier activities?
As you can see with a glance at Figure 18., about a quarter of our respondents’ companies do not model processes that include “external” subprocesses or activities. The largest number of respondents (35%) indicated that their companies Occasionally modeled external processes, while 6% indicated they Always did it, and 12% indicated that they did it Most of the Time.
Mid-sized companies are slightly more likely than large or small companies to model processes that include outside partner activities. North American and European companies are more likely to do it Most Times than companies in other regions.
Process Standards
Anyone who deals with commodity items is helped by standards. Imagine if every vendor created a unique type of screw head and you had to buy a different tool to deal with the screws on each different piece of hardware you acquired. Any company that had invested in a new technology, and had used one of the early products and then decided to switch to another product and found that everything had to be redone (since there was no way to move data from the one tool to the other) would prefer it if vendors conformed to common data representation standards. The problem in a new market, however, is that everyone needs to agree on what’s important and how best to represent things before anyone is ready to define a standard. It’s that way at the moment with business processes. Everyone would like representation and software standards, but everyone is also still trying to determine what standards they would like or really need. Meantime, different vendors are promoting their own standards, hoping that others will rally round and agree to let that vendor define the standard.
Some process areas have remained remarkably free of formal standards. There are no formal standards in the Six Sigma area, for example. A Black Belt means different things to different groups, and everyone seems to get along with this lack of precision.
The software vendors, however, need more precision, and there have been a number of standardization efforts launched to spell out process related software standards. Most are still in committee. We asked companies what standards they were using, involved with, or interested in, and we suggested a wide range of options.
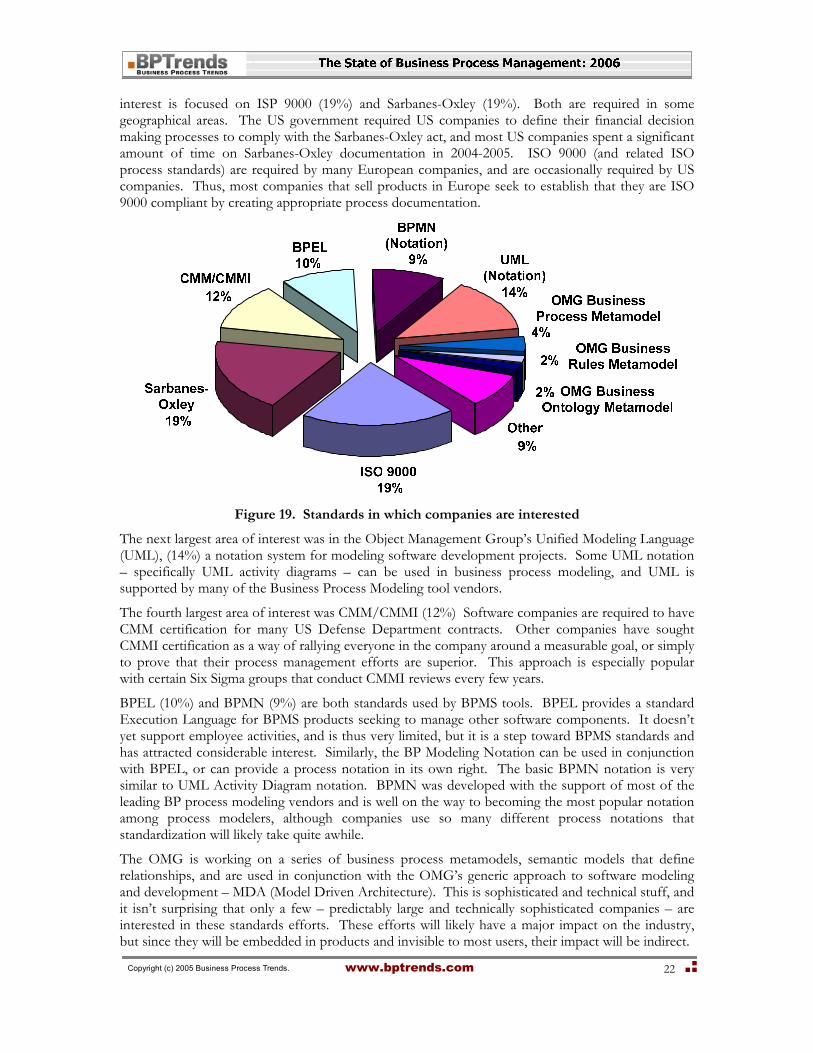
As you can see, the standards that most respondents suggested that their companies were interested in were not software standards, but documentation or risk management standards. The largest
Copyright (c) 2005 Business Process Trends. www.bptrends.com
22
interest is focused on ISP 9000 (19%) and Sarbanes-Oxley (19%). Both are required in some geographical areas. The US government required US companies to define their financial decision making processes to comply with the Sarbanes-Oxley act, and most US companies spent a significant amount of time on Sarbanes-Oxley documentation in 2004-2005. ISO 9000 (and related ISO process standards) are required by many European companies, and are occasionally required by US companies. Thus, most companies that sell products in Europe seek to establish that they are ISO 9000 compliant by creating appropriate process documentation.
Figure 19. Standards in which companies are interested
The next largest area of interest was in the Object Management Group’s Unified Modeling Language (UML), (14%) a notation system for modeling software development projects. Some UML notation – specifically UML activity diagrams – can be used in business process modeling, and UML is supported by many of the Business Process Modeling tool vendors.
The fourth largest area of interest was CMM/CMMI (12%) Software companies are required to have CMM certification for many US Defense Department contracts. Other companies have sought CMMI certification as a way of rallying everyone in the company around a measurable goal, or simply to prove that their process management efforts are superior. This approach is especially popular with certain Six Sigma groups that conduct CMMI reviews every few years.
BPEL (10%) and BPMN (9%) are both standards used by BPMS tools. BPEL provides a standard Execution Language for BPMS products seeking to manage other software components. It doesn’t yet support employee activities, and is thus very limited, but it is a step toward BPMS standards and has attracted considerable interest. Similarly, the BP Modeling Notation can be used in conjunction with BPEL, or can provide a process notation in its own right. The basic BPMN notation is very similar to UML Activity Diagram notation. BPMN was developed with the support of most of the leading BP process modeling vendors and is well on the way to becoming the most popular notation among process modelers, although companies use so many different process notations that standardization will likely take quite awhile.
The OMG is working on a series of business process metamodels, semantic models that define relationships, and are used in conjunction with the OMG’s generic approach to software modeling and development – MDA (Model Driven Architecture). This is sophisticated and technical stuff, and it isn’t surprising that only a few – predictably large and technically sophisticated companies – are interested in these standards efforts. These efforts will likely have a major impact on the industry, but since they will be embedded in products and invisible to most users, their impact will be indirect.
Copyright (c) 2005 Business Process Trends. www.bptrends.com
23
Predictably, North American companies are much more concerned with Sarbanes-Oxley (a U.S. government requirement) than companies in other regions, while European companies are much more likely to be concerned with ISO 9000 than those in other regions. Interest in CMM/CMMI is about the same worldwide. Interest in BPEL, UML, and BPMN is significantly higher in Europe than in North America. Interest in the OMG metamodels is about the same worldwide. The size of the company does not appear to affect interest in standards, although large companies are perhaps slightly more interested in standards than mid or small companies.
In responding to “Other,” respondents cited various standards we had failed to list. Several mentioned Six Sigma, though it would be interesting to know exactly how they would define that “standard.” Similarly, several respondents mentioned Lean, but it is a practice defined by several different books, but without any formal definition or widely accepted certification process. Several mentioned SCOR, the Supply Chain Council’s supply chain methodology and notation, and others mentioned ITIL, an IT services standard developed by the UK government. Several respondents cited variations on ISO 9000, of which there are many.
Copyright (c) 2005 Business Process Trends. www.bptrends.com
24
BPM Spending in 2005
How Much Are Companies Spending on BPM?
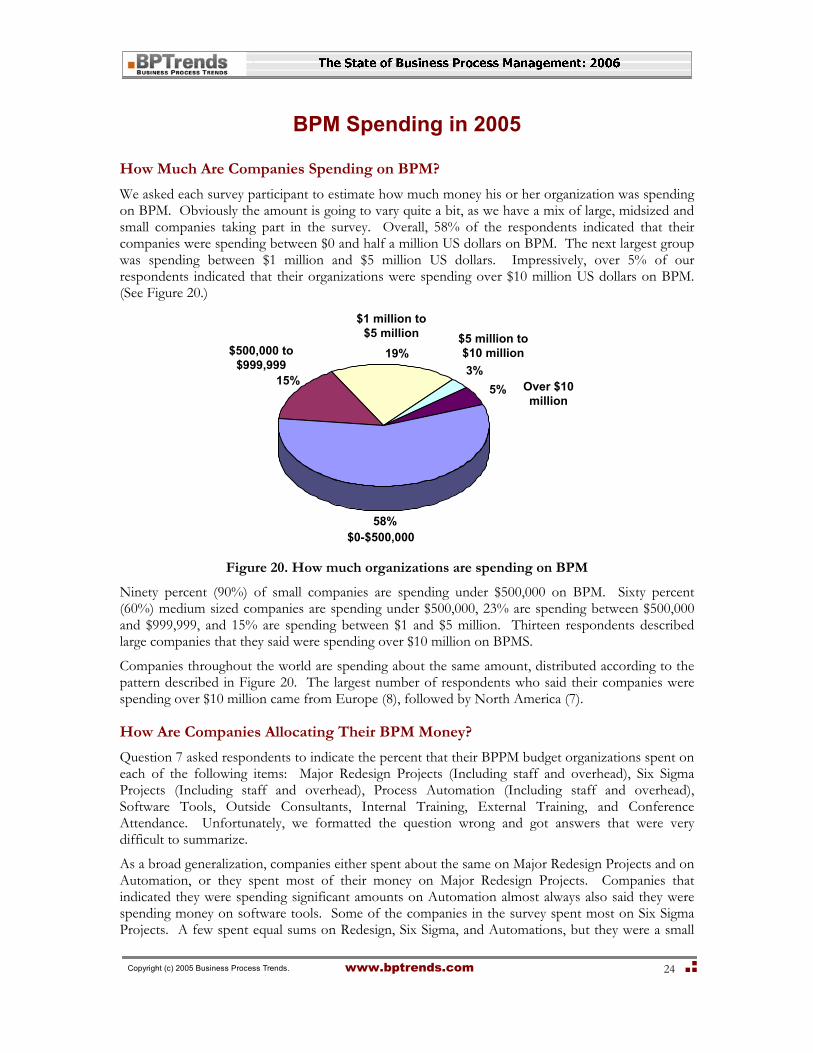
We asked each survey participant to estimate how much money his or her organization was spending on BPM. Obviously the amount is going to vary quite a bit, as we have a mix of large, midsized and small companies taking part in the survey. Overall, 58% of the respondents indicated that their companies were spending between $0 and half a million US dollars on BPM. The next largest group was spending between $1 million and $5 million US dollars. Impressively, over 5% of our respondents indicated that their organizations were spending over $10 million US dollars on BPM. (See Figure 20.)
$0-$500,00058%
$5 million to $10 million3%
Over $10 million
5%
$1 million to $5 million
19%$500,000 to $999,999
15%
Figure 20. How much organizations are spending on BPM
Ninety percent (90%) of small companies are spending under $500,000 on BPM. Sixty percent (60%) medium sized companies are spending under $500,000, 23% are spending between $500,000 and $999,999, and 15% are spending between $1 and $5 million. Thirteen respondents described large companies that they said were spending over $10 million on BPMS.
Companies throughout the world are spending about the same amount, distributed according to the pattern described in Figure 20. The largest number of respondents who said their companies were spending over $10 million came from Europe (8), followed by North America (7).
How Are Companies Allocating Their BPM Money?
Question 7 asked respondents to indicate the percent that their BPPM budget organizations spent on each of the following items: Major Redesign Projects (Including staff and overhead), Six Sigma Projects (Including staff and overhead), Process Automation (Including staff and overhead), Software Tools, Outside Consultants, Internal Training, External Training, and Conference Attendance. Unfortunately, we formatted the question wrong and got answers that were very difficult to summarize.
As a broad generalization, companies either spent about the same on Major Redesign Projects and on Automation, or they spent most of their money on Major Redesign Projects. Companies that indicated they were spending significant amounts on Automation almost always also said they were spending money on software tools. Some of the companies in the survey spent most on Six Sigma Projects. A few spent equal sums on Redesign, Six Sigma, and Automations, but they were a small

Copyright (c) 2005 Business Process Trends. www.bptrends.com
25
minority. Very broadly, and with lots of specific exceptions, the money divided between the categories, as follows:
• Major Redesign Projects 25-40%
• Six Sigma Projects 25-35% (If not spending on Major Redesign Projects)
• Process Automation 25-35% (If not spending on Major Redesign or Six Sigma)
• Software Tools 5-10% (If also spending on Process Automation)
• Outside Consultants 10-20%
• Internal Training 5%
• External Training 0-3%
• Conference Attendance 0-3%
We understand that the percents don’t add to 100%, since we included some items that are mutually exclusive (e.g. if they spend for Major Redesign, then they usually don’t spend for Six Sigma, or vice versa) and we know they vary by size of company.
We will use a different format on our next survey so we can analyze BPM spending patterns in much more detail.
26
Corporate BPM Activity Today We asked a number of questions to get an idea of what companies were doing today to improve their business processes. Several questions were asked about process activities that occurred at the Executive, Process or Implementation Levels. These question rely on a common BPTrends classification. If this classification is unfamiliar, you can review it in Appendix I. In a similar way, in discussing software products being used in support of BPM efforts, we often rely on the categories that we have defined in the BPTrends Software Tools Classification and in our various Reports. The BPTrends Tools Classification is also described in Appendix I for readers who might not be familiar with our approach to dividing up this rather confusing marketplace.
The Existence and Location of BPM Groups
We asked all respondents if their organizations have a Business Process Management Group to coordinate, train, and support business process efforts within the organization. We asked those that had a BPM Group to tell us where it was located. It’s been our experience that organizations that are serious about enterprise level work – organizations moving from CMM level 3 to CMM level 4 – usually have their BPM Group at the enterprise level, reporting to a corporate executive or to a executive level committee, like planning or strategy. Organizations that have their business process groups located in IT or Quality Control usually have a more limited perspective on BPM and are focused on only a part of the total BPM picture.
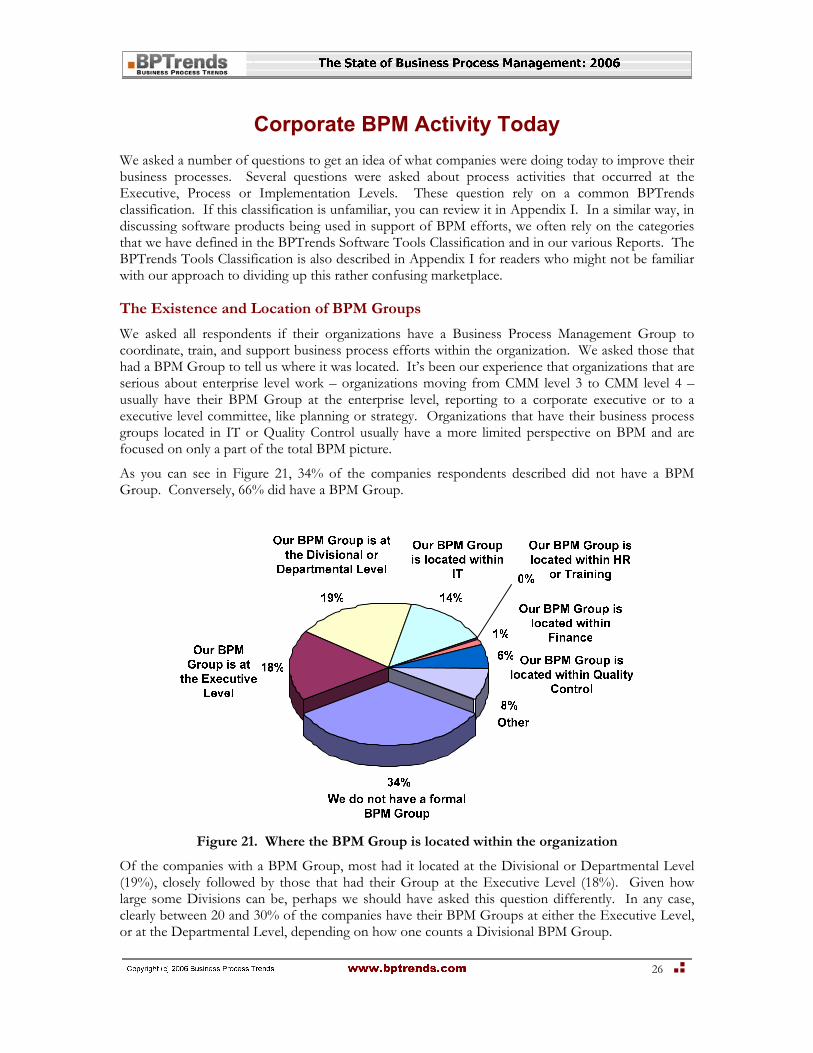
As you can see in Figure 21, 34% of the companies respondents described did not have a BPM Group. Conversely, 66% did have a BPM Group.
Figure 21. Where the BPM Group is located within the organization
Of the companies with a BPM Group, most had it located at the Divisional or Departmental Level (19%), closely followed by those that had their Group at the Executive Level (18%). Given how large some Divisions can be, perhaps we should have asked this question differently. In any case, clearly between 20 and 30% of the companies have their BPM Groups at either the Executive Level, or at the Departmental Level, depending on how one counts a Divisional BPM Group.
Copyright (c) 2005 Business Process Trends. www.bptrends.com
27
No BPM Group was located in HR, and only a few are located in Finance or within Quality Control. 14% are located in IT.
Companies, regardless of size, distributed their BPM groups according to the pattern shown in Figure 21. The only exception is that small companies were significantly less likely to have a BPM Group located in the IT department.
European, Asia/Australia and North American companies were equally likely to have a BPM Group, but companies from South America and Africa/Middle East were considerably less likely to have a BPM Group. Companies from Europe and South America were considerably less likely to have their BPM Group located in IT, and companies from Europe were much more likely to have their BPM Group located within Quality Control. Companies from Asia/Australia and Europe were much more likely to have their BPM Groups located at the Executive Level, while companies from North America were significantly more likely to have their BPM Groups located at the Divisional or Departmental level.
Use of BPM Strategy and Planning Consultants
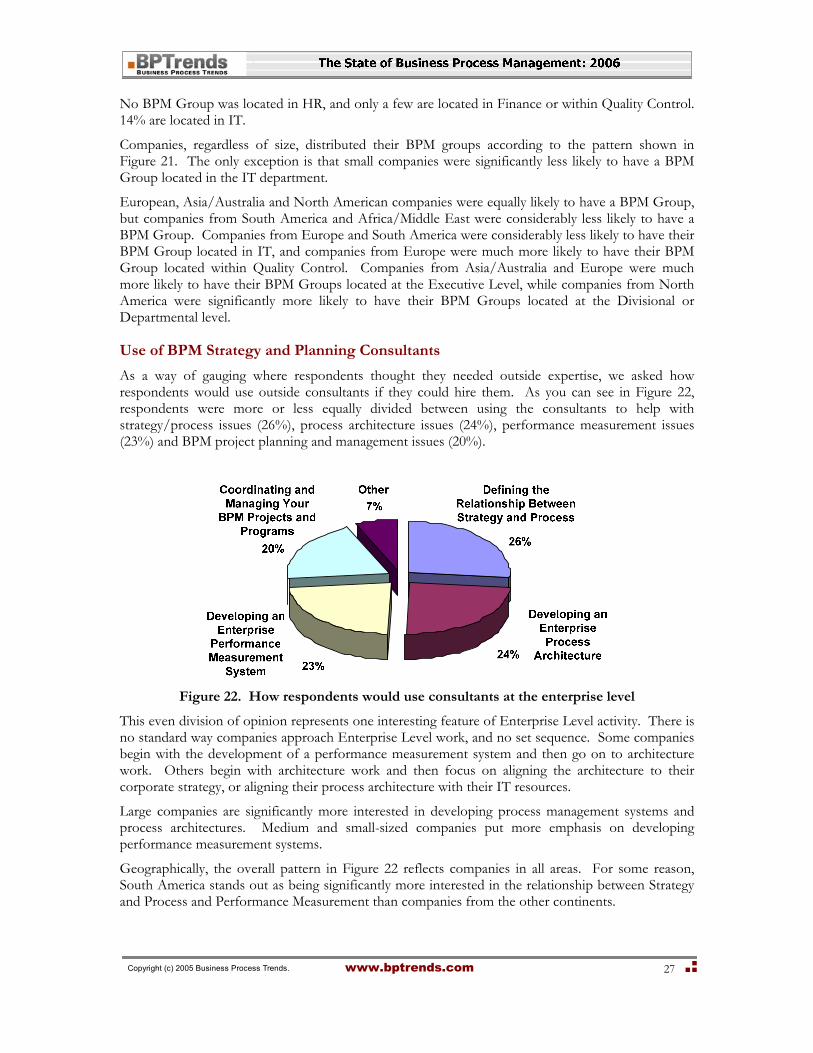
As a way of gauging where respondents thought they needed outside expertise, we asked how respondents would use outside consultants if they could hire them. As you can see in Figure 22, respondents were more or less equally divided between using the consultants to help with strategy/process issues (26%), process architecture issues (24%), performance measurement issues (23%) and BPM project planning and management issues (20%).
Figure 22. How respondents would use consultants at the enterprise level
This even division of opinion represents one interesting feature of Enterprise Level activity. There is no standard way companies approach Enterprise Level work, and no set sequence. Some companies begin with the development of a performance measurement system and then go on to architecture work. Others begin with architecture work and then focus on aligning the architecture to their corporate strategy, or aligning their process architecture with their IT resources.
Large companies are significantly more interested in developing process management systems and process architectures. Medium and small-sized companies put more emphasis on developing performance measurement systems.
Geographically, the overall pattern in Figure 22 reflects companies in all areas. For some reason, South America stands out as being significantly more interested in the relationship between Strategy and Process and Performance Measurement than companies from the other continents.
Copyright (c) 2005 Business Process Trends. www.bptrends.com
28
The Use of Consultants at the Process/Project Level
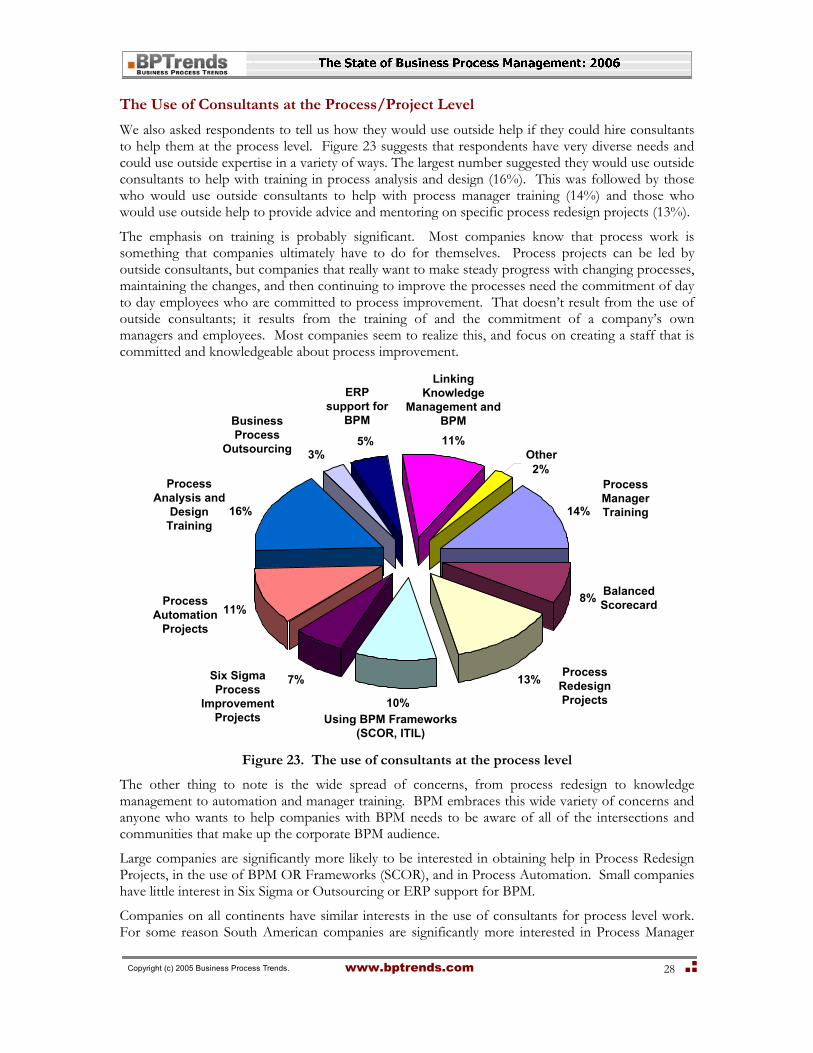
We also asked respondents to tell us how they would use outside help if they could hire consultants to help them at the process level. Figure 23 suggests that respondents have very diverse needs and could use outside expertise in a variety of ways. The largest number suggested they would use outside consultants to help with training in process analysis and design (16%). This was followed by those who would use outside consultants to help with process manager training (14%) and those who would use outside help to provide advice and mentoring on specific process redesign projects (13%).
The emphasis on training is probably significant. Most companies know that process work is something that companies ultimately have to do for themselves. Process projects can be led by outside consultants, but companies that really want to make steady progress with changing processes, maintaining the changes, and then continuing to improve the processes need the commitment of day to day employees who are committed to process improvement. That doesn’t result from the use of outside consultants; it results from the training of and the commitment of a company’s own managers and employees. Most companies seem to realize this, and focus on creating a staff that is committed and knowledgeable about process improvement.
Balanced Scorecard8%
Business Process
Outsourcing 3%
ERP support for
BPM
5%
Linking Knowledge
Management and BPM 11%
Other2%
Process Manager Training14%
Process Redesign Projects
13%
Using BPM Frameworks (SCOR, ITIL)
10%
Six Sigma Process
Improvement Projects
7%
Process Automation
Projects11%
Process Analysis and
Design Training
16%
Figure 23. The use of consultants at the process level
The other thing to note is the wide spread of concerns, from process redesign to knowledge management to automation and manager training. BPM embraces this wide variety of concerns and anyone who wants to help companies with BPM needs to be aware of all of the intersections and communities that make up the corporate BPM audience.
Large companies are significantly more likely to be interested in obtaining help in Process Redesign Projects, in the use of BPM OR Frameworks (SCOR), and in Process Automation. Small companies have little interest in Six Sigma or Outsourcing or ERP support for BPM.
Companies on all continents have similar interests in the use of consultants for process level work. For some reason South American companies are significantly more interested in Process Manager
Copyright (c) 2005 Business Process Trends. www.bptrends.com
29
Training and Balanced Scorecard, but otherwise all countries would seem ready to use consultants in similar ways.
BPM Products and Services Currently Being Used
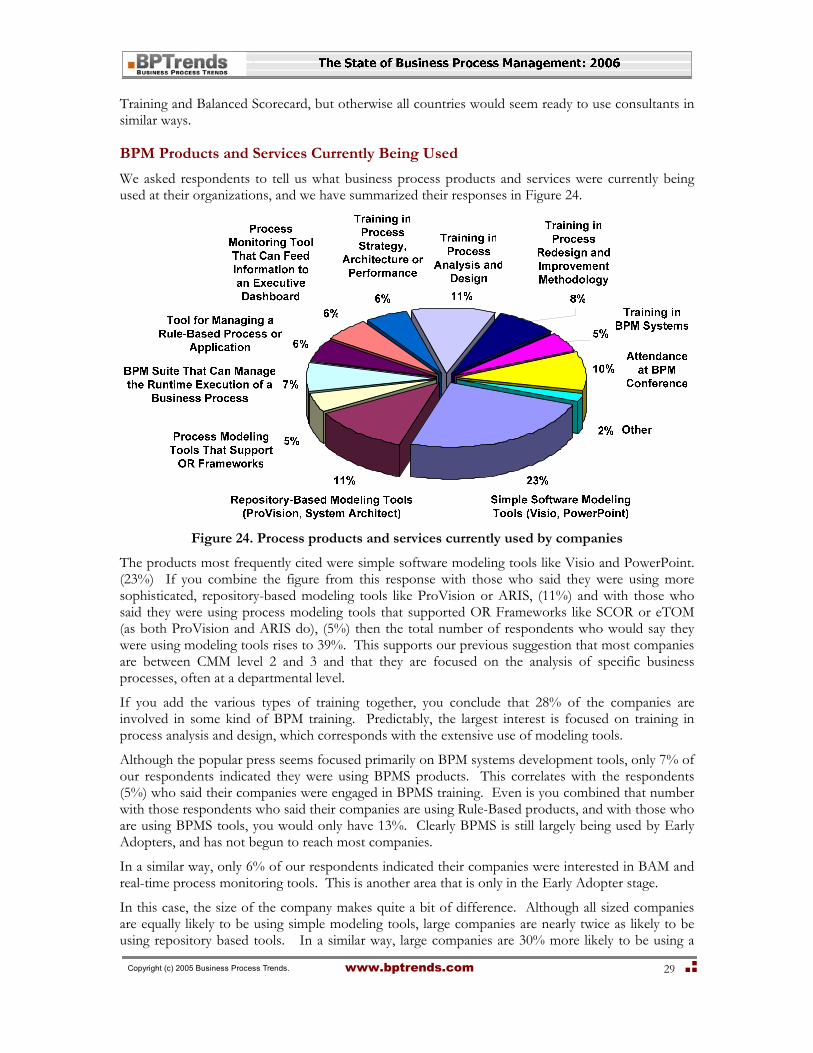
We asked respondents to tell us what business process products and services were currently being used at their organizations, and we have summarized their responses in Figure 24.
Figure 24. Process products and services currently used by companies
The products most frequently cited were simple software modeling tools like Visio and PowerPoint. (23%) If you combine the figure from this response with those who said they were using more sophisticated, repository-based modeling tools like ProVision or ARIS, (11%) and with those who said they were using process modeling tools that supported OR Frameworks like SCOR or eTOM (as both ProVision and ARIS do), (5%) then the total number of respondents who would say they were using modeling tools rises to 39%. This supports our previous suggestion that most companies are between CMM level 2 and 3 and that they are focused on the analysis of specific business processes, often at a departmental level.
If you add the various types of training together, you conclude that 28% of the companies are involved in some kind of BPM training. Predictably, the largest interest is focused on training in process analysis and design, which corresponds with the extensive use of modeling tools.
Although the popular press seems focused primarily on BPM systems development tools, only 7% of our respondents indicated they were using BPMS products. This correlates with the respondents (5%) who said their companies were engaged in BPMS training. Even is you combined that number with those respondents who said their companies are using Rule-Based products, and with those who are using BPMS tools, you would only have 13%. Clearly BPMS is still largely being used by Early Adopters, and has not begun to reach most companies.
In a similar way, only 6% of our respondents indicated their companies were interested in BAM and real-time process monitoring tools. This is another area that is only in the Early Adopter stage.
In this case, the size of the company makes quite a bit of difference. Although all sized companies are equally likely to be using simple modeling tools, large companies are nearly twice as likely to be using repository based tools. In a similar way, large companies are 30% more likely to be using a

Copyright (c) 2005 Business Process Trends. www.bptrends.com
30
BPM Suite or a Process Monitoring tool. Similarly, large companies are significantly more likely to be doing Process Analysis and Design training or BPMS training.
Large and medium sized companies are equally likely to be using a Rule-based tool, and much more likely to be doing so than small companies. Mid-sized companies are slightly more likely to send people to BPM conferences.
European and Asian/Australian companies are significantly more likely to be using a repository-based Modeling tool. North American companies are significantly less likely to be using a BPMS tool or a Rule-based tool than a company anywhere else in the world.
All companies follow the general pattern for Analysis and Design training, but US companies are more likely to be doing training in Redesign and Improvement methodologies, and European and Asian/Australian companies are more likely to be using or doing training that involves OR Frameworks
BPM Conference attendance is higher in North America and Europe and slightly lower elsewhere.
Which Tools Were Most Valuable in 2005
We shifted from simply asking what business process tools were being used, and asked each respondent to tell us which specific business process tool was most valuable to his or her organization in 2005. The results shown in Figure 25 are interesting, not because they show that process modeling tools were most valuable – that was predictable – but because of the wide variety of other tools that some companies found most valuable. Thus, for example, 6% of the respondents found a Simulation Tool to be their most valuable business process tool in 2005. Similarly, 4% found a BAM or Real-Time Monitoring Tool to be their most valuable tool, while 5% said that a rule-based tool was most valuable. Obviously these responses suggest the range of projects being undertaken by the respondents.
Most companies are working to understand their business processes. They are using either graphical tools, like Visio or PowerPoint, or more sophisticated, repository-based tools like Envision VIP, iGrafx, ARIS, Adonis, MEGA, Process Wizard, ProVison, or System Architect. (See Figure 25.)
Organizational Modeling
Environment 7%
Process Modeling Tool 22%
BAM/Real-Time Process Monitoring
Tool4% Performance Metrics Tool/
System9%
Other4%
Simulation Tool
6%
BPMS Execution Environment (Workflow,
EAI) 12%
Repository 7%
Business Rules Tool 5%
Graphics Tool (Visio, PowerPoint)24%
Figure 25. The BPM software tool that was most important in 2005
Respondents from medium-sized companies indicated that their companies were more likely to think a graphics tool was their most important BPM product, while respondents from large companies were more likely to suggest that a repository-based, process modeling tool was their most valuable tool. Medium-sized companies were slightly more likely to favor a business rules tool while large

Copyright (c) 2005 Business Process Trends. www.bptrends.com
31
companies were much more likely to favor a BPM repository product. Respondents from companies of all sizes were equally likely to say that their companies favored a BPMS product. Medium and small companies were much more likely to favor a process monitoring tool.
North Americans were most likely to say their companies favored a Graphics tool, while Europeans were significantly less likely to say their companies preferred a Graphics tool for modeling. Respondents from Asia/Australia and Europe were much more likely to say a repository-based process modeling tool was their most valuable tool. North Americans and Asians/Australians were much more likely to prefer a rules-based tool.
BPMS tools were equally popular in all regions. Simulation tools and BAM/Real Time Monitoring tools were much more likely to be favorites in Europe.
Business Process Initiatives Underway in 2005
To determine what kinds of business process efforts companies were currently engaged in, we asked respondents to choose from a wide variety of BPM initiatives. Figure 26 summarizes their responses. Interestingly, the largest number indicated that they were working on the development of an enterprise process architecture (13%). Given other indicators that suggest that most companies are between CMM level 2 and 3, we see this as an indicator that 13% are actively trying to shift from CMM level 2 to level 3.
The activity that the second largest group of respondents said they were engaged in was major process redesign (12%).
Development of an Enterprise Process
Archiecture
13%
Major Process Redesign projects
12%
None 4%
Lean Six Sigma Process Modeling and Redesign
Training 5%
Redesign Projects With Frameworks (SCOR, ITIL)
4%
Process Manager Training
6%
Six Sigma Process
Improvement Projects
7%
Balanced Scorecard
8%
Coordinating Enterprise Process
Management Efforts
8%Development of an Enterprise Process
Performance Measurement System
8%
Major Process Automation Projects 8%
Process Analysis and Redesign Training (Non-Six Sigma)
8%
Coordinating Enterprise Process
Change Efforts
9%
Figure 26. Activities in which companies were engaged in 2005.
If we pull all the various types of training activities together, we can see that 19% of the companies were engaged in some type of process training. Similarly, if we pull together all of the activities involved in process analysis, redesign, automation, and improvement, we can see that 39% of the companies are engaged in some type of process change effort. Finally, if we pull together the numbers for all of the activities that are essentially enterprise level activities (architecture, measurement, process management, including Balanced Scorecard, and process change coordination), we realize that 46% of the companies described in the survey are engaged in some kind of enterprise level BPM activity.
It’s noteworthy that the development of process architectures (13%) is more common than either enterprise performance measurement (8%) or management systems work (8%). This is expected.
Copyright (c) 2005 Business Process Trends. www.bptrends.com
32
One needs to define one’s processes before one is in a position to determine how to measure or manage those processes.
Large companies were more likely to be engaged in the development of a Process Architecture or a Process Measurement System and much more likely to be implementing a Process Management system in 2005. Large and mid-sized companies are more likely to have or be developing a BPM group, or some other kind of central system to coordinate BPM efforts. In all other areas, large companies are more or much more likely to be doing work with Balanced Scorecard, Lean or Six Sigma Projects, Major BP Redesign projects, Framework-based projects or Major Automation projects.
European companies were more likely to be doing Process Architecture or Process Measurement Systems work in 2005. Europe and North American companies were equally likely to be setting up a BPM Group, and they were both ahead of other regions in that regard.
North American companies were much more likely to have been working on Process Management systems in 2005, and were more likely to have been doing a Major Redesign, Six Sigma or Automation Project. Other regions were more likely to have been using OR frameworks than North America. Europeans were slightly more likely to be doing Process Analysis and Redesign training and were very much less likely to be doing Lean or Six Sigma training in 2005.

Copyright (c) 2005 Business Process Trends. www.bptrends.com
33
Plans for the Future We asked all respondents to tell us what they expected their organizations to focus on in 2006. Specifically, we suggested a number of activities and asked if their organizations would be less active in that area than they had been in 2005, more active in that area than in 2005, or whether they expected to put the same degree of effort into that area in 2006 as they had in 2005.
The Development of an Enterprise Process Architecture
Thirteen percent (13%) of the respondents indicated that their organizations were active in the development of an enterprise architecture in 2005. Clearly many additional organizations will be active in this area in 2006.
The BPTrends website has posted a number of articles demonstrating either how enterprise process architectures can be used as a management tool to make corporate decisions or how process architectures can be used or organize process change or automation efforts. Clearly this message has been understood and is being acted upon. In a similar way, many organizations pursued process redesign and improvement in the Nineties and are now ready to transition to a CMM level 3-4 organization that has the enterprise level resources to use to manage the organization’s processes more effectively.
Figure 27. Companies that will be developing an enterprise process architecture
Mid-sized organizations were both more and less likely than large or small organizations to pursue enterprise process architecture development than in the average pattern indicated in Figure 26.
All regions conformed to the general pattern described in Figure 26.
The Development of an Enterprise Performance Measurement System
Only 8% of the respondents indicated that their organizations were active in the development of an enterprise process performance measurement system in 2005. As with architectures, over half suggested that their organizations would be doing more in this area in 2006.
More54%
Less8%
Same38%
Figure 28. Companies that will be developing an enterprise performance measurement
system

Copyright (c) 2005 Business Process Trends. www.bptrends.com
34
Small organizations were slightly less likely to increase their performance measurement systems efforts, but otherwise, the size of the organization made little difference. North American companies were slightly more likely to decrease their commitment to Enterprise Performance Management, but otherwise region made no difference in the overall pattern described in Figure 27.
Coordinating Enterprise Process Change Efforts
Only 9% of the respondents indicated that their organizations were active in coordinating process change efforts via an enterprise effort in 2005. In general this means that the organization has a BPM Group that gathers information and prioritizes and coordinates process change efforts. Half of the respondents suggested that their companies would be increasing their coordination efforts in 2006.
Figure 29. Companies that will be developing an enterprise process control capability
Large companies were slightly more likely to increase coordinating process change efforts. North American companies were significantly more likely to increase their efforts in 2006.
Coordinating Process Management Efforts
Only 8% of the respondents indicated that their organizations were active in the development of an enterprise process management capability in 2005. Half of our respondents indicated that their companies would be increasing their efforts in 2006.
Figure 30. Companies that will be developing process management capabilities
Large and mid-sized companies were slightly more likely than small companies to increase their commitment to establishing process management systems. European companies were slightly less likely to increase their commitment to process management systems in 2006.
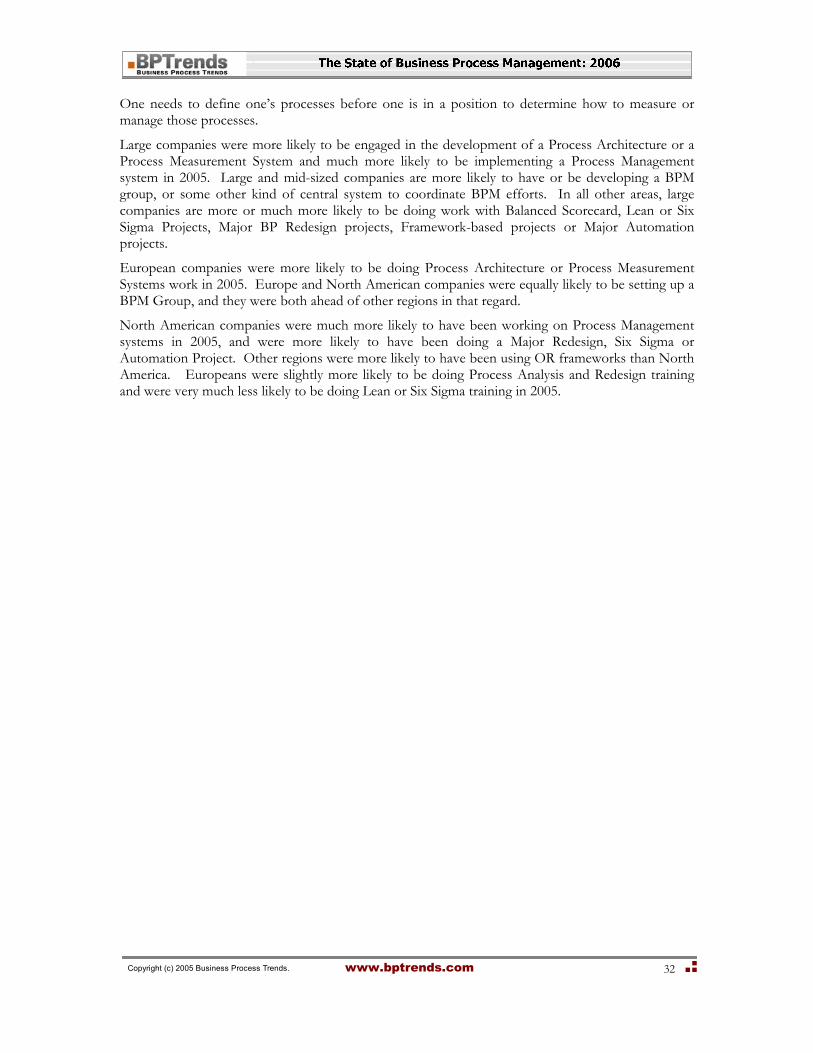
Process Manager Training
Only 6% of the respondents indicated that their organizations were active in process manager training in 2005. Thirty-nine percent (39%) of the respondents said that their companies would be offering more process training to managers in 2006. Almost half said they would be offering the same amount of training and 14% suggested they would be offering less process manager training in 2006.
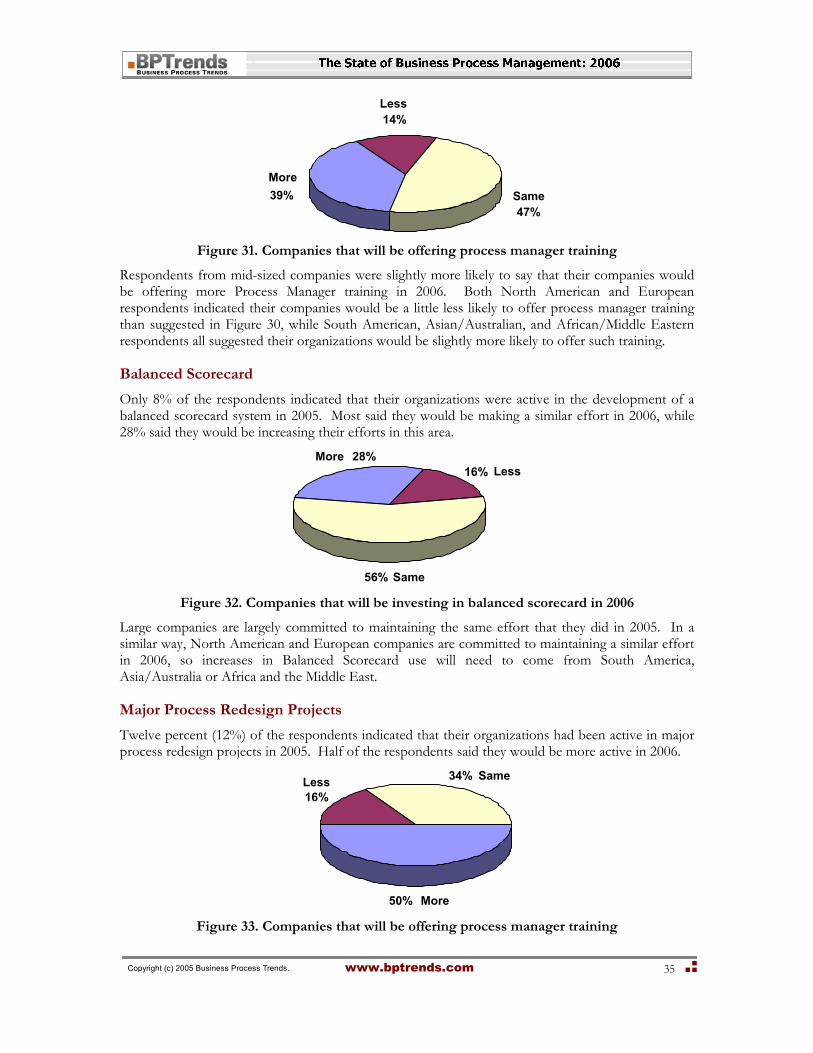
Copyright (c) 2005 Business Process Trends. www.bptrends.com
35
Same47%
More39%
Less14%
Figure 31. Companies that will be offering process manager training
Respondents from mid-sized companies were slightly more likely to say that their companies would be offering more Process Manager training in 2006. Both North American and European respondents indicated their companies would be a little less likely to offer process manager training than suggested in Figure 30, while South American, Asian/Australian, and African/Middle Eastern respondents all suggested their organizations would be slightly more likely to offer such training.
Balanced Scorecard
Only 8% of the respondents indicated that their organizations were active in the development of a balanced scorecard system in 2005. Most said they would be making a similar effort in 2006, while 28% said they would be increasing their efforts in this area.
More 28%Less16%
Same56% Figure 32. Companies that will be investing in balanced scorecard in 2006
Large companies are largely committed to maintaining the same effort that they did in 2005. In a similar way, North American and European companies are committed to maintaining a similar effort in 2006, so increases in Balanced Scorecard use will need to come from South America, Asia/Australia or Africa and the Middle East.
Major Process Redesign Projects
Twelve percent (12%) of the respondents indicated that their organizations had been active in major process redesign projects in 2005. Half of the respondents said they would be more active in 2006.
Same34%Less16%
More50% Figure 33. Companies that will be offering process manager training
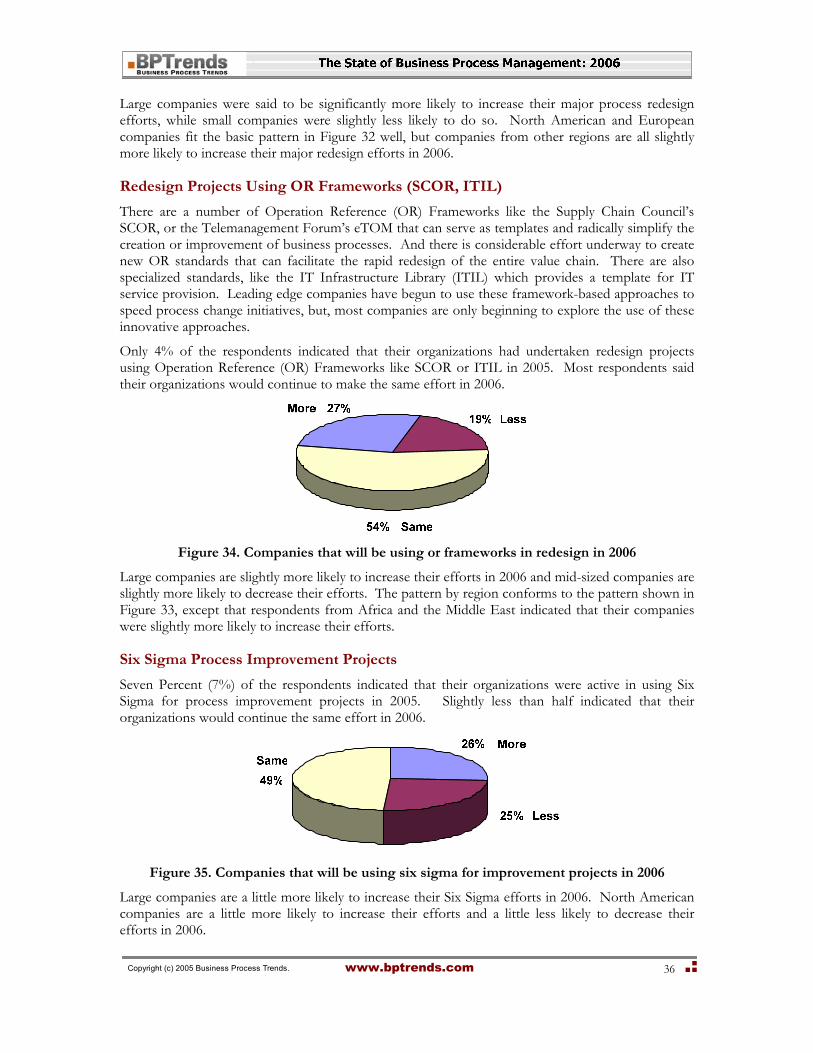
Copyright (c) 2005 Business Process Trends. www.bptrends.com
36
Large companies were said to be significantly more likely to increase their major process redesign efforts, while small companies were slightly less likely to do so. North American and European companies fit the basic pattern in Figure 32 well, but companies from other regions are all slightly more likely to increase their major redesign efforts in 2006.
Redesign Projects Using OR Frameworks (SCOR, ITIL)
There are a number of Operation Reference (OR) Frameworks like the Supply Chain Council’s SCOR, or the Telemanagement Forum’s eTOM that can serve as templates and radically simplify the creation or improvement of business processes. And there is considerable effort underway to create new OR standards that can facilitate the rapid redesign of the entire value chain. There are also specialized standards, like the IT Infrastructure Library (ITIL) which provides a template for IT service provision. Leading edge companies have begun to use these framework-based approaches to speed process change initiatives, but, most companies are only beginning to explore the use of these innovative approaches.
Only 4% of the respondents indicated that their organizations had undertaken redesign projects using Operation Reference (OR) Frameworks like SCOR or ITIL in 2005. Most respondents said their organizations would continue to make the same effort in 2006.
Figure 34. Companies that will be using or frameworks in redesign in 2006
Large companies are slightly more likely to increase their efforts in 2006 and mid-sized companies are slightly more likely to decrease their efforts. The pattern by region conforms to the pattern shown in Figure 33, except that respondents from Africa and the Middle East indicated that their companies were slightly more likely to increase their efforts.
Six Sigma Process Improvement Projects
Seven Percent (7%) of the respondents indicated that their organizations were active in using Six Sigma for process improvement projects in 2005. Slightly less than half indicated that their organizations would continue the same effort in 2006.
Figure 35. Companies that will be using six sigma for improvement projects in 2006
Large companies are a little more likely to increase their Six Sigma efforts in 2006. North American companies are a little more likely to increase their efforts and a little less likely to decrease their efforts in 2006.
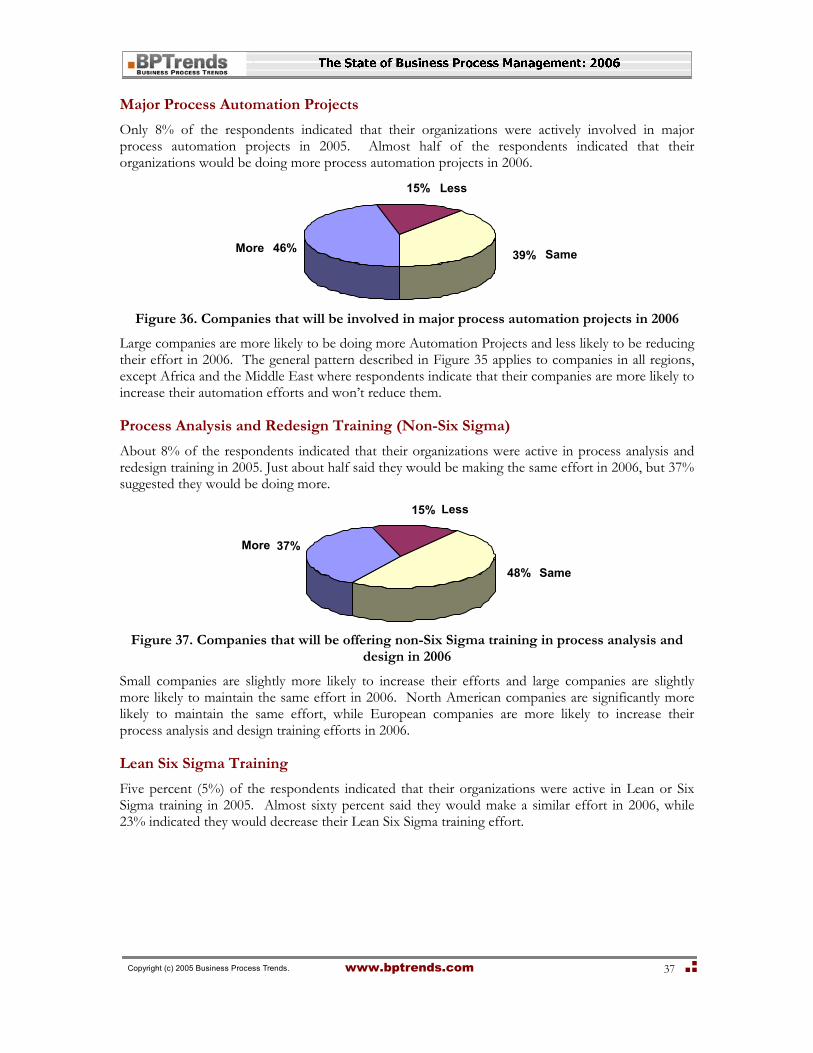
Copyright (c) 2005 Business Process Trends. www.bptrends.com
37
Major Process Automation Projects
Only 8% of the respondents indicated that their organizations were actively involved in major process automation projects in 2005. Almost half of the respondents indicated that their organizations would be doing more process automation projects in 2006.
More 46%
Less15%
Same39%
Figure 36. Companies that will be involved in major process automation projects in 2006
Large companies are more likely to be doing more Automation Projects and less likely to be reducing their effort in 2006. The general pattern described in Figure 35 applies to companies in all regions, except Africa and the Middle East where respondents indicate that their companies are more likely to increase their automation efforts and won’t reduce them.
Process Analysis and Redesign Training (Non-Six Sigma)
About 8% of the respondents indicated that their organizations were active in process analysis and redesign training in 2005. Just about half said they would be making the same effort in 2006, but 37% suggested they would be doing more.
Same48%
More 37%
Less15%
Figure 37. Companies that will be offering non-Six Sigma training in process analysis and
design in 2006
Small companies are slightly more likely to increase their efforts and large companies are slightly more likely to maintain the same effort in 2006. North American companies are significantly more likely to maintain the same effort, while European companies are more likely to increase their process analysis and design training efforts in 2006.
Lean Six Sigma Training
Five percent (5%) of the respondents indicated that their organizations were active in Lean or Six Sigma training in 2005. Almost sixty percent said they would make a similar effort in 2006, while 23% indicated they would decrease their Lean Six Sigma training effort.
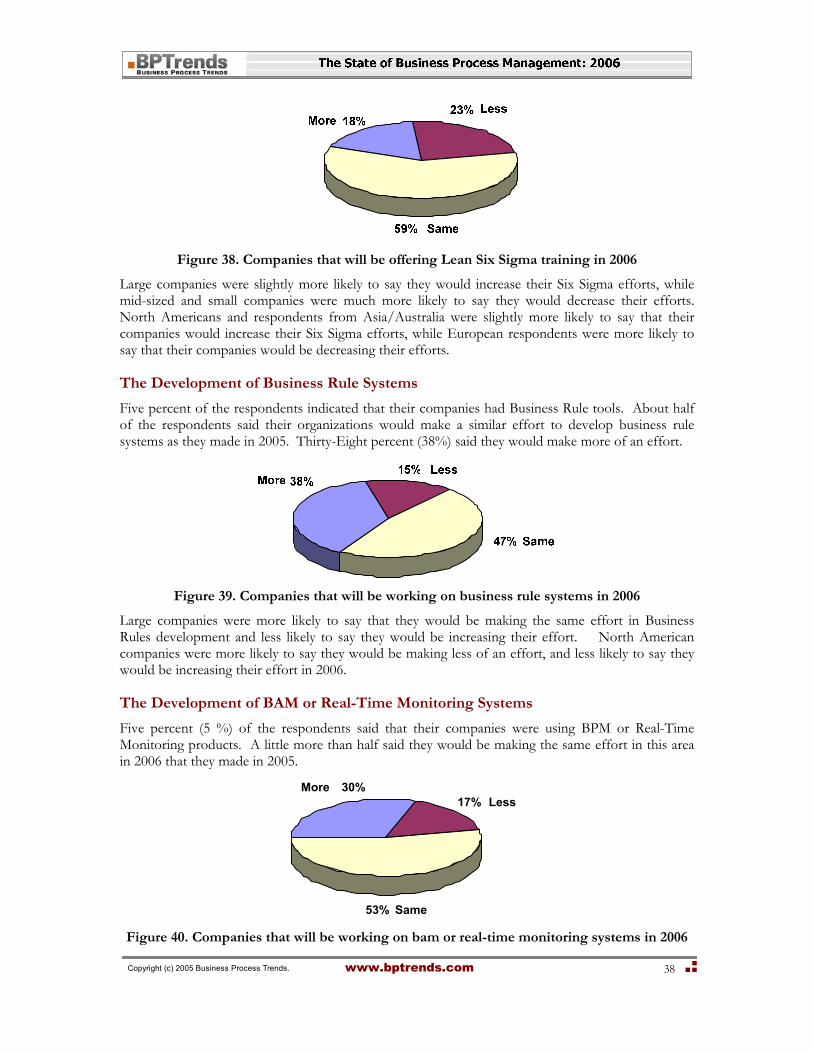
Copyright (c) 2005 Business Process Trends. www.bptrends.com
38
Figure 38. Companies that will be offering Lean Six Sigma training in 2006
Large companies were slightly more likely to say they would increase their Six Sigma efforts, while mid-sized and small companies were much more likely to say they would decrease their efforts. North Americans and respondents from Asia/Australia were slightly more likely to say that their companies would increase their Six Sigma efforts, while European respondents were more likely to say that their companies would be decreasing their efforts.
The Development of Business Rule Systems
Five percent of the respondents indicated that their companies had Business Rule tools. About half of the respondents said their organizations would make a similar effort to develop business rule systems as they made in 2005. Thirty-Eight percent (38%) said they would make more of an effort.
Figure 39. Companies that will be working on business rule systems in 2006
Large companies were more likely to say that they would be making the same effort in Business Rules development and less likely to say they would be increasing their effort. North American companies were more likely to say they would be making less of an effort, and less likely to say they would be increasing their effort in 2006.
The Development of BAM or Real-Time Monitoring Systems
Five percent (5 %) of the respondents said that their companies were using BPM or Real-Time Monitoring products. A little more than half said they would be making the same effort in this area in 2006 that they made in 2005.
Same53%
More 30%Less17%
Figure 40. Companies that will be working on bam or real-time monitoring systems in 2006
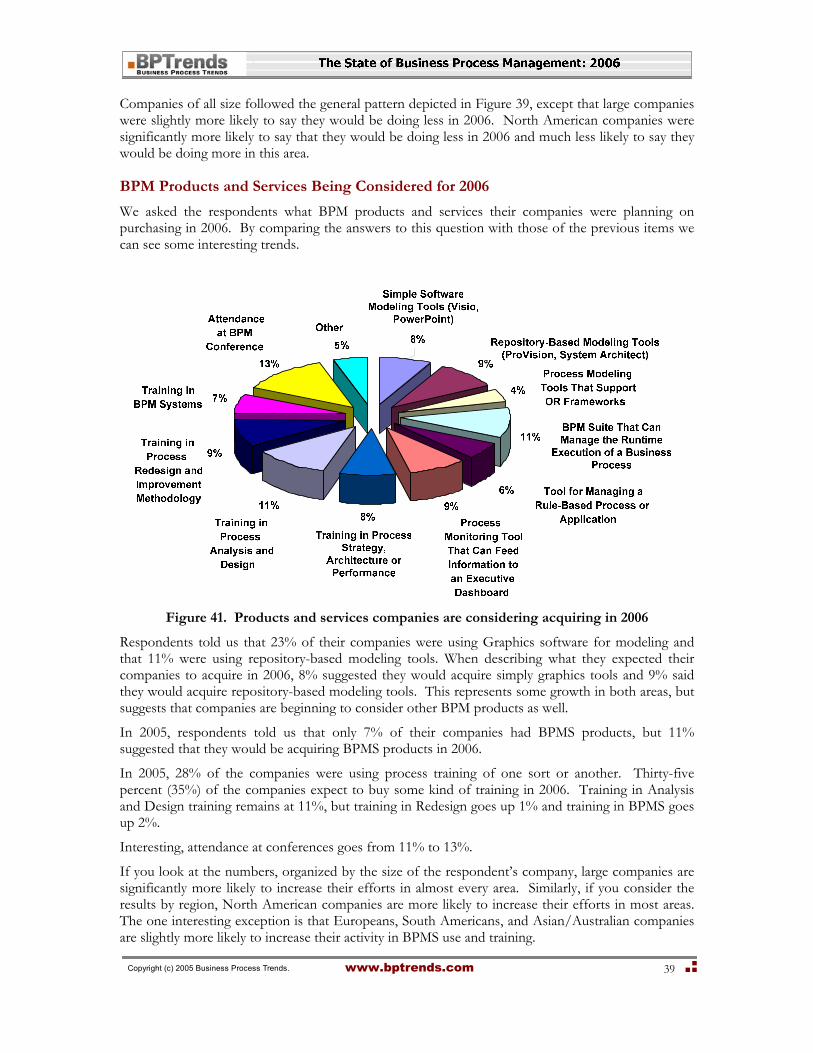
Copyright (c) 2005 Business Process Trends. www.bptrends.com
39
Companies of all size followed the general pattern depicted in Figure 39, except that large companies were slightly more likely to say they would be doing less in 2006. North American companies were significantly more likely to say that they would be doing less in 2006 and much less likely to say they would be doing more in this area.
BPM Products and Services Being Considered for 2006
We asked the respondents what BPM products and services their companies were planning on purchasing in 2006. By comparing the answers to this question with those of the previous items we can see some interesting trends.
Figure 41. Products and services companies are considering acquiring in 2006
Respondents told us that 23% of their companies were using Graphics software for modeling and that 11% were using repository-based modeling tools. When describing what they expected their companies to acquire in 2006, 8% suggested they would acquire simply graphics tools and 9% said they would acquire repository-based modeling tools. This represents some growth in both areas, but suggests that companies are beginning to consider other BPM products as well.
In 2005, respondents told us that only 7% of their companies had BPMS products, but 11% suggested that they would be acquiring BPMS products in 2006.
In 2005, 28% of the companies were using process training of one sort or another. Thirty-five percent (35%) of the companies expect to buy some kind of training in 2006. Training in Analysis and Design training remains at 11%, but training in Redesign goes up 1% and training in BPMS goes up 2%.
Interesting, attendance at conferences goes from 11% to 13%.
If you look at the numbers, organized by the size of the respondent’s company, large companies are significantly more likely to increase their efforts in almost every area. Similarly, if you consider the results by region, North American companies are more likely to increase their efforts in most areas. The one interesting exception is that Europeans, South Americans, and Asian/Australian companies are slightly more likely to increase their activity in BPMS use and training.
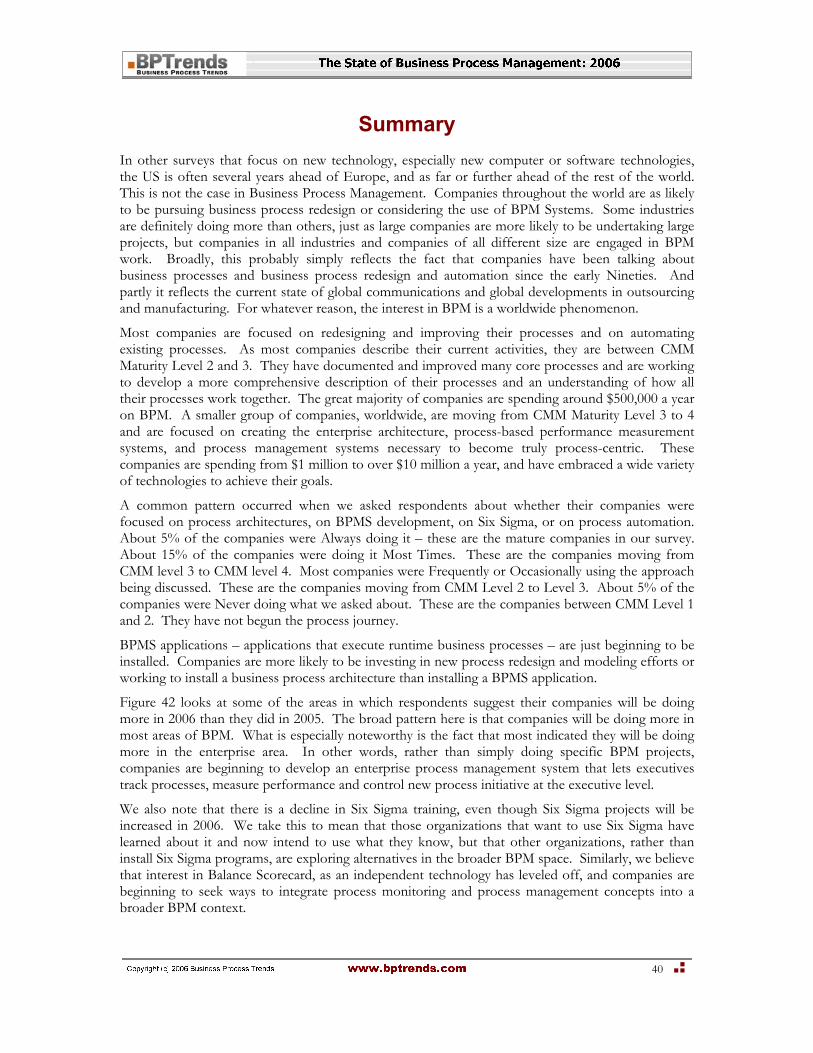
40
Summary In other surveys that focus on new technology, especially new computer or software technologies, the US is often several years ahead of Europe, and as far or further ahead of the rest of the world. This is not the case in Business Process Management. Companies throughout the world are as likely to be pursuing business process redesign or considering the use of BPM Systems. Some industries are definitely doing more than others, just as large companies are more likely to be undertaking large projects, but companies in all industries and companies of all different size are engaged in BPM work. Broadly, this probably simply reflects the fact that companies have been talking about business processes and business process redesign and automation since the early Nineties. And partly it reflects the current state of global communications and global developments in outsourcing and manufacturing. For whatever reason, the interest in BPM is a worldwide phenomenon.
Most companies are focused on redesigning and improving their processes and on automating existing processes. As most companies describe their current activities, they are between CMM Maturity Level 2 and 3. They have documented and improved many core processes and are working to develop a more comprehensive description of their processes and an understanding of how all their processes work together. The great majority of companies are spending around $500,000 a year on BPM. A smaller group of companies, worldwide, are moving from CMM Maturity Level 3 to 4 and are focused on creating the enterprise architecture, process-based performance measurement systems, and process management systems necessary to become truly process-centric. These companies are spending from $1 million to over $10 million a year, and have embraced a wide variety of technologies to achieve their goals.
A common pattern occurred when we asked respondents about whether their companies were focused on process architectures, on BPMS development, on Six Sigma, or on process automation. About 5% of the companies were Always doing it – these are the mature companies in our survey. About 15% of the companies were doing it Most Times. These are the companies moving from CMM level 3 to CMM level 4. Most companies were Frequently or Occasionally using the approach being discussed. These are the companies moving from CMM Level 2 to Level 3. About 5% of the companies were Never doing what we asked about. These are the companies between CMM Level 1 and 2. They have not begun the process journey.
BPMS applications – applications that execute runtime business processes – are just beginning to be installed. Companies are more likely to be investing in new process redesign and modeling efforts or working to install a business process architecture than installing a BPMS application.
Figure 42 looks at some of the areas in which respondents suggest their companies will be doing more in 2006 than they did in 2005. The broad pattern here is that companies will be doing more in most areas of BPM. What is especially noteworthy is the fact that most indicated they will be doing more in the enterprise area. In other words, rather than simply doing specific BPM projects, companies are beginning to develop an enterprise process management system that lets executives track processes, measure performance and control new process initiative at the executive level.
We also note that there is a decline in Six Sigma training, even though Six Sigma projects will be increased in 2006. We take this to mean that those organizations that want to use Six Sigma have learned about it and now intend to use what they know, but that other organizations, rather than install Six Sigma programs, are exploring alternatives in the broader BPM space. Similarly, we believe that interest in Balance Scorecard, as an independent technology has leveled off, and companies are beginning to seek ways to integrate process monitoring and process management concepts into a broader BPM context.

Copyright (c) 2005 Business Process Trends. www.bptrends.com
41
Develop an Enterprise Architecture – 53%
Develop an Enterprise Performance Measurement System – 54%
Coordinating Enterprise Process Change Efforts – 51%
Coordinating Process Management Efforts – 53%
Offer Process Manager Training 39%
Undertake Balanced Scorecard Installations – 28%
Undertake Major Redesign Projects – 50%
Undertake Redesign Projects Using OR Frameworks (SCOR) – 27%
Undertake Six Sigma Process Improvement Projects – 54%
Undertake Process Automation Projects – 46%
Offer Process Analysis/Redesign Training (Non-6 Sigma) – 46%
Offer Lean Six Sigma Training – 18%
Develop Business Rule Systems – 38%
Develop BAM/Real-Time Monitoring Systems – 30%
Strategy or Enterprise Level
Process Level
Implementation Level
EmployeeImplementation Level
ITImplementation Level
Figure 42. Respondents indicating their companies will be doing more in 2006
As we noted at the beginning, BPM is a complex subject that contains many specific technologies. Some have been around for decades and some have only begun to be explored in the past few years. Companies of all sizes, in all geographical areas, are exploring BPM options. They are moved more rapidly in adopting more established areas of BPM, like process modeling and redesign, and more slowly when faced with newer technologies like BPMS and automated process monitoring systems. Broadly, however, leading companies see BPM as a top-down methodology designed to organize, manage, and measure the organization based on the organization’s core processes, and they are moving ahead to determine how to implement technologies that will help them do that.

Copyright (c) 2005 Business Process Trends. www.bptrends.com
42
Appendix I Concepts Used in the Report
We have assumed most readers would be familiar with the terms and concepts widely used on the Business Process Trends website. For readers who might not be familiar with these terms or concepts, we briefly describe them below. In this report we have relied on three different sets of related terms or concepts:
BPTrends Levels. The BPTrends Pyramid provides a way of defining the type or level of process activity in which an organization is engaged.
CMMI or Process Maturity Levels. CMMI defines five levels of process maturity. Organizations at level 1 do not support processes in any significant way and are immature. Level 5 organizations are completely mature and have mastered the use of processes.
BPTrends Process Software Tools Classification. This classification describes the terms we use for the various types of software products that BP practitioners use.
We consider each in sufficient detail to allow readers to understand how the terms are used in this report.
The BPTrends Pyramid
The BPTrends Pyramid describes three groups of business process activities that occur at different levels within an organization.
Figure 43. The BPTrends Pyramid and levels of corporate BP activity
The Enterprise Level Enterprise Level activities occur at higher levels in the organization and are independent of any specific day-to-day processes. Enterprise Level activities focus on aligning strategy and processes, on defining an enterprise-wide business process architecture, on defining enterprise performance measures, and on aligning them with value chains and high-level processes. Other enterprise level activities involve the establishment of a process management system and on developing ways of

Copyright (c) 2005 Business Process Trends. www.bptrends.com
43
surveying all of the organization’s process needs and establishing priorities and plans to assure that processes are changed and maintained.
The Process Level Process Level activities are organized into projects. Typical process level projects include efforts to document processes (ISO 9000), projects to create new processes or to redesign existing processes, or projects to improve existing processes (Lean, Six Sigma). Typical process analysis, design, and modeling activities all occur at this level, organized by various popular business process methodologies.
The Implementation Level The Implementation Level provides the resources needed to implement process change projects. In essence, a redesign team, operating at the Process Level, may specify that a given process should be redesigned to incorporate the use of a new software application. Thus, at least one and probably several new projects are initiated, to develop or acquire and tailor the new software application, to train employees in the use of the new software application, and so forth. Projects undertaken to provide support resources for process change efforts occur at the Implementation Level. There are specific tools, notations, and methodologies that are only used on the Implementation. Thus, for example, a software development methodology like RUP or a notation like UML are usually only used at the Implementation Level.
CMMI Maturity Levels
The concept of Process Maturity Levels was developed at the Software Engineering Institute (SEI) at Carnegie Mellon University in the Nineties, based on quality work originally undertaken by Watts Humphrey. Originally developed to support the analysis of software process maturity (CMM), the latest version, the Capability Maturity Model Integrated (CMMI) has been generalized so that it can be applied to any of a wide variety of processes in diverse organizations.
Software organizations often pay SEI certified evaluators to do a formal evaluation to determine where their organizations are on the CMM scale. Many other companies do informal evaluations, based on the broad concepts inherent in the CMM “stair step diagram” reproduced in Figure 44. What follows is an informal description of the CMM process maturity model.
Figure 44. An Overview of the basic CMMI maturity levels.
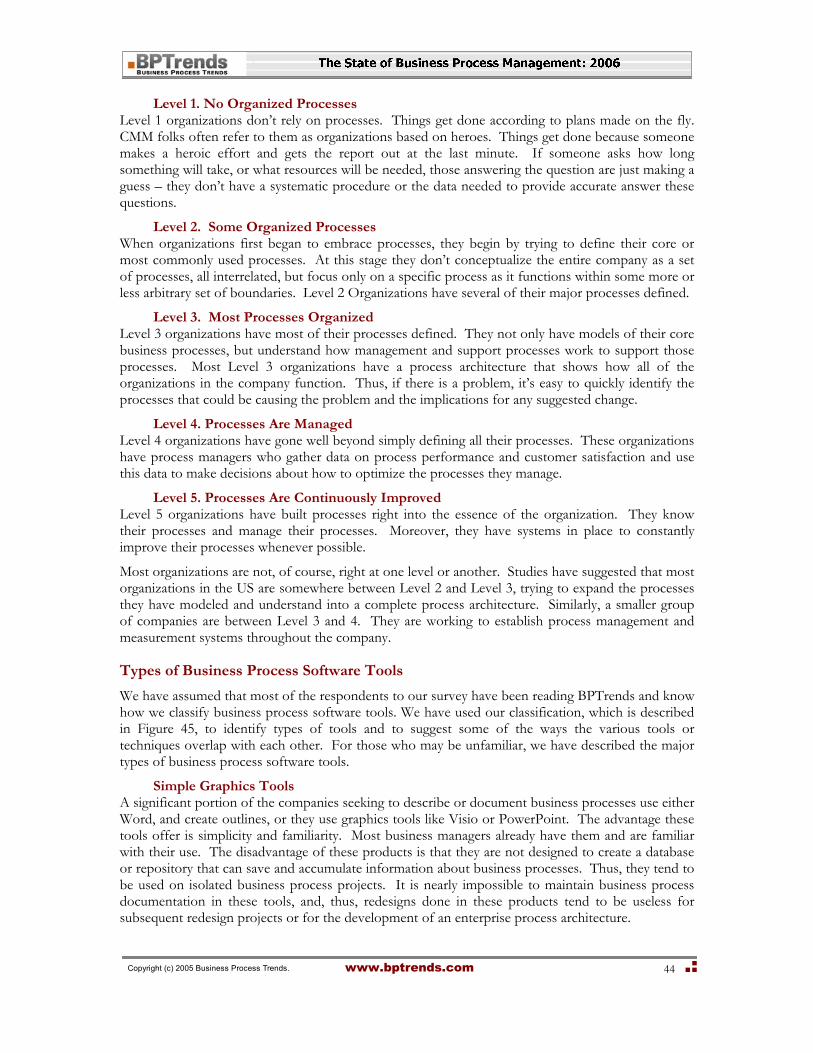
Copyright (c) 2005 Business Process Trends. www.bptrends.com
44
Level 1. No Organized Processes Level 1 organizations don’t rely on processes. Things get done according to plans made on the fly. CMM folks often refer to them as organizations based on heroes. Things get done because someone makes a heroic effort and gets the report out at the last minute. If someone asks how long something will take, or what resources will be needed, those answering the question are just making a guess – they don’t have a systematic procedure or the data needed to provide accurate answer these questions.
Level 2. Some Organized Processes When organizations first began to embrace processes, they begin by trying to define their core or most commonly used processes. At this stage they don’t conceptualize the entire company as a set of processes, all interrelated, but focus only on a specific process as it functions within some more or less arbitrary set of boundaries. Level 2 Organizations have several of their major processes defined.
Level 3. Most Processes Organized Level 3 organizations have most of their processes defined. They not only have models of their core business processes, but understand how management and support processes work to support those processes. Most Level 3 organizations have a process architecture that shows how all of the organizations in the company function. Thus, if there is a problem, it’s easy to quickly identify the processes that could be causing the problem and the implications for any suggested change.
Level 4. Processes Are Managed Level 4 organizations have gone well beyond simply defining all their processes. These organizations have process managers who gather data on process performance and customer satisfaction and use this data to make decisions about how to optimize the processes they manage.
Level 5. Processes Are Continuously Improved Level 5 organizations have built processes right into the essence of the organization. They know their processes and manage their processes. Moreover, they have systems in place to constantly improve their processes whenever possible.
Most organizations are not, of course, right at one level or another. Studies have suggested that most organizations in the US are somewhere between Level 2 and Level 3, trying to expand the processes they have modeled and understand into a complete process architecture. Similarly, a smaller group of companies are between Level 3 and 4. They are working to establish process management and measurement systems throughout the company.
Types of Business Process Software Tools
We have assumed that most of the respondents to our survey have been reading BPTrends and know how we classify business process software tools. We have used our classification, which is described in Figure 45, to identify types of tools and to suggest some of the ways the various tools or techniques overlap with each other. For those who may be unfamiliar, we have described the major types of business process software tools.
Simple Graphics Tools A significant portion of the companies seeking to describe or document business processes use either Word, and create outlines, or they use graphics tools like Visio or PowerPoint. The advantage these tools offer is simplicity and familiarity. Most business managers already have them and are familiar with their use. The disadvantage of these products is that they are not designed to create a database or repository that can save and accumulate information about business processes. Thus, they tend to be used on isolated business process projects. It is nearly impossible to maintain business process documentation in these tools, and, thus, redesigns done in these products tend to be useless for subsequent redesign projects or for the development of an enterprise process architecture.
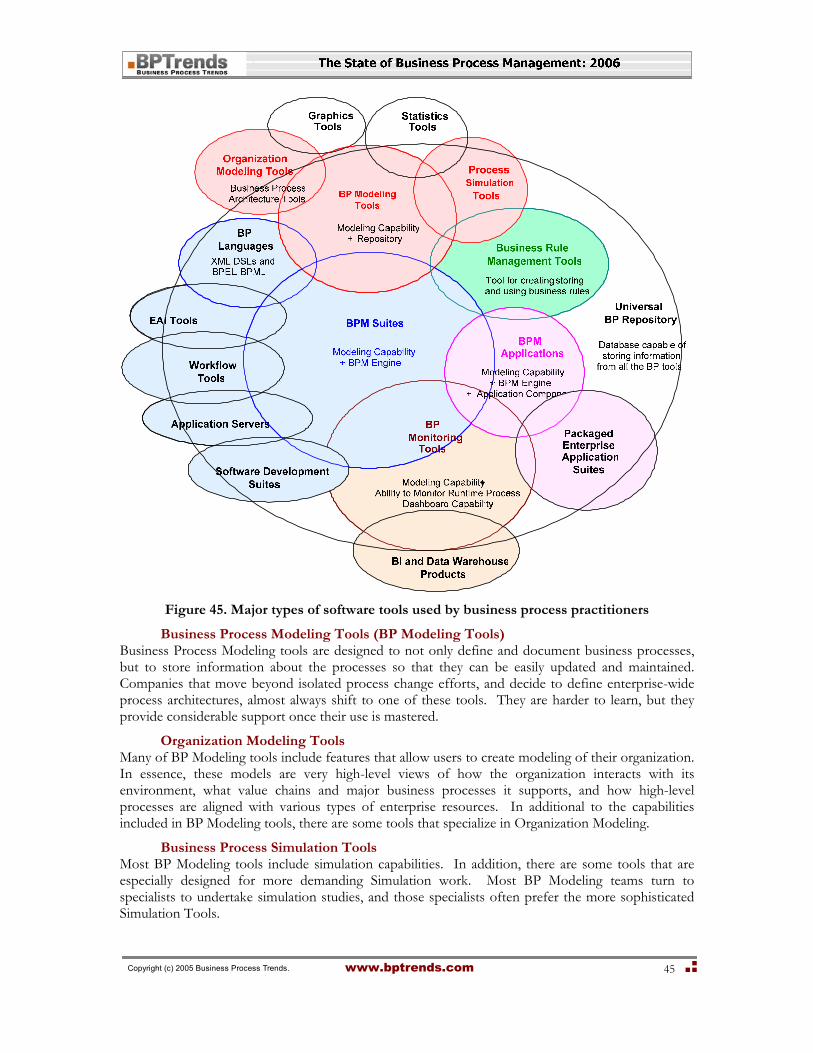
Copyright (c) 2005 Business Process Trends. www.bptrends.com
45
Figure 45. Major types of software tools used by business process practitioners
Business Process Modeling Tools (BP Modeling Tools) Business Process Modeling tools are designed to not only define and document business processes, but to store information about the processes so that they can be easily updated and maintained. Companies that move beyond isolated process change efforts, and decide to define enterprise-wide process architectures, almost always shift to one of these tools. They are harder to learn, but they provide considerable support once their use is mastered.
Organization Modeling Tools Many of BP Modeling tools include features that allow users to create modeling of their organization. In essence, these models are very high-level views of how the organization interacts with its environment, what value chains and major business processes it supports, and how high-level processes are aligned with various types of enterprise resources. In additional to the capabilities included in BP Modeling tools, there are some tools that specialize in Organization Modeling.
Business Process Simulation Tools Most BP Modeling tools include simulation capabilities. In addition, there are some tools that are especially designed for more demanding Simulation work. Most BP Modeling teams turn to specialists to undertake simulation studies, and those specialists often prefer the more sophisticated Simulation Tools.

Copyright (c) 2005 Business Process Trends. www.bptrends.com
46
Business Process Management Suites or Systems (BPMS Tools) These tools combine process modeling with runtime execution. In essence, they combine features previously found in workflow and EAI (Enterprise Application Integration) products. In some cases the tools also incorporate Rule Management and Process Monitoring capabilities. These tools are newer and are just beginning to gain a foothold in most companies. In the long run, they promise to help companies create a process layer between those who define and manage processes and the software resources used to implement processes.
BPM Applications In essence, BPM Suites are tools that one uses to create BPM Applications. A BPM application is an application that is used to manage all of the people and software systems used to implement a specific process. Whenever the organization is called upon to execute the specific process, it relies on the BPM application to manage the execution. In a few years, as BPMS become more widely used, we expect to see applications offered with BPMS built-in. Conversely, we expect ERP and CRM vendors to offer BPM Applications especially designed to go with their current ERP or CRM modules. A BPMS is only a tool for building a BPM application. A BPM application is an application designed to execute a specific company process with BPMS built in so that managers can modify the application as needed.
Business Process Monitoring Tools Most BPMS tools offer some process monitoring capabilities. They tend, for example, to provide information about process events to the process supervisors. Other BPMS tools, and more sophisticated monitoring tools, combine data from specific processes with information derived from other sources in a Data Warehouse and then use simulation techniques or Business Intelligence (BI or Data Mining) techniques to abstract patterns from the data and to report this “overview” information to executives via Executive Dashboards in something close to real-time. These tools are sometimes called Business Activity Monitoring (BAM) tools.
Rule Management Tools Most BP Modeling tools allow analysts to identify and save business rules. Most BPMS tools incorporate rule management tools that at least allow for the identification of business rules used in specific business processes. In some cases the Rule Management tools can be used to actually analyze business rules at runtime and generate or suggest decisions using logical inferencing techniques.
BPTrends has published extensive reports on Business Process Modeling and Simulation Tools, on BPM Suites, and on Business Rule Tools. These reports are available free of charge on www.bptrends.com
Geoffrey Moore’s Technology Lifecycle Model
Geoffrey Moore is a high tech marketing guru who has been involved in numerous technology launches and wrote a very popular book, Crossing the Chasm, (HarperBusiness, 1991) which describes the lifecycle of new technologies and the problems they face gaining widespread acceptance.
Innovators New technologies, according to Moore, are initially adopted by Innovators, companies that are focused on new technologies and are willing to work hard to make a new technology work in order to gain an early advantage. Innovators have their own teams of sophisticated technologies and are willing to work with academics and vendors to create highly tailored solutions.
Early Adopters Once the Innovators prove that a new technology can be made to work, Early Adopters follow. Early Adopters are not focused on new technologies, as such, but on new business approaches that can give them a competitive advantage. They are less technologically sophisticated than Innovators,
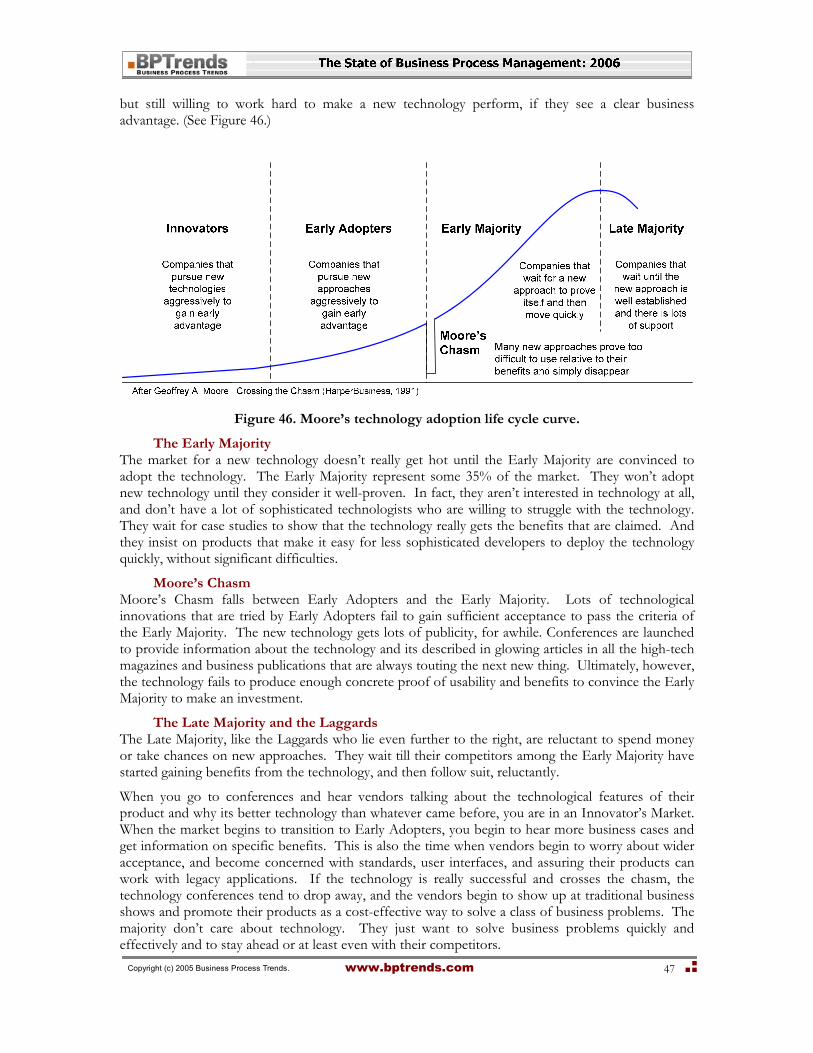
Copyright (c) 2005 Business Process Trends. www.bptrends.com
47
but still willing to work hard to make a new technology perform, if they see a clear business advantage. (See Figure 46.)
Figure 46. Moore’s technology adoption life cycle curve.
The Early Majority The market for a new technology doesn’t really get hot until the Early Majority are convinced to adopt the technology. The Early Majority represent some 35% of the market. They won’t adopt new technology until they consider it well-proven. In fact, they aren’t interested in technology at all, and don’t have a lot of sophisticated technologists who are willing to struggle with the technology. They wait for case studies to show that the technology really gets the benefits that are claimed. And they insist on products that make it easy for less sophisticated developers to deploy the technology quickly, without significant difficulties.
Moore’s Chasm Moore’s Chasm falls between Early Adopters and the Early Majority. Lots of technological innovations that are tried by Early Adopters fail to gain sufficient acceptance to pass the criteria of the Early Majority. The new technology gets lots of publicity, for awhile. Conferences are launched to provide information about the technology and its described in glowing articles in all the high-tech magazines and business publications that are always touting the next new thing. Ultimately, however, the technology fails to produce enough concrete proof of usability and benefits to convince the Early Majority to make an investment.
The Late Majority and the Laggards The Late Majority, like the Laggards who lie even further to the right, are reluctant to spend money or take chances on new approaches. They wait till their competitors among the Early Majority have started gaining benefits from the technology, and then follow suit, reluctantly.
When you go to conferences and hear vendors talking about the technological features of their product and why its better technology than whatever came before, you are in an Innovator’s Market. When the market begins to transition to Early Adopters, you begin to hear more business cases and get information on specific benefits. This is also the time when vendors begin to worry about wider acceptance, and become concerned with standards, user interfaces, and assuring their products can work with legacy applications. If the technology is really successful and crosses the chasm, the technology conferences tend to drop away, and the vendors begin to show up at traditional business shows and promote their products as a cost-effective way to solve a class of business problems. The majority don’t care about technology. They just want to solve business problems quickly and effectively and to stay ahead or at least even with their competitors.
Copyright (c) 2005 Business Process Trends. www.bptrends.com
48
When a new technology is first introduced, lots of relatively small vendors rush to offer products. As long as the market is small, ironically, the number of vendors is large. No one vendor makes very much money, but they are full of hopes, each believing that their technological approach is superior. As the market grows and customers become a little more sophisticated, they begin to demand more comprehensive products and features like support for evolving standards. It is not uncommon for products to go through 3-4 generations in the course of 2-3 years. The cost of constantly developing new versions of one’s product, coupled with the need for more aggressive advertising, forces the smaller vendors to search for capital to continue to remain competitive.
Sometime during the Early Adopter phase of the market, the major vendors begin to incorporate the technology into their more comprehensive offerings, and begin to promote the technology. In effect, the large vendors guarantee that the new technology is safe. As the competition heats up, most of the small vendors disappear. Some are acquired by large vendors. Many decide to specialize in industry or niche specific markets. Others simply fail to earn enough money to survive. The key thing, however, is that Majority companies only buy from established vendors who they are reasonably confident can provide the rather extensive support they will require and who they are sure will still be in business 5 or 10 years from now. Thus, if a new technology succeeds in crossing Moore’s chasm, the leading vendors will be companies like IBM, Microsoft, and SAP. One or two of the new startups may have been successful enough to have grown into a 100 million dollar company and still be viable in the Majority market, but most won’t make it.
Moore’s Model and BPM Market Unfortunately, it is not easy to apply Moore’s model to the BPM market, as a whole, because today’s BPM market is really lots of separate markets. The most important distinction is between those engaged in helping companies improve their business processes and those working to provide software tools that will enable some kind of process automation. Even within these segments, however, there are important distinctions, as for example, between the process modeling software tools, that have been widely adopted, and the BPMS tools that are still in the Early Adaptor phase.

Copyright (c) 2005 Business Process Trends. www.bptrends.com
49
Appendix II The Questionnaire Used in the Survey
The actual questions asked to generate the data used in this survey are as follows:
1. Which of the following best describes your organization’s understanding of BPM (Choose one)?
A top-down methodology designed to organize, manage, and measure the organization based on the organization’s core processes
A systematic approach to analyzing, redesigning, improving, and managing a specific project or program process
A cost-saving initiative focused on increasing productivity of specific work flow processes A set of new software technologies that make it easier for IT to manage and measure the
execution of process workflow and process software applications Other, Please Specify
2. How would you characterize your organization’s current interest in BPM (Choose one)?
Major strategic commitment by executive management Significant commitment to multiple high level process projects Initial commitment to limited number of mid or low-level projects Exploring opportunities No interest
3. What are the business drivers causing your organization to focus on business process change (Choose one)?
Need to save money by reducing costs and/or improving productivity Need to improve existing products, create new products, or enter new lines of business to
remain competitive One time event (merger or acquisition) Government or business requirements (Sarbanes-Oxley, ISO 9000) Need to improve customer satisfaction to remain competitive Need to improve management coordination or organizational responsiveness Need to improve management of IT resources (ERP applications) Other, Please Specify
4. Please indicate your organization’s performance level for each of the following activities:
(For each item, the respondent should indicate: Never (0%), Occasionally (1-30%), Frequently (31-60%), Most Times (61-99%), or Always (100%) 4.1 Work processes are documented and kept up to date for business processes. 4.2 Units that perform similar activities use standard or similar processes. 4.3 Standard process models are defined for the major value chains in the organization. 4.4 Standard measures are defined for evaluating the performance of major processes and subprocesses.

Copyright (c) 2005 Business Process Trends. www.bptrends.com
50
4.5 Support provided by automated applications is consistent with the defined processes used in the organization. 4.6 Skills needed to perform the tasks in the major processes are defined. 4.7 Skills training for tasks required to design and manage major processes is provided. 4.8 Process managers use performance data to manage their processes. 4.9 Process improvement programs are in place to identify and improve problems and defects. 4.10 Major process models include activities performed by outside vendors/partners.
5. In which of the following process standards is your organization actively involved (Choose
as many as apply)?
ISO 9000 Sarbanes-Oxley CMM/CMMI BPEL BPMN (Notation) UML (Notation) OMG Business Process Metamodel OMG Business Rules Metamodel OMG Business Ontology Metamodel Other, Please Specify
6. How much would you estimate your organization spent on business process analysis, management, monitoring, redesign, and improvement in 2005? Include overhead staff and exclude outsourcing or ERP software implementation costs. (Choose one.)
$0-$500,000 $500,000 to $999,999 $1 million to $5 million $5 million to $10 million Over $10 million
7. What percent of your organization’s 2005 BPM budget was spent on each of the following?
Major Redesign Projects (Include Staff and Overhead) Six Sigma Projects (Include Staff and Overhead) Process Automation (Include Staff and Overhead) Software Tools Outside Consultants Internal Training External Training Conference Attendance
Copyright (c) 2005 Business Process Trends. www.bptrends.com
51
8. Does your organization have a group responsible for Business Process Management and, if so, where is it located within your organization (Choose one)?
We do not have a formal BPM Group. Our BPM Group is at the Executive level. Our BPM Group is at the Divisional or Departmental level. Our BPM Group is located within IT. Our BPM Group is located within HR or Training. Our BPM Group is located within Finance. Our BPM Group is located within Quality Control. Other, Please Specify
9. If your organization could hire outside consultants to help with your BPM strategy and planning, where would you focus their efforts (Choose all that apply)?
Defining the relationship between Strategy and Process Developing an Enterprise Process Architecture Developing an Enterprise Performance Management System Coordinating and managing your Business Process Management projects and programs Other, Please Specify
10. If your organization could hire outside consultants to help with BPM projects, where would you focus their efforts (Choose all that apply)?
Process Manager training Balanced Scorecard Process Redesign projects Using BPM Frameworks (SCOR, ITIL) Six Sigma Process Improvement projects Process Automation projects Process Analysis and Design training Business Process Outsourcing ERP support for BPM Linking Knowledge Management to BPM Other, Please Specify
11. What BPM products and services is your organization currently using (Choose all that apply)?
Simple software Modeling tools (Visio, PowerPoint) Repository-based Modeling tools (ProVision, System Architect) Process Modeling tools that support OR Frameworks BPM Suite that can manage the runtime execution of a business process Tool for managing a Rule-based process or application Process Monitoring tool that can feed information to an executive dashboard Training in Process Strategy, Architecture, or Performance
Copyright (c) 2005 Business Process Trends. www.bptrends.com
52
Training in Process Analysis and Design Training in BPM Systems Attendance at BPM Conferences Others, Please Specify
12. What BPM products and services is your organization planning on purchasing in 2006 (Choose all that apply)?
Graphics Modeling tools (Visio, PowerPoint) Repository-based Modeling tools (ProVision, System Architect) Process Modeling tools that support OR Frameworks BPM Suite that can manage the runtime execution of a business process Tool for managing a Rule-based process or application Process Monitoring tool that can feed information to an executive dashboard Training in Process Strategy, Architecture, or Performance Training in Process Analysis and Design Training in BPM Systems Attendance at BPM Conferences Others, Please Specify
13 Which of the following software tools was most important to your business process management efforts in 2005 (Choose one)?
Organizational Modeling environment Graphics tool (Visio, PowerPoint) Process Modeling tool Business Rules tool Repository BPMS execution environment (Workflow, EAI) Simulation tool BAM/Real-Time Process Monitoring tool Performance Metrics tool/system Other, Please Specify
14 What business process initiatives were underway in your organization in 2005 (Check all that apply)?
Development of an Enterprise Process Architecture Development of an Enterprise Process Performance Measurement system Coordinating Enterprise Process Change efforts Coordinating Enterprise Process Management efforts Process Manager training Balanced Scorecard Major Process Redesign Projects Redesign projects with Frameworks (SCOR, ITIL)
Copyright (c) 2005 Business Process Trends. www.bptrends.com
53
Six Sigma Process Improvement projects Major Process Automation projects Process Analysis and Redesign training (Non-Six Sigma) Lean Six Sigma Process Modeling and Redesign Training None of the above
15 Please indicate whether you expect your organization to be more active, less active, or about the same in each of the following areas:
1. Development of an Enterprise Process Architecture
2. Development of an Enterprise Process Performance Measurement system
3. Coordinating Enterprise Process Change efforts
4. Coordinating Enterprise Process Management efforts
5. Process Manager training
6. Balanced Scorecard
7. Major Process Redesign projects
8. Redesign projects using Frameworks (SCOR, ITIL)
9. Six Sigma Process Improvement projects
10. Major Process Automation projects
11. Process Analysis and Redesign training (Non-Six Sigma)
12. Lean Six Sigma training
13. Development of Business Rules systems
14. Development of BAM or Real-Time Monitoring systems
16. Which of the following best describes your job function (Choose one)?
Executive (CEO, COO, CFO) Business or Line of Business Manager Process Practitioner/Business Analyst IT Manager/IT Developer HR Manager or Human Performance Practitioner
17. Which of the following best describes the entity you are reporting on (Choose one)?
Entire Enterprise Division Single Business or Functional Unit
18. Which of the following best describes your organization’s size (Choose one)?
Large Medium Small
Copyright (c) 2005 Business Process Trends. www.bptrends.com
54
19. Which of the following best describes your industry (Choose one)?
Aerospace/Defense Heavy manufacturing Light manufacturing Chemicals/Energy Computers/Consumer Electronics/Software Education Financial Services/Insurance Food/Beverage Government/Military Healthcare/Medical Equipment Leisure/Entertainment/Travel Professional/Business Services/Consulting Retail and Wholesale Telecommunications Utilities Other, Please Specify
20. Where is your organization located (Choose one)?
North America South America Asia/Australia Africa/Middle East Europe