brady dougan, chief executive officer of credit suisse, is scheduled to present at the merrill lynch...
TRANSCRIPT

Merrill Lynch Banking & Insurance ConferenceOctober 8, 2008
London
Brady W. Dougan, Chief Executive Officer

Slide 1Merrill Lynch Banking & Insurance Conference
Cautionary statement
Cautionary statement regarding forward-looking and non-GAAP information
This presentation contains forward-looking statements within the meaning of the Private Securities Litigation Reform Act of 1995.
Forward-looking statements involve inherent risks and uncertainties, and we might not be able to achieve the predictions, forecasts, projections and other outcomes we describe or imply in forward-looking statements.
A number of important factors could cause results to differ materially from the plans, objectives, expectations, estimates and intentions we express in these forward-looking statements, including those we identify in "Risk Factors" in our Annual Report on Form 20-F for the fiscal year ended December 31, 2007 filed with the US Securities and Exchange Commission, and in other public filings and press releases.
We do not intend to update these forward-looking statements except as may be required by applicable laws.
This presentation contains non-GAAP financial information. Information needed to reconcile suchnon-GAAP financial information to the most directly comparable measures under GAAP can be found in Credit Suisse Group's second quarter report 2008.

Slide 2Merrill Lynch Banking & Insurance Conference
Remaining focused in challenging environment
Challenging third quarter operating environment
Continue to implement our focused business strategy
Credit Suisse positioned to benefit when markets turn
Positioned to create long-term value and seize opportunities that arise from market dislocation

Slide 3Merrill Lynch Banking & Insurance Conference
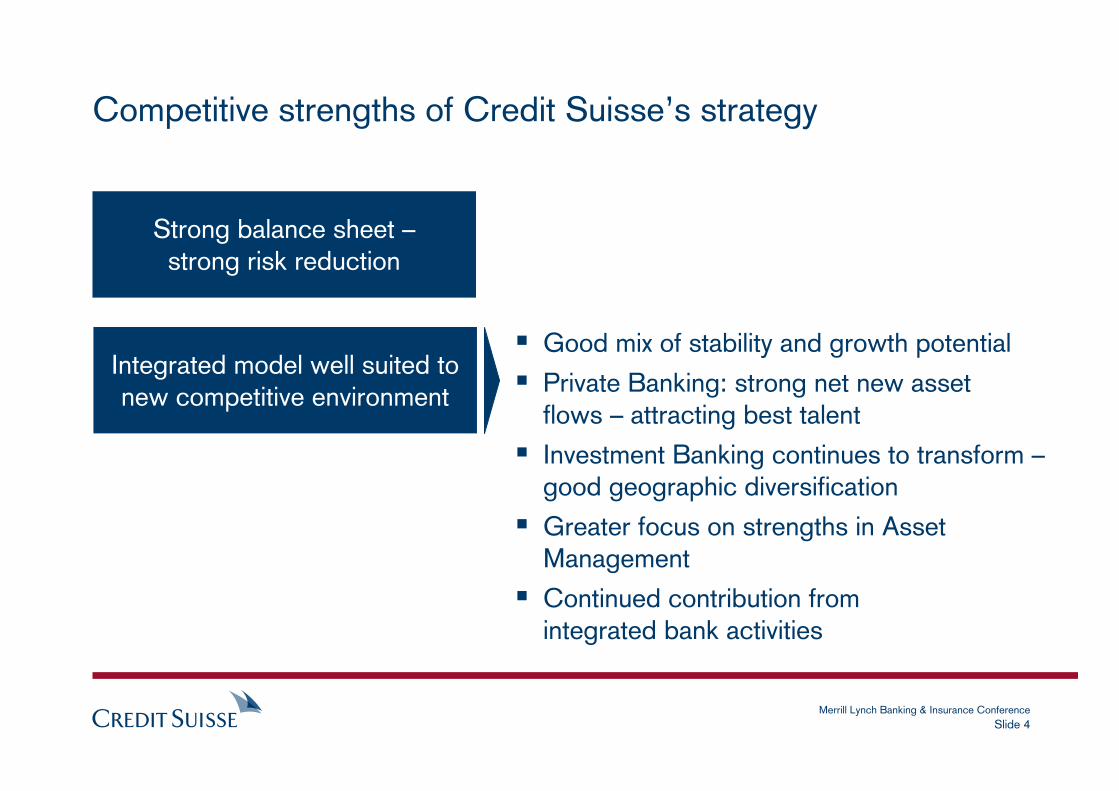
Competitive strengths of Credit Suisse’s strategy
Strong balance sheet –strong risk reduction
Strong capital position
Substantial deposit base
Secure funding profile
Competitive funding costs
Continue to reduce risk exposures
Slide 4Merrill Lynch Banking & Insurance Conference
Good mix of stability and growth potential
Private Banking: strong net new assetflows – attracting best talent
Investment Banking continues to transform –good geographic diversification
Greater focus on strengths in Asset Management
Continued contribution fromintegrated bank activities
Integrated model well suited tonew competitive environment
Competitive strengths of Credit Suisse’s strategy
Strong balance sheet –strong risk reduction

Slide 5Merrill Lynch Banking & Insurance Conference
Integrated model well suited tonew competitive environment
Capitalizing on growth opportunities
Strong net new assets in Private Banking
Good client flows in Investment Banking
Exceptional opportunities to hire new talent
Competitive strengths of Credit Suisse’s strategy
Strong balance sheet –strong risk reduction

Slide 6Merrill Lynch Banking & Insurance Conference
Volatile market conditions during 3Q08
1020
30405060
7080
Jul-01 Jul-15 Jul-29 Aug-12 Aug-26 Sep-09 Sep-23
S&P 500 index 10-day volatility CDX investment grade index
EUR/USD one-month implied volatility DJ AIG commodity index 30-day volatility
7
9
11
13
15
Jul-01 Jul-15 Jul-29 Aug-12 Aug-26 Sep-09 Sep-23
10-year average
10
15
20
25
30
35
Jul-01 Jul-15 Jul-29 Aug-12 Aug-26 Sep-09 Sep-23
+283%in 3Q08
+48%in 3Q08
+80%in 3Q08
4-year average
in basis points
10-year average
Source: Bloomberg, all data through September 30, 2008
10-year average50
100
150
200
250
Jul-01 Jul-15 Jul-29 Aug-12 Aug-26 Sep-09 Sep-23
+48%in 3Q08

Slide 7Merrill Lynch Banking & Insurance Conference
Credit Suisse has maintained strong capital position
Strong capital base as competitive advantage
Continue to prudently manage our balance sheet, exposures and capital
Our Tier 1 ratio of 10.2% makes us one of the best capitalized banks in the world
BIS Tier 1 ratio (Basel II)
10.0% 9.8% 10.2%
4Q07 1Q08 2Q08

Slide 8Merrill Lynch Banking & Insurance Conference
Solid funding structure
25
11
14
29
CD Long-term debt
Asset and liabilities by category
Assets Capital and liabilities
CHF bn at end of 2Q08
1,230 1,230
CHF 541 bn
Long-term debt and term CD issuanceUSD bn
Full year2007
Year-to-date2008
13
29
Full-year CD goal
Full-year long-term debt goal
Slide 9Merrill Lynch Banking & Insurance Conference
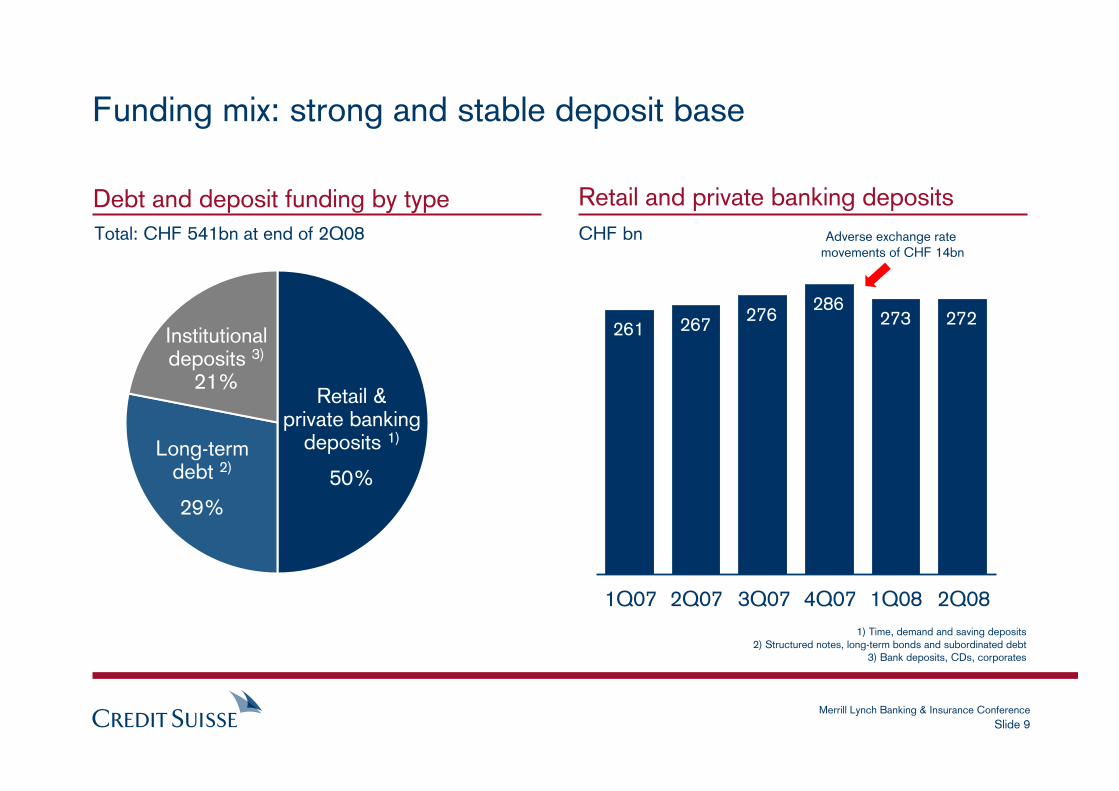
Funding mix: strong and stable deposit base
Debt and deposit funding by type
Retail &private banking
deposits 1)
50%Long-term
debt 2)
29%
Institutional deposits 3)
21%
Total: CHF 541bn at end of 2Q08
1) Time, demand and saving deposits2) Structured notes, long-term bonds and subordinated debt
3) Bank deposits, CDs, corporates
Retail and private banking depositsCHF bn
1Q07 2Q07 3Q07 4Q07 1Q08 2Q08
261 267 276 286273 272
Adverse exchange rate movements of CHF 14bn

Slide 10Merrill Lynch Banking & Insurance Conference
5-year CDS spreads (senior debt) as of October 3, 2008
Basis points
Credit Suisse CDS spreads are at the low end of peers
939
400 393 350286 279 248
175 163 145 106
Peer 0 Peer 1 Peer 2 Peer 3 Peer 4 Peer 5 Peer 6 Peer 7 Peer 8 Peer 9 CreditSuisseSource: Bloomberg

Slide 11Merrill Lynch Banking & Insurance Conference
Risk management discipline – Most rapid reduction of exposures among peers
Leveraged finance Commercial mortgages
Residential mortgages 1) CDO trading (US subprime related) 2)
3Q07 4Q07
59
35
UnfundedFunded
(76)%
3Q07 4Q07
3626
(58)%
16
9
Other
Subprime
(67)%
4Q07
4.6
Origination-based
(exposures shown gross)
Trading-based
(exposures shown net)
1) All non-agency business, including higher quality segments (Alt-A and prime)2) 2Q08 long positions are CHF 5.2 bn and short positions of CHF 4.1 bn
Subprime
CHF bn
3.9
1.6
21
1Q08
61.1
1Q08
19
1Q08
1.9
1415
2Q08 2Q08
2Q08
5 0.81.1
3Q07 4Q07 1Q08 2Q08
(76)%
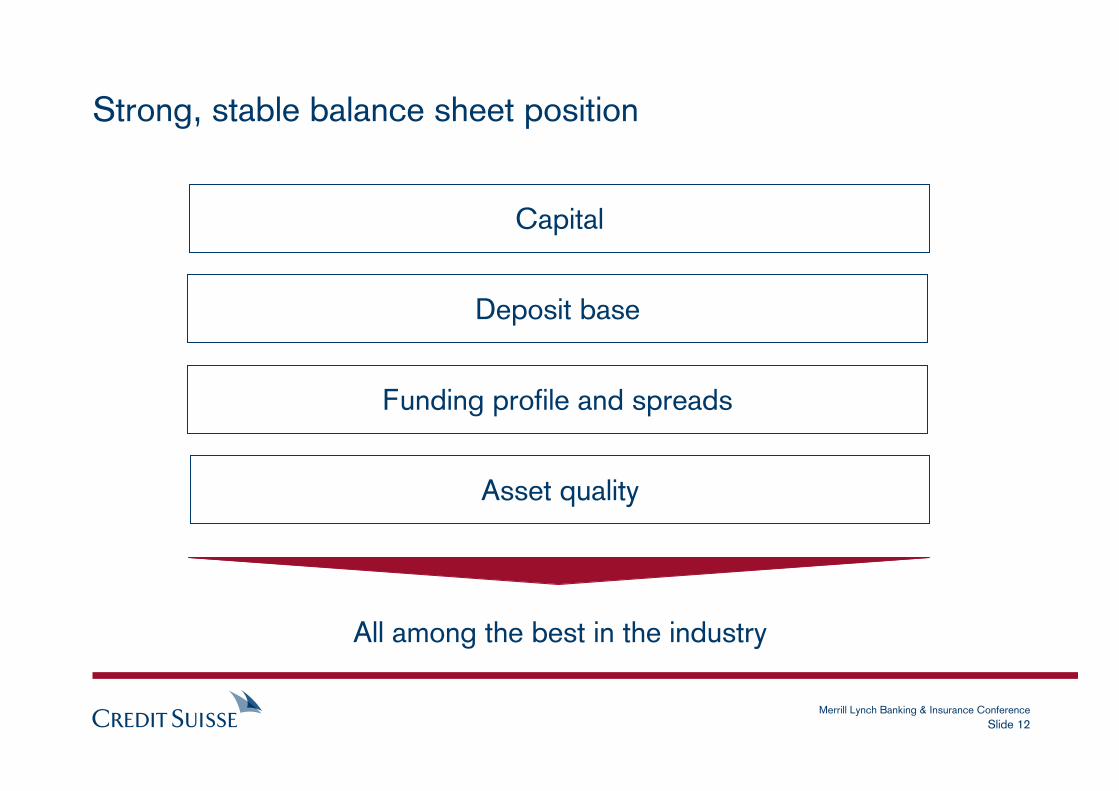
Slide 12Merrill Lynch Banking & Insurance Conference
Asset quality
Deposit base
Capital
Funding profile and spreads
Strong, stable balance sheet position
All among the best in the industry

Slide 13Merrill Lynch Banking & Insurance Conference
We benefit from positive long-term growth trends in global Private Banking
Long-term growth prospects for wealth managers remain intact
We are well positioned to face challenges and outperform competition
Rise of emerging markets
Generational transfers of wealth
"Private investment banking"
Global presence and brand
Strong balance sheet and capital
Unique integrated bank approach

Slide 14Merrill Lynch Banking & Insurance Conference
Private Banking resilient through the cycle
Private Banking pre-tax incomeCHF m
Gross margin on AuM in Wealth Mgmtbasis points
AuM = client Assets under Management
113 117 117 116
2Q07 3Q07 1Q08 2Q08
30 34 32 30
82 83 85 86
4Q07
75
38
112
2Q07 3Q07 1Q08 2Q084Q07
1,381 1,377 1,3241,2201,289
Transaction-based
Recurring

Slide 15Merrill Lynch Banking & Insurance Conference
29 2931 43 5121
568693
784 839 774
Wealth Management maintains strong NNA growth in 2008
6% 8% 7% 6% 7%*
Net new assets inWealth Management
CHF bn
AuM in Wealth Management
CHF bn
Net new assets (NNA) growth on AuM
* Annualized
+9%CAGR
2004 2005 2006 2007 June-08
2004 2005 2006 2007 1H08
1H
2H
AuM = client Assets under Management

Slide 16Merrill Lynch Banking & Insurance Conference
Private Banking: ongoing global diversification
Japan onshore in preparation
China onshore established
Australia onshore launched
India onshore launched
Gulf: Leverage integrated bank
Continued investment in Eastern Europe & Russia
Mexico onshore in preparation
Expanded presence in Brazil (Hedging-Griffo)
Continued turnaround and growth in the US
Accelerated growth in Western Europe
2,5403,140
4,100
2004 2007 Goal 2010
Relationship managers (RMs)at year-end

Slide 17Merrill Lynch Banking & Insurance Conference
Private Banking: our flagship franchise
Results have shown resilience despite market dislocation
Strong asset gathering and hiring trends across all regions
Continue to invest in business and implementinternational growth strategy
Private Banking offers unique growthprospects within the financial services industry
Slide 18Merrill Lynch Banking & Insurance Conference
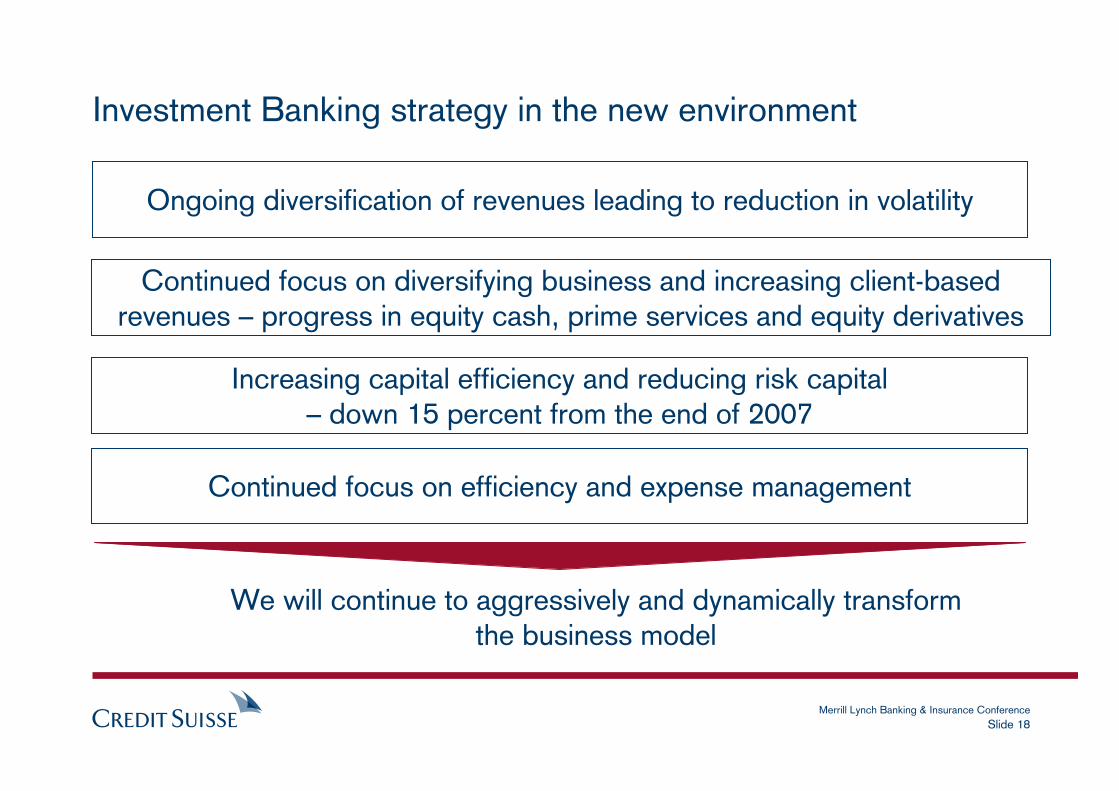
We will continue to aggressively and dynamically transformthe business model
Investment Banking strategy in the new environment
Continued focus on efficiency and expense management
Increasing capital efficiency and reducing risk capital– down 15 percent from the end of 2007
Continued focus on diversifying business and increasing client-based revenues – progress in equity cash, prime services and equity derivatives
Ongoing diversification of revenues leading to reduction in volatility

Slide 19Merrill Lynch Banking & Insurance Conference
+47%
2Q07 1Q08 2Q084Q073Q07
Growth of less correlated and innovative businesses
Prime services quarterly revenue growth Equity derivatives quarterly revenue growth
+68%
2Q07 1Q08 2Q084Q073Q07
+7%
2Q07 1Q08 2Q084Q073Q07
Electronic trading quarterly revenue growth
2Q07 1Q08 2Q084Q073Q07
+201%
Life finance quarterly revenue growth

Slide 20Merrill Lynch Banking & Insurance Conference
Reallocation of headcount to less correlated growth businesses
Correlation of revenues 1)
% change in headcount from 2Q07 to 2Q08
(40%)(23%)
57%
102%
27%
(52%)(68%)
12%
Life Finance
Prime Svcs.
Com-modities
Lev. FinanceCMBS
RMBSCDOs
Equity Derivs.
High Med. High High Low Med. Med. Low
1) Based on historic results and long-term expectations

Slide 21Merrill Lynch Banking & Insurance Conference
1Q06 2Q06 3Q06 4Q06 1Q07 2Q07 3Q07 4Q07 1Q08 2Q08
Focus on growing client revenues
+39%
Client revenues from 1Q06 to 2Q08
Client revenues = Estimates of the client-related value inherent in trading and sales transactions as well as fees and other amounts which can be directly associated with client activity.

Slide 22Merrill Lynch Banking & Insurance Conference
Market dislocation has created opportunities
Source: Thomson Financial
Example: Significant market share increase in RMBS agency business
2007 Volume MarketCompany (USD bn) Rank share (%)JP Morgan Chase 43.1 1 18.2Lehman Brothers 35.1 2 14.8Merrill Lynch 22.7 3 9.6Morgan Stanley 21.9 4 9.3RBS 21.0 5 8.9Credit Suisse 18.0 6 7.6Banc of America 15.4 7 6.5Citigroup 15.3 8 6.5UBS 13.7 9 5.8Deutsche Bank 11.2 10 4.7
US mortgage-backed securities – Residential Federal Credit Agencies
Year-to-date 2008 Volume MarketCompany (USD bn) Rank share (%)Credit Suisse 14.3 1 14.5JP Morgan Chase 13.2 2 13.4Barclays Capital 13.1 3 13.3Lehman Brothers 10.3 4 10.5Merrill Lynch 8.8 5 8.9RBS 7.4 6 7.5Banc of America 7.3 7 7.4Deutsche Bank 7.0 8 7.1Citigroup 5.6 9 5.7UBS 5.2 10 5.3

Slide 23Merrill Lynch Banking & Insurance Conference
Rebalancing Investment Banking ERC
2007 LevFin CMBS Prop Trading
CDOs ABS / Conduits
Comm. Equity Derivatives
Life Finance
Other June 08
100% -9.9%
-7.4%
-2.0%-1.6% -1.2% +2.8%
+1.5% +0.2%+2.2%
(15)%
ERC change by business from year-end 2007 to June 30, 2008
% change from year-end 2007
ERC = Economic Risk Capital

Slide 24Merrill Lynch Banking & Insurance Conference
0
5,000
10,000
15,000
20,000
25,000
30,000
Peer1
CS Peer3
Peer6
Peer5
Peer4
Peer2
Peer7
0
5,000
10,000
15,000
20,000
25,000
30,000
CS Peer1
Peer2
Peer3
Peer4
Peer5
Peer6
Peer7
Credit Suisse Investment Banking headcount amongst the lowest in peer group
Note: Based on Credit Suisse estimates
Peer average Peer average
Investment Banking headcount at 30 June 2007 Investment Banking headcount at 30 June 2008

Slide 25Merrill Lynch Banking & Insurance Conference
Disciplined cost management in Investment Banking
1) Excluding net litigation credit of CHF 134 m in 2Q08
Other operating expenses General & Administration expenses per head 1)
2,178
6M07 6M08
2,286
149
6M07 6M08
1722,044
(5)%1)
CHF m
1)
(13)%
CHF 000's

Slide 26Merrill Lynch Banking & Insurance Conference
We will continue to aggressively and dynamicallytransform the business model
Investment Banking strategy in the new environment
Long standing strategy to reduce volatility
Diversifying revenues and increasing client-based revenues
Continued focus on efficiency and expense management
Increasing capital efficiency and reducing ERC

Slide 27Merrill Lynch Banking & Insurance Conference
APAC = Asia / Pacific, EMEA = Europe, Middle East and Africa1) Based on Core Results before Corporate Center
Continued geographic diversification
Credit Suisse 2007 net revenues by region
in CHF bn and up/down in % vs. 2006
Americas EMEA
APACSwitzerland
Global Footprint
+23%
+15%-25%
+11%
4.0bn
10.4bn9.6bn
11.1bn
New York
Santiago
Bogotá
Buenos Aires
Monterrey
San FranciscoLos Angeles
Irvine Atlanta
LondonParis
Madrid
Zurich
Hong Kong
Mumbai
Singapore
Wroclaw
Montreal
Toronto
Milan
Russia
Melbourne
SydneyPerth
Ukraine
Bangkok
Beijing
JakartaKuala Lumpur
DallasHouston
Mexico City
BostonChicago
MiamiNassau
MontevideoSão Paulo
Rio de Janeiro
Cayman Islands
Kazakhstan
U.A.E.
Qatar
South Africa
Czech Republic
PhilippinesMalaysia
Tokyo
Frankfurt
Karachi New Delhi
Shanghai
1)

Slide 28Merrill Lynch Banking & Insurance Conference
14%
16%15%
16%
Continue to focus on achieving integration benefits;2010 target collaboration revenues of over CHF 10 bn
Core and collaboration revenues Collaboration revenues share (%) 1)
34.9
37.9
16.2
CHF bn
Avg. qtr 2006
Avg. qtr 2007
1Q08 2Q08
2.5
5.9
4.9
2006 2007 6M08
Collaboration revenues
Core revenues 1)
(different scale)
1) Excludes valuation reductions and fair value gains/losses on own debt of total CHF 3.0 bn and CHF 5.4 bn in 2007 and 1H08, respectively

Slide 29Merrill Lynch Banking & Insurance Conference
Competitive strengths of Credit Suisse’s strategy
Business model well suited to new competitive environment
Capitalizing on growth opportunities
Strong balance sheet – good risk reduction
Positioned to create long-term value and seize opportunities that arise from market dislocation

Slide 30Merrill Lynch Banking & Insurance Conference