brage.bibsys.no thesis... · front page for master thesis faculty of science and technology...
TRANSCRIPT

Front page for master thesis
Faculty of Science and Technology
Decision made by the Dean October 30th
2009
Faculty of Science and Technology
MASTER’S THESIS
Study program/ Specialization:
Offshore Technology
Marine and Subsea Technology
Spring semester, 2015
Open
Writer:
Adeliya F. Mustafina
………………………………………… (Writer’s signature)
Faculty supervisor: Ljiljana Djapic Oosterkamp (University of Stavanger, Stavanger, Norway)
External supervisor(s): Per Rishard Nystrøm (IKM Ocean Design, Stavanger, Norway)
Thesis title:
Anchor Damage Assessment of Subsea Pipelines - Optimization of Design Methodology
Credits (ECTS):
30
Key words:
Offshore, Pipelines, Anchor Dragging, Pipe-
Anhcor Interaction Scenario, Pipeline
Response, Cross-Sectional Capacity Check,
SIMLA
Pages: 118
+ enclosure: 11
Stavanger, 12.06.2015
Date/year

ANCHOR DAMAGE ASSESSMENT OF SUBSEA PIPELINES -
OPTIMIZATION OF DESIGN METHODOLOGY
Master thesis/ Offshore Technology, Marine and Subsea Technology
Adeliya F. Mustafina
Spring, 2015
Supervisors:
Ljiljana Djapic Oosterkamp (University of Stavanger, Stavanger, Norway)
Per Rishard Nystrøm (IKM Ocean Design, Stavanger, Norway)

i
ABSTRACT
The world’s energy resources on land are getting depleted, and mush attention is given to the
development of offshore fields. Over the past years, new reserves located offshore have been
regularly discovered. Once the hydrocarbons have been extracted, it is necessary then to
transport them to the storage places, refineries or gas processing plants, and to deliver to the
consumers. There are several ways of hydrocarbon transportation. One of the most cost-effective
and popular means of oil and gas transportation is pipelines.
Construction and operation of subsea pipelines are known to be very hazardous and risky
processes. In order to ensure reliable and safe operation of submarine lines, it is essential to
design them according to the international standards and codes. However, observance of rules
sometimes does not guarantee safe pipeline operation. Some undesirable events can occur from
time to rime. One of such events is dragging anchor incident, which poses great threat to the
subsea lines. The consequences of this incident may be huge, involving environmental pollution,
asset losses and even fatality. The mitigation of these outcomes becomes problematic, expensive
and impossible. That is why it is recommended to carry out relevant investigations before the
mitigation measures are planned and implemented.
This work is mainly focused on the anchor damage assessment of subsea pipelines. The
comprehensive discussion on a PARLOC 2001 database is done in order to determine major
pipeline incidents, their causes and consequences. The questions regarding pipe-anchor
interaction scenario have been studied a lot. It has been found that the extent of pipeline damage
is heavily dependent on its unique properties. In addition, not only the pipeline data, but also a
combination of vessel characteristics and anchoring equipment parameters has been very useful
for the analyses.
Based on the results of AIS ship traffic data processing, main pipe damage criteria checks have
been performed. The findings indicate that not all the anchors have potential of hooking and
approaching the pipeline resting on the seafloor. Key parameters here are anchor class (size),
chain length, ship speed and water depth. Moreover, the geometrical configuration of all the
anchors has been taken into account as well. Not only a theoretical approach, but a model scale
test has been carried out in order to understand the variation of anchor towing depth with
different ship velocities. The comparison of analytical solution results with the experimental
results is also included in this thesis.
Anchor pulling consequences are established in accordance with the global scale analyses
performed in the FE program SIMLA for a certain number of sensitivity cases for both small
(16-inch) and large (40-inch) diameter pipelines. The pipelines responses have been determined,
and their cross-sectional capacities have been checked. In addition, pipelines failure frequencies
have been estimated.
This work shows how critical it is to have detailed ship and equipment class data for doing
pipeline integrity assessment. In accordance with the results obtained, the dragging anchor
interference assessment methodology is developed.

ii
ACKNOWLEDGEMENTS
I would like to express my deep gratitude to my faculty supervisor Dr. Ljiljana Djapic
Oosterkamp. Her advice, meaningful assistance, patience and support helped me to complete my
master thesis.
I would like to thank my external supervisor Mr. Per Rishard Nystrøm, Engineering Manager at
IKM Ocean Design, who inspired me a lot during my thesis writing. I appreciate his valuable
ideas and keen interest on every stage of the work.
I also thank Mrs. Kristin Sandvik and other employees at IKM Ocean Design for their kind help
and guiding comments throughout the course of my thesis. They were always available for my
questions.
I am very grateful to Professor Ove Tobias Gudmestad, who encouraged me to take this topic.
His vast knowledge in the area of Offshore Technology has helped me to track my project in the
correct path.
I would like to thank John Grønli, Laboratoriy Manager at the University of Stavanger, and
members of UiS Subsea. It would be impossible to carry out an experiment without their
suggestions and contribution.
Special thanks to my scientific adviser at Gubkin University, Professor Anatoly Zolotukhin, who
continually supported me throughout this master program.

iii
ABSTRACT ................................................................................................................................................... i
ACKNOWLEDGEMENTS ......................................................................................................................... ii
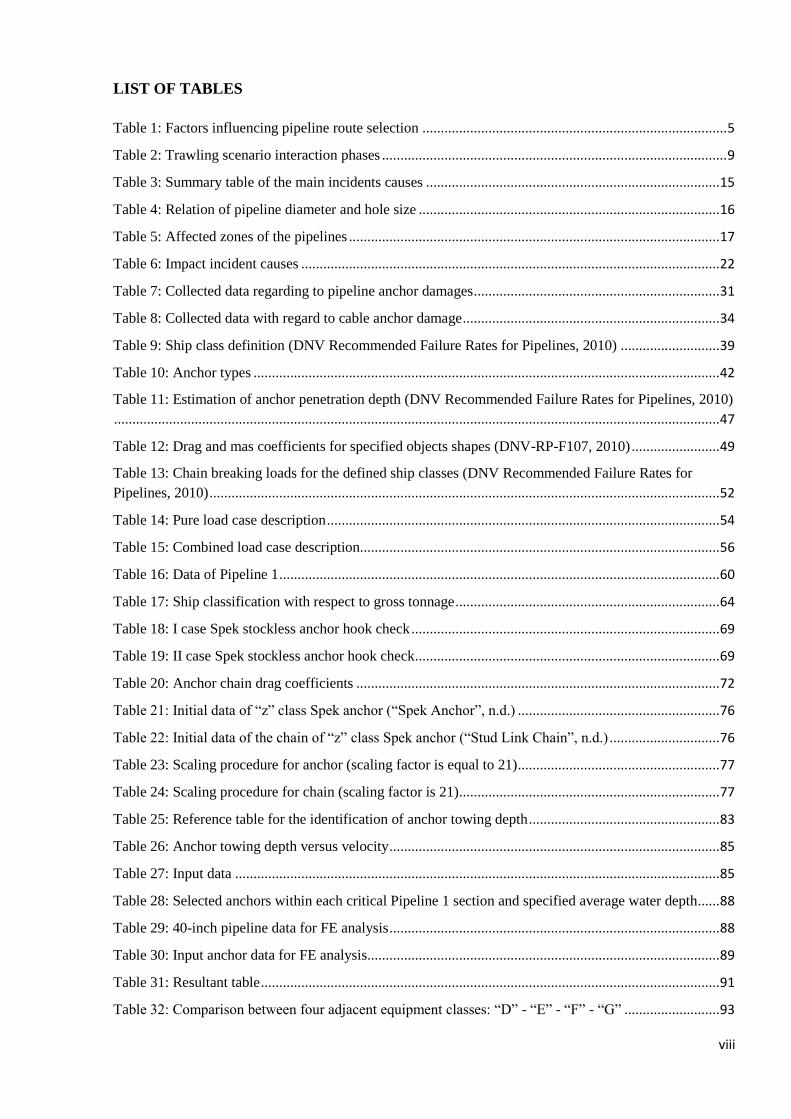
LIST OF FIGURES ....................................................................................................................................... v
LIST OF TABLES .................................................................................................................................... viii
ABBREVIATIONS ....................................................................................................................................... x
CHAPTER 1. INTRODUCTION ................................................................................................................. 1
1.1 BACKGROUND ................................................................................................................................. 1
1.2 PROBLEM STATEMENT ................................................................................................................. 1
1.3 PURPOSE AND SCOPE .................................................................................................................... 1
1.4 THESIS ORGANIZATION ................................................................................................................ 2
CHAPTER 2. PIPELINE DESIGN BASIS .................................................................................................. 4
2.1 DESIGN PHASES .............................................................................................................................. 4
2.2 ROUTE SELECTION ......................................................................................................................... 5
2.2.1 Environment ................................................................................................................................. 6
2.2.2 Seabed characteristics .................................................................................................................. 7
2.2.3 Facilities ....................................................................................................................................... 7
2.2.4 Landfall ........................................................................................................................................ 8
2.2.5 Third party activities .................................................................................................................... 8
2.3 ROUTE SURVEY ............................................................................................................................ 10
CHAPTER 3. PIPELINE THREATS ......................................................................................................... 11
3.1 DATABASE. STATISTICS ............................................................................................................. 11
3.1.1 PARLOC 2001 ........................................................................................................................... 11
3. 2 MAIN PIPELINE INCIDENT CAUSES ......................................................................................... 17
3.2.1 Spontaneous hazards. Corrosion ................................................................................................ 17
3.2.2 Spontaneous hazards. Material defects ...................................................................................... 20
3.2.3 External hazards. Impact ............................................................................................................ 22
3.2.4 External hazards. Anchoring ...................................................................................................... 25
CHAPTER 4. SHIP ANCHORING EFFECT ON SUBMARINE PIPELINES ......................................... 30
4.1 SHIP ANCHORING ......................................................................................................................... 38
4.1.1 Vessel characteristics ................................................................................................................. 39
4.1.2 Anchoring equipment characteristics ......................................................................................... 41
4. 2 PIPELINE DAMAGE CRITERIA ................................................................................................... 43
4.2.1 Anchor fluke size ....................................................................................................................... 44
4.2.2 Relation between chain length and water depth ......................................................................... 45
4.2.3 Anchor penetration depth ........................................................................................................... 45
4.2.4 Marine physical environment ..................................................................................................... 47

iv
4.2.5 Applied forces from the anchor .................................................................................................. 48
4.2.6 Pipeline resistance ...................................................................................................................... 52
4.2.7 Pipeline protection ...................................................................................................................... 58
CHAPTER 5. CASE STUDY - DRAGGED ANCHOR INTERFERENCE ASSESSMENT ................... 59
5.1 SCOPE OF THE CASE STUDY ...................................................................................................... 59
5.2 DEFINED DATA .............................................................................................................................. 59
5.2.1 Pipeline data ............................................................................................................................... 59
5.2.2 AIS data ...................................................................................................................................... 62
5.3 SHIP TRAFFIC DATA ANALYZES ............................................................................................... 63
5.4 ANCHOR HOOK CRITERIA CHECK............................................................................................ 68
5.5 ANCHOR HIT CRITERIA CHECK ................................................................................................ 70
5.6 MODEL SCALE TEST .................................................................................................................... 75
5.6.1 The scope of the experiment ...................................................................................................... 75
5.6.2 Site description ........................................................................................................................... 75
5.6.3 Scaling procedure ....................................................................................................................... 75
5.6.4 Preparation for the experiment ................................................................................................... 78
5.6.5 Experiment ................................................................................................................................. 82
5.6.6 Comparison of test results with the results of analytical solution .............................................. 85
5.7 ANCHOR DRAGGING CONSEQUENCES ................................................................................... 86
5.7.1 Sensitivity cases ......................................................................................................................... 86
5.7.2 Parameters for the anchor hooking analysis ............................................................................... 88
5.7.3 Global scale analyses ................................................................................................................. 90
5.8 ANCHOR DRAGGING FREQUENCY ......................................................................................... 102
5.8.1 Frequency estimation procedure .............................................................................................. 103
5.9 ANCHOR DAMAGE ASSESSMENT METHODOLOGY ........................................................... 110
CHAPTER 6. DISCUSSION, CONCLUSION AND RECOMMENDATIONS ..................................... 112
6.1 DISCUSSION ON STUDY AND ANALYSES RESULTS .......................................................... 112
6.2 ASSUMPTIONS ............................................................................................................................. 115
6.3 CONCLUSION ............................................................................................................................... 116
6.4 RECOMMENDATIONS ................................................................................................................ 117
REFERENCES .......................................................................................................................................... 118
APPENDIX A ........................................................................................................................................... 123

v
LIST OF FIGURES
Figure 1: Pipeline system phases (DNV-OS-F101, 2013) ............................................................................ 5
Figure 2: Typical otter trawl gear crossing a pipeline (DNV-RP-F111, 2010) ............................................. 8
Figure 3: Example of datasheet from the PARLOC 2001 (PARLOC 2001 Database, 2003 version) ........ 12
Figure 4: Database population flowchart of the PARLOC 2001 ................................................................ 12
Figure 5: PARLOC database incidents by numbers .................................................................................... 13
Figure 6: Causes of incidents to operating steel and flexible pipelines ...................................................... 14
Figure 7: Number of incidents (with and w/o loss of containment) involving pipelines and fittings ......... 15
Figure 8: Pipeline principle zones ............................................................................................................... 16
Figure 9: Corrosion incidents involving rigid lines..................................................................................... 18
Figure 10: Pipeline diameter (inches) and location of corrosion incidents resulted in leakage .................. 19
Figure 11: Material defect incidents involving rigid lines .......................................................................... 21
Figure 12: Pipeline diameter (inches) and location of material defect incidents resulted in leakage ......... 21
Figure 13: Causes of impact incidents to operating steel and flexible pipelines ......................................... 24
Figure 14: Pipeline diameter (inches) and location of impact incidents resulted in leakage ...................... 25
Figure 15: Causes of anchoring incidents to operating steel and flexible pipelines .................................... 26
Figure 16: Pipeline diameter (inches) and location of anchoring incidents resulted in leakage ................. 27
Figure 17: Bathtub curve (“Further information on ageing and life extension”, n.d.) ................................ 28
Figure 18: Pipeline anchor damage incidents number in XX-XXI centuries .............................................. 30
Figure 19: Cable anchor damage incidents number in XX-XXI centuries ................................................. 30
Figure 20: Offshore pipeline zones (Liu, HU & Zhang, 2013) ................................................................... 38
Figure 21: Illustration of vessel types ......................................................................................................... 40
Figure 22: Part of the Equipment Table from the DNV Rules for Classification of Ships document ........ 42
Figure 23: Stud-link and stud-less chain configurations (“Mooring chain”, n.d.) ...................................... 43
Figure 24: Anchor size and pipeline diameter relation ............................................................................... 44
Figure 25: Relation between water depth and chain length (DNV Recommended Failure Rates for
Pipelines, 2010) ........................................................................................................................................... 45
Figure 26: Equilibrium of anchor ................................................................................................................ 46
Figure 27: Vessel motions (Gudmestad, 2014) ........................................................................................... 48
Figure 28: Dropped anchor mode (Hvam, Bruschi, Tommez, & Vitali, 1990) .......................................... 48
Figure 29: Schematic view of dent prediction model (DNV-RP-F107, 2010) ............................................ 50
Figure 30: Dragged anchor mode (Hvam, Bruschi, Tommez, & Vitali, 1990) ........................................... 51
Figure 31: Fundamentals of Limit State Design ......................................................................................... 53
Figure 32: Pipe exposed to the pressure, bending moment and axial force (Bai, Igland & Moan, 1992)... 56

vi
Figure 33: Seabed depth profile of the Pipeline 1 ....................................................................................... 60
Figure 34: Part of the Pipeline 1 route and ship track density plot ............................................................. 61
Figure 35: Illustration of ship track density plot retrieved from MarineTraffic.com .................................. 62
Figure 36: EXCEL data list example .......................................................................................................... 62
Figure 37: Ship data collection procedure description ................................................................................ 63
Figure 38: Ship traffic data list example ..................................................................................................... 64
Figure 39: Distribution of passing ships with respect to GT value ............................................................. 64
Figure 40: Vessel GT and EL relation illustration ...................................................................................... 65
Figure 41: Total number of crossing ships within certain KP sections and defined water depth ............... 66
Figure 42: Total number of various ELs with the corresponding average vessel speed value (knots) ....... 67
Figure 43: Equipment Specification Letter grouping .................................................................................. 68
Figure 44: Part of the Spek anchor characteristics retrieved from the anchor catalogue (“Spek Anchor”,
n.d.) ............................................................................................................................................................. 70
Figure 45: Anchor-chain system configuration illustration ....................................................................... 71
Figure 46: Tow depth of anchors classified by Small Letters and water depth lines (dashed) of certain KP
sections ........................................................................................................................................................ 73
Figure 47: Tow depth of anchors classified by Capital Letters and water depth lines (dashed) of certain
KP sections .................................................................................................................................................. 74
Figure 48: Tow depth of anchors classified by Letters marked with star and water depth lines (dashed) of
certain KP sections ...................................................................................................................................... 74
Figure 49: The laboratory tank geometry .................................................................................................... 75
Figure 50: Anchor and chain (stud less) chosen for the experiment ........................................................... 78
Figure 51: Removal of steel bars from the top of the tank .......................................................................... 78
Figure 52: 1x1 m steel mesh reinforcement and 15x15 cm grid size .......................................................... 79
Figure 53: Waterproof white material ......................................................................................................... 79
Figure 54: Painted in blue grid plates .......................................................................................................... 80
Figure 55: Process of covering the walls with the reflective material ........................................................ 80
Figure 56: The tank inner surface covered with material and grid plates on top of it ................................. 80
Figure 57: Marked with letters and numbers grid ....................................................................................... 81
Figure 58: Painted in yellow anchor and chain ........................................................................................... 81
Figure 59: Tank filled with water ................................................................................................................ 81
Figure 60: Electric winch system ................................................................................................................ 82
Figure 61: Snapshot from the video: anchor towing depth – position K (157.5 cm); 𝑣 = 2.3 𝑚/𝑠 ........... 83
Figure 62: Snapshot from the video: anchor towing depth – position M (185.0 cm); 𝑣 = 1.9 𝑚/𝑠 .......... 84
Figure 63: Snapshot from the video: anchor towing depth – position O (217.5 cm); 𝑣 = 1.6 𝑚/𝑠 .......... 84
Figure 64: Snapshot from the video: anchor towing depth – position Q (247.5 cm); 𝑣 = 1.4 𝑚/𝑠 ........... 84

vii
Figure 65: Comparison of results ................................................................................................................ 86
Figure 66: Total number of crossing ships within certain KP sections and defined water depth (after
hook/hit criteria checks) .............................................................................................................................. 87
Figure 67: Pipeline stress-strain relationship curve .................................................................................... 89
Figure 68: Schematic view of overall pipe-anchor interaction model ........................................................ 91
Figure 69: Pipeline 1 vertical displacement for specified cases .................................................................. 92
Figure 70: Pipeline 1 lateral displacement for specified cases .................................................................... 92
Figure 71: Pipeline displacement in case of anchor class “Y” .................................................................... 93
Figure 72: Pipeline displacement in case of anchor class “B*” .................................................................. 93
Figure 73: Pipeline 1 strain for specified cases ........................................................................................... 94
Figure 74: Capacity check for EL “o” ......................................................................................................... 95
Figure 75: Capacity check for EL “v” ......................................................................................................... 95
Figure 76: Capacity check for EL “x” ......................................................................................................... 95
Figure 77: Capacity check for EL “z” ......................................................................................................... 95
Figure 78: Capacity check for EL “B” ........................................................................................................ 96
Figure 79: Capacity check for EL “D” ........................................................................................................ 96
Figure 80: Capacity check for EL “E” ........................................................................................................ 96
Figure 81: Capacity check for EL “F” ........................................................................................................ 96
Figure 82: Capacity check for EL “G” ........................................................................................................ 96
Figure 83: Capacity check for EL “Y” ........................................................................................................ 96
Figure 84: Capacity check for EL “B*” ...................................................................................................... 97
Figure 85: Change in axial force in time, EL “Y”....................................................................................... 97
Figure 86: Change in axial force in time, EL “B*” ..................................................................................... 98
Figure 87: Change in axial force in time, EL “o” ....................................................................................... 98
Figure 88: 16-inch pipeline vertical displacement for specified cases ...................................................... 100
Figure 89: 16-inch pipeline lateral displacement for specified cases ........................................................ 100
Figure 90: 16-inch pipeline strain for specified cases ............................................................................... 101
Figure 91: Capacity check for EL “o” ....................................................................................................... 102
Figure 92: Capacity check for EL “z” ....................................................................................................... 102
Figure 93: Capacity check for EL “G” ...................................................................................................... 102
Figure 94: Capacity check for EL “B*” .................................................................................................... 102
viii
LIST OF TABLES
Table 1: Factors influencing pipeline route selection ................................................................................... 5
Table 2: Trawling scenario interaction phases .............................................................................................. 9
Table 3: Summary table of the main incidents causes ................................................................................ 15
Table 4: Relation of pipeline diameter and hole size .................................................................................. 16
Table 5: Affected zones of the pipelines ..................................................................................................... 17
Table 6: Impact incident causes .................................................................................................................. 22
Table 7: Collected data regarding to pipeline anchor damages ................................................................... 31
Table 8: Collected data with regard to cable anchor damage ...................................................................... 34
Table 9: Ship class definition (DNV Recommended Failure Rates for Pipelines, 2010) ........................... 39
Table 10: Anchor types ............................................................................................................................... 42
Table 11: Estimation of anchor penetration depth (DNV Recommended Failure Rates for Pipelines, 2010)
..................................................................................................................................................................... 47
Table 12: Drag and mas coefficients for specified objects shapes (DNV-RP-F107, 2010) ........................ 49
Table 13: Chain breaking loads for the defined ship classes (DNV Recommended Failure Rates for
Pipelines, 2010) ........................................................................................................................................... 52
Table 14: Pure load case description ........................................................................................................... 54
Table 15: Combined load case description.................................................................................................. 56
Table 16: Data of Pipeline 1 ........................................................................................................................ 60
Table 17: Ship classification with respect to gross tonnage ........................................................................ 64
Table 18: I case Spek stockless anchor hook check .................................................................................... 69
Table 19: II case Spek stockless anchor hook check ................................................................................... 69
Table 20: Anchor chain drag coefficients ................................................................................................... 72
Table 21: Initial data of “z” class Spek anchor (“Spek Anchor”, n.d.) ....................................................... 76
Table 22: Initial data of the chain of “z” class Spek anchor (“Stud Link Chain”, n.d.) .............................. 76
Table 23: Scaling procedure for anchor (scaling factor is equal to 21) ....................................................... 77
Table 24: Scaling procedure for chain (scaling factor is 21)....................................................................... 77
Table 25: Reference table for the identification of anchor towing depth .................................................... 83
Table 26: Anchor towing depth versus velocity .......................................................................................... 85
Table 27: Input data .................................................................................................................................... 85
Table 28: Selected anchors within each critical Pipeline 1 section and specified average water depth...... 88
Table 29: 40-inch pipeline data for FE analysis .......................................................................................... 88
Table 30: Input anchor data for FE analysis................................................................................................ 89
Table 31: Resultant table ............................................................................................................................. 91
Table 32: Comparison between four adjacent equipment classes: “D” - “E” - “F” - “G” .......................... 93

ix
Table 33: 16-inch pipeline data for FE analysis .......................................................................................... 99
Table 34: Comparison table for vertical and lateral displacements of 40 and 16-inch pipelines .............. 100
Table 35: Comparison table for strain values of 40 and 16-inch pipelines ............................................... 101
Table 36: The frequency for pipe - anchor interaction scenario for different anchor drop situations ....... 103
Table 37: Failure frequency estimation for the 40-inch Pipeline 1 KP sections per 1Q ........................... 105
Table 38: Failure frequency estimation for the 16-inch gas pipeline KP sections per 1Q ........................ 107
Table 40: Anchor damage assessment methodology ................................................................................ 110

x
ABBREVIATIONS
AIS - Automatic Identification System
ALS - Accidental Limit State
BOP - Blowout Preventer
DCC - Displacement Controlled Condition
DEA - Drag Embedment Anchor
EL - Equipment Letter
EN - Equipment Number
FE – Finite Element
FLS - Fatigue Limit State
GoM - Gulf of Mexico
GRT - Gross Register Tonnage
GT - Gross Tonnage
IMO - International Maritime Organization
KP - Kilometer Point
LCC - Load Controlled Condition
LRFD - Load and Resistance Factor Design
MAOP - Maximum Allowable Operating Pressure
MMSI - Maritime Mobile Service Identity
PARLOC - The Pipeline and Riser Loss of Containment
SLS - Serviceability Limit State
SMTS - Specified Minimum Tensile Strength
SMYS - Specified Minimum Yield Stress
SPM - Single Point Mooring
ULS - Ultimate Limit State
VTS - Vessel Traffic Services

Anchor Damage Assessment of Subsea Pipelines
1
CHAPTER 1. INTRODUCTION
1.1 BACKGROUND
21st century is a century of enormous energy consumption. The energy is arguably the spine of
human life on our planet. The need for energy is insatiable and we need to constantly think of
new ways to try to meet this need. However, resources on land are fast depleting, hence it is
necessary to explore new reserves to extract oil and gas. Over the past couple of decades, we
have seen that new reserves regularly discovered are located on offshore sites. As a result,
offshore field development is receiving great interest. The new oil and gas fields on the
continental shelf are fast becoming major global energy reserves. To move extracted energy
resources to the storage places, refineries or gas processing plants, and to deliver them to the
consumers, several means of products transportation are used. One of the most popular means is
pipeline. Submarine pipelines are laid across different territories of the world. For this reason a
lot of attention should be given to their monitoring, considering safety and environmental
questions.
Construction and operation of pipelines are known to be very hazardous and risky processes. To
mitigate the risks and to exclude the causes of pipeline failures, it is necessary to design,
construct and manage the pipelines safely and in an appropriate way according to the
international codes and standards. Sometimes even observance of necessary rules does not
guarantee safe pipeline operation. Statistic shows that high-technology solutions and innovations
help to decrease the probability of any failures. However, there are still some undesired events
that cannot be completely avoided. One of such cases is pipeline anchor damage. This accident
can lead to the consequences like fatality, fire, explosion, environmental pollution and asset
losses. Mitigation of such outcomes becomes difficult, expensive and even impossible. Even in a
best-case scenario, when the pipeline suffers minor damage, the consequences can be serious:
extended pipeline shutdowns, disruption of a schedule and financial problems.
1.2 PROBLEM STATEMENT
In case if ship anchor is accidently dropped and dragged over the pipeline, the latter may suffer
damage, lose its integrity and leak. Even though the pipeline failures and their causes are studied
and discussed a lot, there are still some questions regarding anchor damage threats to submarine
pipelines. An extent of damage strongly depends on pipe unique properties, vessel characteristics
and anchor parameters. In addition, AIS ship traffic data with ship particularities (identification
number, type, gross tonnage, equipment specifications, etc.) is to be included into the assessment
as well. A combination of all these factors is of great importance for the dragged anchor
interference analysis and failure frequency estimation. Based on the findings and results of the
detailed investigation, risk reducing measures can be proposed and implemented if necessary.
Eventually, the design methodology can be optimized and applied where appropriate for both
existent and new pipeline projects.
1.3 PURPOSE AND SCOPE
The analysis is primarily focused on a given gas pipeline called “Pipeline 1”, which is located in
the North Sea. Typical pipeline and ship traffic details are taken as a basis for the present work.

Anchor Damage Assessment of Subsea Pipelines
2
The emphasis is placed on the whole pipeline including all the KP sections and possible
anchoring zones. Several sensitivity cases are distinguished along the pipeline route and selected
in order to establish anchor dragging consequences and to estimate the pipeline failure
frequencies. All the analyses are performed in the most conservative way, considering the worst
cases.
Scope of the thesis:
1. Study of the design objectives and main aspects of pipeline route selection.
2. Pipeline hazards investigation. Detailed definition and study of the PARLOC 2001
database.
3. Analysis of the ship anchoring effect on submarine pipelines by using the corresponding
theoretical approach.
4. Collection of relevant data needed for the assessment.
5. Dragged anchor interference assessment. Anchor hook/hit/damage checks.
6. Carrying out of model scale test on the variation of anchor towing depth with different
towing speed. Verification of the results.
7. Establishment of pipe-anchor interaction consequences by performing global scale
analysis in SIMLA finite element program. Check of large and small diameter pipelines
responses and cross-sectional capacities.
8. Failure frequency estimation procedure for both large and small size pipelines.
9. Discussion and methodology description.
10. Drawing up of the conclusions with regard to the analysis and frequency estimation
results.
1.4 THESIS ORGANIZATION
Chapter 2 presents pipeline design objectives. It points out the main factors influencing the
selection of pipeline route, namely: environment, seabed features, facilities, landfall and third
party activities.
Chapter 3 describes possible pipeline threats, their causes and consequences. It also defines the
purpose of pipeline databases. Detailed discussion of PARLOC 2001 database is included in this
chapter. The most frequently encountered incidents, involving steel and flexible lines, are studied
and analyzed as well.
Chapter 4 explains the ship anchoring procedure and its effect on submarine pipelines.
Comprehensive theoretical approach is presented here. The chapter defines vessel classification
and its characteristics. Particularities of vessel equipment (anchor and chain) are discussed as
well. In addition, the chapter provides complete description of pipeline damage criteria that is of
great importance for further analysis.
Chapter 5 presents dragged anchor interference assessment. The chapter includes AIS data
processing based on the typical pipeline route. Collection of missing data for different ships with
respect to IMO-no, name, type, EL, GT, speed and vessel coordinates is done as well. All the
information is used for the anchor hook, hit and damage criteria checks. The chapter also
provides a description of model scale test on the variation of anchor towing depth with different
ship velocities. The comparison of analytical solution results with the experimental results is also

Anchor Damage Assessment of Subsea Pipelines
3
included. Anchor pulling consequences are established in accordance with the global scale
analyses performed in finite element program for several sensitivity cases for both small and
large diameter pipelines. The pipelines responses are determined, and the cross-sectional
capacities are checked. In addition, anchor dragging induced frequencies estimation is presented
in this chapter. In accordance with the results obtained, the dragging anchor interference
assessment methodology is developed.
Chapter 6 comprises complete discussion based on the results and findings obtained from the
studies, tests and analyses. All the assumptions taken for the present work are listed as well.
Some recommendations for the further studies and analyses are given in this chapter.

Anchor Damage Assessment of Subsea Pipelines
4
CHAPTER 2. PIPELINE DESIGN BASIS
2.1 DESIGN PHASES
In order to ensure reliable and safe operation of submarine pipelines, it is essential to design
them according to the international standards, codes and practices. Pipeline design procedure
mainly consists of three stages (Bai, 2001):
I. Conceptual engineering;
II. Preliminary engineering;
III. Detail engineering.
Each stage is of great importance and has a set of basic objectives which are to be given below.
Conceptual engineering objectives:
Establishment of technical feasibility and constraints on the system design and
construction;
Elimination of non-viable options;
Identification of required information for the design and construction processes;
Preparation of the basic cost and scheduling exercises;
Identification of interfaces with planned or existent systems.
Preliminary engineering objectives:
Pipeline design: verification of pipeline size, determination of grade and wall thickness;
Verification of pipeline against design and code requirements;
Authority applications preparation;
Material take-off and order of the line pipe.
Detailed engineering objectives:
Route selection and optimization;
Wall thickness and coating selection;
Confirmation of code requirements on strength, vortex-induced vibrations, on-bottom
stability, global buckling and installation;
Detailed design and drawings preparation: pipelines, tie-ins, crossings, risers, shore
approaches and subsea structures;
Preparation of alignment sheets according to the recent survey data;
Preparation of specifications on materials, costs, construction works (laying, survey,
welding, riser and spoolpiece installation, tie-ins, structures installation) and
commissioning (flooding, pigging, hydrotest, drying);
Material take-off, procurement of materials;
Preparation of design data and necessary information for the certification authorities.
There is a set of main pipeline design issues that is to be taken into account during pipeline
design stages:

Anchor Damage Assessment of Subsea Pipelines
5
1. Environmental issues: water depth profile; weather conditions; information about
currents, waves, and ambient temperature variations. Seasonal changes should be
specified as well.
2. Seabed particularities: geotechnical characteristics; tectonic movement details; seabed
topography data.
3. Flow issues: fluid type, flowrate, pressure and temperature information, water profile.
Specifying the issues mentioned above, it is possible to design the pipeline in an appropriate
way, so that its integrity is ensured through all the pipeline system phases: from the concept
development to the pipeline abandonment (Figure 1).
Busi
nes
s dev
elopm
ent
Conce
pt
dev
elopm
ent
Bas
ic d
esig
n
Det
ail
des
ign
Lin
epip
e
Com
ponen
ts a
nd a
ssem
bli
es
Corr
osi
on p
rote
ctio
n a
nd
wei
ght
coat
ing
Pre
-inte
rven
tion
Inst
alla
tion
Post
-inte
rven
tion
Pre
-com
mis
sionin
g
Com
mis
sionin
g
Inte
gri
ty m
anag
emen
t
Insp
ecti
on a
nd r
epai
r
Re-
qual
ific
atio
n
Aban
donm
ent
Concept Design Construction Operation
Establich integrity Maintain integrity
Figure 1: Pipeline system phases (DNV-OS-F101, 2013)
2.2 ROUTE SELECTION
Route selection, being one of the objectives of the detailed pipeline engineering, is a critical
aspect, affecting all the phases of pipeline project. The pipeline route shall be selected with due
regard to safety of the public and personnel, protection of the environment, and the probability
of damage to the pipe or other facilities (DNV-OS-F101, 2013). There are a lot of factors
influencing the selection of the pipeline placement. These factors are mainly seabed features,
geotechnical and environmental condition, seasonal changes, etc. The identification of pipe
location particularities, issues and problems can be done by applying geographical information
system and different route surveys techniques. As soon as all the relevant information is
obtained, it becomes easier to suggest, select and develop successful pipeline route.
Typical routing is influenced by a set of factors which are presented in the Table 1
below (DNV-OS-F101, 2013).
Table 1: Factors influencing pipeline route selection
Factor Factor identification and comments

Anchor Damage Assessment of Subsea Pipelines
6
Environment
archaeological sites;
exposure to environmental damage;
areas of natural conservation interest (oyster beds
and coral reefs);
marine parks;
turbidity flows.
Seabed
characteristics
uneven and unstable seabed;
soil properties;
subsidence;
seismic activity.
Facilities
offshore installations;
subsea structures and well heads;
platform anchor patterns;
existing pipelines and cables;
obstructions;
coastal protection works.
Landfall
local constraints;
3rd
party requirements;
environmental sensitive areas;
vicinity to people;
limited construction period.
Third party
activities
ship traffic and fishing activity;
dumping areas for waste, ammunition, etc.;
mining activities;
military exercise areas.
2.2.1 Environment
Environmental and statistical data (wind, wave, tide, current, temperatures, ice, earthquake, etc.)
should be determined and taken into account before the selection of pipeline route.
Hydrodynamic loads induced by the relative motion between the pipe and surrounding water
also affect the choice of pipeline routing. It is essential to take into account all the load sources,
namely current, wave, etc. (DNV-OS-F101, 2013).
Arctic seas are covered with ice in different forms. Presence of such ice features as ice ridges
and icebergs may cause the scouring of the seabed and increase of hydrodynamic loads. Ice
gouging leads to pipeline damage and rupture. The gouging is a special hazard, requiring
appropriate route selection and design to minimize the risks of pipe failures.
Geographical location is to be estimated and compared to other possible locations. Then it is
necessary to assess the environmental conditions of chosen corridor: the pipeline can be divided
into several sections in accordance with the water depth, seabed topography and geomorphology
(DNV-OS-F101, 2013; Palmer & King, 2008).

Anchor Damage Assessment of Subsea Pipelines
7
Special focus is to be put on the seas of natural conservation interest because of tropical coral
reefs, which form the ecosystem of the planet. Similar to reefs marine parks are to be protected
as well. Thus, any kind of trenching or dredging works must be excluded.
2.2.2 Seabed characteristics
Alongside with the environmental data, it is important to utilize the seabed features. The latter
should include the information about rocks, sand waves, pock marks, mud slides, mud
volcanoes, and iceberg scars. Some surveys and laboratory tests are to be taken in order to obtain
the list of geotechnical properties and soil parameters that are necessary for the selection of the
design philosophy.
Pipeline rests on the sea bottom. Ideal seabed is represented as flat, smooth and technically
uniform one, consisting of stable clay. However, the seabed is usually uneven, and due to the
presence of rocks and valleys there is a probability of free spans formation. In addition, the
seabed with different kinds of obstacles the cobbles and boulders poses a threat and complicates
the trenching procedure a lot.
One of the challenging physical factors influencing pipeline behavior on the seabed is mobile
sand waves. Since sand waves are unstable, the pipeline, resting on their crests, can lose the
support of moving sand. That is why, it is recommended to avoid such territories. In case if it is
impossible to evade sand waves, the route must be laid along the troughs of sand waves, and the
pipeline has to be lowered in the trench below the troughs level, by using well-known pre-sweep
method (Palmer & King, 2008).
Moreover, soil is composed of several layers, the properties of which vary with the layers’ depth:
the upper layer is known to be more uncertain than deeper one. Thus, both of them have to be
emphasized during the pipeline design (DNV-OS-F101, 2013).
2.2.3 Facilities
An interaction of the pipeline with the platforms, offshore installations, subsea structures,
existing pipelines and cables (power or communication) may become dangerous and
challenging. In order to avoid probable pipeline damage it is better to locate the pipeline at a
certain distance from such obstructions. Offshore Standard DNV-OS-F101 (2013) points out that
minimum horizontal distance of 500 m shall be adopted in case if there are any facilities or
manned areas close to the pipeline. If there is an FPSO, drilling rig or semisubmersible, it is
essential to specify the size of anchor spreading or the distance of 2 km radius (Karunakaran,
2014).
A threat may be posed by the existing pipelines and cables. Before the final decision on pipeline
routing is made, some monitoring procedures are to be taken to determine the placement of
existing installations. Moreover, the following should be noticed:
The corridor shall be in a range of 50-100 meters, if it is an existing pipeline; and in a
range of 20-30 meters, if the pipeline is constructed together with the new one;
Approach angle shall be more than 300;
Size of crossing should be equal to the length of the part elevated off the seabed;
Anchor Damage Assessment of Subsea Pipelines
8
Rock dumping is to be calculated to provide necessary protection;
Areas with the vulnerable submarine cables are to be avoided either. Otherwise, the
pipeline should be laid through the gap of severed cable. Then the cable is to be spliced
and lowered back over the pipeline (Karunakaran, 2014).
2.2.4 Landfall
Pipeline route selection is also dependent on the construction limitations: shore and platform
approaches, pipeline crossings, and trenching. With regard to the landfall, the pipeline location is
chosen in accordance with the lay barge draught (in terms of the barge generation), and
environmental conditions. Concerning the platform approach, the minimum clearance of the
vessel to platform and sufficient corridor must be specified.
Political issues are also point of concern, especially for the export lines, interconnecting different
countries or even continents. For both the design and operation of export pipelines it is important
to use multiple code compliance and meet multiple reporting requirements (Karunakaran, 2014).
2.2.5 Third party activities
The focus of much attention is the third party activities mentioned in the Table 1. Pipelines
resting on the seafloor are increasingly exposed to the loads arising due to high human activity
on the sea. Deciding on a route, the inference between these activities and pipelines must be
considered.
Loads which are imposed on the pipeline system from 3rd
party activities shall be classified as
interference loads. Typical interference load include trawl interference, anchoring, vessel
impacts and dropped objects. Along with the interference loads there are also accidental loads,
and the main difference between them is the probability of occurrence. If the latter is less than
10-2
throughout a year, then it can be defined as accidental load (DNV-OS-F101, 2013).
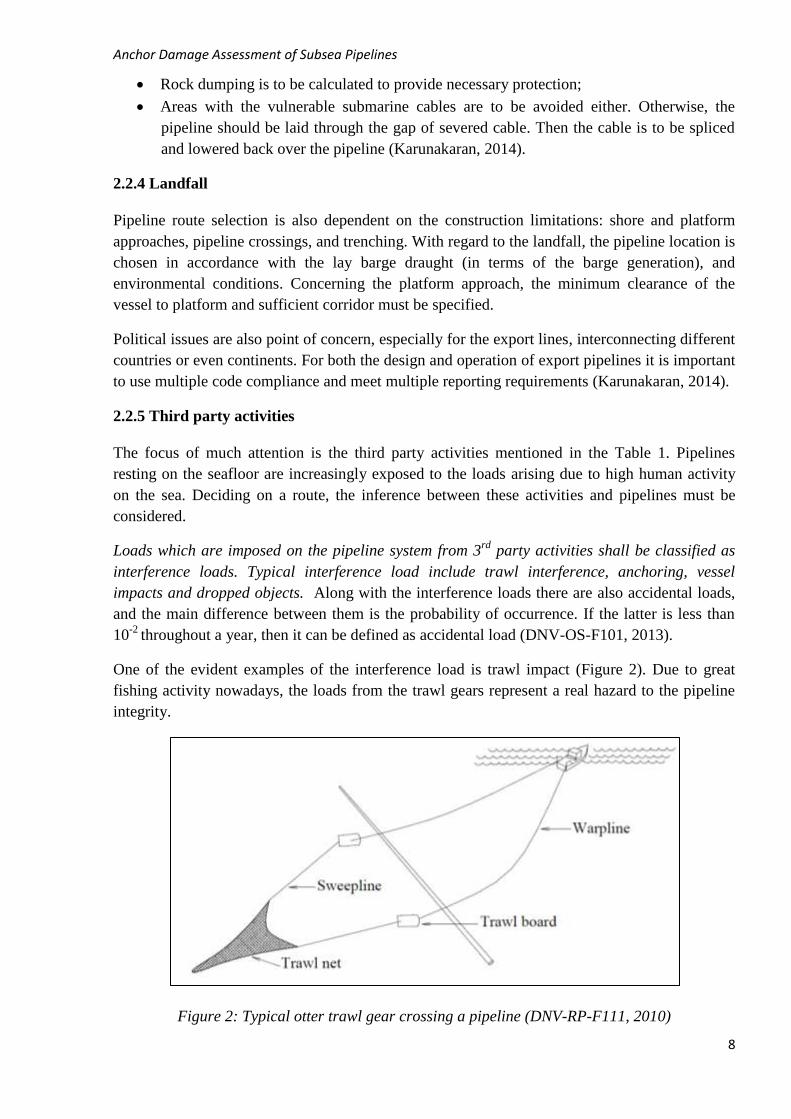
One of the evident examples of the interference load is trawl impact (Figure 2). Due to great
fishing activity nowadays, the loads from the trawl gears represent a real hazard to the pipeline
integrity.
Figure 2: Typical otter trawl gear crossing a pipeline (DNV-RP-F111, 2010)

Anchor Damage Assessment of Subsea Pipelines
9
The trawling scenario is usually divided into three interaction phases (Table 2) (DNV-RP-F111,
2010; Bai, 2001):
Table 2: Trawling scenario interaction phases
Phase Explanation Duration of the
phase Effect from the load
Impact
A pipeline is hit with the board, beam
shoe or clump. The pipe shell is
supposed to resist the impact load.
Some
hundredths of
second.
Local dents, damage of
pipe coating.
Pull-over A trawl board, beam shoe or clump is
pulled over the pipeline. 1-10 seconds.
Global pipeline
response.
Hooking A trawl board is stuck and wedged
under the pipeline. Several minutes.
Extreme cases, large
hooking loads are
imposed to the pipeline.
NB. Because of its small frequency, the hooking is classified as an accidental load. The reasons
for such loads may be different, and some of them are the following:
Severe environment conditions: high wave and current loads, ice features loads;
Emergency situations: explosions and/or fire;
Operational failures: infrequent internal overpressure, accidental water filling;
The impact from various items: vessel impact, dropped objects, dragging anchors, etc.
It is an era of a large amount and variety of ships (supply and construction vessels, ferries,
tankers, etc.) passing different territories and performing different functions. The more these
vessels are used, the greater danger is for the pipelines laid on the seabed. Dragged and dropped
anchors, grounding and foundering vessels represent serious accidents the pipeline might
experience. Significant consequences, such as scouring and rupture of the pipe section,
subsequent leakage of the product arise out of accidental events. Thus, a lot of attention must be
paid to the scenarios of pipeline routing in case of high ship traffic: pipeline shall be laid away
from the harbor and shipping lanes. Ship data collection and analysis have to be taken prior to
choosing the routing of the pipeline.
Another area of concern is an outcome of military activities. The presence of non-recovered and
undetonated mines; navigating submarines; weapons and bombs are very problematic and
dangerous. Those places must be carefully examined for location of the military action items. All
the explosive devices, bombs are to be defused (Palmer & King, 2008).
In addition, there is a possibility of pipe damage due to material dumping. Ocean disposal of
chemicals, nuclear wastes and obsolete equipment is a threat for both the environment and
offshore pipelines. Although the disposal at sea is totally prohibited nowadays, disturbed
remaining wastes may lead to undesirable and heavy consequences (Palmer & King, 2008).

Anchor Damage Assessment of Subsea Pipelines
10
2.3 ROUTE SURVEY
The route survey is carried out with a view to data collection for further design and construction
procedures. The survey is usually conducted within the corridor of preliminary route chosen in
accordance with the existing data. Later on obtained details from the sea charts, topography and
ROV surveys graphs are reviewed and modified in order to fulfil all the requirements in an
appropriate manner. Desk study includes the investigations of the seabed profile and geology,
presence of existing pipelines and cables, obstructions and wrecks, etc. All the investigations
must be performed in an accurate way for the purpose of safety during pipeline design,
construction and operation. Eventually, alignment sheets are to be prepared. Alignment sheets
provide information of the facilities and pipeline location, its length and key features. Those
drawings are very useful for final route selection, for the production of material takeoff, and for
the installation process.
Summarizing the part of pipeline route selection one shall understand how essential it is to obey
the rules of routing design, follow the whole survey procedure sequence, define work purposes,
and recognize the main features included in the alignment sheets. The more rational route is
chosen, the more successful, safe and cost-effective construction, operation and management of
pipeline system will be.

Anchor Damage Assessment of Subsea Pipelines
11
CHAPTER 3. PIPELINE THREATS
Pipelines are thought to be one of the most popular and safest methods of oil and gas
transportation. Otherwise, there are a lot of issues regarding design, installation and operation.
As mentioned before, pipeline route selection being the first in pipeline design “chain”, reflects
essential and basic procedures, which are very important for the next steps of the design
sequence. Factors affecting the route design are described above. Taking into account all these
factors for the route selection; the safety, reliability and integrity of the pipeline will be provided.
However, different problems associated with subsea lines may arise throughout their design life.
Pipeline failures are big area of concern, and they can result in the following (DNV-OS-F101,
2013):
Loss of component or system function;
Deterioration of functional capability to such an extent that the safety of the installation,
personnel or environment is significantly reduced.
3.1 DATABASE. STATISTICS
One or even several failures of the pipeline system can lead to huge incidents. Pipeline incident
outcomes depend heavily on failure modes and its causes. There are different international
databases and technical reports, which are commonly applied for the identification and analysis
of undesired events and potential hazards. Each source may denote its own list of pipeline
features, as well as failure causes and consequences correspondingly. Thus, rich information may
be widely used by authorities, operating, service and other companies involved in the
engineering works. The main characteristics of any database are to be defined by (Velez Vega et
al., 2006):
1. Database boundaries that are necessary to separate the incidents relating to the pipeline,
equipment, and facilities; to distinguish offshore lines from onshore ones; to point out the
life cycle phases of considered activities.
2. Database population that presents the details of considered lines, equipment, and
facilities. This information is primarily used for further statistical analysis.
3. Incident with the corresponding list of its location, causes and consequences.
3.1.1 PARLOC 2001
The most informative and comprehensive example of existing databases related to the data of
offshore pipeline incidents is PARLOC 2001 document, the latest version of which was updated
in the far 2003.
NB. The incident is defined here as an occurrence, which directly results or threatens to result
in loss of containment of a pipeline (PARLOC 2001 Database, 2003 version).
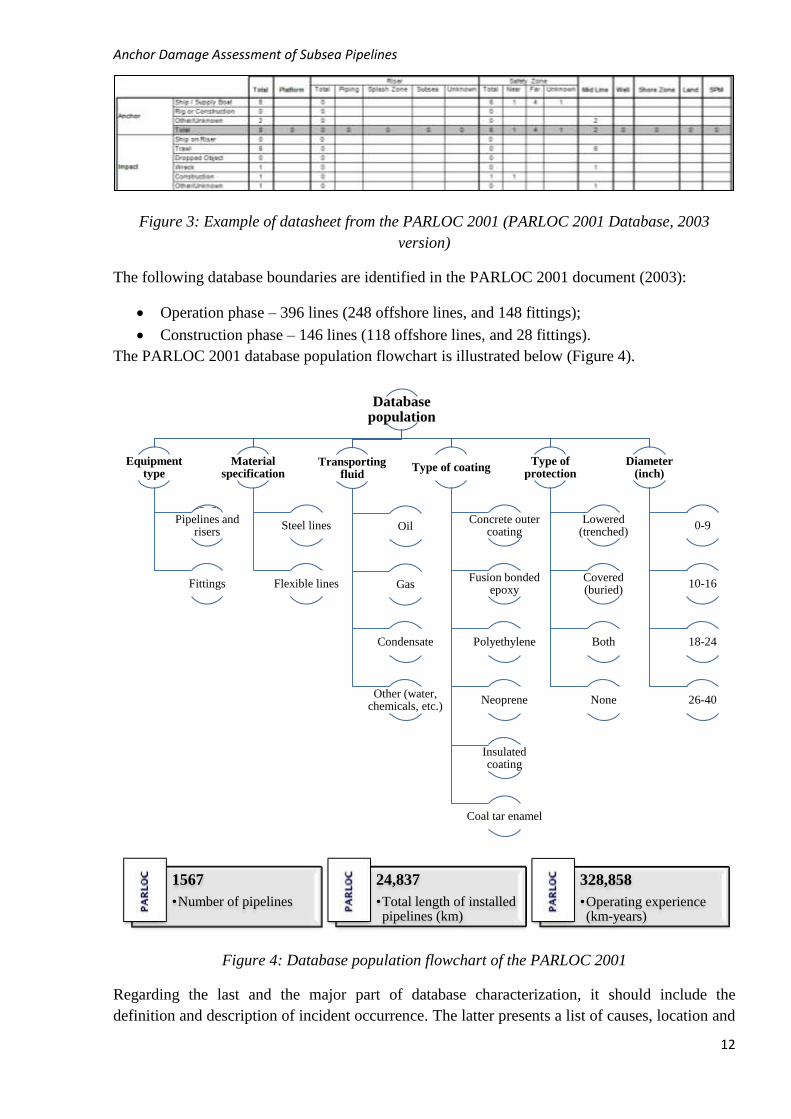
The document contains detailed information about pipelines sitting on the seabed of the North
Sea, and the description of the incidents occurring from 1960 up to 2000. All the plots, charts,
tables and diagrams, presented below, are compiled manually by using the data from different
chapters of this database document. An example of the datasheet is illustrated below (Figure 3).
Anchor Damage Assessment of Subsea Pipelines
12
1567
•Number of pipelines
24,837
•Total length of installed pipelines (km)
328,858
•Operating experience (km-years)
Figure 3: Example of datasheet from the PARLOC 2001 (PARLOC 2001 Database, 2003
version)
The following database boundaries are identified in the PARLOC 2001 document (2003):
Operation phase – 396 lines (248 offshore lines, and 148 fittings);
Construction phase – 146 lines (118 offshore lines, and 28 fittings).
The PARLOC 2001 database population flowchart is illustrated below (Figure 4).
Figure 4: Database population flowchart of the PARLOC 2001
Regarding the last and the major part of database characterization, it should include the
definition and description of incident occurrence. The latter presents a list of causes, location and
Database population
Equipment type
Pipelines and risers
Fittings
Material specification
Steel lines
Flexible lines
Transporting fluid
Oil
Gas
Condensate
Other (water, chemicals, etc.)
Type of coating
Concrete outer coating
Fusion bonded epoxy
Polyethylene
Neoprene
Insulated coating
Coal tar enamel
Type of protection
Lowered (trenched)
Covered (buried)
Both
None
Diameter (inch)
0-9
10-16
18-24
26-40

Anchor Damage Assessment of Subsea Pipelines
13
consequences of the incident correspondingly. The total number of pipeline incidents and further
details of the database content are given below (Figure 5).
Figure 5: PARLOC database incidents by numbers
According to the presented flowchart, one can see that the total number of incidents is 542.
There are 366 incidents involving lines, and 176 involving fittings. 248 out of 366 pipeline
failures are seen during operation phase and the rest (118) are found during construction. It
should be mentioned, that 209 incidents are associated with steel lines, and it represents 39% of
all the 542 cases. As for the fittings, there are 148 and 28 incidents occurred on the lines under
construction and operation respectively.
NB. Since there is no exact and full-length information about fittings incidents, proper analysis
on causes and consequences of fittings failures cannot be presented.
Concerning the occurrences of failures, they are heavily dependent on failure causes. 12 main
different causes may be found in that database:
Anchoring;
Impact;
Corrosion;
Material defect;
Fire/explosion;
Repair and maintenance;
Natural hazards;
Structural damage;
Construction fault;
Fitting fault;
Others.
Using the data from the document, it is possible to plot the diagrams, which can be easily
analyzed. As mentioned earlier, the pipelines become the subject of undesirable events two times
more likely than the fittings. Furthermore, it is important to distinguish steel lines from flexible
542 incidents
366 to pipelines
248 to lines under operation
209 to steel pipelines
39 to flexible pipelines
118 to lines under construction
176 to fittings
148 to fittings
on the lines
under operation
28 to fittings
on the lines uner construction

Anchor Damage Assessment of Subsea Pipelines
14
ones. That is why two diagrams are illustrated below in order to highlight their similarities and
differences (Figure 6). Each diagram presents all incident causes (248) involving operating
pipelines - steel (209) and flexible (39) ones.
Incident Causes
Steel lines Flexible lines
Figure 6: Causes of incidents to operating steel and flexible pipelines
In accordance with the diagrams above, it is seen that the most common incident causes for the
rigid pipelines are impact (26.8 %), corrosion (24.9 %) and anchoring (19.1 %); while the most
frequently detected incidents on the flexible lines are material (30.8 %) and impact (23.1 %).
It is also necessary to explain the consequences of all the incidents observed. All of them result
in loss of system integrity, which leads to the leakages of oil and gas. As defined in the Offshore
Standard DNV-OS-F101 (2013) the pipeline integrity is the ability of the submarine pipeline
system to operate safely and withstand the loads imposed during the pipeline lifecycle. The
flowchart illustrating the number of leaked and survived pipelines is presented on Figure 7.
19%
27%
6% 9%
1%
0%
6%
25%
6%
0%
1% 0%
ANCHOR
IMPACT
STRUCTURAL
MATERIAL
CONSTRUCTION
REPAIR
OTHER
CORROSION
NATURAL HAZARD
FIRE/EXPLOSION
HUMAN ERROR
OP. PROBLEMS
5%
23%
5%
31%
5% 3%
28%

Anchor Damage Assessment of Subsea Pipelines
15
Figure 7: Number of incidents (with and w/o loss of containment) involving pipelines and fittings
Figure 7 points out on 244 leakage events associated with the pipelines and fittings. 188 of them
are detected on the pipelines and fittings being under operation. Leaks are a big area of concern,
since they poses a threat to the people, environment and assets. The leakages may be
accompanied by the following ignition, fires and/or explosions.
Interesting to note that loss of pipeline containment often occurs due to the same list of damage
causes (impact, corrosion, anchoring and material). This fact is confirmed by a summary table
below (Table 3). The reason why there are a lot of incidents with rigid lines is probably because
there are more steel lines than flexible ones. Concerning fittings, main failure reason is observed
to be the fitting itself. However, there is a certain amount of fittings suffered from anchor,
impact, material and corrosion. Detailed discussion on each of these issues will be given further
as the text goes.
Table 3: Summary table of the main incidents causes
Subject Consequence
Cause
CORROSION MATERIAL
DEFECT IMPACT ANCHORING
Steel pipeline Damaged 52 18 56 40
Leaked 26 10 9 8
Flexible pipeline Damaged 1 12 9 1
Leaked 1 12 4 2
Every loss of containment event may be examined by the size of damage, which is also a part of
data. PARLOC 2001 classifies different hole diameters as following:
0 – 20 mm;
20 – 80 mm;
80 mm and more.
542 incidents
No leak (298)
230 pipelines
152 under operation
78 under construction
68 fittings
56 under operation
12 under construction
Leak (244)
136 pipelines
96 under operation
65 steel
31 flexible
40 under cosntruction
108 fittings
92 under operation
85 steel
7 flexible
16 under construction

Anchor Damage Assessment of Subsea Pipelines
16
In terms of the pipeline diameter, the ranges are presented in the database population (Figure 4).
The relation of pipeline diameter and hole size is given below. As indicated in Table 4, both steel
and flexible pipelines with 0-9 inches diameter suffer a lot as compared to the pipes with the
diameters of 10 inches or even more. The same situation is evidenced with the ruptured lines.
Thus, smaller diameter pipelines are more vulnerable and damageable.
Table 4: Relation of pipeline diameter and hole size
Pipeline
diameter (inch)
Hole size
(mm)
Leaked steel
pipes
Ruptured
steel pipes
Leaked
flexible pipes
Ruptured
steel pipes
0-9 0-20 26 0 18 0
20-80 8 3 3 1
>80 5 3 4 4
10-16 0-20 7 0 1 0
20-80 2 0 1 0
>80 9 5 1 1
>16 0-20 4 0 - -
20-80 2 0 - -
>80 2 2 - -
Pipeline incident location is of great significance as well. There are 6 principle zones recognized
in the database (Figure 8):
Figure 8: Pipeline principle zones
1 Within a radius of 500 m from the platform;
2 Outside the 500 m zone from the platform;
3 Within a radius of 500 m from the well.
Principle zones
II. Riser
III. Safety zone 1
IV. Mid line 2
V. Well 3
VI. Shore approach
I. Platform

Anchor Damage Assessment of Subsea Pipelines
17
Summary table is compiled to show the most affected by incidents areas along the pipeline
(Table 5). Table is complemented with land and SPM (single point mooring) zones.
Table 5: Affected zones of the pipelines
Subject Consequence
Total
number
of
incidents
Zone
I II III IV V VI Land SPM Unknown
Steel lines Damaged 209 1 60 47 84 10 4 1 2 0
Leaked 65 1 12 18 27 6 0 0 1 0
Flexible lines Damaged 39 2 5 2 15 12 0 0 0 3
Leaked 31 1 5 3 9 10 0 0 0 3
Pipeline Mid Line is one of the most sensitive regions: large numbers of damages and leakages
are observed there.
Summarizing the part devoted to incidents statistic in accordance with the PARLOC 2001
database, one shall understand the necessity of pipeline incidents information collection. Data
may be analyzed in different ways, and the results of such analyzes may be used for various
purposes during pipeline project planning, design, construction and management.
Database boundaries, population and incident occurrence are defined. Steel and flexible pipelines
are distinguished and studied. Special emphasis is made on the number of pipeline incidents,
their causes, location and consequences. So, damage sizes, number of leaked and ruptured pipes,
as well as the area of incidents are graphically presented in tables and diagrams. The emphasis
should be placed on the causes of pipeline failures, especially those, which lead to the loss of
containment. That is why a detailed description of failure causes will be given in the following
section of this paper.
3. 2 MAIN PIPELINE INCIDENT CAUSES
Discussed in a previous part pipeline incidents are characterized by their causes and
consequences. Corrosion, material defect, impact and anchor damage are defined as the main
reasons for loss of pipeline structural integrity (Figure 6, Table 5). That is why each of these
causes is going to be discussed hereinafter.
3.2.1 Spontaneous hazards. Corrosion
Corrosion is one of the most leading causes of pipe failures, in particular ruptures and leakages.
It is defined as the deterioration of a material, usually a metal, which results from a reaction
with its environment (Jacobson, n.d.). Corrosion primarily affects the design life of pipelines.
Pipes become weak, and they are less capable of resisting to the external forces. Two types of
pipeline corrosion exist: external and internal. Once one or both of them are established, the
mitigation procedures come to be more difficult. So that, corrosion process is to be controlled
during design, fabrication, installation, commissioning and operation phases of pipeline life-
cycle. Along with the control, corrosion protection measures should be specified as well.
Anchor Damage Assessment of Subsea Pipelines
18
Internal corrosion is observed inside of the pipelines because of the oil, gas or water stream.
Stream characteristics (operating pressure and temperature, flow regime, fluid composition, etc.)
tend to change during the design life. That is why periodic inspection, cleaning and monitoring
are required.
Several mechanisms of internal corrosion are distinguished:
Sweet corrosion (due to the presence of dissolved CO2) progresses slowly in a form of
pitting.
Sour corrosion (due to the presence of H2S in the product) progresses rapidly, resulting in
the cracking of pipeline steel wall.
Corrosion due to oxygen is formed in the pipelines during water-injection, gas lift,
pressure maintenance works.
Microbiological corrosion (due to the presence of sulfate-reducing bacteria) results in the
overlapping pits located on the pipe bottom (Palmer & King, 2008; Corrosion problems
in production, n.d.).
External corrosion usually appears on the outer side of the pipeline because of corrosive ambient
medium (e.g. seawater). External corrosion mechanisms may be classified as organic acid attack,
oxygen or microbiological corrosion. Set of the following factors usually influences external
corrosion (DNV-OS-F101, 2013):
Temperature profile along the pipeline;
Fabrication and installation peculiarities;
Design life;
Selected type of protection.
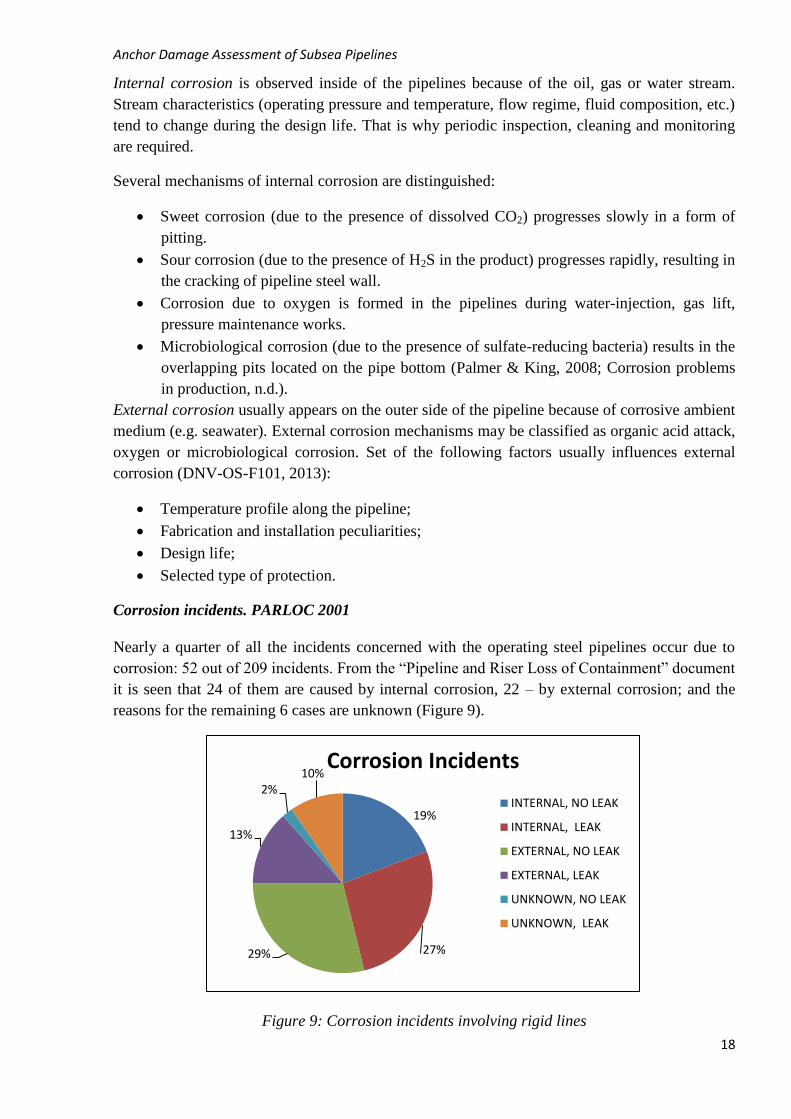
Corrosion incidents. PARLOC 2001
Nearly a quarter of all the incidents concerned with the operating steel pipelines occur due to
corrosion: 52 out of 209 incidents. From the “Pipeline and Riser Loss of Containment” document
it is seen that 24 of them are caused by internal corrosion, 22 – by external corrosion; and the
reasons for the remaining 6 cases are unknown (Figure 9).
Figure 9: Corrosion incidents involving rigid lines
19%
27% 29%
13%
2% 10%
Corrosion Incidents
INTERNAL, NO LEAK
INTERNAL, LEAK
EXTERNAL, NO LEAK
EXTERNAL, LEAK
UNKNOWN, NO LEAK
UNKNOWN, LEAK

Anchor Damage Assessment of Subsea Pipelines
19
Total number of leaked rigid pipelines being under operation phase is 26. 14 and 7 cases belong
to internal and external corrosion respectfully, and 5 of them are unknown (Figure 10). There are
4 incidents involving fittings. They are caused by internal corrosion, and all of them lead to
pipeline loss of containment issue. Concerning the flexible pipelines, they also become subject to
corrosion even if they are highly resistant to severe conditions. According to the database, only
one flexible line is affected by corrosion. In terms of the fluid type, the most problematic ones
are oil and water.
Figure 10: Pipeline diameter (inches) and location of corrosion incidents resulted in leakage
As seen from the Figure 10, a lot of corrosion incidents are established in II, III and IV zones,
i.e. Riser, Safety Zone and Mid Line (Figure 8). Dividing the pipeline into a set of certain
segments (or 6 principle zones as shown on the figure) helps to get clear understanding of
degradation mechanism location and to make proper risk analysis. In addition, such kind of “pipe
failed zone” information may be relevant for the selection of corrosion prevention strategies
(cathodic protection and coating systems) and for pipeline inspection planning procedures. Thus,
zones can dictate what and where to inspect. Nevertheless, by analyzing different failure cases,
one shall not exclude the fact that every pipeline system is unique and has its own properties.
Interesting to note that smaller diameter pipelines are more susceptible to corrosion and
subsequent leakage, than bigger ones. Smaller diameter pipes (3.5-16 inches) are usually used
for the product gathering and distribution purposes. These lines connect subsea wells with the
processing and treatment facilities. Fluid, being transported by them, is unprocessed and full of
mechanical impurities. Presence of dissolved CO2, H2S or bacteria in the stream may react with
the pipe material. Increase of reaction rate leads to the material deterioration. Such systematic
phenomena can result in loss of pipeline system integrity and other significant consequences.
0
2
4
6
8
10
12
14
16
18
Inte
rnal
Exte
rnal
Un
kno
wn
Exte
rnal
Un
kno
wn
Exte
rnal
Exte
rnal
Exte
rnal
Inte
rnal
Inte
rnal
Un
kno
wn
Inte
rnal
Un
kno
wn
Exte
rnal
Exte
rnal
Un
kno
wn
Inte
rnal
Inte
rnal
Inte
rnal
Inte
rnal
Inte
rnal
Inte
rnal
Inte
rnal
Inte
rnal
Inte
rnal
Inte
rnal
Inte
rnal
I I II II II II II III III III III III IV IV IV IV IV IV IV IV IV IV IV V V V V
Pip
elin
e d
iam
ete
r, in
ch
Incident cause and zone identification
Corrosion Incidents
FLEXIBLE STEEL

Anchor Damage Assessment of Subsea Pipelines
20
In order to ensure asset integrity and to optimize pipeline monitoring and inspection costs, the
following corrosion mitigation measures are to be specified during pipeline design:
Material selection;
Chemical and inhibitors dosing;
Use of external and internal coatings;
Cathodic or anodic protection.
In case of pipeline incident attributed to corrosion, the continuation of safe fluid transportation
may be achieved by urgent measures. Pipeline repair, reduction of maximum allowable operating
pressure (MAOP), and usage of necessary corrosion inhibitors seem to be the most indicative
and useful methods in accordance with the PARLOC 2001 database. In addition to them,
periodic maintenance service and monitoring are essential.
3.2.2 Spontaneous hazards. Material defects
Safe pipeline operation depends heavily on the type of pipe material and way of its fabrication.
Despite proper material selection and line pipe manufacturing process, there are still plenty of
defects that can threaten pipeline integrity. Failures may occur due to problems with the material
itself (either rigid or flexible) or due to defects associated with welds.
Different impurities, oxides or trapped gas are remained in steel. The presence of them leads to
the deterioration of pipe material. Eventually, formed inclusions and raised spots may affect the
wall thickness and thereby reduce the value of maximum allowable pressure in the pipeline.
Pipeline manufacture procedure is an issue as well. Production of steel lines is known to be
selected with or without welding (seamless pipes). Welding flaws or cracks on the pipeline wall
are of common occurrence after pipe fabrication. Sometimes they become unavoidable and
dangerous, because cracking size is never the same and it tends to change in time. The only way
to check the pipeline for imperfections is pressure testing. At the same time, testing should be
carried out carefully in order to exclude cracks size growing after several cycles of pipeline
pressurization (U.S. Department of Transportation, 2014). Regarding flexible pipelines, number
of all their defects is often lower than those, found on rigid ones.
Material defect incidents. PARLOC 2001
PARLOC database contains information about pipeline failures resulted from the material
defects. There are 30 failures, where 18 are observed on steel lines, and the rest is on the flexible
lines. Leakage of rigid lines happens in 10 cases out of 18, while leakage of flexible lines is
found in all 12 cases. Given pie diagram (Figure 11) shows, how many mechanical failures are
caused by weld and steel defects. As seen in a diagram below, steel defects represent a great
danger in comparison with weld ones.

Anchor Damage Assessment of Subsea Pipelines
21
Figure 11: Material defect incidents involving rigid lines
Defects in material and welds also affect the weakest points of pipeline such as connections and
pipe fittings. In pursuance of the database, 3 cases involving fittings are registered on the rigid
lines, while just 1 is tracked down on the flexible pipe.
Figure 12: Pipeline diameter (inches) and location of material defect incidents resulted in
leakage
Both small and large diameter pipelines fail due to defective fabrication and manufacturing
(Figure 12). Safety Zone and Mid Line seem to be the most susceptible to defects zones of the
pipeline. As for the fittings, problems with them are usually detected in a Platform Zone.
Reducing the number of mechanical failures may be achieved by implementation of appropriate
pipe material procurement, fabrication, manufacture and welding processes. Improved
technology and practice can have a positive effect on reduction of mechanical failures.
22%
22%
34%
22%
Material Defect Incidents
WELD DEFECT, LEAK
WELD DEFECT, NO LEAK
STEEL DEFECT, LEAK
STEEL DEFECT, NO LEAK
0
5
10
15
20
25
30
35
40
Ste
el d
efec
t
Ste
el d
efec
t
Ste
el d
efec
t
Ste
el d
efec
t
We
ld d
efe
ct
We
ld d
efe
ct
Fle
xib
le d
efe
ct
Fle
xib
le d
efe
ct
Fle
xib
le d
efe
ct
Fle
xib
le d
efe
ct
Ste
el d
efec
t
We
ld d
efe
ct
Fle
xib
le d
efe
ct
Fle
xib
le d
efe
ct
Fle
xib
le d
efe
ct
Fle
xib
le d
efe
ct
Ste
el d
efec
t
Fle
xib
le d
efe
ct
Fle
xib
le d
efe
ct
Fle
xib
le d
efe
ct
Fle
xib
le d
efe
ct
We
ld d
efe
ct
II II III III III III III III III III IV IV IV IV IV IV V V V V V SPM
Pip
elin
e d
iam
ete
r, in
ch
Incident cause and zone identification
Material Defect Incidents
FLEXIBLE
STEEL

Anchor Damage Assessment of Subsea Pipelines
22
Hydrostatic pressure tests must be carried out periodically but in an accurate way to evade any
uncontrolled and undesired events in the future.
3.2.3 External hazards. Impact
External hazards and harm coming from third party activities shall be taken to be the most severe
incident scenarios for the offshore pipelines. These failures are usually caused by the following
reasons:
1. Impacts:
1.1. Vessel and ship impact on risers;
1.2. Fishing and trawling;
1.3. Dropped objects;
1.4. Wrecks;
1.5. Activities of construction vessel;
1.6. Dumping;
1.7. Accidental grounding;
1.8. Dredging operations;
1.9. Ice gouging.
All of them are potential consequences of activities such as pipeline, risers and modules
installations; lifting procedures; subsea operations, fishing and ship traffic. A more detailed
description of these reasons will be given in the next part of this paper.
The submarine pipeline system shall be designed for impact forces caused by, e.g. dropped
objects, fishing gear or collisions. The design may be achieved either by design of pipe,
protection or means to avoid impacts (DNV-OS-F101, 2013) From time to time even advanced
design philosophy, optimized methods of protection and mitigation measures do not help to
completely exclude the possibility of pipeline damage and later loss of containment. So, it is
really important to use and refer to the incident databases, which include necessary for the
analysis information of pipeline failures.
In order to describe main impact incidents causes Table 6 is drawn up and given below.
Table 6: Impact incident causes
Impact incident causes Description and mitigation measures
Vessel and ship impact on
risers
It is very common when upper part of the riser is hit and damaged
by various kinds of powered or drifting vessels (merchant, supply,
fishing or standby vessels; shuttle tankers). For every riser vertical
zone is more “attackable” than horizontal one. That part is subject
to the impact from the ships and their collisions. That is why
special attention shall be given to the ship traffic area around any
offshore structure and platform with access to the braces in the
splash zone. Some protection in a form of jackets, J-tubes or
caissons is to be chosen and implemented for the upper parts of

Anchor Damage Assessment of Subsea Pipelines
23
the risers.
Fishing and trawling
This event is the most severe among those affecting the pipeline
resting on the seafloor. Scenarios and phases of interaction
between the pipeline and operating trawl/fish board or gear are
presented in the part devoted to the pipeline route selection (Table
2). The best way of protecting the pipeline from gear impact is to
keep it buried in a trench, to use special coatings and rock cover in
specified pipe sections.
Dropped objects
Drop object event is characterized by loss of any freights during
lifting operation, construction activities etc. There is variety of
objects that can be lost. They are classified by their shape
(flat/long, box/round) and their weight (2-8 tons). Drill tubes,
containers and/or huge objects like BOPs are generic examples of
objects, which are able to hit both flexible and rigid lines resting
on the seafloor. All the possible consequences from coating
damage to pipeline exposure and product release may occur after
the damage due to this undesired event. Concerning protection
actions - rock filling, external coating or appropriate heavy wall
thickness are to be selected.
Ship grounding
Ship grounding is the impact of a ship on seabed or waterway side
(“Ship grounding”, 2015).
Accidental grounding of the vessel may happen because of harsh
weather conditions, waves and currents, incorrect vessel
characteristics and parameters. All listed may affect navigation
and control systems of the vessel. In case if such errors find place
the ship can ground over the pipeline. After that the pipeline is
moved from its initial position. In addition, pipe may be left
exposed. Accurate routing design, trenching and pipe burying
solution can save pipeline from the effect of grounding ship.
Dredging operations
Some pipeline failures occur during excavation activity usually
taken in shallow water areas. Large equipment such as bucket
dredge, suction tools, grab dredgers or stern spud can easily
approach the pipeline and do much of harm to it. Some safeguards
measures are quite similar to those used in other cases. In
addition, marking marine chart may become useful for these
purposes (“Quantitative risk assessment for submarine gas
pipelines”, n.d.).
Ice gouging
With great interest to the oil and gas fields located in Arctic,
special attention should be paid to the pipeline transportation in
these regions. High risk is driven by the presence of ice of
different shape, age and physical characteristics (fast ice, drift ice,

Anchor Damage Assessment of Subsea Pipelines
24
ridges, stamuchas, etc.) as well as icebergs. Interaction of pipeline
with ice features threatens the fluid transportation process a lot.
Theoretically, design philosophy for the pipelines must be done in
accordance with three main factors: maximum expected gouge
depth, subgouge deformation, and pipeline strain. Pipeline shall
resist all possible loads from ice. Highly effective method of
submarine pipe protection from the ice gouge incident is to bury it
until it is placed in the safest zone below the seabed.
Impact incidents. PARLOC 2001
Continuing with the impact issues, it is important to refer to the data info contained in the
database. There are 56 out of 209 failures involving steel pipelines and 9 out of 39 involving
flexible ones. From the diagram charts (Figure 13) it is easily seen that trawling and dropped
object are serious problems for both types of lines. The fact can be proven by high fishing and
trawling activities; by large amount of construction or related to that area works that require
lifting of the cargo. Causes of certain number of failures are unidentified.
Impact incidents
Steel lines Flexible lines
Figure 13: Causes of impact incidents to operating steel and flexible pipelines
Mostly, loss of containment is observed after trawl and drop object impact on the pipeline.
Generally, leakage occurs in 9 cases with steel and in 4 cases with flexible lines.
6 incidents are related to the fittings: first four of them come from trawling action, the fifth one is
due to snagging buoy chain and the last one is because of inaccurate anchor chain drop. Pipeline
leakage over connector failure is recorded twice.
Identification of incident zone points out that Mid Line (outside the 500 m from the platform) is
the most affected by impacts area among all six zones. It can be explained by the location of
marine passage. In accordance with the existent standards and codes, there must be sufficient
14%
48% 3%
2%
4%
29% SHIP ON RISER
TRAWL
DROPPED OBJECT
WRECK
CONSTRUCTION
OTHER/UNKNOWN
67%
11%
22%

Anchor Damage Assessment of Subsea Pipelines
25
horizontal distance between ship lanes and offshore structures. That is why every marine passage
commonly crosses the pipeline route sections situated in the Mid Line zone. It is also justified by
the diagram (Figure 14). As to the line size, smaller diameter pipelines are more exposed to the
loads from external hazards. These pipes are more vulnerable to damage than larger ones. Thus,
trawl and fishing gears are able to hit and drag over them at an easy rate. Statistics shows that
2.4 and 6 inches pipes suffer a lot.
Figure 14: Pipeline diameter (inches) and location of impact incidents resulted in leakage
Recorded impact consequences are denting, ovalization, damaged coating, buckling, and pipeline
displacement. Some of them are found on the same lines. In order to get rid of these outcomes -
repair, pipe section replacement, and additional protection methods are used then. New safeguard
procedures can be developed and applied as well. In addition, it is recommended to take periodic
monitoring and survey along the pipeline in order to ensure its integrity and dependable service.
3.2.4 External hazards. Anchoring
Nowadays ship transport is getting more and more popular. It is still one of the most effective
ways to carry the passengers and cargo from one place to another. Despite increasing
attractiveness of sea transport, a lot of problems arise sometimes: sinking and grounding ships,
collisions of vessels, incorrect ship anchoring and uncontrolled anchor drops over the subsea
objects (pipelines, cables, manifolds, etc.). Several pipeline routes are crossed by ship traffic
zone. So, unsuccessful ship anchoring may result in loss of pipeline integrity and other
undesirable effects. Damage degree will change from case to case, depending on pipeline unique
properties; type and parameters of the vessel; characteristics of anchor and anchor chain; water
depth, environmental conditions and so on. Thus, a lot of attention should be paid to these factors
as well as ship traffic information.
0
5
10
15
20
25
30
35
40
Co
nst
ruct
ion
ves
sel
Un
kno
wn
Traw
l
Traw
l
Traw
l
Traw
l
Traw
l
Traw
l
Wre
ck
Traw
l
Dro
pp
ed o
bje
ct
Traw
l
Traw
l
III IV IV IV IV IV IV IV IV IV V V V
Pip
elin
e d
iam
ete
r, in
ch
Incident cause and zone identification
Impact Incidents
FLEXIBLE STEEL

Anchor Damage Assessment of Subsea Pipelines
26
Since this part of the paper is mainly focused on the analysis of PARLOC database, more
detailed discussion on vessel anchoring hazards will be presented in the next sections.
Anchoring incidents. PARLOC 2001
According to the data contained in the PARLOC 2001, 44 pipeline failures have occurred due to
unsuccessful ship anchoring. 40 cases are recorded on the operating steel lines, 2 cases are
detected on the flexible lines and remaining 2 have been found on the fittings of rigid pipelines.
Most failures are caused either by anchoring of the ship (supply boat) or construction vessel. It
is shown in Figure 15 below.
Anchoring Incidents
Steel lines Flexible lines
Figure 15: Causes of anchoring incidents to operating steel and flexible pipelines
Charts present what types of vessels have greater impact on pipeline integrity. There are 19
incidents attributed to incorrect ship anchoring (18 cases are recorded on steel pipes, and 1 case
is recorded on flexible), and further 11 incidents (involving only rigid pipelines) are occurred
due to anchoring procedure of construction vessels. Two fitting failure causes are not identified.
With regard to the incident location data (Figure 16), Safety Zone and Mid Line are the most
exposed to the anchor damage pipeline zones. Pipeline diameter is also a point of issue. Its size is
one of the major criteria for the selection of protection philosophy. For instance, the pipeline can
be buried, covered with the rock or coated with concrete, etc. Protection methods help to provide
some resistance against third party loads (Verley, 1994). Decision pipeline protection philosophy
is usually taken from case to case depending on the unique characteristics of pipeline and
environment as well. Otherwise, according to PARLOC 2001, it is seen that the largest leaked
pipeline affected by an anchor is 16 inch diameter line and the smallest one is 2.4 inch diameter
pipe. So in practice, smaller diameter lines (that are supposed to be protected) are more
vulnerable to harm.
45%
27%
28%
SHIP
CONSTRUCTION VESSEL
OTHER/UNKNOWN
50% 50%

Anchor Damage Assessment of Subsea Pipelines
27
Figure 16: Pipeline diameter (inches) and location of anchoring incidents resulted in leakage
During anchoring activity, pipelines resting on the seafloor might be hooked and moved off from
their initial position. It should be noted that theoretically not all the pipes can be hooked.
Relation between pipeline diameter and geometrical parameters of anchor is quite significant. It
is difficult to imagine that large diameter export line gets stuck inside the shank and flukes of 1st
class anchor (the smallest one). Discussion on pipeline and anchor parameters will be given
hereinafter.
Consequences of interaction between the anchor and submarine pipeline vary a lot: from non-
visible effects defined as local to ruptures of pipe bodies and product leakages. Loss of
containment is detected in 11 cases (9 in pipelines and 2 in fittings). Along with that, some rigid
lines are dented, displaced, or have their concrete coating damaged. As to the flexible, one is
broken, and another has external fault. Some repair procedures may be needed after such
incidents, consequences of which are incompatible with future operation of pipelines.
In order to ensure safe and continuous operation of pipelines, the following solutions may be
implemented, especially in areas with high ship traffic (Brown, 1972):
Pipeline burial;
Using of high strength concrete coating;
Application of rock dumping;
Using of reinforcing steel/extra steel;
Installation of concrete sections.
Prior to implementing one or another protection system, it is important to establish its technical
feasibility. In such a way, it will guarantee pipe safety during its design life (Brown, 1972):
02468
1012141618
An
cho
r-sh
ip/s
up
ply
bo
at
An
cho
r-sh
ip/s
up
ply
bo
at
An
cho
r-sh
ip/s
up
ply
bo
at
An
cho
r-sh
ip/s
up
ply
bo
at
An
cho
r-sh
ip/s
up
ply
bo
at.
An
cho
r-w
reck
An
cho
r-sh
ip/s
up
ply
bo
at
An
cho
r-sh
ip/s
up
ply
bo
at
An
cho
r-sh
ip/s
up
ply
bo
at
III III III III III III IV IV V
Pip
elin
e d
iam
ete
r, in
ch
Incident cause and zone identification
Anchoring Incidents
FLEXIBLE
STEEL

Anchor Damage Assessment of Subsea Pipelines
28
Summarizing the part devoted to the main incident causes, namely corrosion, material defect,
impacts and anchoring, one shall see how many subsea pipelines suffer from spontaneous and
external hazards even in era of technology growth. Some of these incidents occur more often
than other. Some of them are recorded on the same lines.
Various pie diagrams and bar charts are presented in order to illustrate the whole picture of
failures consequences. These consequences are distinguished between rigid, flexible lines and
pipe fittings. Special attention is given to leakages. Since the total number of steel pipelines
exceeds the number of flexible lines, the leakage on steel lines is detected more often than on
flexible ones. Incident cause and zone identification are determined and analyzed. The same
procedure is done with regard to pipeline diameter. This kind of information is very useful for
the selection of pipeline protection, which significantly reduces the extent of damage or
eliminates it at all. Certain outcomes are huge and dangerous; they can result in pollution, fatality
and loss of company reputation. Hereby, necessary safeguard measures for each type of incidents
are to be specified during pipeline design and implemented before the start of the operation
phase. In case of serious pipeline damage, some degree of repair is needed in an effort to return
the pipeline to normal operational mode.
Speaking about the databases, one shall understand how important it is to use them. Statistical
studies are widely used for updating of standards and design practices. Pipeline databases
contain different information that helps to recognize the factors affecting the safety of existent
and new lines. Moreover, statistics is needed for risk analysis procedure, which is basic for any
project start.
There will always be failures or disasters (Spurrier, 2009). This statement may be confirmed by
the bathtub curve, showing the relation between failure rate and age of the system (Figure 17).
Figure 17: Bathtub curve (“Further information on ageing and life extension”, n.d.)
As seen from the figure, bathtub curve characterizes three main phases of the system:
I. Early-life failures – decreasing failure rate;

Anchor Damage Assessment of Subsea Pipelines
29
II. Random failures – stabilized failure rate;
III. End-of-life failures – increasing failure rate.
The first phase shows the possibility of pipeline failure due to design, fabrication or construction
defects. The rate is very high at the beginning, but then it starts declining. The second phase
points out failures coming from the external hazards, such as anchor damage, impact or harsh
weather conditions. After that the curve behavior changes again, and the rate is increasing. End-
of-life failures are usually found because of pipeline ageing and wear. The most frequent causes
here are corrosion, cracking, and welding issues etc. Mechanical system safety and integrity may
be achieved by implementation of appropriate design, controlled manufacturing and construction
works, as well as periodic maintenance and inspection. These measures also help to extend the
useful life of the system (Figure 17).
All mentioned above highlight how important it is to record disasters which can occur within the
whole life of the pipeline system. Collection of incidents information provides an excellent
opportunity to learn from past experience and to eliminate risks in the future.

Anchor Damage Assessment of Subsea Pipelines
30
CHAPTER 4. SHIP ANCHORING EFFECT ON SUBMARINE PIPELINES
Pipelines are the most popular mean of hydrocarbon transportation. With the expansion of
pipeline network system and large amount of maritime activities, the potential damage to subsea
lines increases a lot. Analyzing pipeline failure database one can determine that incorrect ship
anchoring may result in huge consequences for the pipeline (rupture, leakage), environment
(pollution) and people around (fatality). Even if the anchor damage is categorized as accidental
event with the probability of occurrence less than the probability of occurrence of other
unplanned events, it is still one of the major threats to the pipeline integrity. Not only offshore
pipelines suffer from the action of anchor arrangement. Submarine cables that function as
communication lines, carrying data and Internet, can be hooked, damaged and/or torn by the
anchors as well.
In an attempt to show all the significance of anchor damage incident analysis, two tables (Table
7 and Table 8), containing information about worldwide offshore pipelines and submarine cables
failures due to anchor hazards, have been compiled. As demonstrated, great number of accidents
has occurred throughout XX and XXI centuries (Figures 18, 19). Dragged and dropped anchors
are detected to be the main pipeline and cable failure causes.
Figure 18: Pipeline anchor damage incidents number in XX-XXI centuries
Figure 19: Cable anchor damage incidents number in XX-XXI centuries
9; 36%
16; 64%
Pipeline Incidents in XX-XXI cent.
XXI century
XX century
17; 85%
3; 15%
Cable Incidents in XX-XXI cent.
XXI CENTURY
XX CENTURY

Anchor Damage Assessment of Subsea Pipelines
31
Table 7: Collected data regarding to pipeline anchor damages
Pipeline Year Location Cause Vessel type Consequence Source
Natural gas
pipeline 2014
Copano Bay,
Gulf of
Mexico (GoM)
Dragging
anchor Boat
Snagging of the pipeline.
Pipeline rupture. Fire on the
water.
(“Natural gas pipeline rupture causes
fire on the water in Copano Bay,
Texas”, 2014)
West African Gas
Pipeline 2012
Nigeria, Benin,
Togo, Ghana
waters
Dragging
anchor
WAGPCo
vessel taken
over by pirates
Damage of two pipeline
sections.
(“WAGPCo loses $30m to pipeline
rupture, to resume operations soon”,
2012)
Trans
Mediterranean
(natural gas
pipeline)
2008
The
Mediterranean
Sea
Dragging
anchor -
Catastrophic failure and a
simultaneous l4% reduction
in a parallel subsea high-
pressure pipeline.
(Sim, 2010)
Submarine
ethane gas
pipeline
2008 Port Phillip,
Australia
Dragging
anchor
Containership
"APL Sydney"
Snagging of the pipeline.
Pipeline displacement. Scour
marks, and some blowout
craters.
(Australian Transport Safety Bureau,
2008)
Kvitebjørn gas
pipeline 2007
Norwegian
sector of the
North Sea
Dragging
anchor (10
ton)
Large 80 000 -
100 000 DWT
vessel
A localized and sharp 17
degree dent and around half a
meter of damaged coating
exposing bare metal. The
pipeline was dragged 53 m
out of the installed position.
(Gjertveit, Berge & Opheim, 2010)
Central Area
Transmission
System
2007 UK sector of
the North Sea
Dragging
anchor
Motor Vessel
"Young Lady"
The pipeline was lifted out of
the trench and dragged 6 m
laterally. Damage of outer
protective layers.
(Woods, 2011)
High Island 2006 The Galveston Dragging Liberian oil Rupture resulted in an oil (U.S. Department of the Interior

Anchor Damage Assessment of Subsea Pipelines
32
Pipeline System
(oil pipeline)
Lightering
Area in the
GoM
anchor tanker leakage of approximately 870
barrels.
Minerals Management Service, 2008)
Canyon Chief
Gas Export
Pipeline
2005 GoM Dragging
anchor
Semi-
submersible oil
rig
Hook by an anchor. The
resulting damage pulled the
pipeline laterally 1 500 ft
from its original path.
(Alexander et al., 2014; Heallen, 2013)
Equilon Pipeline
Co. crude oil line 2000
Louisiana,
GoM
Dropped
anchor (8
ton)
Ship
About 2984.12 barrels of
crude oil were spilled,
creating a slick (2 miles wide
by 7 miles long).
(List of pipeline accidents in the United
States in the 21st century, 2015)
Natural gas
distribution line 1999
Hudson River,
New York
Anchor and
anchor chain,
the flukes of
the anchor
caught the
pipe
Cement barge
Maria T
Gas escape from the pipe,
"boiling water" effect. (United States Coast Guard, 1999)
Condensate line 1998 GoM, Block
EC334
Dragging
anchor during
rescue
operations
Service vessel Leakage of 1 211 barrels of
condensate.
(U.S. Department of the Interior
Minerals Management Service, 2002)
Amethyst gas
pipeline 1997 Humber estuar
Dragging
anchor Capella tanker
The anchor snagged on the
Amethyst gas pipeline.
(United Kingdom. Marine Accident
Investigation Branch, 2007)

Anchor Damage Assessment of Subsea Pipelines
33
Tennessee Gas
Pipeline 1996
Tiger Pass,
Louisiana,
GoM
Dropped
stern spud
(large steel
shaft that is
dropped into
the river
bottom to
serve as an
anchor
during
dredging
operations)
Dredge Dave
Blackburn
Rupture of natural gas steel
pipeline. The pressurized
(about 930 psig) natural gas
released from the pipeline
enveloped the stern of the
dredge and an accompanying
tug.
(Washington National Transportation
Safety Board, 1996)
Amethyst gas
pipeline 1996 Humber estuar
Dragging
anchor
Kandilousa oil
tanker
The anchor snagged the
Amethyst pipeline, parted an
ethylene feeder line
and a power cable. The gas
pipeline remained intact.
(United Kingdom. Marine Accident
Investigation Branch, 2007)
Chevron
Corporation
pipeline offshore
(oil line)
1991 El Segundo,
California Anchor Ship
1587.3 barrels of light oil
spil. Wildlife was affected.
(List of pipeline accidents in the United
States 1975 to 1999, 2015)
Condensate line 1990 GoM, Block
SS281
Dragging
anchor -
Leakage of 14 423 barrels of
condensate.
(U.S. Department of the Interior
Minerals Management Service, 2002)
Amoco pipeline
(oil line) 1988
Galveston
Block A-2,
GoM
Anchor Sypply boat 15 576 barrels leakage of
crude oil into the Gulf.
(List of pipeline accidents in the United
States 1975 to 1999, 2015; Strating,
1981)
Oil pipeline 1981 GoM, Block
SP60 Anchor Service vessel
Leakage of 5 100 barrels of
oil.
(U.S. Department of the Interior
Minerals Management Service, 2002)

Anchor Damage Assessment of Subsea Pipelines
34
Thistle-Dunlin
(oil line) 1980 North Sea
Dragging
anchor Vessel 1000 tons of oil leakage. (Orszulik, 2008)
High pressure
natural gas
pipeline
1979 Mississippi
River Delta
Mooring
spud Crane barge
Four workers drowned
attempting to escape a fire.
(Washington National Transportation
Safety Board, 1980)
Norpipe oil
pipeline (Ekofisk
to Teesside)
1977 North Sea Dragging
anchor
50 000 DWT
tanker,
Liberian
Tanker Marion
5-inch dent. (Gowen, Goetz & Waitsman, 1980)
Pennzoil pipeline 1974
GoM, Eugen
Island Block
317
Dragging
anchor - 19 833 barrels of oil spill. (Strating, 1981)
Oil pipeline 1969 GoM, Block
MP299
Dragging
anchor -
Leakage of 7 532 barrels of
oil.
(U.S. Department of the Interior
Minerals Management Service, 2002)
Oil pipeline 1968 GoM, Block
ST131
Dragging
anchor -
Leakage of 6 000 barrels of
oil.
(U.S. Department of the Interior
Minerals Management Service, 2002)
Humble oil
pipeline 1967
GoM, Block
WD73
Anchor tore a
hole in a
corroded
pipeline
- Leakage of 160 638 barrels of
oil.
(U.S. Congress, Office of Technology
Assessment, 1990; U.S. Department of
the Interior Minerals Management
Service, 2002)
Table 8: Collected data with regard to cable anchor damage
Cable Year Location Cause Vessel type Consequence Source
Transpower and
a fibre-optic
communication
cable
2015 Cook Strait Anchoring Boat Damage of cable. (“Big fine for anchoring in zone”,
2015)
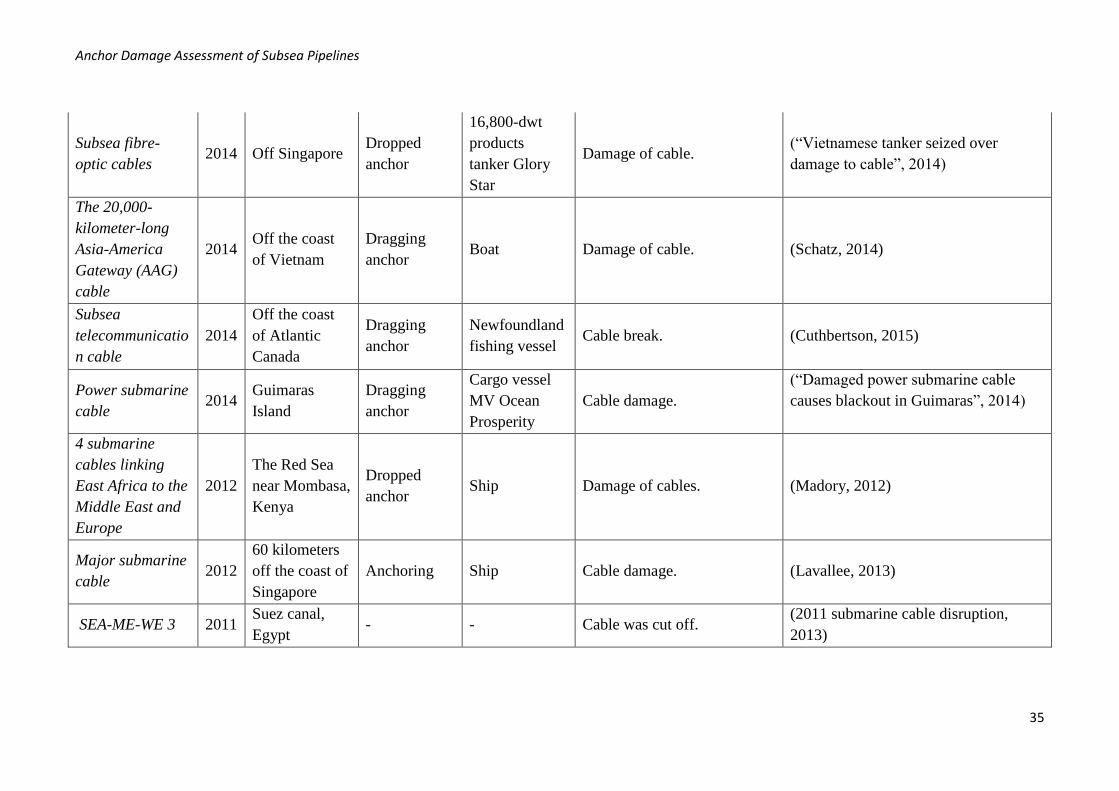
Anchor Damage Assessment of Subsea Pipelines
35
Subsea fibre-
optic cables 2014 Off Singapore
Dropped
anchor
16,800-dwt
products
tanker Glory
Star
Damage of cable. (“Vietnamese tanker seized over
damage to cable”, 2014)
The 20,000-
kilometer-long
Asia-America
Gateway (AAG)
cable
2014 Off the coast
of Vietnam
Dragging
anchor Boat Damage of cable. (Schatz, 2014)
Subsea
telecommunicatio
n cable
2014
Off the coast
of Atlantic
Canada
Dragging
anchor
Newfoundland
fishing vessel Cable break. (Cuthbertson, 2015)
Power submarine
cable 2014
Guimaras
Island
Dragging
anchor
Cargo vessel
MV Ocean
Prosperity
Cable damage.
(“Damaged power submarine cable
causes blackout in Guimaras”, 2014)
4 submarine
cables linking
East Africa to the
Middle East and
Europe
2012
The Red Sea
near Mombasa,
Kenya
Dropped
anchor Ship Damage of cables. (Madory, 2012)
Major submarine
cable 2012
60 kilometers
off the coast of
Singapore
Anchoring Ship Cable damage. (Lavallee, 2013)
SEA-ME-WE 3 2011 Suez canal,
Egypt - - Cable was cut off.
(2011 submarine cable disruption,
2013)
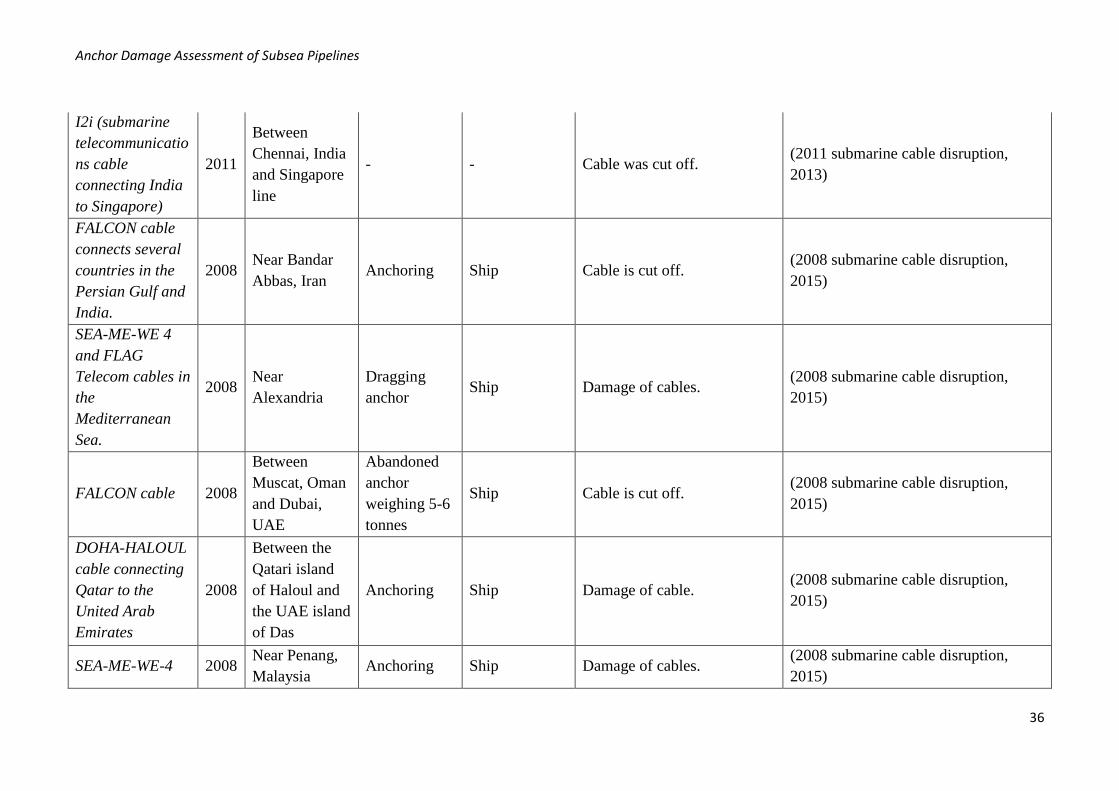
Anchor Damage Assessment of Subsea Pipelines
36
I2i (submarine
telecommunicatio
ns cable
connecting India
to Singapore)
2011
Between
Chennai, India
and Singapore
line
- - Cable was cut off. (2011 submarine cable disruption,
2013)
FALCON cable
connects several
countries in the
Persian Gulf and
India.
2008 Near Bandar
Abbas, Iran Anchoring Ship Cable is cut off.
(2008 submarine cable disruption,
2015)
SEA-ME-WE 4
and FLAG
Telecom cables in
the
Mediterranean
Sea.
2008 Near
Alexandria
Dragging
anchor Ship Damage of cables.
(2008 submarine cable disruption,
2015)
FALCON cable 2008
Between
Muscat, Oman
and Dubai,
UAE
Abandoned
anchor
weighing 5-6
tonnes
Ship Cable is cut off. (2008 submarine cable disruption,
2015)
DOHA-HALOUL
cable connecting
Qatar to the
United Arab
Emirates
2008
Between the
Qatari island
of Haloul and
the UAE island
of Das
Anchoring Ship Damage of cable. (2008 submarine cable disruption,
2015)
SEA-ME-WE-4 2008 Near Penang,
Malaysia Anchoring Ship Damage of cables.
(2008 submarine cable disruption,
2015)

Anchor Damage Assessment of Subsea Pipelines
37
FLAG Telecom,
SEA-ME-WE 4,
and SEA-ME-WE
3 cables, linking
Alexandria,
Egypt, Sicily, and
Malta; GO-1
cable
2008 Off Sicily Dragging
anchor
Oil tanker of
244m length
with a gross
tonnage of
58,000 tons
Cables are cut. (2008 submarine cable dispruption,
n.d.; Green & Brooks, n.d.)
6 cables: one
power cable, 1
electrode cable, 1
fiber-optic cable
and 3
communication
cables
2006 The Baltic Sea Dragging
anchor Cargo ship Damage of cables.
(“Cargo ship damages 6 submarine
cables in the Baltic”, 2007)
Submarine cable 2005
Between
Scania and
Bornholm
Anchor loss Barge Cable is torn in two parts. (“Blackout on Bornholm”, n.d.)
4 trans-Atlantic
cables 1986
Off the coast
of New Jersey
Dragging
anchor
Cargo ship
M/V
Aconcagua
Damage of hot-lines between
the US and the USSR.
(Burnett, Beckman & Davenport,
2013)
Electric cable 1955 Norway Dropped
anchor Ship Cable damage.
(Winiger, Koziol, Koch & Reinhard
Zimmermann, 2011)
Telegraph cable 1842 East River,
New York Anchoring Ship Cable damage.
(Carter et al., 2009)

Anchor Damage Assessment of Subsea Pipelines
38
4.1 SHIP ANCHORING
There are a lot of lines laid in shallow water. Some parts of their routes may be crossed by
shipping lanes, and other parts may be located near to the port or harbour. (Figure 20) Such a
common and controlled procedure as vessel anchoring may result in adverse effects for offshore
pipelines.
Figure 20: Offshore pipeline zones (Liu, HU & Zhang, 2013)
Anchoring is defined as lowering of weight (anchor, anchor chain or rope) to the sea bottom in
order to hold the ship in a certain position (“Anchors and anchoring”, 2012). Ship anchoring
procedure is usually distinguished between two scenarios (Hvam, Bruschi, Tommez, & Vitali,
1990):
1. Ordinary (routine) anchorage is carried out in a prescribed and most suitable area, which
extends 1 km on both sides of pipeline corridor. That is why ordinary procedure is not
thought to be risky for the pipeline operation;
2. Extraordinary anchorage may be carried out within unpredicted zone (shipping lanes or
pipe corridor) in case of emergency (engine failure, ship collision, loss of control) and
dangerous situation for the surrounding vessels and installations. Thus, emergency
anchoring becomes very critical for the pipelines.
Along with these two scenarios, there is also planned anchoring that is taken in the vicinity of
offshore structures and pipelines during construction works. Extraordinary and planned
operations need to be performed carefully and in accurate way. In spite of accumulated
knowledge and experience, there are still a lot of incidents associated with incorrect and unsafe
ship anchoring resulting in catastrophic damages to pipelines and submarine cables. The reasons
for them may be different, but the main ones are human error, failure of navigational system, and
harsh weather conditions.
It is always a challenge to deploy the anchors, when the ship is on its way. Sometimes the
problem resides in unsatisfactory maintenance of anchor winch arrangement: bad condition of

Anchor Damage Assessment of Subsea Pipelines
39
turnbuckle; break of the chain stopper; jerk in a chain; inadequate applications of chain lock, and
band brakes (DNV Recommended Failure Rates for Pipelines, 2010). All these may lead to
uncontrolled actions with three possible outcomes:
1. Anchor is dropped within 1 km. The penetration depth is not large, so the anchor is easily
recovered.
2. Anchor is fully seated in the seabed. Maximum penetration and holding power are
provided and it can result in chain and bitter end breaks; some problems in ship
maneuvering system also arise. Anchor can be lost.
3. Anchor is not seated and dragged for some distance along the seabed until it hooks the
pipeline or structure. Ship anchor drags because the external forces are greater than
holding power of the anchor and chain. Anchor is lost.
Three outcomes denote that subsea pipeline may be hit from the top or displaced by dropped and
dragged anchors correspondingly. In order to get a broad picture of pipeline damage, it is
necessary to know key factors, particularly affecting the interaction between pipeline and anchor,
namely:
Vessel characteristics: type, identification number, length, breadth, drought, speed, and
vessel movements tracks, etc.;
Anchor arrangement parameters: anchor type, class and mass; chain type, length and
diameter, etc.;
Pipeline characteristics: route identification, seabed profile, material type (steel or
flexible) and grade, diameter, wall thickness, coating thickness, type of protection, etc.
In addition to these factors, it is essential to take into account marine activity details such as ship
traffic volume (intensity) and vessel population (composition). It should be mentioned that the
number of emergency situations is heavily dependent on the number of ships passing the lines.
Hence, the combination of these data becomes very useful.
Moreover, not only anchoring issues, but also a set of other criteria, become an actual reason for
pipeline failure. Set of key factors and criteria relevant to the pipeline damage will be covered
hereinafter.
4.1.1 Vessel characteristics
A vast number of different vessels cross over huge territories. Passing vessels vary in class and
area of use. Energy Report categorizes six ship classes with the ranges of Equipment Number
(EN) and corresponding values of displacement, chain length and anchor mass (Table 9).
Table 9: Ship class definition (DNV Recommended Failure Rates for Pipelines, 2010)
Class Displacement,
tonnes
GRT
from
GRT
to
EN
from
EN
to
Length of
anchor
chain, in
Anchor
mass, kg
I 1500 100 499 280 320 179 900
II 3600 500 1599 450 500 207 1440
III 10000 1600 9999 980 1060 248 3060
IV 45000 10000 59999 2870 3040 317 8700

Anchor Damage Assessment of Subsea Pipelines
40
V 175000 60000 99999 5800 6100 372 17800
VI 350000 100000 - 8400 8900 385 26000
All of the vessels can be attributed to a certain category that is accepted by naval architects
(Ship, 2015). Several types of the ships are shown in Figure 21.
Figure 21: Illustration of vessel types
Each ship has its name and unique numbers like IMO (International Maritime Organization) and
MMSI (Maritime Mobile Service Identity). These numbers are used to identify vessel location
and set of specific parameters: tonnage, hull, cargo, and machinery, etc. Such data may be found
in Vessel Register sources (for instance, DNV GL). Moreover, the identification numbers also
help to determine vessels movements’ details (in particular, shipping intensities and traffic
composition), and tracking data, that can be retrieved from AIS (Automatic Identification
System) surveys.
Types of vessels
High speed craft
Offshore vessels
Supply vessel
Laying vessel
Accomodation barge
FPSO
Drilling rigs
Fishing vessel
Harbour work craft
Cable layers
Tugboats
Dredgers
Floating cranes
Passenger vessels
Special-purpose vessels
Warships

Anchor Damage Assessment of Subsea Pipelines
41
4.1.2 Anchoring equipment characteristics
Equipment number
Once the IMO-no is known, then it is possible to get information about anchoring equipment,
which varies with the type of vessels. For the purpose of getting clear understanding of the
equipment, some definitions and interpretations are taken from the DNV Rules for Classification
of Ships document (DNV Rules for Classification of Ships, 2011).
The anchoring equipment required is the minimum considered necessary for temporary mooring
of a vessel in moderate sea conditions when the vessel is awaiting berth, tide, etc. The equipment
is therefore not designed to hold a vessel off fully exposed coasts in rough weather or for
frequent anchoring operations in open sea. In such conditions the loads on the anchoring
equipment will increase to such a degree that its components may be damaged or lost owing to
the high energy forces generated. The anchoring equipment required by the Rules is designed to
hold a vessel in good holding ground in conditions such as to avoid dragging of the anchor. In
poor holding ground the holding power of the anchors will be significantly reduced. It is
assumed that under normal circumstances the vessel will use only one bower anchor and chain
cable at a time.
As noted before, each ship has its own anchoring system (anchor and its attachment to the ship),
the size of which is directly dependent on the ship characteristics. To make decision on the
anchor size it is needed to find an Equipment Number using specified formula from the Rules
(DNV Rules for Classification of Ships, 2011):
𝐸𝑁 = Δ2/3 + 2 ∙ 𝐵 ∙ 𝐻 + 0.1 ∙ 𝐴 (1)
𝐻 - effective height from the summer load waterline to the top of the uppermost deckhouse, to be
measured as follows:
𝐻 = 𝑎 + ∑ℎ𝑖 (2)
𝑎 - distance from summer load waterline amidships to the upper deck at side;
ℎ𝑖 - height on the center line of each tier of houses having a breadth greater than 𝐵/4. For the
lowest tier, ℎ𝑖 shall be measured at center line from the upper deck, or from a notional deck line
where there is local discontinuity in the upper deck;
𝐴 - area in profile view of the hull, superstructures and houses above the summer load waterline,
which is within 𝐿 of the ship. Houses of breadth less than 𝐵/4 shall be disregarded;
𝛥 – displacement.
NB. The Equipment Numeral formula for required anchoring equipment is based on an assumed
current speed of 2.5 m/s, wind speed of 25 m/s and a scope of chain cable between 6 and 10, the
scope being the ratio between length of chain paid out and water depth (DNV Rules for
Classification of Ships, 2011).
As soon as the EN has been found, one can define what kinds of anchor and anchor chain
correspond to a given vessel. Anchoring equipment may be selected according to the
requirements from the Equipment Tables provided by the Rules (Figure 22).

Anchor Damage Assessment of Subsea Pipelines
42
Figure 22: Part of the Equipment Table from the DNV Rules for Classification of Ships
document
Anchor
Speaking about the anchors in general, there are several types of them developed for temporary
or permanent usage: gravity and drag embedment; pile and suction anchors. The most traditional
one for the vessels is drag embedment anchor (DEA) designed to penetrate into the seafloor.
DEA can be classified as stocked or stockless one (widely used). More detailed description of
various anchor types is presented in Table 10 (Sriskandarajah & Wilkins, 2002; Aberdeen.
Health & Safety Executive, 2009).
Table 10: Anchor types
Illustration Name Peculiarities
Hook
(traditional fisherman
and grapnel)
Has small fluke surface and heavy,
narrow arm;
Penetrates into rock, heavy kelp, eel
grass, coral and hard sand;
May snag unprotected (unburied)
pipelines.
Plough May bury itself in the sea bottom;
Penetrates in both soft mud and rock.

Anchor Damage Assessment of Subsea Pipelines
43
Fluke Has large fluke areas;
Develops very large resistance to the
loads;
Has less ability to penetrate;
Has light weight.
May threaten shallow trenched pipelines.
Anchor rode
The anchor is attached to the ship by the rode, which is quite critical item of anchoring system as
well. Anchor rode can be rope, chain or a combination of them. Every type has its own
advantages and disadvantages: wire rope is more flexible, while chain is more robust.
Nevertheless, chain is supposed to be the most applicable mode of anchor and vessel connection
(Sriskandarajah & Wilkins, 2002).
One can distinguish between stud-link (for temporary purposes) and stud-less (for permanent
purposes) chains (Figure 23). Each of them varies in size (diameter) and material grade, which
are chosen in relation to the parameters of the anchor as shown in the Equipment Table (Figure
22).
Figure 23: Stud-link and stud-less chain configurations (“Mooring chain”, n.d.)
4. 2 PIPELINE DAMAGE CRITERIA
On the basis of ship, anchor and pipeline parameters it is possible then to highlight main damage
criteria influencing effect of pipeline-anchor interaction. Six damage criteria are chosen to be
principle for the assessment of the threats from anchors to the pipelines:
1. Chain length;
2. Anchor fluke size;
3. Anchor penetration depth;
4. Marine physical environment;
5. Applied forces from the anchor;
6. Pipeline resistance.

Anchor Damage Assessment of Subsea Pipelines
44
4.2.1 Anchor fluke size
It is evident that not all the anchors are capable of hooking on to the offshore pipelines. The key
parameter here is the anchor fluke (“teeth”) size. There are two ways (a and b) of hooking the
pipeline (Figure 24). The first figure below (a) shows the configuration of pipeline being stuck
between one fluke and shank of the anchor. Pipe diameter and anchor size relation for this case is
as written:
𝐶⊥ ≥ 𝑑/2 (3)
𝛼 - angle between fluke and shank;
𝐶 - length of fluke;
𝐶⊥ − projected fluke length;
𝑑 - outer diameter of steel pipe (w/o specifying the coating).
Another way of line hook is presented on the second figure (b). It is shown that the pipeline can
be stuck between the plane of two flukes and anchor shank correspondingly. The relation here is
as specified:
𝐶′⊥ ≥ 𝑑/2 (4)
𝛽 - angle between the plane of flukes and the shank;
𝐶′ - median of flukes plane;
𝐶′⊥ - projected median;
𝑑 - outer diameter of steel pipe (w/o specifying the coating).
Figure 24: Anchor size and pipeline diameter relation
It is possible to determine the maximum hook diameter for each anchor size. Thus, pipe-anchor
interaction studies are simplified a lot.
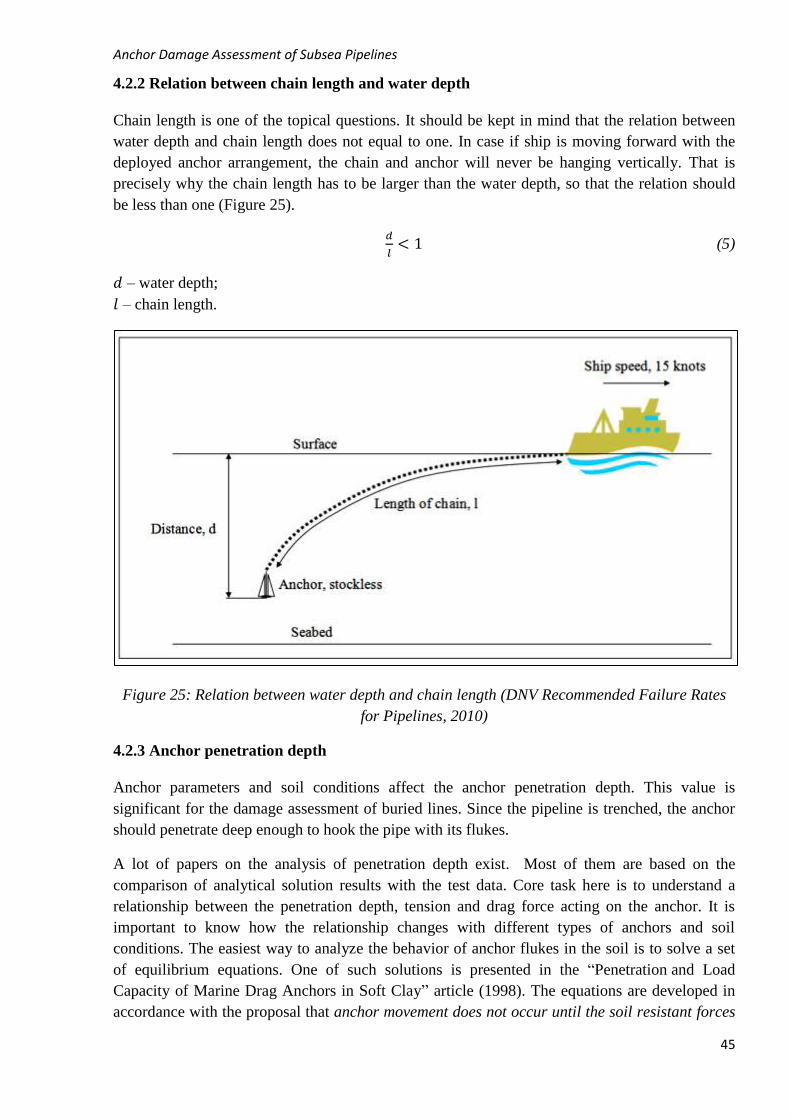
Anchor Damage Assessment of Subsea Pipelines
45
4.2.2 Relation between chain length and water depth
Chain length is one of the topical questions. It should be kept in mind that the relation between
water depth and chain length does not equal to one. In case if ship is moving forward with the
deployed anchor arrangement, the chain and anchor will never be hanging vertically. That is
precisely why the chain length has to be larger than the water depth, so that the relation should
be less than one (Figure 25).
𝑑
𝑙< 1 (5)
𝑑 – water depth;
𝑙 – chain length.
Figure 25: Relation between water depth and chain length (DNV Recommended Failure Rates
for Pipelines, 2010)
4.2.3 Anchor penetration depth
Anchor parameters and soil conditions affect the anchor penetration depth. This value is
significant for the damage assessment of buried lines. Since the pipeline is trenched, the anchor
should penetrate deep enough to hook the pipe with its flukes.
A lot of papers on the analysis of penetration depth exist. Most of them are based on the
comparison of analytical solution results with the test data. Core task here is to understand a
relationship between the penetration depth, tension and drag force acting on the anchor. It is
important to know how the relationship changes with different types of anchors and soil
conditions. The easiest way to analyze the behavior of anchor flukes in the soil is to solve a set
of equilibrium equations. One of such solutions is presented in the “Penetration and Load
Capacity of Marine Drag Anchors in Soft Clay” article (1998). The equations are developed in
accordance with the proposal that anchor movement does not occur until the soil resistant forces

Anchor Damage Assessment of Subsea Pipelines
46
are overcome (Figure 26). The first three equations govern anchor equilibrium during its
penetration, while the fourth one describes chain performance (Thorne, 1998; DNV-RP-E301,
2012).
𝑀: −𝑇𝑎 ∙ 𝑆𝑖𝑛(𝜃 + 𝜃𝑎) ∙ 𝑆𝑥 +𝑊 ∙ 𝐶𝑜𝑠(𝜃) ∙ 𝑋𝑤 +𝑀 − 𝑇𝐷𝐹𝑀 + 𝑇𝑎 ∙ 𝐶𝑜𝑠(𝜃 + 𝜃𝑎) ∙ 𝑆𝑦 +𝑊 ∙
𝑆𝑖𝑛(𝜃) ∙ 𝑌𝑤 = 0 (6)
𝑂𝑥: 𝑇𝑎 ∙ 𝐶𝑜𝑠(𝜃 + 𝜃𝑎) − 𝑇𝐷𝐹𝑃 +𝑊 ∙ 𝑆𝑖𝑛(𝜃) = 0 (7)
𝑂𝑦: 𝑇𝑎 ∙ 𝑆𝑖𝑛(𝜃 + 𝜃𝑎) − 𝐹𝑛 − 𝑇𝐷𝐹𝑁 −𝑊 ∙ 𝐶𝑜𝑠(𝜃) = 0 (8)
𝜃𝑎 = √2 ∙ 𝑍 ∙ �̅�
𝑇𝑎+ 𝜃0
2
𝑇𝑎 – chain tension in attachment point;
𝜃 – angle of fluke to horizontal;
𝜃𝑎 – angle of chain at anchor attachment to horizontal;
𝑆𝑥 – x-coordinate of anchor shackle;
𝑊 – submerged weight of anchor;
𝑋𝑤 – x-coordinate of anchor center of gravity;
𝑀 – moment exerted on fluke by soil;
𝑇𝐷𝐹𝑀 – total moment of drag forces about center of fluke area;
𝑆𝑦 – y-coordinate of anchor shackle;
𝑌𝑤 – y-coordinate of anchor center of gravity;
𝑇𝐷𝐹𝑃 – total drag force parallel to fluke;
𝐹𝑛– normal force exerted on the fluke by the soil;
𝑇𝐷𝐹𝑁 - total drag force normal to fluke;
𝑄 – average normal force per unit length of chain;
𝑍 – depth from the mud line to the anchor shackle;
𝜃0– angle of the chain at the mud line to the horizontal.
Figure 26: Equilibrium of anchor

Anchor Damage Assessment of Subsea Pipelines
47
Good studies results for both hard and soft soil are presented in DNV Recommended Failure
Rates for Pipelines document (Table 11). Table shows the variation of anchor penetration depth
and fluke length for different ship classes.
Table 11: Estimation of anchor penetration depth (DNV Recommended Failure Rates for
Pipelines, 2010)
Displacement,
tons
Penetration
depth, m
Fluke
length, m
Hard soil
(sand/hard
clay)
1500 0.60 0.84
3600 0.65 0.91
10000 0.89 1.26
45000 1.30 1.83
175000 1.64 2.31
350000 1.87 2.64
Soft soil
(mud/soft
clay)
1500 1.79 0.84
3600 1.94 0.91
10000 2.68 1.26
45000 3.89 1.83
175000 4.91 2.31
350000 5.62 2.64
It is seen from the table that the maximum penetration depth of the flukes is found in soft clay
and mud.
NB. Anchor penetration depth check is not going to be included into the analyses. In the case
study it is assumed that all the anchors have already broken out of the sea bottom prior to
hooking the pipe.
4.2.4 Marine physical environment
Action of the external forces on the vessel (sometimes exceeding the value of anchor holding
power) can lead to unfavorable events. These forces are usually created by the marine physical
environment. So that wind, currents and waves are capable of generating horizontal and vertical
forces that give rise to various vessel motions. (Figure 27) In such cases the anchor can be
broken free and then dragged along the seabed. The latter may result in huge consequences for
both anchor arrangement system itself (break of the rode, loss of the anchor, etc.) and submarine
pipelines and cables as well (damage, rupture, etc.) (Gudmestad, 2014).

Anchor Damage Assessment of Subsea Pipelines
48
Figure 27: Vessel motions (Gudmestad, 2014)
4.2.5 Applied forces from the anchor
Mainly two anchoring operation modes characterize pipe-anchor interaction scenario. These
modes are dropped and dragged anchors; and they are supposed to be the dominant causes of
pipeline failure among all other external hazards.
Dropped anchors
Dropped from the vessel anchor is capable of hitting the pipeline vertically and causing localized
deformations like coating crush and deflection of the steel shell (dent) (Figure 28). The duration
of this mode is milliseconds. Assuming that all the impact energy is absorbed by the capacity of
the pipeline and its protection, one shall find out that kinetic energy of the dropped anchor is
very critical for the assessment of pipe local damage (Hvam, Bruschi, Tommez, & Vitali, 1990).
Figure 28: Dropped anchor mode (Hvam, Bruschi, Tommez, & Vitali, 1990)
From the basis of classical mechanics it is known that kinetic energy (𝐸𝑘) of any object is a
function of its mass (𝑚) and impact velocity (𝑣):
𝐸𝑘 =1
2∙ 𝑚 ∙ 𝑣2 (9)
𝑣 = 𝑣𝑇 (10)

Anchor Damage Assessment of Subsea Pipelines
49
Impact velocity is to be defined as terminal velocity of the object falling free in the water
medium. The value of the terminal velocity is affected by the object shape and mass, and may be
calculated from the Newton’s second low:
(𝑚 − 𝑉 ∙ 𝜌𝑤) ∙ 𝑔 =1
2∙ 𝜌𝑤 ∙ 𝐶𝐷 ∙ 𝐴 ∙ 𝑣𝑇
2 (11)
𝑣𝑇 = √2∙(𝑚−𝑉∙𝜌𝑤)∙𝑔
𝜌𝑤∙𝐶𝐷∙𝐴 (12)
𝑚 – object mass;
𝑔 – acceleration of gravity;
𝑉 – object volume (equals to the volume of the displaced water);
𝜌𝑤 – water density;
𝐶𝐷 – object drag coefficient;
𝐴 – object area in the direction of the flow;
𝑣𝑇 – terminal velocity.
Moreover, there is an added hydrodynamic mass parameter that should be specified as well:
𝑚𝑎 = 𝜌𝑤 ∙ 𝐶𝑎 ∙ 𝑉 (13)
𝑚𝑎 – object added mass;
𝐶𝑎 – object mass coefficient.
Drag and mass coefficients can be taken from Table 12.
Table 12: Drag and mas coefficients for specified objects shapes (DNV-RP-F107, 2010)
Shape description Drag coefficient, CD Mass coefficient, Ca
Slender 0.7-1.5 0.1-1.0
Box 1.2-1.3 0.6-1.5
Complex 0.6-2.0 1.0-2.0
Taking into account terminal velocity and added mass, the formula of kinetic energy of dropped
object can be rewritten as following:
𝐸𝑘 = (𝑚 +𝑚𝑎) ∙ 𝑣𝑇2 (14)
When the kinetic energy of the impact object is determined, then it is possible to find the size of
local damage (Figure 29). It is obvious that the impact scenario consequences vary based on the
type of pipeline protection (DNV-RP-F107, 2010).
Bare pipeline:
𝐸 = 16 ∙ (2𝜋
9)
1
2∙ 𝑚𝑝 ∙ (
𝐷
𝑡)
1
2∙ 𝐷 ∙ (
𝛿
𝐷)
3
2 (15)
𝐸 - absorbed energy;
𝑚𝑝 - plastic moment capacity of the wall;

Anchor Damage Assessment of Subsea Pipelines
50
𝛿 - pipe deformation, dent depth;
𝑡 - wall thickness (nominal);
D - steel outer diameter.
Figure 29: Schematic view of dent prediction model (DNV-RP-F107, 2010)
Pipeline with the concrete coating:
𝐸 = Υ ∙ 𝑏 ∙ ℎ ∙ 𝑥0 (16)
𝐸 = Υ ∙ 𝑏 ∙ 4/3 ∙ √𝐷 ∙ 𝑥03 (17)
𝐸 – absorbed energy;
Υ – crushing strength of concrete;
𝑏 – breath of the impacting object;
ℎ – depth;
𝑥0 – penetration;
𝐷 – pipeline diameter.
Gravel cover:
𝐸 =2
3∙ 𝛾′ ∙ 𝐿 ∙ 𝑁𝛾 ∙ 𝑧
3 (18)
𝐸 =√2
4∙ 𝛾′ ∙ 𝑠𝛾 ∙ 𝑁𝛾 ∙ 𝑧
4 (19)
𝐸 – absorbed energy;
γ′ – effective unit weight of the fill material;
𝐿 – length of the impacting side;
𝑠𝛾 – shape factor;
z – penetration depth;
Nγ – bearing capacity coefficient.
Dragged anchors
If the vessel is moving with the deployed anchor, the latter can hit and snag the pipeline resting
beneath or laid on the seafloor (Figure 30). As the result, pipeline becomes dented, bended,

Anchor Damage Assessment of Subsea Pipelines
51
and/or lifted up from the bottom, and/or displaced from its initial position. In most cases pipeline
loses its integrity and leaks.
Figure 30: Dragged anchor mode (Hvam, Bruschi, Tommez, & Vitali, 1990)
The interaction of the pipeline with the dragging anchor can be divided into two stages. Firstly,
the anchor hits the pipeline with its kinetic energy. The outcome here will be just a break of the
coating, since steel pipe absorbs the impact energy. The impact energy of dragged anchor is
related to the velocity of slowing down vessel. Velocity of decelerating vessels can be
distinguished between different vessel sizes: for large ships it is usually in range of 0.2-0.5 m/s,
and for small ships it is in range of 1.0-1.5 m/s (Hvam, Bruschi, Tommez, & Vitali, 1990).
Secondly, the anchor gets in contact with the pipeline, and applies a point load (snagging load) to
it. In this case the line will be deflected, and the shell will be dented. When the line is snagged by
the anchor, ship kinetic energy will be transferred to the pipeline until the rode, connecting
anchor to the ship, breaks. Besides, anchor can catch the line, rotate over it and get released later.
So, instead of snagging load, a pullover load will be applied to the line. The value of this load is
smaller than value of snagging load. Pullover interaction may result in dents or gouges, and
sometimes in line displacement. The duration of pull-over is 1-10 seconds, while the duration of
anchor snagging is several minutes (Palmer-Jones, Turner, John & Nespeca, 2011).
From the basis of work-energy principle, the work done by all forces acting on a particle (the
work of the resultant force) equals the change in the kinetic energy of the particle (Work
(physics), 2015).
𝑊 = Δ𝐸𝑘 (20)
𝑊 – work done;
𝛥𝐸𝑘 – change in the kinetic energy.
At that time, the work done by a constant force of magnitude F on a point that moves a
displacement 𝑠 in the direction of the force is the product (Work (physics), 2015).
𝑊 = 𝐹 ∙ 𝑠 (21)
The parameter 𝑠 here may be explained as a distance needed to make the vessel to stop.
Interesting to note that the larger the distance traveled by the ship the larger the lateral
displacement of caught pipeline will be. Once the limiting strain is exceeded, the pipeline will
damage after the interaction with the anchor. Moreover, not only the force from the kinetic

Anchor Damage Assessment of Subsea Pipelines
52
energy is to be considered. Another significant parameter is ship’s thrust force. So, the
contribution of both forces becomes a factor for the pipe damage assessment (DNV
Recommended Failure Rates for Pipelines, 2010).
Furthermore, special attention should be given to the chain breaking load, which is the anchor
dragging force applied to the pipeline. Checking the criteria for pipeline damage, it is safe to say
that break load of the chain becomes basic parameter for the determination of damage
occurrence for different cases. Breaking force value is related to the mass of anchor and varies
with the diameter and material grade of the chain. The values of chain breaking load for six main
ship classes are presented below (Table 13):
Table 13: Chain breaking loads for the defined ship classes (DNV Recommended Failure Rates
for Pipelines, 2010)
Class Displacement,
tonnes
Anchor
mass, kg
Chain breaking load, kN
Grade
NV K1
Grade
NV K2
Grade
NV K3
I 1500 900 368 389 476
II 3600 1440 581 655 735
III 10000 3060 1220 1370 1540
IV 45000 8700 3230 3610 3990
V 175000 17800 5720 6510 7320
VI 350000 26000 - 9030 10710
4.2.6 Pipeline resistance
Limit state design
Submarine pipelines are to be designed to withstand all the loads acting on them throughout its
design life. Governing principle here is to define an acceptable limit or limit state. Once the
acceptable limit is reached, the pipeline will not satisfy mandatory requirements any more.
Four categories of limit state exist (Karunakaran, 2014):
Ultimate Limit State (ULS) involves the structural integrity or strength. The pipeline is
designed to reach this limit state with very low probability.
o Burst;
o Collapse; local, global and propagating buckling.
Fatigue Limit State (FLS) involves the fatigue damage coming from accumulated cyclic
dynamic loads. The pipeline is designed in such a way, so that its life (considering fatigue
damage) meets or exceeds its design life.
o Currents and waves;
o Slugging.
Serviceability Limit State (SLS) involves the disruption of the pipeline use as planned.
The pipeline is designed to be suitable for normal equipment operations.

Anchor Damage Assessment of Subsea Pipelines
53
o Extreme ovality of cross section;
o Extreme deflection or vibration.
Accidental Limit State (ALS) involves pipeline failure due to accidental (infrequent
loads).
o Dropped objects;
o Incidental overpressure;
o Natural hazards;
o Explosion and/or fire.
One of the fundamentals of Limit State Design is Load and Resistance Factor Design (LRFD)
format (Figure 31) (DNV-OS-F101, 2013). The principle is to verify that the design resistance is
not exceeded by the design load effects:
𝑓 ((𝐿𝑆𝑑
𝑅𝑅𝑑)𝑖) ≤ 1 (22)
𝐿𝑆𝑑 – design load;
𝑅𝑅𝑑 – design resistance;
𝑖 – loading type.
𝐿𝑆𝑑 = 𝐿𝐹 ∙ 𝛾𝐹 ∙ 𝛾𝐶 + 𝐿𝐸 ∙ 𝛾𝐸 + 𝐿𝐼 ∙ 𝛾𝐹 ∙ 𝛾𝐶 + 𝐿𝐴 ∙ 𝛾𝐴 ∙ 𝛾𝐶 (23)
𝑅𝑅𝑑 =𝑅𝑐(𝑓𝑐,𝑡𝑐,𝑓0)
𝛾𝑚∙𝛾𝑆𝐶 (24)
𝛾𝐹, 𝛾𝐶 , 𝛾𝐸 , 𝛾𝐶 – load factors;
𝛾𝑚, 𝛾𝑆𝐶 – resistance factors;
𝐿𝑐 – characteristic load;
𝑅𝑐 – characteristic resistance;
𝑓𝑐 – characteristic material strength;
𝑡𝑐 – characteristic thickness;
o 𝑓0 – out-of-roundness of the pipe.
Figure 31: Fundamentals of Limit State Design

Anchor Damage Assessment of Subsea Pipelines
54
Pipeline capacity
As found above, large impact forces and snagging loads are applied to the pipeline during the
interaction with the anchor. Even if the pipeline is designed properly, no one can exclude
occurrence of failures due to external hazards that can introduce large forces and moments to the
pipe.
Capacity of the pipeline is heavily dependent on the amount of bending moment, axial force
(tensile or compressive) and pressure (internal or external). These loads can affect the pipeline
integrity singularly or in combination. Possible effects of pure loads are shown in Table 14 (Bai,
2001; Hauch & Bai, 2000).
Table 14: Pure load case description
Pure load and effect
on the pipeline
Effect description
Bending moment
Increased ovalisation of the cross-section;
Increased pipe wall stress;
Cross-sectional collapse;
Low D/t leads to failure on the tensile side of the pipe;
High D/t leads to failure (inward buckling) on the compressive
side of the pipe.
𝑀𝑙 = (1.05 − 0.0015𝐷
𝑡) ∙ 𝑆𝑀𝑌𝑆 ∙ 𝐷2 ∙ 𝑡 (25)
𝑀𝑙– ultimate bending moment for pure bending;
𝑀𝑙 – average diameter;
𝑡 – wall thickness;
𝑆𝑀𝑌𝑆 – specified minimum yield strength in longitudinal direction.
External pressure
The deviation from circular to elliptical form;
Total cross-sectional collapse;
Radial displacement;
Low D/t leads to cross-section yield;
High D/t leads to elastic buckling.
𝑃𝑙3 − 𝑃𝑒𝑙 ∙ 𝑃𝑙
2 − (𝑃𝑝2 + 𝑃𝑒𝑙 ∙ 𝑃𝑃 ∙ 𝑓0 ∙
𝐷
𝑡𝑐𝑜𝑟𝑟) ∙ 𝑃𝑙 + 𝑃𝑒𝑙 ∙ 𝑃𝑝
2 = 0
𝑃𝑒𝑙 =2𝐸
(1−𝜗2)∙ (𝑡𝑐𝑜𝑟𝑟
𝐷)3
(27)
𝑃𝑝 = 𝜂𝑓𝑎𝑏 ∙ 𝑆𝑀𝑌𝑆 ∙2𝑡𝑐𝑜𝑟𝑟
𝐷 (28)
𝑡𝑐𝑜𝑟𝑟 =𝑡−𝑑
1−𝑑
𝑡∙√1+0.8(𝐿
√𝐷∙𝑡)2
(29)
𝑃𝑙 –ultimate external overpressure (collapse pressure);
𝑃𝑒𝑙 – elastic collapse pressure;
𝑃𝑝 – plastic collapse pressure;
𝑓0 – initial out-of-roundness;
𝑓0 - average diameter;

Anchor Damage Assessment of Subsea Pipelines
55
𝑡 – wall thickness;
𝑡𝑐𝑜𝑟𝑟 – corrosion thickness;
𝑑 – defect depth;
𝐿 - defect length;
𝑆𝑀𝑌𝑆 – specified minimum yield strength in hoop direction;
𝐸 – Young’s modulus;
𝜐 – Poisson’s ratio;
𝜂𝑓𝑎𝑏 – material strength de-rating factor.
Internal pressure
Bursting and expansion of the pipe cross-section;
Wall thickness decrease.
𝑃𝑏𝑢𝑟𝑠𝑡 = 0.5(𝑆𝑀𝑇𝑆 + 𝑆𝑀𝑌𝑆) ∙2∙𝑡𝑐𝑜𝑟𝑟
𝐷 (30)
𝑃𝑏𝑢𝑟𝑠𝑡 – ultimate internal overpressure (burst pressure);
𝑆𝑀𝑌𝑆 – specified minimum yield strength in hoop direction;
𝑆𝑀𝑇𝑆 – specified minimum tensile strength in hoop direction;
𝐷 - average diameter;
𝑡𝑐𝑜𝑟𝑟 – corrosion thickness.
Tensile longitudinal
force
Pipe bursting;
Wall thinning;
Narrowed pipe cross-section.
𝐹𝑙 = 0.5(𝑆𝑀𝑇𝑆 + 𝑆𝑀𝑌𝑆) ∙ (𝜋 − (1 − 𝑘𝑙) ∙ 𝛽) ∙ 𝐷 ∙ 𝑡 (31)
𝑘𝑙 = (1 −𝑑
𝑡) ∙ (1 +
𝑑
𝐷) (32)
𝐹𝑙 – ultimate true longitudinal force for pure tension;
𝐷 - average diameter;
𝑡 – wall thickness;
𝑘𝑙 – constant depending on defect size;
𝑆𝑀𝑌𝑆 – specified minimum yield strength in longitudinal direction;
𝑆𝑀𝑇𝑆 – specified minimum tensile strength in longitudinal direction;
𝛽 – defect width;
𝑑 – defect depth.
Compressive
longitudinal force
Euler or local buckling.
Ultimate compressive force is found by the previous equation with the
opposite sign.
Along with the single loads mentioned above, the pipeline is usually subjected to the combined
loading (e.g. pressure, moment, tension) as very often happens during the anchor dragging
(hooking) event (Figure 32). In fact, there are a lot of analyses focused on the capacity of
pipelines to resist plastic collapse and/or geometrical instabilities. Due to great numerical and
experimental approach of these studies some parametric equations are developed in order to
predict pipeline geometrical and mechanical behavior under different modes of combined
loading (Table 15) (Kenedi, Borges & Vaz, 2009).

Anchor Damage Assessment of Subsea Pipelines
56
Figure 32: Pipe exposed to the pressure, bending moment and axial force (Bai, Igland & Moan,
1992)
Table 15: Combined load case description
Combined loading Expression for the evaluation of pipeline strength capacity
Axial force – bending
moment (Bai, Igland
& Moan, 1993)
𝑀
𝑀𝑐− cos (
𝜋
2∙𝑁
𝑁𝑐) = 0 (33)
𝑀𝑐 – ultimate bending moment capacity;
𝑁𝑐 – ultimate true longitudinal force capacity.
Axial force – pressure
(Bai, 2001) (𝜎𝑙
𝜎𝑙𝑙)2
− 2𝛼 ∙𝜎𝑙∙𝜎ℎ
𝜎𝑙𝑙∙𝜎ℎ𝑙+ (
𝜎ℎ
𝜎ℎ𝑙)2
= 1 (34)
𝜎𝑙 – longitudinal stress;
𝜎ℎ – hoop stress;
𝜎𝑙𝑙 – limit longitudinal stress for pure longitudinal force;
𝜎ℎ𝑙 – limit hoop stress for pure pressure;
𝛼 - correction factor depending on the ratio between the limit stress in
the longitudinal and hoop direction correspondingly.
Pressure – bending
moment (Bai &
Hauch, 2001)
(𝑀
𝑀𝑐)2
+ (𝑃
𝑃𝑐)2
≤ 1 (35)
𝑀𝑐 – ultimate bending moment capacity;
𝑃𝑐 – ultimate pressure capacity.
Pressure – axial force
– bending moment
(Nozarian, 2011) 𝑀 = 𝑀𝑐 ∙ √1 − (1 − 𝛼2) ∙ (𝑃
𝑃𝑐)2
∙ cos
(
𝜋2∙
(𝑁
𝑁𝑐−𝛼∙
𝑃
𝑃𝑐)
√1−(1−𝛼2)∙(𝑃
𝑃𝑐)2
)
(36)
𝑀𝑐 – ultimate bending moment capacity;
𝑃𝑐 – ultimate pressure capacity;
𝑁𝑐 – ultimate true longitudinal force capacity.
Design check
One of the serious outcomes of excessive combined loading, which is often observed because of
pull-over-hooking scenario, is pipeline local buckling. Local buckling occurs when loads applied
to the pipeline are equal to or greater than its internal resistance over cross-section. Two design
criteria for local buckling are proposed by Offshore Standard DNV-OS-F101 (2013):

Anchor Damage Assessment of Subsea Pipelines
57
Load Controlled Condition (LCC). The pipeline response is governed by the loads.
o Combined loading: internal overpressure, bending moment, effective axial force.
{𝛾𝑚 ∙ 𝛾𝑆𝐶 ∙|𝑀𝑆𝑑|
𝛼𝑐∙𝑀𝑝(𝑡)+ {𝛾𝑚 ∙ 𝛾𝑆𝐶 ∙
𝑆𝑆𝑑(𝑝𝑖)
𝛼𝑐∙𝑆𝑝(𝑡)}2
}
2
+ (𝛼𝑝 ∙𝑝𝑖−𝑝𝑒
𝛼𝑐∙𝑝𝑏(𝑡))2
≤ 1 (37)
𝛾𝑚, 𝛾𝑆𝐶 – resistance factors;
𝛼𝑐 – flow stress parameter;
𝑀𝑆𝑑 – design moment;
𝑆𝑆𝑑 – design effective axial force;
𝑝𝑖 – internal pressure;
𝑝𝑒 – external pressure;
𝑝𝑏 – burst pressure
𝑆𝑝, 𝑀𝑝 – plastic capacities of pipe.
o Combined loading: external overpressure, bending moment, effective axial force.
{𝛾𝑚 ∙ 𝛾𝑆𝐶 ∙|𝑀𝑆𝑑|
𝛼𝑐∙𝑀𝑝(𝑡)+ {𝛾𝑚 ∙ 𝛾𝑆𝐶 ∙
𝑆𝑆𝑑(𝑝𝑖)
𝛼𝑐∙𝑆𝑝(𝑡)}2
}
2
+ (𝛾𝑚 ∙ 𝛾𝑆𝐶 ∙𝑝𝑒−𝑝𝑚𝑖𝑛
𝛼𝑐∙𝑝𝑐(𝑡))2
≤ 1 (38)
𝑝𝑚𝑖𝑛 – minimum internal pressure that can be sustained;
𝑝𝑐 – characteristic collapse pressure.
Displacement Controlled Condition (DCC). The pipeline response is governed by
geometric displacements.
o Combined loading: longitudinal compressive strain (bending moment and axial force)
and internal overpressure.
휀𝑆𝑑 ≤ 휀𝑅𝑑 =𝑐(𝑡,𝑝𝑚𝑖𝑛−𝑝𝑒)
𝛾𝑒 (39)
휀𝑐(𝑡, 𝑝𝑚𝑖𝑛 − 𝑝𝑒) = 0.78 ∙ (𝑡
𝐷− 0.01) ∙ (1 + 5.75 ∙
𝑝𝑚𝑖𝑛−𝑝𝑒
𝑝𝑏(𝑡)) ∙ 𝛼ℎ
−1.5 ∙ 𝛼𝑔𝑤 (40)
휀𝑆𝑑 – design compressive strain;
휀𝑐 – characteristic bending strain;
𝛼ℎ – strain hardening;
𝛼𝑔𝑤 – girth weld factor;
𝛾𝑒 – strain resistance factor.
o Combined loading: longitudinal compressive strain (bending moment and axial force)
and external overpressure.
(
𝜀𝑆𝑑𝜀𝑐(𝑡,0)
𝛾𝑒)
0.8
+
𝑝𝑒−𝑝𝑚𝑖𝑛𝑝𝑐(𝑡)
𝛾𝑚∙𝛾𝑆𝐶≤ 1 (41)
Anchor Damage Assessment of Subsea Pipelines
58
In case if these criteria are not met, the pipeline will have increased ovalisation and experience
collapse of its cross-section or even rupture.
Global and local scale performance
In order to analyze the pipeline response, it is necessary to distinguish between global and local
scale performances.
Global scale analysis is usually done to estimate the pipeline displacement while being
hooked and dragged by the anchor. The emphasis here is put on recognizing the force-
displacement relationship.
Local scale analysis is performed in order to understand how severe the damage is in the
area of pipe-anchor interference. The accent here is put on a strain and dent size
estimation.
NB. A global scale analysis will be done in the following assessment study.
Summarizing the part about ship anchoring activity and its effect on submarine pipelines and
cables one can see how many basic damage criteria and key factors are to be taken into account.
Combination of vessel and anchor arrangement parameters, marine activity details and pipeline
data are very helpful for the assessment of pipeline potential danger. Even if the pipeline is
designed in accordance with all the standards, codes and guidelines, no one can exclude the fact
that pipeline will experience a failure due to uncontrolled anchor drop and loss while the ship is
in underway. Hence, it is of great importance to specify all the significant criteria that shall be
met during each stage of pipeline life cycle. Moreover, different sensitivity cases are to be
performed and analyzed in order to develop a generic conclusion with respect to the pipeline
response and damage frequency of pipeline system. Analysis on pipeline-anchor interference
scenario based on the theoretical approach written above is going to be done and presented in the
following chapter.
4.2.7 Pipeline protection
In case if the pipeline has potential to be hooked and damaged by the dragging anchors, some
pipeline protection measures can be implemented then (DNV-RP-F107, 2010):
1. Concrete coating;
2. Polymer coating;
3. Gravel dump and natural backfill;
4. Protection structures;
5. Trenching;
6. Higher wall thickness.

Anchor Damage Assessment of Subsea Pipelines
59
CHAPTER 5. CASE STUDY - DRAGGED ANCHOR INTERFERENCE ASSESSMENT
5.1 SCOPE OF THE CASE STUDY
The scope of the “Dragged anchor interference assessment” case study is to present the
methodology of anchor damage assessment of subsea pipelines. Several sensitivity cases are to
be performed in order to gain a complete understanding of pipe-anchor interaction scenario.
Detailed step by step procedure of dragged anchor interference investigation is given below.
1. AIS data processing based on the typical pipeline route: collection of data for different
ship/vessel types with respect to IMO-no, name, type, EL, GT, speed and vessel
coordinates.
2. Data analyzes: development of various diagrams, graphs and distribution charts for a
considered pipeline route on the basis of collected data.
3. Anchor hook criteria check: relation between pipeline diameter and anchor size (2
configurations).
4. Anchor hit criteria check (MATLAB): relation between vessel speed, chain length and
water depth.
5. Carrying out a model scale test on anchor towing depth: scaling of required physical
values; preparation for the experiment; comparison of experimental data and analytical
solution (MATLAB).
6. Establishment of anchor pulling consequences in accordance with global scale analyses
performed in SIMLA; determination of pipeline response; pipeline capacity check (or
anchor damage criteria) for both 40 and 16-inch pipelines.
7. Frequencies of pipe-anchor interaction modes in accordance with the criteria
(hook/hit/damage) checks for 40 and 16-inch pipelines.
8. Methodology description;
9. General conclusions with regard to pipeline properties, water depth, vessel speed and EL:
whether the pipeline is hooked/hit/damaged by the anchor; total frequency estimation.
5.2 DEFINED DATA
5.2.1 Pipeline data
In order to make comprehensive study on subsea pipeline damage assessment in accordance with
the designated objectives, the Pipeline 1 is chosen for that purpose. The Pipeline 1 is a 40-inch
gas transporting line, running through the sector of the North Sea. All the relevant information
concerning pipeline design and operational characteristics are provided by Statoil Company.
Generalized data of Pipeline 1 is prepared and presented in Table 16.

Anchor Damage Assessment of Subsea Pipelines
60
Table 16: Data of Pipeline 1
Item Unit Value
Location - The North Sea
Length km 305
Design life years 50
Nominal size inch 40
Internal Diameter mm 966.4
Wall thickness mm 26.1
Material - X-65
Transport medium - Dry gas
Corrosion Allowance mm 0
Corrosion coating - Asphalt enamel
Protection and weight coating - Concrete coating
Density of gas kg/m3 177
Density of corrosion coating kg/m3 1300
Density of concrete kg/m3 3040
The seabed profile of Pipeline 1 is shown below (Figure 33). One can see how the water depth
varies with each KP section of the pipe route.
Figure 33: Seabed depth profile of the Pipeline 1
Part of the Pipeline 1 route and extracted AIS ship track density plot for the specified area is
presented in Figure 34.
-175
-350
-132 -78
-400
-350
-300
-250
-200
-150
-100
-50
0
0-1
0
15
-20
25
-30
35
-40
45
-50
55
-60
65
-70
75
-80
85
-90
95
-10
0
10
5-1
10
11
5-1
20
12
5-1
30
13
5-1
40
14
5-1
50
15
5-1
60
16
5-1
70
17
5-1
80
18
5-1
90
19
5-2
00
20
5-2
10
21
5-2
20
22
5-2
30
23
5-2
40
24
5-2
50
25
5-2
60
26
5-2
70
27
5-2
80
28
5-2
90
29
5-3
00
Wat
er
de
pth
, m
KP section, km
Seabed Depth Profile Pipeline 1

Anchor Damage Assessment of Subsea Pipelines
61
Figure 34: Part of the Pipeline 1 route and ship track density plot
North Sea

Anchor Damage Assessment of Subsea Pipelines
62
5.2.2 AIS data
Automatic Identification System is an automatic tracking system used on ships and by vessel
traffic services (VTS) for identifying and locating vessels by electronically exchanging data with
other nearby ships, AIS base stations, and satellites (Automatic Identification System, 2105).
There are a lot of services that provide a real-time and historical AIS data. Such kind of
databases is very useful for the extraction of important information about ships: individual
identification number, position, destination, speed, etc. As explained before, once the
identification number of passing ship is known, one can get any particularities of these vessels.
Moreover, ship traffic pattern around an area of interest can be obtained as well (Figure 35).
Figure 35: Illustration of ship track density plot retrieved from MarineTraffic.com
All the AIS data required for the assessment of pipeline-anchor interaction scenario have been
provided by the Statoil Company. A total of 127006 table lines contained in the data list describe
the motion of 824 vessels. For the simplification of data processing, all the information has been
exported to the EXCEL sheet (Figure 36).
Figure 36: EXCEL data list example
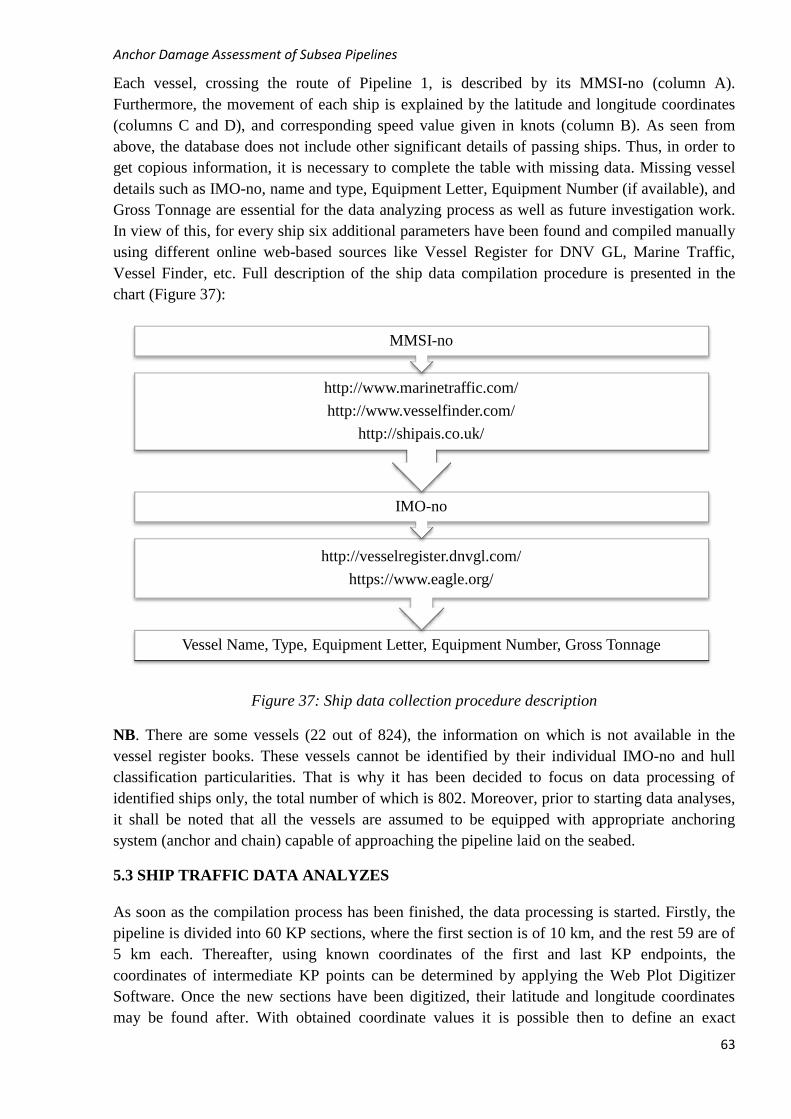
Anchor Damage Assessment of Subsea Pipelines
63
Each vessel, crossing the route of Pipeline 1, is described by its MMSI-no (column A).
Furthermore, the movement of each ship is explained by the latitude and longitude coordinates
(columns C and D), and corresponding speed value given in knots (column B). As seen from
above, the database does not include other significant details of passing ships. Thus, in order to
get copious information, it is necessary to complete the table with missing data. Missing vessel
details such as IMO-no, name and type, Equipment Letter, Equipment Number (if available), and
Gross Tonnage are essential for the data analyzing process as well as future investigation work.
In view of this, for every ship six additional parameters have been found and compiled manually
using different online web-based sources like Vessel Register for DNV GL, Marine Traffic,
Vessel Finder, etc. Full description of the ship data compilation procedure is presented in the
chart (Figure 37):
Figure 37: Ship data collection procedure description
NB. There are some vessels (22 out of 824), the information on which is not available in the
vessel register books. These vessels cannot be identified by their individual IMO-no and hull
classification particularities. That is why it has been decided to focus on data processing of
identified ships only, the total number of which is 802. Moreover, prior to starting data analyses,
it shall be noted that all the vessels are assumed to be equipped with appropriate anchoring
system (anchor and chain) capable of approaching the pipeline laid on the seabed.
5.3 SHIP TRAFFIC DATA ANALYZES
As soon as the compilation process has been finished, the data processing is started. Firstly, the
pipeline is divided into 60 KP sections, where the first section is of 10 km, and the rest 59 are of
5 km each. Thereafter, using known coordinates of the first and last KP endpoints, the
coordinates of intermediate KP points can be determined by applying the Web Plot Digitizer
Software. Once the new sections have been digitized, their latitude and longitude coordinates
may be found after. With obtained coordinate values it is possible then to define an exact
Vessel Name, Type, Equipment Letter, Equipment Number, Gross Tonnage
http://vesselregister.dnvgl.com/
https://www.eagle.org/
IMO-no
http://www.marinetraffic.com/
http://www.vesselfinder.com/
http://shipais.co.uk/
MMSI-no
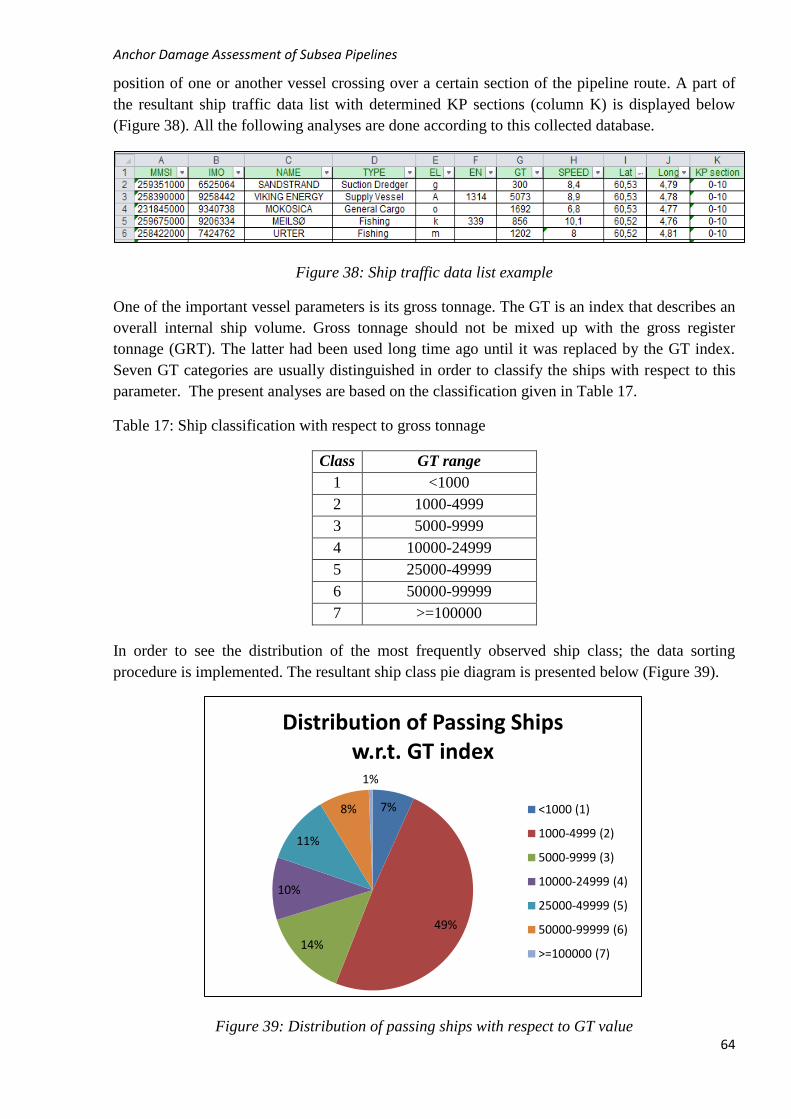
Anchor Damage Assessment of Subsea Pipelines
64
position of one or another vessel crossing over a certain section of the pipeline route. A part of
the resultant ship traffic data list with determined KP sections (column K) is displayed below
(Figure 38). All the following analyses are done according to this collected database.
Figure 38: Ship traffic data list example
One of the important vessel parameters is its gross tonnage. The GT is an index that describes an
overall internal ship volume. Gross tonnage should not be mixed up with the gross register
tonnage (GRT). The latter had been used long time ago until it was replaced by the GT index.
Seven GT categories are usually distinguished in order to classify the ships with respect to this
parameter. The present analyses are based on the classification given in Table 17.
Table 17: Ship classification with respect to gross tonnage
Class GT range
1 <1000
2 1000-4999
3 5000-9999
4 10000-24999
5 25000-49999
6 50000-99999
7 >=100000
In order to see the distribution of the most frequently observed ship class; the data sorting
procedure is implemented. The resultant ship class pie diagram is presented below (Figure 39).
Figure 39: Distribution of passing ships with respect to GT value
7%
49%
14%
10%
11%
8%
1%
Distribution of Passing Ships w.r.t. GT index
<1000 (1)
1000-4999 (2)
5000-9999 (3)
10000-24999 (4)
25000-49999 (5)
50000-99999 (6)
>=100000 (7)

Anchor Damage Assessment of Subsea Pipelines
65
It is visible that the most commonly encountered ship class is Class 2 (49%), the GT value of
which varies between 1000 and 4999. Additionally, 14% of all the vessels fall into the Class 3.
Other classes are distributed almost uniformly, except the last one that is about 1% of all the
vessels passing the line.
As explained before, all the ships have their individual anchor arrangement system specified by
either Equipment Number or Equipment Letter. The larger the vessel, the greater the value of the
EN will be. This is quite logical, because the EN value is heavily dependent on vessel
displacement and other parameters. In addition to the EN, the vessel can be characterized by the
EL, which is found in accordance with the generalized Equipment Tables (Figure 22). Since
compiled ship traffic database contains information about vessels’ gross tonnage, it is interesting
to show an illustrative case of the relation between GTs and ELs correspondingly (Figure 40).
Figure 40: Vessel GT and EL relation illustration
The next part of this case study is devoted to the juxtaposition of every KP section with the ships
classified by the GT index. Furthermore, the seabed profile is also taken into account. The water
depth profile helps to understand, what kind of sections are more susceptible to anchor hitting
event. Thus, Figure 41 demonstrates which vessel classes are in the majority with regard to
designated KP section endpoints and proper values of the water depth.
-10000
10000
30000
50000
70000
90000
110000
130000
f i l k n l o m p p o q s t t u u v z w B y A E D E I K L N O P T V Z
GT
EL
Gross Tonnage vs Equipment Letter

Anchor Damage Assessment of Subsea Pipelines
66
Figure 41: Total number of crossing ships within certain KP sections and defined water depth
-400
-350
-300
-250
-200
-150
-100
-50
0
0
20
40
60
80
100
120
0-1
0
15
-20
25
-30
35
-40
45
-50
55
-60
65
-70
75
-80
85
-90
95
-10
0
10
5-1
10
11
5-1
20
12
5-1
30
13
5-1
40
14
5-1
50
15
5-1
60
16
5-1
70
17
5-1
80
18
5-1
90
19
5-2
00
20
5-2
10
21
5-2
20
22
5-2
30
23
5-2
40
24
5-2
50
25
5-2
60
26
5-2
70
27
5-2
80
28
5-2
90
29
5-3
00
Wat
er
de
pth
, m
Nu
mb
er
of
cro
ssin
g sh
ips
KP sections
Total Number of Ship Crossings within Pipleine 1 route KP sections
>=100000 (7)
50000-99999 (6)
25000-49999 (5)
10000-24999 (4)
5000-9999 (3)
1000-4999 (2)
<1000 (1)
SEABED DEPTH PROFILE

Anchor Damage Assessment of Subsea Pipelines
67
Figure 41 shows that the highest marine activity falls between pipeline KP sections 0-60 and 65-
95, where ship Class 2 (GT 1000-4999) is observed more often than other ship classes.
According to this evaluation, the line between those endpoints may be subjected to incident
coming from dragging anchor. However, these pipeline sections are situated in the deepest areas.
So, at this stage no one can draw precise conclusion whether the ship anchors are capable of
hooking the pipeline or not.
Not only gross tonnage is to be included into assessment, but an equipment letter shall be
considered as well. The following column chart (Figure 42) points out the number of all the
equipment letters assigned to the defined ships. Another significant detail here is speed value,
which has been retrieved from the AIS ship database. In order to simplify the analyses, an
average speed for a corresponding equipment specification is calculated and used for the
following estimation work.
Figure 42: Total number of various ELs with the corresponding average vessel speed value
(knots)
In general, 49 different Equipment Letters characterize given passing ships. From the Figure 42
above it is understood that the most commonly detected crossings are done by the ships with the
Equipment Letter “o”, which accounts for 9% (75 out of 802) of total number of passing over the
pipe vessels. Both the variation of the average speed (black line) and medium speed (red line) are
illustrated on the chart above.
There are three groups of Latin letters used for the classification of anchor arrangement. The
explanation of each group is presented in the Figure 43. Small letters usually point small
dimension anchors (120-3780 kg), while capital letters and letters marked with the star denote
large (4050-16900 kg) and huge (17800-46000 kg) anchoring systems. Along with the anchor
mass, the chain length and diameter changes as well.
75
0
2
4
6
8
10
12
14
0
10
20
30
40
50
60
70
80
e g i k m o q s u w y A C E G I K M O Q T V Y
Ave
rage
sp
ee
d, k
no
ts
Nu
mb
er
of
ship
s w
ith
th
e E
L
EL
EL and Average Ship Speed
EQUIPMENT LETTER
AVERAGE SPEED

Anchor Damage Assessment of Subsea Pipelines
68
Figure 43: Equipment Specification Letter grouping
Development of the charts and diagrams gives a strong notion of ship distribution along the route
of Pipeline 1. Along with the specified KP sections, the seabed profile is considered. The water
depth values over the Pipeline 1 vary significantly, especially in 0-150 KP sectors. Additionally,
the densest area in terms of the ship traffic volume is in between 0-95 KP sections. It should be
mentioned, that not all the vessel types are capable of getting in contact with the pipe situated in
the deepest areas: the limitation here is the length of the anchor chain and speed of the vessel.
Speaking about the vessel speed, it should also be included into analysis. The combination of
water depth value, chain length and speed is very important for the detailed analyses, which are
going to be discussed in further parts.
Two key vessel parameters are taken as basis for the relevant ship classification algorithms,
namely GT index and Equipment Letter. So that classified ships are included into distribution
charts in order to show which kind of vessels cross one or another KP pipe section. The most
frequently observed class of the ship is Class 2, while the most commonly encountered EL is
letter “o”.
NB. Additional tables used for the present analysis are included in the Appendix.
Summarizing this part, one shall see how many details are essential for the data analyzing
process. The more particularities are taken into account during the initial steps, the more
comprehensive assessment can be done hereafter.
5.4 ANCHOR HOOK CRITERIA CHECK
Not only the anchor mass, but its geometrical configuration is critical for the assessment of pipe-
anchor interaction. It is obvious that small dimension vessel equipment is not even capable of
hooking large diameter pipelines. That is precisely why hook criteria check shall be performed.
As written in the previous chapter, there are mainly two ways of hooking the line. The pipeline
may either stick between one fluke and anchor shank or between the plane of two flukes and
shank of the anchor. Two sketches demonstrating the geometrical interpretation of hooking event
are given before in Figure 24.
NB. For the present case study it is assumed that every moving ship is equipped with the
stockless anchor, the information on which is easily found in the Rules for Ship document and
relevant catalogues.
a0-z
A-Z
A*-O*
Equipment Letter
Grouping (I, II, III)

Anchor Damage Assessment of Subsea Pipelines
69
One of the most popular and conventional stockless anchor types is Spek anchor, which is
widely used for the positioning of different vessels. Spek anchor is taken as basic example for
the study and criteria check. The minimum size of anchor, capable of catching the Pipeline 1, can
be determined for both cases by applying the formulas in the Tables 18 and 19. The formulas
present the most conservative way of hook criteria check.
Table 18: I case Spek stockless anchor hook check
Formula and geometry of hook Item Symbol Unit Value
𝐶⊥ ≥ 𝑑/2 (42)
Angle between one fluke and
anchor shank 𝛼 deg 27
Pipeline diameter 𝑑 mm 1018.6
Projected fluke length 𝐶⊥ mm 509.3
Fluke length 𝐶 mm 1138.8
E-parameter (Figure 44) 𝐸 mm 1018.6
Table 19: II case Spek stockless anchor hook check
Formula and geometry of hook Item Symbol Unit Value
𝐶′⊥ ≥ 𝑑/2 (43)
Angle between the plane of
two flukes and the shank 𝛽 deg 40
Pipeline diameter 𝑑 mm 1018.6
Projected median 𝐶′⊥ mm 509.3
Median of flukes plane 𝐶′ mm 792.3
E-parameter (Figure 44) 𝐸 mm 792.3
d
d
E
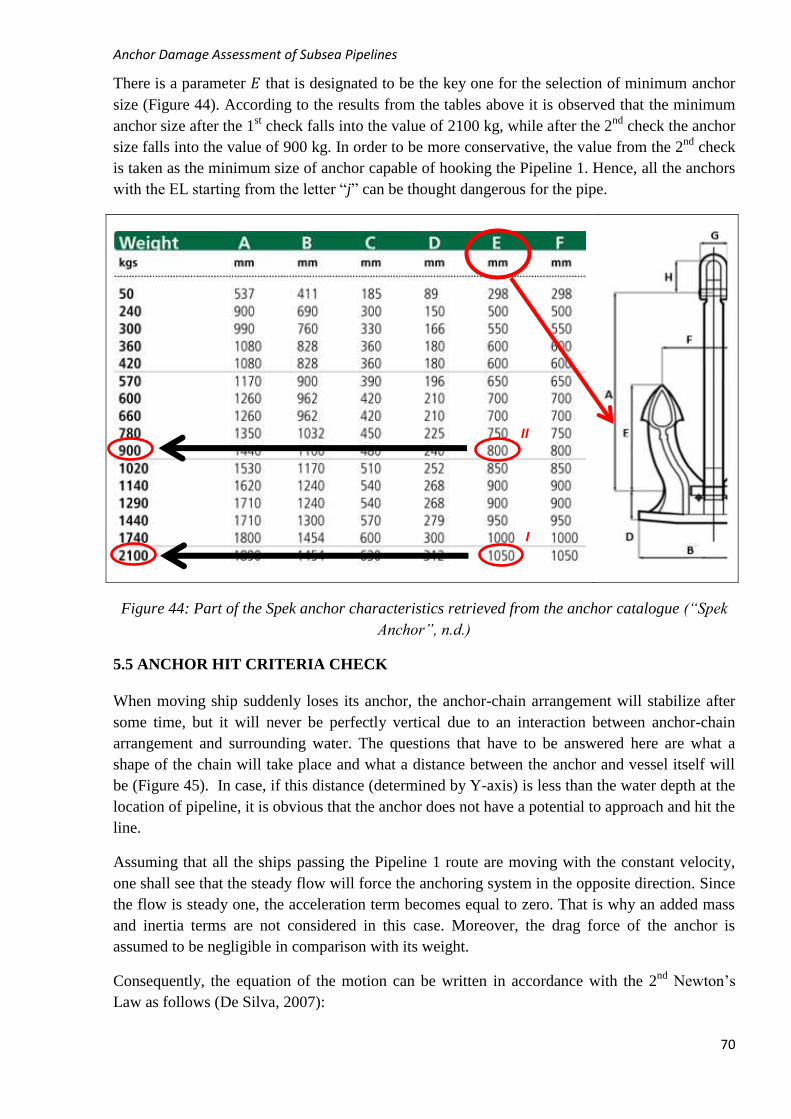
Anchor Damage Assessment of Subsea Pipelines
70
There is a parameter 𝐸 that is designated to be the key one for the selection of minimum anchor
size (Figure 44). According to the results from the tables above it is observed that the minimum
anchor size after the 1st check falls into the value of 2100 kg, while after the 2
nd check the anchor
size falls into the value of 900 kg. In order to be more conservative, the value from the 2nd
check
is taken as the minimum size of anchor capable of hooking the Pipeline 1. Hence, all the anchors
with the EL starting from the letter “j” can be thought dangerous for the pipe.
Figure 44: Part of the Spek anchor characteristics retrieved from the anchor catalogue (“Spek
Anchor”, n.d.)
5.5 ANCHOR HIT CRITERIA CHECK
When moving ship suddenly loses its anchor, the anchor-chain arrangement will stabilize after
some time, but it will never be perfectly vertical due to an interaction between anchor-chain
arrangement and surrounding water. The questions that have to be answered here are what a
shape of the chain will take place and what a distance between the anchor and vessel itself will
be (Figure 45). In case, if this distance (determined by Y-axis) is less than the water depth at the
location of pipeline, it is obvious that the anchor does not have a potential to approach and hit the
line.
Assuming that all the ships passing the Pipeline 1 route are moving with the constant velocity,
one shall see that the steady flow will force the anchoring system in the opposite direction. Since
the flow is steady one, the acceleration term becomes equal to zero. That is why an added mass
and inertia terms are not considered in this case. Moreover, the drag force of the anchor is
assumed to be negligible in comparison with its weight.
Consequently, the equation of the motion can be written in accordance with the 2nd
Newton’s
Law as follows (De Silva, 2007):
II
I

Anchor Damage Assessment of Subsea Pipelines
71
∑ �⃗� = 𝑚�⃗�(𝑙, 𝑡) = 0⃗⃗ (44)
𝑚�⃗�(𝑙, 𝑡) =𝜕
𝜕𝑙(𝑇𝑡) + 𝑓𝑛 �⃗⃗� + 𝑓𝑡𝑡 + 𝑚𝑔�⃗⃗� (45)
0⃗⃗ =𝜕
𝜕𝑙(𝑇𝑡) + 𝑓𝑛 �⃗⃗� + 𝑓𝑡𝑡 + 𝑚𝑔�⃗⃗� (46)
𝑚 – mass of the chain per unit length;
𝑔 – acceleration of gravity;
�⃗�(𝑙, 𝑡) – acceleration of the chain;
𝑙 – coordinate along the anchor chain;
𝑇 – tension force;
𝑓𝑛 – normal drag force per unit length;
𝑓𝑡 – tangential drag force per unit length;
�⃗⃗� – normal unit vector;
𝑡 – tangential unit vector;
�⃗⃗� – unit vector in the direction of gravity.
Figure 45: Anchor-chain system configuration illustration
As seen from the formula, there are two components of drag force: normal (dominant) and
tangential. The formulas on both of them are presented below:
𝑓𝑛 = 𝐶𝐷𝑛 ∙ 𝜌𝑤 ∙𝐷
2∙ 𝑣2 ∙ 𝐶𝑜𝑠2𝛼 (47)
𝑓𝑡 = 𝐶𝐷𝑡 ∙ 𝜌𝑤 ∙𝐷
2∙ 𝑣2 ∙ 𝑆𝑖𝑛2𝛼 (48)
CDn – normal drag coefficient;
CDt – tangential drag coefficient;
ρw – seawater density;
D – anchor chain diameter;

Anchor Damage Assessment of Subsea Pipelines
72
v – water flow velocity;
𝛼 – angle between the vertical axes and tangential vector.
Normal and tangential drag coefficients of the stud-link and stud less chains are given in the
Offshore Standard DNV-OS-E301 (2010) (Table 20).
Table 20: Anchor chain drag coefficients
Chain types Normal drag coefficient Tangential drag coefficient
Stud-link 2.6 1.4
Stud less 2.4 1.15
To continue with the calculations needed for the criteria check, the equation of motion should be
rewritten in the scalar form:
{
𝑑𝑇
𝑑𝑙− 𝐶𝐷𝑡 ∙ 𝜌𝑤 ∙
𝐷
2∙ 𝑣2 ∙ 𝑆𝑖𝑛2𝛼 −𝑚 ∙ 𝑔 ∙ 𝐶𝑜𝑠𝛼 = 0
−𝑇 ∙𝑑𝛼
𝑑𝑙+ 𝐶𝐷𝑛 ∙ 𝜌𝑤 ∙
𝐷
2∙ 𝑣2 ∙ 𝐶𝑜𝑠2𝛼 −𝑚 ∙ 𝑔 ∙ 𝑆𝑖𝑛𝛼 = 0
(49)
It is a system of two ordinary differential equations that can be solved numerically to find 𝑇(𝑙)
and 𝛼(𝑙). For that purpose, two initial conditions must be specified:
𝑇(0) = 𝑊𝑎𝑛𝑐ℎ𝑜𝑟 (50)
𝛼(0) = 0 (51)
𝑊𝑎𝑛𝑐ℎ𝑜𝑟 – weight of the anchor in the water:
𝑊𝑎𝑛𝑐ℎ𝑜𝑟 = 𝑚𝑎𝑛𝑐ℎ𝑜𝑟 ∙ 𝑔 ∙ (1 −𝜌𝑤
𝜌𝑠𝑡𝑒𝑒𝑙) (52)
In addition to the previous system, the relation between the Cartesian coordinates and angle 𝛼 is
to be included either:
{
𝑑𝑥
𝑑𝑙= 𝑆𝑖𝑛𝛼
𝑑𝑦
𝑑𝑙= 𝐶𝑜𝑠𝛼
(53)
Where the initial conditions are:
𝑥(0) = 0 (54)
𝑦(0) = 0 (55)
Thus, solving the system of four ordinary differential equations with specified set of initial
conditions, it is possible to understand how an equilibrium configuration of anchor-chain
arrangement looks like. Moreover, the distance between the towed anchor and the ship is
determined as well. For the present case study, the anchor towing depth calculation can be done
by applying MATLAB software. With this objective in view, an effort has been made to create
appropriate code. An ode-45 function, based on an explicit Runge-Kutta formula, is included.
According to the Equipment Specification Letter grouping (Figure 43) all 49 various ELs are

Anchor Damage Assessment of Subsea Pipelines
73
taken for the calculation: for every EL the combination of corresponding anchor mass; chain
length, chain diameter; and average speed (in m/s) are put into the prepared code. All the results
have been exported to the EXCEL sheet in order to use them for the development of essential
graphs and future analyses.
Obtained data helps to identify, whether the anchoring systems of given passing ships are
capable of hitting the Pipeline 1 or not. The anchor towing depth variations in terms of different
Equipment Letter groups are illustrated in Figures 46-48.
Figure 46: Tow depth of anchors classified by Small Letters and water depth lines (dashed) of
certain KP sections
Figure 46 shows that not all the anchors classified by Small Letters will reach the sea bottom in
case if passing ships lose their anchors. The majority of intersections are observed only where
the water depth value is about 140 m and less.
Figure 47 demonstrates the same sort of estimation for Capital Letter class of anchors. One can
see that this kind of anchors have the potential to reach even deeper sections of 250 m depth. It is
quite obvious, because larger anchors have longer and heavier chains, which easily approach
even deeper areas.
-400
-350
-300
-250
-200
-150
-100
-50
0
-250 -200 -150 -100 -50 0
Y, m
X, m
Anchor Tow Depth (Small Anchors) e
f
g
h
i
j
k
l
m
n
o
p
q
r
s
t
u
v
w
x
y
z
0-10
15-20
75-80
135-140
175-180
235-240
295-300

Anchor Damage Assessment of Subsea Pipelines
74
Figure 47: Tow depth of anchors classified by Capital Letters and water depth lines (dashed) of
certain KP sections
Finally, an assessment of the 3rd
anchor EL group is presented in Figure 48. In this case the
anchor tow depth is increased up to 280 m. So, almost all the pipeline sections can be reached
and hit by huge anchoring equipment of crossing ships.
Figure 48: Tow depth of anchors classified by Letters marked with star and water depth lines
(dashed) of certain KP sections
-400
-350
-300
-250
-200
-150
-100
-50
0
-300 -250 -200 -150 -100 -50 0
Y, m
X, m
Anchors Tow Depth (Large Anchors) ABCDEFGHIKLMNOPQSTUVXYZ0-1015-2075-80135-140175-180235-240295-300
-400
-350
-300
-250
-200
-150
-100
-50
0
-350 -300 -250 -200 -150 -100 -50 0
Y, m
X, m
Anchor Tow Depth (Huge Anchors) A*
B*
E*
0-10
15-20
75-80
135-140
175-180
235-240
295-300
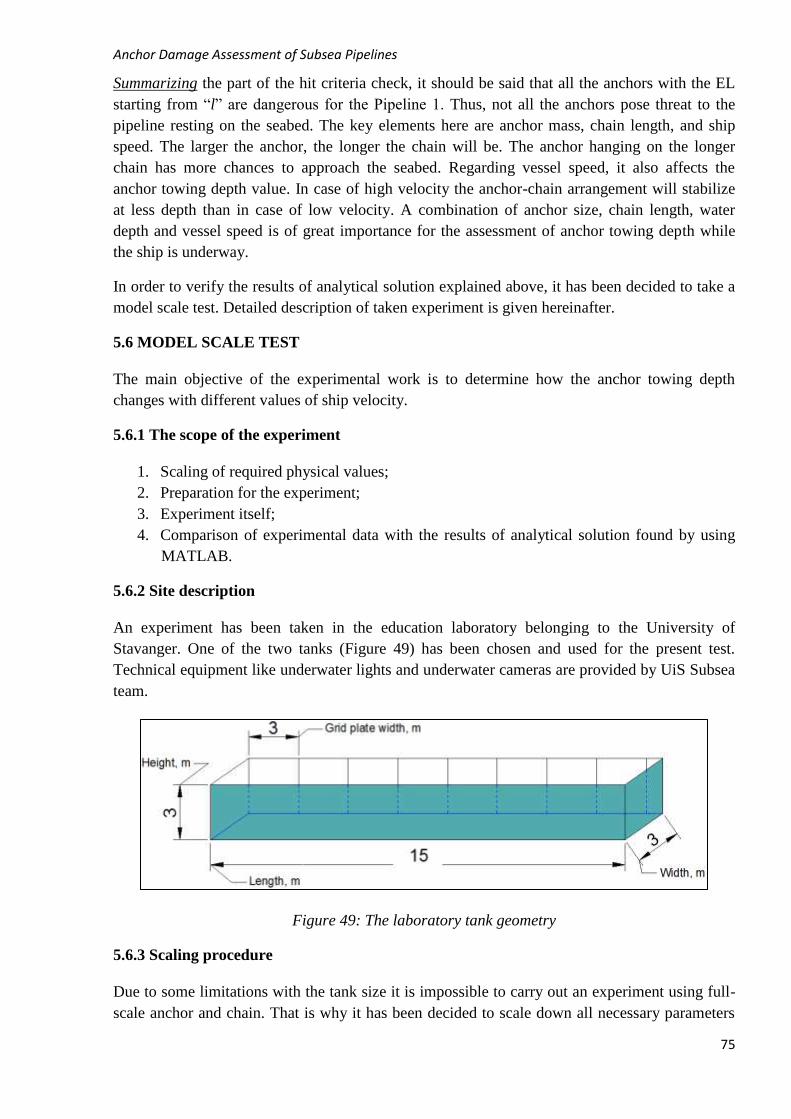
Anchor Damage Assessment of Subsea Pipelines
75
Summarizing the part of the hit criteria check, it should be said that all the anchors with the EL
starting from “l” are dangerous for the Pipeline 1. Thus, not all the anchors pose threat to the
pipeline resting on the seabed. The key elements here are anchor mass, chain length, and ship
speed. The larger the anchor, the longer the chain will be. The anchor hanging on the longer
chain has more chances to approach the seabed. Regarding vessel speed, it also affects the
anchor towing depth value. In case of high velocity the anchor-chain arrangement will stabilize
at less depth than in case of low velocity. A combination of anchor size, chain length, water
depth and vessel speed is of great importance for the assessment of anchor towing depth while
the ship is underway.
In order to verify the results of analytical solution explained above, it has been decided to take a
model scale test. Detailed description of taken experiment is given hereinafter.
5.6 MODEL SCALE TEST
The main objective of the experimental work is to determine how the anchor towing depth
changes with different values of ship velocity.
5.6.1 The scope of the experiment
1. Scaling of required physical values;
2. Preparation for the experiment;
3. Experiment itself;
4. Comparison of experimental data with the results of analytical solution found by using
MATLAB.
5.6.2 Site description
An experiment has been taken in the education laboratory belonging to the University of
Stavanger. One of the two tanks (Figure 49) has been chosen and used for the present test.
Technical equipment like underwater lights and underwater cameras are provided by UiS Subsea
team.
Figure 49: The laboratory tank geometry
5.6.3 Scaling procedure
Due to some limitations with the tank size it is impossible to carry out an experiment using full-
scale anchor and chain. That is why it has been decided to scale down all necessary parameters

Anchor Damage Assessment of Subsea Pipelines
76
of randomly chosen anchor-chain arrangement. Anchor class “z” is taken as full scale model, and
scaling factor 21 is used for scale operation. Parameters of full-scale anchor and chain are
presented in the Tables 21 and 22.
Table 21: Initial data of “z” class Spek anchor (“Spek Anchor”, n.d.)
Item Unit Value
𝑚 kg 3780
𝐴 mm 2430
𝐵 mm 1850
𝐶 mm 810
𝐷 mm 393
𝐸 mm 1350
𝐹 mm 1350
𝐺 mm 310
𝐻 mm 385
𝐴𝑟𝑒𝑓−𝑎 m2 2.95
A rough value of anchor reference area (m2) is found by using the formula:
𝐴𝑟𝑒𝑓−𝑎 = (𝐺 ∙ (𝐴 + 𝐻) + 2 ∙ 𝐸 ∙ (𝐵 − 𝐹) ∙ 𝐶𝑜𝑠(400) + 𝐷 ∙ 𝐵) ∙ 10−6 (56)
Table 22: Initial data of the chain of “z” class Spek anchor (“Stud Link Chain”, n.d.)
Item Unit Value
𝐷 m 0.048
𝐿 m 261.2
𝑤 kg/m 50.4
𝑚 kg 13182.05
𝐴𝑟𝑒𝑓−𝑐 = 𝐷 ∙ 𝐿 m2 12.54
Where the weight of the chain per meter is calculated by the following formulas (“The future of
mooring”, n.d.):
𝑤𝑠𝑡𝑢𝑑−𝑙𝑖𝑛𝑘 = 0.0219 ∙ 𝐷2 (57)
𝑤𝑠𝑡𝑢𝑑 𝑙𝑒𝑠𝑠 = 0.02 ∙ 𝐷2 (58)
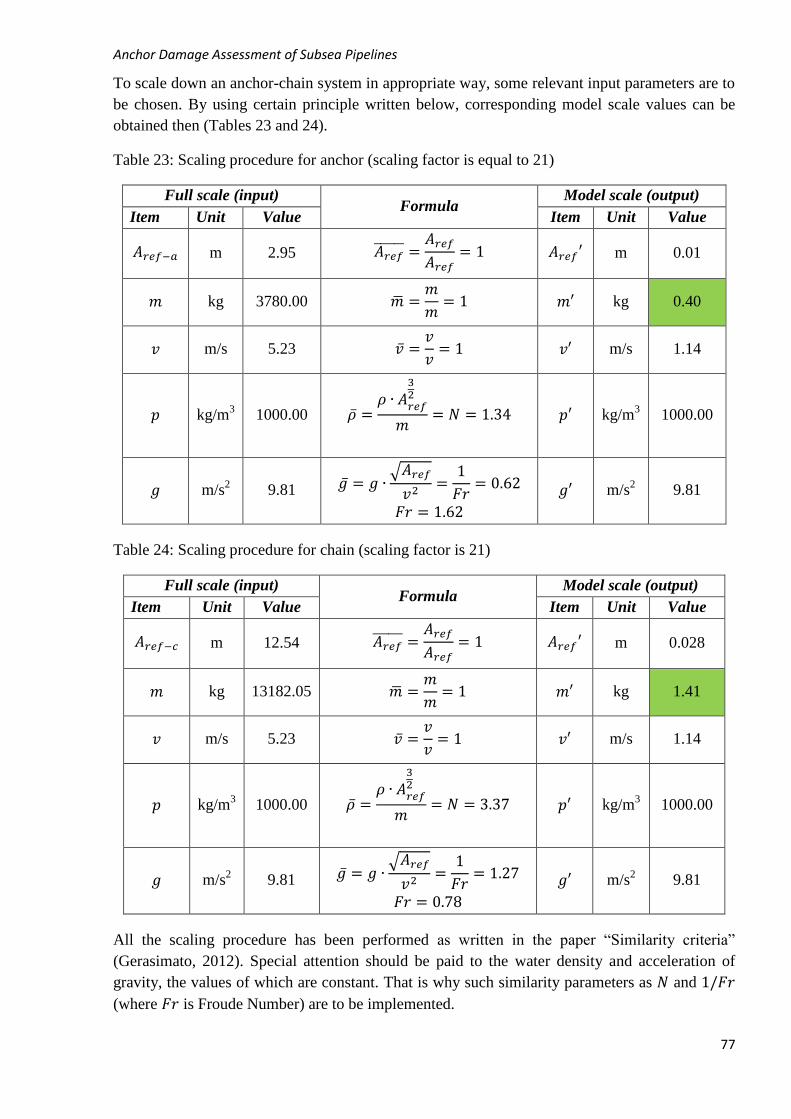
Anchor Damage Assessment of Subsea Pipelines
77
To scale down an anchor-chain system in appropriate way, some relevant input parameters are to
be chosen. By using certain principle written below, corresponding model scale values can be
obtained then (Tables 23 and 24).
Table 23: Scaling procedure for anchor (scaling factor is equal to 21)
Full scale (input) Formula
Model scale (output)
Item Unit Value Item Unit Value
𝐴𝑟𝑒𝑓−𝑎 m 2.95 𝐴𝑟𝑒𝑓̅̅ ̅̅ ̅̅ =𝐴𝑟𝑒𝑓
𝐴𝑟𝑒𝑓= 1 𝐴𝑟𝑒𝑓′ m 0.01
𝑚 kg 3780.00 �̅� =𝑚
𝑚= 1 𝑚′ kg 0.40
𝑣 m/s 5.23 �̅� =𝑣
𝑣= 1 𝑣′ m/s 1.14
𝑝 kg/m3 1000.00 �̅� =
𝜌 ∙ 𝐴𝑟𝑒𝑓
32
𝑚= 𝑁 = 1.34
𝑝′ kg/m3 1000.00
𝑔 m/s2 9.81 �̅� = 𝑔 ∙
√𝐴𝑟𝑒𝑓
𝑣2=1
𝐹𝑟= 0.62
𝐹𝑟 = 1.62
𝑔′ m/s2 9.81
Table 24: Scaling procedure for chain (scaling factor is 21)
Full scale (input) Formula
Model scale (output)
Item Unit Value Item Unit Value
𝐴𝑟𝑒𝑓−𝑐 m 12.54 𝐴𝑟𝑒𝑓̅̅ ̅̅ ̅̅ =𝐴𝑟𝑒𝑓
𝐴𝑟𝑒𝑓= 1 𝐴𝑟𝑒𝑓′ m 0.028
𝑚 kg 13182.05 �̅� =𝑚
𝑚= 1 𝑚′ kg 1.41
𝑣 m/s 5.23 �̅� =𝑣
𝑣= 1 𝑣′ m/s 1.14
𝑝 kg/m3 1000.00 �̅� =
𝜌 ∙ 𝐴𝑟𝑒𝑓
32
𝑚= 𝑁 = 3.37
𝑝′ kg/m3 1000.00
𝑔 m/s2 9.81 �̅� = 𝑔 ∙
√𝐴𝑟𝑒𝑓
𝑣2=1
𝐹𝑟= 1.27
𝐹𝑟 = 0.78
𝑔′ m/s2 9.81
All the scaling procedure has been performed as written in the paper “Similarity criteria”
(Gerasimato, 2012). Special attention should be paid to the water density and acceleration of
gravity, the values of which are constant. That is why such similarity parameters as 𝑁 and 1/𝐹𝑟
(where 𝐹𝑟 is Froude Number) are to be implemented.

Anchor Damage Assessment of Subsea Pipelines
78
𝐹𝑟 =𝑣2
𝑔∙√𝐴𝑟𝑒𝑓 (59)
In the result, output mass of the anchor (0.4 kg) and output mass of the chain (1.41 kg) are taken
as reference parameters. According to them, model anchor and chain, having almost the same
masses, are found and bought from the car and boat shop Biltema. The final form (view) of the
equipment is shown below (Figure 50).
Figure 50: Anchor and chain (stud less) chosen for the experiment
5.6.4 Preparation for the experiment
Prior to carrying out an experiment, the laboratory tank should be prepared for that. It has been
kind of long and routine task. Step by step description of the test preparation objectives is written
hereinafter.
1. To empty and to dispose the trash and foreign objectives from the top and inside of the
tank (Figure 51).
Figure 51: Removal of steel bars from the top of the tank
2. To clean the concrete walls and bottom with fresh water, to wait till the tank is totally
dry.
0.43 kg
anchor
1.28 kg chain (𝐷 = 4 𝑚𝑚, 𝐿 = 4 𝑚)

Anchor Damage Assessment of Subsea Pipelines
79
3. To purchase and prepare the grid plates (1x1 m) and white material for the walls and
bottom (Figures 52 and 53).
Figure 52: 1x1 m steel mesh reinforcement and 15x15 cm grid size
Figure 53: Waterproof white material
NB. Since all the surfaces are made of concrete, they are grey. So, it has been decided to cover
them with white waterproof material, which can give more reflection from the walls and bottom
during the test. Concerning grid plates, they are used to act as coordinated map inside the tank.
4. To assemble the plates so that the size of assembled mesh is three by three meters.
5. To paint the grid plates (steel mesh reinforcement) in blue color (Figure 54).
3m

Anchor Damage Assessment of Subsea Pipelines
80
Figure 54: Painted in blue grid plates
NB. The painting is necessary here, because purchased mesh is of bad quality and can
contaminate the water.
6. To cover the tank inside with white waterproof material (Figure 55).
Figure 55: Process of covering the walls with the reflective material
7. To install new grid plates (3x3 meters) on top of the material (Figure 56).
Figure 56: The tank inner surface covered with material and grid plates on top of it
3m
3m

Anchor Damage Assessment of Subsea Pipelines
81
8. To mark each grid inside in order to understand the position of towing anchor during the
test (Figure 57).
Figure 57: Marked with letters and numbers grid
9. To paint the anchor and chain in yellow color (Figure 58).
Figure 58: Painted in yellow anchor and chain
10. To install the underwater lights and to fill the tank with water (Figure 59).
Figure 59: Tank filled with water

Anchor Damage Assessment of Subsea Pipelines
82
5.6.5 Experiment
Once the preparation stage has been finished, the main experimental part can be started then. In
order to pull the anchoring system (0.43 kg anchor and 4-meter chain) in water, special electric
winch has been installed for that purpose. The winch includes a high torque electric motor joined
to a gear box that drives a rotating drum, so that the rode is wound onto the winch, and anchor-
chain arrangement is moved across the tank. Using controller, it is possible to change the mode
of towing speed. Two kinds of modes are set during the test: mode 1.5 and 2. An illustrative
view of winch system is given below (Figure 60).
Figure 60: Electric winch system
A total of 65 towing anchor runs have been done. All the experimental runs are captured on
video by applying two GoPro – Hero cameras. The cameras are decided to be fixed by special
tape on massive steel bars and submerged into the water, so that the shooting process is held
from one of the walls. One camera has been installed at the beginning and another one in the
middle of the tank. Several screenshots are taken to show how the configuration of anchor-
chain arrangement changes with different speed value. The position of the anchor is visible due
to marked grid acting as coordinated map. The reference table showing the distance between the
tank bottom and precise letter on the grid is compiled and used for the identification of anchor
towing depth value (Table 25).
Drum with wound rope (a) Fixed pulley and rope (b)
Laboratory power supply (c) Mode controller (d)

Anchor Damage Assessment of Subsea Pipelines
83
Table 25: Reference table for the identification of anchor towing depth
Reference letter Position of the letter
on the grid, cm
Anchor towing
depth, cm
A 285 7.5
B 270 22.5
C 255 37.5
D 240 52.5
E 225 67.5
F 210 82.5
G 195 97.5
H 180 112.5
I 165 127.5
J 150 142.5
K 135 157.5
L 120 172.5
M 105 187.5
N 90 202.5
O 75 217.5
P 60 232.5
Q 45 247.5
R 30 262.5
S 15 277.5
Using this table, one can easily see, at which letter the anchor-chain arrangement stabilizes. The
most commonly observed anchor stabilization points refer to the letters K, M, O and Q; they are
presented on the Figures 61-64 below.
Figure 61: Snapshot from the video: anchor towing depth – position K (157.5 cm); 𝑣 = 2.3 𝑚/𝑠
K
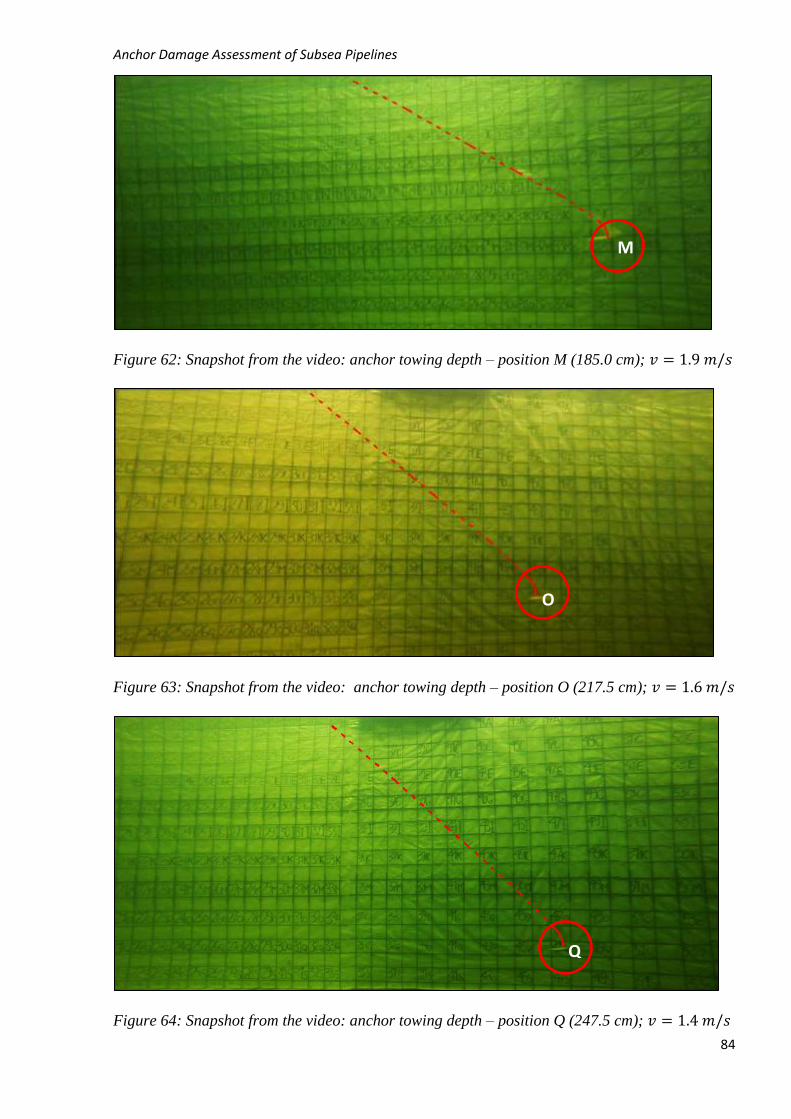
Anchor Damage Assessment of Subsea Pipelines
84
Figure 62: Snapshot from the video: anchor towing depth – position M (185.0 cm); 𝑣 = 1.9 𝑚/𝑠
Figure 63: Snapshot from the video: anchor towing depth – position O (217.5 cm); 𝑣 = 1.6 𝑚/𝑠
Figure 64: Snapshot from the video: anchor towing depth – position Q (247.5 cm); 𝑣 = 1.4 𝑚/𝑠
M
O
Q

Anchor Damage Assessment of Subsea Pipelines
85
Every towing depth can be characterized by certain velocity value. The pulling velocity is
calculated by using simple formula (Table 26):
𝑣 =𝑠
𝑡 (60)
Where 𝑠 is the distance travelled by the anchor after its stabilization, and 𝑡 is time in seconds
measured during each anchor-chain system run.
Table 26: Anchor towing depth versus velocity
Velocity, m/s Anchor towing
depth, m
2.3 1.575
1.9 1.85
1.6 2.175
1.4 2.475
As seen from the table, anchor towing depth value increases with decreasing velocity.
5.6.6 Comparison of test results with the results of analytical solution
For the verification of experimental measurements, four different anchor-chain configurations
(Figures 61-64) have been digitized by applying the Web Plot Digitizer Software; and obtained
points have been graphed in the EXCEL application.
Concerning analytical solution, it is found by using the same principle as described in anchor hit
criteria check part. Input data that are required for the present calculation is given below (Table
27). In addition, towing velocity values for 4 different cases are taken as input as well.
Table 27: Input data
Characteristics Item Unit Value
Model anchor mass 𝑚𝑎 kg 0.43
Chain length 𝑙 m 4
Chain diameter 𝐷 m 0.004
Normal drag
coefficient of stud-less
chain
𝐶𝐷𝑛 - 2.4
Tangential drag
coefficient of stud-less
chain
𝐶𝐷𝑡 - 1.15
Acceleration of gravity 𝑔 m/s2 9.81
Water density 𝜌𝑤 kg/m3 1000
Steel density 𝜌𝑠𝑡𝑒𝑒𝑙 kg/m3 7850
All the results of analytical solution are presented on the same graph (Figure 65). The absolute
error of the measurements in x-direction falls between 0.003-0.059 m.

Anchor Damage Assessment of Subsea Pipelines
86
Figure 65: Comparison of results
Summarizing this part, it is safe to say that anchor hit criterion is one of the most important
criteria that have to be checked and discussed in every detail prior to continuing with anchor
damage performance analyses. The graph gives good answers on two major questions – the chain
shape after its stabilization and anchor towing depth variations with changing velocity values.
Both, analytical and experimental approaches point out that the anchor will never be hanging
vertically from the bow of the moving ship. It is due to an interaction between the water and
anchor-chain arrangement: there will always be the hydrodynamic drag forces acting on the
system in a direction opposite to the movement of the vessel. It should be mentioned, that the
drag forces are proportional to the velocity squared (as presented in the formulas above). That is
precisely why the position of anchor is heavily affected by the value of ship speed. The higher
the velocity, the smaller the value of anchor towing depth will be. Moreover, not only the
velocity, but anchor and chain masses are significant for this investigation. It is obvious that
large and huge anchoring systems (classified by Capital Letters and Letters marked with star) are
very heavy, so that they stabilize at greater towing depths as compared to Small Letters anchors.
5.7 ANCHOR DRAGGING CONSEQUENCES
In order to investigate the response of the pipeline interacted by the anchor suddenly lost and
dragged over the line, a model developed by the IKM Ocean Design in the finite element (FE)
program SIMLA is used. A full access to the program SIMLA is provided by the IKM Ocean
Design Company as well. Dragged anchor analysis on a given Pipeline 1 with defined
parameters is done for a number of sensitivity cases.
5.7.1 Sensitivity cases
Based on the results obtained after the double hook and hit criteria checks, the summary column
diagram is drawn up (Figure 66).
-3
-2,5
-2
-1,5
-1
-0,5
0
-4-3-2-10Y
, m
X, m
Test Results vs Analytical Solution Results
K
M
O
Q
K'
M'
O'
Q'
Test Results
Calculated Results
Anchor Tow Depth

Anchor Damage Assessment of Subsea Pipelines
87
Figure 66: Total number of crossing ships within certain KP sections and defined water depth (after hook/hit criteria checks)
-400
-350
-300
-250
-200
-150
-100
-50
0
0
2
4
6
8
10
12
14
160
-10
15
-20
25
-30
35
-40
45
-50
55
-60
65
-70
75
-80
85
-90
95
-10
0
10
5-1
10
11
5-1
20
12
5-1
30
13
5-1
40
14
5-1
50
15
5-1
60
16
5-1
70
17
5-1
80
18
5-1
90
19
5-2
00
20
5-2
10
21
5-2
20
22
5-2
30
23
5-2
40
24
5-2
50
25
5-2
60
26
5-2
70
27
5-2
80
28
5-2
90
29
5-3
00
Way
er
de
pth
, m
Nu
mb
er
of
cro
ssin
g sh
ips,
hav
ing
po
ten
tial
to
dam
age
th
e p
ipe
KP sections
Total Number of Ship Crossings after Double Hook and Hit Criteria Checks Y
P
O
M
K
G
F
E
D
C
B*
B
A*
A
z
y
x
w
v
u
t
s
r
q
p
o
SEABED DEPTH PROFILE

Anchor Damage Assessment of Subsea Pipelines
88
As seen from the diagram, the most critical Pipeline 1 KP sections are the following: 0-10, 75-
95, 145-150, 170-215, 225-255, and 265-295. Each of these sections is laid at various water
depths. That is why all of them are a point of interest. Every pipe segment is crossed by different
number and different classes of anchoring systems (as illustrated on the legend). In view of this,
several anchor types that are commonly occurred in every dangerous KP segments are selected
for the anchor damage assessment procedure (Table 28).
Table 28: Selected anchors within each critical Pipeline 1 section and specified average water
depth
Number of critical
KP section
Critical KP
section
Average water
depth, m
Selected anchor classes
within KP section
1 0-10 175 G, Y
2 145-150 224.5 B*
3 170-215 119 E
4 225-255 115.25 z, v, F
5 260-295 89 o, x, B, D
One can see that the number of sensitivity cases needed for the analysis of pipe-anchor
interaction scenario is equal to 11. Moreover, all anchor types are chosen for the analysis: both
small and large ones.
5.7.2 Parameters for the anchor hooking analysis
Relevant pipeline parameters essential for the analyses in SIMLA are summarized in Table 29.
Table 29: 40-inch pipeline data for FE analysis
Characteristics Unit Value
Outer diameter m 1.019
Wall thickness m 0.026
Material - Statoil grade X-65
Steel density kg/m3 7850
Young’s modulus GPa 207
SMYS MPa 450 (0.5% strain)
SMTS MPa 680 (20% strain)
Poisson’s ratio - 0.3
Coefficient of linear expansion 0C
-1 11.7 x 10
-6
Internal temperature 0C 50
Internal pressure barg 170
Content density kg/m3 177
Submerged weight (empty) kg/m 409.17
Submerged weight (operation) kg/m 539.00
Special attention should be paid to the pipeline material definition that is included into the finite
element model. For the present case study a Ramberg-Osgoord stress-strain relationship is used
(Figure 67):

Anchor Damage Assessment of Subsea Pipelines
89
휀(𝜎) =𝜎
𝐸∙ (1 +
3
7∙ (
𝜎
𝜎𝑟)𝑛−1
) (61)
𝜎𝑟 - Ramberg-Osgood yield parameter;
𝑛 – hardening parameter.
Parameters 𝜎𝑟 and 𝑛 are found by using this relationship, so that for the current material 𝜎𝑟 is
equal to 399.3 MPa, and 𝑛 is equal to 10.
Figure 67: Pipeline stress-strain relationship curve
Regarding anchor and chain data, a complete table of each anchor class characteristics is given
below (Table 30). All the information about vessel equipment is taken from the Rules for Ship
document. Anchor pulling angle value is found during the calculations of anchor towing depth
(in anchor hit criteria check part). And anchor pulling velocity is as shown on the diagram “EL
vs Average Ship Speed” (Figure 42).
Table 30: Input anchor data for FE analysis
Case #
Anchor
arrangement
class (EL)
Anchor
mass, kg
Chain
length, m
Chain
capacity,
kN
Anchor
pulling
angle, deg
Velocity,
m/s
1 G 6000 288.75 2770 33 4.97
2 Y 16100 371.25 6690 34 6.05
3 B* 18800 371.25 7960 38 5.70
4 E 5250 288.75 2430 25 6.33
5 z 3780 261.25 1810 28 5.23
6 v 2850 247.5 1400 25 5.58
7 F 5610 288.75 2600 39 4.07
8 o 1590 206.25 735 23 5.27
9 x 3300 247.5 1680 28 5.21
10 B 4320 225 1960 27 5.68
11 D 4890 225 2270 29 5.51
0,00E+00
1,00E+08
2,00E+08
3,00E+08
4,00E+08
5,00E+08
6,00E+08
7,00E+08
8,00E+08
0 0,05 0,1 0,15 0,2 0,25
Stre
ss, P
a
Strain, -
Stress-Strain Relationship
Anchor Damage Assessment of Subsea Pipelines
90
NB. Conventional stockless anchor type and the most commonly used stud-link chain (steel
grade NV K3) are selected for the present analysis.
5.7.3 Global scale analyses
Anchor hooking analyses for all the distinguished sensitivity cases are performed by employing
FE program SIMLA.
Modeling particularities
1. 10000-meter pipeline segment is modeled in the finite element program. By considering
SIMLA element library, an element type PIPE33 has been chosen to describe elasto-
plastic behavior of pipeline material. All the corresponding pipeline design and
operational characteristics are also set into the computer code in SIMLA.
2. An anchor is modeled as a 3D beam, and a chain is modeled as a single beam. An
element type PIPE31 is used to describe a linear elastic behavior of anchor and chain
materials. Relevant input characteristics of anchor arrangement given in the Table 30 are
included into the code as well. Special emphasis should be placed on the axial stiffness
(in N) of the chain, which is the function of its diameter (𝐷) and found by formula:
𝐸𝐴𝑠𝑡𝑢𝑑−𝑙𝑖𝑛𝑘 = 1.01 ∙ 1011 ∙ 𝐷2 (62)
3. The analyses are performed for several critical KP sections, which are situated at
different seawater depths. The depth value has been changed for every individual case in
accordance with the Table 28. SEA150 element is taken to simulate the sea properties.
4. As for the seabed, it is flat in the model. The seabed properties are described in two
directions (axial and lateral) by using contact element types CONT126 in order to show
the contact between the pipeline and seabed.
5. The model simulates a pipe-anchor interaction using an elastic spring connection. At a
given springtime the spring (material of which is explained by the element spring137)
will be activated effectively “gluing” itself to the pipeline and simulating that it hooks the
line. After that the spring connection is capable of emulating the break of the chain at
relevant chain breaking load. The analysis is continued until the pipeline comes to rest
after being interfered by dragging anchor.
6. Global type boundary conditions are specified in the model. The pipeline is modeled with
finite length and fixed ends in x- and y-directions (translation), and in torsional direction
(rotation about x) as well.
Schematic illustration of the pipe-anchor interaction simulation is presented below (Figure 68).

Anchor Damage Assessment of Subsea Pipelines
91
Figure 68: Schematic view of overall pipe-anchor interaction model
NB. To be more conservative the interaction between the Pipeline 1 and dragging anchor is
assumed to be perpendicular.
40-inch Pipeline 1 modeling results
Following the main objective of the present case study, relevant SIMLA analysis input files have
been prepared individually for all the sensitivity cases, a total number of which is 11. Once,
every input file is run, the output data concerning moments, forces, displacements and strains are
determined and exported to the individual EXCEL sheets. Using obtained data, it becomes
possible to investigate 40-inch Pipeline 1 response after being hooked by the dragging anchor.
Displacements
Special attention is paid to the vertical and lateral displacements of the 40-inch pipeline. For that
purpose, summarized table with the relevant values is compiled. Corresponding graphs, showing
how the displacements of the Pipeline 1 changes from case to case, are developed and presented
below (Figures 69 and 70).
NB. One shall take into account that all the parameters used for the analysis in SIMLA are not
generalized or averaged; they are specific for every single case. So, values of the velocity,
chain length and anchor pulling angle are individual and vary only with certain anchor class and
water depth (Table 31).
Table 31: Resultant table
Anchor
class (EL)
Vertical
displacement, m
Lateral
displacement, m
Ship
speed, m/s
Anchor pulling
angle, deg
Water
depth, m
o 0.11 8.62 5.3 23 89
v 1.43 16.99 5.6 25 115
x 1.62 19.49 5.2 28 89

Anchor Damage Assessment of Subsea Pipelines
92
z 1.91 20.33 5.2 28 115
B 1.88 20.53 5.7 27 89
D 2.79 23.53 5.5 29 89
E 2.36 21.93 6.3 25 119
F 5.52 32.39 4.1 39 115
G 4.13 26.55 5.0 33 175
Y 6.61 49.23 6.0 34 175
B* 7.71 61.60 5.7 38 225
Figure 69: Pipeline 1 vertical displacement for specified cases
Figure 70: Pipeline 1 lateral displacement for specified cases
It is visible that the behavior of the graphs is quite similar. Large vertical and lateral
displacements refer to the anchor classes “Y” and “B*” (Figures 71 and 72). Moreover, one can
see here that the displacement values are not distributed smoothly as they are thought to be (it is
observed for the “E” and “G” anchor classes). The reason for this is that not only the anchor size,
but a combination of the chain length, ship speed and water depth strongly influence the value of
anchor pulling angle, which greatly affects the resultant value of the pipeline displacements. In
0,0
2,0
4,0
6,0
8,0
10,0
o v x z B D E F G Y B*
Ve
rtic
al d
isp
lace
me
nt,
m
Anchor class (EL)
40-inch Pipeline Vertical Displacement
VERTICAL DISPLACEMENT
0,0
10,0
20,0
30,0
40,0
50,0
60,0
70,0
o v x z B D E F G Y B*
Late
ral d
isp
lace
me
nt,
m
Anchor class (EL)
40-inch Pipeline Lateral Displacement
LATERAL DISPLACEMENT

Anchor Damage Assessment of Subsea Pipelines
93
order to confirm this statement, the following table (Table 32) is compiled to show the
comparison between four adjacent equipment classes: “D” - “E” - “F” - “G”.
Figure 71: Pipeline displacement in case of anchor class “Y”
Figure 72: Pipeline displacement in case of anchor class “B*”
Table 32: Comparison between four adjacent equipment classes: “D” - “E” - “F” - “G”
D Comparison
character E
Comparison
character F
Comparison
character G
Vertical
displacement, m 2.79 > 2.36 < 5.52 > 4.13
Lateral
displacement, m 23.53 > 21.93 < 32.39 > 26.55
Anchor pulling
angle, deg 29 > 25 < 39 > 33
Velocity, m/s 5.51 < 6.33 > 4.07 < 4.97
0
1
2
3
4
5
6
7
-10
0
10
20
30
40
50
60
0 5 10 15 20 25
Ve
rtic
al d
isp
lace
me
nt,
m
Late
ral d
isp
lace
me
nt,
m
Time, s
40-inch Pipeline Displacement for EL "Y"
LATERAL DISPLACEMENT
VERTICAL DISPLACEMENT
0
1
2
3
4
5
6
7
8
9
-10
0
10
20
30
40
50
60
70
0 5 10 15 20 25
Ve
rtic
al d
isp
lace
me
nt,
m
Late
ral d
isp
lace
me
nt,
m
Time, s
40-inch Pipeline Displacement for EL "B*"
LATERAL DISPLACEMENT
VERTICAL DISPLACEMENT

Anchor Damage Assessment of Subsea Pipelines
94
Strains
Along with the displacement, strain is also a point of interest while assessing the pipeline
response. In the analysis 5% strain is chosen as a limit value. Once it is exceeded, the pipeline
will suffer damage. The graph below presents the variation of pipeline strain with different
anchor types (Figure 73).
Figure 73: Pipeline 1 strain for specified cases
As seen from above the anchor classes “Y” (16100 kg) and “B*” (18800 kg) are very dangerous
for the Pipeline 1. These classes refer to the ships, crossing KP 0-10 and 145-150.
Bending moment, axial force and internal pressure
Evaluation of cross-sectional capacity of the Pipeline 1 is to be included in the analysis as well.
Being hooked by the dragging anchor, the pipeline is subjected to large axial forces and bending
moments. Moreover, taking into account the fact that the pipeline is under operation, no one can
exclude an effect from the internal pressure. Detailed discussion on combined loading effect has
been given in the previous part (Table 15). So, an assessment of pipeline cross-sectional
capacity can be performed by applying plastic interaction curves, which account for maximum
combined axial force, bending moment and internal pressure. The plastic capacity curves can be
gotten by solving the following equation (Vitali, Bruschi, Mork, Levold & Verley, 1999):
𝑀 = (𝐷 − 𝑡)2 ∙ 𝑡 ∙ 𝜎𝑦 ∙ √1 −3
4∙ 𝑞ℎ2 ∙ 𝑐𝑜𝑠 (
𝜋
2∙(𝑁
𝑁𝑐−1
2∙𝑞ℎ)
√1−3
4∙𝑞ℎ2) (63)
𝑀 – full plastic bending moment;
𝑁 – axial force applied in steel;
𝑞ℎ - hoop stress ratio equal to 𝜎ℎ/𝜎𝑦;
𝜎ℎ- hoop stress equal to 𝑃𝑖 ∙𝐷−𝑡
2∙𝑡;
𝑃𝑖 - internal pressure;
0
1
2
3
4
5
6
7
8
9
o v x z B D E F G Y B*
Stra
in, %
Anchor class (EL)
40-inch Pipeline Strain
STRAIN
LIMIT STRAIN

Anchor Damage Assessment of Subsea Pipelines
95
𝐷 - pipe outer diameter;
𝑡 - pipe wall thickness;
𝜎𝑦- yield stress;
𝑁𝑦 – yield axial force equal to 𝜋 ∙ (𝐷 − 𝑡) ∙ 𝑡 ∙ 𝜎𝑦.
Once the plastic interaction curves are ready, an axial force – bending moment relationship can
be plotted as well. In case, if force - moment relationship falls within the plastic interaction curve
related to 5% limit strain, the pipeline is supposed to survive. Otherwise, it will suffer damage.
Cross-sectional capacity (black line) of the Pipeline 1 is checked for all the anchor types
specified before. Green dashed line corresponds to SMYS; red dashed line refers to SMTS; while
blue dashed line is plastic capacity curve relates to 5% limit strain value. The results of this
check are presented below in Figures 74-84.
Figure 74: Capacity check for EL “o”
Figure 75: Capacity check for EL “v”
Figure 76: Capacity check for EL “x”
Figure 77: Capacity check for EL “z”
-4,0E+07
-2,0E+07
0,0E+00
2,0E+07
4,0E+07
6,0E+07
8,0E+07
0,0E+00 1,0E+07
Axi
al f
orc
e, N
Bending moment, Nm
-4,0E+07
-2,0E+07
0,0E+00
2,0E+07
4,0E+07
6,0E+07
8,0E+07
0,0E+00 1,0E+07
Axi
al f
orc
e, N
Bending moment, Nm
-4,0E+07
-2,0E+07
0,0E+00
2,0E+07
4,0E+07
6,0E+07
8,0E+07
0,0E+00 1,0E+07
Axi
al f
orc
e, N
Bending moment, Nm
-4,0E+07
-2,0E+07
0,0E+00
2,0E+07
4,0E+07
6,0E+07
8,0E+07
0,0E+00 1,0E+07
Axi
al f
oce
, N
Bending moment, Nm

Anchor Damage Assessment of Subsea Pipelines
96
Figure 78: Capacity check for EL “B”
Figure 79: Capacity check for EL “D”
Figure 80: Capacity check for EL “E”
Figure 81: Capacity check for EL “F”
Figure 82: Capacity check for EL “G”
Figure 83: Capacity check for EL “Y”
-4,0E+07
-2,0E+07
0,0E+00
2,0E+07
4,0E+07
6,0E+07
8,0E+07
0,00E+00 1,00E+07
Axi
al f
orc
e, N
Bending moment, Nm
-4,0E+07
-2,0E+07
0,0E+00
2,0E+07
4,0E+07
6,0E+07
8,0E+07
0,0E+00 1,0E+07
Axi
al f
orc
e, N
Bending moment, Nm
-4,0E+07
-2,0E+07
0,0E+00
2,0E+07
4,0E+07
6,0E+07
8,0E+07
0,0E+00 1,0E+07
Axi
al f
orc
e, N
Bending moment, Nm
-4,0E+07
-2,0E+07
0,0E+00
2,0E+07
4,0E+07
6,0E+07
8,0E+07
0,0E+00 1,0E+07
Axi
al f
orc
e, N
Bending moment, Nm
-4,0E+07
-2,0E+07
0,0E+00
2,0E+07
4,0E+07
6,0E+07
8,0E+07
0,0E+00 1,0E+07
Axi
al f
orc
e, N
Bending moment, Nm
-4,0E+07
-2,0E+07
0,0E+00
2,0E+07
4,0E+07
6,0E+07
8,0E+07
0,0E+00 1,0E+07
Axi
al f
orc
e, N
Bending moment, Nm

Anchor Damage Assessment of Subsea Pipelines
97
Figure 84: Capacity check for EL “B*”
As observed from the plots above, in case if pipeline is interfered by the dragging anchors
classified by “Y” and “B*”, the axial force – bending moment relationship curve intersects the
plastic capacity curve corresponding to 5% limit strain (blue dashed line). So, the Pipeline 1 will
suffer damage in 0-10 KP and 145-150 KP sections respectively. In order to understand, how the
axial force has been changing in time until the anchor chain is broken, the following graphs are
shown below (Figures 85-87).
Figure 85: Change in axial force in time, EL “Y”
-4,0E+07
-2,0E+07
0,0E+00
2,0E+07
4,0E+07
6,0E+07
8,0E+07
0,0E+00 1,0E+07
Axi
al f
orc
e, N
Bending moment, NM
-1,5E+07
-1,0E+07
-5,0E+06
0,0E+00
5,0E+06
1,0E+07
1,5E+07
0 2 4 6 8 10 12
Axi
al f
orc
e, N
Pipe length, km
Axial Force in a Pipe, EL "Y"
10,4
10,9
11,4
11,9
12,4
12,9
13,4
13,9
14,4
14,9
15,4
15,9
16,4
16,9
17,4
17,9
18,4
18,9
Time, s
Axial force vs Bending Moment
Plastic Interaction Curve (SMYS)
Plastic Interaction Curve (SMTS)
Plastic Interaction Curve (5% strain)

Anchor Damage Assessment of Subsea Pipelines
98
Figure 86: Change in axial force in time, EL “B*”
Figure 87: Change in axial force in time, EL “o”
-1,5E+07
-1,0E+07
-5,0E+06
0,0E+00
5,0E+06
1,0E+07
1,5E+07
0 2 4 6 8 10 12
Axi
al f
orc
e, N
Pipe length, km
Axial Force in a Pipe, EL "B*"
10,410,911,411,912,412,913,413,914,414,915,415,916,416,917,417,918,418,919,419,920,420,921,4
Time, s
-1,40E+07
-1,20E+07
-1,00E+07
-8,00E+06
-6,00E+06
-4,00E+06
-2,00E+06
0,00E+00
0 2 4 6 8 10 12
Axi
al f
orc
e, N
Pipeline length, km
Axial Force in a Pipe, EL "o"
10,4
10,9
11,4
11,9
12,4
12,9
13,4
13,9
14,4
14,9
Time, s

Anchor Damage Assessment of Subsea Pipelines
99
In case of huge anchor interactions (“Y”, “B*”), the ends of modeled 10 km pipeline are affected
by the axial force. The latter is not observed in case of small anchors (Figure 87). This
phenomenon can be explained by the effect of large membrane terms in the pipeline that steadily
increase until the anchor chain is broken. Hence, it is better to model longer pipeline for the
assessment of its damage due to huge anchoring systems.
Summarizing the part about anchor pulling consequences, one shall see how important it is to
perform anchor hooking analysis on a global scale. A lot of attention should be given here to the
pipeline displacements and strains. The analysis shows interesting variation of vertical and
lateral pipeline displacements with different anchor sizes. It is found that not only the anchor
mass, but also a vessel speed becomes key parameter affecting the resultant pipeline response.
The larger the velocity, the less the anchor pulling angle and the less the pipeline displacements
(both vertical and lateral) will be. Regarding pipeline strain, the limit value of 5% strain is used
in the present case study. The analysis indicates that the strain criterion has been exceeded in
cases of anchor class “Y” and “B*”. So, 40-inch Pipeline 1 is supposed to be damaged if it is
hooked by these anchors. The same results are obtained from the pipeline cross-sectional
capacity check. Combined axial force, bending moment and internal overpressure are taken into
account for this evaluation. Eleven plots give good demonstration on pipeline capability to
survive or fail. According to them, the Pipeline 1 will not survive after the “attack” of huge
anchors such as “Y” and “B*”, which are found on the ships, crossing Pipeline 1 KP 0-10 and
145-150 sections.
16-inch pipeline analysis
40-inch gas pipeline response and cross-sectional capacity check are studied above for various
sensitivity cases chosen on the basis of the anchor hook and hit criteria check results. It has been
observed that a 40-inch line will not survive if it is “attacked” by huge anchors like “Y” and
“B*”. Thus, it is interesting to see what the effect of considered dragging anchors on a smaller
diameter pipeline is. By applying the same modeling and analysis procedures, a limited set of
sensitivity cases is used for the damage assessment of a 16-inch gas pipeline. Relevant pipeline
data is given below (Table 33). Other specific pipe parameters remain the same as for the 40-
inch line.
Table 33: 16-inch pipeline data for FE analysis
Characteristics Unit Value
Outer diameter m 0.406
Wall thickness m 0.016
Submerged weight (empty) kg/m 98.29
Submerged weight (operation) kg/m 122.81
Four different classes of vessel equipment are specified for the investigation: “o”, “z”, “G”, and
“B*”. The results are presented in the same way as it has been done with a 40-inch pipeline.
Displacements
Summary graphs illustrating the variation of small diameter pipeline displacements (vertical and
lateral) are shown in Figures 88, 89.

Anchor Damage Assessment of Subsea Pipelines
100
Figure 88: 16-inch pipeline vertical displacement for specified cases
Figure 89: 16-inch pipeline lateral displacement for specified cases
It is obvious that the displacements will be greater as the anchor size increases: the maximum
values are obtained when the line is dragged by the anchor class “B*”. In addition, Table 34 is
compiled to demonstrate how different the vertical and lateral displacements of 16-inch and 40-
inch pipelines are.
Table 34: Comparison table for vertical and lateral displacements of 40 and 16-inch pipelines
Anchor
class (EL)
40-inch line
vertical
displacement, m
16-inch line
vertical
displacement, m
40-inch line lateral
displacement, m
16-inch line lateral
displacement, m
o 0.11 3.17 8.62 24.80
z 1.91 5.73 20.33 51.02
G 4.13 7.60 26.55 79.59
B* 7.71 10.11 61.60 134.87
0
2
4
6
8
10
12
o z G B*
Ve
rtic
al d
isp
lace
me
nt,
m
Anchor class (EL)
16-inch Pipeline Vertical Displacement
VERTICAL DISPLACEMENT
0
20
40
60
80
100
120
140
160
o z G B*
Late
ral d
isp
lace
me
nt,
m
Anchor class (EL)
16-inch Pipeline Lateral Displacement
LATERAL DISPLACEMENT

Anchor Damage Assessment of Subsea Pipelines
101
It is seen that the lateral displacements of smaller pipeline have increased approximately 2.5
times.
Strain
Strain is taken into account as well. 5% strain is chosen as a limit value. The graph below
presents the variation of a 16-inch pipeline strain with 4 different anchor types (Figure 90).
Figure 90: 16-inch pipeline strain for specified cases
The graph illustrates that the anchors, classified by the EL starting from “G”, have potential to
damage a small diameter pipeline. Strain results for both 16 and 40-inch pipelines are presented
in Table 35.
Table 35: Comparison table for strain values of 40 and 16-inch pipelines
Anchor class
(EL)
40-inch line
strain, %
16-inch line
strain, %
o 0.9 3.5
z 2.3 3.9
G 2.9 5.7
B* 8.2 15.1
16-inch pipe strain values, corresponding to anchor type “G” and “*B”, have almost doubled in
contrast with the same values for a 40-inch line.
Bending moment, axial force and internal pressure
Regarding combined loading effect due to bending moment, axial force and internal
overpressure; it is observed that the pipeline will probably not survive after being interacted by
the anchor class “G” and higher. It is proven by the graphs below (Figures 91-94), where green
dashed line corresponds to SMYS; red dashed line refers to SMTS; while blue dashed line is
plastic capacity curve relates to 5% limit strain value.
0
2
4
6
8
10
12
14
16
o z G B*
Stra
in, %
Anchor class (EL)
16-inch Pipeline Strain
STRAIN
LIMIT STRAIN

Anchor Damage Assessment of Subsea Pipelines
102
Figure 91: Capacity check for EL “o”
Figure 92: Capacity check for EL “z”
Figure 93: Capacity check for EL “G”
Figure 94: Capacity check for EL “B*”
Both predicted strain results and combined loading effect outcomes correspond to each other.
Thus, it is safe to say that a 16-inch gas pipeline may suffer serious damage if it is hooked by all
the anchors classified by “G” and higher. So, the pipeline KP 0-10, 75-95, 135-140, 145-150 are
the most critical sections in terms of pipe-anchor interaction event.
Resultant tables indicate that the smaller diameter pipelines (especially those, which are not
protected) are very vulnerable to the damages from dragging anchors. It is understandable, since
thin-walled, small diameter lines are known to have negligible cross-sectional capacities in
comparison with the larger diameter pipelines.
5.8 ANCHOR DRAGGING FREQUENCY
Prior to drawing main conclusion consistent with the results of dragged anchor analysis on a
given Pipeline 1, it has been decided to estimate the pipe-anchor interaction frequencies.
Frequency estimation is done in accordance with the procedure written in the Energy Report
(DNV Recommended Failure Rates for Pipelines, 2010). Since all the information (namely AIS
ship traffic data) is given only for the 1st quarter of 2013, the frequencies are calculated for a
-1,50E+07
-1,00E+07
-5,00E+06
0,00E+00
5,00E+06
1,00E+07
1,50E+07
2,00E+07
0,00E+00 1,00E+06
Axi
al f
orc
e, N
Bending moment, Nm
-1,50E+07
-1,00E+07
-5,00E+06
0,00E+00
5,00E+06
1,00E+07
1,50E+07
2,00E+07
0,00E+00 1,00E+06
Axi
al f
orc
e, N
Bending moment, Nm
-1,50E+07
-1,00E+07
-5,00E+06
0,00E+00
5,00E+06
1,00E+07
1,50E+07
2,00E+07
0,00E+00 1,00E+06
Axi
al f
orc
e, N
Bending moment, Nm
-1,50E+07
-1,00E+07
-5,00E+06
0,00E+00
5,00E+06
1,00E+07
1,50E+07
2,00E+07
0,00E+00 1,00E+06
Axi
al f
orc
e, N
Bending moment, m

Anchor Damage Assessment of Subsea Pipelines
103
quarter at first. Then an assumption is taken that the same marine activity is observed for the
remaining quarters of the year, and an annual failure frequency is also calculated.
5.8.1 Frequency estimation procedure
It is assumed that there are two incidents of anchor loss per 200 ships and year. And the
frequency for this event will be equal to 1·10-2
per ship and year, or 2.5·10-3
per ship and quarter.
Hence, the estimated frequency of uncontrolled anchor drops per vessel and quarter is as follows:
𝐴𝑐𝑐𝑖𝑑𝑒𝑛𝑡𝑎𝑙 𝑎𝑛ℎ𝑐𝑜𝑟 𝑑𝑟𝑜𝑝𝑠
𝑞𝑢𝑎𝑟𝑡𝑒𝑟=𝐴𝑛𝑐ℎ𝑜𝑟 𝑙𝑜𝑠𝑠
𝑞𝑢𝑎𝑟𝑡𝑒𝑟∙ 𝐶𝑜𝑟𝑟𝑒𝑐𝑡𝑖𝑜𝑛 𝑓𝑎𝑐𝑡𝑜𝑟 = 0.0025 ∙ 0.46 =
1.15 ∙ 10−3/𝑞𝑢𝑎𝑟𝑡𝑒𝑟 (64)
NB. Correction factor (0.46) is used, because not all the anchors are lost due to accidental anchor
drop event. In addition, just a few lost anchors relate to the uncontrolled anchor drops (DNV
Recommended Failure Rates for Pipelines, 2010).
An estimated frequency of accidental anchor drops per vessel and travelled distance in km is
calculated in this manner:
𝐴𝑐𝑐𝑖𝑑𝑒𝑛𝑡𝑎𝑙 𝑎𝑛ℎ𝑐𝑜𝑟 𝑑𝑟𝑜𝑝𝑠
𝑘𝑚=𝐴𝑐𝑐𝑖𝑑𝑒𝑛𝑡𝑎𝑙 𝑎𝑛ℎ𝑐𝑜𝑟 𝑑𝑟𝑜𝑝𝑠/𝑞𝑢𝑎𝑟𝑡𝑒𝑟
𝑇𝑟𝑎𝑣𝑒𝑙𝑙𝑒𝑑 𝑑𝑖𝑠𝑡𝑎𝑛𝑐𝑒=
1.15∙10−3/𝑞𝑢𝑎𝑟𝑡𝑒𝑟
70%∙2190ℎ
𝑞𝑢𝑎𝑟𝑡𝑒𝑟∙15
𝑛𝑚𝑖
ℎ∙1.852
𝑘𝑚
𝑛𝑚𝑖
=
2.7 ∙ 10−8/𝑘𝑚 (65)
Where 70% are accounted for utilization and 15 knots are taken as average vessel speed value.
The pipe-anchor interaction phenomenon may happen due to three different outcomes that are
presented in the Table 36. The total frequency for this scenario is equal to the sum of the
frequencies for every outcome (DNV Recommended Failure Rates for Pipelines, 2010).
Table 36: The frequency for pipe - anchor interaction scenario for different anchor drop
situations
# Anchor drop description Frequency for pipe-anchor
interaction per ship crossing
1
Anchor is dropped within 1 km. The penetration depth is
not large, so the anchor is easily recovered. 2.01·10-8
2
Anchor is fully seated in the seabed. Maximum
penetration and holding power are provided and it can
result in chain break. Anchor can be lost. 1.68·10
-9
3
Anchor is not seated and dragged for some distance until
it hooks the pipeline or structure. Ship anchor drags
because the external forces are greater than holding
power of the anchor and chain. Anchor is lost.
1.66·10-7
Thus, the sum of the frequencies for every outcome equals to:

Anchor Damage Assessment of Subsea Pipelines
104
𝐹𝑟𝑒𝑞𝑢𝑒𝑛𝑐𝑦 𝑜𝑓 𝑝𝑖𝑝𝑒 − 𝑎𝑛𝑐ℎ𝑜𝑟 𝑖𝑛𝑡𝑒𝑟𝑎𝑐𝑡𝑖𝑜𝑛 𝑝𝑒𝑟 𝑠ℎ𝑖𝑝 𝑐𝑟𝑜𝑠𝑠𝑖𝑛𝑔 = 2.01 · 10−8 + 1.68 · 10−9 +
1.66 · 10−7 = 1.9 · 10−7 (66)
This value is established to be base failure frequency per ship crossing.
Summary table, showing the failure frequency distribution for every KP section of Pipeline 1, is
compiled below (Table 37). Frequency estimation procedure is done for the total number of ship
crossings, and also for the ship crossings found after each criterion check:
1. Anchor hook criteria check (on the basis of geometrical configuration of vessel
equipment);
2. Anchor hit criteria check (in terms of the relation between the water depth value, ship
velocity and chain length);
3. Anchor damage criteria check (based on pipeline response analysis and check of cross-
sectional capacity).
Furthermore, exactly the same methodology is implemented for the failure frequency estimation
for a 16-inch gas pipeline case. Thus, Table 38 is compiled in order to demonstrate the total
estimated failure frequency for a 16-inch pipeline.
NB. It is assumed that a 16-inch pipeline route is the same as for the Pipeline 1. That is why the
traffic data for a 16-inch line is considered to be identical to the ship traffic data of Pipeline 1
(40-inch). Another assumption is that the results of the anchor hook/hit criteria checks remain the
same as for the 40-inch pipeline. The latter will indicate how the total failure frequencies for
both large and small size pipelines differ from one another.

Anchor Damage Assessment of Subsea Pipelines
105
Table 37: Failure frequency estimation for the 40-inch Pipeline 1 KP sections per 1Q
KP
section
Failure
frequency
per ship
crossing
Total ship crossings I criteria hook check II criteria hit check III criteria damage check
Total #
of ship
crossings
Failure
frequency per
KP and 1Q
# of ship
crossings
with
potential to
hook the pipe
Failure
frequency per
KP and 1Q
# of ship
crossings
with
potential to
hit the pipe
Failure
frequency per
KP and 1Q
# of ship
crossings
with
potential to
damage the
pipe
Failure
frequency per
KP and 1Q
0-10 1.9E-07 8 1.5E-06 8 1.5E-06 7 1.3E-06 1 1.9E-07
10-15 1.9E-07 11 2.1E-06 10 1.9E-06 0 - 0 -
15-20 1.9E-07 20 3.8E-06 18 3.4E-06 0 - 0 -
20-25 1.9E-07 20 3.8E-06 19 3.6E-06 0 - 0 -
25-30 1.9E-07 26 4.9E-06 25 4.7E-06 0 - 0 -
30-35 1.9E-07 26 4.9E-06 26 4.9E-06 0 - 0 -
35-40 1.9E-07 48 9.0E-06 48 9.0E-06 0 - 0 -
40-45 1.9E-07 35 6.6E-06 35 6.6E-06 0 - 0 -
45-50 1.9E-07 27 5.1E-06 25 4.7E-06 0 - 0 -
50-55 1.9E-07 16 3.0E-06 16 3.0E-06 0 - 0 -
55-60 1.9E-07 8 1.5E-06 8 1.5E-06 0 - 0 -
60-65 1.9E-07 12 2.3E-06 11 2.1E-06 0 - 0 -
65-70 1.9E-07 14 2.6E-06 14 2.6E-06 0 - 0 -
70-75 1.9E-07 50 9.4E-06 50 9.4E-06 0 - 0 -
75-80 1.9E-07 19 3.6E-06 19 3.6E-06 1 1.9E-07 0 -
80-85 1.9E-07 68 1.3E-05 68 1.3E-05 1 1.9E-07 0 -
85-90 1.9E-07 114 2.1E-05 112 2.1E-05 1 1.9E-07 0 -
90-95 1.9E-07 57 1.1E-05 54 1.0E-05 1 1.9E-07 0 -
95-100 1.9E-07 2 3.8E-07 2 3.8E-07 0 - 0 -

Anchor Damage Assessment of Subsea Pipelines
106
100-105 1.9E-07 9 1.7E-06 9 1.7E-06 0 - 0 -
105-110 1.9E-07 4 7.5E-07 4 7.5E-07 0 - 0 -
110-115 1.9E-07 2 3.8E-07 2 3.8E-07 0 - 0 -
115-120 1.9E-07 2 3.8E-07 2 3.8E-07 0 - 0 -
120-125 1.9E-07 3 5.6E-07 3 5.6E-07 0 - 0 -
125-130 1.9E-07 1 1.9E-07 1 1.9E-07 0 - 0 -
130-135 1.9E-07 5 9.4E-07 4 7.5E-07 0 - 0 -
135-140 1.9E-07 6 1.1E-06 5 9.4E-07 1 1.9E-07 0 -
140-145 1.9E-07 3 5.6E-07 3 5.6E-07 0 - 0 -
145-150 1.9E-07 2 3.8E-07 2 3.8E-07 1 1.9E-07 1 1.9E-07
150-155 1.9E-07 2 3.8E-07 2 3.8E-07 0 - 0 -
165-170 1.9E-07 1 1.9E-07 1 1.9E-07 0 - 0 -
170-175 1.9E-07 6 1.1E-06 6 1.1E-06 2 3.8E-07 0 -
175-180 1.9E-07 2 3.8E-07 1 1.9E-07 0 - 0 -
180-185 1.9E-07 5 9.4E-07 5 9.4E-07 1 1.9E-07 0 -
185-190 1.9E-07 13 2.4E-06 11 2.1E-06 7 1.3E-06 0 -
190-195 1.9E-07 11 2.1E-06 10 1.9E-06 7 1.3E-06 0 -
195-200 1.9E-07 11 2.1E-06 10 1.9E-06 6 1.1E-06 0 -
200-205 1.9E-07 9 1.7E-06 9 1.7E-06 4 7.5E-07 0 -
205-210 1.9E-07 7 1.3E-06 5 9.4E-07 2 3.8E-07 0 -
210-215 1.9E-07 6 1.1E-06 5 9.4E-07 2 3.8E-07 0 -
215-220 1.9E-07 7 1.3E-06 6 1.1E-06 0 - 0 -
220-225 1.9E-07 4 7.5E-07 4 7.5E-07 0 - 0 -
225-230 1.9E-07 10 1.9E-06 9 1.7E-06 4 7.5E-07 0 -
230-235 1.9E-07 8 1.5E-06 8 1.5E-06 6 1.1E-06 0 -
235-240 1.9E-07 4 7.5E-07 4 7.5E-07 1 1.9E-07 0 -
240-245 1.9E-07 10 1.9E-06 10 1.9E-06 3 5.6E-07 0 -
245-250 1.9E-07 15 2.8E-06 14 2.6E-06 6 1.1E-06 0 -

Anchor Damage Assessment of Subsea Pipelines
107
250-255 1.9E-07 4 7.5E-07 3 5.6E-07 2 3.8E-07 0 -
255-260 1.9E-07 2 3.8E-07 2 3.8E-07 0 - 0 -
260-265 1.9E-07 3 5.6E-07 2 3.8E-07 1 1.9E-07 0 -
265-270 1.9E-07 4 7.5E-07 3 5.6E-07 2 3.8E-07 0 -
270-275 1.9E-07 4 7.5E-07 4 7.5E-07 3 5.6E-07 0 -
275-280 1.9E-07 9 1.7E-06 7 1.3E-06 5 9.4E-07 0 -
280-285 1.9E-07 23 4.3E-06 20 3.8E-06 14 2.6E-06 0 -
285-290 1.9E-07 2 3.8E-07 2 3.8E-07 1 1.9E-07 0 -
290-295 1.9E-07 2 3.8E-07 2 3.8E-07 1 1.9E-07 0 -
Total 802 1.5E-04 768 1.4E-04 93 1.7E-05 2 3.8E-07
Table 38: Failure frequency estimation for the 16-inch gas pipeline KP sections per 1Q
KP
section
Failure
frequency
per ship
crossing
Total ship crossings I criteria hook check II criteria hit check III criteria damage check
Total #
of ship
crossings
Failure
frequency per
KP and 1Q
# of ship
crossings
with
potential to
hook the pipe
Failure
frequency per
KP and 1Q
# of ship
crossings
with
potential to
hit the pipe
Failure
frequency per
KP and 1Q
# of ship
crossings
with
potential to
damage the
pipe
Failure
frequency per
KP and 1Q
0-10 1.9E-07 8 1.5E-06 8 1.5E-06 7 1.3E-06 7 1.3E-06
10-15 1.9E-07 11 2.1E-06 10 1.9E-06 0 - 0 -
15-20 1.9E-07 20 3.8E-06 18 3.4E-06 0 - 0 -
20-25 1.9E-07 20 3.8E-06 19 3.6E-06 0 - 0 -
25-30 1.9E-07 26 4.9E-06 25 4.7E-06 0 - 0 -
30-35 1.9E-07 26 4.9E-06 26 4.9E-06 0 - 0 -
35-40 1.9E-07 48 9.0E-06 48 9.0E-06 0 - 0 -
40-45 1.9E-07 35 6.6E-06 35 6.6E-06 0 - 0 -

Anchor Damage Assessment of Subsea Pipelines
108
45-50 1.9E-07 27 5.1E-06 25 4.7E-06 0 - 0 -
50-55 1.9E-07 16 3.0E-06 16 3.0E-06 0 - 0 -
55-60 1.9E-07 8 1.5E-06 8 1.5E-06 0 - 0 -
60-65 1.9E-07 12 2.3E-06 11 2.1E-06 0 - 0 -
65-70 1.9E-07 14 2.6E-06 14 2.6E-06 0 - 0 -
70-75 1.9E-07 50 9.4E-06 50 9.4E-06 0 - 0 -
75-80 1.9E-07 19 3.6E-06 19 3.6E-06 1 1.9E-07 1 1.9E-07
80-85 1.9E-07 68 1.3E-05 68 1.3E-05 1 1.9E-07 1 1.9E-07
85-90 1.9E-07 114 2.1E-05 112 2.1E-05 1 1.9E-07 1 1.9E-07
90-95 1.9E-07 57 1.1E-05 54 1.0E-05 1 1.9E-07 1 1.9E-07
95-100 1.9E-07 2 3.8E-07 2 3.8E-07 0 - 0 -
100-105 1.9E-07 9 1.7E-06 9 1.7E-06 0 - 0 -
105-110 1.9E-07 4 7.5E-07 4 7.5E-07 0 - 0 -
110-115 1.9E-07 2 3.8E-07 2 3.8E-07 0 - 0 -
115-120 1.9E-07 2 3.8E-07 2 3.8E-07 0 - 0 -
120-125 1.9E-07 3 5.6E-07 3 5.6E-07 0 - 0 -
125-130 1.9E-07 1 1.9E-07 1 1.9E-07 0 - 0 -
130-135 1.9E-07 5 9.4E-07 4 7.5E-07 0 - 0 -
135-140 1.9E-07 6 1.1E-06 5 9.4E-07 1 1.9E-07 1 1.9E-07
140-145 1.9E-07 3 5.6E-07 3 5.6E-07 0 - 0 -
145-150 1.9E-07 2 3.8E-07 2 3.8E-07 1 1.9E-07 1 1.9E-07
150-155 1.9E-07 2 3.8E-07 2 3.8E-07 0 - 0 -
165-170 1.9E-07 1 1.9E-07 1 1.9E-07 0 - 0 -
170-175 1.9E-07 6 1.1E-06 6 1.1E-06 2 3.8E-07 0 -
175-180 1.9E-07 2 3.8E-07 1 1.9E-07 0 - 0 -
180-185 1.9E-07 5 9.4E-07 5 9.4E-07 1 1.9E-07 0 -
185-190 1.9E-07 13 2.4E-06 11 2.1E-06 7 1.3E-06 0 -
190-195 1.9E-07 11 2.1E-06 10 1.9E-06 7 1.3E-06 0 -

Anchor Damage Assessment of Subsea Pipelines
109
195-200 1.9E-07 11 2.1E-06 10 1.9E-06 6 1.1E-06 0 -
200-205 1.9E-07 9 1.7E-06 9 1.7E-06 4 7.5E-07 0 -
205-210 1.9E-07 7 1.3E-06 5 9.4E-07 2 3.8E-07 0 -
210-215 1.9E-07 6 1.1E-06 5 9.4E-07 2 3.8E-07 0 -
215-220 1.9E-07 7 1.3E-06 6 1.1E-06 0 - 0 -
220-225 1.9E-07 4 7.5E-07 4 7.5E-07 0 - 0 -
225-230 1.9E-07 10 1.9E-06 9 1.7E-06 4 7.5E-07 0 -
230-235 1.9E-07 8 1.5E-06 8 1.5E-06 6 1.1E-06 0 -
235-240 1.9E-07 4 7.5E-07 4 7.5E-07 1 1.9E-07 0 -
240-245 1.9E-07 10 1.9E-06 10 1.9E-06 3 5.6E-07 0 -
245-250 1.9E-07 15 2.8E-06 14 2.6E-06 6 1.1E-06 0 -
250-255 1.9E-07 4 7.5E-07 3 5.6E-07 2 3.8E-07 0 -
255-260 1.9E-07 2 3.8E-07 2 3.8E-07 0 - 0 -
260-265 1.9E-07 3 5.6E-07 2 3.8E-07 1 1.9E-07 0 -
265-270 1.9E-07 4 7.5E-07 3 5.6E-07 2 3.8E-07 0 -
270-275 1.9E-07 4 7.5E-07 4 7.5E-07 3 5.6E-07 0 -
275-280 1.9E-07 9 1.7E-06 7 1.3E-06 5 9.4E-07 0 -
280-285 1.9E-07 23 4.3E-06 20 3.8E-06 14 2.6E-06 0 -
285-290 1.9E-07 2 3.8E-07 2 3.8E-07 1 1.9E-07 0 -
290-295 1.9E-07 2 3.8E-07 2 3.8E-07 1 1.9E-07 0 -
Total 802 1.5E-04 768 1.4E-04 93 1.7E-05 13 2.44E-06

Anchor Damage Assessment of Subsea Pipelines
110
To sum up the results of the frequency analysis in the 1st quarter of 2013 for 40-inch gas line, a
total of 802 passing ships are taken for the analysis. After the 1st criteria check, this number is
reduced to 768, after the 2nd
check it is dropped to 93, and after the 3rd
criteria check the number
of dangerous ship crossings is decreased to 2. The failure frequencies are calculated for every
pipe KP section after every criterion check. Resultant damage frequency of the 40-inch
Pipeline 1 for the 1st quarter of 2013 is equal to 3.8·10
-7; and an annual failure frequency is
1.5·10-6
(assuming that the ship traffic volume has been the same in the remaining quarters of the
year). In accordance with the DNV-OS-F101, the nominal target failure frequency is of
magnitude 10-4
per pipeline and year. Thus, one can see that the total estimated frequency is less
than the acceptance criterion for pipeline damage. Concerning a 16-inch gas pipeline, after the
3rd
criteria check the number of critical crosses has decreased up to 13. So, the resultant damage
frequency of smaller diameter pipeline is equal to 2.44·10-6
per quarter, and an annual one is
9.76·10-6
, which is also less than acceptance value. The comparison of obtained frequencies for
both pipelines is shown below:
1.5 · 10−6 < 9.76 · 10−6 (67)
Consequently, the smaller the pipeline, the greater the potential for damage from dragging
anchor will be.
5.9 ANCHOR DAMAGE ASSESSMENT METHODOLOGY
The anchor dragging interference assessment methodology is presented below (Table 40).
Table 40: Anchor damage assessment methodology
Data
Processing
Pipeline Data
and
Characteristics
General pipeline data;
Operational characteristics;
Material properties (steel, concrete);
Seabed characteristics along the route;
Seabed depth profile along the route;
Segmentation of the route.
Ship Traffic
Data
Total number of ship crossings;
Identification number (IMO-no and/or MMSI-no);
Types and/or classes of ships;
Gross Tonnage index;
Equipment Number and/or Equipment Letter;
Vessel speed;
Vessel direction;
Latitude and longitude coordinates.
Screening
Analyses
Anchor Hook
Criteria Check
On the basis of anchor geometrical configuration. Two
scenarios are to be analyzed:
The pipeline is stuck between one fluke and anchor
shank;
The pipeline is stuck between the plane of both flukes
and anchor shank.

Anchor Damage Assessment of Subsea Pipelines
111
NB. The minimum anchor size value and corresponding
equipment class should be determined from both scenarios.
Lower class anchors are to be excluded from the analyses.
Anchor Hit
Criteria Check
On the basis of the vessel speed, water depth, and anchor
class (anchor size and chain length). It allows checking if the
anchor is capable of approaching the pipeline or not. The
following parameters are to be found:
Anchor pulling angle;
Anchor towing depth.
NB. The minimum chain length value and corresponding
equipment class should be determined. Lower class anchors
are to be excluded from the further analyses.
Global
Scale
Analyses
Anchor
Damage
Criteria Check
On the basis of several sensitivity cases selected from the
outcomes from anchor hook & hit criteria checks. The
following is to be assessed then:
Pipeline vertical and lateral displacements;
Pipeline strain;
Pipeline cross sectional capacity check for the case of
combined loading effect (e.g. axial force, bending
moment, and internal overpressure).
NB. The anchor damage assessment of the pipeline can be
performed by employing the FE program SIMLA.
Frequency Estimation Frequency estimation in accordance with the base
failure frequency per ship crossing (1.9·10-7
);
Comparison of total estimated frequency for damage
with the nominal annual target failure frequency for
ALS (10-4
per pipeline).
General Conclusions Which pipeline sizes (as a function of water depth, vessel
size, speed etc.) will typically:
Withstand anchor impact;
Will be damaged.

Anchor Damage Assessment of Subsea Pipelines
112
CHAPTER 6. DISCUSSION, CONCLUSION AND RECOMMENDATIONS
6.1 DISCUSSION ON STUDY AND ANALYSES RESULTS
Prior to drawing a conclusion from the performed analyses and estimations, a complete
discussion based on the results and findings from the previous chapters is presented hereinafter.
PARLOC 2001 database
A comprehensive study on pipeline failure database PARLOC 2001 is prepared in this work. The
emphasis has been placed on the identification and subsequent evaluation of pipeline incidents.
Database boundaries, its population and incidents occurrence are defined and highlighted. The
main pipeline failures, their causes, locations and consequences have been found and analyzed.
The analyses show that the most frequently observed incidents involving both rigid and flexible
lines are corrosion, material defect, impact and anchoring. It has been detected that each of these
hazards can cause a lot of pipeline damages, ruptures and leakages. That is why complete
definition and detailed evaluation of them is presented in this paper. Corresponding graphs,
diagrams and charts are prepared with the purpose of illustrating which pipeline size is the most
vulnerable to damage. In addition, the location of incidents is graphically presented as well. Both
spontaneous and external hazards mostly occur in the pipeline Mid Line (a lot of threats from
high marine and fishing activities) and Safety Zone (a lot of threats from the dropped objects
during installation works). Concerning the pipeline size, it has been found that smaller diameter
lines (2.4-16 inches) are susceptible to damage a lot more since their capacity is almost
negligible in comparison with the capacity of larger lines. Identified pipeline size and zones can
be used for the selection of safeguard measures and pipeline protection philosophy, which
significantly reduces the extent of damage or eliminates it at all. Hence, it is important to record
all the threats observed throughout the whole life of the pipeline system. Collection of pipeline
failures information provides an excellent opportunity to learn from every single experience and
to exclude the failures in the future.
Theoretical approach
In accordance with the database study, one of the major threats to the pipeline integrity is
incorrect ship anchoring. Not only the pipelines but also the submarine cables are susceptible to
damage from lost and dragged anchors. All the significance of anchor damage incidents is
presented in two tables (Tables 7 and 8) containing information of worldwide offshore pipelines
and submarine cables failures due to anchoring hazard. Suddenly dropped and dragged anchors
are supposed to be one of the main causes of pipeline and cable damages in XX and XXI
centuries. The total number of incidents for pipeline and cables are demonstrated in Figures 17,
18. It is seen that the number of pipeline damages has decreased. On the other hand, the number
of cable failures has increased. The latter may be explained by the widespread use of fiber-
optical lines from the end of the last century to the present day. Therefore, even though there are
a lot of technological developments and achievements in the sphere of marine activity control
and monitoring, the incidents still occur from time to time.
A theoretical approach of ship anchoring effect on submarine pipelines is given in the present
work. A comprehensive discussion on vessel anchoring procedure, its variation from case to case

Anchor Damage Assessment of Subsea Pipelines
113
and explanation of different uncontrolled anchor drop outcomes are reviewed and studied as
well. Along with that, the importance of main key factors such as pipe unique properties, vessel
characteristics and anchor parameters is emphasized for the assessments. A combination of these
factors is found to be governing for the set of relevant pipeline damage criteria, which is also
discussed in this paper.
Data analyses
Dragged anchor interference assessment has been performed in order to identify potential for
anchor induced damage of the 40-inch gas pipeline (Pipeline 1). Focus is placed for the entire
pipeline length, including all the pipe KP sections for the analysis. Ship traffic data collection
and compilation has been done by screening procedure in accordance with the steps given in the
flowchart in Figure 37. Marine traffic data has been processed to develop various diagrams and
distribution charts for a considered pipeline route on the basis of collected information. From the
pie diagram (Figure 39) it is observed that the most commonly encountered ship class is Class 2,
which accounts for 49% of total vessel crossings over the pipeline route. Regarding other ship
classes, they are distributed almost uniformly, excepting the ship Class 7 that accounts only for
1% of total crossings. Anchoring equipment specification is also included for the data analysis. It
is found that the equipment class (EL) “o” is the most common one. Furthermore, the
distribution of total number of ships passing the pipe route has been included into the analyses as
well. The investigation shows that the greatest marine activity (with the majority of ship Class 2)
falls between the pipeline KP 0-60 and 65-95 sections, which are situated at the deepest sea area.
That is why it has been decided to continue with a detailed analyses in order to draw precise
conclusion whether the anchors of passing ships are capable of hooking the Pipeline 1 or not.
Anchor hook check
Three main criteria are chosen for the check. The 1st criterion corresponds to the geometrical
configuration of the Spek stockless anchors. It is understandable that small dimension equipment
is not capable of catching large diameter pipeline. The anchor hook check has been performed
for two cases: when the pipeline is thought to be caught between one fluke and anchor shank (I
case); or between the plane of two flukes and anchor shank (II case). It has been found that the
most conservative results are obtained when the pipeline is supposed to stick between the plane
of flukes and the shank. According to the outcome from the 2nd
case check; all the anchors
specified by the EL starting from “j” can pose threat to the Pipeline 1.
Anchor hit check
The 2nd
criterion check is performed in terms of the relation between the ship speed, equipment
class, and water depth. Following the theoretical justification presented in the corresponding
part, it is proven that the anchor will never be hanging vertically after its stabilization at a certain
depth. What is governing here is that there are always the hydrodynamic drag forces acting on
the anchor-chain arrangement in the direction opposite to the movement of the vessel. Moreover,
the drag forces are proportional to the velocity squared. Hence, it follows that the anchor
stabilization point is greatly affected by the value of ship velocity. The size of anchoring
equipment is also leading here: heavy anchor, hanging on long chain, will stabilize at greater
depth than small dimension equipment. That is why a lot of attention should be paid to huge

Anchor Damage Assessment of Subsea Pipelines
114
anchoring systems, which are generally specified by the Equipment Letters from A* to O*. In
accordance with the results obtained from the analytical solution of the anchor hit criterion
check, the anchors characterized by the ELs from “l” and higher are dangerous for the pipeline,
since all of them are capable of approaching the seabed and catching the line while the ship is
underway.
Model scale test
Not only the analytical approach, but also a model scale test has been applied for the
identification of anchor towing depth. The test mainly focuses on the determination of anchor
towing depth variations with different values of towing velocity. Every item has been scaled
down; and the experimental site has been prepared for the test. Obtained results give strong
notions on how the velocity affects the stabilization point of hanging anchor. The higher the
speed, the larger the components of hydrodynamic forces will be, and the anchor will stabilize at
less towing depth. The verification of test and analytical solution results has been done as well.
The calculated absolute error in the x-direction falls in a range of 0.003-0.05 m. The errors find
their place because the tests are not taken in a perfect way. For instance, the quality of most
video shots is not so high, so it has become difficult to distinguish exact position of the anchor-
chain arrangement in the water tank. Moreover, the velocity measurements are also not ideal,
since just usual manual timer has been used for the time record of each test run.
Pipeline response and cross-sectional capacity check
After the anchor hook and hit criteria checks, the present assessment has been continued with the
global analysis performed in the FE program SIMLA. Eleven sensitivity cases are chosen for the
assessment. It has been decided not to generalize but to take all the parameters individually for
every case. The emphasis is placed on the structural response and capacity check in terms of the
axial force, bending moment and internal overpressure. An attention is given to the pipeline
displacement results. What is important to notice is that the values of both vertical and lateral
displacements are observed to be affected by the anchor pulling angle, greatly dependent on the
value of ship velocity. Thus, the higher the ship speed, the less the pipeline displacements will
be. Huge vertical and lateral displacements are found in case of “Y” and “B*” anchor classes
(Figures 71, 72). Pipeline strain is also a point of interest; and 5% strain is chosen as a limit.
From the graph (Figure 73) it is seen that if huge anchors such as “Y” and “B*” hook Pipeline 1,
the strain values will exceed the limit, and the pipeline will not survive. The same results are
obtained from the cross-sectional pipeline capacity check. Combined loading effect is included
into the assessment. It should be noted that there are two dominant terms characterizing pipeline
force-displacement response. The first term is bending, which is not dependent on pipeline
displacements. Another one is membrane term, which increases linearly with the displacements
of the pipe. In case of anchor hooking/dragging scenario, the pipeline membrane forces increase
until the value of applied force reaches the value of chain breaking load. By applying plastic
interaction curve accounted for 5% limit strain it is visible, that in 2 out of 11 sensitivity cases
the Pipeline 1 will not survive. These cases refer to “Y” and “B*” anchor ELs. Thus, pipeline KP
0-10 and 135-140 sections have potential to be damaged by dragging anchor.
Not only the 40-inch gas pipeline but a smaller diameter line has been chosen for the
investigation of pipeline response and capacity check. By using the same methodology,

Anchor Damage Assessment of Subsea Pipelines
115
implemented for the modeling and analysis procedures, a pipe-anchor interaction scenario
assessment has been performed for a considered 16-inch gas pipeline. 5% strain value is taken as
limit as well. Based on the results from the predicted strains and outcomes from the pipeline
cross-sectional capacity check, it is found that the pipeline may fail after the interaction with
large anchors classified by the ELs “G” and higher. It is because thin-walled and small diameter
lines have almost negligible cross-sectional capacities in comparison with the larger lines. Thus,
16-inch pipeline KP 0-10, 75-95, 135-140 and 145-150 are the most critical zones that can be
interacted and damaged by the equipment of crossing vessels.
Thus, only huge anchors (classified by the Capital Letters marked with star) are capable of
damaging the large diameter pipeline. Regarding a small size line, it can lose its integrity even if
small dimension anchors are snagged over it.
Anchor dragging induced frequency
By using AIS ship traffic data given for the 1st quarter (1Q) of 2013 a pipe-anchor interaction
frequency is estimated in accordance with the methodology presented in the Energy Report. The
assessment results point out that the pipeline KP 0-10 and 135-140 can be damaged by the
anchoring equipment of crossing ships. Focus has been placed on these sections. The frequency
of pipeline failure due to dragging anchor interference is calculated based on the number of ship
crossings per KP and 1Q, obtained from the anchor hook/hit/damage criteria checks. This
number has been multiplied by a base failure frequency taken as 1.9·10-7
per ship crossing. It
has been found that there are only two anchors classified as “Y” and “B*”, which have potential
to hook and damage the Pipeline 1. Thus, calculated annual pipeline failure frequency is equal to
1.5·10-6
. It is less than the nominal target frequency accounted for 10-4
per pipeline (DNV-OS-
F101, 2013), so anchor dragging is not critical for the 40-inch Pipeline 1 for given level of ship
traffic.
Regarding the 16-inch line case, it has been found that an annual failure frequency is equal to
9.76·10-6
. Since it is less than a target failure probability, small size pipeline is thought to
survive.
Since the pipeline capacity checks has revealed several sections that can be damaged by passing
ship anchors, potential risk reducing measures may be implemented then.
6.2 ASSUMPTIONS
Some assumptions have been taken during the dragged anchor interference analysis.
The pipelines sections are supposed to be exposed in the present case study.
All the anchors are assumed to be broken out of the seafloor prior to approaching and
catching exposed lines. For that reason, an anchor penetration depth check has not been
included into the analyses. However, this check can be significant for the damage
assessment of trenched and/or covered lines.
Another assumption is that every moving ship is equipped with the Spek stockless anchor
and stud-link chain, the information on which is easily found in the Rules for Ship (2011)
document and relevant catalogues.

Anchor Damage Assessment of Subsea Pipelines
116
Average velocity has been taken for every ship equipped with a certain class of anchor
equipment (distinguished by Equipment Letters). Thus, every EL is characterized by the
corresponding value of average ship speed.
It has been assumed that all the vessels passing the pipelines routes are moving with the
constant velocity; and the flow forcing the anchoring system in the opposite direction is
steady. Hence, the acceleration term is excluded; so that the anchor and chain inertia and
added mass terms are not considered for the present case study. Moreover, the drag force of
the anchor is assumed to be negligible in contrast to its weight.
To be more conservative an interaction between the pipelines and corresponding dragging
anchors is chosen to be perpendicular. In reality the angle between the ship’s course and
pipeline may be less than 90 degrees, or even equal to 0; so that the probability of pipeline
damage will be less for those cases.
For the assessment of a 16-inch pipeline, it has been assumed that its route is the same as the
route of a 40-inch line. That is why the traffic data for a 16-inch pipe is believed to be
identical to the ship traffic data of Pipeline 1 (40-inch). Another assumption is that the
results of the anchor hook & hit criteria checks for a small size pipe are taken the same as
obtained results from a large line assessment. The latter indicates how the total failure
frequencies for both large and small size pipelines differ from one another depending only
on the outcomes of pipelines capacity checks.
A set of relevant assumptions for the frequency assessment procedure is taken as written in
the DNV Recommended Failure Rates for Pipelines (2010) report.
Regarding the model scale test, one shall understand that its results are not 100% perfect due to
some limitations encountered during the experiment. The water tank is not designed for carrying
out such kind of operation, because it usually serves for concrete material tests only. That is
why the experiment site preparation took a lot of time and efforts. Not only special but alternate
equipment and tools were used for that purpose. Furthermore, it was quite problematic to
measure the distance travelled by the anchor after its stabilization, and to record the travel time
corresponding to each test run. Processing of the experimental results became very complex as
well, since the identification of anchor position was limited sometimes by poor visibility inside
of the tank and insufficient lighting.
6.3 CONCLUSION
In accordance with the anchor pulling consequences and failure frequency analyses, it can be
concluded that the dragging anchor interference is not critical for a 40-inch Pipeline 1 and 16-
inch line for a considered lever of marine activity (802 ships) per 3 months.
Firstly, the results of the anchor hook criteria check show that not all the anchors are capable of
hooking the pipeline. The governing parameters here are pipeline diameter and anchor
dimensions. It has been found that anchor classes, lower than “g”, are not large enough to hook
the Pipeline 1.
Secondly, the anchor towing depth has to be such a value as to be able to reach the sea bottom.
What is important to know is that the combination of water depth, anchor size, chain length and
ship transit speed dictates the value of predicted depth. The higher the vessel speed, the less the

Anchor Damage Assessment of Subsea Pipelines
117
anchor towing depth will be. For the Pipeline 1 the vessels’ equipment classes, lower than “l”
have been excluded from the studies after the anchor hit criteria check.
After two criteria checks, a total number of ships capable of both hooking and approaching the
Pipeline 1 have reduced from 802 to 93. Based on the information of these vessels, the anchor
damage criteria have been performed. Global scale analyses results have indicated that only huge
size anchors (“Y” and “B*”) have potential to cause Pipeline 1 failure. The ships with such
equipment type cross Pipeline 1 KP 0-10 (175 m depth) and KP 145-150 (233 m depth). An
average speed of the vessels is 5.9 m/s. An attention is given to vertical and lateral pipeline
displacements, strain and cross-sectional capacity due to combined loading effect (axial force,
bending moment and internal overpressure). It is observed that vessel transit speed also affects
the value of pipeline displacements: the higher the speed, the less the anchor pulling angle and
pipeline displacements will be.
The emphasis is placed not only on a 40-inch line, but also on a 16-inch pipeline. Assuming that
small pipeline route runs along the same path, the same volume of ship traffic as for the 40-inch
line has been chosen for the analyses. Several sensitivity cases of crossings out of total number
of threatening crossings (93) have been taken for the global scale analyses of a 16-inch pipe. The
results have shown that all the anchor classes higher than “G” may pose threat to the line. It can
be noted that thin-walled and smaller diameter pipelines are more vulnerable to damage from
dragging anchors, because their capacity is almost negligible compared to the capacity of large
size pipelines.
According to the results of pipeline response and capacity check, a failure frequency for each
pipeline for the 1st quarter of 2013 has been estimated. Assuming the same ship traffic for the
rest of the year, the total annual damage frequency for large and small diameter pipelines are
1.5·10-6
and 9.76·10-6
correspondingly. These values are less than the nominal annual target
failure probability (10-4
per pipeline). Thus, it is concluded that the anchor dragging event is not
critical for both lines for a given level of ship traffic.
6.4 RECOMMENDATIONS
It would be wrong to state that the pipe-anchor interaction assessment is perfectly performed.
There are still some recommendations for the future studies and assessments:
1. To specify more sensitivity cases with respect to pipeline diameter, wall thickness,
internal overpressure effect, water depth values.
2. To perform not only a global scale, but also a local scale analyses in order to understand
the potential for local buckling and denting, and/or fractures.
3. To give detailed study on risk reducing measures.
4. To take into account other damage criteria, e.g. anchor penetration depth.

Anchor Damage Assessment of Subsea Pipelines
118
REFERENCES
1. Aberdeen. Health & Safety Executive. (2009). Guidelines for pipeline operators on
pipeline anchor hazards. Retrieved from http://www.hse.gov.uk/pipelines/pipeline-
anchor-hazards.pdf.
2. Alexander, C., Aalders. A., Bath, W., Vyvial, B., Dotson, R., & Seal D. (2012).
Evaluating Anchor Impact Damage to the Subsea Canyon Chief Pipeline Using Analysis
and Full-Scale Testing Methods. 9th International Pipeline Conference. Doi:
10.1115/IPC2012-90578.
3. Anchors and anchoring. (2012). Retrieved from
https://www.bimco.org/en/Education/Seascapes/Sea_View/2012_10_10_Anchors_and_a
nchoring.aspx.
4. Australian Transport Safety Bureau. (2008). Independent Investigation into the Rupture
of A Submarine Gas Pipeline By The Hong Kong Registered Container Ship. Retrieved
from https://www.atsb.gov.au/media/1373626/mo2008012.pdf.
5. Automatic Identification System. (2015). In Wikipedia, the Free Encyclopedia. Retrieved
from
http://en.wikipedia.org/w/index.php?title=Automatic_Identification_System&oldid=6642
37804.
6. Bai, Y., & Bai, Q. (2001). Pipelines and Risers. Elsevier Ocean Engineering Series.
7. Bai, Y., & Hauch, S. (2001). Collapse Capacity of Corroded Pipes under Combined
Pressure, Longitudinal Force and Bending. International Society of Offshore and Polar
Engineers.
8. Bai, Y., Igland, R. T., & Moan, T. (1993). Limit States of Pipes under Tension and
Bending. International Society of Offshore and Polar Engineers.
9. Bai, Y., Igland, R., & Moan, T. (1992). Collapse of Thick Tubes under Pressure, Tension,
Bending and Their Combinations. International Society of Offshore and Polar Engineers.
10. Big fine for anchoring in zone. (2015). The Marlborough Express news. Retrieved from
http://www.stuff.co.nz/marlborough-express/news/67259221/Big-fine-for-anchoring-in-
zone.
11. Blackout on Bornholm. (n.d.). JD-Contractor A/S. Retrieved from
http://www.jydskdyk.dk/HTML/News/festures/Bornholm.htm.
12. Brown, R. (1972). Pipelines Can Be Designed to Resist Impact From Dragging Anchors
and Fishing Boards. Offshore Technology Conference. Doi: 10.4043/1570-MS.
13. Burnett, D., Beckman, R., & Davenport, T. (2013). Submarine Cables: The Handbook of
Law and Policy. Martinus Nijhoff Publishers.
14. Cargo ship damages 6 submarine cables in the Baltic. (2007). Risk Panel. Retrieved from
http://www.manageriskpanel.com/page2.html.
15. Carter L., Burnett D., Drew S., Marle G., Hagadorn L., Bartlett-mcneil D., & Irvine N.
(2009). Submarine Cables and the Oceans – Connecting the World. UNEP-WCMC
Biodiversity Series No. 31. ICPC/UNEP/UNEP-WCMC.
16. Corrosion problems in production. (n.d.). Retrieved from
http://petrowiki.org/Corrosion_problems_in_production.
Anchor Damage Assessment of Subsea Pipelines
119
17. Cuthbertson, R. (2015). Eastlink Sues Newfoundland Fishing Vessel for Subsea Cable
Break. CBC News. Retrieved from http://www.cbc.ca/news/canada/nova-scotia/eastlink-
sues-newfoundland-fishing-vessel-for-subsea-cable-break-1.2987832.
18. Damaged power submarine cable causes blackout in Guimaras. (2014). INQUIRER.net
news. Retrieved from http://newsinfo.inquirer.net/620514/damaged-power-submarine-
cable-causes-blackout-in-guimaras.
19. De Silva, C. (2007). Vibration Damping, Control, and Design. CRC Press.
20. DNV Recommended Failure Rates for Pipelines. (2010). Report no/DNV Reg No.: 2009-
1115, Rev 1, 2010-11-16.
21. DNV Rules for Classification of Ships. (2011). Part 3, Chapter 3, Hull Equipment and
Safety. Retrieved from https://exchange.dnv.com/servicedocuments/dnv.
22. Further information on ageing and life extension. (n.d.). Health Safety Executive.
Retrieved from http://www.hse.gov.uk/offshore/ageing/background.htm.
23. Gerasimato, F. (2012). Критерии подобия. Работа над ошибками. [Similarity criteria.
Correction of mistakes]. Russia.
24. Gjertveit, E., Berge, J., & Opheim, B. (2010). The Kvitebjorn Gas Pipeline Repair.
Offshore Technology Conference. Doi:10.4043/20814-MS
25. Gowen, A., Goetz, M., & Waitsman, I. (1980). Choosing offshore pipeline routes:
problems and solutions. National Technical Information Service, Springfield, Virginia
22161.
26. Green, M., & Brooks, K. (n.d.). The Threat of Damage to Submarine Cables by the
Anchors of Ships Underway. Retrieved from http://cil.nus.edu.sg/wp/wp-
content/uploads/2011/04/Mick-Green-and-Keith-Brooks-The-Threat-of-Damage-to-
Submarine-Cables-by-the-Anchors-of-Cables-Underway.pdf.
27. Gudmestad, O. (2014). Lecture notes on Marine Operations. University of Stavanger,
Norway.
28. Hauch, S., & Bai, Y. (2000). Bending Moment Capacity of Groove Corroded Pipes.
International Society of Offshore and Polar Engineers.
29. Heallen, J. (2013). Noble, Mariner Take On $25M Pipeline-Damage Claim. Retrieved
from http://www.law360.com/articles/406933/noble-mariner-take-on-25m-pipeline-
damage-claim.
30. Hvam, C., Bruschi, R., Tommez, M., & Vitali, L. (1990). Risk of Pipe Damage from
Dragging Anchors. International Society of Offshore and Polar Engineers.
31. Jacobson, A. (n.d.). Corrosion - A Natural but Controllable Process. Retrieved from
https://www.nace.org/Corrosion-101/.
32. Karunakaran, D. (2014). Lectures on Pipelines and Risers. University of Stavanger,
Norway.
33. Kenedi, P., Borges, L., & Vaz, M. (2009). Plastic Collapse of Pressurized Pipes under
Bending. 20th International Congress of Mechanical Engineering, November 15-20,
2009, Gramado, RS, Brazil.
34. Lavallee, B. (2013). OSP Aweigh! The Anchor to Securing Future Bandwidth. OSP
Magazine. Retrieved from http://www.ospmag.com/issue/article/OSP-Aweigh.
35. List of pipeline accidents in the United States 1975 to 1999. (2015). In Wikipedia, The
Free Encyclopedia. Retrieved from

Anchor Damage Assessment of Subsea Pipelines
120
http://en.wikipedia.org/w/index.php?Title=List_of_pipeline_accidents_in_the_United_St
ates_1975_to_1999&oldid=664455169.
36. List of pipeline accidents in the United States in the 21st century. (2015). In Wikipedia,
The Free Encyclopedia. Retrieved from
http://en.wikipedia.org/w/index.php?Title=List_of_pipeline_accidents_in_the_United_St
ates_in_the_21st_century&oldid=663882242.
37. Liu, Y., HU, H., & Zhang,D. (2013). Probability Analysis of Damage to Offshore
Pipeline by Ship Factors. Transportation Research Board 92th 27 Annual Meeting.
38. Madory, D. (2012). East African Internet Resilience. Dyn Research. Retrieved from
http://research.dyn.com/2012/02/east-african-cable-breaks/.
39. Mooring chain. (n.d.). Retrieved from http://www.hiseamarine.com/r4-grade-mooring-
chain-1665.html.
40. Natural gas pipeline rupture causes fire on the water in Copano Bay, Texas. (2014).
Retrieved from http://sott.net/en276326.
41. Nozarian, M. (2011). Bending Moment Capacity of Defected Pipes Subjected to
Combined Loads. International Conference on Energy, Environment, Devices, Systems,
Communications, Computers (Eedscc '11), Venice, Italy, March 8-10, 2011.
42. Offshore standard. DNV-OS-E301. (2010). Position Mooring. Retrieved from
https://exchange.dnv.com/servicedocuments/dnv.
43. Offshore standard. DNV-OS-F101. (2013). Submarine Pipeline Systems. Retrieved from
https://exchange.dnv.com/servicedocuments/dnv.
44. Orszulik, S. (2013). Environmental Technology in the Oil Industry. Springer Science &
Business Media.
45. Palmer, A., & King, R. (2008). Subsea Pipeline Engineering. Pennwell Corp.
46. Palmer-Jones, R., Turner, T., John, R., & Nespeca, G. (2011). Rapid Decision-Making in
Emergency Subsea Pipeline Repair. Rio Pipeline Conference & Exposition 2011,
September, 20-22, 2011, Rio de Janeiro.
47. PARLOC 2001 Database. (2003). The Update of Loss of Containment Data for Offshore
Pipelines. Mott Macdonald Ltd.
48. Quantitative risk assessment for submarine gas pipelines. (n.d.). EIA Report. Retrieved
from
http://www.epd.gov.hk/eia/register/report/eiareport/eia_1782009/HTML/EIA%20Report/
S12_Annex%2012A.htm.
49. Recommended practice. DNV-RP-E301. (2012). Design and Installation of Fluke
Anchors. Retrieved from https://exchange.dnv.com/servicedocuments/dnv.
50. Recommended practice. DNV-RP-F107. (2010). Risk Assessment of Pipeline Protection.
Retrieved from https://exchange.dnv.com/servicedocuments/dnv.
51. Recommended practice. DNV-RP-F111. (2010). Interference between Trawl Gear and
Pipelines. Retrieved from https://exchange.dnv.com/servicedocuments/dnv.
52. Schatz, J. (2014). Damaged Submarine Cable To Blame For Slow Internet. Phuket
Gazette news. Retrieved from http://www.phuketgazette.net/phuket-
technology/Damaged-submarine-cable-blame-slow-internet/35995.
53. Ship grounding. (2015). In Wikipedia, The Free Encyclopedia. Retrieved from
http://en.wikipedia.org/w/index.php.

Anchor Damage Assessment of Subsea Pipelines
121
54. Ship. (2015). In Wikipedia, The Free Encyclopedia. Retrieved from
http://en.wikipedia.org/w/index.php?Title=Ship&oldid=663682708.
55. Sim, M. (2010). Isolation, Recovery Tools Speed Pipeline Repair. Offshore magazine.
Retrieved from http://www.offshore-mag.com/articles/print/volume-70/issue-8/flowlines-
__pipelines/isolation-recovery-tools-speed-pipeline-repair.html.
56. Spek Anchor, (n.d.). Sotra Anchor & Chain. Retrieved from http://www.sotra.net/about-
us.
57. Spurrier, N. (2009). Hard Lessons. The Institution of Engineering and Technology.
Retrieved from http://engineeringfailures.org/.
58. Sriskandarajah, T., & Wilkins, R. (2002). Assessment of Anchor Dragging On Gas
Pipelines. International Society of Offshore and Polar Engineers.
59. Strating, J. (1981). A Survey of Pipelines in The North Sea Incidents During Installation,
Testing And Operation. Offshore Technology Conference. Doi: 10.4043/4069-MS.
60. Stud Link Chain. (n.d.). SOTRA ANCHOR & CHAIN. Retrieved from
http://www.sotra.net/products/chains/studlink-common-link.
61. The future of mooring. (n.d.). The Future of Mooring. Vicinay Cadenas-eko Zuzendari
Nagusia. Retrieved from http://www.offshore-
europe.co.uk/__novadocuments/30270?V=635060255270200000.
62. Thorne, C. (1998). Penetration and Load Capacity of Marine Drag Anchors in Soft Clay.
J. Geotech. Geoenviron. Eng., 124(10), 945–953.
63. U.S. Congress, Office of Technology Assessment. (1990). Coping With an Oiled Sea: An
Analysis of Oil Spill Response Technologies. OTA-BP-O-63 (Washington, DC: U.S.
Government Printing Office, March 1990).
64. U.S. Department of the Interior Minerals Management Service. (2008). Investigation of
High Island Pipeline System Rupture Pipeline Segment No. 4879, Pipeline Right-of-way
OCS-G 5150 Galveston Area Block A-5. Retrieved from
http://www.bsee.gov/Inspection-and-Enforcement/Accidents-and-Incidents/Panel-
Investigation-Reports/2008-038-pdf/.
65. U.S. Department of the Interior Minerals Management Service. (2002). Gulf of Mexico
OCS Oil and Gas Lease Sales: 2003-2007. Retrieved from http://www.boem.gov/BOEM-
newsroom/library/Publications/2002/2002-052-vol1.aspx.
66. U.S. Department of Transportation. (2014). Fact Sheet: Material/Weld Failures.
Retrieved from http://primis.phmsa.dot.gov/comm/factsheets/fsmaterialweldfailure.htm.
67. United Kingdom. Marine Accident Investigation Branch. (2007). Report on the
Investigation of Young Lady. Retrieved from https://assets.digital.cabinet-
office.gov.uk/media/547c7025e5274a428d000077/youngladyreport.pdf.
68. United States coast guard. (1999). Investigation into the circumstances Surrounding the
barge Maria T. Retrieved from
http://www.uscg.mil/hq/cg5/cg545/docs/documents/MARIAT.pdf.
69. Vega, D., Hilgenstock, A., Rasmussen, O., Bolt, R., Cappanera, A., Rothwell, B., &
Taberkokt, A. (2006). Using or Creating Incident Databases for Natural Gas
Transmission Pipelines. Paper presented at 23rd World Gas Conference, Amsterdam, The
Netherlands, June 1–5, 2006.
70. Verley, R. (1994). Pipeline On a Flat Seabed Subjected to Trawling Or Other Limited
Duration Point Loads. International Society of Offshore and Polar Engineers.

Anchor Damage Assessment of Subsea Pipelines
122
71. Vietnamese tanker seized over damage to cable. (2014). Tradewinds news. Retrieved
from
http://www.tradewindsnews.com/archive/?Q=Vietnamese+tanker+seized+over+damage+
to+cable.
72. Vitali, L., Bruschi, R., Mork, K. J., Levold, E., & Verley, R. (1999). Hotpipe Project:
Capacity of Pipes Subject to Internal Pressure, Axial Force and Bending Moment.
International Society of Offshore and Polar Engineers.
73. Wagpco loses $30m to pipeline rupture, to resume operations soon. (2012). THE
CITIZEN online newspaper. Retrieved from http://thecitizenng.com/company-
review/wagpco-loses-30m-to-pipeline-rupture-to-resume-operations-soon/.
74. Washington National Transportation Safety Board. (1980). Safety Recommendation M-
80-043. Retrieved from
http://www.ntsb.gov/safety/_layouts/ntsb.recsearch/Recommendation.aspx?Rec=M-80-
043
75. Washington National Transportation Safety Board. (1996). Natural Gas Transmission
Pipeline Rupture and Fire. Retrieved from
http://www.ntsb.gov/investigations/accidentreports/Reports/PAR1101.pdf.
76. Winiger, B., Koziol, H., Koch, B., & Zimmermann, R. (2011). Essential Cases on
Damage. De Gruyter, Germani.
77. Woods, I. (2011). Pipelines – Insurance & Legal Aspects in Cases of Damage. Retrieved
from
http://www.mondaq.com/x/134478/Insurance/Pipelines+ndash+Insurance+Legal+Aspect
s+In+Cases+Of+Damage.
78. Work (physics). (2015). In Wikipedia, The Free Encyclopedia. Retrieved
http://en.wikipedia.org/w/index.php?Title=Work_(physics)&oldid=664595646.
79. 2008 submarine cable disruption. (2015). In Wikipedia, The Free Encyclopedia.
Retrieved from
http://en.wikipedia.org/w/index.php?Title=2008_submarine_cable_disruption&oldid=64
3239514.
80. 2011 submarine cable disruption. (2013). In Wikipedia, The Free Encyclopedia.
Retrieved from
http://en.wikipedia.org/w/index.php?Title=2011_submarine_cable_disruption&oldid=58
3233837.

Anchor Damage Assessment of Subsea Pipelines
123
APPENDIX A
Table A.1: Total number of crossing ships over the route of Pipeline 1
Number of ships in KP KP
GT category
<1000 1000-
4999
5000-
9999
10000-
24999
25000-
49999
50000-
99999 >=100000 N/a Sum
8 0-10 2 4 2 0 0 0 0 0 8
15 10-15 4 7 0 0 0 0 0 4 15
21 15-20 4 14 2 0 0 0 0 1 21
20 20-25 2 16 2 0 0 0 0 0 20
26 25-30 2 22 1 1 0 0 0 0 26
27 30-35 2 21 2 1 0 0 0 1 27
50 35-40 3 42 2 0 1 0 0 2 50
37 40-45 0 32 3 0 0 0 0 2 37
28 45-50 3 22 1 0 1 0 0 1 28
17 50-55 0 15 1 0 0 0 0 1 17
8 55-60 0 7 0 0 1 0 0 0 8
12 60-65 3 7 1 1 0 0 0 0 12
14 65-70 0 12 2 0 0 0 0 0 14
51 70-75 1 16 4 7 17 5 0 1 51
19 75-80 1 5 3 1 6 3 0 0 19
71 80-85 0 24 21 11 4 8 0 3 71
114 85-90 2 20 23 23 26 17 3 0 114
57 90-95 2 9 5 16 15 9 1 0 57
2 95-100 0 1 0 0 0 0 1 0 2
9 100-105 2 6 1 0 0 0 0 0 9
4 105-110 0 4 0 0 0 0 0 0 4
2 110-115 0 1 0 0 1 0 0 0 2
2 115-120 0 1 0 0 0 1 0 0 2
3 120-125 0 0 1 1 0 1 0 0 3

Anchor Damage Assessment of Subsea Pipelines
124
1 125-130 0 0 0 0 0 1 0 0 1
5 130-135 0 1 2 1 0 1 0 0 5
6 135-140 0 3 0 2 0 1 0 0 6
3 140-145 0 2 0 0 1 0 0 0 3
2 145-150 0 0 0 0 1 1 0 0 2
2 150-155 0 1 0 0 0 1 0 0 2
0 155-160 0 0 0 0 0 0 0 0 0
0 160-165 0 0 0 0 0 0 0 0 0
1 165-170 0 0 0 0 1 0 0 0 1
6 170-175 0 1 2 2 0 1 0 0 6
2 175-180 0 1 0 1 0 0 0 0 2
5 180-185 0 2 2 0 0 1 0 0 5
13 185-190 2 6 3 0 0 2 0 0 13
11 190-195 1 4 3 0 0 3 0 0 11
11 195-200 1 5 2 1 1 1 0 0 11
9 200-205 2 3 2 0 0 2 0 0 9
7 205-210 1 3 1 1 1 0 0 0 7
8 210-215 1 2 3 0 0 0 0 2 8
7 215-220 1 6 0 0 0 0 0 0 7
4 220-225 0 4 0 0 0 0 0 0 4
10 225-230 2 4 2 2 0 0 0 0 10
8 230-235 0 6 2 0 0 0 0 0 8
4 235-240 0 2 1 0 1 0 0 0 4
11 240-245 1 8 0 1 0 0 0 1 11
15 245-250 0 5 6 1 2 1 0 0 15
4 250-255 1 2 0 0 1 0 0 0 4
2 255-260 0 1 0 0 1 0 0 0 2
4 260-265 1 1 0 1 0 0 0 1 4
4 265-270 1 2 0 0 0 1 0 0 4
4 270-275 0 3 0 0 0 1 0 0 4
9 275-280 1 3 1 3 0 1 0 0 9

Anchor Damage Assessment of Subsea Pipelines
125
24 280-285 4 4 4 3 6 2 0 1 24
2 285-290 1 1 0 0 0 0 0 0 2
2 290-295 0 1 1 0 0 0 0 0 2
1 295-300 0 0 0 0 0 0 0 1 1
0 300-305 0
Table A.2: The distribution of the ships classified by the gross tonnage index
<1000
(1)
1000-
4999 (2)
5000-
9999 (3)
10000-
24999
(4)
25000-
49999
(5)
50000-
99999
(6)
>=100000
(7)
n/a
54 395 114 81 88 65 5 22 824
6,73% 49,25% 14,21% 10,10% 10,97% 8,10% 0,62% 100,00%
Table A.3: Total number of different anchors classified by their EL and average speed
EL Number of EL Average Speed,
knots
Average Speed,
m/s
e 6 10 5,30
f 4 12 6,14
g 8 9 4,64
h 3 11 5,81
i 13 10 5,32
j 9 11 5,75
k 22 11 5,62
l 21 11 5,63
m 23 11 5,53
n 22 11 5,88
o 75 10 5,27
p 31 11 5,77
q 29 11 5,74

Anchor Damage Assessment of Subsea Pipelines
126
r 35 10 5,36
s 19 11 5,49
t 22 12 6,13
u 31 11 5,73
v 31 11 5,58
w 28 12 6,03
x 18 10 5,21
y 19 12 5,94
z 13 10 5,23
A 10 13 6,43
B 22 11 5,69
C 21 10 5,32
D 18 11 5,51
E 16 12 6,34
F 17 8 4,08
G 6 10 4,98
H 9 12 6,30
I 14 10 5,36
J 16 11 5,71
K 14 10 4,89
L 12 10 4,99
M 8 10 5,11
N 11 11 5,41
O 12 10 4,92
P 22 11 5,50
Q 17 10 5,11
S 1 9 4,42
T 16 11 5,42
U 9 11 5,90

Anchor Damage Assessment of Subsea Pipelines
127
V 12 11 5,81
X 11 11 5,54
Y 5 12 6,05
Z 3 12 6,36
A* 6 9 4,66
B* 7 11 5,70
E* 5 16 8,25
Table A.4: Small Letter anchor classes capable of approaching the pipeline
KP
WD, m
e f g h i j k l m n o p q r s t u v w x y z
-52 -47 -67 -57 -68 -70 -73 -80 -83 -86 -96 -96 -99 -107 -112 -103 -111 -122 -116 -134 -127 -143
0-10 -175 0 0 0 0 0 0 0 0 0 0 0 0 0 0 0 0 0 0 0 0 0 0
10-15 -262,5 0 0 0 0 0 0 0 0 0 0 0 0 0 0 0 0 0 0 0 0 0 0
15-20 -350 0 0 0 0 0 0 0 0 0 0 0 0 0 0 0 0 0 0 0 0 0 0
20-25 -321 0 0 0 0 0 0 0 0 0 0 0 0 0 0 0 0 0 0 0 0 0 0
25-30 -292 0 0 0 0 0 0 0 0 0 0 0 0 0 0 0 0 0 0 0 0 0 0
30-35 -274 0 0 0 0 0 0 0 0 0 0 0 0 0 0 0 0 0 0 0 0 0 0
35-40 -256 0 0 0 0 0 0 0 0 0 0 0 0 0 0 0 0 0 0 0 0 0 0
40-45 -274 0 0 0 0 0 0 0 0 0 0 0 0 0 0 0 0 0 0 0 0 0 0
45-50 -292 0 0 0 0 0 0 0 0 0 0 0 0 0 0 0 0 0 0 0 0 0 0
50-55 -288 0 0 0 0 0 0 0 0 0 0 0 0 0 0 0 0 0 0 0 0 0 0
55-60 -284 0 0 0 0 0 0 0 0 0 0 0 0 0 0 0 0 0 0 0 0 0 0
60-65 -287 0 0 0 0 0 0 0 0 0 0 0 0 0 0 0 0 0 0 0 0 0 0
65-70 -290 0 0 0 0 0 0 0 0 0 0 0 0 0 0 0 0 0 0 0 0 0 0
70-75 -287 0 0 0 0 0 0 0 0 0 0 0 0 0 0 0 0 0 0 0 0 0 0
75-80 -284 0 0 0 0 0 0 0 0 0 0 0 0 0 0 0 0 0 0 0 0 0 0
80-85 -284 0 0 0 0 0 0 0 0 0 0 0 0 0 0 0 0 0 0 0 0 0 0
85-90 -284 0 0 0 0 0 0 0 0 0 0 0 0 0 0 0 0 0 0 0 0 0 0
90-95 -284 0 0 0 0 0 0 0 0 0 0 0 0 0 0 0 0 0 0 0 0 0 0

Anchor Damage Assessment of Subsea Pipelines
128
95-100 -284 0 0 0 0 0 0 0 0 0 0 0 0 0 0 0 0 0 0 0 0 0 0
100-105 -284 0 0 0 0 0 0 0 0 0 0 0 0 0 0 0 0 0 0 0 0 0 0
105-110 -284 0 0 0 0 0 0 0 0 0 0 0 0 0 0 0 0 0 0 0 0 0 0
110-115 -280 0 0 0 0 0 0 0 0 0 0 0 0 0 0 0 0 0 0 0 0 0 0
115-120 -276 0 0 0 0 0 0 0 0 0 0 0 0 0 0 0 0 0 0 0 0 0 0
120-125 -268 0 0 0 0 0 0 0 0 0 0 0 0 0 0 0 0 0 0 0 0 0 0
125-130 -260 0 0 0 0 0 0 0 0 0 0 0 0 0 0 0 0 0 0 0 0 0 0
130-135 -255 0 0 0 0 0 0 0 0 0 0 0 0 0 0 0 0 0 0 0 0 0 0
135-140 -250 0 0 0 0 0 0 0 0 0 0 0 0 0 0 0 0 0 0 0 0 0 0
140-145 -233 0 0 0 0 0 0 0 0 0 0 0 0 0 0 0 0 0 0 0 0 0 0
145-150 -216 0 0 0 0 0 0 0 0 0 0 0 0 0 0 0 0 0 0 0 0 0 0
150-155 -188 0 0 0 0 0 0 0 0 0 0 0 0 0 0 0 0 0 0 0 0 0 0
155-160 -160 0 0 0 0 0 0 0 0 0 0 0 0 0 0 0 0 0 0 0 0 0 0
160-165 -150 0 0 0 0 0 0 0 0 0 0 0 0 0 0 0 0 0 0 0 0 0 0
165-170 -140 0 0 0 0 0 0 0 0 0 0 0 0 0 0 0 0 0 0 0 0 0 1
170-175 -136 0 0 0 0 0 0 0 0 0 0 0 0 0 0 0 0 0 0 0 0 0 1
175-180 -132 0 0 0 0 0 0 0 0 0 0 0 0 0 0 0 0 0 0 0 1 0 1
180-185 -126 0 0 0 0 0 0 0 0 0 0 0 0 0 0 0 0 0 0 0 1 1 1
185-190 -120 0 0 0 0 0 0 0 0 0 0 0 0 0 0 0 0 0 1 0 1 1 1
190-195 -118 0 0 0 0 0 0 0 0 0 0 0 0 0 0 0 0 0 1 0 1 1 1
195-200 -116 0 0 0 0 0 0 0 0 0 0 0 0 0 0 0 0 0 1 1 1 1 1
200-205 -118 0 0 0 0 0 0 0 0 0 0 0 0 0 0 0 0 0 1 0 1 1 1
205-210 -120 0 0 0 0 0 0 0 0 0 0 0 0 0 0 0 0 0 1 0 1 1 1
210-215 -119 0 0 0 0 0 0 0 0 0 0 0 0 0 0 0 0 0 1 0 1 1 1
215-220 -118 0 0 0 0 0 0 0 0 0 0 0 0 0 0 0 0 0 1 0 1 1 1
220-225 -118 0 0 0 0 0 0 0 0 0 0 0 0 0 0 0 0 0 1 0 1 1 1
225-230 -119 0 0 0 0 0 0 0 0 0 0 0 0 0 0 0 0 0 1 0 1 1 1
230-235 -116 0 0 0 0 0 0 0 0 0 0 0 0 0 0 0 0 0 1 0 1 1 1
235-240 -114 0 0 0 0 0 0 0 0 0 0 0 0 0 0 0 0 0 1 1 1 1 1

Anchor Damage Assessment of Subsea Pipelines
129
240-245 -110 0 0 0 0 0 0 0 0 0 0 0 0 0 0 1 0 1 1 1 1 1 1
245-250 -106 0 0 0 0 0 0 0 0 0 0 0 0 0 1 1 0 1 1 1 1 1 1
250-255 -103 0 0 0 0 0 0 0 0 0 0 0 0 0 1 1 1 1 1 1 1 1 1
255-260 -100 0 0 0 0 0 0 0 0 0 0 0 0 0 1 1 1 1 1 1 1 1 1
260-265 -99 0 0 0 0 0 0 0 0 0 0 0 0 0 1 1 1 1 1 1 1 1 1
265-270 -98 0 0 0 0 0 0 0 0 0 0 0 0 1 1 1 1 1 1 1 1 1 1
270-275 -95 0 0 0 0 0 0 0 0 0 0 1 1 1 1 1 1 1 1 1 1 1 1
275-280 -92 0 0 0 0 0 0 0 0 0 0 1 1 1 1 1 1 1 1 1 1 1 1
280-285 -86 0 0 0 0 0 0 0 0 0 0 1 1 1 1 1 1 1 1 1 1 1 1
285-290 -80 0 0 0 0 0 0 0 0 1 1 1 1 1 1 1 1 1 1 1 1 1 1
290-295 -79 0 0 0 0 0 0 0 1 1 1 1 1 1 1 1 1 1 1 1 1 1 1
295-300 -78 0 0 0 0 0 0 0 1 1 1 1 1 1 1 1 1 1 1 1 1 1 1
300-305 -78 0 0 0 0 0 0 0 1 1 1 1 1 1 1 1 1 1 1 1 1 1 1
Table A.5: Capital Letters anchor classes capable of approaching the line
KP
WD,
m
A B C D E F G H I J K L M N O P Q S T U V X Y Z
-
122
-
143
-
154
-
151
-
142
-
205
-
179
-
156
-
181
-
174
-
207
-
206
-
205
-
206
-
224
-
207
-
230
-
260
-
235
-
222
-
227
-
248
-
233
-
226
0-10 -175 0 0 0 0 0 1 1 0 1 0 1 1 1 1 1 1 1 1 1 1 1 1 1 1
10-15 -262 0 0 0 0 0 0 0 0 0 0 0 0 0 0 0 0 0 0 0 0 0 0 0 0
15-20 -350 0 0 0 0 0 0 0 0 0 0 0 0 0 0 0 0 0 0 0 0 0 0 0 0
20-25 -321 0 0 0 0 0 0 0 0 0 0 0 0 0 0 0 0 0 0 0 0 0 0 0 0
25-30 -292 0 0 0 0 0 0 0 0 0 0 0 0 0 0 0 0 0 0 0 0 0 0 0 0
30-35 -274 0 0 0 0 0 0 0 0 0 0 0 0 0 0 0 0 0 0 0 0 0 0 0 0
35-40 -256 0 0 0 0 0 0 0 0 0 0 0 0 0 0 0 0 0 1 0 0 0 0 0 0
40-45 -274 0 0 0 0 0 0 0 0 0 0 0 0 0 0 0 0 0 0 0 0 0 0 0 0
45-50 -292 0 0 0 0 0 0 0 0 0 0 0 0 0 0 0 0 0 0 0 0 0 0 0 0
50-55 -288 0 0 0 0 0 0 0 0 0 0 0 0 0 0 0 0 0 0 0 0 0 0 0 0
55-60 -284 0 0 0 0 0 0 0 0 0 0 0 0 0 0 0 0 0 0 0 0 0 0 0 0

Anchor Damage Assessment of Subsea Pipelines
130
60-65 -287 0 0 0 0 0 0 0 0 0 0 0 0 0 0 0 0 0 0 0 0 0 0 0 0
65-70 -290 0 0 0 0 0 0 0 0 0 0 0 0 0 0 0 0 0 0 0 0 0 0 0 0
70-75 -287 0 0 0 0 0 0 0 0 0 0 0 0 0 0 0 0 0 0 0 0 0 0 0 0
75-80 -284 0 0 0 0 0 0 0 0 0 0 0 0 0 0 0 0 0 0 0 0 0 0 0 0
80-85 -284 0 0 0 0 0 0 0 0 0 0 0 0 0 0 0 0 0 0 0 0 0 0 0 0
85-90 -284 0 0 0 0 0 0 0 0 0 0 0 0 0 0 0 0 0 0 0 0 0 0 0 0
90-95 -284 0 0 0 0 0 0 0 0 0 0 0 0 0 0 0 0 0 0 0 0 0 0 0 0
95-100 -284 0 0 0 0 0 0 0 0 0 0 0 0 0 0 0 0 0 0 0 0 0 0 0 0
100-105 -284 0 0 0 0 0 0 0 0 0 0 0 0 0 0 0 0 0 0 0 0 0 0 0 0
105-110 -284 0 0 0 0 0 0 0 0 0 0 0 0 0 0 0 0 0 0 0 0 0 0 0 0
110-115 -280 0 0 0 0 0 0 0 0 0 0 0 0 0 0 0 0 0 0 0 0 0 0 0 0
115-120 -276 0 0 0 0 0 0 0 0 0 0 0 0 0 0 0 0 0 0 0 0 0 0 0 0
120-125 -268 0 0 0 0 0 0 0 0 0 0 0 0 0 0 0 0 0 0 0 0 0 0 0 0
125-130 -260 0 0 0 0 0 0 0 0 0 0 0 0 0 0 0 0 0 1 0 0 0 0 0 0
130-135 -255 0 0 0 0 0 0 0 0 0 0 0 0 0 0 0 0 0 1 0 0 0 0 0 0
135-140 -250 0 0 0 0 0 0 0 0 0 0 0 0 0 0 0 0 0 1 0 0 0 0 0 0
140-145 -233 0 0 0 0 0 0 0 0 0 0 0 0 0 0 0 0 0 1 1 0 0 1 0 0
145-150 -216 0 0 0 0 0 0 0 0 0 0 0 0 0 0 1 0 1 1 1 1 1 1 1 1
150-155 -188 0 0 0 0 0 1 0 0 0 0 1 1 1 1 1 1 1 1 1 1 1 1 1 1
155-160 -160 0 0 0 0 0 1 1 0 1 1 1 1 1 1 1 1 1 1 1 1 1 1 1 1
160-165 -150 0 0 1 1 0 1 1 1 1 1 1 1 1 1 1 1 1 1 1 1 1 1 1 1
165-170 -140 0 1 1 1 1 1 1 1 1 1 1 1 1 1 1 1 1 1 1 1 1 1 1 1
170-175 -136 0 1 1 1 1 1 1 1 1 1 1 1 1 1 1 1 1 1 1 1 1 1 1 1
175-180 -132 0 1 1 1 1 1 1 1 1 1 1 1 1 1 1 1 1 1 1 1 1 1 1 1
180-185 -126 0 1 1 1 1 1 1 1 1 1 1 1 1 1 1 1 1 1 1 1 1 1 1 1
185-190 -120 1 1 1 1 1 1 1 1 1 1 1 1 1 1 1 1 1 1 1 1 1 1 1 1
190-195 -118 1 1 1 1 1 1 1 1 1 1 1 1 1 1 1 1 1 1 1 1 1 1 1 1
195-200 -116 1 1 1 1 1 1 1 1 1 1 1 1 1 1 1 1 1 1 1 1 1 1 1 1
200-205 -118 1 1 1 1 1 1 1 1 1 1 1 1 1 1 1 1 1 1 1 1 1 1 1 1

Anchor Damage Assessment of Subsea Pipelines
131
205-210 -120 1 1 1 1 1 1 1 1 1 1 1 1 1 1 1 1 1 1 1 1 1 1 1 1
210-215 -119 1 1 1 1 1 1 1 1 1 1 1 1 1 1 1 1 1 1 1 1 1 1 1 1
215-220 -118 1 1 1 1 1 1 1 1 1 1 1 1 1 1 1 1 1 1 1 1 1 1 1 1
220-225 -118 1 1 1 1 1 1 1 1 1 1 1 1 1 1 1 1 1 1 1 1 1 1 1 1
225-230 -119 1 1 1 1 1 1 1 1 1 1 1 1 1 1 1 1 1 1 1 1 1 1 1 1
230-235 -116 1 1 1 1 1 1 1 1 1 1 1 1 1 1 1 1 1 1 1 1 1 1 1 1
235-240 -114 1 1 1 1 1 1 1 1 1 1 1 1 1 1 1 1 1 1 1 1 1 1 1 1
240-245 -110 1 1 1 1 1 1 1 1 1 1 1 1 1 1 1 1 1 1 1 1 1 1 1 1
245-250 -106 1 1 1 1 1 1 1 1 1 1 1 1 1 1 1 1 1 1 1 1 1 1 1 1
250-255 -103 1 1 1 1 1 1 1 1 1 1 1 1 1 1 1 1 1 1 1 1 1 1 1 1
255-260 -100 1 1 1 1 1 1 1 1 1 1 1 1 1 1 1 1 1 1 1 1 1 1 1 1
260-265 -99 1 1 1 1 1 1 1 1 1 1 1 1 1 1 1 1 1 1 1 1 1 1 1 1
265-270 -98 1 1 1 1 1 1 1 1 1 1 1 1 1 1 1 1 1 1 1 1 1 1 1 1
270-275 -95 1 1 1 1 1 1 1 1 1 1 1 1 1 1 1 1 1 1 1 1 1 1 1 1
275-280 -92 1 1 1 1 1 1 1 1 1 1 1 1 1 1 1 1 1 1 1 1 1 1 1 1
280-285 -86 1 1 1 1 1 1 1 1 1 1 1 1 1 1 1 1 1 1 1 1 1 1 1 1
285-290 -80 1 1 1 1 1 1 1 1 1 1 1 1 1 1 1 1 1 1 1 1 1 1 1 1
290-295 -79 1 1 1 1 1 1 1 1 1 1 1 1 1 1 1 1 1 1 1 1 1 1 1 1
295-300 -78 1 1 1 1 1 1 1 1 1 1 1 1 1 1 1 1 1 1 1 1 1 1 1 1
300-305 -78 1 1 1 1 1 1 1 1 1 1 1 1 1 1 1 1 1 1 1 1 1 1 1 1
Table A.6: Capital Letters with star anchor classes capable of hooking the pipeline
KP
WD, m
A* B* E*
-284,928 -251,631 -200,756
0-10 -175 1 1 1
10-15 -262,5 1 0 0
15-20 -350 0 0 0
20-25 -321 0 0 0
25-30 -292 0 0 0

Anchor Damage Assessment of Subsea Pipelines
132
30-35 -274 1 0 0
35-40 -256 1 0 0
40-45 -274 1 0 0
45-50 -292 0 0 0
50-55 -288 0 0 0
55-60 -284 1 0 0
60-65 -287 0 0 0
65-70 -290 0 0 0
70-75 -287 0 0 0
75-80 -284 1 0 0
80-85 -284 1 0 0
85-90 -284 1 0 0
90-95 -284 1 0 0
95-100 -284 1 0 0
100-105 -284 1 0 0
105-110 -284 1 0 0
110-115 -280 1 0 0
115-120 -276 1 0 0
120-125 -268 1 0 0
125-130 -260 1 0 0
130-135 -255 1 0 0
135-140 -250 1 1 0
140-145 -233 1 1 0
145-150 -216 1 1 0
150-155 -188 1 1 1
155-160 -160 1 1 1
160-165 -150 1 1 1
165-170 -140 1 1 1
170-175 -136 1 1 1

Anchor Damage Assessment of Subsea Pipelines
133
175-180 -132 1 1 1
180-185 -126 1 1 1
185-190 -120 1 1 1
190-195 -118 1 1 1
195-200 -116 1 1 1
200-205 -118 1 1 1
205-210 -120 1 1 1
210-215 -119 1 1 1
215-220 -118 1 1 1
220-225 -118 1 1 1
225-230 -119 1 1 1
230-235 -116 1 1 1
235-240 -114 1 1 1
240-245 -110 1 1 1
245-250 -106 1 1 1
250-255 -103 1 1 1
255-260 -100 1 1 1
260-265 -99 1 1 1
265-270 -98 1 1 1
270-275 -95 1 1 1
275-280 -92 1 1 1
280-285 -86 1 1 1
285-290 -80 1 1 1
290-295 -79 1 1 1
295-300 -78 1 1 1
300-305 -78 1 1 1