brage.bibsys.no · web viewcomputed tomography, the development of which was first driven by...
TRANSCRIPT

Journal of Applied Crystallography research papers
Rietveld Analysis of Computed Tomography and its Application to Methanol to Olefin Reactor Beds
Authors
David Stephen Wragga*, Matthew G. O'Brienbb, Marco Di Michielc and Francesca Lønstad-
Blekend
aInGAP Centre for reserach Based Innovation, Department of Chemistry, University of Oslo, PO Box
1033 Blindern, Oslo, 0315, NorwaybInorganic Chemistry, University of Utrecht, Universiteitsweg 99, Utrecht, 3584, The Netherlandsc The European Synchrotron, CS 40220, Grenoble Cedex 9, 38043, FrancedSINTEF Materials and Chemistry, SINTEF, Forskningsveien 1, Oslo, 0314, Norway
Correspondence email: [email protected]
Synopsis Tomographic reconstructions of zeolite catalyst beds using structural data extracted by
parametric Rietveld refinement show small but significant 3D variations in the degree of catalyst
deactivation after reaction.
Abstract We have created tomographic reconstructions giving three dimensional data on the
distribution of various structural features for SAPO-34 zeolite catalyst beds used in the commercially
important methanol to olefin (MTO) conversion process. The data were processed using parametric
Rietveld refinement to treat entire slices of the tomograph as single refined datasets, allowing
extraction of real structural parameters from all voxels of the reconstruction. This has the advantage
over more traditional methods of XRD-computed tomography using peak intensities, that the
structural parameters are independent of the intensity, meaning that information can still be extracted
from poor datasets: an example is shown where part of the sample was no longer in the beam during
data collection. Reconstructions using several structural parameters are presented and the results
compared. Analysis of the variation of the catalyst c-axis (linked to degree of deactivation in earlier
work) shows small but significant 3D variations in the degree of deactivation with patterns which
depend on the silicon content of the catalyst. Average data for the tomographic slices compare well
with the results of earlier in operando 2D reactor scanning experiments.
1. Introduction
In the quest to understand catalytic materials, the variety and location of their active sites under
working conditions, it is essential to have in situ data with both time and space resolution (Buurmans
IMPORTANT: this document contains embedded data - to preserve data integrity, please ensure where possible that the IUCr Word tools (available from http://journals.iucr.org/services/docxtemplate/) are installed when editing this document.
1
Journal of Applied Crystallography research papers
& Weckhuysen, 2012, Beale et al., 2010), i.e. to see where the catalyst is active and when. X-ray
computed tomography, the development of which was first driven by medical imaging applications, is
now recognized as an important technique in the study of all kinds of materials (Hounsfield, 1973,
Lauterbur, 1973, Harding et al., 1987, Arnberg & Mathiesen, 2007, Bertrand et al., 2012, Adams,
2013). X-ray diffraction computed tomography (XRD-CT) (Harding & Kosanetzky, 1989) is
becoming a broadly applicable technique for studying the 3-dimensional structure of catalysts, both as
individual bodies and beds (Beale et al., 2010). It is now possible to collect data fast enough to carry
out time resolved tomographic studies of reactions with XRD (Jacques et al., 2011). However, so far
most of the analysis carried out has been based on simple observations from the diffraction patterns,
for example, phase identification and quantification or crystallite size analysis from single peaks; or
analysis of the total integrated intensity over a selected Q-range (Harding et al., 1990, Hall et al.,
1996, Hall et al., 1998, Espinosa-Alonso et al., 2009, Lazzari et al., 2009, Jacques et al., 2011,
Alvarez-Murga et al., 2011, O'Brien et al., 2012, Álvarez-Murga et al., 2012, Alvarez-Murga et al.,
2012, Voltolini et al., 2013). Bleuet et al reported Rietveld analysis of selected data points in an XRD
tomographic reconstruction in 2009 (Bleuet et al., 2008). Palancher et al have shown that it is possible
to carry out Rietveld quantitative analysis on a complete, sub-micrometer resolution, tomographic
dataset (Palancher et al., 2011) and Scarlett et al have carried out parametric Rietveld quantitative
analysis on energy dispersive XRD tomographic data but did not reconstruct 3-dimensional images of
their electrochemical cells (Scarlett et al., 2009), although they were able to measure electrode
thickness as a function of time from the data. De Nolf and co-workers have recently developed
dedicated software (XRDUA) for full profile quantitative analysis and tomographic reconstruction
using powder diffraction data, especially from non-ideal powders (i.e. powders where the Debye rings
contain poorly averaged Bragg spots due to large single crystals in the sample) (De Nolf et al., 2014).
Egan et al have r used Le Bail fitting methods to perform tomographic reconstructions of teeth based
on the lattice parameters, strain and preferred orientation of the phases present (Egan et al., 2013).
Korsunsky et al used full profile methods to extract lattice parameters and thereby study strain in
XRD-CT reconstructions of aeronautical nickel alloy and dental prostheses (Korsunsky et al., 2006,
Korsunsky et al., 2011). Recent work by Bonnin et al has also combined and compared Rietveld
analysis of phases in a tomographic reconstruction with grain indexing to give the orientations of the
individual crystallites in the sample from “spotty” 2D XRD patterns (Bonnin et al., 2014). Jacques et
al have shown the validity of pair distribution function analysis for tomographic data; obtaining
crystallite size and phase distribution data from working catalysts (Jacques et al., 2013), a very
interesting contribution which opens up the possibility of studying none crystalline materials and
nanosized particles.
Here we present crystal structure analysis of complete XRD-CT reconstructions of catalyst beds used
in the industrially important methanol to olefin (MTO) conversion process (Barger, 2002) using
2

Journal of Applied Crystallography research papers
parametric Rietveld methods. These methods have allowed us to refine atom positions, link related
parameters across all the powder patterns in the tomographic datasets and make the whole process
faster and easier.
The catalyst used in the MTO process is the zeolite-type framework SAPO-34. SAPO-34 is derived
from the AlPO-34 structure: a rhombohedral (spacegroup R-3, a ≈ 13.85, c ≈ 14.8 Å in the hexagonal
setting used here; chabazite zeolite framework) open framework made up of aluminium and
phosphorus atoms tetrahedrally coordinated by oxygen. The framework forms large internal cages
(chabazite cages in the zeolite nomenclature) which can be accessed through windows of 6 and 8
tetrahedral atoms (figure 1).
Figure 1.
To make AlPO-34 catalytically active in the MTO process we replace some of the phosphorus atoms
with silicon. In order to balance the charge of the framework when Si4+ replaces P5+, protons are
coordinated to the framework. These “acid sites” help to convert methanol into hydrocarbons inside
the cages, the % of silicon substituted into the tetrahedral sites is therefore commonly used as an
indicator of acidity (up to 8 % silicon substitution can give a structure with no Si-O-Si linkages and
therefore 1 acid site per silicon in the framework) (Stöcker, 1999). The size of the windows controls
the products which can leave the cages (Hereijgers et al., 2009) making the catalyst very selective for
the olefins ethene, propene and butene- high value chemical building blocks. The structure which
makes SAPO-34 such an effective catalyst for the MTO process also leads to its most significant
problem: the cages, after a time, fill with aromatic hydrocarbons which are too large to escape through
the 8-tetrahedral atom windows (coke) and this deactivates the catalyst. The catalyst can be
regenerated by burning out the hydrocarbon coke at high temperature (calcination), but this requires
MTO plants to utilise expensive and complex circulating bed technology and may be connected to the
long term deactivation of the catalyst due to loss of acidity (Barger, 2002). The link between filling of
the cages, deactivation of the catalyst and expansion of the crystal structure was first observed in in
operando experiments using a capillary microreactor (Wragg et al., 2009) and has since been studied
for other frameworks (Wragg et al., 2011, Wragg, Bleken, et al., 2013). The overall aim of our studies
of this material is to extend the active lifetime of the industrial catalyst and reduce the long term loss
of acidity.
The structural parameters obtained from the refinements carried out here on the XRD-CT data appear
to show preferred reactant paths through the bed, leading to varying degrees of deactivation in
different parts of the bed. The tomographic approach reveals variations in the catalyst structure within
depth slices of the bed as well as average trends from inlet to outlet which can be compared with the
previously reported in situ z-scan data on this reaction (Wragg et al., 2012). Such variations may be
significant for future test reactor designs. Furthermore, Rietveld-CT allows us to extract information
3

Journal of Applied Crystallography research papers
from datasets which would be extremely hard to analyse with conventional XRD-CT methods, by
imaging with parameters which are not correlated with the overall intensity.
2. Experimental
SAPO-34 Catalysts were obtained from SINTEF Oslo (prepared by the method of Wendelbo et al
(Wendelbo et al., 1998)) and pressed and sieved to a particle size of between 0.25 and 0.42 mm.
Tomographic data were collected at the high energy beamline ID15B of the ESRF. The catalyst beds
(100 mg catalyst) were prepared in a 4 mm internal diameter glass tubes and exposed to a flow of
helium gas bubbled through methanol at 19.5 °C (flowing from bottom to top). The flow rate was 50
ml min-1. The reactor was heated with a pair of Leister LE Mini heat guns and the reaction
temperature varied between 346 °C at the top of the catalyst bed to 338°C at the bottom. The reactor
tube and heat guns were mounted on a Huber stage capable of rotation and translation in the x, y and z
directions and a Pixium area detector was used. The sample to detector distance was calibrated at
1473 mm using NIST SRM660a lanthanum hexaboride and the wavelength was 0.14257 Å (89.965
keV). Prior to collection of the XRD-CT data the reaction gas flow was switched to pure helium and
the reactor was cooled to room temperature as rapidly as the heat guns would allow. The exposure
time was 1 second per frame and collection of a dataset suitable for tomographic reconstruction took
around 7 hours. The series of 2D diffraction images were radially integrated to 1D powder patterns
using the program DATASQUEEZE, these raw diffraction images were used for tomographic
reconstruction in the program Snark93 (Browne et al., 1993). The data collection strategy and
methods of reconstruction are described in detail elsewhere (Jacques et al., 2011, O'Brien et al.,
2012). 5 slices of tomographic data, evenly spaced from the reactor inlet to the top of the bed, were
collected for each sample, with a beam size of 0.1 mm. The approximate locations of the five slices
are shown in supporting figure S1.
The reconstructed datasets now consisted of a set of powder XRD patterns, each representing the total
diffraction from a 0.1 mm cubic voxel in the tomographic reconstruction. These patterns were refined
using the parametric Rietveld method (Stinton & Evans, 2007) with the program TOPAS 4.2 (Coelho,
2006). The stability of the refinement method is such that it was possible to refine each slice of the
reconstruction as a complete dataset, including the empty volumes and the glass sides of the reactor.
Further information on the fitting process is given in the supporting information. We refer to this
reconstruction hereafter as the Rietveld-CT of the data.
The structural model used is described in earlier publications (Wragg et al., 2011, Wragg, Groenvold,
et al., 2013, Wragg et al., 2009, Wragg et al., 2010, Wragg et al., 2012, Zokaie et al., 2013) and uses
“dummy” carbon atom positions to estimate the occupancy of the SAPO-34 cages (i.e. the
hydrocarbon coke which builds up in the cages and deactivates the catalyst during the MTO process)
and help prevent the framework structure collapsing during refinement due to the electron density in
4

Journal of Applied Crystallography research papers
the cages. The refinements were split into tomographic slices of 50 x 50 voxels, i.e. 2500 powder
patterns were refined simultaneously as a single surface of Rietveld data. For the fully reacted 8 % Si
sample a 53 x 53 voxel area was refined as the sample moved slightly during data collection and some
sections were outside the initial 50 x 50 range. The zero error, tan-θ sample broadening term (O'Brien
et al., 2011), scale factor and quartz background peak position (see background treatment below) were
refined as single parameters applied to all patterns in each slice (thus applying a constant, but refined
line position shift to all patterns in each tomographic slice as discussed by Palancher et al (Palancher
et al., 2011)). No preferred orientation corrections were applied as earlier flat plate PXRD studies of
SAPO-34 by various authors (see Stöcker’s review of MTO chemistry) (Stöcker, 1999) show no sign
preferred orientation effects when compared to capillary measurements.
Two isotropic thermal parameters (Biso) were refined in each powder pattern one for the tetrahedral
atoms (Al/Si/P; T-atoms) and one for oxygen. Maximum and minimum limits of 10 and 1 were placed
on these parameters. Refinement with Biso fixed across all powder patterns for the two atom groups
was also carried out, based on the assumption that thermal factors should be equal as the atoms are at
the same temperature everywhere in the cooled reactor bed. Such an approach is not without
precedent; Agostini et al used parametric methods to improve the refinement of site occupancies
during zeolite template removal by parameterising a linear variation of atomic positions with
temperature (Agostini et al., 2009). The coordinates of the T-atoms were also refined. Refinement of
the oxygen positions was not possible, leading to collapse of the framework structure when attempted.
This is probably due to the incomplete structural model with only three “dummy” carbon atoms
accounting for all of the electron density inside the cages after reaction. Restraints on the framework
bond lengths and angles were used to prevent the T-atoms migrating into the cages to fit diffuse areas
of electron density not accounted for by the model. The background was fitted with a 7-term
Chebyshev polynomial and a broad peak used to fit the background “bump” from the quartz tube at
~1.8° 2θ. This allows us to study the lattice parameters, strain broadening, overall scale, T atom
positions, cage occupancies and numerous other modes of tomographic projection of the data from the
SAPO-34 structure. In this case we concentrate mainly on the c-axis variation which has been clearly
linked with development of reaction intermediates and coke (Wragg et al., 2009, Wragg et al., 2012,
Zokaie et al., 2013, Wragg, Groenvold, et al., 2013), however, information from some of the other
parameters is considered. A full list if refined parameters for the three samples, detailing whether they
were refined against individual powder patterns in the dataset or all data, is given in table S1 of the
supporting information.
3. Results
We have studied three tomographic datasets representing different stages of the MTO process and
different silicon contents in the catalyst. The silicon content is significant as this determines the
5

Journal of Applied Crystallography research papers
acidity of the catalyst (the number of active sites), a crucial parameter in its effectiveness in the MTO
process (Bleken et al., 2009). The first two samples contained 8 % silicon (determined by energy
dispersive X-ray spectroscopy in an FEI scanning electron microscope). The first of these was
subjected to methanol flow for 5 minutes before rapid cooling to room temperature, while the second
was used for MTO conversion for 195 minutes before cooling and collection of XRD-CT data. The
third sample contained 4 % Si and was used in the MTO reaction for 230 minutes prior to cooling and
data collection. Our diffraction data are therefore comparable not with the in situ data reported in our
earlier work (Wragg et al., 2009, Wragg et al., 2010, Wragg et al., 2011, Wragg et al., 2012, Wragg,
Groenvold, et al., 2013) but with the ex situ XRD studied by Zokaie et al and Wragg et al (Zokaie et
al., 2013, Wragg, Groenvold, et al., 2013). We note however, that the data presented in the latter two
references indicate very similar trends in the variation of the crystal structure with increasing duration
of MTO reaction time to the in situ data.
3.1. SAPO-34, 8 % Si, Quenched
The five 2-dimensional slices of the Rietveld-CT reconstruction using c-axis length for the 8 % Si
sample quenched after 5 minutes of MTO reaction are shown in figure 2 as colour contour plots. The
circular profile of the reactor tube is clearly visible.
Fig. 2
The shift in c-axis length from the initial value of 14.6 Å for the freshly calcined sample is relatively
small (this axis can extend to over 15.1 Å in similar samples (Wragg et al., 2009, Wragg et al.,
2012)), with a maximum c value of 14.8 Å; as expected for a catalyst subjected to a short time on
stream. However, we see significant variations within the range both with increasing distance from
the inlet point and across the individual slices. The extension of the c-axis averaged across each slice
drops slightly from slice (a) (the inlet end of the bed) to slice (b) then increases to the outlet at slice
(e). Examining the slices reveals a pattern of greater expansion at the right edge of the reactor tube.
The c-axis variation of specific voxels seems to follow through the series of slices (i.e. if voxel (35,
35) in slice (c) has a large c-axis compared to surrounding voxels, so will the (35, 35) voxel in slice
(e)) suggesting that the cause of expansion (i.e. the reagents which cause coking of the catalyst) is
spreading in a predictable way up the bed. Figure 1(f) shows the c-axis patterns vs slice number in
several voxels compared to the averaged value for each slice. The greater c-axis extension at the edge
of the reactor may be due to the fact that this area was closest to the heat guns used to maintain the
temperature, however, the fact that this expansion is only observed on one side of the reactor, while
heat guns were positioned on opposite sides of the reactor perpendicular to the X-ray beam, does not
support this proposition.
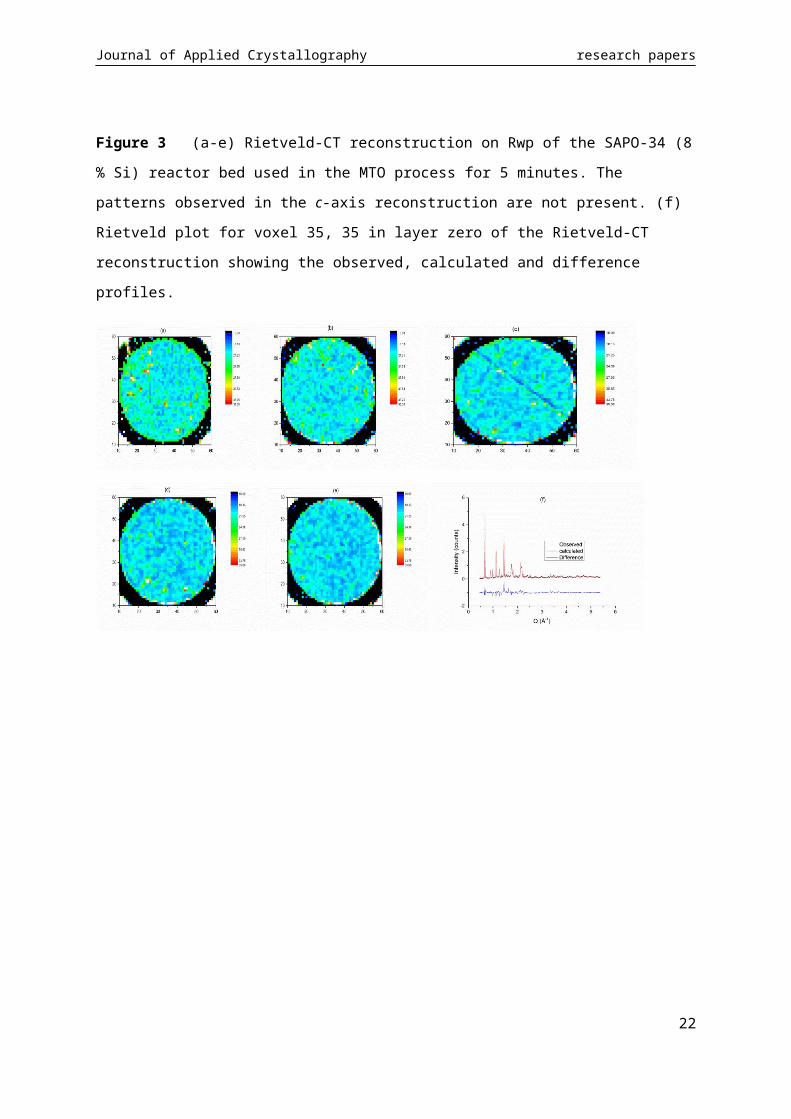
To check that the patterns observed in the Rietveld-CT are not simply due to variations in the quality
of the refinement we compared the data for the c-axis reconstruction to reconstructions based on Rwp
6

Journal of Applied Crystallography research papers
(indicating the quality of Rietveld fit). The Rwp reconstruction of the quenched 8 % Si sample is
shown in figure 3 and clearly does not show the patterns seen in the c-axis tomograph, indeed, the
distribution of Rwp in the discs of the reactor slices appears to be essentially random. The Rwp values
may appear rather high (average Rwp decreases from 21.3 % to 20.1 % from slice (a) to slice (e), see
supporting information, figure S2), however, the Rexp (expected minimum R-value) values for the
reconstructed data are rather high (in the region of 18 % for most of the voxels)- this is due to the
incorrect assumption in TOPAS (common to most Rietveld software) that the errors in the intensities
for PXRD data collected with an area detector are equal to the square root of the intensity (real errors
are related to the number of detector pixels under the powder rings, which depend on detector region),
and may also be due to the unusual counting statistics in the reconstructed data (Rexp for the raw data
patterns is around 10-15 %). A typical Rietveld fit from the dataset (voxel 35, 35 in layer 0) is shown
in figure 3(f).
Fig. 3
If we rule out variations in the fit quality and temperature inconsistencies, our best current explanation
for the 3-D variations seen in the c-axis reconstruction of this sample is that they represent preferred
pathways through the reactor bed. We have demonstrated elsewhere (Wragg et al., 2012) that the
longer the reactants take to pass through the fixed bed MTO reactor the more likely they are to form
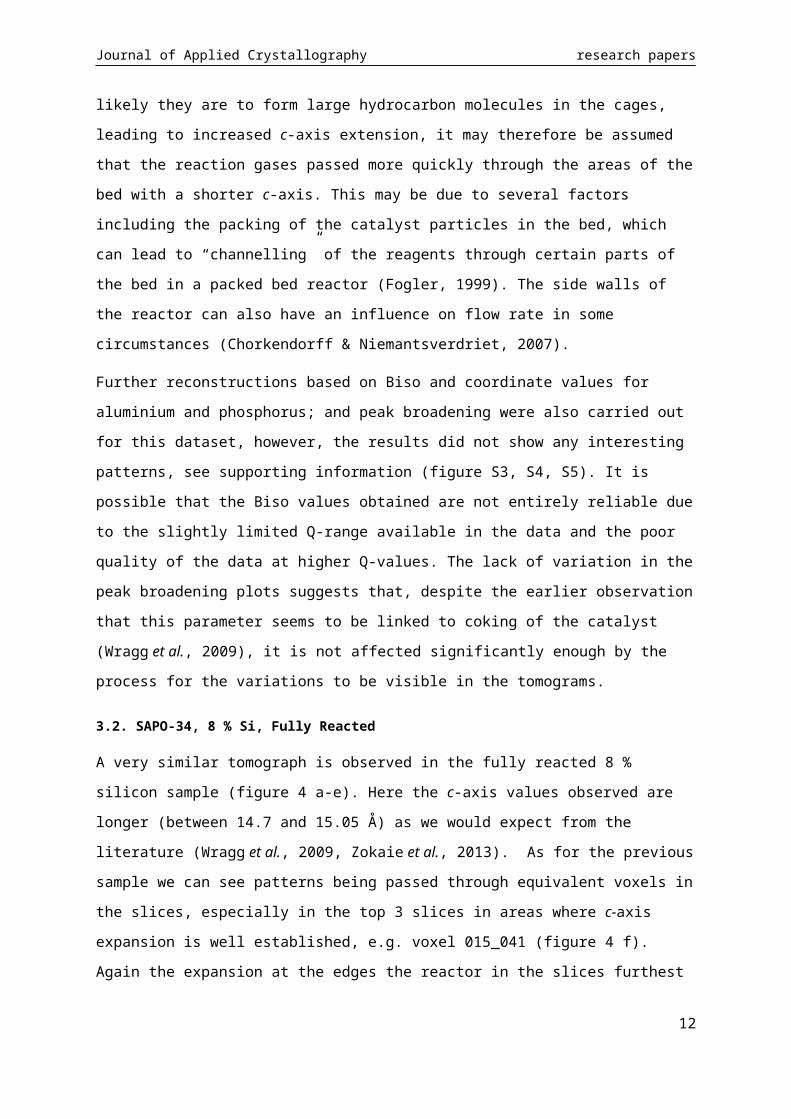
large hydrocarbon molecules in the cages, leading to increased c-axis extension, it may therefore be
assumed that the reaction gases passed more quickly through the areas of the bed with a shorter c-
axis. This may be due to several factors including the packing of the catalyst particles in the bed,
which can lead to “channelling” of the reagents through certain parts of the bed in a packed bed
reactor (Fogler, 1999). The side walls of the reactor can also have an influence on flow rate in some
circumstances (Chorkendorff & Niemantsverdriet, 2007).
Further reconstructions based on Biso and coordinate values for aluminium and phosphorus; and peak
broadening were also carried out for this dataset, however, the results did not show any interesting
patterns, see supporting information (figure S3, S4, S5). It is possible that the Biso values obtained are
not entirely reliable due to the slightly limited Q-range available in the data and the poor quality of the
data at higher Q-values. The lack of variation in the peak broadening plots suggests that, despite the
earlier observation that this parameter seems to be linked to coking of the catalyst (Wragg et al.,
2009), it is not affected significantly enough by the process for the variations to be visible in the
tomograms.
3.2. SAPO-34, 8 % Si, Fully Reacted
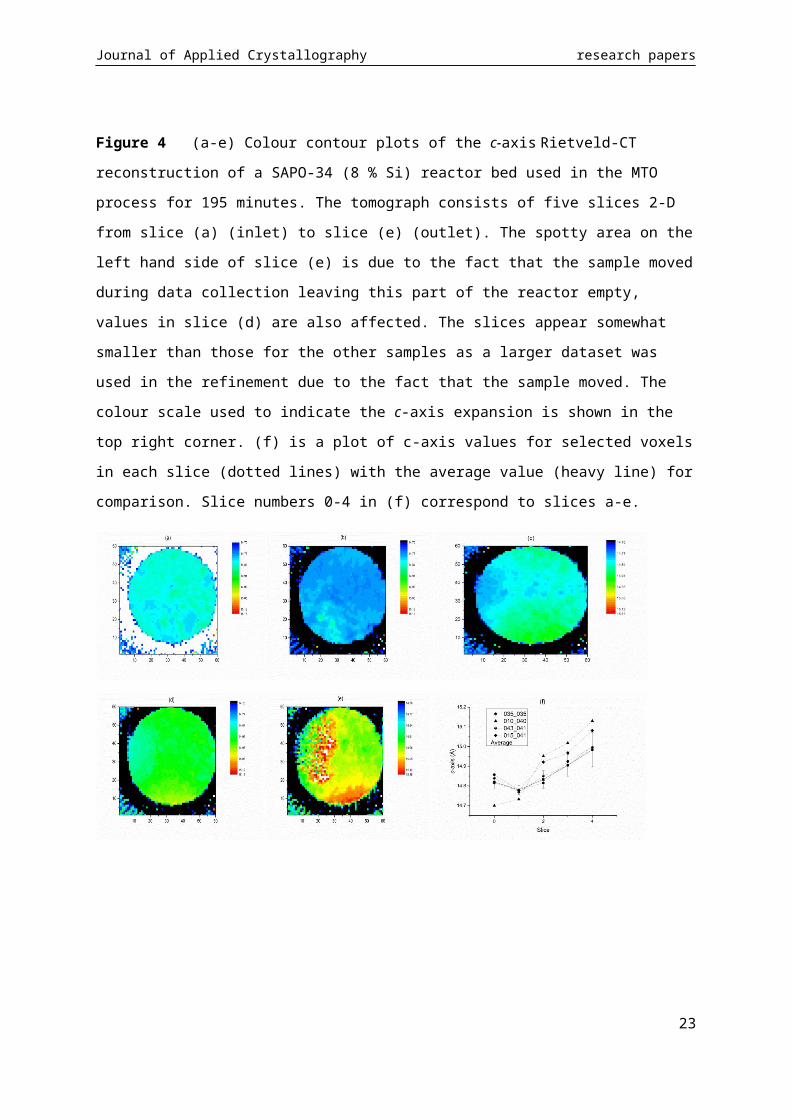
A very similar tomograph is observed in the fully reacted 8 % silicon sample (figure 4 a-e). Here the
c-axis values observed are longer (between 14.7 and 15.05 Å) as we would expect from the literature
(Wragg et al., 2009, Zokaie et al., 2013). As for the previous sample we can see patterns being
7
Journal of Applied Crystallography research papers
passed through equivalent voxels in the slices, especially in the top 3 slices in areas where c-axis
expansion is well established, e.g. voxel 015_041 (figure 4 f). Again the expansion at the edges the
reactor in the slices furthest from the inlet may be linked to the close proximity of the heat gun, but is
only observed on one side of the reactor.
Fig. 4
During data collection on this sample the catalyst bed moved in the reactor leaving an empty space on
the left hand side of slices 3 and 4. This caused problems in scaling which made the data from
ordinary tomographic reconstructions using intensity in a set Q-range almost useless (figure 5). Using
Rietveld-CT reconstruction however, we obtain almost as much information as for the other samples
as the lattice parameters can be extracted regardless of the intensity. Such information would be
difficult to extract using the batch Le Bail type fits which have been applied to other tomographic data
due to the massive scale differences.
Fig. 5
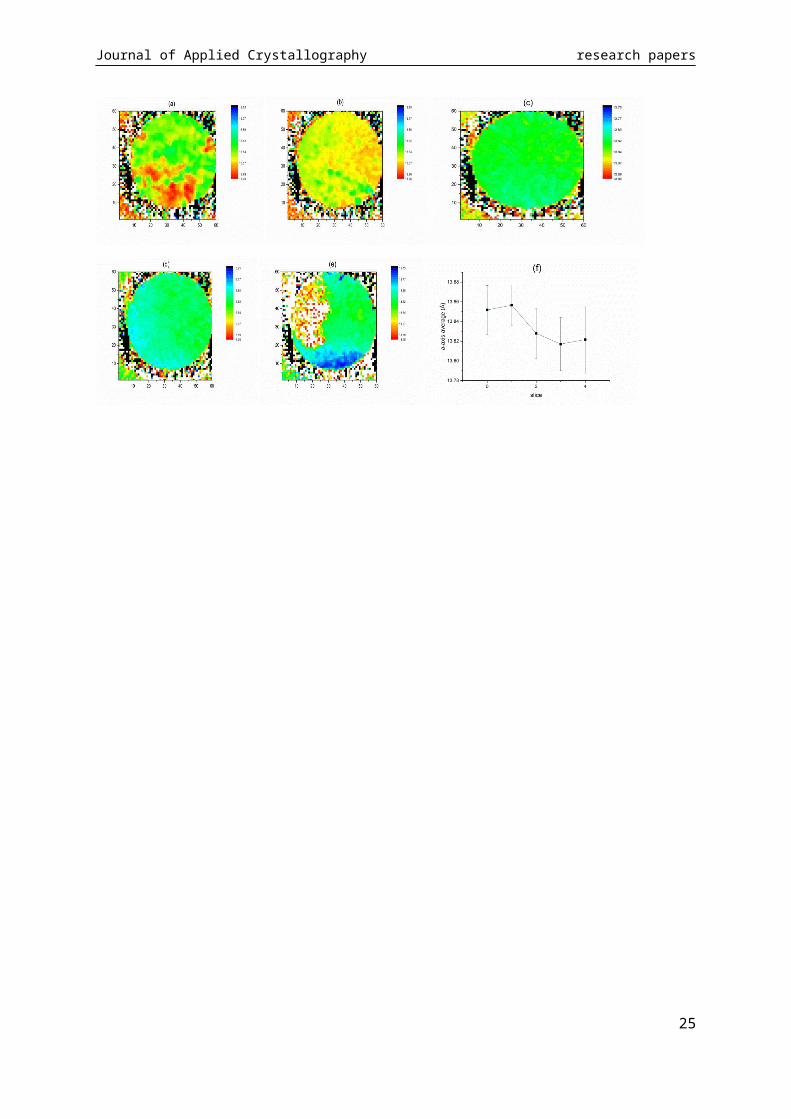
It is also interesting to look at the a-axis reconstruction of this sample, to check that data really are
recovered correctly despite the void area in the reconstruction. The patterns observed in the slices are
similar to those seen in the c-axis reconstruction (figure 6 (a-e)) but the magnitude of the a-axis
variation is relatively small and the average values in adjacent slices are within one standard deviation
of each other (figure 6(f)). It is therefore not possible to point to a trend in the average a-axis values
from these data.
Fig. 6
Tomographic slices reconstructed on cage occupancy for fully reacted 8 % Si SAPO-34 are shown in
supporting figure S6. These slices show a significant similarity to the a-axis reconstructions,
reinforcing the earlier observation that the crystal structure changes (in particular the lattice parameter
variations) during the MTO process are related to the filling of the chabazite cages with organic coke
during the reaction. Figure 7 shows the patterns in reconstructions on the a and c-axes and cage
occupancy for slice 0 of the fully reacted 8% silicon bed side by side for easy comparison.
Fig 7
3.3. SAPO-34, 4 % Si, Fully Reacted
A second fully reacted sample containing 4 % silicon shows a different pattern across the slices (c-
axis reconstruction, along with selected voxel and average c-axis plots through the slices, is shown in
figure 8). In this case we do not see large areas of high c-axis expansion at the edge of the reactor;
however, patterns can still be seen in equivalent voxels through the slices, with small areas of c-axis
extension spread around the slices. There is no sign of greater c-axis extension close to the reactor
8
Journal of Applied Crystallography research papers
edges in this sample, giving further support to the theory that the expansion observed at the edge of
the reactor in the 8% Si sample is not due to overheating.
The pattern of the average c-axis value through the 5 slices is very similar to that observed for the
quenched 8 % Si sample with a small range of values and small standard deviations in the average,
however the overall values of c for this sample are the largest of any of the datasets (see figure 9
below). As for the other two samples the second slice of the tomograph has the smallest average c-
axis value.
Fig. 8, 9
Plotting the average c value from each slice (with standard deviation bars to indicate the range of
values present in each slice) on the same axes shows a similar pattern for the three samples (figure 8),
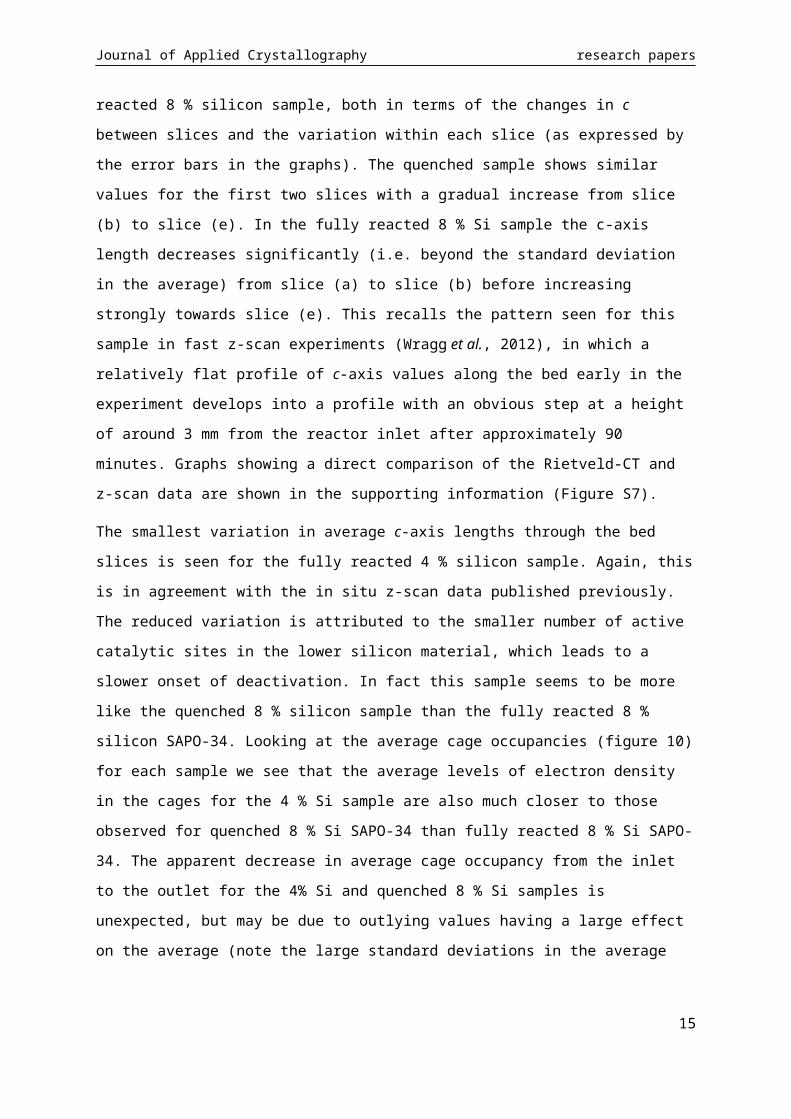
but with a much larger variation in the fully reacted 8 % silicon sample, both in terms of the changes
in c between slices and the variation within each slice (as expressed by the error bars in the graphs).
The quenched sample shows similar values for the first two slices with a gradual increase from slice
(b) to slice (e). In the fully reacted 8 % Si sample the c-axis length decreases significantly (i.e. beyond
the standard deviation in the average) from slice (a) to slice (b) before increasing strongly towards
slice (e). This recalls the pattern seen for this sample in fast z-scan experiments (Wragg et al., 2012),
in which a relatively flat profile of c-axis values along the bed early in the experiment develops into a
profile with an obvious step at a height of around 3 mm from the reactor inlet after approximately 90
minutes. Graphs showing a direct comparison of the Rietveld-CT and z-scan data are shown in the
supporting information (Figure S7).
The smallest variation in average c-axis lengths through the bed slices is seen for the fully reacted 4 %
silicon sample. Again, this is in agreement with the in situ z-scan data published previously. The
reduced variation is attributed to the smaller number of active catalytic sites in the lower silicon
material, which leads to a slower onset of deactivation. In fact this sample seems to be more like the
quenched 8 % silicon sample than the fully reacted 8 % silicon SAPO-34. Looking at the average
cage occupancies (figure 10) for each sample we see that the average levels of electron density in the
cages for the 4 % Si sample are also much closer to those observed for quenched 8 % Si SAPO-34
than fully reacted 8 % Si SAPO-34. The apparent decrease in average cage occupancy from the inlet
to the outlet for the 4% Si and quenched 8 % Si samples is unexpected, but may be due to outlying
values having a large effect on the average (note the large standard deviations in the average
occupancy values for the 4 % Si sample, which also shows the strongest decline in cage occupancy).
Fig. 10
4. Conclusions
9

Journal of Applied Crystallography research papers
We have demonstrated the feasibility of analysing XRD-CT data using the Rietveld method by
reconstructing three SAPO-34 catalyst beds using several different, real structural parameters. This
allows us to track the development of coke in different parts of the reactor, observing small 3-
dimensional variations in catalyst deactivation. Furthermore we have demonstrated that Rietveld-CT
can extract meaningful information from XRD-CT datasets which would be very difficult to study
with conventional reconstruction techniques.
In general we see that the coke from the MTO reaction is more evenly spread around the sample
containing 4 % silicon, this suggests that catalysts with this level of silicon will probably be the most
long-lived and effective MTO catalysts. The existence of areas in the fixed bed reactors with
significantly different levels of deactivation in the 8 % silicon catalysts examined indicates that care
should be taken when we study the behaviour of SAPO-34 in reactors of this type, in order to avoid
flow problems. The variations in the average c-axis values with reactor position recall the reduction
observed in the c-axis length close to the reactor inlet at later stages of the MTO reaction in the in situ
Z-scanning experiments (Wragg et al., 2012). We also note that there seems to be some correlation
between the a-axis and cage occupancy reconstructions, which may explain the origins of the
structural variations. Since less 3D variation in the lattice parameters is observed for the 4 % silicon
sample we believe that temperature inconsistencies in the beds do not make a significant contribution
to the variations seen in the c-axis of SAPO-34 with 8 % silicon and the variations observed are
probably due to preferred pathways through the catalyst bed.
Rietveld CT could be applied very easily to other well-ordered catalyst systems which exhibit good
crystallinity and the combination of the technique with the very fast tomographic data collection now
possible (O'Brien et al., 2009, O'Brien et al., 2012, Jacques et al., 2013) makes in situ Rietveld-CT a
real possibility.
Acknowledgements We acknowledge the ESRF for providing beam time at ID15B and the inGAP
centre for research-based innovation for funding.
References
Adams, J. E. (2013). Nat Rev Endocrinol 9, 28-42.Agostini, G., Lamberti, C., Palin, L., Milanesio, M., Danilina, N., Xu, B., Janousch, M. & van
Bokhoven, J. A. (2009). J. Am. Chem. Soc. 132, 667-678.Álvarez-Murga, M., Bleuet, P., Garbarino, G., Salamat, A., Mezouar, M. & Hodeau, J. L. (2012).
Physical Review Letters 109, 025502.Alvarez-Murga, M., Bleuet, P. & Hodeau, J.-L. (2012). J. Appl. Cryst. 45, 1109-1124.Alvarez-Murga, M., Bleuet, P., Marques, L., Lepoittevin, C., Boudet, N., Gabarino, G., Mezouar, M.
& Hodeau, J.-L. (2011). J. Appl. Cryst. 44, 163-171.Arnberg, L. & Mathiesen, R. (2007). JOM 59, 20-26.Barger, P. (2002). Zeolite for Cleaner Technologies, edited by M. Guisnet & J.-P. Gilson, pp. 239-
260. London: Imperial College Press.Beale, A. M., Jacques, S. D. M. & Weckhuysen, B. M. (2010). Chem. Soc. Rev. 39, 4656-4672.
10
Journal of Applied Crystallography research papers
Bertrand, L., Cotte, M., Stampanoni, M., Thoury, M., Marone, F. & Schöder, S. (2012). Physics Reports 519, 51-96.
Bleken, F., Bjørgen, M., Palumbo, L., Bordiga, S., Svelle, S., Lillerud, K.-P. & Olsbye, U. (2009). Top. Catal. 52, 218-228.
Bleuet, P., Welcomme, E., Dooryhee, E., Susini, J., Hodeau, J.-L. & Walter, P. (2008). Nat Mater 7, 468-472.
Bonnin, A., Wright, J. P., Tucoulou, R. & Palancher, H. (2014). Applied Physics Letters 105, 084103.Browne, J. A., Herman, G. T. & Odhner, D. (1993). SNARK93: A Programming System for Image
Reconstruction from Projections. University of Pennsylvania.Buurmans, I. L. C. & Weckhuysen, B. M. (2012). Nat Chem 4, 873-886.Chorkendorff, I. & Niemantsverdriet, J. W. (2007). Concepts of Modern Catalysis and Kinetics, 2nd
ed. Weinheim: Wiley-VCH.Coelho, A. A. (2006). TOPAS V4.1, Bruker AXS.De Nolf, W., Vanmeert, F. & Janssens, K. (2014). J. Appl. Cryst. 47, 1107-1117.Egan, C. K., Jacques, S. D. M., Di Michiel, M., Cai, B., Zandbergen, M. W., Lee, P. D., Beale, A. M.
& Cernik, R. J. (2013). Acta Biomaterialia 9, 8337-8345.Espinosa-Alonso, L., O'Brien, M. G., Jacques, S. D. M., Beale, A. M., de, J., Barnes, P. &
Weckhuysen, B. M. (2009). J. Am. Chem. Soc. 131, 16932-16938.Fogler, H. S. (1999). Elements of Chemical Reactor Engineering, 3rd ed. New Jersey: Prentice Hall.Hall, C., Barnes, P., Cockcroft, J. K., Colston, S. L., Häusermann, D., Jacques, S. D. M., Jupe, A. C.
& Kunz, M. (1998). Nuclear Instruments and Methods in Physics Research Section B: Beam Interactions with Materials and Atoms 140, 253-257.
Hall, C., Barnes, P., Cockcroft, J. K., Jacques, S. D. M., Jupe, A. C., Turrillas, X., Hanfland, M. & Hausermann, D. (1996). Analytical Communications 33, 245-248.
Harding, G. & Kosanetzky, J. (1989). Nuclear Instruments and Methods in Physics Research Section A: Accelerators, Spectrometers, Detectors and Associated Equipment 280, 517-528.
Harding, G., Kosanetzky, J. & Neitzel, U. (1987). Medical Physics 14, 515-525.Harding, G., Newton, M. & Kosanetzky, J. (1990). Physics in Medicine and Biology 35, 33.Hereijgers, B. P. C., Bleken, F., Nilsen, M. H., Svelle, S., Lillerud, K.-P., Bjørgen, M., Weckhuysen,
B. M. & Olsbye, U. (2009). J. Catal. 264, 77-87.Hounsfield, G. N. (1973). The British Journal of Radiology 46, 1016-1022.Jacques, S. D. M., Di Michiel, M., Kimber, S. A. J., Yang, X., Cernik, R. J., Beale, A. M. & Billinge,
S. J. L. (2013). Nat Commun 4.Jacques, S. D. M., Di, M. M., Beale, A. M., Sochi, T., O'Brien, M. G., Espinosa-Alonso, L.,
Weckhuysen, B. M. & Barnes, P. (2011). Angew. Chem., Int. Ed. 50, 10148-10152, S10148/10141-S10148/10111.
Korsunsky, A. M., Baimpas, N., Song, X., Belnoue, J., Hofmann, F., Abbey, B., Xie, M., Andrieux, J., Buslaps, T. & Neo, T. K. (2011). Acta Materialia 59, 2501-2513.
Korsunsky, A. M., Vorster, W. J. J., Zhang, S. Y., Dini, D., Latham, D., Golshan, M., Liu, J., Kyriakoglou, Y. & Walsh, M. J. (2006). Acta Materialia 54, 2101-2108.
Lauterbur, P. C. (1973). Nature 242, 190-191.Lazzari, O., Jacques, S., Sochi, T. & Barnes, P. (2009). Analyst 134, 1802-1807.O'Brien, M. G., Beale, A. M., Jacques, S. D. M., Di Michiel, M. & Weckhuysen, B. M. (2011).
Applied Catal. A. 391, 468-476.O'Brien, M. G., Beale, A. M., Jacques, S. D. M., Di, M. M. & Weckhuysen, B. M. (2009).
ChemCatChem 1, 99-102.O'Brien, M. G., Jacques, S. D. M., Michiel, M. D., Barnes, P., Weckhuysen, B. M. & Beale, A. M.
(2012). Chem. Sci. 3, 509-523.Palancher, H., Tucoulou, R., Bleuet, P., Bonnin, A., Welcomme, E. & Cloetens, P. (2011). J. Appl.
Cryst. 44, 1111-1119.Scarlett, N. V. Y., Madsen, I. C., Evans, J. S. O., Coelho, A. A., McGregor, K., Rowles, M., Lanyon,
M. R. & Urban, A. J. (2009). J. Appl. Cryst. 42, 502-512.Stinton, G. W. & Evans, J. S. O. (2007). J. Appl. Cryst. 40, 87-95.Stöcker, M. (1999). Microporous Mesoporous Mater. 29, 3-48.
11
Journal of Applied Crystallography research papers
Voltolini, M., Dalconi, M. C., Artioli, G., Parisatto, M., Valentini, L., Russo, V., Bonnin, A. & Tucoulou, R. (2013). J. Appl. Cryst. 46, 142-152.
Wendelbo, R., Akporiaye, D. E., Andersen, A., Dahl, I. M., Mostad, H. B., Fuglerud, T. & Kvisle, S. (1998).
Wragg, D. S., Akporiaye, D. & Fjellvåg, H. (2011). J. Catal. 279, 397-402.Wragg, D. S., Bleken, F. L., O'Brien, M. G., Di Michiel, M., Fjellvag, H. & Olsbye, U. (2013).
Physical Chemistry Chemical Physics 15, 8662-8671.Wragg, D. S., Groenvold, A., Voronov, A., Norby, P. & Fjellvaag, H. (2013). Microporous
Mesoporous Mater. 173, 166-174.Wragg, D. S., Johnsen, R. E., Balasundaram, M., Norby, P., Fjellvåg, H., Grønvold, A., Fuglerud, T.,
Hafizovic, J., Vistad, Ø. B. & Akporiaye, D. (2009). J. Catal. 268, 290-296.Wragg, D. S., Johnsen, R. E., Norby, P. & Fjellvåg, H. (2010). Microporous Mesoporous Mater. 134,
210-215.Wragg, D. S., O'Brien, M. G., Bleken, F. L., Di Michiel, M., Olsbye, U. & Fjellvåg, H. (2012).
Angew. Chem. Int. Ed. Engl. 51, 7956-7959.Zokaie, M., Wragg, D. S., Grønvold, A., Fuglerud, T., Cavka, J. H., Lillerud, K. P. & Swang, O.
(2013). Microporous Mesoporous Mater. 165, 1-5.
12

Journal of Applied Crystallography research papers
Figure 1 The crystal structure of SAPO-34 framework projected along the a-axis (left), showing the
8-tetrahedral atom windows. The cage, with 8 and 6 T-atom windows, is shown on the right. Oxygen
atoms are omitted for clarity.
Figure 2 (a-e) Colour contour plots of the c-axis Rietveld-CT reconstruction of a SAPO-34 (8 % Si)
reactor bed used in the MTO process for 5 minutes. The tomograph consists of five slices 2-D from
slice (a) (inlet) to slice (e) (outlet). The colour scale used to indicate the c-axis expansion is shown in
the top right corner. (f) is a plot of c-axis values for selected voxels in each slice (dotted lines) with
the average value (heavy line) for comparison. Slice numbers 0-4 in (f) correspond to slices a-e.
13

Journal of Applied Crystallography research papers
Figure 3 (a-e) Rietveld-CT reconstruction on Rwp of the SAPO-34 (8 % Si) reactor bed used in the
MTO process for 5 minutes. The patterns observed in the c-axis reconstruction are not present. (f)
Rietveld plot for voxel 35, 35 in layer zero of the Rietveld-CT reconstruction showing the observed,
calculated and difference profiles.
14
Journal of Applied Crystallography research papers
Figure 4 (a-e) Colour contour plots of the c-axis Rietveld-CT reconstruction of a SAPO-34 (8 % Si)
reactor bed used in the MTO process for 195 minutes. The tomograph consists of five slices 2-D from
slice (a) (inlet) to slice (e) (outlet). The spotty area on the left hand side of slice (e) is due to the fact
that the sample moved during data collection leaving this part of the reactor empty, values in slice (d)
are also affected. The slices appear somewhat smaller than those for the other samples as a larger
dataset was used in the refinement due to the fact that the sample moved. The colour scale used to
indicate the c-axis expansion is shown in the top right corner. (f) is a plot of c-axis values for selected
voxels in each slice (dotted lines) with the average value (heavy line) for comparison. Slice numbers
0-4 in (f) correspond to slices a-e.
15
Journal of Applied Crystallography research papers
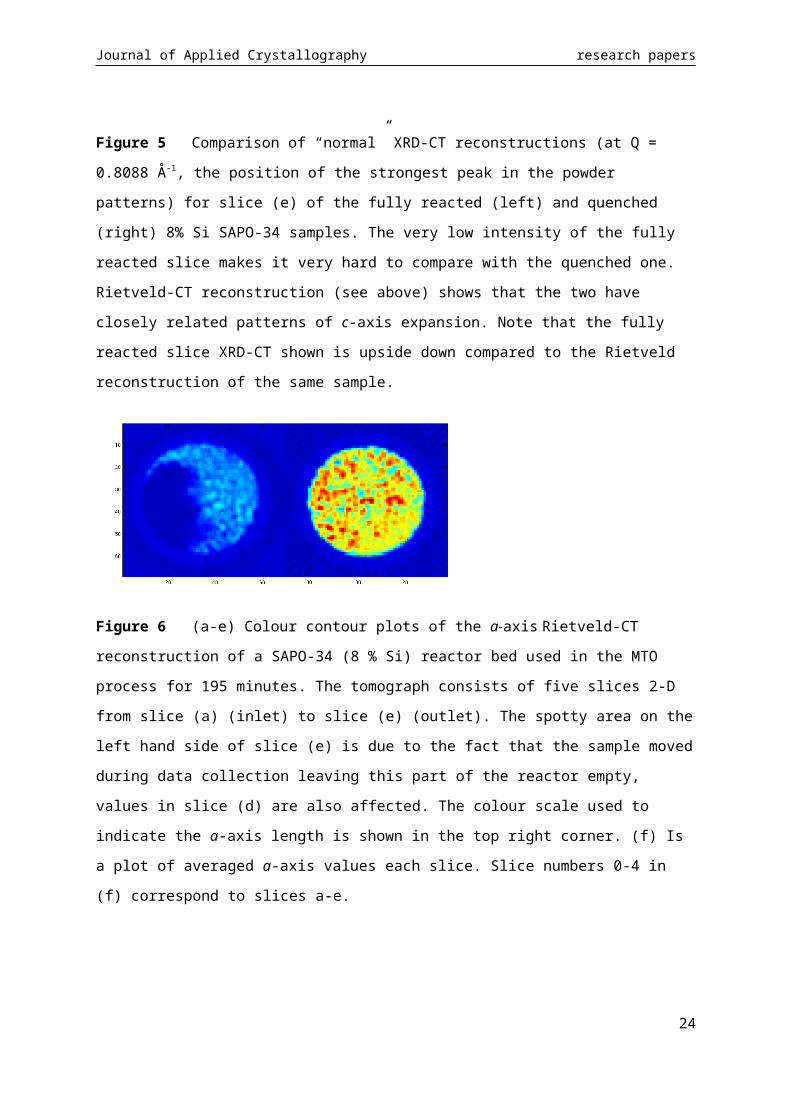
Figure 5 Comparison of “normal” XRD-CT reconstructions (at Q = 0.8088 Å-1, the position of the
strongest peak in the powder patterns) for slice (e) of the fully reacted (left) and quenched (right) 8%
Si SAPO-34 samples. The very low intensity of the fully reacted slice makes it very hard to compare
with the quenched one. Rietveld-CT reconstruction (see above) shows that the two have closely
related patterns of c-axis expansion. Note that the fully reacted slice XRD-CT shown is upside down
compared to the Rietveld reconstruction of the same sample.
Figure 6 (a-e) Colour contour plots of the a-axis Rietveld-CT reconstruction of a SAPO-34 (8 % Si)
reactor bed used in the MTO process for 195 minutes. The tomograph consists of five slices 2-D from
slice (a) (inlet) to slice (e) (outlet). The spotty area on the left hand side of slice (e) is due to the fact
that the sample moved during data collection leaving this part of the reactor empty, values in slice (d)
are also affected. The colour scale used to indicate the a-axis length is shown in the top right corner.
(f) Is a plot of averaged a-axis values each slice. Slice numbers 0-4 in (f) correspond to slices a-e.
16
Journal of Applied Crystallography research papers
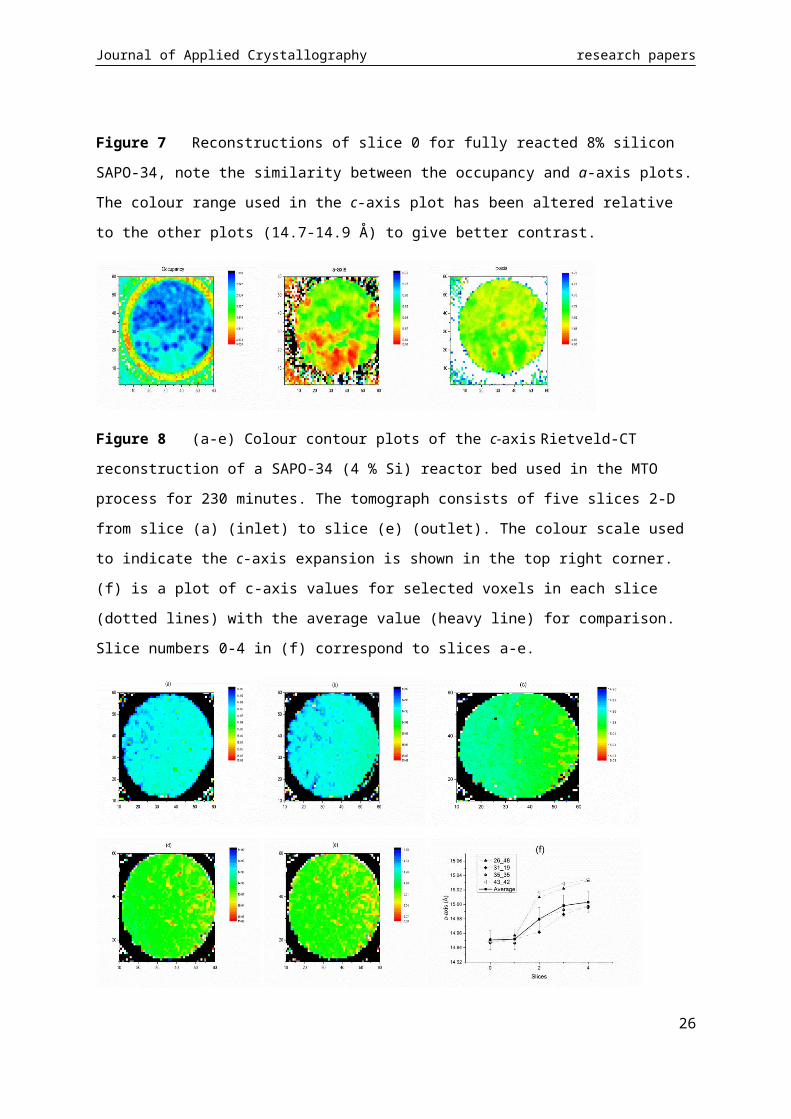
Figure 7 Reconstructions of slice 0 for fully reacted 8% silicon SAPO-34, note the similarity
between the occupancy and a-axis plots. The colour range used in the c-axis plot has been altered
relative to the other plots (14.7-14.9 Å) to give better contrast.
Figure 8 (a-e) Colour contour plots of the c-axis Rietveld-CT reconstruction of a SAPO-34 (4 % Si)
reactor bed used in the MTO process for 230 minutes. The tomograph consists of five slices 2-D from
slice (a) (inlet) to slice (e) (outlet). The colour scale used to indicate the c-axis expansion is shown in
the top right corner. (f) is a plot of c-axis values for selected voxels in each slice (dotted lines) with
the average value (heavy line) for comparison. Slice numbers 0-4 in (f) correspond to slices a-e.
17
Journal of Applied Crystallography research papers
Figure 9 Average c-axis variations for the slices of the Rietveld-CT reconstructions. Slice numbers
0-4 in (f) correspond to slices a-e as for figures 3 and 5.
Figure 10 Average cage occupancy values for the five slices of the tomographs for 8% Si
SAPO-34 (fully reacted and quenched after 5 minutes of reaction) and 4 % Si SAPO-34 (fully
reacted). Slice numbers 0-4 correspond to slices a-e.
18
Journal of Applied Crystallography research papers
Supporting information
S1. Refinement details/ fitting procedure The Rietveld refinements presented were carried out using
TOPAS academic version 4.2. Initial structural parameters from the SAPO-34 framework and carbon
atoms placed on at positions where electron density peaks were observed in the cages in high
resolution XRD studies were refined against the powder pattern of the central voxel of slice 0 for the
relevant tomograph to obtain good starting values. A parametric Rietveld input file was then prepared
using a simple text replacement script to copy the starting parameters into an input file which could be
used to treat the powder patterns from the whole slice simultaneously. The command
conserve_memory was added to the top of the input file before running to supress graphical output.
Thus command should always be used when dealing with very large datasets such as these. An extract
from a typical parametric input file is shown below. “…” indicates truncation of the input file.
Complete input for one powder pattern is shown along with the essential initial “conserve_memory”
command at the top of the file and continuation into the input for the next powder pattern at the end:
conserve_memory
…
'tomo_00_032_035
r_wp 27.439 r_exp 408.574 r_p 25.156 r_wp_dash 32.753 r_p_dash 47.883 r_exp_dash 487.701 weighted_Durbin_Watson 0.407 gof
0.067
'do_errors
iters 100000
xdd "TXT_MTO1_initial_sample_finaltomo_00_032_035.xy"
start_X 0.6
finish_X 8
x_calculation_step 0.01
bkg @ 0.136308454` -0.00497403061` -0.0316535491` 0.0179460652` -0.0265348765` 0.00656437511` 0.0291852131`
lam
ymin_on_ymax 0.8
la 1 lo 0.142569 lh 0.002
User_Defined_Dependence_Convolution(gauss_fwhm, 5 Tan(2 Th),tth, 0.06948`)
LP_Factor(0)
Zero_Error(ze, 0.00110`)
prm oc1_00_032_035 0.39141`_LIMIT_MIN_0 max 3 min 0
prm oc2_00_032_035 1.01889`_LIMIT_MIN_0 max 3 min 0
prm oc3_00_032_035 0.89057`_LIMIT_MIN_0 max 3 min 0
prm totoc_00_032_035 =oc1_00_032_035+oc2_00_032_035+oc3_00_032_035;
local bp 1.37871`_LIMIT_MIN_0.01 max 10 min 0.01
local bo 0.19591`_LIMIT_MIN_0.01 max 10 min 0.01
str
Trigonal(atri_00_032_035 13.82297` , ctri_00_032_035 14.81201`)
space_group "R-3"
19

Journal of Applied Crystallography research papers
site P1 x @ 0.22554` y @ 0.23150` z @ 0.59983` occ P 0.92000 beq =bp; num_posns 18
occ SI 0.08000 beq =bp; num_posns 18
site Al1 x @ 0.01223` y @ 0.22831` z @ 0.61430` occ AL 1.00000 beq =bp; num_posns 18
site O1 x 0.99530 y 0.73270 z 0.48740 occ O 1.00000 beq =bo; num_posns 18
site O2 x 0.88010 y 0.75680 z 0.36900 occ O 1.00000 beq =bo; num_posns 18
site O3 x 0.80290 y 0.90560 z 0.38080 occ O 1.00000 beq =bo; num_posns 18
site O4 x 0.67520 y 0.98180 z 0.32920 occ O 1.00000 beq =bo; num_posns 18
site C1 x 0.93756 y 0.96891 z 0.96889 occ C =oc1_00_032_035; beq 1.5 num_posns 18
site C2 x 0.92174 y 0.07793 z 0.84376 occ C =oc2_00_032_035; beq 1.5 num_posns 18
site C3 x 0.00000 y 0.00000 z 0.06422 occ C =oc3_00_032_035; beq 1.5 num_posns 6
scale sc 2.09022641e-011`
CS_L(size_00_032_035, 79.27213`_LIMIT_MIN_0.3)
Out_Yobs_Ycalc_and_Difference("MTO1_initial_sample_finaltomo_00_032_035.xyd")
Out_X_Yobs("MTO1_initial_sample_finaltomo_00_032_035.xy")
out "delme.txt" append
Out(Get (r_wp), "Rwp_00_032_035: %11.5f :")
Out(atri_00_032_035, " a_trigonal: %11.5f :", " %11.5f :")
Out(ctri_00_032_035, " c_trigonal: %11.5f :", " %11.5f :")
Out(bo, " Biso Oxygen: %11.5f :", " %11.5f :")
Out(bp, " Biso T sitep: %11.5f :", " %11.5f :")
Out(size_00_032_035, " xtal size L: %11.5f :", " %11.5f :")
Out(totoc_00_032_035, " occupancy of cage: %11.5f :", " %11.5f :
")
'al bond length restraints
Distance_Restrain(Al1 O3 2 1 0 -1, 1.73, 1.62277`, 0, 500)
Distance_Restrain(Al1 O2 5 -1 -1 -1, 1.73, 1.41855`, 0, 500)
Distance_Restrain(Al1 O1 5 -1 -1 -1, 1.73, 1.62063`, 0, 500)
Distance_Restrain(Al1 O4 2 1 0 -1, 1.73, 1.58233`, 0, 500)
'P bond length restraints
Distance_Restrain(P1 O1 3 -1 0 0, 1.53, 1.74449`, 0, 500)
Distance_Restrain(P1 O3 5 -1 -1 -1, 1.53, 1.75596`, 0, 500)
Distance_Restrain(P1 O4 12 0 1 0, 1.53, 1.71044`, 0, 500)
Distance_Restrain(P1 O2 5 -1 -1 -1, 1.53, 1.61488`, 0, 500)
'OPO angle restraints
Angle_Restrain(O1 3 -1 0 0 P1 O3 5 -1 -1 -1, 109.5, 106.84896`, 0, 0.01)
Angle_Restrain(O1 3 -1 0 0 P1 O2 5 -1 -1 -1, 109.5, 116.90964`, 0, 0.01)
Angle_Restrain(O1 3 -1 0 0 P1 O4 12 0 1 0, 109.5, 105.56820`, 0, 0.01)
Angle_Restrain(O2 5 -1 -1 -1 P1 O3 5 -1 -1 -1, 109.5, 109.61330`, 0, 0.01)
Angle_Restrain(O2 5 -1 -1 -1 P1 O4 12 0 1 0, 109.5, 111.63363`, 0, 0.01)
Angle_Restrain(O4 12 0 1 0 P1 O3 5 -1 -1 -1, 109.5, 105.56103`, 0, 0.01)
'oalo angle restraints
Angle_Restrain(O2 5 -1 -1 -1 Al1 O3 2 1 0 -1, 109.5, 118.24333`, 0, 0.01)
Angle_Restrain(O2 5 -1 -1 -1 Al1 O1 5 -1 -1 -1, 109.5, 110.55183`, 0, 0.01)
Angle_Restrain(O2 5 -1 -1 -1 Al1 O4 2 1 0 -1, 109.5, 115.27275`, 0, 0.01)
Angle_Restrain(O3 2 1 0 -1 Al1 O1 5 -1 -1 -1, 109.5, 102.85061`, 0, 0.01)
Angle_Restrain(O3 2 1 0 -1 Al1 O4 2 1 0 -1, 109.5, 107.35260`, 0, 0.01)
Angle_Restrain(O1 5 -1 -1 -1 Al1 O4 2 1 0 -1, 109.5, 100.42368`, 0, 0.01)
xo_Is
20

Journal of Applied Crystallography research papers
xo x_glass 2.33334059` I @ 6.01803694e-006`_LIMIT_MIN_1e-010
CS_L(, 9.90666)
'tomo_00_032_036
r_wp 18.855 r_exp 272.213 r_p 15.289 r_wp_dash 24.356 r_p_dash 30.379 r_exp_dash 351.622 weighted_Durbin_Watson 0.580 gof
0.069
'do_errors
iters 100000
xdd "TXT_MTO1_initial_sample_finaltomo_00_032_036.xy"
…
Table S1 lists the refined parameters and how they were treated (independent to each powder pattern
or simultaneous refinement against all patterns in the parametric input file).
21
Journal of Applied Crystallography research papers
Table S1 Rietveld refinement parameters and refinement methods
Parameter
Number of
parameters/powder
pattern
How refined?
8 % Si
Quench
8 % Si Fully
Reacted
4 % Si Fully
Reacted
Background 7Individual
Pattern
Individual
Pattern
Individual
Pattern
Tan theta Broadening 1 All Data All Data All Data
Zero error 1 All Data All Data All Data
Dummy carbon occupancy 3Individual
Pattern
Individual
Pattern
Individual
Pattern
Biso Phosphorus/aluminium 1Individual
Pattern*
Individual
Pattern*Fixed
Biso Oxygen 1Individual
Pattern*
Individual
Pattern*Fixed
x,y,z phosphorus 3Individual
Pattern
Individual
Pattern
Individual
Pattern
x,y,z aluminium 3Individual
Pattern
Individual
Pattern
Individual
Pattern
Scale 1 All Data All Data All Data
Lorentzian peak broadening 1Individual
Pattern
Individual
Pattern
Individual
Pattern
Glass peak position 1 All Data All Data All Data
Glass peak intensity 1Individual
Pattern
Individual
Pattern
Individual
Pattern
Glass peak broadening 1 All DataIndividual
Pattern
Individual
Pattern
* Refinement of the Biso parameters against all patterns in the tomographic slice was also tested. Maximum and
minimum limits of 10 and 1 applied to Biso.
22
Journal of Applied Crystallography research papers
Figure S1 Location of the 5 tomographic slices on a sample reactor bed.
Figure S2 Average Rwp per tomographic slice for the 8% silicon SAPO-34 quenched after 5
minutes of MTO reaction. Error bars correspond to the standard deviation in the mean average.
23
Journal of Applied Crystallography research papers
Figure S3 Tomographic slices 0 and 4 for quenched 8 % Si SAPO-34 reconstructed on Biso for the
aluminium (left) and phosphorus/silicon (right) sites.
Slice 0
Slice 4
24
Journal of Applied Crystallography research papers
Figure S4 Reconstructions of the quenched 8 % Si SAPO-34 bed on x, y and z coordinates for
aluminium (slices 0 and 4) and phosphorus (slice 4).
Figure S5 Reconstructions of the quenched 8 % Si SAPO-34 bed on peak broadening.
25
Journal of Applied Crystallography research papers
Figure S6 Tomographic slices for fully reacted 8 % Si SAPO-34 reconstructed on cage occupancy.
(a) Slice closest to reactor inlet – (e) slice furthest from inlet.
Figure S7 Comparison of the average c-axis variations in the tomographic slices compared to the z-
scan data published previously (Wragg et al., 2012)
26