brainwaves and mind recent advances
TRANSCRIPT
.:

BRAINWAVES AND MIND:RECENT ADVANCES
"
. A Report From Istanbul
Edited by:Norman C.Moore, MD, and M Kemal Arikan, MD
(
)
Table ofContents
PREFACE V
THEORYBiology of Brain Waves: Natural History and Evolutionof an Information-Rich Sign of Activity 3Theodore Holmes Bullock, La Jolla, California,USA
Neuropsychology of P3a and P3b: A Theoretical Overview 15John Polich, La Jolla, California,USA
NON-CLINICAL
Digital Signal Processing and Single Trial Evoked Potentials:Accomplishments, Limitations and Promises 33B. H. Jansen, V.Garoosi, G. Agarwal, D. Iyer,A. Hegde and R. Jacob, Houston,Texas,USAN. N. Boutros, NewHaven,Connecticut, USA
On the Existence and Functional Properties of PeriscaccadicOccipital Gamma Range EEG in Humans .41i.Bodis·Wollner, H. von Gizycki, T. Kapoor, A. Habib,A. Raza, M. Sobeth, A. Javeid and M. Avitable, Brooklyn,NewYork,USA
Time-Frequency Analysis ofVEPs for Interhemispheric Transfer Time 47Ilkay Ulusoy, Uyur Halici, ılker Anac and Kemal Leblebicioğlu, Ankara, TurkeyErhan Nalçaci, Nakara, TurkeyCanan Başar-Eroiilu, Bremen, Germany
Properties of Multistable Perception During Long Term EEG Recordings 53Ümmiihan lşoğlu·Alkaç, Istanbul, TurkeyCananBaşar-Eroğlu, Bremen, Germany
Cognitive Potentials to Visual and Auditory Discrimination Tasksin Children and Adolescents 59M. Zgorzalewicz, B. Galas-Zgorzalewicz and R. Noıoak, Poznan, Poland
ILI
CLINICAL
Diagnostic Utility of Electrophysiological Testing: Approaches and Obstacles 67Nashaat N. Boutros, New Haven, Connecticut, USAMustafa Senocak. Istanbul, Turkey
Electric Brain Activity in Psychiatry: Research Tools with Clinical Value 71Oliver Pogarell and Ulrieh Hegerl, Munich, Germany
Reliability of Brain Responses to a Person's Own Namein Healthy Subjects and Patients with Brain Damage 75B. Kotehoubeg, S. Lang, E. Herb and P. Maurer, Tübingen, GermanyN. Birbaumer, Trento, ltaly
Psychogenic Dysphagia and Globus Sensation 81Cumhur Ertekin, Bornova-lzmir, Turkey
INDEX 89
IV
)
Preface,
Editors:Norman C. Moore, MD, and M. Kemal Arikan, MD
Istanbul is both the nearest Asiarı city to Europe and the nearest European city to Asia, connecting continents,cultures and religions. it is a city of 11 million people living on a hill surrounded by two seas. it was the capital cityof both Byzantine and Ottoman Empires, and trade paths passed through the city for thousands ofyears. It was there-fore appropriate for scientists and clinicians from all over the world to meet in Istanbul in June 2001, for a confer-ence "Electrophysiology in elinical practice and research." This book consists of selected papers, which are repre-sentative of the lectures given at the meeting. The authors have updated and rewritten the chosen presentations,which were the n subjected to peer reviewand appropriate revision.
Kemal Arikan had the idea to host the conference, and asked Norman Moore, then President of the EEG andClinical Neuroscience Society (ECNS), to assist with the organization. He hoped that Turkish electrophysiologistswould benefit from observing the reasoning and problem solving of leading scientists. He alsa wanted them to devel-op personal relationships with these leaders and other colleagues. Finally, he was confident that, by presenting theirown work, they would enhance their own and Turkey's reputation in the science of electrophysiology. Weare pleasedto report that all these goals were met. The successful meeting could not have been held without the support andassistance of many. These include Roche Turkey, which gave a generous educational grant, and the University ofIstanbul, which assisted with administration. Wyeth Turkey, Turkcell and Turkiye Is Bankasi provided invaluablefunding for organization expenses. The Turkish Company, Interium, did an excellent job of organizing theConference. All members of the former Turkish Society of Electrophysiological Psychometry contributed greatly tothe meeting.
v
)

THEORY
Biology of Brain Waves: Natural History andEvolution of an Information-Rich Sign of Activity
Theodore Holmes Bullock. University of California San Diego, La Jolla, California, USA
ABSTRACTUsing "brain waves" and "EEG" broadly for ongoing
electrical aetivity and stimulus- or event-related activi-ty of organized masses of neural tissue, as seen by wide-band amplifiers and maero-, miero- or semi-mieroelee-trodes within or in eleetrieal eontaet with the centralnervous system, i eonsider the eharaeter of these signsin animals of many phyla, by various deseriptors,emphasizing loeal field potentials, pregnant questionsand researeh opportunities.
We still have inadequate or hardly tested ideas ofwhy most invertebrates, large and smail, have incon-spieuous slow waves «50 Hz) and eonspieuous spikes.They can, however, show slow waves und er certain eon-ditions, somewhat reminiscent of spinal cord, cerebel-lum or retina.
We have even less tested explanations of the strongsimilarity of all vertebrates: fish, amphibians, reptiles,birds and mammals, large and smaIl - with respect tothe power spectrum of conspicuous slow and inconspic-uous spikes (until hunted by microelectrodes).Amplitude is the only obvious difference among verte-brate classes, mammals being highest. This may comefrom an evolution of the prevalence of synchrony, attrib-utable, if true, to a generaIly higher coherence betweenpairs of sites in reptiles, birds and especially mammals.
The strong similarity in the power spectrum, amongtaxa with and without a cortex, is onlyone of severalreasons to believe that we have not found the most rel-evant measures to reveal the real structure of the timeseries, in space and time. Fine strueture in the millime-ter and fraetional second domains, in the seemingiy sto-ehastie, wideband eomponent of activity, is probablywidespread and greater in mammals than in fish. it hasproperties that are not obvious, such as nonlinear quad-ratic phase couplings and pseudo-periodieities, locallyand episodieaIly. Wavelet analysis, independent eompo-nent analysis and other tools that might reveal non-rhythmic fine structure have not yet be en applied toevolutionary studies.
A new tool, the Period-Specific-Average (PSA) canshow real rhythms even when the power spectrum doesnot and shows absence of rhythms at some frequencieswhere the power spectrum peaks show Fourier compo-
nents of irregular transients. The PSA shows that mostof the speetrum, most of the time, in most human eor-tex is without significant rhythms. Speeial eonditionsbring out episodes of delta, theta, alpha, beta andgamma waves and the ir subtypes, usually onlyone ortwo at once, while most of the energy is wideband andseemingiy stochastic. Between episodes of one or tworhythms there are major periods of time in normalhuman life without any significant rhythm in cortiealsurface (subdura!) and depth electrodes. In spite ofmany kinds of sophistieated analyses, gross mappings,and models, with our present understanding, we cannotyet anticipate the character of sealp or subdural surfaceor macroelectrode depth recordings from microelec-trode data or viee versa. Also lacking, so far, is any gen-eral understanding of the relation of slower, local fieldpotentials and spike firing. Examples are known ofstrong positive correlations and others show no correla-tion. Communication among neurons by subthreshold,nonsynaptic routes is probably important in some evolv-ing places and times.
The relative neglect of the basic biology, natural his-tory, evolution, and system identification of local fieldpotentials at different scales in different places is unde-served and a prime opportunity for new tools .
if a living organism moves or emits light, electricity,secretions, or sound, whether it sings or buzzes or ticks,if it squirts or flowers or lays eggs, biologists ask threekinds of questions: what, how and whence. The firstquestion may be stated: what is the most adequatedescription ofwhatever is happening? The second ques-tion: how does it work? The third question is where didit come from - ontogeneticaIly and phylogeneticaIly?The task I set myself here is to look at what we neuro-scientists have done and comment on the propositionthat we haven't done much on any of these three frontswith respect to one form of action, the electrical activi-ty of the nervous systems of humans and other animals.
Our descriptions of brain waves (a term which I wiIluse as shorthand for ongoing eleetrieal activity of thecentral nervous.system, whether seen from the sealp, oron, or in the brain) have usuaIly been in terms of thepower speetrum. This may be about as adequate asdeseribing an opera in terms of its power spectrum.
3
)
Chaos analysis and mutual information and bispectrumand all the rest have surely not adequately deseribedthe fine structure in space and time and the coopera-tivity of the myriad electrical generators in the depthsof the brain. Stili less have we an understanding ofeither how the brain waves are generated or what theirroles may be - that is, whether theyare purely thenoise of the engine or can sometimes in some placesalso act as causes, able to influence cells in a field.
i find in some current literature that the EEG is thesummation of action potentials! More often it is consid-ere d to be the summed synaptic potentials. We certain-!yknow a number of other kinds of potentials that are atleast candidate contributors and we can suspect stiliothers. Even farther behind is any big picture of the evo-lution of brain waves - who has them, what theyarelike and how come? iwill make some remarks on eachof these three areas, as seen by a comparative biologist.
THE "HOW ITWORKS" QUESTIONFirst, let me deal with the how question - because
there is little more to say. Wethink that most of the gen-erators are cellular or subcellular, that is the cell mem-brane of one part of the cell changes its impedance orleakiness, relative to other parts of the cell. The imped-ances face standing potentials across the membrane,which may vary from place to place. This subcellular dif-ferentiation of one part from another, changing in time,is essential to explain the extracellu!ar field activity,because if the whole cell stood or changed together wewould have a closed system and could see nothing in theexternal field. We suppose that each of several kinds ofmembrane changes contributes to the summed externalfield: all-or-rıone action potentials (as far as they caninvade the somata, dendrites and axon terminals),graded slow (ca. 0.1-50 Hz), subthreshold and infraslowchanges in the membranes, pacemaker potentials, bothrhythmic and nonrhythmic, local potentials, synapticpotentials, miniature, even quantal events peculiar toaxonal terminal arbors or to dendrites or somata.
Some neurons - perhaps quite a few - never orrarely have all-or-none action potentials - which imayhereafter call spikes. Neuroglia of several kinds are alsocandidate generatorso We cannot exc!ude other sourcessuch as streaming potentials at the walls of blood vesselsand epithelial potentials at the ependymal and pial sur-faces. Empirically we find that events contribute over awide spectrum of durations, from fractional millisecondsto many seconds and even minutes. The cellular andsubcellular generators act as dipoles or muItipoles in thesize range from a few up to at least dozens of mlerome-ters, and they have some more or less consistent orierı-tations to help determine their contributions to the sum.The extracellular volume conductor is a complex config-uration of interstices that cannot be assumed to be
homogenous. Most of this is a guess and we might have aquite distorted idea of the true situation. ın.u.ıa.ı 1.17.1'.'" Ofcourse, the re is an enormous literature on brain waves;a great deal has been learned - mostly elinical correla-tions. Here we deal with general biological questions.
In particular i would underline that we have littlebasis to judge the relative importance of spikes andsynaptic communication on the one hand and of non-spike, nonsynaptic communication between cells on theother - especially since the ir qualitative roles are nodoubt quite different in the kind or meaning of the com-munications they mediate.
The diversity of kinds of neurons must have somerole and consequence in the summed activity of organ-ized assemblies. Uniquely among all the organ systemsof the body, the nervous system has units with widelydifferent or only slightly, but importantly, differentreceptive fields and projection fields as well as sub-threshold behavior and spiking properties from neverspiking to two kinds of spikes."
Synchrony among some proportion of the activecells, whether firing spikes or undergoing subthresholdfluctuations, due to intrinsic cellular spontaneity or toimpinging input, must be a major variable. Probably sev-eral distinct kinds of synchronization coexist, largely byway of the phase locking of slow fluctuations and thenceof spikes or bursts.
Non-eynaptic field effects are probably a major partof the communication between cells, besides theclas-sical spikes and synapses, usually the only channelconsidered. Non-synaptic influences include directelectrical subthreshold interaction of slower fluctua-tions, some very slow and spoken of as "DC" or "infra-slow" potentials.l-":"
The infraslow potentials are often greater in voltagethan all the rest of the activity and almost certainlyexert strong modulatory influences upon spiking fre-quencies of many cells.2",I;.IH.2X,211.:ır,.:ın.:1!I.42.4:ı,4n
As already stated, we have no basis for estimatingthe relative importance of spike and synapse vs non-spike, non-synaptic information processing and commu-nication in neuropile and gray matter. Long distancecommunication that depends on spikes is certainlyimportant but may be the posta! service to the morecontinuous, decisive, integrative communication withinthe board rooms, auditoriums, offıces and homes of theneurons and the glia, ihope it is obvious by now that theaim is to lift up for attention some questions of broadgeneral interest that have been relatively negIected andoffer attractive opportunities for new research.
NEURONALINTEGRATNEMECHAJilSMSInstead of a code of the brain, several or many codes,
including non-sp ike codes, operate in parallel. The longlist of integrative mechanisms, cellular and subcellular,
4
)
A
•••••••••••• '+0.0045••••••••••••• ••
o - i.\F(x,y.t}
~
-0.0045-1mm
O,006t:""
c;
İ0.004
0.002
~~LL
_9,000
x -0.002'T
-0.004
-0.006 -----1 s
40 60
Time (units are frame numbers, at 17/s)8020
B,.'Vo. ..••.o•••\ ••,~,"'\I\IIwL-..•••I••••ı!~ı'ımln
"""""1'\".'''\.....•........•• \
. Y"w.'".1~"f'IwVl"'yA,r,V\~"" l{V\~"""""""·~rvif'-r""'~~--~""""'~"'.""""-'""'''"'-...";",-,,,,,
N~~!\rw.",,,,,,,,,,~------..._~~.,-,,",
~~"'~~~~)Yıf~~'1"-"'''-wıW{'VV>w''''''''''\r<ı.I",,~-'w'~_
'J V Photcdiodes: :itrıpe app~nn> dis<!pp~
20°1" A ~ "''''<....//'Oj.--------. ==_===;===~o====='T"========
-200 Jo Seconds 9
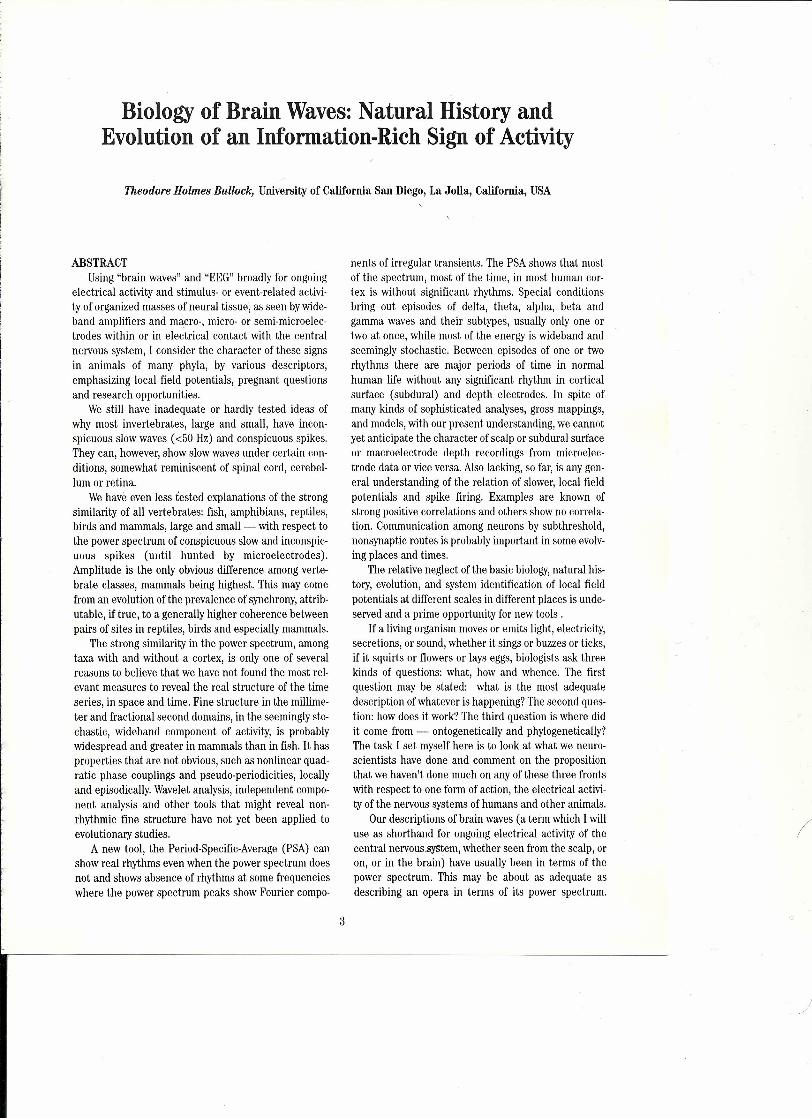
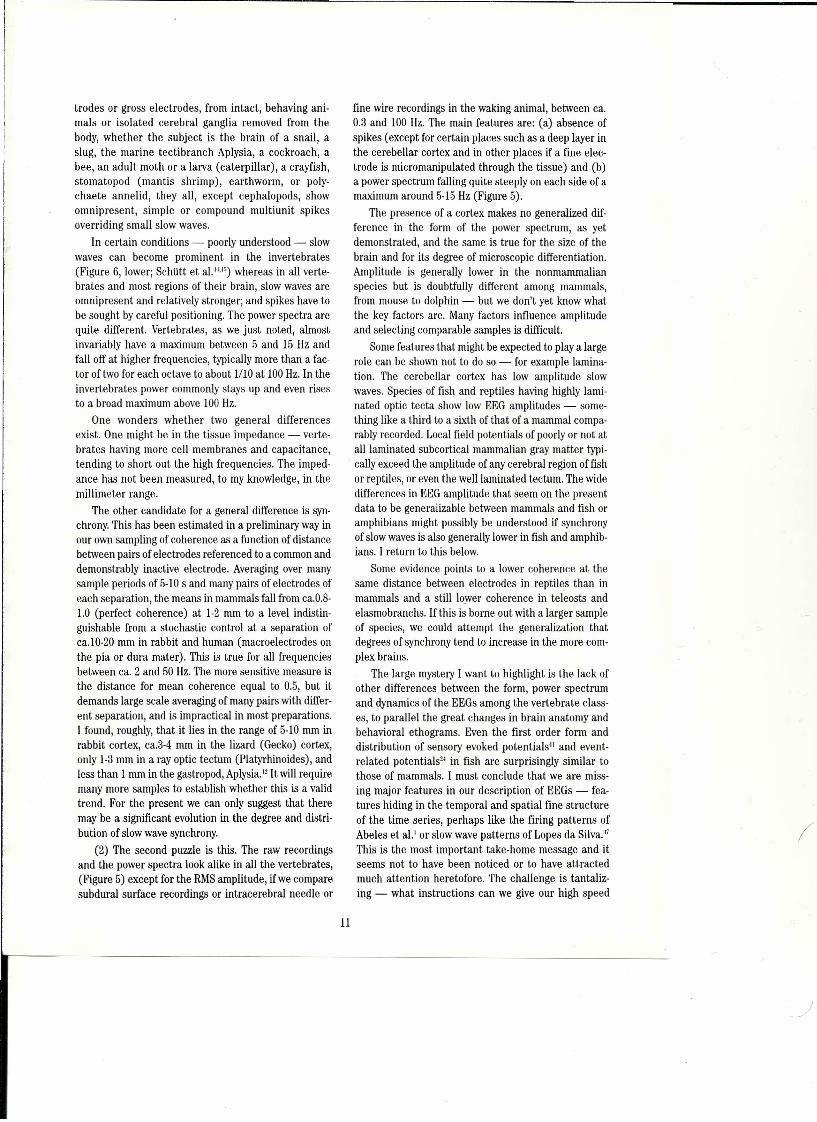
Flgure ı..A, Optically recorded visual evoked potentials from turtle dorsal cortex. Upper: 4 rows of 12 photographs of the brain surface, leftto right, top to bottom, during 2.7 s of a video sequence of the stimulated membrane voltage changes, Each frame is a pseudo-col-ored image of 1,7x ı.7 mm of the right visual area; rostral = right, lateral = up, white proflle coming in from lower left = elec-trode. The moving visual stimulus starts in frame #30 (first of second row), causing a net hyperpolarization (dark blue) in frames32-37, followed by depolarizations at a few loci which expand in caudal and lateral directions in frames 43-49; that is the figureshows a traveling wave. Bottom left: emission changes vs time from 3 loci indicated by the color-coded boxes in the enlargedframe #53, bottom right. The timing difference among the 3 plots reflects the spread of excitation. Responses imaged by epi-illu-mination with a CCDcamera, 17 frames/s, alter application of the fluorescent voltage-serısitive dye, RH795.Kindness of J,C.Prechtl (see Prechtl et aL.(1997),4"B. Raw data from 9 single sweeps of asimilar preparation that shows the ON response, a"gamma" burst (ca, 20 Hz at 25°C), not time-Iocked and hence disappearing in an average - superimposed on a slow wave; noOFF effect. Turtle intracortical EEG;stimulus is a slowly moving visible stripe. Kindness of J.C. Prechtl.
5
)
whereby converging influences upon a neuron, excitato-ry and inhibitory, are weighted, and facilitate over timeor disfacilitate with shorter or longer time-constants, orboth - this list is alteady well above fıfty (Bullock1993,16 p.l6) and increases with nearly every issue of thejournals. These integrative mechanisms act at many lev-els: protein synthesis, intracellular messengers, releaseof modulators of many kinds, gate opening and closingrates, transfer functions and non-linearities of manysteps. Something similar probably happens with respectto smail or medium populations of cells and more or less
- discrete circuits. By something similar, i mean there areprobably severallevels of integration and parallel as wellas serial operations. My guess is that the brain is a reser-voir of unfamiliar principles of system organization,waiting to be discovered.
The operations of the brain and of its constituentparts, nuclei, laminae, and eircuits are not well und er-standable simply by unraveling the connectivity or hardwiring. We require also a major set of specifications ofproperties for each unit and site of interaction, mostlydynamical and plastic properties. i call them personali-ty traits of the neurons and glia and sets of them. Theyrepresent formulae, equations and graphs of timedependence and state dependence, as additional de ter-minants of output. The expression "circuits," even "localcircuits," in the usual electronic engineering sense is aquite inadequate analog and terminology.
For this most complex of all systems, except systemsof brains, we lack appropriate familiar terminology andanalogs, Sometimes i find it heuristic to liken the organ-ization of a brain to that of a complex human institutionsuch as the government or a university. Many similarindividuals perform a few similar acts - writing, speak-ing, filing and transporting materials, with many levelsof integration, degrees of uniqueness and redundaney,plastic eonnectivity, serial and paralle!. But, the anal 0-
gy is limited.
Still speaking to the problem of how it works, the sei-enee cannot afford to wait for information about singlecells and lower levels to accumulate sufficiently to per-mit bottom-up explanation or predietion of organizedassembly dynamies. Emergents have already spieed upthe history of brain physiology and are the only sure pre-dietion in our seience. Even hundred-channel recordingof units, even if each channel were, as never before,wideband to allow both spikes and slow signals to beseen, is unlikely to make interpretation easier.Multichannel unit recording, with high resolution inspace and time, is eertainly the wave of the future and awhite hope for new insights, stipulating technical prob-lems yet to be solved. But it will overlap with multiunitextracellular field potential, wideband recordings -whieh i am here advocating in spite of the relative neg-
lect and low opinion of some physiologists who are stillmaking important discoveries from unit spike reeord-ings. Another outstanding need today is for models of thenervous tissue, realistic with respect to geometry of sub-cellular generators, volume conduction, both spike-likeand subthreshold, slow activity - on which to test ideasabout synchrony, rhythms, field effeets and redundancy.
THE "WHAT" QUESTION - ANADEQUATE DESCRIPTION?
This view of how it works does not give any elues towhat we should measure or look for in the time seriesand their spatial distributions in various parts of thebrain and different speeies to provide an adequatedeseription of brain waves. Now that the brain is regard-ed as central to behavior and mentallife, we can not besatisfied with statistical measures of Gaussianity,Fourier analyses of energy at each equivalent frequencycomponent, or estimates of dimensionality. Expectingnonlinearity and nonstationarity to be charaeeristic,except in special states, we do well to see k any evidenceof mierostrueture, temporal as well as spatia!.
Whether one considers the ongoing unstimulatedbackground activity or the activity related to stimuli or tomental events or to changes in state, an array of extracel-lular, semimicro-probes, eaeh detecting the widebandactivity of a smail volume overlapping with that of neigh-bors offers an array of information-rich time-series thatchallenges our ingenuity to find tools that might uncovernonrandomness potentially related to behavior or state. ifthe array is fortunately situated we may be able to recog-nize some of that rich information, although it will in thegeneral ease be as difficult to interpret as would an arrayof microphones at a political convention in a foreign lan-guage; indeed, even more diffieult, since the number ofunits in the brain is many times greater. One concept thatembraces many approaches and relevant measures iscalled cooperativity - any aspect of the assembly con-sidered as though it were an interacting group.
Figure lA shows one current state-of-the-art methodof visualizing cooperativity of traveling brain waves in aplane by using voltage sensitiye dyes and optical record-ing via an array of ca. 20 x 20 sensors. Without averag-ing, but confined to the near-surface plane, ca. 60 msand 80 pm temporal and spatial resolution is permittedin this favorable case by the optical no ise reduction ofreplacing blood with corpuscle-free saline in a suitablytolerant species, the po nd turtle.
Coherence is a first order, linear form of eooperativ-ity measured for pairs of places at each frequency in theFourier space. Although on the average it is highbetween electrodes a few eell diameters apart, in ourmeasurements of rabbit cortex it is comm only low andvaries widely second by second and pair by pair a fewmillimeters apart.2ı,25,26 Average coherence falls rapidly
6
~)
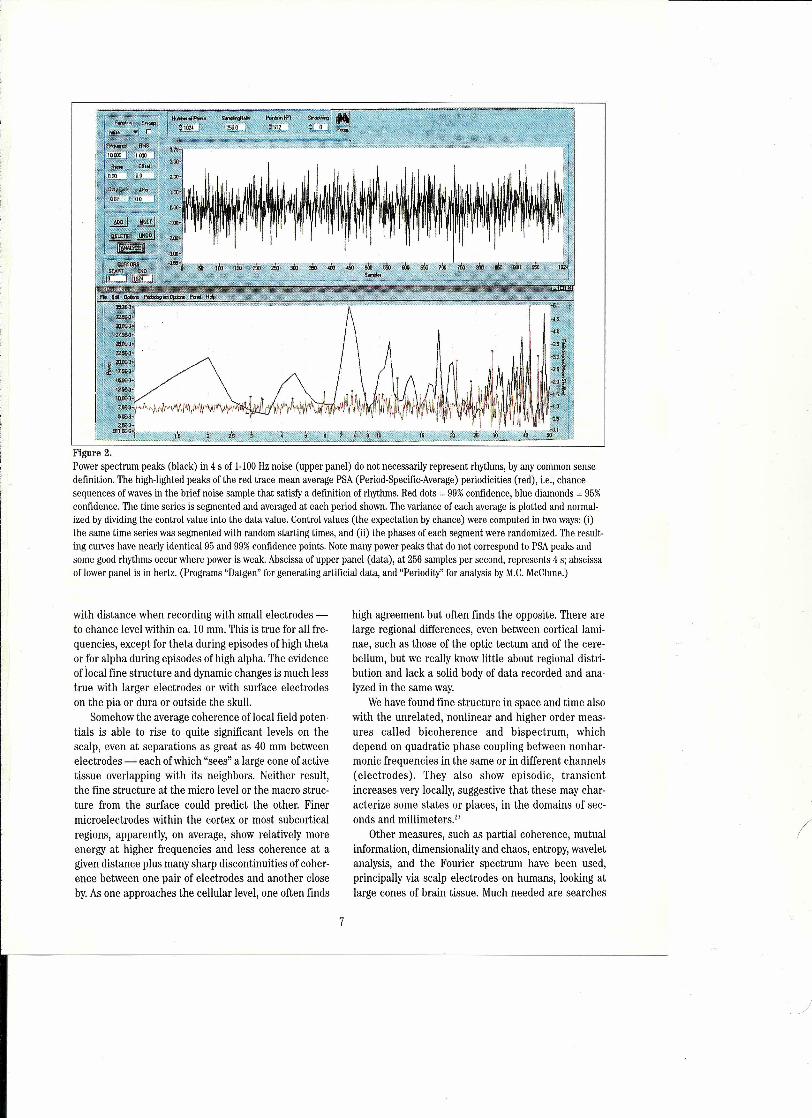
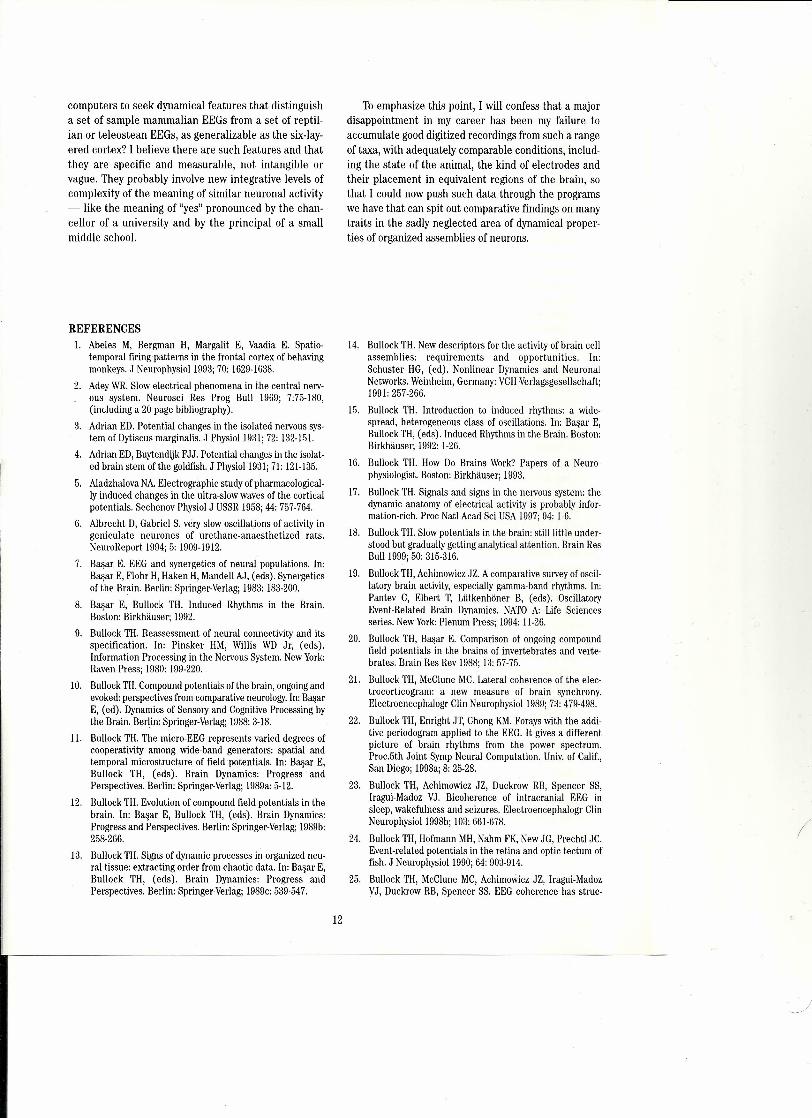
Figure 2.Power spectrum peaks (black) in 4 s of 1-100Hz noise (upper panel) do not necessarily represent rhythms, by any common sensedefinition. The high-lighted peaks of the red trace mean average PSA (Period-Specific-Average) periodicities (red), i.e., chaneesequences of waves in the brief noise sample that satisfy a definition of rhythms. Red dots = 99%confidence, blue diamonds = 95%confidence. The time series is segmented and averaged at each period shown. The variance of each average is plotted and normal-ized by dividing the control value into the data value. Control values (the expectation by chance) were computed in two ways: (i)the same time series was segmented with random starting times, and (ii) the phases of each segment were randomized. The result-ing curves have nearly identical 95 and 99%confidence points. Note many power peaks that do not correspond to PSApeaks andsome good rhythms occur where power is weak. Abscissa of upper panel (data), at 256 samples per second, represents 4 s; abscissaof lower panel is in hertz. (Programs "Datgen" for generating artificial data, and "Periodity" for analysis by M.C.McClune.)
with distance when recording with smail electrodes -to chance level within ca. 10 mm. This is true for all fre-quencies, except for theta during episodes of high thetaor for alpha during episodes of high alpha. The evidenceof local fine structure and dynamic changes is much lesstrue with larger electrodes or with surface electrodeson the pia or dura or outside the skull.
Somehow the average coherence of local field poten-tials is able to rise to quite significant levels on thescalp, even at separations as great as 40 mm betweenelectrodes - each ofwhich "sees" a large cone of activetissue overlapping with its neighbors. Neither result,the fine structure at the micro level or the macro struc-ture from the surface could predict the other. Finermicroelectrodes within the cortex or most subcorticalregions, apparently, on average, show relatively moreenergy at higher frequencies and less coherence at agiven distance plus many sharp discontinuities of coher-ence between one pair of electrodes and another closeby. As one approaches the cellular level, one often finds
high agreement but often finds the opposite. There arelarge regional differences, even between cortical lami-nae, such as those of the optic tectum and of the cere-bellum, but we really know little about regional distri-bution and lack a solid body of data recorded and ana-lyzed in the same way.
Wehave found fine structure in space and time alsowith the unrelated, nonlinear and higher order meas-ures called bicoherence and bispectrum, whichdepend on quadratic phase coupling between nonhar-monic frequencies in the same or in different channels(electrodes). They also show episodic, transientincreases very locally, suggestive that these may char-acterize some states or places, in the domains of see-onds and millimeters."
Other measures, such as partial coherence, mutualinformation, dimensionality and chaos, entropy, waveletanalysis, and the Fourier spectrum have been used,principally via scalp electrodes on humans, looking atlarge cones of brain tissue. Much needed are searches
7
for wave or spike burst packages with a degree of com-plexity that recur nowand then, permitting efforts tofind their correlates. Quite possibly some programsmight be useful from the libraries of the search for non-random patterns in radio frequencies from extraterres-trial sources.
Particularly promising is the recently introducedIndependent Component Analysis (lCA) which allowssearching for localized sources of distinct time series atthe resolution of the spacing of electrodes." lt has not tomy knowledge been applied intracranially or to labora-tory animals or non-mammals.HOW MUCH LS LOCALBRAIN ACTMTY RHITHMIC?
At present my colleagues and I are exploring rhythms(= oscillations) in human subdural and depth as well asscalp recordings, non-human and non-mammalian andinvertebrate recordings, with a new method that permitsthe distinction between real rhythms and peaks ofFourier components which may not represent rhythmsbut Fourier components of irregular transients=" it is anadditive periodogram we call Period Specific Averaging(PSA), based on the method of Enright'"; the time seriessample is segmented at an arbitrary period and these areaveraged; this is repeated at every possible periodbetween chosen limits, at aresolution of <1% of the peri-od. The variance of each average is plotted against theperiod. Periodicities can be revealed which are missed bythe FIT as well as, more often, absence of periodicityrevealed where the FFT has a peak. PSA is nearly inde-pendent of wave form or duration of a repetitive event. itcan show up to several nonharmonically related rhythmsanywhere in a chosen range, such as 2-50 Hz, even in briefsample epochs. it works even when the stochastic back-ground is many times higher than the rhythmic signal, i.e.,with a signal to noise ratio of 1/4 or 1/5. if the rhythm issloppy or frequency-jittered by 10 or 20 percent it is stilluseful though less sensitive. The control is the same timeseries segmented with randomized phase or randomizedstart times, permitting peaks to be highlighted when theyare 95% or 99% confident. Figure 2 shows a short sampleof band-passed noise and the absence of confidentrhythms at some periods with FFT peaks.
The idea is to provide another descriptor potentiallydiscriminating or characterizing places in the brain, orstates, stages and species or taxa. So far this methodhas shown that: (a) much of the time most electrodessee no rhythm, (b) rhythms are often short lived -appearing in one 4 s epoch and not the next, (c) clearrhythms in the human are usually narrow-peaked,rarely sloppy or otherwise frequency modulated, (d)generally, if there is a rhythm at all there is onlyonethat stands out or lasts for some time; but a second,third or fourth not harmonically related can occur, usu-
ally for a short time. The method has many limitationsand the plots are not easy to read, as yet.
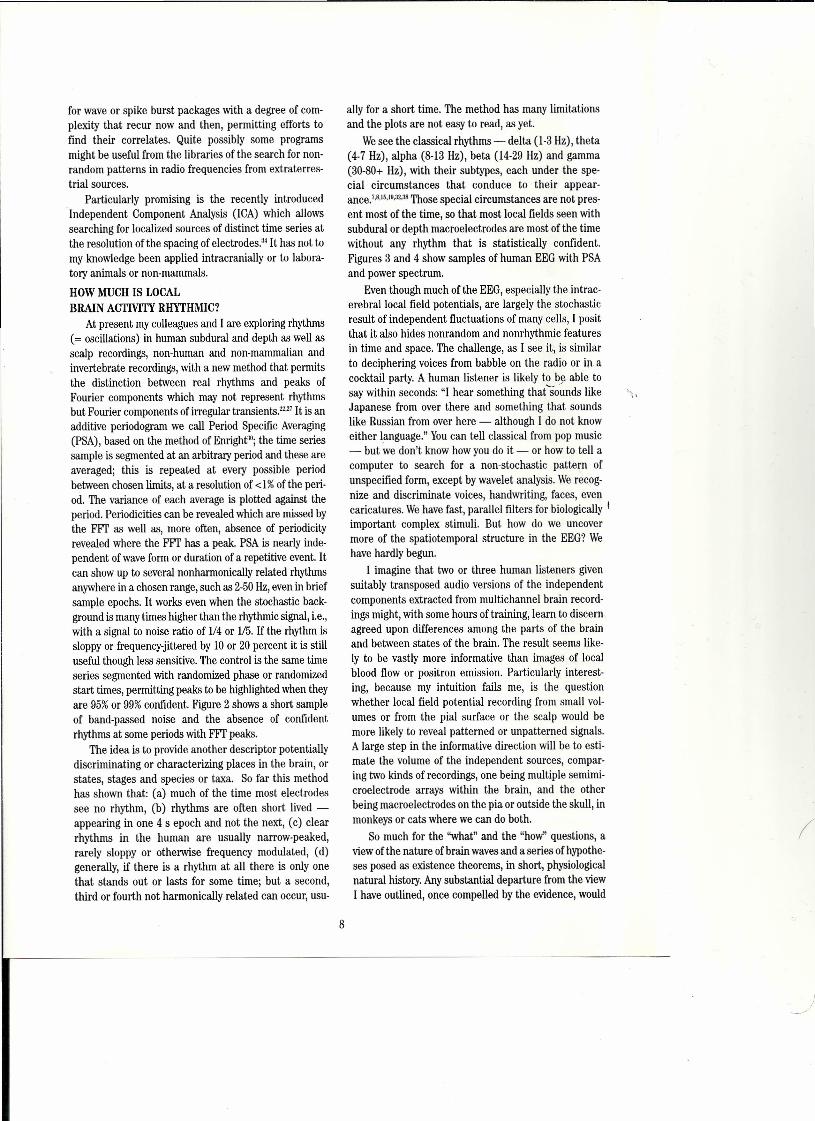
Wesee the classical rhythms- delta (1-3 Hz), theta(4-7 Hz), alpha (8-13 Hz), beta (14-29 Hz) and gamma(30-80+ Hz), with their subtypes, each under the spe-cial circumstances that conduce to their appear-ance.7.8.15.1.;tl;uıThose special circumstances are not pres:ent most of the time, so that most local fields seen withsubdural or depth macroelectrodes are most of the timewithout any rhythm that is statistically confident.Figures 3 and 4 show samples of human EEG with PSAand power spectrum.
Even though much of the EEG, especially the intrac-erebrallocal field potentials, are largely the stochasticresult of independent fluctuations of many cells, I positthat it also hides nonrandom and nonrhythmic featuresin time and space. The challenge, as I see it, is similarto deciphering voices from babble on the radio or in acocktail party. A human listener is likely to be able tosay within seconds: "I hear something thatso~nds like "'.Japanese from over there and something that soundslike Russian from over here - although I do not knoweither language." Youcan teli classical from pop music- but we don't know how you do it - or how to tell acomputer to search for a non-stochastic pattern ofunspecified form, except by wavelet analysis. We recog-nize and discriminate voices, handwriting, faces, evencaricatures. Wehave fast, parallel fılters for biologically iimportant complex stimuli, But how do we uncovermore of the spatiotemporal structure in the EEG? Wehave hardly begun.
i imagine that two or three human listeners givensuitably transposed audio versions of the independentcomponents extracted from multichannel brain record-ings might, with some hours of trairıing, learn to discernagreed upon differences among the parts of the brainand between states of the brain. The result seems like-Iy to be vastly more informative than images of localblood flow or positron emission. Particularly interest-ing, because my intuition fails me, is the questionwhether local field potential recording from smail vol-umes or from the pial surface or the scalp would bemore likely to reveal patterned or unpatterned signals,A large step in the informative direction will be to esti-mate the volume of the independent sources, compar-ing two kinds of recordings, one being multiple semimi-croelectrode arrays within the brain, and the otherbeing macroelectrodes on the pia or outside the skull, inmonkeys or cats where we can do both.
So much for the ''what'' and the "how" questions, aview of the nature ofbrain waves and a series of hypothe-ses posed as existence theorems, in short, physiologicalnatural history. Any substantia! departure from the viewI have outlined, once compelled by the evidence, would
(
8
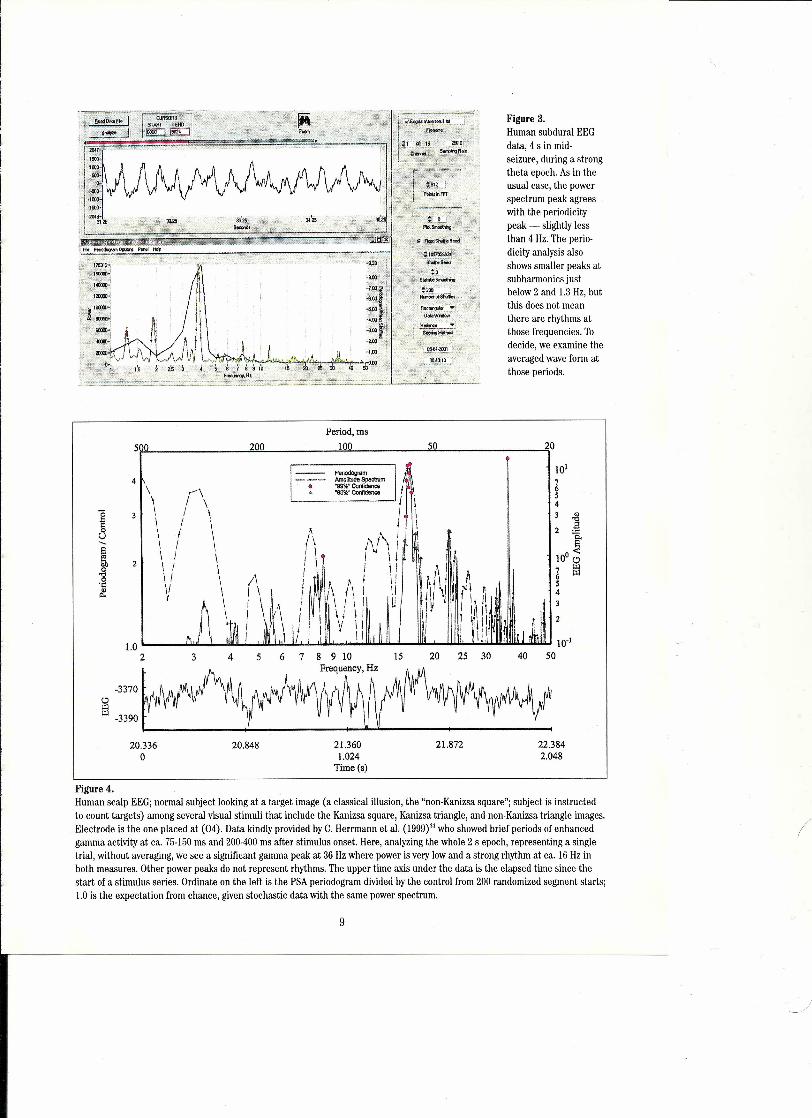
Figure 3.Human subdural EEGdata, 4 s in mid-seizure, during a strongtheta epoch. As in theusua\ case, the powerspectrum peak agreeswith the periodicitypeak - slightly lessthan 4 Hz. The perio-dicity analysis alsoshows smailer peaks atsubharmonics justbelow 2 and 1.3 Hz, butthis does not meanthere are rhythms atthose frequencies. Todecide, we examine theaveraged wave form atthose periods.
Period,ms
100 50 20
4 1\ 1--;- =:~eclrum i h\..-\ - ::~:g:::~i\ i \ '-------'1 \i i \ i ii i \ ı iii \ ~ \ ii i i (\1 j\ t \ ,i i i i \ ,'" 11 ,i i \ i '\i \ i Ji i i 1\ ı i i i ~:i i i ~II i i \ i!\ l, ii 1\1 \j ! t \ iır i'ı A IlIM' 1,1 \\~ Aıı 111 \ J \ \1 i Y i In 11 J i
II i Y i i i ı llı' Lı i i n1 li.\ i Iı ~ ,J II. 111'.\1 i:~ ıl ~iıı1.0 L-__ w..L...L.....JJIlUl....:......ı..Il.U.LIW.l..ı..IWl.I..I.ı.. •••.•••.i..i..Ulu..ıı..JJ...iI._.lW....ı.-w..ııı...ı.;.ı..ıı;.ı..ııw.ııwULlilJLI ıo-ı
2 3 4 5 6 7 8 9 10 15 20 25 30 40 50requency, Hz
-3370
~ -3390i
20.336 20.848 21.360 21.872 22.384O 1.024 2.048
Time (8)
5 lO 200
101
~543
Figure 4.Human scalp EEGj normal subject looking at a target image (a classical illusion, the "non-Kanizsa square"; subject is instructedto count targets) among several visual stimuli that include the Kanizsa square, Kanizsa triangle, and non-Kanizsa triangle images.Electrode is the one placed at (04). Data kindly provided by C. Herrmann et aL.(I999?1 who showed brief periods of enhancedgamma activity at ca. 75-150 ms and 200-400 ms after stimulus onset. Here, analyzing the whole 2 sepoch, representing a singletrial, without averaging, we see a significant gamma peak at 36 Hz where power is very low and a strong rhythm at ca. ı6 Hz inboth measures. Other power peaks do not represent rhythms. The upper time aıds under the data is the elapsed time since thestart of a stimulus series. Ordinate on the left is the PSA periodogram divided by the control from 200 randomized segment starts;1.0 is the expectation from chance, given stochastic data with the same power spectrum.
(
9
)
,000Frequency. Lu
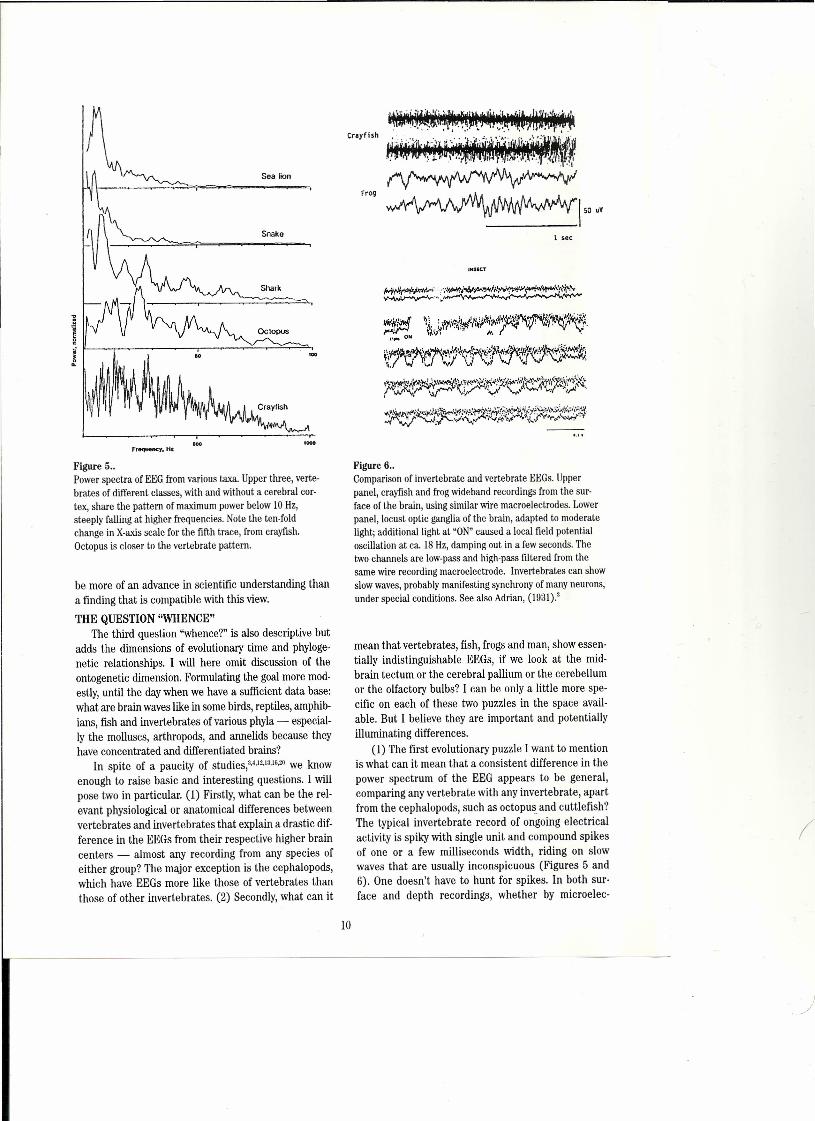
Figure 5..Power speetra of EEG from various taxa. Upper three, verte-brates of different classes, with and without a eerebral eor-tex, share the pattern of maximum power below 10 Hz,steeply falling at higher frequeneies. Note the terı-foldchange in X-axis scale for the fifth trace, from erayfish.Oetopus is closer to the vertebrate pattern.
be more of an advance in scientific understanding thana finding that is eompatible with this view.
THE QUESTION "WHENCE"The third question "whence?" is alsa deseriptive but
adds the dimensions of evolutionary time and phyloge-netic relationships. i wiIl here omit discussion of theontogenetic dimension. Formulating the goal more mod-estly, until the day when we have a sufficient data base:what are brain waves like in some birds, reptiles, amphib-ians, fısh and invertebrates ofvarious phyla - especial-Iy the molluscs, arthropods, and annelids because theyhave concentrated and differentiated brains?
In spite of a paucity of studies,3.4,'2,'3,'G,20we knowenough to raise basic and interesting questions. I willpose two in particular. (1) Firstly, what can be the rel-evant physiological or anatomical differences betweenvertebrates and invertebrates that explain a drastic dif-ference in the EEGs from their respective higher braincenters - almost any recording from any species ofeither group? The major exception is the cephalopods,which have EEGs more like those of vertebrates thanthose of other invertebrates. (2) Secondly, what can it
·.1'··.
Crayfish
Frog
_______ 150 uY
1 see
ıNSlCT
Figure 6 ..Comparison of invertebrate and vertebrate EEGs. Upperpanel, crayfish and frog wideband reeordings from the sur-faee of the brain, using similar wire maeroeleetrodes. Lowerpanel, loeust optie ganglia of the brain, adapted to moderatelight; additionallight at "ON"eaused a loeal field potentialoscillation at ca. 18 Hz, damping out in a few seeonds. Thetwo ehannels are low-pass and high-pass filtered from thesame wire reeording maeroeleetrode. Invertebrates can showslow waves, probably manifesting synehrony of many neurons,under speeial eonditions. See also Adrian, (1931).:1
mean that vertebrates, fish, frogs and man, show essen-tially indistinguishable EEGs, if we look at the mid-brain tectum or the cerebral pallium or the cerebellumor the olfactory bulbs? I can be only a little more spe-cific on each of these two puzzles in the space avail-able. But I believe theyare important and potentiallyilluminating differences.
(1) The first evolutionary puzzle iwant to mentionis what can it mean that a consistent difference in thepower spectrum of the EEG appears to be general,comparing any vertebrate with any invertebrate, apartfrom the cephalopods, such as octopus and cuttlefish?The typical invertebrate record of ongoing electricalactivity is spiky with single unit and compound spikesof one or a few milliseconds width, riding on slowwaves that are usually inconspicuous (Figures 5 and6). One doesn't have to hunt for spikes. In both sur-face and depth recordings, whether by microelec-
(
LO
)
trodes or gross electrodes, from intact, behaving ani-mals or isolated cerebral ganglia removed from thebody, whether the subject is the brain of a snail, aslug, the marine tectibranch Aplysia, a cockroach, abee, an adult moth or a larva (caterpillar), a crayfish,stomatopod (mantis shrimp), earthworm, or poly-chaete annelid, theyall, except cephalopods, showomnipresent, simple or compound multiunit spikesoverriding smail slow waves.
In certain conditions - poorly urtderstood - slowwaves can become prominent in the invertebrates(Figure 6, lower; Schütt et aI.H.~'.)whereas in all verte-brates and most regions of their brain, slow waves areomnipresent and relatively stronger; and spikes have tobe sought by careful positioning. The power spectra arequite different. Vertebrates, as we just noted, al mostinvariably have a maximum between 5 and 15 Hz andfall off at higher frequencies, typically more than a fac-tor of two for each octave to about 1/10 at lDO Hz. In theinvertebrates power commonly stays up and even risesto a broad maximum above 100 Hz.
One wonders whether two general differencesexist. One might be in the tissue impedance - verte-brates having more cell membranes and capacitance,tending to short out the high frequencies. The imped-ance has not been measured, to my knowledge, in themillimeter range,
The other candidate for a general difference is syn-chrony. This has been estimated in a preliminary way inour own sampling of coherence as a function of distancebetween pairs of electrodes referenced to a common anddemonstrably inactive electrode. Averaging over manysample periods of 5-10 s and many pairs of electrodes ofeach separation, the means in mammals fall from ca.O.S-L.O (perfect coherence) at 1-2 mm to a level indistin-guishable from a stochastic control at a separation ofca.lO-20 mm in rabbit and human (macroelectrodes onthe pia or dura mater). This is true for all frequenciesbetween ca. 2 and 50 Hz. The more sensitiye measure isthe distance for mean coherence equal to 0.5, but itdemands large scale averaging of many pairs with differ-ent separation, and is impractical in most preparations.I found, roughly, that it lies in the range of 5-10 mm inrabbit cortex, ca.3-4 mm in the lizard (Gecko) cortex,only 1-3 mm in a ray optic tectum (Platyrhinoides), andless than 1 mm in the gastropod, Aplysia." It will requiremany more samples to establish whether this is avaiidtrend. For the present we can only suggest that theremay be a significant evolution in the degree and distri-bution of slow wave synchrony.
(2) The second puzzle is this. The raw recordingsand the power spectra look alike in all the vertebrates,(Figure 5) except for the RMS amplitude, ifwe comparesubdural surface recordings or intracerebral needle or
fine wire recordings in the waking animal, between ca.0.3 and 100 Hz. The main features are: (a) absence ofspikes (except for certain places such as a deep layer inthe cerebellar cortex and in other places if a fine ele c-trode is micromanipulated through the tissue) and (b)a power spectrum falling quite steeply on each si de of amaximum around 5-15 Hz (Figure 5).
The presence of a cortex makes no generalised dif-ference in the form of the power spectrum, as yetdemonstrated, and the same is true for the size of thebrain and for its degree of microscopic differentiation.Amplitude is generally lower in the nonmammalianspecies but is doubtfully different among mammals,from mouse to dolphin - but we don't yet know whatthe key factors are. Many factors influence amplitudeand selecting comparable samples is difficult.
Some features that might be expected to play a largerole can be shown not to do so - for example lamina-tion. The cerebellar cortex has low amplitude slowwaves. Species of fish and reptiles having highly lami-nated optic tecta show low EEG amplitudes - some-thing like a third to a sixth of that of amammal compa-rably recorded. Local field potentials of poorly or not atalllaminated subcortical mammalian gray matter typi-cally exceed the amplitude of any cerebral region of fishor reptiles, or even the welllaminated tectum. The widedifferences in EEG amplitude that see m on the presentdata to be generalizable between mammals and fish oramphibians might possibly be understood if synchronyof slow waves is also generally lower in fish and amphib-ians. ıreturn to this below.
Some evidence points to a lower coherence at thesame distance between electrodes in reptiles than inmammals and a stili lower coherence in teleosts andelasmobranchs. if this is borne out with alarger sampleof species, we could attempt the generalization thatdegrees of synchrony tend to increase in the more com-plex brains.
The large mystery I want to highlight is the lack ofother differences between the form, power spectrumand dynamics of the EEGs among the vertebrate class-es, to parallel the great changes in brain anatomy andbehavioral ethograms. Even the first order form anddistribution of sensory evoked potentials" and event-related potentials" in fish are surprisingly similar tothose of mammals. I must conclude that we are miss-ing major features in our description of EEGs - fea-tures hiding in the temporal and spatial fine structureof the time series, perhaps like the firing patterns ofAbeles et aL.ı or slow wave patterns of Lopes da Silva."This is the most important take-home message and itseems not to have been noticed or to have attractedmuch attention heretofore. The challenge is tantaliz-ing - what instructions can we give our high speed
(
11
computers to seek dynamical features that distinguisha set of sample mammalian EEGs from a set of reptil-ian or teleostean EEGs, as generalizable as the six-lay-ered cortex? i believe there are such features and thattheyare specific and measurable, not intangible orvague. They probably involve new integrative levels ofcomplexity of the meaning of similar neuronal activity- like the meaning of "yes" pronounced by the chan-cellor of a universityand by the principal of a smailmiddle schooL.
REFERENCES1. Abeles M, Bergman H, Margalit E, Vaadia E. Spatio-
temporal firing patterns in the frontal cortex of behavingmonkeys. J Neurophysiol 1993j70: 1629-1638.
2. Adey WR. Slow electrical phenomena in the central nerv-ous system. Neurosci Res Prog Bull 1969j 7:75·180,(inoludlng a 20 page bibliography).
3. Adrian ED. Potential changes in the isolated nervous sys-tem of Dytiscus marginalls. J Physiol lü'll ; 72: 132·151.
4. Adrian ED, Buytendijk FJJ. Potential changes in the isolat-ed brain stern of the goldfısh. J Physiol Iüôl; 71: 121-135.
5. Aladzhalova NA.Electrographic study of pharrnaoologieal-ly induced changes in the ultra-slow waves of the corticalpotentials. Sechenov Physiol J USSR 1958j44: 757-764.
6. Albrecht D, Gabriel S. very slow oscillations of activity ingeniculate neurones of urethane-anaesthetized rats.Neurolceport 1094j 5: 1009-1012.
7. Başar E. EEG and synergetics of neural populations. In:Başar E, Flohr H, Haken H, Mandell AJ, (eds). Synergeticsof the Brain. Berlin: Springer-verlag; 1983: 183-200.
8. Başar E, Bullock TH. Induced Rhythms in the Brain,Boston: Birkhauser; 1992.
9. Bullock TH. Reassessment of neural connectivity and itsspecification. In: Pinsker HM, Willis WD Jr, (eds).Information Processing in the Nervous System. New York:Raven Press; 1980: 199-220.
10. Bullock TH.Compound potentials of the brain, ongoing andevoked: perspectives from comparative neurology. In: BaşarE, (ed). Dynamics of Sensory and Cognitive Processing bythe Brain. Berlin: Springer-Verlag; 1988:3-18.
lL. Bullock TH. The micro-EEG represents varied degrees ofcooperativity among wide-band generatorso spatial andtemporal microstructure of fieldpotentials. In: Başar E,Bullock TH, (eds). Brain Dynamics: Progress andPerspectives. Berlin: Sprlnger-Verlag; 1989a: 5-12.
12. Bullock TH. Evolution of compound field potentials in thebrain. In: Başar E, Bullock TH, (eds). Brain Dynamics:Prograss and Perspectives. Berlin: Springer-Verlag; 1989b:258-266.
13. Bullock TH. Signs of dynamic processes in organize d neu-ral tissue: extracting order from chaotic data. In: Başar E,Bullock TH, (eds). Brain Dynamics: Progress andPerspectives. Berlin: Springer-Verlag; 19S9c:539-547.
To emphasize this po int, iwill confess that a majordisappointment in my care er has be en my failure toaccumulate good digitized recordings from such a rangeof taxa, with adequately comparable conditions, includ-ing the state of the animal, the kind of electrodes andtheir placement in equivalent regions of the brain, sothat i could now push such data through the programswe have that can spit out comparative findings on manytraits in the sadly neglected area of dynamical proper-ties of organized assemblies of neurons.
14. Bullock TH. New descriptors for the activity of brain cellassemblies: requirements and opportunities. In:Schuster HG, (ed). Nonlinear Dynamics and NeuronalNetworks. Weinheim, Germany: VCHVerlagsgesellschaft;1991: 257-266.
15. Bullock TH. Introduction to induced rhythms: a wide-spread, heterogeneous class of oscillations. In: Başar E,BullockTH, (eds).lnduced Rhythms in the Brain. Boston:Birkhauser; 1992: 1-26.
16. Bullock TH. How Do Brains Work? Papers of a Neuro-physiologist. Boston: Birkhauser; 1993.
17. Bullock TH. Signals and signs in the ncıvous system: thedynamic anatomy of electrical activity is probably infor-mation-rich. Proc Natl Acad Sci USA1997j94: 1-6.
18. Bullock TH. Slow potentials in the brain: stilllittle under-stood but gradually getting analytical attention. Brain ResBull1999j 50: 315-316.
19. Bullock TH,Achimowicz JZ. A comparative survey of oscil-latory brain activity, especially gamma-band rhythms. In:Pantey C, Elbert 1', Lütkenhöner B, (eds). OscillatoıyEvent-Related Brain Dynamics. NATOA: Life Sciencesseries. New York:Plenum Press; 1994: 11-26.
20. Bullock TH, Başar E. Comparison of ongoing compoundfield potantials in the brains of invertebrates and verte-brates. Brain Res Rev 1985j 13:57-75.
21. Bullock TH, McClune MC. Lateral coherence of the elec-trocorticogram: a new measure of brain synchrony.Electroencephalogr Clin Neurophysiol 19S9j73: 479-498.
22. Bullock TH, Enright JT, Chong KM. Forays with the addi-tive periodogram applied to the EEG. it gives a differentpicture of brain rhythms from the power spectrum.Proc.5th Joint Symp Neural Computation. Univ. of Calif.,San Diego; 1998aj S: 25-28.
23. Bullock TH, Achimowicz JZ, Duckrow RB, Spencer SS,Iragui-Madoz VJ. Bicoherence of intracranial EEG insleep, wakefulness and seizures. Electroencephalogr ClinNeurophysiol 1995bj 103: 661-678.
24. Bullock TH, Hofmann MH,Nahm FK, New JG, Prechtl JC.Event-related potentials in the retina and optic tectum offish, J Neurophysiol 1990j 64: 903-914.
25. Bullock TH, McClune MC, Achimowicz JZ, Iragui-MadozVJ, Duckrow RB, Spencer SS. EEG coherence has struc-
(
12

ture in the millimeter domain: subdural and hippocampalrecordings from epileptic patients. ElectroencephalogrClin Neurophysiol1995a; 95: 161-177.
26. Bullock TH, McClune MC, Achimowicz JZ, Iragui-MadozVJ, Duckrow RB, Spencer SS. Temporal fluctuations incoherence of brain waves. Proc Natl Acad Sci USA1995b;92: 11568-11572.
27. Bullock TH, McClune MC, Enright JT. Rhythms in thehuman EEG are oeeasional. Proe Seventh Joint SympNeural Computation, Inst Neural Computation, UCSD,LaJolla, CA;2000; ıo. 18-20.
28. Devrim M, Demiralp T, Kurt A, Yücesir ı. Slow eorticalpotential shifts modulate the sensory threshold in humanvisual system. Neurosci Lett 1999;270: 17-20.
29. Elbert T. Slow eortical potentials refleet the regulation ofcortical exeitability. In: McCallum WC, (ed). SlowPotential Changes in the Human Brain. NewYork:PlenumPress; 1993:235-251.
30. Enright JT. The search for rhythmicity in biological time-series. J Theoret Biol 1965;8: 426-468.
31. Ezrokhi VL, Voronin LL. Non-synaptic synchronizingeffects of endogenous single neuron activity on spikeactivity of a neighboring neuron. (Personal commuica-tion); 2001.
32. Gray CM. Synchronous oscillations in neuronal systems:mechanisms and functions. J Computat Neurosci 1994; 1:11-38.
33. Herrmann CS, Mecklinger A, Pfeifer E. Gamma responsesand ERPs in a visual classification task. Clin Neurophysiol1999; 110: 636-642.
34. Jung TP, Makeig S, McKeown, Bell AJ, Lee TW,SejnowskiTJ. lmaging brain dynamics using independent compo-nent analysis. Proc IEEE 2001; 89: 1107-1122.
35. Lang W,Starr A, Lang V,Lindinger G, Deecke L. CorticalDC potential shifts accompanying auditory and visualshort-term memory. Electroencephalogr Clin Neuro-physiol 1992;82: 285-295.
36. Lickey ME. Localization and habituation of sensoryevoked DC responses in cat cortex. Exp Neurol 1966; 15:437-454.
37. Lopes da Silva F H. Pattern recognition and automaticEEG analysis. Trends Neurosci 1981;4: 272-297.
38. Lopes da Silva F H, van Rotterdam A, Barts P, VanHeusden E, Burr W.Models of neuronal populations: thebasic mechanisms of rhythmicity. Prog Brain Res 1976;45:281-308.
39. O'Leary JL, Goldring S. D-C potentials of the brain.Physiol Rev 1964;44: 91-125.
40. Prechtl JC, Cohen LB, Pesaran B, Mitra PP, Kleinfeld D.Visual stimuli induce waves of electrical activity in turtlecortex. Proc Natl Acad Sci USA1997;94: 7621-7626.
41. Prechtl JC, von der Emde G, Wolfart J, Karamürsel S,Akoev GN,Andrianov YN,Bullock TH. Sensory processingin the pallium of a mormyrid fish. J Neurosci 1998; 18:7381-7393.
42. Rowland V. Steady potential phenomena of cortex. In:Quarton GC, Melnechuk T, Schmitt FO, (eds). The Neuro-sciences: a Study Program. New York: The RockefellerUniv Press; 1967:482-495.
43. Rowland V. Cortical steady potential (direct currentpotential) in reinforcement and learning. In: Stellar E,Sprague J, (eds). Progress in Physiological Psychology.NewYork:Academic Press; 1968: 1-70.
44. Schütt A, Başar E, Bullock TH. Power spectra of ongoingactivity of the snail brain can discriminate odorants.Comp Biochem Physiol A 1999a; 123:95-110.
45. Schütt A, Bullock TH, Başar E. Dynamics of potentialsfrom invertebrate brains. In: Başar E, (ed). BrainFunctions and Oscillations. Li: IntegrativeBrain Function.Neurophysiology and Cognitive Processes. Berlin:Springer; 1999b:91-ıo8.
46. Speckmann E-J, EIger CE. Introduction to the neurophys-iological basis of the EEG and DC potentials. In:Niedermeyer E, Lopes da Silva F, (eds). Electroenceph-alography: Basic Principles, Clinical Applications andRelated Fields. Baltimore-Munich: Urban & Schwarzen-berg; 1987: 1-13.
(
13
Neuropsychology of P3a and P3b:A Theoretical Overview
John Polich, The Scripps Research Institute, La Jolla, California, USA
ABSTRACTThis chapter outlines the cognitive theory and neu-
ropsychological origins of the P300 event-related brainpotential (ERP) by reviewing the basis for the distinc-tion between the P3a and P3b subcomponents. Themethodological and empirical foundations underlyingthese ERPs are sketched, with candidate neurophysio-logical generator mechanisms proffered. These struc-tures are used to articulate a theoretical perspective thatspecifies the interaction between P3a and P3b in terms offrontal attention with working memory processes andsubsequent attentional resource allocation during tem-poralJparietal memory storage operations. The neuro-electric basis for these effects is then outlined. Finally,practical guidelines for recording P300 in elinical set-tings are presented, with a viewtoward defining standardparadigms that can be developed for evaluating the neu-rocognitive efficiency of individual subjects.NEUROPSYCHOLOGYOF P3AAND P3B:ATHEORETICALOVERVIEW
The P300 event-related brain potential (ERP) hasdemonstrated considerable utility in the study ofnormalcognitive function as well as forassessingavarietyofmen-tal disorders. Despite the plethora ofERP studies on thesetopics, the usefulness of P300 (or "P3b" as deseribedbelow) as an assessment tool has been limited in partbecause itsneural generators are as yet ill defined so thatformulation of a comprehensive theoretical perspectivehas been limited. However,recent empirical advances onthe relationship between the P3aand P3b ERPshave sug-gesteda plausible approach to howthese subcomponentsmaycontribute to overall P300 generation. The purpose ofthe present chapter is to outline the issues surroundingthese developments. The review is organized into severalsections: First, the empirical background of the P3a andP3b subcomponent distinction is sketched. Second, a the-oretical perspective ofP300 is presented. Third, the ne u-ropsychological basis for the P300 component is outlinedin terms of how these subcomponents may be related.Fourth, the neuroelectric basis for P300 generation issummarized. The chapter concludes with suggestionsforelinical applications.P3aandP3b
The P300 was discovered over 35 years ago and hasprovided much fundamental information on the neural
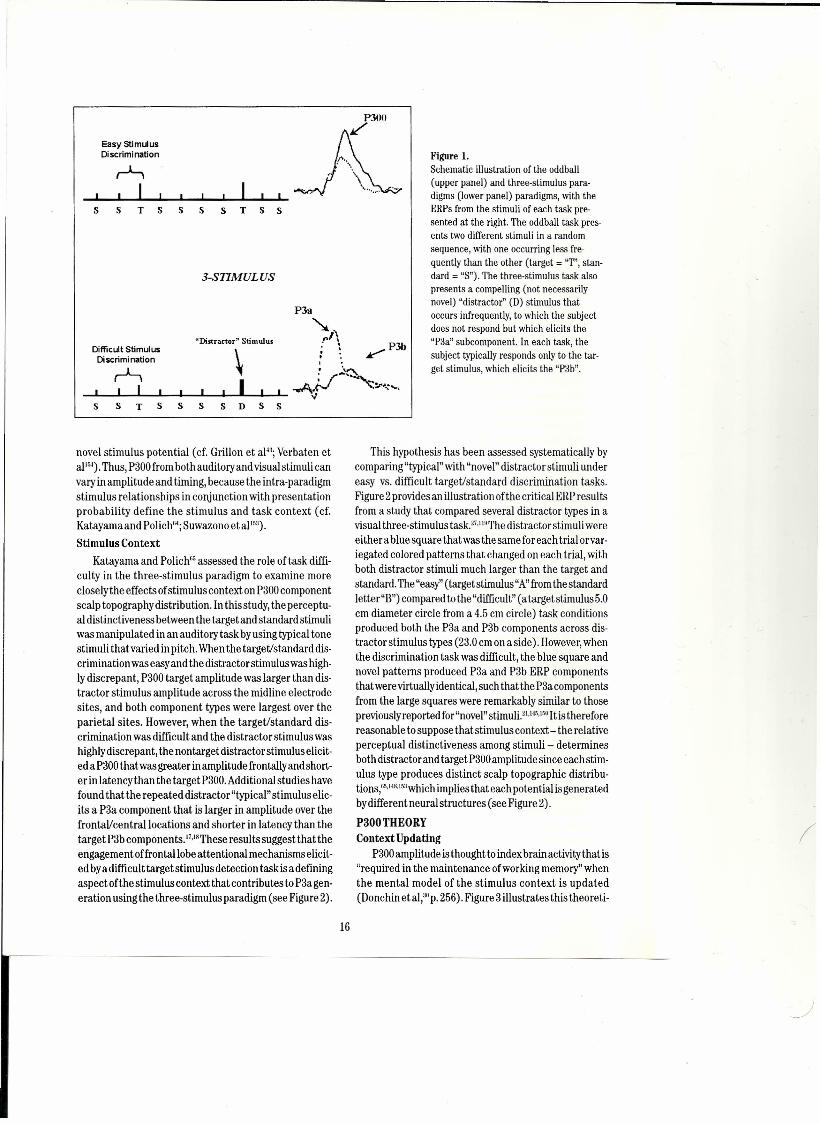
underpinningsofnormal and dysfunctional cognition. ".1'''This ERPcomponent is often elicited using the "oddball"paradigm, wherein two stimuli are presented in a ran-dom order, with one occurring more frequently than theother. Figure 1 illustrates this task situation in the upperpaneL.The subject is required to discriminate an infre-quent target stimulus from the frequent standard stimu-lus by responding covertly or overtly to the target-typi-callya relatively easy discrimination. "".1iK The target elic-its the P300, which is not apparent in the ERP from thestandard stimulus.
The "three-stimulus" paradigm isa modification oftheoddball task inwhich "distractor" stimuli are inserted intothe sequence of target and standard stimuli. Figure 1schematically illustrates the task situation in the lowerpaneL.When "novel" stimuli (e.g., dog barks, color forms,etc.) are presented as distractors in the series of more"typical" targetand standard stimuli (e.g., tones, Ietters ofthe alphabet, etc.), aP300 component that is large overthefrontalJcentral areas can be produced with auditory, visu-al, and somatosensory stimuli,"·14.Iı;1This "novelty"P300issometimes called the "P3a,""·ı,,nand with recentanalysesconfirmingthat these twopotentialsare thesame compo-nent (cf. Simons et al'"; Spencer et al'"). The parietalmaximum P300 from the target stimulus is sometimescalled the "P3b."Asthe P3a exhibits an anteriorscalp dis-tribution, relativelyshort peaklatency, and rapidly habit-uates, it is thought to reflect frontallobe Iuncuon'"" andcan be elicited in avarietyofpopulations.t-"'!"
In another variant of the three-stimulus paradigm,infrequent-nontarget "typical" visual stimuli (i.e., notnovel) that are easily recognized (i.e., not novel) havebeen found to elicita P300with maximum amplitude overthe centraIJparietal rather than frontalJcentral areas."?"This component is sometimes referred to as a "no-go"P300, because subjects do not respond to the infrequentnontargets."!" In the auditorymodality, infrequent non-target tone stimuli that are readily perceived (i.e., notnovel) inserted into the traditional oddball sequence alsoelicit a centraIJparietal maximum P300 (cr. Katayamaand Polich'"; Pfefferbaum and Ford!"), When both aninfrequentnontarget tone and a novel sound are present-ed, the novel stimuli elicit a central maximum P300 andthe infrequent nontarget tone elicits a centraIJparietalP300, the amplitude ofwhich is smailer than that of the
15
P3a~~,.1\. ,
OilTicult Stimulus \ • ,Oiscriminationr'-ı ~ ..:ır.."
i i --Aif ..~=---~....~~_IL-~~~~~~~~ __~~ ~S S T S s S D S S
Easy StimuusOiscrimination
r'-ıi
S S T S S S S T S S
3-S11MULUS
"Distraccor" Stimulus
S
novel stimulus potential (cr. Grillon et al"; Verbaten etal ır,,). Thus, P300from both auditory and visual stimuli canvaryin amplitude and timing, because the intra-paradigmstimulus relationships in conjunction with presentationprobability define the stimulus and task context (cf.Katayamaand Polich'"; Suwazono et al'").Stimulus Context
Katayama and Polich" assessed the role of task diffi-culty in the three-stimulus paradigm to examine moreeloselythe effeets ofstimulus eontext on P300componentscalp topographydistribution. In thisstudy, theperceptu-al distinctiveness between the target and standard stimuliwas manipulated in an auditery task by using typical tonestimuli thatvaried in pitch. When the target/standard dis-erimination was easy and the distraetor stimulus was high-Iydiserepant, P300 target amplitude was larger than dis-tractor stimulus amplitude across the midline electrodesites, and both eomponent types were large st over theparietal sites. However, when the target/standard dis-erimination was diffieult and the distraetor stimulus washighly discrepant, the nontarget distraetor stimulus elicit-ed a P300that was greater in amplitude frontally and short-er in Iateney than the target P300.Additional studies havefound that the repeated distraetor"typieal" stimuluselic-its a P3a eomponent that is larger in amplitude over thefrontal/cerıtral locations and shorter in lateney than thetarget P3b components.v=These resultssuggest that theengagement offrontallobe attentional mechanisms elicit-ed bya diffieult target stimulus deteetion task is a definingaspeet ofthe stimulus eontext that eontributes to P3agen-eration using the three-stimulus paradigm (see Figure 2).
/P3b
Figure ı.Schematic illustration of the oddball(upper panel) and three-stimulus para-digms (lower panel) paradigms, with theERPs from the stimuli of each task pre-sented at the right. The oddball task pres-ents two different stimuli in a randomsequence, with one occurring less fre-quently than the other (target = "T", stan-dard = "S"). The three-stimulus task alsopresents a compelling (not necessarilynovel) "distractor" (D) stimulus thatOCCUfS infrequently, to which the subjectdoes not respond but which elicits the"P3a" subcomponent. In each task, thesubject typically responds only to the tar-get stimulus, which elicits the "P3b".
This hypothesis has been assessed systematieally bycomparing "typical" with "novel"distraetor stimuli undereasy vs. diffieult target/standard diserimination tasks.Figure 2providesan illustration ofthe eritical ERPresultsfrom a study that compared several distraetor types in avisual tnree-stimulus task.t7•IIiIThedistractor stimuli wereeither a blue square that was the same foreaeh trial orvar-iegated eolored patterns that changed on eaeh trial, withboth distraetor stimuli much larger than the target andstandard. The "easy"(target stimulus "A"fromthe standardletter"B") eompared to the "difficult" (a target stimulus 5.0cm diameter eirele from a 4.5 cm eirele) task eonditionsprodueed both the P3a and P3b components across dis-traetor stimulus types (23.0 cm on a side). However,whenthe diserimination task was difficult, the blue square andnovel patterns produced P3a and P3b ERP componentsthat were virtuallyidentieal, such that the P3aeomponentsfrom the large squares were remarkably similar to thosepreviouslyreported for"novel"stimuli.21.145,150It is thereforereasonable to suppose thatstimulus eontext- the relativeperceptual distinctiveness among stimuli - determinesboth distraetor and target P300amplitude sinee eaeh stim-ulus type produees distinet sealp topographie distribu-tions,'·,,14"I~'whiehimplies that eaeh potential isgeneratedbydifferent neural struetures (see Figure 2).
P300THEORYContext Updating
P300amplitude is thought to index brain aetivity that is"required in the maintenance ofworking memory" whenthe mental model of the stimulus context is updated(Donehin et al,""p.256). Figure 3 illustrates this theoreti-
16
EASY TASK
BWESQUARES NOVEL PATTERNS
TARGETDISTRACTORSTANDARD
DIFFICULT TASK
BWESOUARES NOVEL PATTERNS
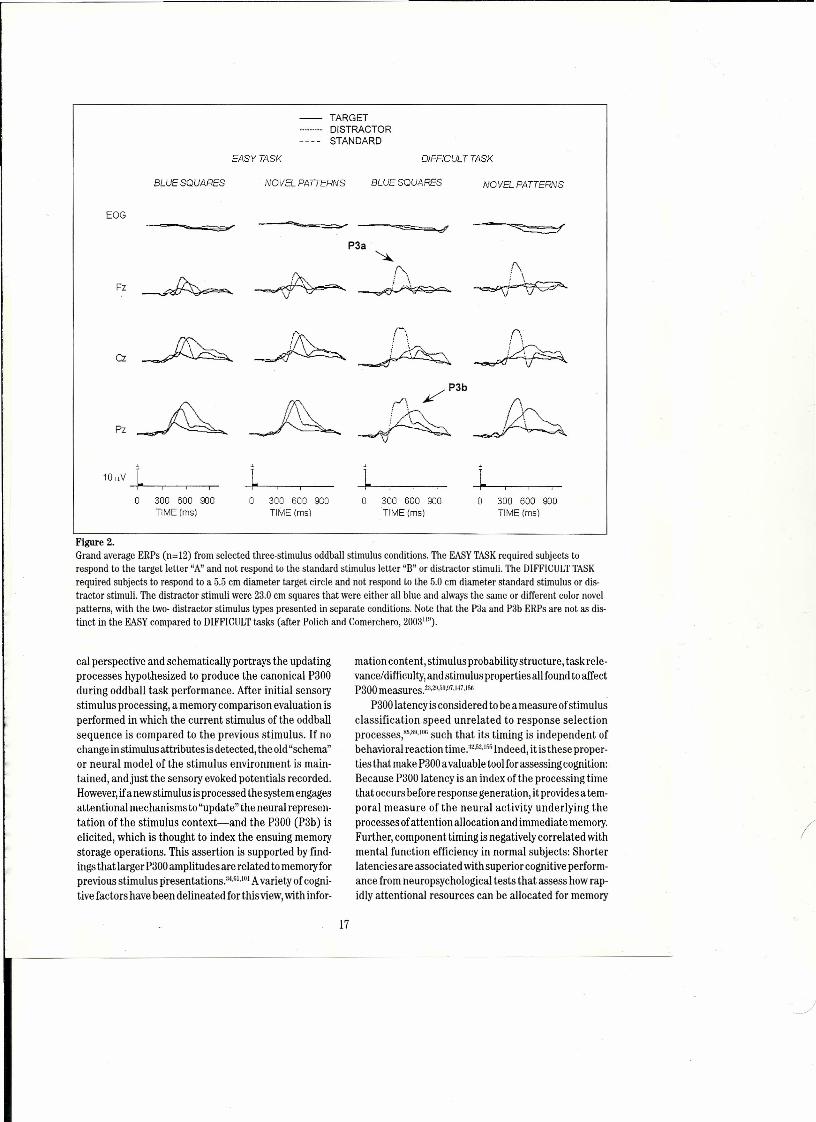
Figure 2.Grand average ERPs (n=12) from selected three-stimulus oddball stimulus conditions. The EASYTASKrequired subjects torespond to the target Ietter "A" and not respond to the standard stimulus Ietter "B" or distractor stimuli. The DIFFICULTTASKrequired subjects to respond to a 5.5 cm diameter target circle and not respond to the 5.0 cm diameter standard stimulus or dis-tractor stimuli. The distractor stimuli were 23.0 cm squares that were either all blue and always the same or different color novelpatterns, with the two- distractor stimulus types presented in separate conditions. Note that the P3a and P3b ERPs are not as dis-tinct in the EASYcompared to DIFFICULTtasks (after Polich and Comerchero, 2003"11
).
EOG ----P7=>- ---=="=-""'=..#P3a
FZ~
~ r-.~ i \
~~
/\, \
~
cı
"10 ıN J'---r--.---,-
O 300 600 900TIME (msı
O 300 600 900TIME (msı
cal perspective and schematically portrays the updatingprocesses hypothesized to produce the canonical P300during oddball task performance. After initial sensorystimulus processing, a memory comparison evaluation isperformed in which the current stimulus of the oddballsequence is compared to the previous stimulus, if nochange in stimulus attributes is detected, the old"schema''or neural model of the stimulus environment is main-tained, andjust the sensory evoked potentials recorded.However,ifa new stimulus isprocessed the system engagesattentional mechanisms to "update" the neural represen-tation of the stimulus context-and the P300 (P3b) iselicited, which is thought to index the ensuing memorystorage operations. This assertion is supported by find-ings that largerP300 amplitudes are related to memory forprevious stimulus presentations.t''"!" Avariety of cogni-tive factors have been delineated forthis view,with irıfor-
n~
O 300 600 900TIME (msı
O 300 600 900TIME (msı
mation content, stimulus probability structure, task rele-vance/difficulty, and stimulus properties all Iound to affectP300 measures. ı:ı.2!):>!),!)7,1~7,""
P300 lateney is considered to be a measure ofstimulusclassification speed unrelated to response sel ec tionprocesses,&"'""II"such that its timing is independent ofbehavioral reaction time.:'/·52,'!;!;Indeed, it is these proper-ties that make P300avaluable tool for assessing cognition..Because P300 lateney is an index of the processing timethat occurs before response generation, it providesa tem-poral measure of the neural activity underlying theprocesses ofattention allocation and immediate memory.Further, component timing is negatively correlated withmental function efficiency in normal subjects: Shorterlatencies are associated with superior cognitive perform-ance from neuropsychological tests that assess how rap-idly attentional resources can be allocated for memory
17

MEMORY COMPARISION NEURAl MODEL
11\2
N2N1
Figure 3.Schematic iIlustration of the context-updat-ing model for P300 theory, Stimuli enter theprocessing system and a memoıy comparisonprocess is engaged that ascertains whetherthe current stimulus is either the same asthe previous stimulus or not (i.e., a standardor a target stimulus in the oddball task). Ifthe incoming stimulus is the same, the neu-ral model or schema of the stimulus environ-ment is uneharıged and single signal averag-ing of the EEG reveals sensory evoked poterı-tials (NI, P2, N2). If the in com ing stimulusis not the same and the subject discrimi-nates the target from the preceding standardstimulus, the neural model of the stimulusenvironment is changed or "updated," suchthat a P3(OO) potential is generated in addi-tion to the sensoıy evoked potentials.
ST1MULUSIN PUT
P3
: :-!'·'·'·'·'·'i, ,,~,: CAPACITY :
• Information {• Stimulus Timing· Individual Differences• Bio/ogical Factors
r-----'
~~
P300 AMPLlTVDElLA TENCY
Figure 4.Schematic illustration of the resouree allocation model forP300 theory. Arousal governs the amount of processing capaci-ty that can be allocated as atterıtional resources to a giventask. The attention allocation governe P300 amplitude andlateney in a manner that can help account for cognitive andbiologieal variables that alIect ERPs (arter Kahneman, 1973'~),
processing (e.g.",,51·1t:ı.I~I.ıt",ı411,ır,I).This association is alsofound in elinical studies that indicate P300 latencyincreases as mental capability is compromised bydementing illness (e.g,"",!I",12i,12!1,I:'4).AttentionalResourceAllocation
As the P300 is derived from neural activity, it is nec-essarily affected by the physical state ofits underlyingphysiology that can be subsumed under the rubric of
arousal in two ways: (1) a general arousing effect and(2) a specific or idiosyncratic effect that contributes toa complex pattern of activation that modulates infor-mation processing."'!" Figure 4 illustrates a theoreticalmodel of how arousal affects P300 measures (cf. Kah-nernan'"; Kok"), Arousal's tonic changes usually involvetime periods on the order of minutes or hours and aremanifestations of relatively slow fluetuations in thegeneral or non-specifie baekground arousal state oftheindividual, whereas phasic responses reflect the organ-ism's energetie reaction to specific stimulus events, Inthis framework, tonic and phasie arousal effects origi-nate from situational or spontaneous faetors and affectthe cogrıitive operations of attention and memoryupdating - i.e., the same proeesses hypothesized tounderlie P300 gerıeration.!"
Dual-task effects also support the effects ofbiologicalinfluenees on P300, Performanee ofasecondary eognitive(but not motor) taskwhile exeeuting the primary typicalauditory or visual oddball paradigrn will deerease orincrease P300amplitude in direct proportion to the atten-tional resourees alloeated to the seeondary task(e.g." .•"ır,,).Hence, for any tasksituation in which arousalis hypothesized to be operating, attentional resourcesare allocated such that P300amplitude is altered relativeto a non-arousal state." As suggested by Figure 4, bothP300 amplitude and latency from a given task situationwill reflect how the processing system provides generalattentional resources in the evaiuation ofineoming stim-uli. This theoretical interpretation is eonsonant with thecontext-updating viewofP300 generation but additicnal-Iyspecifies a more general explanatorymechanism for thecognitive variables that affect this ERP eomponent (cf.Donchin et al"; Hillyard and Pictorr"; Johnson"; j Picton ""j
Pritehard ,:ıi).
18
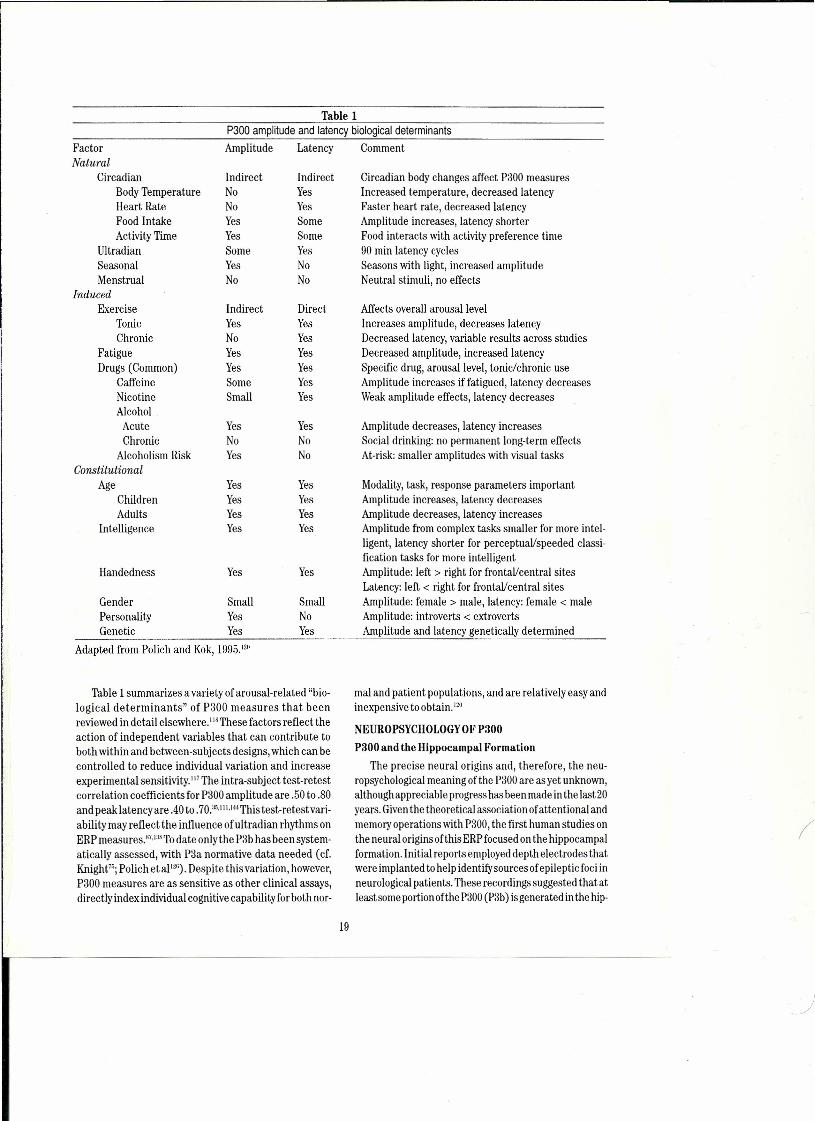
Table ıP300 amplitude and Iateney biologiealdeterminants
FactorNatural
CircadianBody TemperatureHeart RateFood IntakeActivity Time
UltradianSeasonalMenstrual
InducedExercise
TonicChronie
FatigueDrugs (Common)
CaffeineNicotineAJeohol
AeuteChronic
AJcoholism RiskConstitutional
AgeChildrenAdults
Intelligence
Handedness
Amplitude Latency Comment
Indirect IndirectNo YesNo YesYes SomeYes SomeSome YesYes NoNo No
Indirect DirectYes YesNo YesYes YesYes YesSome YesSmail Yes
Yes YesNo NoYes No
Yes YesYes YesYes YesYes Yes
Yes Yes
Gender SmailPersonality YesGenetic Yes
SmailNoYes
Adapted from Polieh and Kok, 1995.120
Table 1summarizes a variety of arousal-related "bio-logical determinants" of P300 measures that beenreviewed in detai! elsewhere. i LS These faetors refleet theaetion of independent variables that can contribute toboth within and between-subjects designs, whieh can becontrolled to reduee individual variation and increaseexperimental sensitivity,'" The intra-subjeet test-re testeorrelation coefficients for P300 amplitude are .50 to .80and peak lateneyare .40 to .70.:<1·1)).144This test-retestvari-ability may refleet the influenee ofultradian rhythms onERPmeasures.'7.1:"'Todate onlythe P3b has beensystem-atically assessed, with P3a normative data needed (ef.Knight"; Polieh et al 12H). Despite this variation, however,P300 measures are as sensitiye as other elinical assays,direetly index individual eognitive capability for both nor-
Circadian body changes affeet P300 measuresInereased temperature, deereased IateneyFaster heart rate, deereased lateneyAmplitude increases, Iateney shorterFood interacts with aetivity preferenee time90 min lateney cyc\esSeasons with light, increased amplitudeNeutral stimuli, no effects
Affeets overall arousal levelInereases amplitude, deereases IateneyDeereased Iateney, variable results across studiesDeereased amplitude, inereased lateneySpeeifie drug, arousal level, tonie/ehronic useAmplitude inereases if fatigued, Iateney decreasesWeak amplitude effects, Iateney deereases
Amplitude deereases, lateney inereasesSocial drinking: no permanent long-term effeetsAt-risk: smailer amplitudes with visual tasks
Modality, task, response parameters importantAmplitude increases, Iateney decreasesAmplitude deereases, Iateney inereasesAmplitude from eomplex tasks smailer for more intel-ligent, Iateney shorter for pereeptuaVspeeded elassi-fieation tasks for more intelligentArnplitude: left > right for frontal/central sitesLateney: left < right for frontal/central sitesAmplitude: female > male, Iateney: female < maleAmplitude: introverts < extrovertsAmplitude and Iateney genetieally determined
mal and patient populations, and are relatively easy andinexpensive to obtain. 120
NEUROPSYCHOLOGYOF P300P300 and the Hippocampal Formation
The precise neural origins and, therefore, the neu-ropsyehologieal meaning ofthe P300 are as yet unknown,althoughappreciable progress has been made in the last 20years. Giventhe theoretical association ofattentional andmemory operations with P300, the first human studies onthe neural origins afthis ERPfocused on the hippocampalformation. Initial reports employed depth eleetrodes thatwere implanted to help identifysourees ofepileptie foci inneurologieal patients. These recordings suggested that atleastsome portion ofthe P300(P3b) isgenerated in the hip-
19

AUDITORY VISUAL
~~1L • s +r s sj j j j, .. , •• ~v.L •• ••
o :ıoo 600 o 300 600 o :ıoo 600 o 300 600 o 300 600 o 300 600
Laleney (msı Laleney (msı
Figure 5.Grand averaged auditory and visual oddball ERPs from normal eontrols (n=20) and bilateral hippoeampallesion amnesic patients(nefi). No statistieally reliable differences were obtained for either P300 amplitude or Iateney between the eontrols and patients(after Polich and Squire, 1993124).
I• AM •• SlC. io CONTROlS
AOOrrORY VISUAL
task recorded from normal matched controls and patientswith bilateral hippocampallesions. Although generalmorphological differences were observed, no statisticallyreliable P300 amplitude or lateney group effects werefound. 12' Figure 6illustrates additional observationsfroma subset of the se patients and controls from the samestudywhose MRIhippocampal size measures were avail-able. P300amplitude from each modality is positivelycor-related with the proportional size of the hippocampal for-mation relative to the temporallobe size from MRImeas-ures and suggests that larger hippocampal size is associ-ated with larger P300 amplitudes. Furthermore, otherstudies oflesion patients have found that the integrity ofthe temporal-parietallobejunction is involvedwith eithertransmission or generation processes subsequent to hip-pocampal activity and contributes to component record-ings at the scalp (cf. Johnson"; Knight et al'"; Yamaguchiand Knight'"; Yerlegeret al'"). Taken together, these find-ings suggest that although relative absence of the hip-pocampus does not eliminate the P300, its presenceand/or connection with temporal-parietallobe functiondoes influence P300generation.P3a NeuraI Substrates
Asoutlined above, the P3asubcomponent is producedwhen the attentional focus required for the primary dis-erimination task is interrupted byan infrequent nontargetstimulus event, which does not have to be perceptuallynoveL.IN,I 19 ERPstudies on humans with frontallobe lesionshave demonstrated that P3a requires frontallobe func-
F/"" . o F~/:.7·.:~:ı 00 :I. o
~. •• : 4 •. .0.00 0.25 0.50 0.7$ 1.00 0.00 0.25 O.SO 0.1S 1.00
HIPPOCAMPlJS HIPPOCAMPU$
Figure 6.Scattergrams of P300 amplitude from the auditory and visualERP tasks plotted against relative hippoeampus size (asassessed through MRImeasures) from a subset of eontrolsand bilateral hippoeampal Iesion amnesic patients for whomthe brain area measures were available (previously unpub-lished from Polieh and Squire, 1993124).
pocampal areas ofthe medial temporal lobe.v'" However,subsequent investigations using scalp recordings on indi-viduals after temporal lobectomy'v" experimental exci-sions in monkeys, lOO,I~J and patients with severe medial tem-porallobe damage"!" found that the hippocampal forma-tion does not contribute directly to the generstion ofP300.1l5
Figure 5providesan example ofthese effects and illus-trates ERPs from auditory and visual stimuli in an oddball
20
DTARGET• NOVEL
CONTROL. FRONTAL.
Fı Ci P,
ELeCTRODE
'* Cı Pı
ELECTRODE
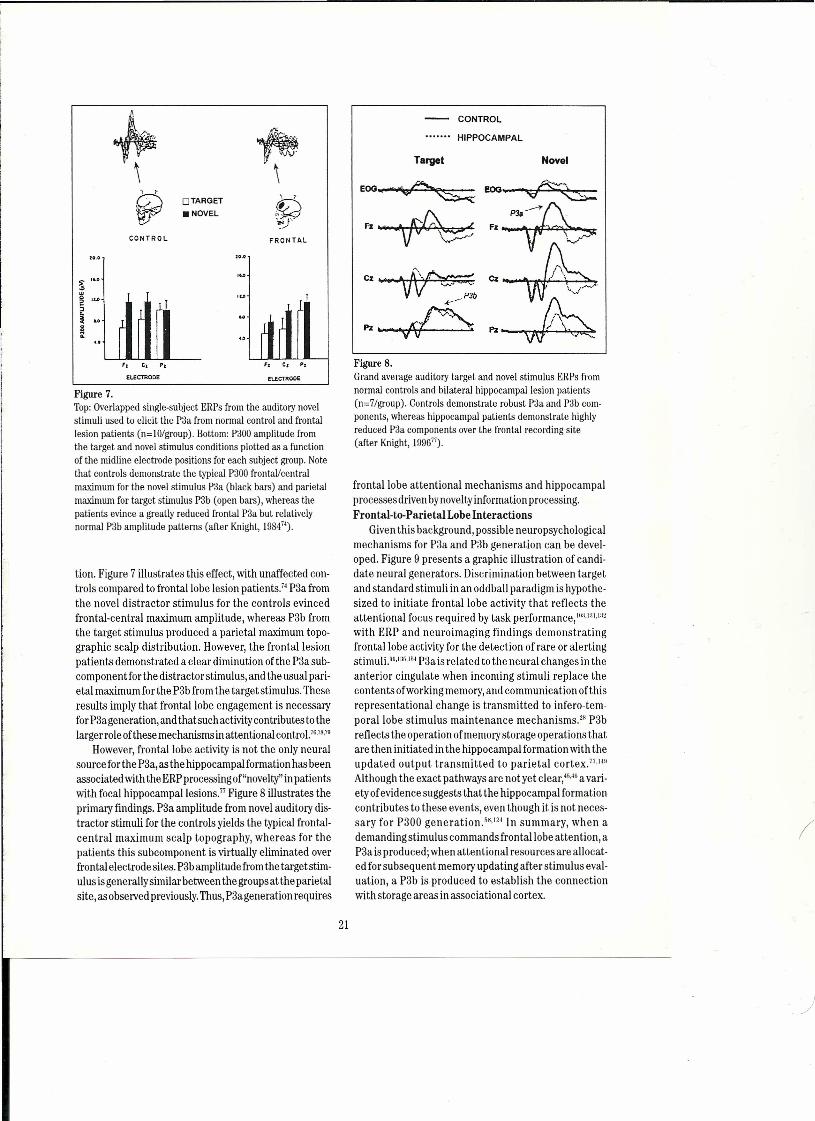
Figure 7.Top: Overlapped single-subject ERPs from the auditory novelstimuli used to elicit the P3a from normal control and frontallesion patients (ne lü/group). Bottorn: P300 amplitude fromthe target and novel stirnulus conditions plotted as a functionof the midline electrode positions for each subject group. Notethat control s demonstrate the typical P300 frontal/centralmaximum for the novel stimulus P3a (black bars) and parietalmaximum for target stimulus P3b (open bars), whereas thepatients evince a greatly reduced frontal P3a but relativelynormal P3b amplitude patterns (after Knight, 1984").
tion. Figure 7 illustrates this effect, with unaffected con-trols compared to frontallobe lesion patients." P3a fromthe novel distractor stimulus for the control s evincedfrontal-central maximum amplitude, whereas P3b fromthe target stimulus produced a parietal maximum top0-
graphic scalp distribution. However, the frontallesionpatients demonstrated a elear diminution of the P3a sub-componentforthe distractor stimulus, and the usual pari-etal maximum for the P3b from the target stimulus. Theseresults imply that frontallobe engagement is necessaryforP3a generation, and thatsuch activitycontributes to thelarger role ofthese mechanisms inattentional contro!.1·,ı8,7ll
However, frontallobe activity is not the only neuralsourceforthe P3a, as the hippocampalformation has beenassociated with the ERPprocessing or'noveltv" inpatientswith focal hippocampal lesions." Figure 8 illustrates theprimary findings, P3a amplitude from novel auditory dis-tractor stimuli for the controls yields the typical frontaI-central maximum scalp topography, whereas for thepatients this subcomponent is virtually eliminated overfrontal electrodesites. P3b amplitude from the targetstim-ulus isgenerally similar between the groups at the parietalsite, as observed previously.Thus, P3a generation requires
CONTROL
HIPPOCAMPAL
Target Novel
EOG ••
Fz t~
cz ..• ~~s--: P3b
Pz,.-j(~ VVPigure 8.Grand average auditery target and novel stimulus ERPs fromnormal control s and bilateral hippocampal lesion patients(n=7/group). Controls demonstrate robust P3a and P3b com-ponents, whereas hippocampal patients demonstrate highlyreduced P3a components over the frontal recording site(arter Krıight, 199677).
frontallobe attentional mechanisms and hippocampalprocesses driven bynovelty information processing.Frontal-to-Parietal Lobe Interactions
Given this background, possible neuropsychologicalmechanisms for P3a and P3b generation can be devel-oped. Figure 9 presents a graphic illustration of candi-date neural generatorso Discrimination between targetand standard stimuli in an oddball paradigm is hypothe-sized to initiate frontallobe activity that reflects theattentional focus required by task performance, ",:ı,ı:ıı,ı:ıı
with ERP and neuroirnaging findings demonstratingfrontallobe activity for the detection of rare or alertingstimuli."!"!" P3ais related to the neural changes in theanterior cingulate when incorning stimuli replace thecontentsofworking memory, and communication of thisrepresentational change is transmitted to infero-tem-porallobe st imulus maintenance rnechanisms." P3breflects the operation ofmemory storage operations thatare then initiated in the hippocampal formation with theupdated output transmitted to parietal cortex."!"Although the exact pathways are not yet clear,4r,-,,;a vari-ety ofevidence suggests that the hippocampal formationcontributes to these events, even though it is not neces-sary for P300 generation.v!" In summary, when ademanding stimulus commandsfrontallobe attention, aP3a isproduced; when attentional resources are allocat-ed for subsequent memory updating after stimulus eval-uation, a P3b is produced to establish the connectionwith storage areas in associational cortex.
(
21
•
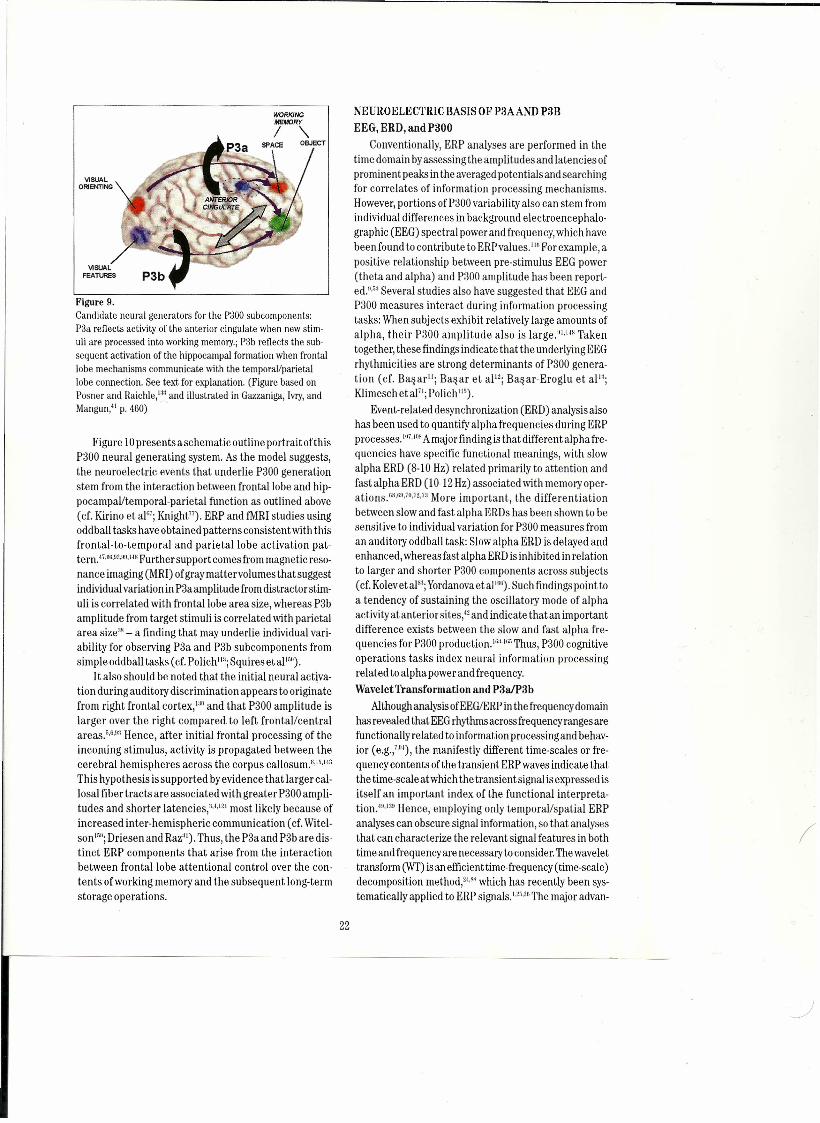
Figure 9.Candidate neural generators for the P300 subcomponents:P3a reflects activity of the arıterior cingulate when new stim-uli are processed into working rneruory.; P3b reflects the sub-sequent activation of the hippocampal formation when frontallobe mechanisms communicate with the temporal/parietallobe connection. See text for explanation. (Figure based onPosner and Raichle,':" and illustrated in Gazzaniga, lvry, andMangun," p. 460)
Figure ıo presents aschematic outline portrait of thisP300 neural generating system. As the model suggests,the neuroelectric events that underlie P300 generationstern from the interaction between frontallobe and hip-pocampal/ternporal-parietal functionas outlined above(cr. Kirino et al"; Knight"). ERP and fMRI studies usingoddball tasks have obtained patterns consistentwith thisfrontal-to-temporal and parietallobe activation pat-tern. H.ı;ı;,!l2,'HI,ljHFurther support comes from magnetic reso-nan ce imaging (MRI) of graymattervolumes thatsuggestindividual variation in P3aamplitude from distractor stim-uli is correlated with frontallobe area size, whereas P3bamplitude from target stimuli is correlated with parietalarea size" - a finding that may underlie individual vari-ability for observing P3a and P3b subcomponents fromsimple oddball tasks (cf. Polich'!'; Squires et al!").
It alsa should be noted that the initial ne ural activa-tion during auditory discrimination appears to originatefrom right frontal cortex,':" and that P300 amplitude islarger over the right compared. to left frontal/centralareas."-"·":' Hence, after initial frontal processing of theincoming stimulus, activity is propagated between thecerebral hemispheres across the corpus callosum.v"!"This hypothesis is supported by evidence that larger cal-losal fiber tracts are associated with greater P300 ampli-tudes and shorter latencies.v!" most likely because ofincreased inter-hemispheric communication (cf. Witel-son ''''; Driesen and Raz:II), Thus, the P3aand P3b are dis-tinct ERP components that arise from the interactionbetween frontal lobe attentional controlover the con-tents of working memory and the subsequent long-termstorage operations,
NEUROELECTRIC BASIS OF P3AAND P3BEEG, ERD, and P300
Conventionally, ERP analyses are performed in thetime domain by assessing the amplitudes and Iate nci es ofprominent peaks in the averaged potentials and searchingfor correlates of information processing mechanisms,However, portions of P300 variability alsa can stern fromindividual differences in background electroencephalo-graphic (EEG) spectral power and frequency, which havebeen found to contribute to ERPvalues.III' Forexample, apositive relationship between pre-stimulus EEG power(theta and alpha) and P300 amplitude has been report-ed."l':' Several studies alsa have suggested that EEG andP300 measures interact during information processingtasks: When subjects exhibit relatively large amounts ofalpha, their P300 amplitude alsa is large.":" Takentogether, these findings indicate that the underlying EEGrhythmicities are strorıg determinants of P300 geneta-tion (cf. Başar"; Başar et aP2; Başar-Eroglu et al";Klimesch eta!"; Polich'").
Event-related desynchronization (ERD) analysis alsahas been used to quantify alpha frequencies during ERPprocesses. 1117.111'A major finding is that different alpha fre-quencies have specific functiona! meanings, with slowalpha ERD (8- LO Hz) related primarily to attention andfastalphaERO (10-12 Hz) associated with memoryoper-ations,,·<,Ii!l,i1ı,72,7:'More important, the differentiationbetween slow and fast alpha ER Os has been shown to besensitiye to individual variation for P300 measures froman auditory oddball task: Slow alpha ERD is delayed andenhanced, whereas fast alpha ERO is inhibited in relationto larger and shorter P300 components across subjects(cr. Kolev et al'"; Yordanova etal'"). Such findings point toa tendeney of sustaining the oscillatory mode of alphaactivityat anterior sites," and indicate thatan importantdifference exists between the slow and fast alpha fre-quencies for P300 production.!'"!" Thus, P300 cognitiveoperations tasks index neural information processingrelated to alpha power and frequency,Wavelet Transformation and P3a/P3b
Althoughanalysis ofEEGIERP in thefrequencydomaifıhas revealed that EEG rhythms across frequencyranges arefunctionallyrelated to information processingand behav-ior (e,g}'''), the manifestly different time-scales or fre-quency contents of the transient ERP waves indicate thatthe time-scale atwhich the transientsignal is expressed isitself an important index of the functional interpreta-tion."'!" Hence, employing only temporal/spatial ERPanalyses can obscure signal information, so that analysesthat can characterize the relevant signal features in bothtime and frequencyare necessaıyto consider, The wavelettransform (WT) isan efficient time-frequency (time-scale)decomposition method.v" which has recently been sys-tematically applied to ERP signals. 1,2r,,21iThe major advan-
22
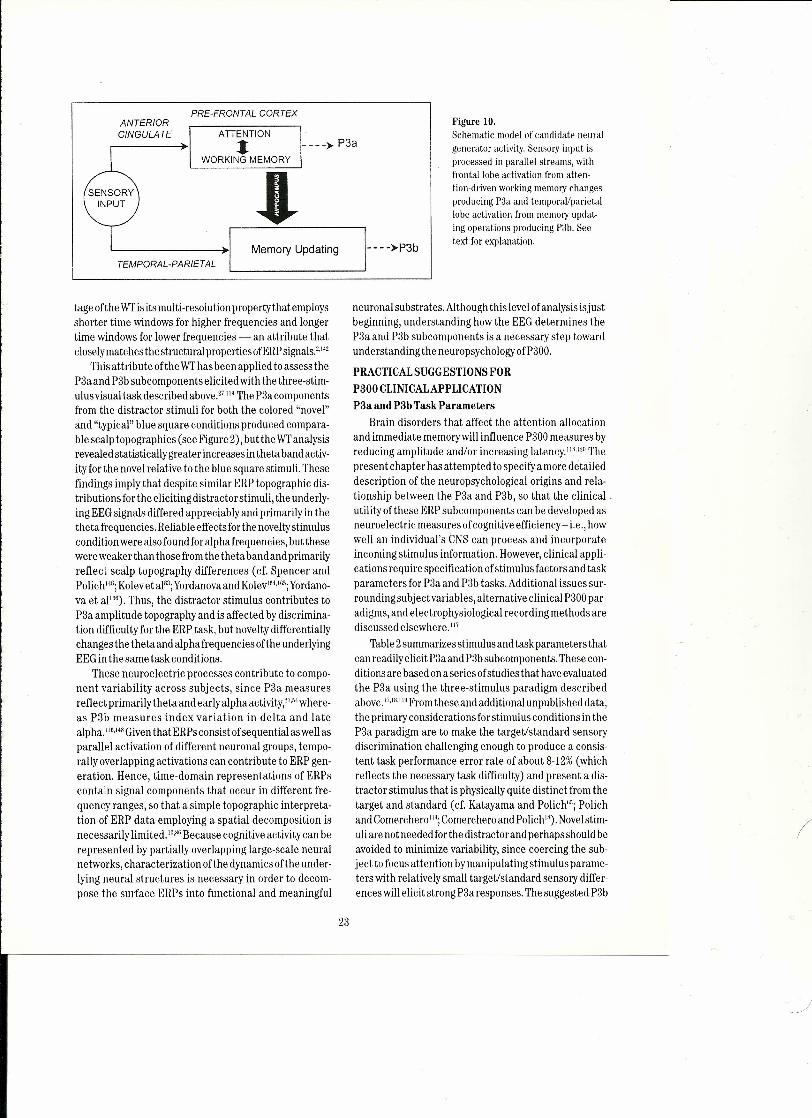
PRE-FRONTAL CORTEXANTERIOR Figure 10.CING ULA TE ADENTION Schematic model of candidate neural
i • ____> P3agenetater activity, Sensory input is
WORKING MEMORY processed in parallel streanıs, with
•TEMPORAL-PARIET AL
Memory Updating ---->P3b
tage ofthe Wl'is its multi-resolution property that employsshorter time windows for higher frequencies and lerıgertime windows for lower frequencies - an attribute thatcloselymatches the structural properties ofERPsignals.2.142
This attribute ofthe wr has been applied to assess theP3a and P3b subcomponents elicited with the three-stim-ulusvisual taskdescribed above."!" The P3acomponentsfrom the distractor stimuli for both the colored "novel"and "typical" blue square conditions produced compara-ble scalp topographies (see Figure 2), but the wr analysisrevealed statisticallygreaterincreases in theta band activ-ity for the novel relative to the blue square stimuli. Thesefindings imply that despite similar ERP topographic dis-tributions for the eliciting distractor stimuli, the underly-ing EEGsignals differed appreciably and primarily in thethetafrequeneies. Reliable effectsfor the noveltystimuluscondition were alsa foundfor alphafrequencies, but thesewere weaker than those from the theta band and primarilyreflect scalp topography differences (cf, Spencer andPolich'"; Kolevet al"; Yordanovaand Kolev'<"; Yordano-va et al 11'''). Thus, the distractor stimulus contributes toP3a amplitude topography and is affected bydiscrimina-tion difficulty for the ERP task, but novelty differentiallychanges the thetaand alphafrequencies ofthe underlyingEEGin the same task conditions.
These neuroelectric processes contribute to compo-ne nt variability across subjects, since P3a measuresreflect primarily theta and earlyalpha activity,';,",where-as P3b measures index variation in delta and Iatealpha. i 11',14' GiventhatERPs consist ofsequential aswell asparallel activation of different neuronal groups, tempo-rally overlapping activations can contribute to ERP gen-eration, Hence, time-domain representations of ERPscontain signal components that occur in different fre-quency ranges, so that a simple topographic interpreta-tion of ERP data employing a spatial decomposition isnecessarily limited. I",," Because cognitive activity can berepresented by partially overlapping large-scale neuralnetworks, characterization ofthe dynamics ofthe under-lying neural structures is necessary in order to decom-pose the surface ERPs into functional and meaningful
frontal lobe activatiorı from atten-tiorı-driven working mernory changesproducing P3a and ternporal/parietallobe activation from memoıy updat-ing operations producing P3b. Seetext for explanation.
neuronal substrates. Although this levelofanalysis isjustbeginning, understanding how the EEGdetermines theP3a and P3b subcomponents is a necessary step towardunders tand ing the neuropsyehology ofP300.
PRACTICALSUGGESTIONSFORP300 CLINICALAPPLICATIONP3a and P3b Task Parameters
Brain disorders that affect the attention allocationand immediate memorywill influenee P300measures byreducing amplitude and/or increasing latency.' ",lı" Thepresent chapter has attempted to specifya more detaileddescription of the neuropsychological origins and rela-tionship between the P3a and P3b, so that the elinical -utility ofthese ERPsubcomponents can be developed asneuroelectric measures ofcognitive effieiency - Le" howwell an individual's CNS can process and incorporateineoruing stimulus information, However,elinical appli-cations require specification ofstimulusfactors and taskparameters for P3a and P3b tasks, Additional issues sur-roundingsubjectvariables, alternative elinical P300par-adigms, and electrophysiologieal reeording methods arediscussed elsewhere. 117
Table2summarizes stimulusand task parameters thatcan readily elieit P3aand P3bsubcomponents. These con-ditionsare based onaseriesofstudies that have evaluatedthe P3a using the three-stimulus paradigm deseribedabove.17,,,,II!I From these and additional unpublished data,the primary considerationsfor stimulus conditions in theP3a paradigm are to make the targetıstandard sensorydiscrimination challenging enough to produce a consis-tent task performance error rate of about 8-12%(whichreflects the necessary task difficulty) and present a dis-tractor stimulus that is physically quite distinct from thetarget and standard (cf. Katayama and Polich"; Polichand Comerchero'"; Comerchero and Polich"), Novelstim-uliare not neededfor the distractor and perhapsshould beavoided to minimize variability, since coereing the sub-ject to focus attention bymarıipulating stimulus parame-ters with relatively smail targetıstandard sensory differ-ences will elicit strong P3a responses. The suggested P3b
23
)
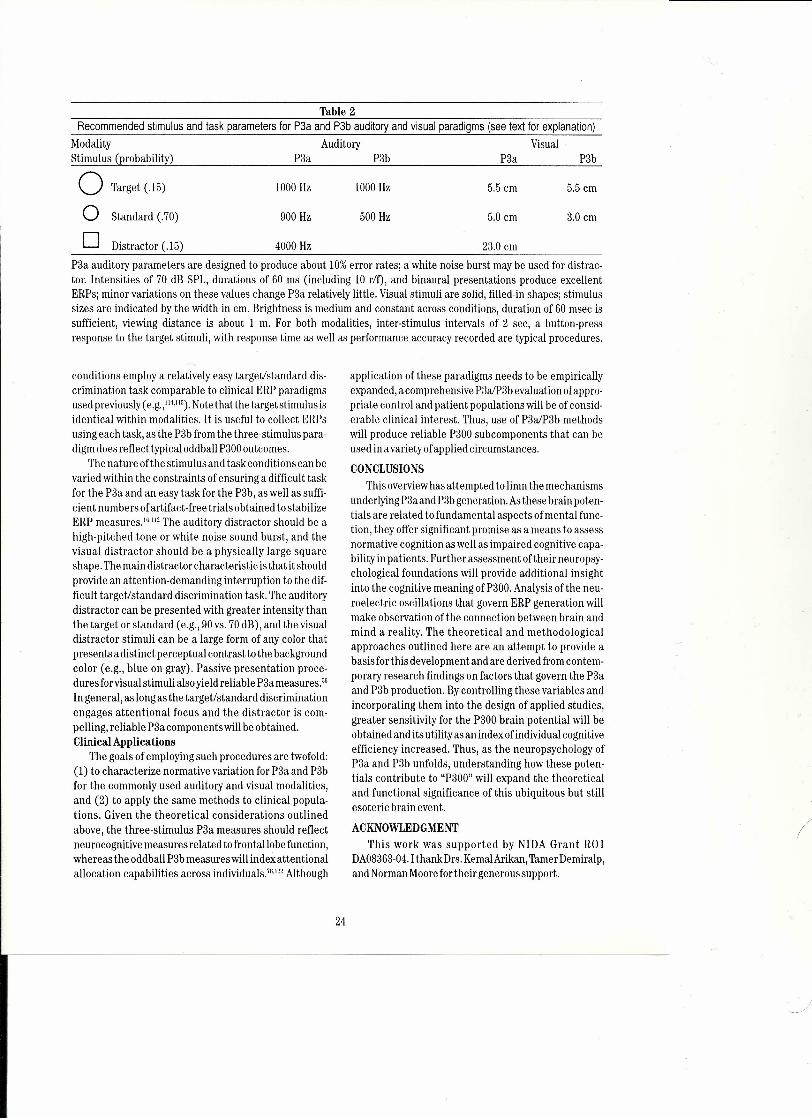
Table 2Recommended stimulus and task parameters for P3a and P3b auditory and visual paradigms (see text for explanation)
Modality Auditory VisualStimulus (probability) P3a P3b P3a P3bo Target (.15)
O Standard (.70)
D Distractor (.15) 4000 Hz 23.0 cm
1000 Hz
900 Hz
1000 Hz 5.5 cm 5.5 cm
500 Hz 5.0 cm 3.0 cm
P3a auditory parameters are designed to produce about 10% error tates; a white noise burst may be use d for distrac-tor. lntensities of 70 dB SPL, durations of 60 ms (including 10 rif), and binaural presentations produce excellentERPsj minor variations on these values change P3a relatively little. Visual stimuli are solid, filled-in shapes; stimulussizes are indicated by the width in cm. Brightness is medium and constant across conditions, duration of 60 msec issufficient, viewing distance is about 1 m. For both modalities, inter-stimulus intervals of 2 sec, a button-pressresponse to the target stimuli, with response time as well as performance accuracy recorded are typical procedures.
conditions employ a relatively easy targetıstandard dis-erimination task comparable to elinical ERP paradigmsused previously (e.g., 114.115). Note that the targetstimulus isidentical within modalities. it is useful to collect ERPsusing each task, as the P3b from the three-stimulus para-digrn does reflect typical oddball P300 outcomes.
The nature of the stimulus and task conditions can bevaried within the constraints of ensuring a difficult taskfor the P3a and an easy task for the P3b, as well as suffi-cient numbers of artifact-free trials obtained to stabilizeERP measures.!"!" The auditory distractor should be ahigh-pitched tone or white noise sound burst, and thevisual distractor should be a physically large squareshape. The main distractor characteristic is that it shouldprovide an attention-demanding interruption to the dif-ficult targetıstandard discrimination task. The auditorydistractor can be presented with greater intensity thanthe target or standard (e.g., 90 vs. 70 dB), and the visualdistractor stimuli can be a large form of any color thatpresentsadistinct perceptual contrast to the backgroundcolor (e.g., blue on gray), Passive presentation proce-dures forvisual stimuli alsa yield reliable P3a measures."In general, as long as the target/standard discriminationerıgages attentional focus and the distractor is com-pelling, reliable P3a components will be obtained.Clinical Applications
The goals of employing such procedures are twofold:(1) to characterize normative variation for P3a and P3bfor the commonly used auditory and visual modalities,and (2) to apply the same methods to elinical popula-tions. Given the theoretical considerations outlinedabove, the three-stimulus P3a measures should reflectneurocognitive measures related to frontallobe function,whereas the oddball P3b measures will index attentionalallocation capabilities across Individuals.t-'" A1though
application of the se paradigms needs to be empiricallyexpanded, acomprehensive P3a/P3b evaluation of appro-priate control and patient populations will be of consid-erable elinical interest. Thus, use of P3a1P3b methodswill produce reliable P300 subcomponents that can beused in a variety of applied circumstances.
CONCLUSIONSThis overview has attempted to limn the mechanisms
underlying P3aand P3b generatfon. As these brain poten-tials are related to fundamental aspects ofmental func-tion, they offer significant promise as a means to assessnormative cognition as well as impaired cognitive capa-bility in patients, Further assessment oftheir neuropsy-chological foundations will provide addi tion al insightinto the cognitive meaning ofP300, Analysis ofthe neu-roelectric oscillations that govern ERP generation willmake observation ofthe connection between brain andmind a reality, The theoretical and methodologicalapproaches outlined here are an attempt to provide abasis for this development and are derived from contem-porary research findings on factors that govern the P3aand P3b production. By controlling these variables andincorporating the m into the design of applied studies,greater sensitivity for the P300 brain potential will beobtained and its utility as an index ofindividual cognitiveefficiency increased. Thus, as the neuropsychology ofP3a and P3b unfolds, understanding how these poten-tials contribute to "P300" will expand the theoreticaland functional significance of this ubiquitous but stillesoteric brain event.
ACKNOWLEDGMENTThis work was supported by NIDA Grant RO 1
DA08363-04, I thank Drs. KemalArikan, Tamer Demiralp,and Norman Moore fortheir gene ro us support.
24
REFERENCES1. AdemogluA, Micheli-Tzanakou E, lstefanopulos Y.Analysisof
pattern reversal visual evoked potentials (PRVEP's) bysplinewavelets.IEEETransBiomed Engineer 1997;44:881·890.
2. Ademoglu A, Demiralp T,Yordanova J, Kolev V,Devrim M.Decomposition of event-related brain potentials into mul-ticomponents usingwavelet transform. ApplSignal Process1998;5: 142-151.
3. Alexander JE, PolichJ. P300differences between sinistralsand dextrals. Cogn Brain Res 1995;2: 277-282.
4. Alexander JE, Polich J. Handedness and P300from auditorystlmuli, Brain Cogn 1997;35: 259-270.
5. Alexander JE, Bauer LO,Kuperman S,RohrbaughJ, MorzorariS,et aL.Hemispheric differencesfor P300amplitude from anauditery oddball task. IntJ Psychophysiol1996; 21:189-196.
6. AlexanderJE, PorjeszB, Bauer LO,Kuperman S,Mozarati S,O'Connor SJ, et aL.P300 amplitude hemispheric asymme-tries from a visual discrimination task. Psychophysiol lüsô;32: 467-475.
7. AnokhinAP, LutzenbergerW, Birbaumer N.Spatiotemporalorganization of brain dynamics and intelligence: an EEGstudy in adolescents. IntJ Psychophysiol1999; 33: 259-273.
8. Barcelo F,Suwazono S, Knight RT.Prefrontal modulationofvisual processing in humans. Nature Neurosci 2000; 3:399-403.
9. Başar E, Schürmann M,Başar-Eroglu C,DemiralpT. Thetaand delta responses in cognitive everıt-related potentialparadigms and their possible psychophysiological corre-lates. In: Heinze HJ, MunteTF, Mangun GR,(eds). CognitiveElectrophysiology. Boston: Birkhauser, 1994:334-367.
10. Başar E, Demiralp T, Schürmann M, Başar-Eroglu C, Ade-moglu A. Oscillatory brain dynamics, wavelet analysis andcognition. Br Lang 1999;66: 146-183.
i1. Başar E. Brain Function and Oscillations.1. Brain Oscilla-tions. Principles and Approaches. Springer Series in Syner-geties. Berlin-Heidelberg-NewYork: Springer; 1998.
12. Başar E, Hari R, Lopes Da Silva FH, Schürmann M. Brainalphaactivity: new aspects and functional correlates. IntJPsychophysiol 1997;26: 353-368.
13. Başar-Eroglu C,Başar E, Demiralp T,Schürmann M.P300-response: possible psychophysiological correlates in deltaand theta frequency channels: a review. Int J Psycho-physiology 1992; 13: 161-179.
14. BashoreTR, van der Molen M.Discovery ofP300: a tribute.Biol Psychol1991; 32: 155-171.
15. Baudena P, Halgrerı E, Heit G, Clarke JM. Intracerebalpotentials to rare target and distractor auditory and visualstimuli. III. Frontalcortex. Electroencephalogr Clin Neuro-physiol1995;94:251-264.
16. CohenJ, PolichJ. On the number oftrials needed for P300.IntJ Psychophysiol1997; 25:249-255.
17. Comerchero MD,Polich J. P3a, perceptual distinctiveness,and stimulus modality. Cogn Br Res 1998;7:41-48.
18. Comerchero MD,PolichJ. P3aand P3b from typical audi to-ryand visual stimuli. Clin Neurophysiol1999; iLO: 24·30.
19. Courchesne E. Changes in P3 waves with event repetition:long-term effects on scalp distribution and amplitude. Elec-troencephalogrClin Neurophysiol1978; 45: 754·766.
20. Courchesne E, Courchesne RY,Hillyard SA.The effect ofstimulus deviation on P3waves to easily recognized stimuli.Neuropsychologia 1978;16: 189-199.
21. Courchesne E, Hillyard SA,Galambos R.Stimulus novelty,task relevance and the visual evoked potential in man. Elec-troencephalogrClinNeurophysiol1975; 39: 131-143.
22. Courchesne E, Kilman BA,Galambos R, Lincoln A.Autism:processing ofnovel auditory information assessed byevent-related brain potentials. Electroencephalogr Clin Neuro-physioI1984;59:238·248.
23. CovingtonJW,Polich J. P300,stimulus intensity, and modali-ty.ElectroencephalogrClinNeurophysiol1996; 100:579-584
24. Daubechies ı.The wavelet transform. time-frequency local-ization and signal arialysis. IEEE Trans on Inform Theory1990;36:961-1005.
25. Demiralp T, Ademoglu A, Schürmann M, Başar-Eroglu C,Başar E. Detection of P300 waves in single trials by thewavelet transform. Br Lang 1999a;66: 108-128.
26. Demiralp T,Yordanova J, KolevV,Ademoglu A, Devrim M.Time-frequency analysis of single-sweep event-relatedpotentials by means of Iast wavelet transform. Br Lang1999b;66: 129-145.
27. Demiralp T,Ademoglu A, Comerchero M, Polich J. WaveletanalysisofP3aand P3b. Br'Iopogr 2001;13:251-2G7.
28. Desimone R, Miller EK, Chelazzi L, Lueschow A. Multiplememory systems in the visual cortex. In: Gazzaniga MS,(ed). The Cognitive Neurosciences. Cambridge, Mass: MITPress; 1995:475-486.
29. Donchin E,Coles MGH.Is the P300componentamanifesta-tionofcontextupdating? BehavBrSci 1988;1i: 357-374.
30. Donchin E, Karis D, Bashore TR, Coles MGH,Gratton G.Cognitive psychophysiology and human information pro-cessing.ln: Coles MGH,Donchin E, Porges SW,(eds). Psy-chophysiology: Systems, Processes, and Applications. NewYork:The Guilford Press; 1986:244-267.
31. Driesen NR, Raz N. The influence of sex, age, and handed-ness of corpus callosum morphology: a meta-analysts. Psy-chobiology 1995;23: 240-247.
32. Duncan-Johnson CC. P300 lateney: a new metric of infor-mation processing. Psyehophysiology 1981;18:207-215.
33. Emmerson R,Dustman R,Shearer D,TurnerC. P300 lateneyand symbol digit eorrelations in aging. Experimental AgingRes 1990;15:151-159.
34. Fabiani M,Karis D,Donchin E. Effects ofmneumonie strat-egy manipulation in a von Restorff paradigm. Electroen-cepha!ogrClin Neurophysiol 1990;75:22-35.
35. Fabiani M, Gratton G, Karis D, Donchin E. The definition,identifieation, and reliability of measurement of the P300component of the event-related brain potential. In: AeklesPK,Jennings JR, ColesMGH,(eds). Advanees in Psychophys-iology.Greenwieh, CT:JAI Press; 1987;2: 1-78.
36. Fabiani M,Friedman D,ChingJ.lndividual differences in P3sea!p distribution in older adults, and their relationship tofronta! lobe funetion. Psychophysiology 1998;35:G98-708.
37. Falkenstein M,KoshlykovaNA,KirojYN,HoormannJ, Hohns-bein J. Late ERPcomponents in visual and auditery go/nogotasks, E!ectroeneephalogrClin Neurophysiol1995; 96:36-43.
25
38. Ford J M,Sullivan E,Marsh L,White P,Lim K,Pfefferbaum A. 55. Israel JB, Chesney GL, Wickens CD, Donchin K P:lOOandThe relationship between P300 amplitude and regional gray trackingdifficulty: evidence for multiple resourees in dual-mattervolumes depends on the attentional system erıgaged. task performance. Psychophysiology 1080; 17:259·273.Electroencephalogr Clin Neurophysiol 1994;90: 214-228. 56. Jeon Y-W,Polich J. P3a from a passiye visual paradigm. Clin
39. Friedman D,Simpson G.ERPamplitudeand scalpdistribution Neurophysiol200 1;112:2202-2208.to targetand novel events: effectsoftemporal order in young, 57. Johnson R. A triarchic model of P300 amplitude. Psy-middle-age, and older adults. CognBr Res 1094;2:49-63. chophysiology 1986;23: 367·384.
40. Friedman D,Kazmerski VA,CycowiczYM.Effects ofaging on 58. Johnson R.Scalp-recorded P300activity in patients followingthe novelty P3 duringattend and ignore oddball tasks. Psy- unilateraltemporallobectomy. Brain 198ıla;111:1517·29.chophysiology 1998;35: 508·520.
Gazzaniga MS, Ivry RB, Marrgun GR. Cognitive neuro-59. Johnson R. The amplitude of the P300 component of the41. event-related potential: reviewand synthesis.ln: Ackles P,
science: The biology of the mind. New York:W.w.Norton & JenningsJR, Coles MGH,(eds). Advances in Psychophysi-Company, 1998. ology: AResearch Annua!. Greenwich, CT:JAI Press, Ine;
42. Gevins A, Smith ME, McEvoy L,YuD. High-resolution EEG 1988b;3:69-137.mapping of cortical activation related to working memory: 60. Johnson R.On the neural generatorsofthe P300 componenteffects of task difficulty, type of processing, and practice. of the event-related poterıtial. Psychophysiology ıuU:l;30:Cerebral Cortex 1997;7:374-385. 90-97.
43. Grillon C, Courchesne E, Ameli R, Elmasian R, Braff D. 61. Johnson R. Event-related potential insights into the neuro-Effects of rare norı-target stimuli on brain electrophysio- biology ofmemoıy systems.ln: Boller F,Gralrnan J, (eds).logical activityand performance.lntJ Psychophysiol 1990; Handbook ofNeuropsychology. Amsterdam: Elsevier 1995;9:257-267. ıo 135-163.
44. Halgren E,Squires NK,Wilson C,RohrbaughJ, Babb T,Cran- 62. Kahneman D. Attention and Effort. Engleweod-Cliffs. NJ:dalı P. Endogenous potentials in the human hippocampal PrentisHall1973.formation and amygdala by infrequent events. Science 1980;
63. KatayamaJ, PolichJ. P300 from one-, two-,and three-stimu-210: 803-805.
45. Halgren E, Baudena P,ClarkeJM, HeitG, Liegeois C, Chau-lusauditoryparadigms.lntJ Psychophysiol1996a; 2:l:;ı:l-40.
yel P, Musolino A. Intracerebral potentials to rare target 64. KatayamaJ, PolichJ. P300, probability, and the three-ton eand distractor auditory and visual stimuli. i. Superior tem- paradigm. Electroencephalogr Clin Neurophysiol ıuU6b;poral plane andparietallobe. ElectroencephalogrClin Neu- 100:555-562.rophysiol1995a; 94: 191-220. 65. KatayamaJ, PolichJ. Stimulus contextdetermines P3aand
46. Halgren E, Baudena P, Clarke J M, Heit G, Marinkovic K, P3b. Psychophysiology 1998;35:23-33.Devaux B, et a!.lntracerebral potentials to ra re target and 66. Kiehl KA,Laurens KR,DutyTL, Forster BB,Liddle PF.Neur-distractor auditory and visual stimuli. ii. Medial, lateral al sources involved in auditorytargetdetection and noveltyand posterior temporallobe. Electroencephalogr Clin Neu- processing. an event-related fMRIstudy. PsychophysiologyrophysioI1995b;94;229-250. 2001;38: 133-142.
47. He B, Lian J, Spencer KM, Dien J, Donchin E. A cortical 67. Kirino E, Belger A, Goldman-Rakic P, McCarthy, G. Pre-potential tmaging analysis of the P300 and novelty P3 com- frontal activation evoked by infrequent target and novelponents. Human Br Map2001; 12:120-130. stimuli in a visual target detection task: an event-related
48. Hillyard SA, Picton TW.Electrophysiology of cognition.In: functional magnetic resonance study. J Neurosci 2000; 20:Geiger SR, (ed). Handbook ofPhysiology: ACritical, Com- 6612-6618.prehensive Presentation of Physiological Knowledge and 68. Klimesch W.EEG-alpha rhythms and memory processes.Concepts (Section 1:The nervous system). NewYork:Amer- IntJ Psychophysiol 1997;26: 319-340.ican Physiology Association 1986;5:519-584. 69. Klimesch W.EEGalpha and theta oscillations reflect cogni-
49. Hillyard SA,Picton TW.Electrophysiology of cognition. In: tive and memory performance: a reviewand analysis. BrPlum F,(ed). Handbook ofPhysiology. Baltimore: American Res Rev 1999;29: !G9-195.Physiological Society 1987:519-584. 70. KlimeschW,Doppelmayr M,PachingerT, Rusaegger H.Event-
50. HombergV, Hefter H,Granseyer G,Strauss W,Lange H,Hen- related desynchronization in the alpha band and the pro-nerici M. Event-related potentials in patients with Hunt- cessing ofsemantic information. Cogn Br Res 1997;6:83-94.ington 's disease and relatives at risk in relation to detailed 71. Klimesch W, Doppelmayr M, Russegger H, Pachirıger T,psychometry. ElectroencephalogrClin Neurophysiol 1986; Schwaiger J. Induced alpha band power changes in the63:552-569. human EEGand attention. Neurosci Lett 1998;244:7:l·76.
51. Houlihan M, Stelmack R, Campbell K. Intelligence 1998; 72. Klimesch W,Schimke H,Schwaiger J. Episodic and semantie26:9·25. memory: an analysis in the EEGthetaandalpha band. Elec-
52. Ilan AB, Polich J. P300 and response time from a manual troencephalogrClin Neurophysiol1994; 91:428-441.Strooptask. ClinNeurophysiol 1999; 110:367·373. 73. Klimesch W,Dopplemayr M,Schwaiger J, WinklerT, Gruber
53. Intriligator J, Polich J.On the relationship between back- W.Theta oscillations and the ERP old/new effect: inde-ground EEGand the P300 event-related potentia\. Biol Psy-, pendent phenomena? Clin Neurophysiol2000; 1ll: 781-793.choI1994;37: 207-218. 74. Knight RT.Decreased response to novel stimuli after pre-
54. Intriligator J, Polich J. On the relationship between EEG frontallesions in man. Electroencephalogr Clin Neuro-and ERPvariability.lntJ Psychophysiol1995; 20:59-74. physiol1984; 59: 9-20.
26
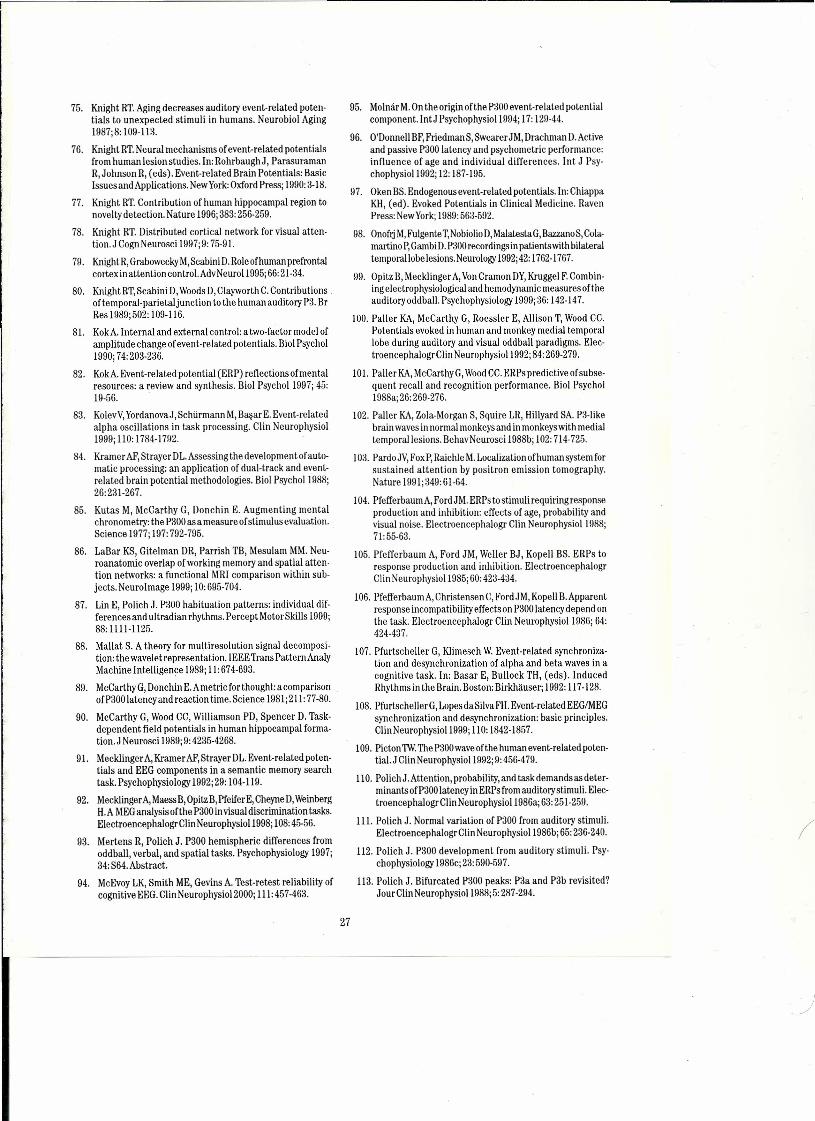
75. Knight RT.Aging deereases auditery event-related poten-tials to unexpeeted stimuli in humans. Neurobiol Aging1987j8: 109-113.
76. Knight RT.Neural meehanisms of event-related potentialsfrom human lesion studies. In: Rohrbaugh J, ParasuramanR, Johnson R, (eds). Event-related Brain Potentials: BasicIssuesandApplieations. NewYork: Oxford Press; 1990:3-18.
77. Knight RT.Contribution of human hippoeampal region tonoveltydetection. Nature 1996j383: 256-259.
78. Knight RT. Distributed eortical network for visual atten-tion. J Cogn Neurosci 1997; 9: 75-91.
79. Knight R,Grabowecky M,Scabini D.Role ofhuman prefrontalcortex in attention control. AdvNeurol 1995j66:21-34.
80. Knight RT,Scabini D,Woods D,Clayworth C.Contributionsoftemporal-parietaljunction to the human auditory P3. BrRes 1989j502: 109-116.
81. KokA.lnternal and external control: a two-faetor model ofamplitude change of event-related potentials. Biol Psyehol1990; 74: 203-236.
82. KokA. Event-related potential (ERP) refleetions of mentalresources: a reviewand synthesis. Biol Psychol 1997j 45:19-56.
83. KolevV,YordanovaJ, Sehürmann M,Başar E. Event-relatedalpha oscillations in task processing. Clin Neurophysiol1999j 110: 1784-1792.
84. Kramer AF,Strayer DL.Assessing the developmentofauto-matic processing: an application of dual-track and event-related brain potential methodologies. Biol Psychol 1988j26:231-267.
85. Kutas M, McCarthy G, Donchin E. Augmenting mentalchronometry: the P300 asa measureofstimulusevaluation.Seience 1977j 197:792-795.
86. LaBar KS, Gitelman DR, Parrish TB, Mesulam MM. Neu-roanatomie overlap of working memory and spatial atten-tion networks: a functional MR! comparison within sub-jects. Neurolmage 1999j lü: 695-704.
87. Lin E, Polich J. P300 habituation patterns: individual dif-ferencesand ultradian rhythms. Percept MotorSkills 1999j88: 1111-1125.
88. Mallat S. A theory for multiresolution signal deeomposi-tion: the wavelet representation. IEEE Trans PatternAnalyMachine Intelligence 1989j ll: 674-693.
89. McCarthy G,Donchin E.Ametric for thought: a comparisonofP300 latency and reaction time. Science 1981j211: 77-80.
90. McCarthy G, Wood CC, Williamson PD, Spencer D. Task-dependent field potentials in human hippocampal forma-tion. J Neurosci 1989j 9: 4235-4268.
91. Mecklinger A,Kramer AF,Strayer DL.Event-related poten-tials and EEG components in a semantic memory searchtask. Psychophysiology 1992j 29: 104-119.
92. Mecklinger A,MaessB, OpitzB, Pfeifer E,Cheyne D,WeinbergH.A MEGanalysis ofthe P300 in visual discrimination tasks.ElectroencephalogrClinNeurophysiol1998j 108:45-56.
93. Mertens R, Polich J. P300 hemispheric differences fromoddball, verbal, and spatial tasks. Psychophysiology 1997j34: S64. Abstract.
94. McEvoy LK, Smith ME, Gevins A. Test-retest reliability ofcognitive EEG. Clin Neurophyslol Züôü; lll: 457-463.
95. Molnar M.On the origin ofthe P300 event-related potentialcomponent.lntJ Psychophysiol lüüd; 17: 129-44.
96. O'Donnell BF,Friedman S,Swearer JM, Drachman D.Activeand passiye P300 lateneyand psychometric performance:influence of age and individual differences. Int J Psy-chophysiol lüüz; 12: 187-195.
97. Oken BS.Endogenousevent-related potentials.Irı: ChiappaKH, (ed). Evoked Potentials in Clinical Medicine. RavenPress: NewYork; 1989:563-592.
98. Onofıj M,FulgenteT, NobiolioD,MalatestaG, BazzanoS, Cola-martino P,Gambi D.P300recordings in patientswith bilateraltempo ral lobe lesions. Neurology 1992j42: 1762-1767.
99. Opitz B, Mecklinger A,VonCramon DY,Kruggel F.Combi n-ing electrophysiological and hemodynamic measuresoftheauditoryoddball. Psychophysiology 1999j 36: 142-147.
100. Paller KA, McCarthy G, Roessler E, Allison T, Wood CC.Potentials evoked in human and monkey medial temporallobe during auditory and visual oddball paradigms. Elec-troencephalogrClin Neurophysiol 1992j 84: 269-279.
101. Paller KA,McCarthyG, WoodCC. ERPs predictive ofsubse-quent recall and recognition performance. Biol Psychol1988aj 26: 269-276.
102. Paııer KA,Zola-Morgan S, Squire LR, Hillyard SA. P3-likebrain waves in normal monkeys and in monkeys with medialtemporallesions. BehavNeurosci 1988bj 102:714-725.
103. Pardo JV,FoxP, Raichle M.Localization ofhuman system forsustained attention by positron emission tomography.Nature 1991j349:61-64.
104. PfefferbaumA, Ford JM. ERPs to stimuli requiringresponseproduction and inhibition: effects of age, probability andvisual noise. Electroencephalogr Clin Neurophysiol i988j71:55-63.
105. Pfefferbaum A, Ford JM, Weııer BJ, Kopell BS. ERPs toresponse production and inhibition. ElectroencephalogrClin Neurophysiol Iüsô: 60: 423-434.
106. PfefferbaumA, Christensen C,Ford JM, Kopeli B.Apparentresponse incompatibility effects on P300 latency depend onthe task. Electroencephalogr Clin Neurophysiol 1986j 64:424-437.
107. Pfurtscheller G, Klimesch W. Event-related synchroniza-tion and desynchronization of alpha and beta waves in acognitive task. In: Basar E, Bullock TH, (eds). lnducedRhythms in the Brain. Boston: Birkhauser; 1992: 117-128.
108. Pfurtscheller G,Lopes daSilva FH. Event-related EEGIMEGsynchronization and desynchronization: basic principles.ClinNeurophysiol 1999j 110: 1842-1857.
109. Picton TW.The P300wave ofthe human event-related poten-tiaJ. J Clin Neurophysiol lüüz: 9:456-479.
ILO. Polich J. Attention, probability, and task demands as deter-minants of1'300latency in ERPs from auditorystimuli. Elec-troencephalogrClin Neurophysiol 1986aj 63: 251-259.
llL. Polich J. Normal variation of P300 from auditery stimuli.ElectroencephalogrClin Neurophysiol 1986bj65: 236-240.
112. Polich J. 1'300 development from auditery stimuli. Psy-chophysiology 1986cj 23: 590-597.
113. Polich J. Bifurcated 1'300 peaks: P3a and P3b revisited?JourClin Neurophysiol1988j 5:287-294.
27
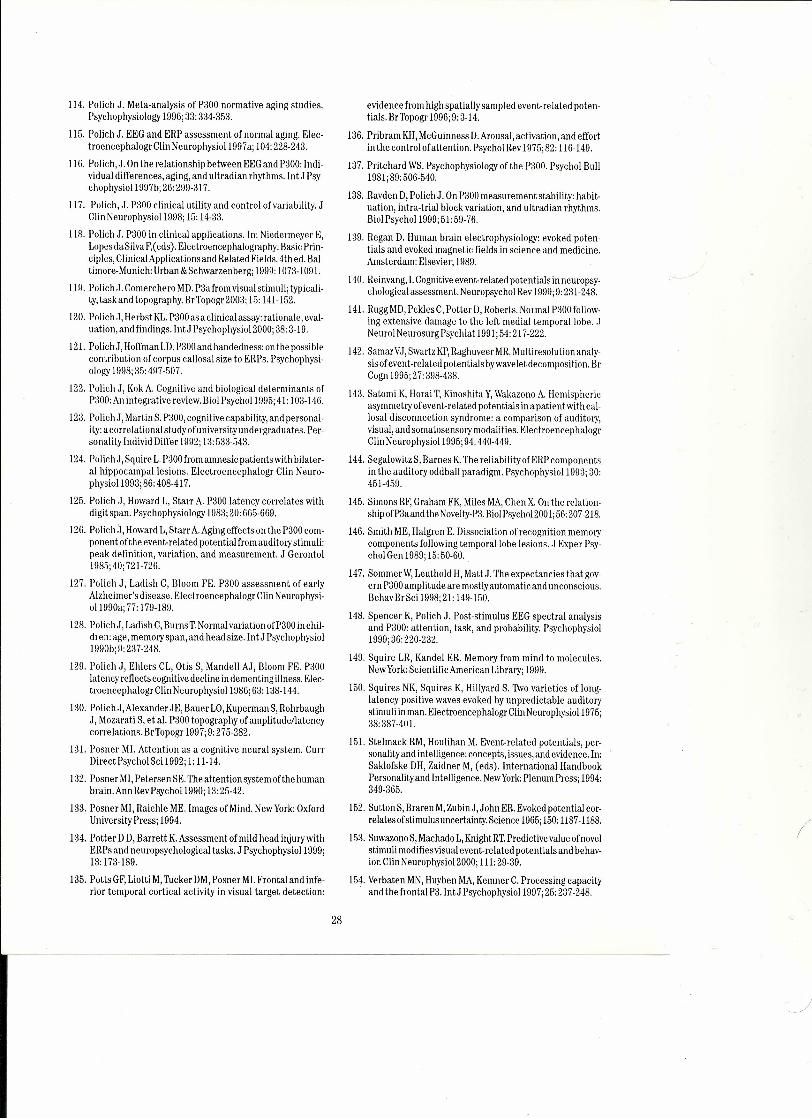
114. Polich J. Meta-analysis of P300 normative aging studies.Psychophysiology 1996;33: 334·353.
115. Polich J. EEG and ERP assessment of normal aging. Elec-troencephalogr Clin Neurophysiol 1997a; 104:228·243.
ilG. Polich, J. On the relationship between EEGand P300: Indi-vidual differences, agirıg, and ultradian rhythms. IntJ Psy-chophysiol 1997b;26: 299·317.
117. Polich, J. 1'300 elinical utility and control ofvariability. JClinNeurophysiol 1998; 15: 14-3:3.
118. Polich J. P300 in elinical applications. In: Niedermeyer E,LopesdaSilva F,(eds). Electroencephalography; Basic Prin-ciples, ClinicalApplications and Related Fields. 4th ed. Bal-timore-Munich: Urban & Schwarzenberg; 1999:1073-1091.
119. PolichJ. Comerehero MD.P3afrom visualstimuli; typicali-ty, taskand topography. BrTopogr2003; 15: 141-152.
120. PolichJ, Herbst KI,.P300 as a elinical assay: rationale, eval-uation,and findings. IntJ Psychophysiol 2000;38: 3-19.
121. Polich J, Hoffman LD.1'300and handedness: on the possiblecontributiorı of corpus callosal size to ERPs. Psychophysi-ology 1998;35:497-507.
122. Polich J, Kok A. Cognitive and biological determinants ol'P:100:An integrative review. Biol Psychol 1995;41: 103-146.
123. Polich J, Martin S. P300, cognitive capability, and personal-ity: acorrelational study ofuniversityundergraduates. Per-sonality Individ Differ 1992;13:533-543.
124. PolichJ, Squire L.1'300from amnesie patierıts with bilater-al hippocampal lesions, Electroencephalogr Clin Neuro-physioI1993;86:408-417.
125. Polich J, Howard L, Starr A. P300 latency correlates withdigit span. Psychophysiology 1983;20:665-669.
126. Polich J, Howard L, StarrA.Aging effectson the 1'300com-ponent of the event-related potential from auditory stimuli:peak definition, variation, and measurement. J Gerontol1985;40; 721-726.
127. Polich .1,Ladish C, Bloom FE. 1'300 assessment of earlyAlzheimer's disease. Electroencephalogr Clin Neurophysi-ol 1990a; 77: 179-189.
128. PoliehJ, Ladish C,Burns T.Normal variation of1'300in chil-dren: age, memory span, and head size. IntJ Psychophysiol1990b; 9:237-248.
129. Polich J, Ehlers CL, Otis S, Mandeıı AJ, Bloom FE. P300Iateney reflects cognitive decline in dementing illness. Elec-troencephalogr Clin Neurophysiol 1986;63: 138-144.
130. PolichJ, Alexander JE, Bauer LO,Kuperman S,RohrbaughJ, Mozarati S, et aL.1'300 topography of amplitudellatencycorrelations. Br Topogr 1997;9:275-282.
131. Posner MI. Attention as a eognitive neural system. CurrDirect Psychol Sci 1992; 1:11-14.
132. Posrıer MI,Petersen SE.Theattention system of the humanbrain. Ann Rev Psychol 1990; 13:25-42.
133. Posner MI, Raichle ME. Images ofMind. New York:OxfordUniversity Press; 1994.
134. Potter D D, Barrett K.Assessment ofmild head injurywithERPs and neuropsychological tasks. J Psychophysiol 1999;13: 173-189.
135. PottsGF, Liotti M,Tucker DM,Posner MI. Frontal and infe-rior temporal cortical activity in visual target detection:
evidence from high spatially sampled event-related poten-tials. BrTopogr 1996;9: 3-14.
136. Pribram KH,McGuinness D.Arousal, aetivation, and effortin the control ofattention. Psychol Rev 1975;82: 116-149.
137. Pritchard WS.Psychophysiology of the 1'300. Psychol Bull1981;89: 506-540.
138. Ravden D,Polich J. On 1'300measurement stability: habit-uation, intra-trial block variatiorı, and ultradian rhythms,Biol Psychol 1999;51: 59-'16.
139. Regan D. Human brain eleetrophysiology: evoked poten-tials and evoked magnetic fields in science and medicine.Amsterdam: EIsevier; 1989.
140. Reinvang, i. Cognitive event-related potentials in neuropsy-chological assessment. Neuropsychol Rev 1999;9:231-248.
141. Rugg MD,PekiesC, Potter D,Roberts. Normal P300 follow-ing extensive damage to the left medial temporal lobe. JNeurol NeurosurgPsyehiat 1991;54: 217-222.
142. Samar V.I,Swartz KP,Raghuveer MR.Multiresolution analy-sisof event-related potentials bywaveletdecomposition. BrCogn 1995;27: 398-438.
143. Satomi K, Horai T, Kinoshita Y,Wakazono A. Hemisphericasymmetry ofevent-related potentials in a patient with eal-losal diseonneetion syndrome: a comparison of auditory,visual, and somatosensory modalities. ElectroeneephalogrClinNeurophysiol 1995;94:440-449.
144. Segalowitz S,Barnes K.The reliability ofERP componentsin the auditery oddball paradigm. Psychophysiol 1993; 30:451-459.
145. Simons RF,Graham FK,Miles MA,Chen X.On the relation-ship ofP3aand the Novelty-P3.BiolPsychol 2001;56:207-218.
146. Smith ME,Halgren E. Dissociation ofreeognition memorycomponents Iollowing temporal lobe lesions. J Exper Psy-cholGen 1989;15:50-60.
147. Sommer W,Leuthold H, MattJ. The expeetancies that gov-em P300amplitude are mostlyautomatie and unconscious.BehavBrSci 1998;21: 149-150.
148. Spencer K, Polich J. Post-stimulus EEG spectral analysisand P300: attention, task, and probability. Psyehophysiol1999;36:220-232.
149. Squire LR, Kandel ER. Memoıy from mind to molecules.NewYork:ScientificAmerican Library; 1999.
150. Squires NK, Squires K, Hillyard S. 'Iwo varieties of long-latency positive waves evoked by unpredictable auditorystimuli in man. Electroeneephalogr Clin Neurophysiol 1975;38:387-401.
151. Stelmack RM, Houlihan M. Event-related potentials, per-sonality and intelligence: concepts, issues, and evidence. In:Saklofske DH, Zaidner M, (eds). International HandbookPersonallty and Intelligence. NewYork:Plenum Press; 1994:349-365.
152. Sutton S,Braren M,Zubin J, John ER. Evoked potential cor-relatesofstimulusuncertainty. Science 1965;150:1187-1188.
153. Suwazono S,Machado L,Knight RT.Predictive value ofnovelstimuli modifiesvisual event-related potentialsand behav-ior.Clin Neurophysiol 2000; lll: 29-39.
154. Verbaten MN,Huyben MA,Kemner C. Processing capacityand thefrontal P3. IntJ Psychophysiol 1997;25: 237-248.
28
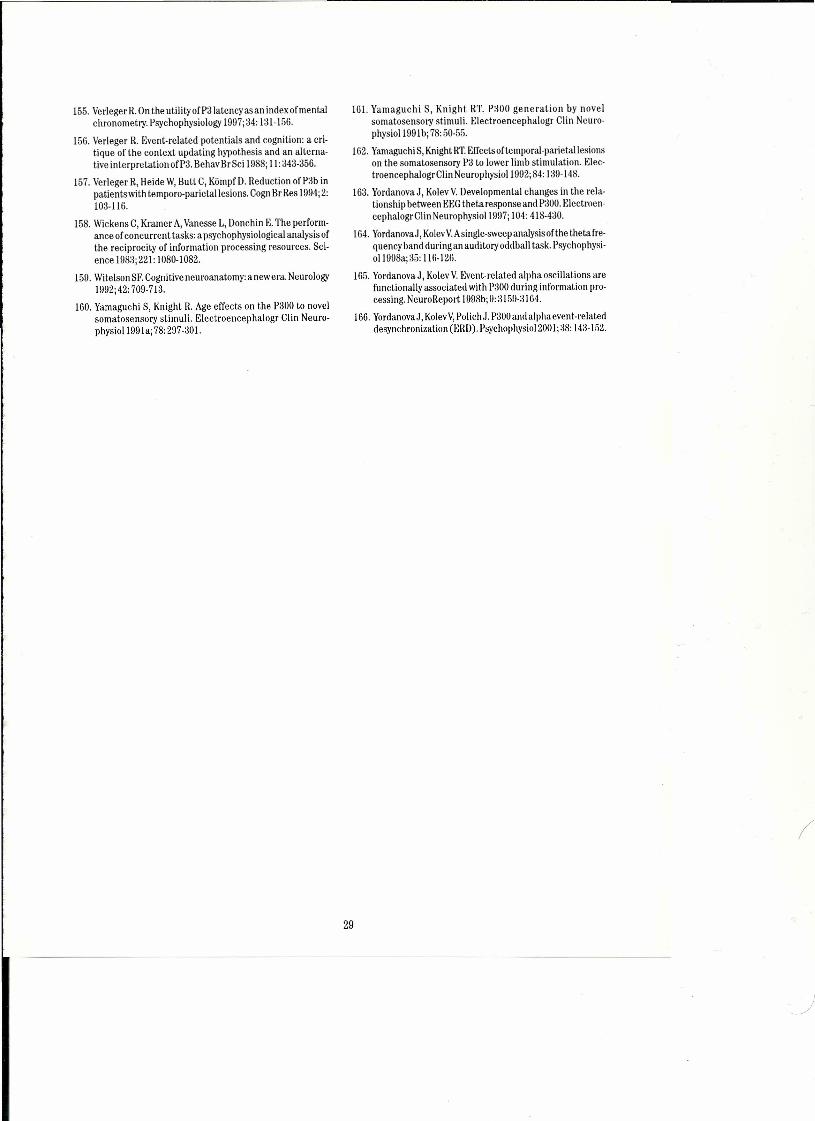
155. Verleger R.On the utilityofP3 latency asan index of mentalchronometry, Psychophysiology 1997j34: 131-156.
156. Verleger R. Event-related potentials and cognition: a eri-tique of the context updating hypothesis and an alterna-tive interpretation ofP3. Behav Br Sci 1988j ll: 343-356.
157. Verleger R, Heide W,Butt C, Kömpf D. Reduction ofP3b inpatientswith temporo-parietal lesions. Cogn Br Res 1994j2:103-116.
158. Wickens C, Kramer A,Vanesse L, Donchin E.The perform-ance ofconcurrent tasks: a psychophysiological analysis ofthe reciprocity of information processing resources. Sci-en ce 1983j221: 1080-1082.
159. Witelson SF.Cognitive neuroanatomy: anewera. Neurology1992j42: 709-713.
160. Yamaguchi S, Knight R. Age effects on the P300 to novelsomatoserısory stimuli. Electroerıcephalogr Clin Neuro-physiol 199laj 78: 297-301.
161. Yamaguchi S, Knight RT. P:LOOgeııeratioıı by novelsomatosensory stimuli. Electroencephalogr Clin Neuro-physiol 1991b; 78:50-55.
!ü2. Yamaguchi S, Knight RT.Effectsofteıııporal-parietal lesiolison the somatosensory P3 to lower Iimb stimulation. Elec-troencephalogrClin Neurophysiol 1902j84: 130-148.
163. Yordanova J, Kolev V.Developmental chaııges iıı the rela-tionship between E~;Gtheta response and P300. Eleetmen-cephalogrClin Neurophysiol 1997j 104: 418-430.
164. YordanovaJ, KolevV.Asingle-sweep analysis ofthe theta fre-quency band during an auditoryoddball task. Psychophysi-ol 1998aj35: 116-12G.
165. Yerdanova J, Kolev V.Event-related alpha oscillations arefuııctionally associated with P:LOOduring information pm-cessing. NeuroReport 190HbjLL:3159-3164.
166. Yordanova J, KolevV,Polich.l. P300 and alpha event-relateddesyııchroııization (ERD). Psychophysiol 200Ij:l8: 14:1-152.
29

NON-CLINICAL
31

Digital Signal Processing and SingleTrial Evoked Potentials: Accomplishınents,
Limitations and PromisesB. H. Jansen, V. Garoosi, G. Agarwal, D. [yer, A. Hegde and R. Jacob
University of Houston, Houston, Texas, USAN. N. Boutros, Yale University, New Haven, Connecticut, USA
ABSTRACTDigital signal processing (DSP) involves converting
the analog EEG signal into a digital sequence ("sam-pling''), followed by computer-based processing. EarlyDSP methods were aimed at improving ensemble aver-aging, which relies on the rather unrealistic assump-tions that the EP is time-Iocked to the stimulus, doesnot vary between trials, and is not correlated with theongoing EEG. These days, much attention is devoted tosingle trial analysis. Two basic approaches are beingexplored: inverse filtering, and decomposition.
Inverse filtering uses a model for EEG generation.Once the model parameters have been adapted toreproduce the pre-stimulus EEG, post-stimulus EEGIEPis input to the inverse model, resulting in an attenua-tion of the post-stimulus, spontaneous EEG. Modelschosen for their mathematical convenience or neuro-physiological relevance have been used with moderatesuccess, as will be illustrated by examples.
Decomposition methods take the single trial EEGIEPapart into its constituent rhythms. Band-pass filtering isone approach, but may introduce misleading artifacts, aswe will show. The wavelet transform shows promise, butthe decomposition depends sensitively on the choice ofthe "mother wavelet." The author's laboratory developedthe piecewise Prony method (PPM), and results of itsapplication to auditory EPs are presented.INTRODUCTION
Ever since the introduction of ensemble averaging,about 35 years ago, computers, and more specifically,digital signal processing (DSP) methods have played amajor role in evoked potential (EP) analysis. DSPinvolves converting the analog EEG signal into a digitalsequence ("sampling"), followed by computer-hased pro-cessing. DSP methods are implemented in software, pro-viding flexibility not attainable in implementationsusing analog circuitry.
Early DSP methods were aimed at improvingensemble averaging, which relies on the rather unreal-istic assumptions that the EP is time-locked to thestimulus, does not vary between trials, and is inde-
pendent (or at least uncorrelated) with the ongoingEEG. Examples include latency-corrected averaging"and Wierıer filtering."
Veritabı e single trial analysis methods can be divid-ed into two categories: inverse filtering methods, anddecomposition methods. Inverse filtering involves theuse of a model for EEG generation, which is adapted toreproduce the pre-stimulus EEG. Post-stimulus EEGIEPis input to the inverse model, resulting in an attenua-tion of the post-stimulus, spontaneous EEG. Inverse fil-tering is reviewed below.
Regardless of the choice of model, all inverse filter-ing methods assume that the event related activity isadditive to the spontaneous EEG activity. However,there is mounting evidence that the EEGand EP are nottwo independent processes, but that the event relatedactivity is due to an interaction between spontaneousneural activity and specific afferent activity. This inter-action may result in the emergenco of new frequencycomponents, attenuation or augmentation of EEGrhythms present pre-stimulus, or phase resetting of cer-tain components (or a combination of all or some ofthese). Decomposition methods are well-suited touncover which of these processes underlie EP geneta-tion. Next, several decomposition methods are reviewedand the ir strengths and weaknesses are discussed. Thenan application of a new decomposition method for sin-gle trial auditory EPs is presented, and a discussion con-cludes this presentation.INVERSE FILTERING
One class of single trial EP analysis methodsinvolves the use of filters, designed to attenuate theongoing EEGactivity while leaving the EP activity unaf-fected. A variety of such methods have been developed,many involving Wiener filtering.v" A theoretical reviewof such method s was presented by de Weerd," who alsointroduced a tirne-varying method." Other filteringapproaches rely on linear, and especially autoregres-sive, modeling." Applications to EP enhancement arereported using single EEGIEP trials.7t2.21;The basic ideais to fit a model to pre-stimulus EEG and to pass the
33
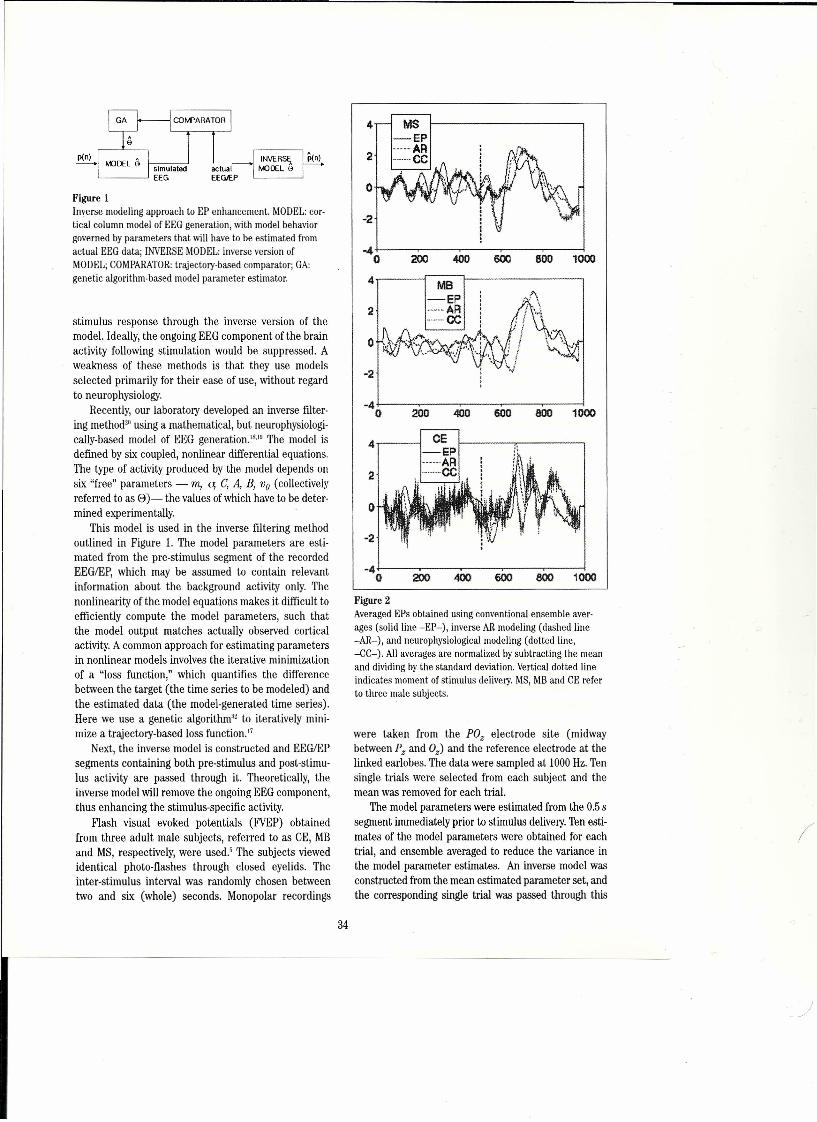
Figure 1lnverse modelingapproach to EP enhancement. MODEL:cor-tical column model of EEGgeneration, with model behaviorgoverrıedbyparameters that willhave to be estimated fromactual EEGdata; lNVERSEMODEL:inverseversionofMODEL;COMPARATOR:trajectory-basedcomparator;GA:genetic algorithm-basedmodel parameter estimator.
stimulus response through the inverse version of themodeL. Ideally, the orıgoing EEG compone nt of the brainactivity following stimulation would be suppressed. Aweakness of these methods is that they use modelsselected primarily for the ir ease of use, without regardto neurophysiology,
Recently, our laboratory developed an inverse filter-ing method" using a mathematical, but neurophysiologi-cally-based model of EEG generation.":" The model isdefined by six coupled, nonlinear differential equations.The type of activity produced by the model depends onsix "free" parameters - m, O; C, A, B, Vo (collectivelyreferred to as 8)- the values ofwhich have to be deter-mined experimentally.
This model is used in the inverse filtering methodoutlined in Figure ı. The model parameters are esti-mated from the pre-stimulus segment of the recordedEEGIEP, which may be assumed to contain relevantinformation about the background activity only. Thenonlinearity of the. model equations makes it difficult toefficiently compute the model parameters, such thatthe modeloutput matches actually observed corticalactivity. A common approach for estimating parametersin nonlinear models involves the iterative minimizationofa "loss function," which quantifies the differencebetween the target (the time series to be modeled) andthe estimated data (the model-generated time series).Here we use a genetic algorithm" to iteratively mini-mize a trajectory-based loss function."
Next, the inverse model is constructed and EEGIEPsegments containing both pre-stimulus and post-stimu-lus activity are passed through it. Theoretically, theinverse model will remove the ongoing EEG component,thus enhancing the stimulus-specific activity.
Flash visual evoked potentials (FVEP) obtainedfrom three adult male subjects, referred to as CE, MBand MS, respectively, were used," The subjects viewedidentical photo-flashes through closed eyelids. Theinter-stimulus interval was randomly chosen betweentwo and six (whole) seconds. Monopolar recordings
~~--~----~----~----~--~O
4~---4~~~--------~~200 600 800 1000400
o
-2
-4~--~----~----~--~----~O 200 400 600 800 1000
2
4~-----L
o
-2
-4~----~--~~--~----~----~·0 800 1000200 600
Figure 2AveragedEPs obtained usingconventionalensemble aver-ages (solid line -EP-), inverseARmodeling(dashed line-AR-), and neurophysiologicalmodeling(dotted line,-CC-). Allaveragesare normalizedbysubtracting the meanand dividingby the standard deviation.Verticaldotted lineindicates moment ofstimulus delivery, MS,MBand CEreferto three male subjects.
were taken from the POz electrode site (midwaybetween Pz and Oz) and the reference electrode at thelinked earlobes. The data were sampled at 1000 Hz. Tensingle trials were selected from each subject and themean was removed for each trial.
The model parameters were estimated from the 0.5 ssegment immediately prior to stimulus delivery. Ten esti-mates of the model parameters were obtained for eachtrial, and ensemble averaged to reduce the variance inthe model parameter estimates. An inverse model wasconstructed from the mean estimated parameter set, andthe corresponding single tria! was passed through this
34
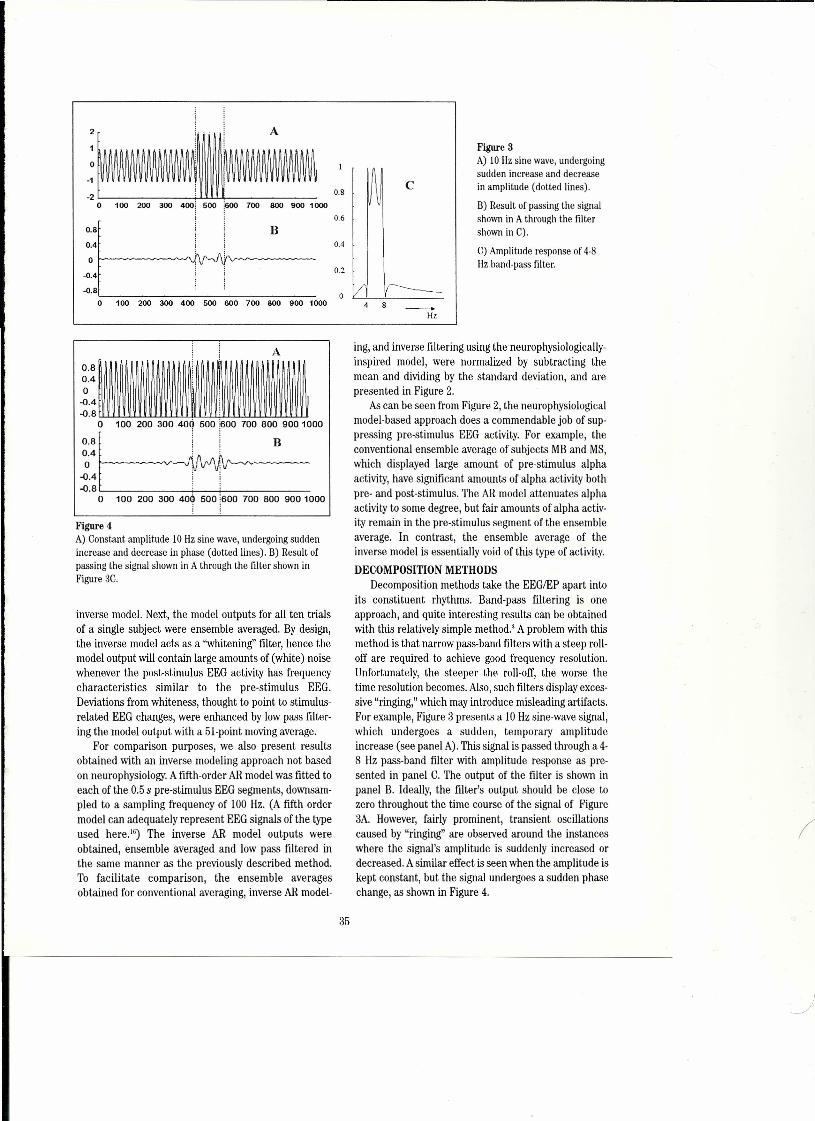
L~o 100 200 300 400: 500 i600 700 800 900 1000
0.8C i i B0.4 ; ;
O ~~~
-0.4 i ~-0.8 ; ,
O 100 200 300 400 500 600 700 800 900 1000
0.8~
C
0.6
OA
0.2
O V v--------Hz
Figure 3A) 10 Hz sine wave, undergoingsudden inerease and deereasein amplitude (dotted lines).
B) Result of passing the signalshown in A through the filtershown in C).
C) Amplitude response of 4·8Hz barıd-pass filter.
A0.80.4O-0.4-O.8UL~LU~~LU~ıu~~~~ıuuı~
O 100~:i~-~~--~--0.4-0.8 --.;._--.;. _
O 100 200300409500:6007008009001000
Figure 4A) Constant amplitude LO Hz sine wave, undergoing suddeninerease and decrease in phase (dotted lines). B) Result ofpassing the signal shown in A through the filter shown inFigure 3C.
inverse modeL.Next, the model outputs for all ten trialsof a single subject were ensemble avetaged. By design,the inverse model acts as a "whitening" fılter, hence themodeloutput will contain large amounts of (white) noisewhenever the post-stimulus EEG activity has frequencycharacteristics similar to the pre-stimulus EEG.Deviations from whiteness, thought to point to stimulus-related EEG changes, were enhanced by low pass filter-ing the modeloutput with a ôl-point moving average.
For comparison purposes, we also present resultsobtained with an inverse modeling approach not basedon neurophysiology. A fifth-order ARmodel was fitted toeach of the 0.5 s pre-stimulus EEG segments, downsam-pled to a sampling frequency of ıoo Hz. (A fıfth ordermodel can adequately represent EEG signals of the typeused here. lG) The inverse AR model outputs wereobtained, ensemble avetaged and low pass fıltered inthe same manner as the previously deseribed method.To facilitate comparison, the ense mble averagesobtained for eonventional averaging, inverse AR model-
ing, and inverse filtering using the neurophysiologically-inspired model, were normalized by subtracting themean and dividing by the standard deviation, and arepresented in Figure 2.
Asean be seen from Figure 2, the neurophysiologicalmodel-based approach does a eommendable job of sup-pressing pre-stimulus EEG activity. For example, theconventional ensemble average of subjects MBand MS,which displayed large amount of pre-stimulus alphaactivity, have significant amounts of alpha activity bothpre- and post-stimulus. The ARmodel attenuates alphaactivity to some degree, but fair amounts of alpha activ-ity remain in the pre-stimulus segment of the ensembleaverage. In contrast, the ensemble average of theinverse model is essentially void of this type of aetivity.DECOMPOSITION METHODS
Decomposition methods take the EEGIEP apart intoits constituent rhythms. Barıd-pass fıltering is oneapproach, and quite interesting results ean be obtainedwith this relatively simple method." A problem with thismethod is that narrow pass-band fılters with a steep roll-off are required to achieve good frequency resolution.Unfortunately, the steeper the roll-off, the worse thetime resolution becomes. Also,such fılters display exces-sive "rirıging,"which may introduce misleading artifaets.For example, Figure 3 presents a 10 Hzsine-wave signal,which undergoes a sudden, temporary amplitudeinerease (see panel A). This signal is passed through a 4-8 Hz pass-band fıIter with amplitude response as pre-sented in panel C. The output of the fıIter is shown inpanel B. Ideally, the fıIter's output should be close tozero throughout the time eourse of the signal of Figure3A. However, fairly prominent, transient oscillationscaused by "ringing" are observed around the instanceswhere the signal's amplitude is suddenly increased ordecreased. Asimilar effect is seen when the amplitude iskept constant, but the signal undergoes a sudden phasechange, as shown in Figure 4.
35

!I~AA~AA~~M~~~A~AAW ~ IA~A~AAA~~~~~AAAAAW-1 tV_VVVVVV~~mV_VVVV!V -1 ~~V~~ım~V~V~V~V-2ô--joo 200 -300---400--500 -2 ~100-2iıO 300-40iı~500
O~ B 2 EO· 1l/\I\/\/\/\/10\/\/\III\II/I/\JI/I/I/L~: ~_~__ :1 .O_~OC 100 200 300 400 500 21:AA~0;AA2AO~A~3~0;AA;:AA:00
il/V\f\AN\fvvvV :i~O 100 200 300 400 500 O 100 200 300 400 500
Figure 5Comparison of wavelet transforms and pieeewise Pronymethod for 10 Hz sine wave, undergoing sudden increase anddeerease in amplitude (panels A and D). PPM results in the4-8 Hz band (B) and 8-16 Hz band (E). wr results in the 4-8Hz band (C) and 8-16 Hz band (F).
Wavelet transform-based decomposition has beenused successfully for EP analysis.v'-" The basisapproach involves the repeated application of compli-mentary high and low-pass filters followed by downsam-pling the output of the low-pass filter, The advantageover band-pass filtering approaches is that less "ring-ing" will occur because of the use of low- and high-passfllters. However, loss of time resolution will still be aproblem. Another problem with these methods is thatthey depend sensitively on the choice of the "motherwavelet," which often shows little or no resemblance toEP signal oharacteristics, Figures 5 and 6 present thewavelet transform results obtained using theDaubechies 9-tap filter for LO Hz sine waves undargoingsudden amplitude change and phase change, respec-tively, AB one can see, a substantial amount of activity isseen in the 4-8 Hz band (Figures 5C, 6C), even thoughno such activity is present in the signal at hand. Also,the wavelet transform produces an 8-16 Hz decomposi-tion that shows considerable amplitude variability(Figures 5F, 6F),
An alternative method for single trial analysis wasrecently introduced." This method, referred to as thepiecewise Prony method (PPM), reduces the signal to a.sum of elementary signals, very much like a chemistmay split a molecule into atoms, The method we devel-oped is somewhat similar to a Fourier series expansion,where a signal is represented as a sum of weightedcosines and sinusoids. However,we follow a variant orig-inally developed by Baron de Prony," who propose d touse exponentially decaying sinusoids as elementary sig-nals. llsing such signals for EEG and EP modeling isattractive, because it has been observed that intra-cor-tical EP activity resembles decaying oscillaticns.l-" Inthe original Prony method, the sinusoids have a dura-tion equal to the length of the signal to be modeled, andall components are monotonically increasing or
0_"~ A-o.-o.ı 100 200 300 400 5000.80ıi B
-o.-o ... _-. __ or 100 200 300 400 5000.8
~4 N\r'V\J"\f\j\I'iVV c-o.-o. o __ o .____ _ __ •• _
o 100 200 300 400 500
Dimmo 100 200 300 400 500
1.Ed.o,"II\:III\I\I\~"I\I\III\~-.J\I\I\I\~~
-o.--11·~~10""'""0 -2CCO""'""O~3CCOO'""""4"700C--=500
Dr~'-o.-1
-1.~()()
Figure 6Comparison of wavelet transforms and pieeewise Pronymethod for 10 Hz sine wave, undergoiııg sudden increase anddecrease in phase (panels A and D). PPM results in the 4-8Hzband (B) and 8-16 Hz band (E). Wl' results in the 4-8 Hzband (C) and 8-16 Hzband (F),
decreasing. In our variant, we allow the components tostart and terminate at any time during the interval to bedecomposed, and the components can turn from decay-ing to increasing and vice versa. In this regard, PPMresembles a wavelet transform. However, an importantdifference is that a redundant representation isobtained, with the signal components not orthogonal toeach other, This results in less "Ieakage" than observedfor non-redundant representations such as the Fouriertransform and the wavelet transform. This is illustratedin Figures 5B and 6B, which show that the PPM pro-duces a zero-amplitude component in the 4-8 Hz rangewhen decomposing a 10 Hz sine wave undergoing sud-den amplitude or phase changes, respectively, AB shownbefore, the wavelet transform incorrectly producedappreciable output in this frequency ran ge (Figures 5Cand 6C), Furthermore, the PPM also produces an accu-rate estimate of the amplitude of the LO Hz signal com-ponent, as can be seen from Figures 5E and GE.A draw-back is that the PPM fails to accurately model the sig-nal around the instances where the signal characteris-tic s undergo a sudden change,
PPM ANALYSIS OF SINGLE TRIAL AUDITORY EPS
Subjects and recording procedure
'Iwenty paid healthy volunteers and nineteen chron-ic schizophrenia patients were subjected to a doubleclick paradigm, All patients had negative drug screenson admission, and all were on neurolepties (typical oratypical, but none were on elozapine) at the time of thestudy, Pairs of identical1500 Hzelicks were produced by
- a Grass auditory stimulator and were delivered throughhead phones, with 400 msee to 600 msee between thefirst (Si) and the second (S2) click. The inter-stimulusintervals were randomized by the computer, A samplingrate of 1000 Hz was used for digitization. Pairs of clickswere separated by at least 8 see, Monopolar recordings
36
)
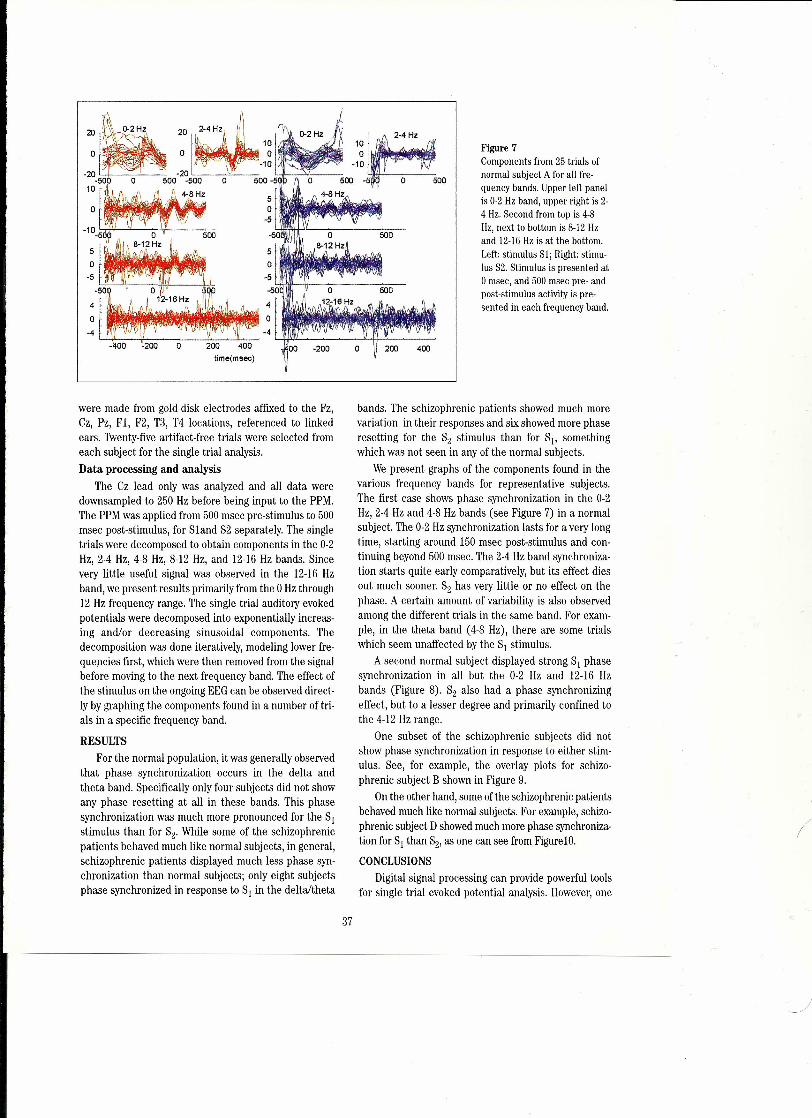
20
o
4
O
-4~~~~--------~--~~-o 200 400time(msec)
were made from gold-disk eleetrodes affıxed to the Fz,Cz, Pz, F1, F2, T3, T4 locations, referenced to linkedears. Twenty-five artlfact-free trials were selected fromeach subject for the single trial analysis.Data processing and analysis
The Cz lead only was analyzed and all data weredownsampled to 250 Hz before being input to the PPM.The PPM was applied from 500 msec pre-stimulus to 500msec post-stimulus, for Sland S2 separately. The singletrials were decomposed to obtain components in the 0-2Hz, 2-4 Hz, 4-8 Hz, 8-12 Hz, and 12-16 Hz bands. Sincevery little useful signal was observed in the 12-16 Hzband, we present results primarily from the O Hz through12 Hz frequency range. The single trial auditory evokedpotentials were decomposed into exponentially increas-ing and/or decreasing sinusoidal components. Thedecomposition was done iteratively, modeling lower fre-quencies first, which were then removed from the signalbefore moving to the next frequency band. The effect ofthe stimulus on the ongoing EEG can be observed direct-ly by graphing the components found in a number of tri-als in a specific frequency band.
RESULTSFor the normal population, it was generally observed
that phase synchronization occurs in the delta andtheta band. Specifically only four subjects did not showany phase resetting at all in these bands. This phasesynchronization was much more pronounced for the Sıstimulus than for S2' While some of the schizophrenicpatients behaved much like normal subjects, in general,schizophrenic patients displayed much less phase syn-chronization than normal subjects; only eight subjectsphase synchronized in response to Sı in the delta/theta
Figure 7Components from 25 trials ofnormal subject A for all fre-quency bands. Upper left panelis 0-2 Hz band, upper right is 2-4 Hz. Second from top is 4-8Hz, next to bottom is 8-12 Hzand 12-16Hz is at the bottom.Left: stimulus S1; Right: stimu-lus S2. Stimulus is presented atOmsec, and 500 msec pre- andpost-stimulus activity is pre-sented in each frequency band.
~~
2-4HZ10o
-10
500 -5 O 5004-8 Hz
bands. The schizophrenic patients showed much morevariation in their responses and six showed more phaseresetting for the S2 stimulus than for Sı, somethingwhich was not seen in any of the normal subjects.
We present graphs of the components found in thevarious frequency bands for representative subjects.The first case shows phase synchronization in the 0-2Hz, 2-4 Hz and 4-8 Hz bands (see Figure 7) in anormalsubject. The 0-2 Hz synchronization lasts for a very longtime, starting around 150 msec post-stimulus and con-tinuing beyond 500 msec. The 2-4 Hz band synchroniza-tion starts quite early comparatively, but its effect diesout much sooner. S2 has very little or no effect on thephase. A certain amount of variability is also observedamong the different trials in the same band. For exam-ple, in the theta band (4-8 Hz), there are some trialswhich seem unaffected by the Sı stimulus.
A second normal subject displayed strong Sı phasesynchronization in all but the 0-2 Hz and 12-16 Hzbands (Figure 8). S2 also had a phase synchronizingeffect, but to a lesser degree and primarily confined tothe 4-12 Hz range.
One subset of the schizophrenic subjects did notshow phase synchronization in response to either stim-ulus. See, for example, the overlay plots for schizo-phrenic subject B shown in Figure 9.
On the other hand, some of the schizophrenic patientsbehaved much like normal subjects. For example, schizo-phrenic subject D showed much more phase synchrorıiza-tion for Sı than S2'as one can see from Figureıo.
CONCLUSIONSDigital signal processing can provide powerful tools
for single trial evoked potential analysis. However, one
37
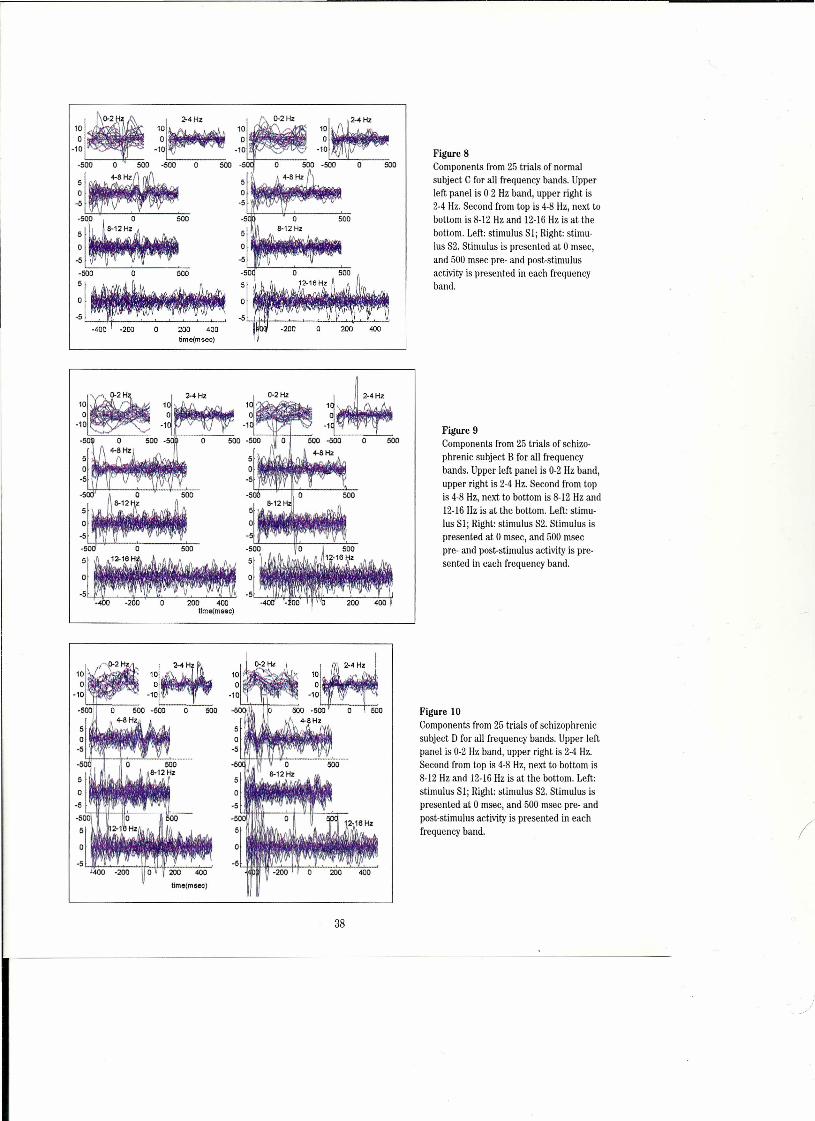
1~1~-10~
~
-4HZ10
O-10
O 500 -500 O 500
4-8 Hz
O 500
500
'~~
-500 O 500
;i~-400 -200 O 200 400
tlme(msec)
,J. J,'"~-1~
500 -500 O 500
4-8 Hz
38
Pigure 8Components from 25 trials of normalsubject C for all frequency bands. Upperleft panel is 0-2 Hz band, upper right is2-4 Hz. Second from top is 4-8 Hz, next lobottom is 8-12 Hz and 12-16 Hz is al thebottom. Left: stimulus SI; Right: stimu-lus S2. Stimulus is presented at O msec,and 500 msec pre- and post-stimulusactivity is presented in each frequencyband.
Figure 9Components from 25 trials of schizo-phrenic subject B for all frequencybands. Upper left panel is 0-2 Hz band,upper right is 2-4 Hz. Second from topis 4-8 Hz, next to bottom is 8-12 Hz and12-16 Hz is at the bottom. Left: stimu-lus SI; Right: stimulus S2. Stimulus ispresented at O msec, and 500 msecpre- and post-stimulus activity is pre-sented in each frequency band.
Figure 10Components from 25 trials of schizophrenicsubject D for all frequency bands. Upper leftpanel is 0-2 Hz band, upper right is 2-4 Hz.Second from top is 4-8 Hz, next to bottom is8-12 Hz and 12-16 Hz is at the bottom. Left:stimulus SI; Right: stimulus S2. Stimulus ispresented at Omsec, and 500 msec pre- andpost-stimulus activity is presented in eachfrequency band.
)
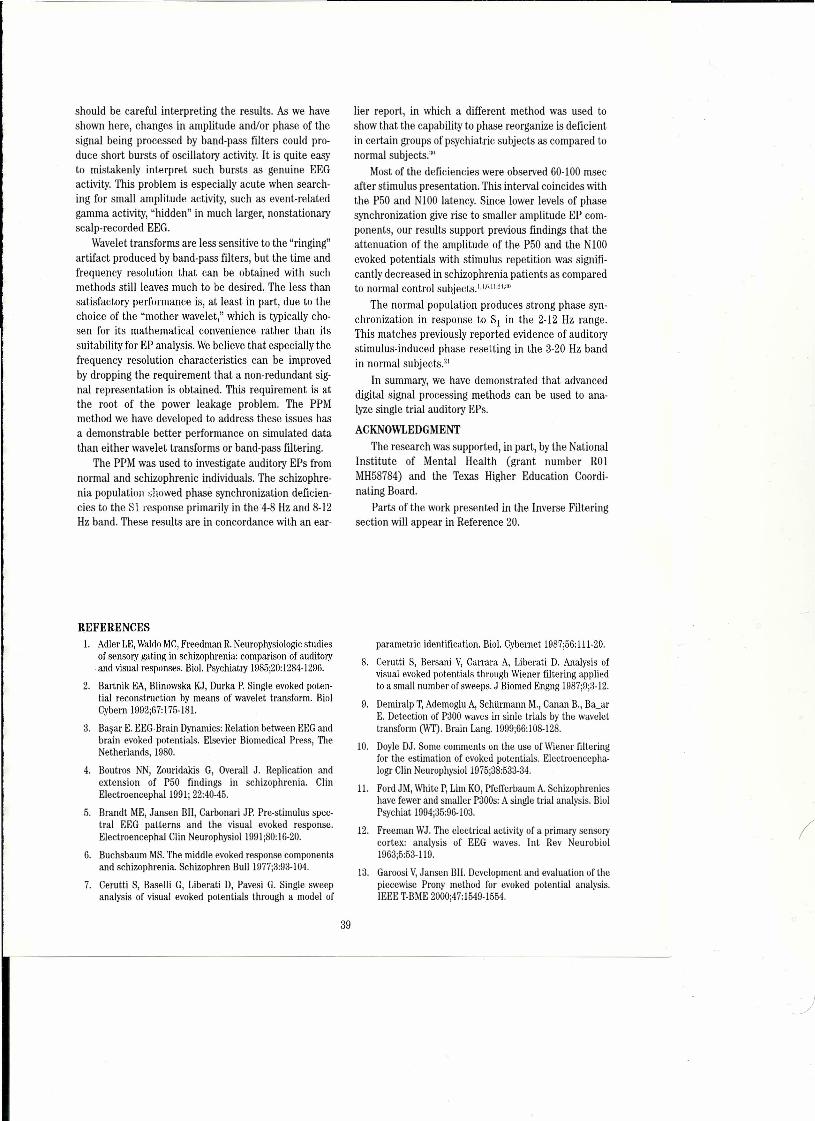
should be careful interpreting the results. As we haveshown here, changes in amplitude and/or phase of thesignal being processed by band-pass filters could pro-duce short bursts of oscillatory activity. it is quite easyto mistakenly interpret such bursts as genuine EEGactivity. This problem is especially acute when search-ing for smail amplitude activity, such as event-relatedgamma activity, "hidden" in much larger, nonstationaryscalp-recorded EEG.
Wavelet transforms are less sensitiye to the "ringing"artifact produced by band-pass fılters, but the time andfrequency resolution that can be obtained with suchmethods still leaves much to be desired. The less thansatisfactory performance is, at least in part, due to thechoice of the "mother wavelet," which is typically cho-sen for its mathematical convenience rather than itssuitability for EP analysis. Webelieve that especially thefrequency resolution characteristics can be improvedby dropping the requirement that a non-redundant sig-nal representation is obtained. This requirement is atthe root of the power leakage problem. The PPMmethod we have developed to address these issues hasa demonstrable better performance on simulated datathan either wavelet transforms or band-pass fıltering.
The PPM was used to investigate auditory EPs fromnormal and schizophrenic individuals. The schizophre-nia population showed phase synchronization deficien-cies to the S1 response primarily in the 4-8 Hz and 8-12Hz band. These results are in concordance with an ear-
REFERENCESı. Adler LE,WaldoMC,Freedman R.Neurophysiologic studies
of sensory gating in schizophrenia: comparison of auditoıyand visual responses. Biol. Psychiatry 1985;20:1284-1296.
2. Bartrıik EA, Blinowska KJ, Durka P. Single evoked poten-tial reconstruction by means of wavelet transform. BiolCybern 1992;67:175-181.
a. Başar E. EEG-Brain Dynamics: Relation between EEGandbrain evoked potentials. EIsevier Biomedical Press, TheNetherlands, 1980.
4. Boutros NN, Zouridakis G, Overall J. Replication andextension of P50 findings in schizophrenia. ClinElectroencephal 1991; 22:40-45.
5. Brarıdt ME, Jansen BH, Carbonari JP. Pre-stimulus spec-tral EEG patterns and the visual evoked response.Electroencephal Clin Neurophysiol 1991;80:16-20.
6. Buchsbaum MS.The middle evoked response componentsand schizophrenia. Schizophren Bull1977;3:93-104.
7. Cerutti S, Baselli G, Liberati D, Pavesi G. Single sweepanalysis of visual evoked potentials through a model of
lier report, in which a different method was used toshow that the capability to phase reorganize is deficientin certain groups of psychiatric subjects as compared tonormal subjects."
Most of the deficiencies were observed 60-100msecafter stimulus presentation. This interval coincides withthe P50 and NlOOlateney. Sirıce lower levels of phasesynchronization give rise to smailer amplitude EP com-ponents, our results support previous findings that theattenuation of the amplitude of the P50 and the NlOOevoked potentials with stimulus repetition was signifi-cantly deereased in schizophrenia patients as comparedto normal control subjects.'·j·I;.".jt''''
The normal population produces strong phase syn-chronization in response to Sı in the 2-12 Hz range.This matches previously reported evidence of auditorystimulus-induced phase resetting in the 3-20 Hz bandin normal subjects."
In sumrnary, we have demonstrated that advanceddigital signal processing methods can be used to ana-lyze single trial auditory EPs.
ACKNOWLEDGMENTThe research was supported, in part, by the National
Institute of Mental Health (grant number ROlMH58784) and the Texas Higher Education Coordi-nating Board.
Parts of the work presented in the Inverse Filteringseetion will appear in Reference 20.
parametne identification. Biol. Cybernet 1987;56:111-20.
8. Cerutti S, Bersani V, Canara A, Liberati D. Analysis ofvisual evoked potentials through Wiener filtering appliedto a smail number of sweeps, J Biomed Engng 1987;9;3-12.
9. Demiralp T,Ademoglu A, Schürmann M., Canan B., Ba_arE. Detection of P300 waves in sinle trials by the wavelettransform CWT).Brain Lang, 1999;66:108-128.
10. Doyle DJ. Some comments on the use of Wiener fılteringfor the estimation of evoked potenlials. Electroencepha-logr Clin Neurophysiol 1975;38:533-34.
1ı. Ford JM, White P,Lim KO,Pfefferbaum A. Schizophrenicshave fewer and sınaller P300s: A single trial analysis. BiolPsychiat 1994;35:96-103.
12. Freeman WJ. The electrical activity of a primary sensorycortex: analysis of EEG waves, Int Rev Neurobiol1963;5:53-119.
13. Garoosi V,Jansen BH. Development and evaluation of thepiecewise Prony method for evoked potential analysis.IEEE T-BME2000;47:1549-1554.
(
39
14. Horowitz SM. Evoked activity of single units and neuralpopulations in the hippocampus of the cat.Electroencephal elin Neurophysiol 1972;32:227-240.
15. Jansen BH.Analysis of biomedical signals by means of lin-ear modeling. CRC Crit Rev Bioengng 1985;12:343-92.
16. Jansen BH, Bourne JR, Ward JW. Autoregressive estima-tion of short segment spectra for computerized EEGanalysis. lEEE T-BME1981;28:630·38.
i7. Jansen BH, Nyberg HN. Measuring the similarity betweentrajectories using elustering techniques. Chaos1993;43:i43-5i.
18. Jansen BH, Zouridakis G, Brandt ME. A neurophysiologi-cally based mathematical model of flash visual evokedpotentials. Biol. Cybern 1993;68:275-83.
19. Jansen BH, Rit VG.EEG and visual evoked potential gen-eration in a mathematical model of coupled corticalcolumns. Biol. Cybern 1995;73:357-66.
20. Jansen BH, , Kavaipatti AB, Markusson O. A model-basedapproach to evoked potential enhancement. Meth InformMed 2001; 40: 338-345.
21. Laskaris NA, Ioannides M. Exploratory data analysis ofevoked response single trials based on minimal spanningtree. Clin Neurophysiol 2000;112:698-712.
22. Liberati D, Bedarida L, Brandazza P, Cerutti S. A modelfor the cortico-cortical neural interaction in multisensory-evoked potentials. IEEE T-BME 1991;38:879-89.
23. McGillem CD, Aunon JI, Pomalaza CA. Improved wave-form estimation procedures for event related potentials.IEEE T-BME 1985;32:371-79.
24. Müller MM,Keil A, Kissler J, Gruber T. Suppression of theauditory middle-Iatency response and evoked gamma-band response in a paired-click paradigm. Exp Brain Res2001;136:474-479.
25. Prony GR Baron de. Essai Experimental et analytique: surles lois de la dilatabilite de fluides elastiques et sur cellesde la force expansive de la vapeur de l'eau et de la vapeurde I'alkool, ildifferentes temperatures. J l'Ecole Polytechi795;i:24-76.
26. Solomon G, Barford J. A new concept of vertex ERA andEEG analysis applying inverse filtering. Acta Otolar1977;83:200-10.
27. Thakor NV,Xin-Rong G, Yi-Chun S, Hanley DF. Multires-olution wavelet analysis of evoked potentials. IEEE T-BME1993;40:1085-1094.
28. Weerd JPC de. Facts and fancies about a posterieri"Wiener" filtering. IEEE T-BME1981;28:252-57.
29. Weerd JPC de. A posterieri time-varying filtering of aver-aged evoked potentials, ı. Introduction and conceptualbasis. Biol Cybern 1981;41:211-22.
30. Winterer G, Ziller M, Dorrı H, Frick K, Mulert C, WuebbenY,Herrmann WM,Coppola R. Sehizophrenia: reduced sig-nal-to-noise ratio and impaired phase-locking during infor-mation processing. Clin Neurophysiol2000;1I 1:837-849.
31. WoodyCD. Characterization of an adaptive filter for theanalysis of variable latency neuroeleetric signals. MedBiol Engng 1967;5:539-53.
32. Yao L, Sethares WA.Nonlinear parameter estimation viathe genetic algorithm. IEEE T-SP 1994;42:927-35.
40
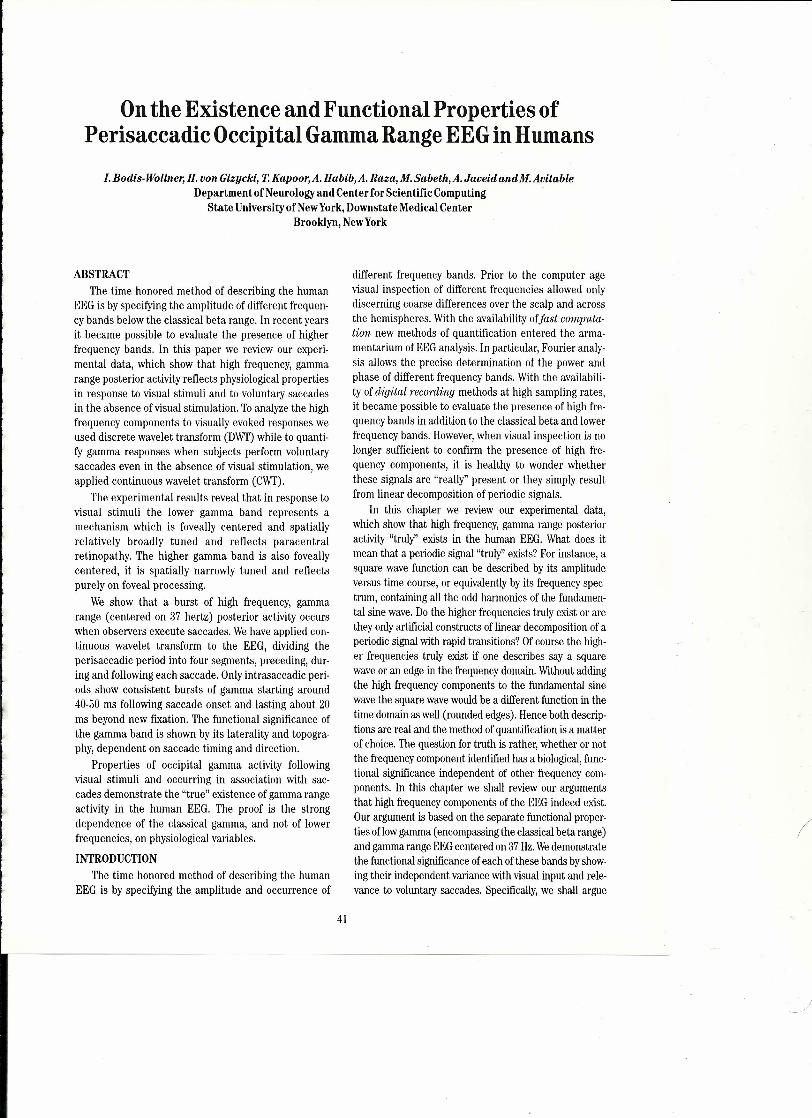
Onthe Existenee and Funetional Properties ofPerisaeeadie Oeeipital GammaRange EEGin Humans
I. Bodis-Wollner, H. von Gizycki, T.Kapoor, A. Habib, A. Raza, M. Sabeth,A. Javeid andM. AvitableDepartment ofNeurology and Centerfor Scientific Computing
State University of NewYork, Downstate Medical CenterBrooklyn, NewYork
ABSTRACTThe time honored method of describing the human
EEG is by specifying the amplitude of different frequen-cy bands below the classical beta range. In recent yearsit became possible to evaluate the presence of higherfrequency bands. In this paper we review our experi-mental data, which show that high frequency, gammarange posterior activity reflects physiological propertiesin response to visual stimuli and to voluntary saccadesin the absence ofvisual stimulation. Toanalyze the highfrequency components to visually evoked responses weused discrete wavelet transform (DWf) while to quanti-fy gamma responses when subjects perform voluntarysaccades even in the absence of visual stimulation, weapplied continuous wavelet transform (CWf).
The experimental results reveal that in response tovisual stimuli the lower gamma band represents amechanism which is foveally centered and spatiallyrelatively broadly tuned and reflects paracentralretinopathy. The higher gamma band is also foveallycentered, it is spatially narrowly tuned and reflectspurely on foveal processing.
We show that a burst of high frequency, gammarange (centered on 37 hertz) posterior activity occurswhen observers execute saccades. Wehave applied con-tinuous wavelet transform to the EEG, dividing theperisaccadic period into four segments, preceding, dur-ing and followirıgeach saccade. Only intrasaccadic peri-ods show consistent bursts of gamma starting around40-60 ms following saccade onset and lasting about 20ms beyond new fixation. The functional significance ofthe gamma band is shown by its laterality and topogra-phy, dependent on saccade timing and direction.
Properties of occipital gamma activity followingvisual stimuli and occurring in association with sac-cades demonstrate the "true" existence of gamma rangeactivity in the human EEG. The proof is the strongdependence of the classical gamma, and not of lowerfrequencies, on physiological variables.
INTRODUCTIONThe time honored method of describing the human
EEG is by specifying the amplitude and occurrence of
different frequency bands. Prior to the computer agevisual inspection of different frequencies allowed onlydiseerning coarse differences over the scalp and acrossthe hemispheres. With the availability ofjast computa-tion new methods of quantification entered the arma-mentarium ofEEG analysis. In particular, Fourier analy-sis allows the precise determination of the power andphase of different frequency bands. With the availabili-ty of digital recarding methods at high sampling rates,it became possible to evaluate the presence of high fre-quency bands in addition to the classical beta and lowerfrequency bands. However,when visual inspection is nolonger sufficient to confirm the presence of high fre-quency components, it is healthy to wonder whetherthese signals are "really" present or they simply resultfrom linear decomposition of periodic signals.
In this chapter we review our experimental data,which show that high frequency, gamma range posterioractivity "truly" exists in the human EEG. What does itmean that a periodic signal "truly" exists? For instance, asquare wave function can be deseribed by its amplitudeversus time course, or equivalently by its frequency spec-trum, containing all the odd harmonics of the fundamen-tal sine wave. Dothe higher frequencies truly exist or aretheyonly artifıcial constructs of linear decomposition of aperiodic signal with rapid transitions? Ofcourse the high-er frequencies truly exist if one deseribes say a squarewave or an edge in the frequency domain. Without addingthe high frequency components to the fundamental sinewave the square wavewouldbe a different function in thetime domainas well (rounded edges). Hence both descrip-tions are real and the method ofquantifıcation is amatterof choice. The question for truth is rather, whether or notthe frequency component identifıed has a biological,func-tional signifıcance independent of other frequency com-ponents. In this chapter we shall review our argumentsthat high frequency components of the EEGindeed exist.Our argument is based on the separate functional proper-ties oflowgamma (encompassing the classicalbeta range)and gammarange EEGcentered on 37Hz.Wedemonstratethe functional signifıcanceofeach ofthese bands byshow-ing their independent variance with visual input and rele-vance to voluntary saccades. Specifically,we shall argue
41
)
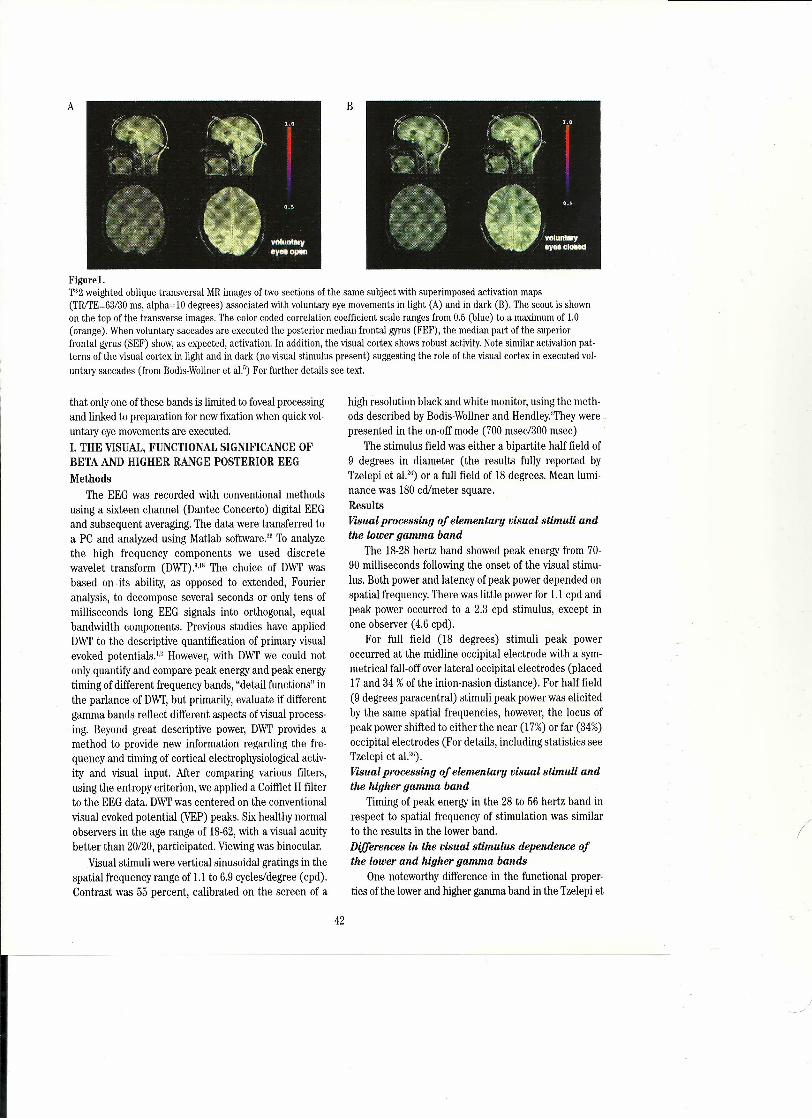
A B
Figure l.'1'*2weighted oblique transversal MRimages of two sections of the same subject with superimposed activation maps(TRtrE=63/30 ms, alpha- lü degrees) associated with voluntary eye movements in light (A) and in dark (B). The scout is shownon the top of the transverse images. The color coded correlation coefficient scale ranges from 0.5 (blue) to a maximum of 1.0(orange). When voluntary saccades are executed the posterior median frontal gyrus (FEF), the median part of the süperidrfrontal gyrus (SEF) show, as expected, activation. In addition, the visual cortex shows robust activity. Note similar activation pat-terns of the visual cortex in light and in dark (no visual stimulus present) suggesting the role of the visual cortex in executed vol-untary saccades (from Bodis-Wollneret al.") For further details see text.
that onlyone of these bands is limited to foveal processingand linked to preparation for new fıxation when quick vol-untary eye movements are executed.ı. THE VISUAL, FUNCTIONAL SIGNlFICANCE OFBETA AND HIGHER RANGE POSTERIOR EEGMethods
The EEG was recorded with conventional methodsusing a sixteen channel (Dantec Concerto) digital EEGand subsequent averaging. The data were transferred toa PC and analyzed using Matlab software," To analyzethe high frequency components we used discretewavelet transform (OWf).O.lS The choice of OWf wasbased on· its ability, as opposed to extended, Fourieranalysis, to decompose several seconds or only tens ofmilliseconds long EEG signals into orthogonal, equalbandwidth components. Previous studies have appliedOWf to the descriptive quantification of primary visualevoked potentials." However, with OWf we could notonly quantify and compare peak energy and peak energytiming of different frequency bands, "detail functions" inthe parlance of OWf, but primarily, evaluate if differentgamma bands reflect different aspects of visual process-ing. Beyond great descriptive power, OWf provides amethod to provide new information regarding the fre-quency and timing of cortical electrophysiological activ-ity and visual input. Af ter comparing various filters,using the entropy criterion, we applied a Coifflet II filterto the EEG data. OWf was centered on the conventionalvisual evoked potential (VEP) peaks. Six healthy normalobservers in the age range of 18-62, with a visual acuitybetter than 20/20, participated. Viewing was binocular.
Visual stimuli were vertical sinusoidal gratings in thespatial frequency range of 1.1 to 6.9 cycles/degree (cpd).Contrast was 55 percent, calibrated on the screen of a
high resolution black and white monitor, using the meth-ods deseribed by Bodis-Wollner and Hendley.They werepresented in the on-off mode (700 msec/300 msec)
The stimulus field was either a bipartite half field of9 degrees in diameter (the results fully reported byTzelepi et aP'I) or a full field of 18 degrees. Mean lu mi-nance was 180 cd/meter square.ResultsVisualprocessing of elementary visual stimuli andthe loıoergamma band
The 18-28 hertz band showed peak energy from 70-90 milliseconds following the onset of the visual stimu-lus. Both power and Iateney ofpeak power depended onspatial frequency. There was little power for 1.1 cpd andpeak power occurred to a 2.3 cpd stimulus, except inone observer (4.6 cpd).
For full field (18 degrees) stimuli peak poweroccurred at the midline occipital electrode with a sym-metrical fall-off over lateral occipital electrodes (placed17 and 34 % of the inion-nasion distance). For halffield(9 degrees paracentral) stimuli peak power was elicitedby the same spatial frequencies, however, the locus ofpeak power shifted to either the near (17%) or far (34%)occipital electrodes (For details, including statistics seeTzelepi et al.").Visualprocessing of elementary visual stimuli andthe higher gamma band
Timing of peak energy in the 28 to 56 hertz band inrespect to spatial frequency of stimulation was similarto the results in the lower band.Differences in the visual stimulus dependence ofthe lower and higher gamma bands
One noteworthy difference in the functional proper-ties of the lower and higher gamma band in the Tzelepi et
42
)
· 73 281.25 y: ·.77
20 ,a 8D 811 IDD 120 110 180 ıBO 2il[
Figure 2.The subject executed a single voluntary saccade over a dis-tance of 30 degrees from left to right of fıxation. The EOGtrace, reflecting eye movement velocity, is shown in the toptrace, while eye position, as recorded with the infraredreflection technique, is shown in the second trace, There is alü msec delay between EOG and eye position trace. Cursorswere placed to indicate a period of 78 msee encompassingthe new fıxation, but starting prior to arriving at the the newlixation aim. The next trace is recorded over the occiput,without any filtering. Recording sites were referred to a mid-frontal location, and in addition to a mastoid location. Thesubsequent two traces show the EEG recorded over the leftand right occiput, following eontinuous wavelet transform(CWI', see text). The rows showing 37 Hz centered aetivity inoccipital and parieto-occipital ehannels. The top row showsthe midline occipital recording, while the subsequent ehan-nels represerıt left alternaring with right-sided recording overnear and the n far oeciput, parieto-oceipital, parietal skull.The last ehannel represents the wavelet EEG reeorded overthe left oeciput with a different reference electrode. Note theasymmetıy particularly evident in the cursored period overthe left and right occiput. Color ecding represents waveletcoeffıeient magnitude (red =high, bluee low). For quantita-tive results see text. (After Bodis-Wollner et aI.2002')
al." study was that the response fell below no ise in five ofsix observers at lateral eleetrodes, suggesting that thehigher band is closely linked to foveal processing andreflects poorly on paracentral stimuli. This was true evenat the lowest spatial frequency, with known strong para-central representation in the cortical retinotopical map."
The most functionally important dillerence of lowerand Iıigher gamma band responses is their spatial fre-quency bandwidth selectivity. We' evaluated the spatialfrequency response cuıve of the two bands.(For statisticaldetails see Tzelepi et al." and Bodis-Wollner et al.') Theresults showed that power in the lower band peaks tobetween 1.1 and 2.3 cpd at the inion, while in the higherband it peaks to 4.6 cpd. Even more significantly, not onlypeak tuning differs, but spatial frequency bandwidth. Thelower band has a bandwidth of over one octave, while thehigher band has the remarkably narrow bandwidth of 0.15octave. All these differences between the simultaneouslyobtained responses in the lower and "classical" gammarange oscillatory responses may be therefore summarizedas such: both reflect fixational and spatial frequencyselective mechanisms, however, (a) the lower gammaband in vision represents a mechanism that is foveallycentered and spatially but relatively broadly and further-more reflects paracentral retinotopy, and (b) the highergamma band is alsa foveally centered; it is spatially nar-rowly tuned and reflects purely on foveal processing.IL THE ROLE OF THE FOVEAL GAMMA DURINGSACCADIC EYE MOVEMENTS
lt has been shown that the striate cortex is Iinked tovisual processing strategies associated with saccades,operating even without active visual input. Wer"ı;havestudied in 12 normal observers cortical activity associ-ated with voluntary saccades, using functional magnet-ic imaging (IMR!) with electro-oculograrn monitoring.The activity associated with bIinks was registered dur-ing the recording ofvoluntary saccades in the same ses-sion (alternating bIinks, sac cad es and rest).
The results showed that voluntary blinks are associat-ed with significant activation of the frontal (FEF) andsupplementary eye fields (SEF), the parietal eye field(PEF) and of the primary visual cortex. (Figure 1).Severalother subsequent studies show visual corticalchanges in association with saccades.":" However,whether occipital activity in association with saccadesoccurs prior to, during or following saccades is notrevealed by conventional fMRI studies. We thereforeexplored perisaccadic changes in the EEG, in particularthose in the higher frequencies. In the past several elec-trophysiological presaccadic signal changes have beenrecorded over the occipital cortex. An attenuation of twodifferent frequency bands of the EEG (alpha and somebeta) prior to visually triggered saccades is known. Higherthan 25Hz activity associated with voluntary saccades was
(
43
)
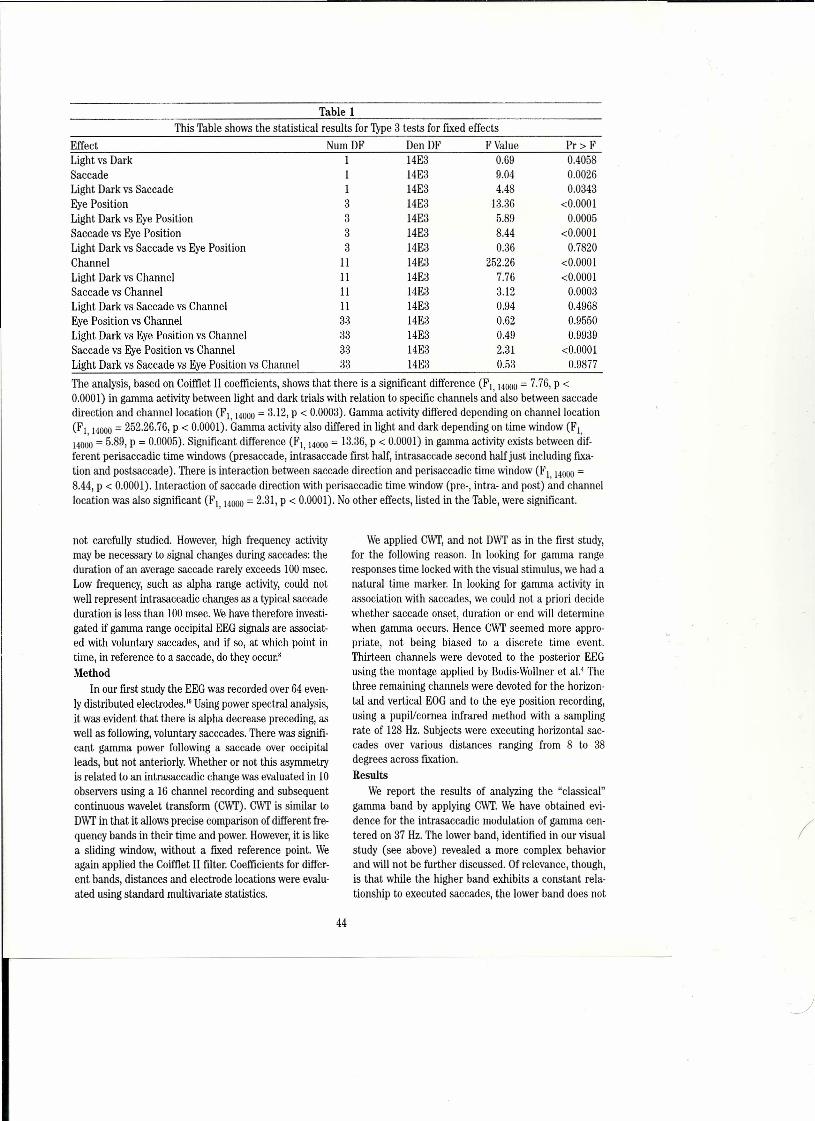
Table 1This Table shows the statistical results for 1YPe3 tests for fıxed effects
Effect Num DF Den DF F Value Pr> FLight vs Dark i 14E3 0.69 0.4058Saccade i 14E3 9.04 0.0026Light Dark vs Saccade i 14E3 4.48 0.0343Eye Position 3 14E3 13.36 <0.0001Light Dark vs Eye Position 3 14E3 5.89 0.0005Saccade vs Eye Position 3 14E3 8.44 <0.0001Light Dark vs Saccade vs Eye Position 3 14E3 0.36 0.7820Channel II 14E3 252.26 <0.0001Light Dark vs Channel II 14E3 7.76 <0.0001Saccade vs Channel II 14E3 3.12 0.0003Light Dark vs Saccade vs Channel II 14E3 0.94 0.4968Eye Position vs Channel 33 14E3 0.62 0.9550Light Dark vs Eye Position vs Channel 33 14E3 0.49 0.9939Saccade vs Eye Position vs Channel 33 14E3 2.31 <0.0001Light Dark vs Saccade vs Eye Position vs Channel 33 14E3 0.53 0.9877The analysis, based on Coifflet II coefficients, shows that the re is a significant difference (Fı 140110 = 7.76, P <0.0001) in gamma activity between light and dark trials with relation to specific channels and also between saccadedirection and channellocation (F, 14000 = 3.12, P < 0.0003). Gamma activity differed depending on channellocation(F i 14000 = 252.26.76, P < 0.0001). Gamma activity also differed in light and dark depending on time window (F i
140~ = 5.89, P = 0.0005). Significant difference (Fı, 14000 = 13.36, P < 0.0001) in gamma activity exists between rlif-ferent perisaccadic time windows (presaccade, intrasaccade first half, intrasaccade second half just including fıxa-tion and postsaccade). There is interaction between saccade direction and perisaccadic time window (Fı, 14000 =8.44, p < 0.0001). Interaction of saccade direction with perisaccadic time window (pre-, intra- and post) and channellocatio n was also significant (Fı, 14000 = 2.31, P < 0.0001). No other effects, listed in the Table, were significant,
not carefully studied. However, high frequency activitymay he necessary to signal changes during saccades: theduration of an average saccade rarely exceeds 100 msec.Low frequency, such as alpha range activity, could notwell represent intrasaccadic changes as a typical saccadeduration is less than 100msec. Wehave therefore investi-gated if gamma range occipital EEG signals are associat-ed with voluntary saccades, and if so, at which point intime, in reference to a saccade, do they occur,'Method
In our first study the EEGwas recorded over 64 even-ly distributed electrodes." Using power spectral analysis,it was evident that there is alpha decrease preceding, aswell as following, voluntary sacccades. There was signifi-cant gamma power following a saccade over occipitalleads, but not anteriorly. Whether or not this asymmetryis related to an intrasaccadic change was evaluated in LOohservers using a 16 channel recording and subsequentcontinuous wavelet transform (CWT). CWTis similar toDWTin that it allows precise comparison of different fre-quency bands in their time and power. However,it is likea sliding window, without a fıxed reference point. Weagain applied the Coifflet II fılter. Coefficients for differ-ent hands, distances and electrode locations were evalu-ated using standard multivariate statistics.
We applied CWT,and not DWTas in the first study,for the following reason. In looking for gamma rangeresponses time locked with the visual stimulus, we had anatural time marker. In looking for gamma activity inassociation with saccades, we could not apriori decidewhether saccade onset, duration or end will determinewhen gamma occurs. Hence CWTseemed more appro-priate, not being biased to a discrete time event.Thirteen channels were devoted to the posterior EEGusing the montage applied by Bodis-Wollner et al.' Thethree remaining channels were devoted for the horizon-tal and vertical EOG and to the eye position recording,using a pupil/cornea infrared method with a samplingrate of 128 Hz. Subjects were executing horizontal sac-cades over various distances ranging from 8 to 38degrees across fıxation.Results
We report the results of analyzing the "classical''gamma band by applying CWT.We have obtained evi-dence for the intrasaccadic modulation of gamma cen-tered on 37 Hz. The lower band, identified in our visualstudy (see above) revealed a more complex behaviorand will not be further discussed. Of relevance, though,is that while the higher band exhibits a constant rela-tionship to executed saccades, the lower band does not
44

reveal occipital saccadic modulation. What we havefound is a highly statistically significant difference ingamma over the leftand right occipital hemisphere pre-ceding the new fixation. Gamma synchronization startsabout 40 msec into the saccade and outlasts the newfixation. In Figure 2, one can see the results of a singletrial, showing the horizontal EOG, the eye positionrecording and the color coded output of the coefficientsover 13 channels for the 37 Hz component. Table 1shows the statistical significance of side-to-side differ-ence for the occipital leads for the 37 Hz component formultiple trials in 10 observers (seven saccades each).
DlSCUSSIONWe have recently shown (Tzelepi et al.") and
reviewed above the functional differences between sub-bands of high frequency brain wave activity in referenceto retinotopical representation in the visual cortex. Ourrecent results also show that high frequency activitymay be necessary to signal changes during saccades.The duration of an average saccade rarely exceeds ıoomsec, and our results show that gamma modulationoccurs for perhaps 60-70 msec. Low frequency, such asalpha range activity, is unlikely to represent intrasac-cadic changes. Consistent with earlier suggestions, ourhypothesis is that associated with saccades an occipitalgamma burst represents modulation of lateral intercon-nections in the visual cortex.
Gamma was first deseribed in multi un it recordingsin cats" and morıkeys," and it has received increasinglymore attention in human studies. Based on the originalsuggestions of W. Singer and colleagues,'!" it has be eninferred that binding of neuronal activity by a temporalcode is one effective way the cortex integrates distrib-uted activity, and thus gamma represents cortical activ-ity related to perception of closure" and binding ofvisu-al features.
Saccades (and blinks) occur continuously inhumans who are awake. Yet one is not aware either oftheir occurrence, or of a shift of the visual scene, duringsaccades or blanking out of vision during blinks. How,and which cortical mechanisms ensure visual stabilityassociated with saccades is stili unknown, even thoughmu ch has been learned in re cent years of saccade relat-ed receptive field changes of individual neurons in thefrontal and lateral parietal cortices. We have discoveredthat the occipital cortex, hitherto not thought to be partof the circuit participating in saccades is active in asso-ciation with voluntary saccades, even in the dark, in theabsence of visual input. Our electrophysiological datashow that at least during saccades, the occipital cortexis physiologically active. The properties of the intrasac-cadic gamma range EEG suggest that one of the func-tions of the occipital cortex is to prepare for the new fix-
ation. Whether this preparation represents the reorgan-ization of the connectivity of visuaIly responsiye neu-rons to alter their spatial summation properties orvisuo-spatial attention has not been evaluated by ourstudies. Nevertheless, saccade preparatory attention isunlikely to explain the results. A relationship betweensaccadic eye movements and spatial attention has beenalways seen as eminently reasonable. Over the lastdecades an increasing number of experiments and the-oretical models support the view of a direct connectionbetween them. One current theory postulates that thetrigger for saccades is a diserıgagement of attentionfrom a particular visual target, or lack of focus on a tar-get. In this view, once a new target emerges its locatio nis computed during a disengagement or unfocusedstage,":" the saccadic eye movement is triggered. Sinceour data show changes in gamma are initiated, follow-ing the saccade, this type of attention related explana-tion for the intrasaccadic gamma is not very likely.
The possible relationship of intrasaccadic gammachanges to perisaccadic changes in visual sensitivity ismore likely. Vision during, and for a short time prior toand following saccades'v'" is "suppressed." Based onexperimental evidence Ross, Morrone and Burr" andRoss et al." suggested that visibility of stimuli preferen-tially exciting "magnocellular" pathways is suppressed.The psychophysical evidence is consistent with the per-ceptual observation that when saccades bring the foveato a new target the objects in the seanpath do not appearto move. Ever since the pioneering concept of Helmholtz(1866) ır, the notion of "corollary discharge?" and"Reafferenzprinzip'" postuIate that the cortical organi-zation responsible for saccades generates signals prior tothe eye movement. The purpose of these signals is to pre-pare the visual cortices to caneel the shift of the visualframe and maintain stable perception. It has been sug-gested by Ross et aL.""" that the concept of selectiveattenuation of "magnocellular" signals provides a moreparsimonious explanation of perceptual stability duringsaccades, than cancellation due to the "corollary signal"does. Our data show that the occipital cortex generatesintrasaccadic sensory preparatory signals. if inde edgamma reflects interneuronal binding, as neurophysio-logical studies suggest, then our results may be inter-preted as representing short term (60-70 milliseconds)activity dependent plasticity in neuronal connectivity.
Irrespective of the explanation, however, taking intoconsideration the properties of occipital gamma activi-ty following visual stimuli and occurring in associationwith saccades demonstrates the "true" existence ofgamma range activity in the human EEG. The proof isthe strong dependence of the cIassical gamma, and notof lower frequencies, on physiological variables.
45
)

REFERENCESı. Ademoglu A, Micheli-Tzanakou E, Istefanopulos Y.
Analysis of pattern reversal visual evoked potentials(PRVEP's) by spline wavelets. IEEE Trans Biomed Engıo97; 44: 881-901.
2. Başar E, Demiralp 1', Schurmann M, Başar-Eroglu C,Ademoglu A. Oscillatory brain dynamics, wavelet analysis,and cognition. Brain Larıg 1999; 66: 146-183.
3. Bodis-Wollner I, Hendley CD. On the separability of twomechanisms involved in the detection of grating patternsin humans. J Physiology 1979; 291: 251-263.
4. Bodis-Wollner I, Mylin L, Frkovic S. The topography of theN70 component of the visual evoked potential in humans.In: Maurer K, (ed). Topographic Brain Mapping of EEGand Evoked Potentials. Berlin, Heidelberg: Springer-Verlag; 1989: 396-406.
5. Bodis-Wollner I, Bucher SF, Seelos KC, Paulus W, ReiserM, Oertel WH. Functional MRI mapping of occipital andfrontal cortical activity during voluntary and imaginedsaccades. Neurology 1997; 49: 416-420.
6. Bodis Wollner I, Bucher SF, Seelos KC. Cortical activationpatterns during voluntary blinks and voluntary saccades.Neurology 1999; 53: 1800-1805.
7. Bodis-Wollner I, Jiang D, Tzelepi A, Bezerianos T. Wavelettransform of the EEG reveals differences in low and highgamma responses to elementary visual stimuli. ClinElectroencephalogr 2001; 32: 139-144.
8. Bodis-Wollner I, von Gizycki M, Avitable Z, Hussain A,Javeid A, Habib A, Raza A, Sabet M. Perisaccadic eecipi-tal EEG changes quantified with wavelet analysis. Ann NYAcad Sci 2002; 956: 464-467.
9. Daubechies ı. The wavelet transform, time-frequencylocalization and signal analysis. IEEE Trans InformTheoıy 1990; 36: 961-1004.
10. Eckhorn R, Frien A, Bauer R, Woelbern 1', Kehr H. Highfrequency (60-90 Hz) oscillations in primary visual cortexof awake monkey. NeuroReport 1903; 4: 243-246.
lL. Engel AK, Koenig P, Kreiter AK,Schillen TB, and Singer W.Temporal coding in the visual cortex: new vistas on inte-gration in the nervous system. Trend Neurosci 1992; 15:218-226.
12. Fischer B, Weber H. Characteristics of 'anti' saccades. ExpBrain Res 1992; 89: 415-424.
13. Fischer B, Weber H. Express saccades and visual behavior.Brain Sci 1993; 16: 553-567.
14. Gray C, Singer W. Stimulus-specific neuronal oscillationsin orientation columns of cat visual cortex. Proc Natl AcadSci USA 1089; 86: 1698-1702.
15. Helmholtz HY. Handbuch der Physiologischen Optik. In:Southhall JPC, (ed). A Treatise on Physiological Optics1866. New York: Dover; 1986.
16. Latour PL. Vision during voluntary saccadic eye rnove-ments. Vision Research 1962; 2: 261-262.
17. Law I, Svarer C, Restrup E, Paulson O B. Parleto-occipitalcortex activation during self-generated eye movements inthe dark. Brain 1998; 121: 2189-2200.
18. Mallat S. A theory for multi-resolution signal decomposi-tion: the wavelet representation. IEEE Trans Pattern AnalMachine Intell1989; LL:674-693.
19. Mari Z, Mima 1', Gerloff C, Hallett M, Bodis-Wollner ı.Perisaccadic high frequency EEG changes in frontal andoccipital regions are similar in light and dark. J Physiol(London) 2000; 25S: 526.
20. Ross J, Morrone MC, Burr OC. Compression of visualspace before saccades. Nature 1997; 386: 598-601.
21. Ross J, Morrone MC, Goldberg E, Burr OC. Changes invisual perception at the time of saccades. Neuroscience2001; 24: 113-121.
22. Singer W.Synchronization of cortical activity and its puta-tive role in information processing and learrıing. AnnuRev Physiol1993; 55: 349-374.
23. Sperry RW.Neural basis of the optokinetic response pro-duced by visual inversion. J Comp Psych Physiol 1950; 43:482-489.
24. Tallon-Baudry C, Bertrand O, Delpuech C, Permier.Oscillatory gamma-band (30-70 Hz) activity induced by avisual search task in humans. J Neurosci 1997; 17:722-734.
25. Tootell R B H, Silverman M S, Hamilton S L, Switkes E, DeValois R L. Functional anatomy of macaque striate cortex.V.Spatial frequency. J Neurosci 1988; 8: 1610-1624.
26. Tzelepi A, Bezerianos 1',Bodis-Wollner ı. Functional proper-ties of sub-bands of oscillatoıy brain waves to pattern visualstimulation in man. Clin Neurophysiol 2000; 1LL:259-269.
27. Volkmann F. Vision during voluntary saccadic eye move-ments. J Opt Soc Am 1962; 52: 571-578.
28. Volkınann FC, Riggs LA, Moore RK. Eyeblinks and visualsuppression. Science 1980; 207: 900-902.
29. Von Holst E, Mittelstaedt H. Das Reafferenzprinzip.Naturwissenschaftenl950; 37: 464-476.
30. Wenzel R, Wobst P, Heekeren HH, Kwong KK, Brandt SA,Kohl M, Obrig H, Dirrıagl U, Villringer A. Saccadic sup-pression induces focal hypooxygenation in the occipitalcortex. J Cereb Blood Flow Metab 2000; 20: 1103-1110.
46
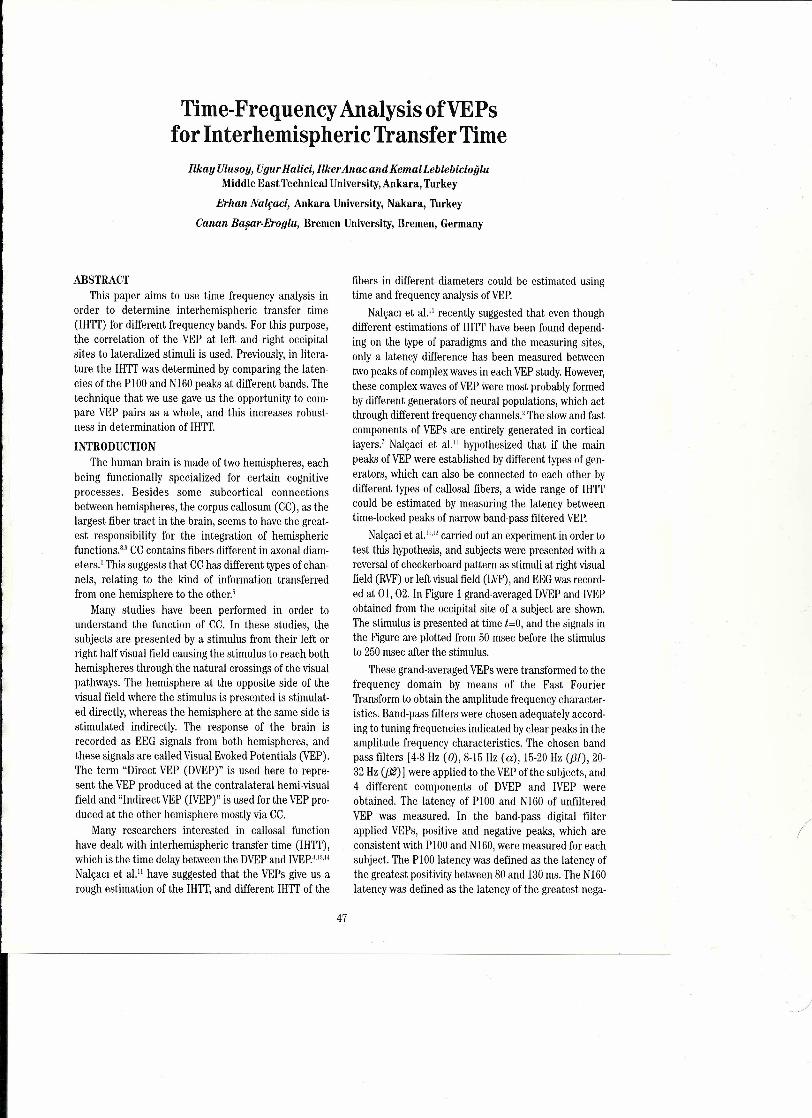
Time-Frequency Analysis ofVEPsfor Interhemispheric Transfer Time
Ilkay Ulusoy, Ugur Halid, Ilker AnacandKemalLeblebicioğluMiddle East Technical University, Ankara, Turkey
Erhan Nalçaci, Ankara University, Nakara, Turkey
Canan Başar-Eroqlu, Bremen University, Bremen, Germany
ABSTRACTThis paper aims to use time frequency analysis in
order to determine interhemispheric transfer time(IHTT) for different frequency bands. For this purpose,the correlation of the VEP at left and right occipitalsites to lateralized stimuli is used. Previously, in lite ra-ture the IHTTwas determined by comparing the laten-cies of the Plüü and N160peaks at different bands. Thetechnique that we use gave us the opportunity to com-pare VEP pairs as a whole, and this increases robust-ness in determination of IHTT.INTRODUCTION
The human brain is made of two hemispheres, eachbeing functionally specialized for certain cognitiveprocesses. Besides same subcortical connectionsbetween hemispheres, the corpus callosum (CC), as thelargest fiber tract in the brain, seems to have the great-est responsibility for the integration of hemisphericfunctions." CCcontains fibers different in axonal diam-eters.' This suggests that CChas different types of chan-nels, relating to the kind of information transferredfrom one hemisphere to the other."
Many studies have been performed in order tounderstand the function of CC. In these studies, thesubjects are presented by a stimulus from the ir left orright halfvisual field causing the stimulus to reach bothhemispheres through the natural crossings of the visualpathways. The hemisphere at the opposite side of thevisual field where the stimulus is presented is stimulat-ed directly, whereas the hemisphere at the same side isstimulated indirectly. The response of the brain isrecorded as EEG signals from both hemispheres, andthese signals are called Visual Evoked Potentials (VEP).The term "Direct VEP (DVEP)" is used here to repre-sent the VEP produced at the contralateral hemi-visualfield and "Indirect VEP (IVEP)" is used for the VEPpro-duced at the other hemisphere mostly via CC.
Many researchers interested in callosal functionhave dealt with interhemispheric transfer time (IHTT),which is the time delay between the DVEPand lVEP.:ı·I:ı,14Nalçacı et al." have suggested that the VEPs give us arough estimation of the IHTT,and different IHTTof the
fibers in different diameters could be estimated usingtime and frequency analysis of VEP,
Nalçacı et al." recently suggested that even thoughdifferent estimations of IHTThave been found depend-ing on the type of paradigms and the measuring sites,only a lateney difference has been measured betweentwo peaks of complex waves in each VEPstudy, However,these complex waves of VEPwere most probably formedby different generators of neural populations, which actthrough different frequency channels.' The slow and fastcomponents of VEPs are entirely generated in corticallayers.' Nalçaci et al." hypothesized that if the mainpeaks of VEPwere established by different types of gen-erators, which can also be connected to each other bydifferent types of callosal fibers, a wide range of IHTTcould be estimated by measuring the lateney betweentime-locked peaks of narrow barıd-pass filtered VEP,
Nalçaci et aL"'I' carried out an experiment in order totest this hypothesis, and subjects were presented with areversal of checkerboard pattern as stimuli at right visualfield (RVF)or left visual field (LVF),and EEGwas record-ed at OL, 02. In Figure 1 grand-averaged DVEPand lVEPobtained from the occipital site of a subject are shown,The stimulus is presented at time t=O, and the signals inthe Figure are plotted from 50 msec before the stimulusto 250msec after the stimulus.
These grand-averaged VEPswere transformed to thefrequency domain by means of the Fast FourierTransform to obtain the amplitude frequency character-istics. Barıd-pass filters were chosen adequately accord-ing to tuning frequencies indicated byclear peaks in theamplitude frequency characteristics. The chosen bandpass filters [4-8 Hz (8),8-15 Hz (a), 15-20Hz ((]]), 20-32 Hz (f32) ıwere applied to the VEPof the subjects, and4 different components of DVEP and IVEP wereobtained. The lateney of pıoo and N160 of unfilteredVEP was measured. In the band-pass digital filterapplied VEPs, positive and negative peaks, which areconsistent with PIOOand N160,were measured for eachsubject. The P100 Iateney was defined as the lateney ofthe greatest positivity between 80 and 130ms. The N160lateney was defined as the lateney of the greatest nega-
47
)
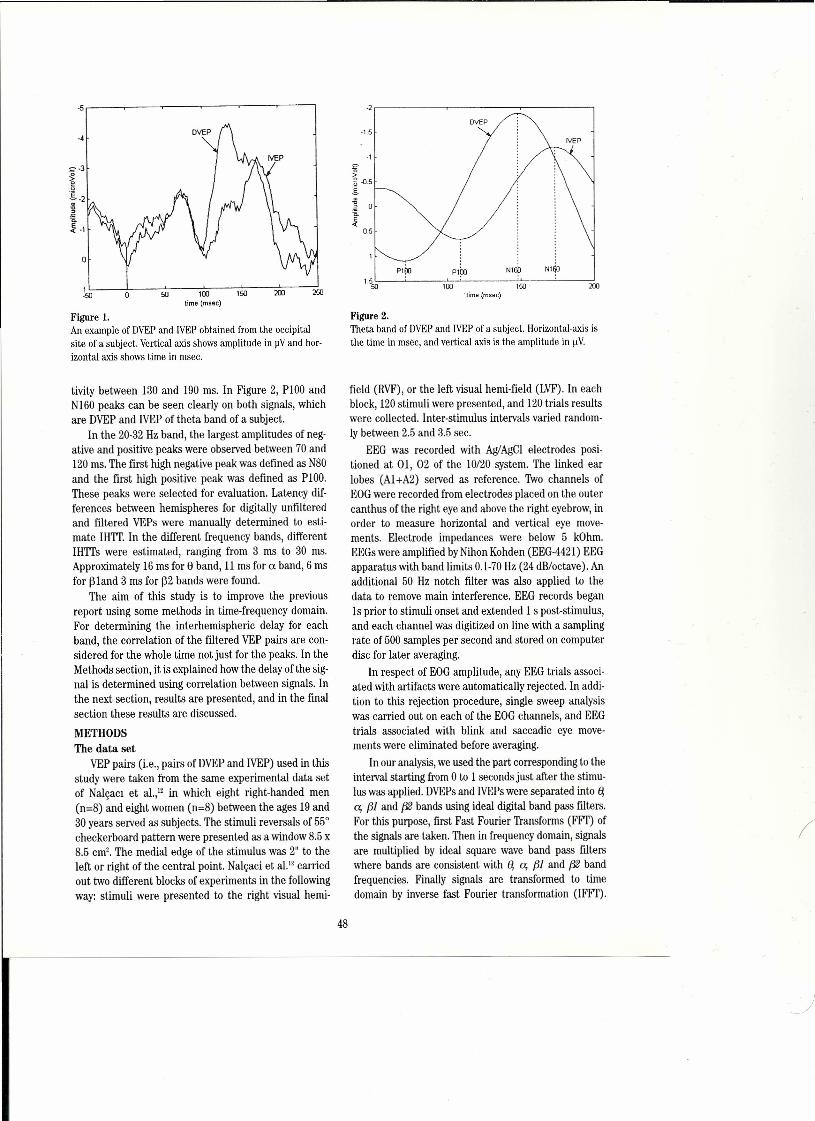
·5,---~--~-~-----r---'-----ı
·4
!~L---~O----~~=---~I00~--~I~~--~~~--~3U
time (msec)
Figure ı.An example of DVEPand !VEP obtained from the occipitalsite of a subject. Vertical aıds shows amplitude in pv and hor-izontal aıds shows time in msec.
tivity between 130 and 190 rns. In Figure 2, pıoo andN160 peaks can be see n c\early on both signals, whichare DVEP and lVEP of theta band of a subject.
In the 20·32 Hz band, the largest amplitudes of neg-ative and positive peaks were observed between 70 and120 ms. The first high negative peak was defined as N80and the first high positive peak was defined as PI00.These peaks were selected for evaluation, Latency dif-ferences between hemispheres for digitally unfilteredand filtered VEPs were manually determined to esti-mate IHIT. In the different frequency bands, differentIHTrs were estimated, rarıging from 3 ms to 30 ms.Approximately 16 ms for e band, II ms for o band, 6 msfor ~land 3 ms for ~2 bands were found.
The aim of this study is to improve the previousreport using some methods in time-frequency domain.For determining the interhemispheric delay for eachband, the correlation of the filtered VEP pairs are co n-sidered for the whole time notjust for the peaks. In theMethods section, it is explained how the delay of the sig-nal is determined using correlation between signals, Inthe next section, results are presented, and in the finalseetion these results are discussed,
METHODSThe data set
VEP pairs (i.e., pairs ofDYEP and lVEP) used in thisstudy were taken from the same experimental data setof Nalçacı et al.," in which eight right-handed men(n=8) and eight women (n=8) between the ages 19 and30 years served as subjects. The stimuli reversals of 55 o
checkerboard pattern were presented as a window 8.5 x8.5 cm'. The medial edge of the stimulus was 2" to theleft or right of the central point. Nalçaci et al. 12 carriedout two different blocks of experiments in the followingway: stimuli were presented to the right visual hemi-
·2 ,---------~----------~--------...,
·1
Pl(JJ NI6(J
·1.5
~u -0.5:§.
] o
t0.5
PlfXl1.5
soL----'-------'I00.,-i-------'-'ISO-----'------.Jıoo
·ıime(msec)
Figure 2.Theta barıd of DVEPand [VEPof a subject. Horizontal-axis isthe time in msec, and vertical aıds is the amplitude in ~ıV.
field (RVF), or the left visual hemi-field (LVF). In eachbloek, 120 stimuli were presented, and 120 trials resultswere collected. Inter-stimulus intervals varied random-Iy between 2.5 and 3.5 see.
EEG was recorded with Ag/AgCI electrodes posi-tioned at OL, 02 of the 10/20 system. The linked earlobes (Al +A2) served as reference. Two channels ofEOG were recorded from electrodes placed on the outercanthus of the right eye and above the right eyebrow, inorder to measure horizontal and vertical eye move-ments, Electrode impedances were below 5 kOhm.EEGs were amplified by Nihon Kohden (EEG-4421) EEGapparatus with band limits 0.1-70 Hz (24 dB/octave). Anadditional 50 Hz notch filter was also applied to thedata to remove main interference. EEG records beganls prior to stimuli on set and extended 1 s post-stimulus,and each channel was digitized on line with a samplingrate of 500 samples per second and stored on computerdisc for later averaging,
In respect of EOG amplitude, any EEG trials associ-ated with artifacts were automatically rejected. In addi-tion to this rejection procedure, single sweep analysiswas carried out on each of the EOG channels, and EEGtrials associated with blink and saccadic eye move-ments were eliminated before averaging.
In our analysis, we used the part corresponding to theinterval starting from O to 1 seconds just after the stimu-lus was applied. DYEPs and IVEPs were separated into f:!~ {31 and f32 bands using ideal digital band pass filters.For this purpose, first Fast Fourier Transforms (FFT) ofthe signals are taken. Then in frequency domain, signalsare multiplied by ideal square wave band pass filterswhere bands are consistent with e, ~ {31 and f32 bandfrequencies. Finally signals are transformed to timedomain by inverse fast Fourier transformation (lFFT).
48
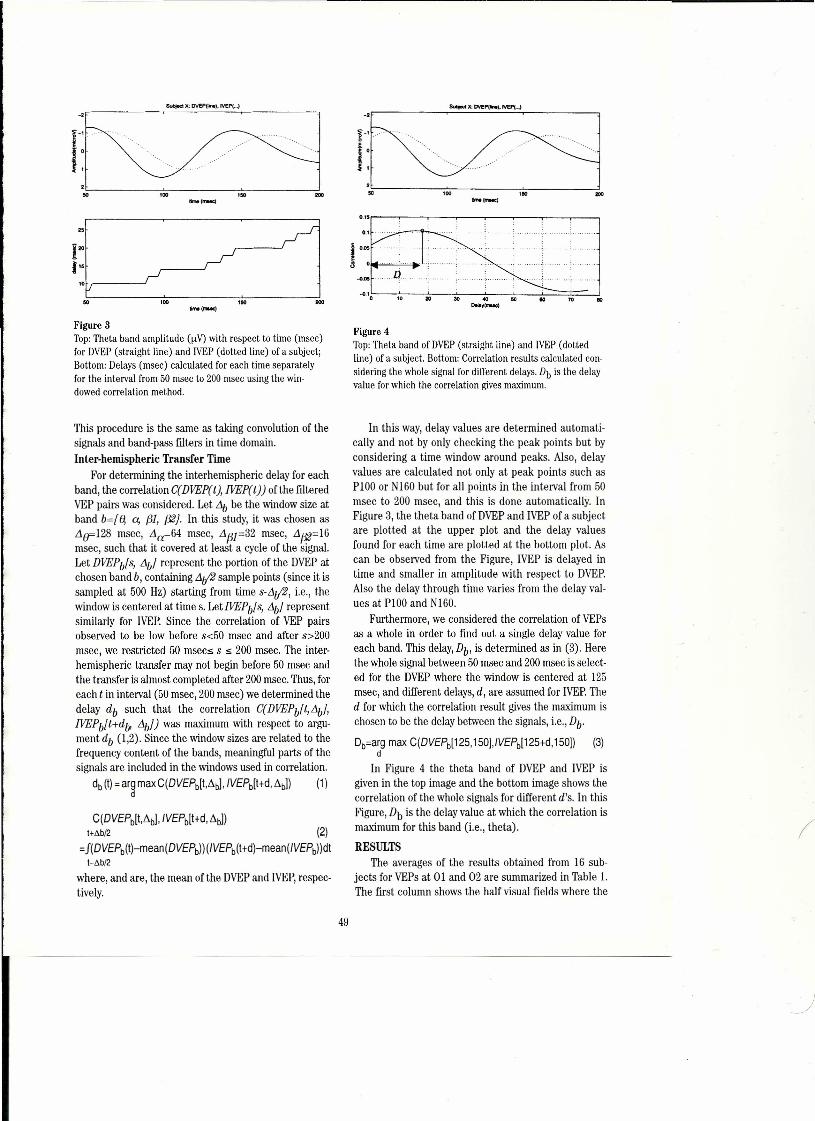
sutı;ed x; DVEP(1ioe). JVePI.·.)
-'~'r·· ············ .~ i ". '.
2~ 00 ~ _.•...1..-
ı~l r: /i~ 100 i~-1..-
Figure 3Top: Theta band amplitude (uv) with respect to time (msec)for DVEP(straight line) and IVEP (dotted line) of a subject;Bottom: Delays (msec) calculated for each time separatelyfor the interval from 50 msec to 200 msec using the win-dowed correlation method.
This procedure is the same as taking convolution of thesignals and barıd-pass filters in time domain.lnter-hemispheric Transfer Time
For determining the interhemispheric delay for eachband, the correlation C(DVEP(t), IVEP(t)) ofthe filteredVEP pairs was considered. Let ı1b be the window size atband b={ e, ~ f31, f32j. In this study, it was chosen ası1e=128 msec, ı1a=64 msec, ı1f31=32 msec, ı1f32=16msec, such that it covered at least a cycle of the signa!.Let DVEPbfs, ı1bl represent the portian of the OVEPatchosen band b, containing ı1i/2 sample points (since it issampled at 500 Hz) starting from time s-ı1i/2, i.e., thewindow is centered at time s. LetIVEPbfs, !J.blrepresentsimilarly for IVEP. Since the correlation of VEP pairsobserved to be law before s<50 msec and after s>200msec, we restricted 50 msecs s s 200 msec. The inter-hemispheric transfer may not begin before 50 msec andthe transfer is almost completed after 200msec. Thus, foreach t in interval (50 msec, 200 msec) we determined thedelay db such that the correlation C(DVEPbft,ı1bl'IVEPbft+dlJı ı1bJ) was maximum with respect to argu-ment db (1,2). Since the window sizes are related to thefrequency content of the bands, meaningful parts of thesignals are included in the windows used in correlatiorı.
db (I) = arg max C(DVEPb[I,~J, IVEPb[ltd, ~b]) (1)d
C(DVEPb[I,~b].IVEPb[ltd, ~b])l+öb/2 (2)
=J(DVEPb (I)-mean (DVEPb)) (IVEPb(1 td)-mean( IVEPb) )dll-öb12
where, and are, the mean of the OVEPand lVEP,respec-tively.
Figure 4Top:Theta band of DVEP(straight line) and lVEP (dottedline) of a subject. Bottom: Correlation results calculated con-sidering the whole signal for different delays. Db is the delayvalue for which the correlation gives maximum.
In this way, delay values are determined automati-cally and not by only checking the peak points but byconsidering a time windowaround peaks. Alsa, delayvalues are calculated not only at peak points such asP100 or N160 but for all points in the interval from 50msec to 200 msec, and this is done automatically. InFigure 3, the theta band of OVEPand lVEP of a subjectare plotted at the upper plot and the delay valuesfound for each time are plotted at the bottom plot. ABcan be observed from the Figure, IVEP is delayed intime and smailer in amplitude with respect to OVEP.Alsa the delay through time varies from the delay val-ues at pıoo and N160.
Furthermore, we considered the correlation of VEPsas a whole in order to find out a single delay value foreach band. This delay, Db, is determined as in (3). Herethe whole signal between 50 msec and 200msec is select-ed for the OVEPwhere the window is centered at 125msec, and different delays, d, are assumed for IVEP.Thed for which the correlation result gives the maximum ischosen to be the delay between the signals, i.e.,Db'
Db=arg max C(DVEPb[125,150j,IVEPb[125td,150]) (3)d
In Figure 4 the theta band of OVEP and IVEP isgiven in the top image and the bottom image shows thecorrelation of the whole signals for different d's. In thisFigure, Db is the delay value at which the correlation ismaximum for this band (i.e., theta).
RESULTSThe averages of the results obtained from 16 sub-
jects for VEPs at OL and 02 are summarized in Table ı.The first column shows the half visual fields where the
49
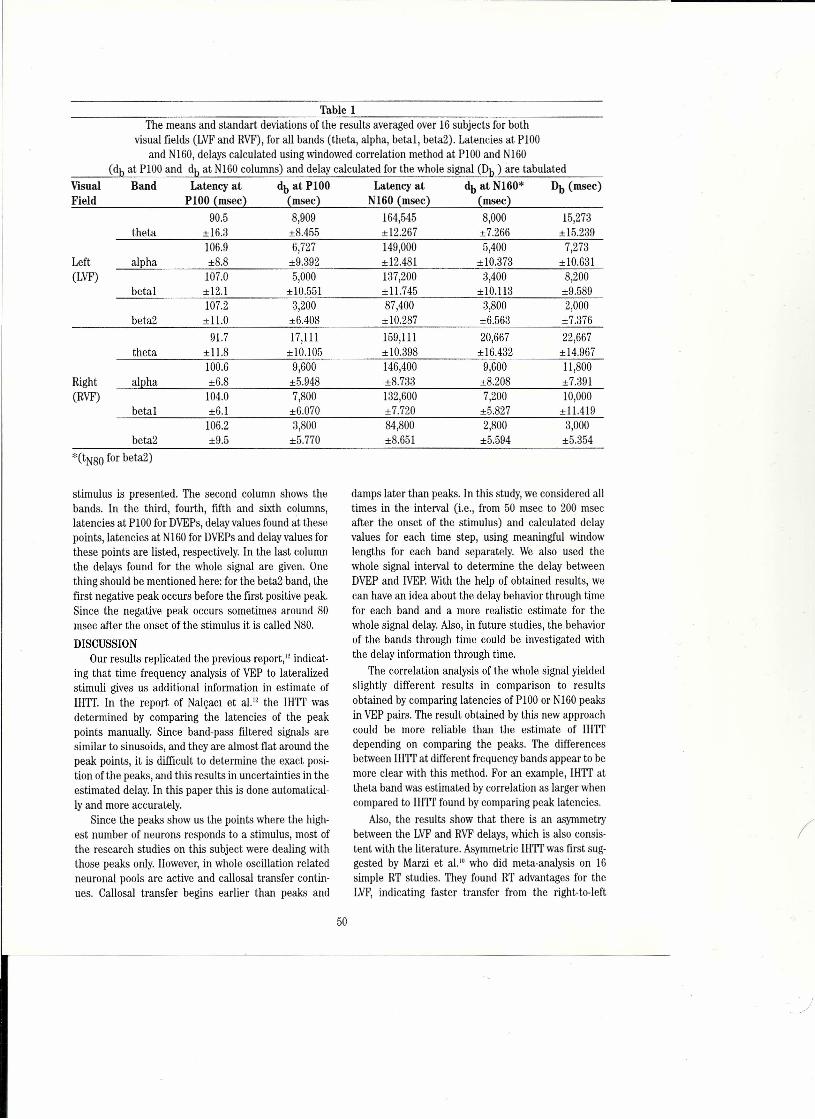
Table iThe means and standart deviations of the results averaged over 16 subjects for both
visual fields (LVFand RVF), for all bands (theta, alpha, betal, beta2). Latencies at PIOOand N160, delays calculated using windowed correlation method at PIOOand NI60
(db at PI00 and db at N160 columns) and delay calculated for the whole signal (Db) are tabulatedVisualField
Band Latencyat db at PIOO Latencyat db at N160* Db (msec)PIOO (msec) (msec) NI60 (msec) (msec)
15,273±15.239theta
90.5 8,909 164,545 8,000+ 16.3 +8.455 +12.267 +7.266106.9 6,727 149,000 5,400+8.8 ±9.392 +12.481 + 10.373Left
(LVF)alpha
7,273±10.631
107.0 5,000 137,200 3,400+12.1 +10.551 +11.745 +10.113betal
8,200±9.589
107.2 3,200 87,400 3,800±11.0 ±6.408 + 10.287 +6.563beta2
2,000±7.376
theta91.7 17,111 159,111 20,667
±11.8 ±10.105 + 10.398 +16.43222,667
±14.967100.6 9,600 146,400 9,600+6.8 +5.948 +8.733 +8.208Right
(RVF)alpha
11,800±7.391
104.0 7,800 132,600 7,200±6.1 ±6.070 ±7.720 ±5.827betal
10,000±11.419
beta2106.2 3,800 84,800 2,800±9.5 ±5.770 ±8.651 ±5.594
3,000±5.354
*(tN80 for beta2)
stimulus is presented. The second column shows thebands. In the third, fourth, fıfth and sixth columns,latencies at PIOOfor DVEPs,delayvalues found at thesepoints, latencies at N160 for DVEPsand delay values forthese points are listed, respectively. In the last columnthe delays found for the whole signal are giverı, Onething should be mentioned here: for the beta2 band, thefirst negative peak occurs before the first positive peak.Since the negative peak occurs sometimes around 80msec after the onset of the stimulus it is called N80.DlSCUSSION
Our results replicated the previous report," indicat-ing that time frequency analysis of VEP to lateralizedstimuli gives us additional information in estimate ofIHTT. In the report of Nalçacı et al." the IHTT wasdetermined by comparing the latencies of the peakpoints manually. Since band-pass filtered signals aresimilar to sinusoids, and theyare almost fiat around thepeak points, it is diffıcult to determine the exact posi-tion of the peaks, and this results in uncertainties in theestimated delay, In this paper this is done automatical-Iy and more accurately.
Since the peaks show us the points where the high-est number of neurons responds to a stimulus, most ofthe research studies on this subject were dealing withthose peaks only. However, in whole oscillation relatedneuronal pools are active and callosal transfer contin-ues. Callosal transfer begins earlier than peaks and
damps later than peaks. In this study, we considered alltimes in the interval (i.e., from 50 msec to 200 msecafter the onset of the stimulus) and caJculated delayvalues for each time step, using meaningful windowlengths for each band separately. We also used thewhole signal interval to determine the delay betweenDVEP and lVEP.With the help of obtained results, wecan have an idea about the delay behavior through timefor each band and a more realistic estimate for thewhole signal delay. Also, in future studies, the behaviorof the bands through time could be investigated withthe delay information through time.
The correlation analysis of the whole signal yieldedslightly different results in comparison to resultsobtained by comparing latencies of PIOOor N160 peaksin VEP pairs. The result obtained by this new approachcould be more reliable than the estimate of IHTTdepending on comparing the peaks. The differencesbetween IHTTat different frequency bands appear to bemore clear with this method. For an example, IHTT attheta band was estimated by correlation as larger whencompared to IHTTfound by comparing peak Iatencies.
Also, the results show that there is an asymmetrybetween the LVFand RVFdelays, which is also consis-tent with the literature. Asymmetric IHTTwas first sug-gested by Marzi et al." who did meta-analysis on 16simple RT studies. They found RT advantages for theLVF, indicating faster transfer from the right-to-Ieft
50

hemisphere than from the left-to-right, Meta-analysts ofVEP-IHIT by Brown et al.' supported this report ofMarzi, indicating the similar directionally asymmetrictransmission. Our study supported the previous findingsabout asymmetric callosal transfer, indicating fastertransfer from the right hemisphere to the left.
REFERENCESı. Aboitiz F, Sc he ibe 1AB, Fisher RS, Zaidel E. Fiber com po-
si tion of the human corpus callosum. Brain Res 1992; 598:143-153.
2. Başar E. EEG-dynamics and evoked potentials in serısoryand cognitive processing by the brain. In: Başar E (ed).Dynamics of Sensoıy and Cognitive Processing by theBrain. Berlin: Springer; 1988: 30-55.
3. Brown WS, Jeeves MA. Bilateral visual field processingand evoked potential inter-hemispheric transmissiontime. Neuropsychologia 1993; 31: 1267-1281.
4. Brown WS, Larson EB, Jeeves MA. Directional asymme-tries in interhemispheric transmission time: evidencefrom visual evoked potentials. Neuropsychologia 1994; 32:439-448.
5. Clarke JM, Zaidel E. Anatomical-behavioural relation-ship s: corpus callosum morphometry and hemispheriespecialization. Behav Bl' Res 1994; 64: 185-202.
6. Davidson RJ, Saron C.. Evoked potential measures ofinterhemispheric transfer time in reading disabled andnormal boys. Develop Neuropsychology 1992; 22: 353-364.
7. Ducati A, Fava E, Motti ED F. Neuronal generaters of thevisual evoked potentials: intracerebral recording inawake humans. Electroencephalogr CLin NeurophysiolUJ88; 71: 89-99.
In this study, our main aim was to perform delay cal-culation for a long period of time automatically, and thiswas successful. In future studies, we plan to do the sameanalysis with more subjects and to understand thebehavior of delay through time for each band andbehavior of delay among bands.
8. Hoptman MJ, Davidson RJ. How and why do two cerebralhernispheres interact? Psychol Bull1994; 116: 195-219.
9. Innocenti GM, Aggound-Zouaouni D, Lehman P. Cellularaspects of callosal connections and their development.Neuropsychologia 1995; 33: 961-987.
10. Marzi CA, Bisiacchi P, Nicoletti R. Is interhernispherictransfer of visuomotor information asynımetric? A meta-analysis. Neuropsychologia 1991; 29: 1163-1177.
1i. Nalçacı E, Başar-Eroğlu C, Stadler M. Visual evoked poten-tial interhernispheric transfer time in different frequencybands. Clin Neurophysiol1999; 110: 71-81.
12. Nalçacı E, Başar-Eroğlu C, Stadler M. VEP-interhemi-spheric transfer time in 20-32 Hz band in man.NeuroReport 1999; ın 3105-3109.
13. Rugg MD, Lines CR, Milner AD. Visual evoked potentialsto lateralized stimuli and the measurement of interhemi-spheric transmission time. Neuropsychologia 1984; 22:215-225.
14. Saron CD, Davidson RJ. Visual evoked potentials meas-ures of interhemispheric transfer time in humans. BehavNeurosci 1989; 103: 1115-1138.
51
)
Properties ofMultistable PerceptionDuringLongTermEEG Recordings
Ümmuhan Işoğlu-Alkaç, istanbul University, çapa-istanbul, TurkeyCananBaşar-Eroğlu, Bremen University, Bremen, Germany
ABSTRACTIn previous studies, we showed that a positive wave
appeared approximately 250 ms prior to the button pressof the subjects, indicating the perceptual reversal duringthe observation of the Necker cube figure. The most dom-inant features in the delta and alpha band were found torepresent the perceptual reversal related positivity. Inthe present study, we aim to analyze the changes in thealpha frequency band during the perceptual reversal byusing the Necker cube paradigm during long term EEGrecordings. After the determination of the IndividualAlpha Frequency (lAF), the properties of the alpha activ-ity have been measured in three alpha sub-bands: Lower-1 alpha (6-8 Hz), lower-2 alpha (8- LOHz) and upper alpha(10-12 Hz). The Root Mean Square (RMS) values of thealpha frequency band were measured for two time peri-ods: ±3 SD around the mean peak lateney of the percep-tual reversal related positivity and a time window of thesame length before the perceptual reversal related posi-tivity. We obtained the behavioral properties of the alphapower during the long term EEG recordings by using themultistable perception paradigm.
INTRODUCTIONSince Berger's" discovery of the alpha blocking
response, several investigators assumed alpha activityto be generated in the visual cortex as an idling rhythmof the visual cortex, because it is blocked by opening theeyes.II.14,18,ıo.:\J.:ı:ı,:If;
Alpha desynchronization probably is the best knownphenomenon in the human electroencephalograph.Event-related desynchronization or ERD coined byPfurtscheller and Aranibar" is deseribed as the attenu-ation or blocking within the alpha and the other fre-quency bands. ERD was observed during visual stimula-tion, voluntary movement and cognitive activity by sev-eral investigators. Recent research on event-relatedchanges in alpha band power suggests that desynchro-nization in the alpha frequency range is associated withactive information processing. and that different alphafrequencies have quite different functions.v"
Because of outstanding features of the alpha fre-quency band, many researchers have assumed thatalpha may play a key role in understanding other EEGphenomena. For the alpha range, a variety of functional
correlates have be en found, some of which appear inthe following classification (extending a previous ver-sion by Galambos"; by Başar!"; Başar et a1.4: 1) Thealpha rhythm is more than just a spontaneous rhythm.It is the prototype of spontaneous brain rhythms.According to Başar et al.," it is a prototype of a dynamicprocess that governs a large ensemble of integrativebrain functions. 2) Alpha patterns can be induced, i.e.,initiated by, but not closely time-locked to a stimulus."3) Alpha patterns can be evoked, i.e., precisely time-locked to a stimulus. 4) Alpha patterns can be rnove-ment-related and also rnemory-related," 5) Finally, alphapatterns can be emitted. Well trained subjects emittedtime-locked bursts of alpha band energy for up to a fullsecond before the delivery of an expected target, Thealpha locking to the future moment, when a target wiU bedelivered, is robust and statisticaUy significant,"
Reversible or ambiguous figures Iike the Neckercube make up a well known class of visual phenomena,leading to spontaneous alternations between differentstable percepts or interpretations without a physicalchange of the stimulus." In previous studies, the corre-lates of the perceptual reversibility from one stable tothe other was found related to the alpha and delta fre-quency bands.',"·II;.17.4'
The aim of the present study is to test the relation-ship between the perceptual reversal related positivityand the alpha desynchronization on the sub-bands ofalpha range by applying the Necker cube as a multi-stable figure during the long term EEG recordings.
METHODSubjects
Fifteen healthy, right-handed volunteers participat-ed in this study. Subjects were eight men and sevenwomen ranging in age from 21 to 31 years. They werepsychology students and members of the university. Allsubjects had normal or corrected vision, and none ofthem had neurological disorders. They were instructedto keep their eyes open and to maintain fixation all thetime, to minimize blinking and eye movements.Stimulus pattern
We used a reversible Necker cube as stimulus duringthe recording time (Figure 1). The stimulus was contin-uously projected on a computer monitor for a time peri-
53

Figure ı.The stimulus paradigm:ambiguous Necker cube. "O"indicates the fixation point.
od of 400 see. The line length of the outline cu be was 10cm. The viewing distance was 150 cm, and visual anglewas 3.81 deg. The stimulus was presented as white lineson a black background.Experimental procedure
The subjects sat in a soundproof and echo-free room,which was dimly lit. They were informed about the per-ceptual reversal of the Necker cube. The subjects wereinstructed to look at the fixation point all the time and.to press a button immediately Iollowing reversa!. Theyindicated the onset of the perceptual reversal by shortlyand slightly pressing down their right index finger, thusbreaking a contact impinging on one channel of theEEG-wciter. An additional electromyographic (EMG)recording was carried out in order to estimate the con-tribution of the motor potentials to the main recording,Electrophysiological recording
The EEG was registered at recording sites Fz, Cz, Pz,and üz according to the International 10/20 System.Linked earlobe electrodes served as a reference. All elec-trode impedances were maintained at less than 5 kühm.The electrooculogram (EüG) was also registered fromrnedial upper and lateral orbital rim of the right eye. TheEEG was amplified by means of a Nihon Kohden (EEG4421 G) apparatus with band limits at 0.1-70 Hz (24dB/octave). An additional notch filter (36 dB/octave) wasalso applied to remove the main interferences. For therecording of EüG, the time constant was set at 0.3 seeand a low pass filter at 70 Hz were applied. All channelswere displayed on paper and on-line by monitor scope inorder to observe both single trials and averaged trials.The EEG was digitized with a sampling rate of 256points/s and stored on computer disc memory. Each but-ton press was also recorded as a simple on-off signal onone EEG channe!. Furthermore, the EMG was recordedfrom the right forearm, which served as trigger point forthe data analysis. The recording time was about a hun-dred minutes with 2000 sweep number.Data analysis
To eliminate muscle and eye movement artifacts,manual off-line selective averaging procedure wasapplied. Then the remaining epochs were averagedtime-Iocked to the onset of the finger movement. Themean number of the sweeps af ter artifact eliminationwas between 800-1000 for each recording. The number
of sweeps was equalized from the artifact-free sweepsas 800 sweeps for each subject.
For each subject the peak frequency of the domi-nant EEG frequency in the alpha band for all recordingssites was used as an anehor point. The mean IndividualAlpha Frequency (lAF) was dermed as the mean fre-quency calculated over the entire EEG epochs of eachsubject individually."> Table 1 shows the mean fre-quency windows averaged over the entire sample of 15subjects as well as the values for the subjects with thehighest and the lowest lAF. The frequency windows hada standard bandwidth of 2 Hz and were the same for allof the subjects.v-' Three alpha frequency sub-bandswith a bandwidth of 2 Hz each were defined by usinglAF as the individual anehor po int: (IAF-4) to (lAF-2),(IAF-2) to LAF and lAF to (IAF+2), termed lower-1alpha (6-8 Hz), lower-2 alpha (8-10 Hz) and upper-alpha(10-12 Hz). Averaged over the entire sample ofsubjects,lAF was 10.37 Hz (see Table 1).2~,2r•
The mean latencies of the perceptual reversal relatedpositivity (261.41 ± 60.9 ms) were measured on the aver-age sweeps to determine the Iateney ranges where alphapower changes related with the perceptual reversalshould be measured. The RMS values of the alpha fre-quency band were computed on the average sweeps forthree alpha frequency sub-bands; termed lower- 1 alpha(6-8 Hz), lower-2 alpha (8-10 Hz) and upper-alpha (10-12Hz). This procedure was applied for two time periods: ±3SD around the mean peak Iateney (261.41 ± 60.9 ms) ofthe perceptual reversal related positivity (t2: 440-80 msbefore button press), and a time window of the samelength before the time window of the perceptual reversalrelated positivity (tl: 800-440 ms before button press)was used for this purpose.Statistical analyses
Statistical analyses were carried out on the alphaRMS values of the averaged sweeps by multivariateanalysis ofvariance (MANÜVA) test for repeated meas-ures with three factors (frequency, period-effect of per-ceptual reversal, channe!).
RESULTSFigure 2 shows the grand averages of the artifact-
free sweeps of all subjects recorded from Fz, Cz, Pz andüz channels. The averages of the artlfact-free sweepsshowed a positive wave approximately 250 ms prior tothe finger movement of the subjects marking the on setof the perceptual reversa!.
Figure 3 shows the properties of the broad range ofalpha power (6-12 Hz) in the lateney range of the per-ceptual reversal-related positivity recorded from the Fz,Cz, Pz and Üz channels of a representative subject. itcan be clearly observed that the alpha desynchroniza-tion occurs in a precise temporal relation with the per-ceptual reversal related positivity.
54
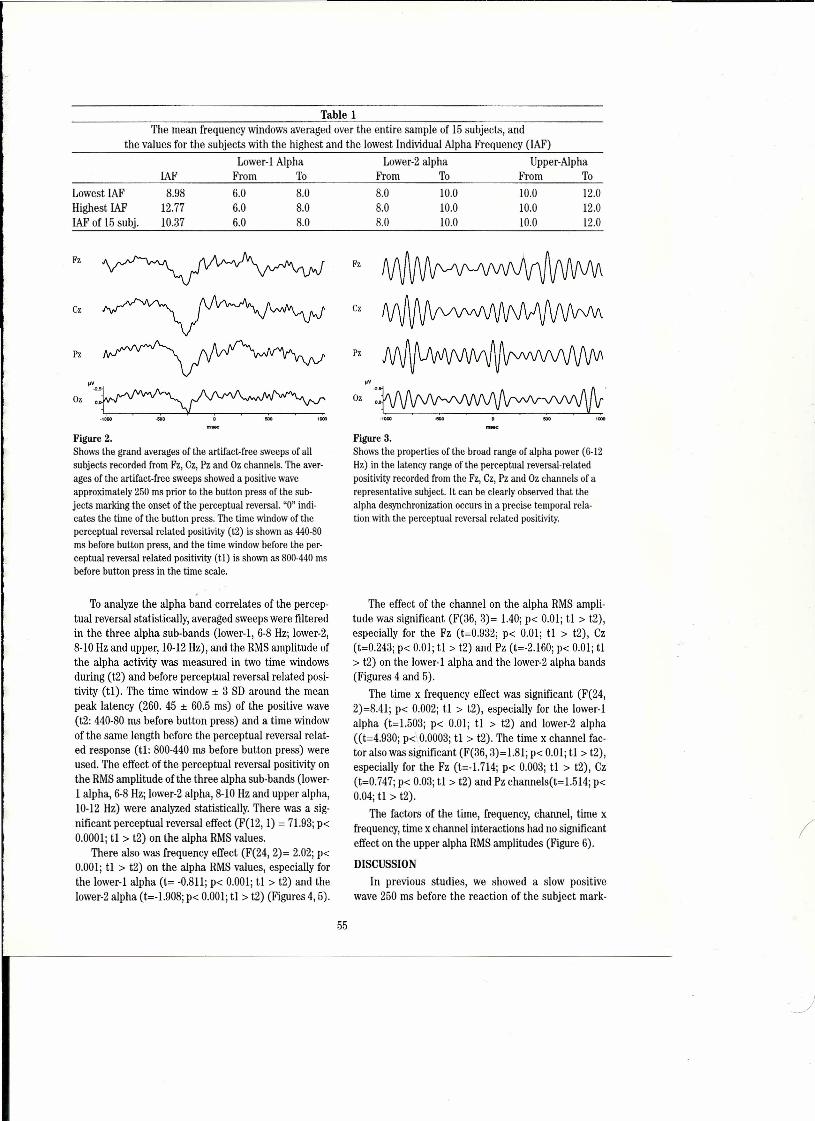
Table 1The mean frequency windows averaged over the entire sample of 15 subjects, and
the values for the subjects with the highest and the lowest Individual Alpha Frequency (LAF)
LAFLower-l Alpha Lower-2 alpha Upper-Alpha
From To From To From ToLowest LAFHighest LAFLAFof 15 subj.
8.9812.7710.37
6.0 8.0 8.0 10.0 10.0 12.06.0 8.0 8.0 10.0 10.0 12.06.0 8.0 8.0 10.0 10.0 12.0
Fz
Cz
pz
Oz 'v.:·,000.,;00 l5DO 1000
Figure 2.Shows the grand averages of the artlfact-free sweeps of allsubjects recorded from Fz, Cz, Pz and Üz channels. The aver-ages of the artlfact-free sweeps showed a positive waveapproximately 250 ms prior to the button press of the sub-jects marking the onset of the perceptual reversal. "O"indi-cates the time of the button press. The time window of theperceptual reversal related positivity (t2) is shown as 440-80ms before button press, and the time window before the per-ceptual reversal related positivity (tl) is shown as 800-440msbefore button press in the time scale.
To analyze the alpha band correlates of the percep-tual reversal statistically, average d sweeps were filteredin the three alpha sub-bands (lower-I, 6-8 Hz; lower-2,8-10 Hz and upper, 10-12Hz), and the RMS amplitude ofthe alpha activity was measured in two time windowsduring (t2) and before perceptual reversal related posi-tivity (tl). The time window ± 3 SO around the meanpeak lateney (260. 45 ± 60.5 ms) of the positive wave(t2: 440-80 ms before button press) and a time windowof the same length before the perceptual reversal relat-ed response (tl: 800-440 ms before button press) wereused. The effect of the perceptual reversal positivity onthe RMS amplitude of the three alpha sub-bands (lower-1 alpha, 6-8 Hz; lower-2 alpha, 8-LOHz and upper alpha,10-12 Hz) were analyzed statistically. There was a sig-nificant perceptual reversal effect (F(12, 1) = 71.93;p-c0.0001; tl > t2) on the alpha RMS values.
There also was frequency effect (F(24, 2)= 2.02; p-c0.001; tl > t2) on the alpha RMS values, especially forthe lower-I alpha (t= -0.811; p-c 0.001; tl> t2) and thelower-2 alpha (t=- 1.908;p<Ü.OOl;tl > t2) (Figures 4,5).
Fz
Cz
pz
'vOZ: >
Ftgure 3.Shows the properties ofthe broad range of alpha power (6-12Hz) in the lateney range of the perceptual reversal-relatedpositivity recorded from the Fz, Cz, Pz and Üz channels of arepresentative subject. It can be clearly observed that thealpha desynchronization occurs in a precise temporal rela-tion with the perceptual reversal related positivity.
The effect of the channel on the alpha RMS ampli-tude was significant (F(36, 3)= 1.40; p-c 0.01; tl > t2),especially for the Fz (t=0.932; P< 0.01; tl > t2), Cz(t=0.243; p-c 0.01; tL > t2) and Pz (t=-2.l60; p-c 0.01; tL> t2) on the lower- 1 alpha and the lower-2 alpha bands(Figures 4 and 5).
The time x frequency effect was significant (F(24,2)=8.41; p-c 0.002; tL > t2), especially for the lower-Ialpha (t=1.503; p-c 0.01; tl > t2) and lower-2 alpha((t=4.930; p<.,0.0003; tl > t2). The time x channel fac-tor also was significant (F(36,3)=1.81; p< 0.01; tl> t2),especially for the Fz (t=-1.714; p-c 0.003; tl > t2), Cz(t=0.747; p-c 0.03; tl > t2) and Pz channelstte l.ô ld; p-c0.04; tl > t2).
The factors of the time, frequency, channel, time xfrequency, time x channel interactions had no signifıcanteffect on the upper alpha RMS amplitudes (Figure 6).
DlSCUSSIONIn previous studies, we showed a slow positive
wave 250 ms before the reaction of the subject mark-
55
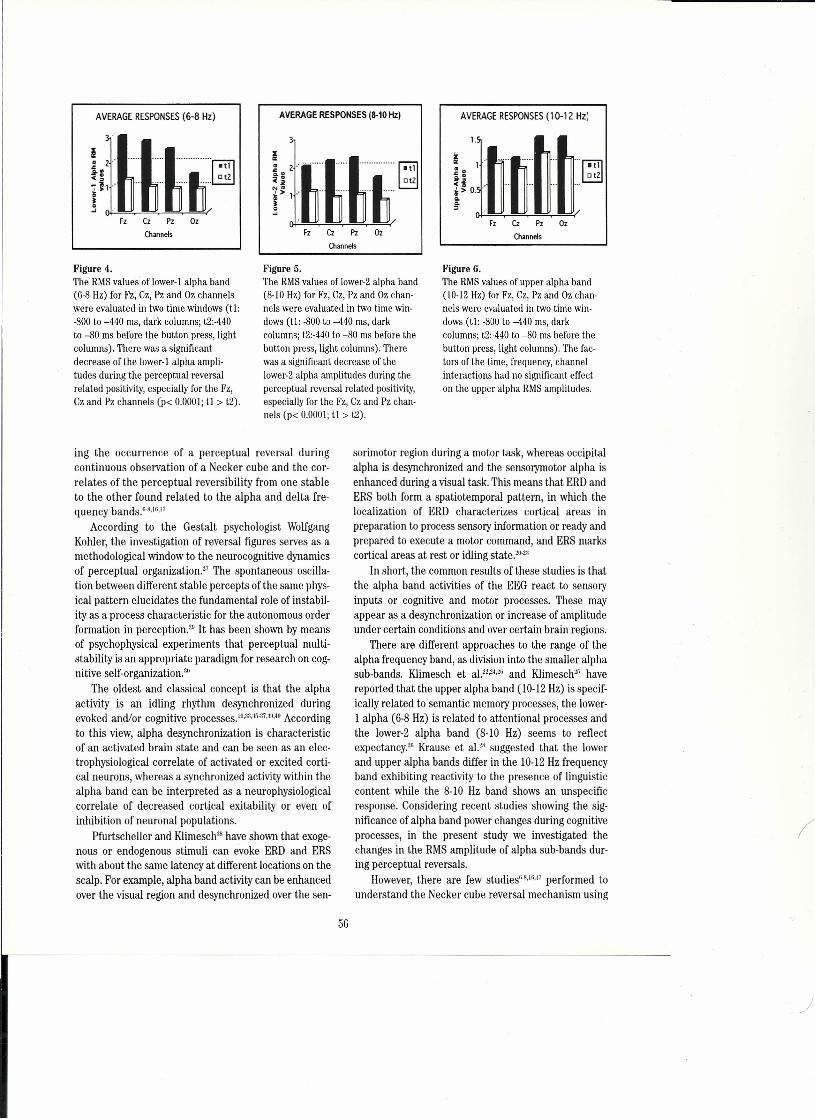
AVERAGE RESPONSES (6-8 Hz)
Fz Cz pz Oz
Chonnels
AVERAGE RESPONSES (8-10 Hz)
Figure 4.The RMSvalues of lower-l alpha band(6-8 Hz) for Fz, Cz, Pz and üz ehannelswere evaluated in two time windows (tl:-800 to -440 ms, dark eolumns; t2:-440to -80 ms before the button press, lighteolumns). There was a signifieantdecrease of the lower-l alpha ampli-tudes during the perceptual reversalrelated positivity, espeeially for the Fz,Cz and Pz channels (p-c 0.0001; tL > t2).
Fz Cz pz üz
Channels
Figure 5.The RMSvalues of lower-2 alpha band(8-10 Hz) for Fz, Cz, Pz and üz chan-nels were evaluated in two time win-dows (tl: -800 to -440 ms, darkcolumns; t2:-440 to -80 ms before thebutton press, light eolumns). Therewas a significant decrease of thelower-2 alpha amplitudes during theperceptual reversal related positivity,especially for the Fz, Cz and Pz chan-nels (p-c 0.0001; tL > t2).
ing the occurrence of a perceptual reversal duringcontinuous observation of a Necker cube and the cor-relates of the perceptual reversibility from one stableto the other found related to the alpha and delta fre-quency bands.'-8,1.,11
According to the Gestalt psychologist WolfgangKohler, the investigation of reversal figures serves as amethodological window to the neurocognitive dynamicsof perceptual organization." The spontaneous oscilla-tion between different stable percepts of the same phys-ical pattern elucidates the fundamental role of instabil-ity as a process characteristic for the autonomous orderformation in perception." it has been shown by meansof psychophysical experiments that perceptual multi-stability is an appropriate paradigm for research on cog-nitiye self-organization."
The oldest and classical concept is that the alphaactivity is an idling rhythm desynchronized duringevoked and/or cognitive processes.IIı;I:I,:v,-:lı,:ııl,411Accordingto this view, alpha desynchronization is characteristicof an activated brain state and can be seen as an elec-trophysiological correlate of activated or excited corti-cal neurons, whereas a synchronized activity within thealpha band can be interpreted as a neurophysiologicalcorrelate of decreased cortical exitability or even ofinhibition of nemünal populations,
Pfurtscheller and Klimesch'" have shown that exoge-nous or endogenous stimuli can evoke ERD and ERSwith about the same latency at different locations on thescalp. For example, alpha band activity can be enhancedover the visual region and desynchronized over the sen-
AVERAGE RESPONSES (10-12 Hz;
Fz ez Pz Oz
Chonnels
Pigure 6.The RMSvalues of upper alpha band(10-12 Hz) for Fz, Cz, Pz and üz chan-nels were evaluated in two time win-dows (tL: -800 to -440 ms, darkcolumns; t2:-440 to -80 ms belere thebutton press, light columns). The fac-tors of the time, frequency, channetinteractions had no significant effecton the upper alpha RMSamplitudes.
sorimotor region during a motor task, whereas occipitalalpha is desynchronized and the sensorymotor alpha isenhanced during a visual task. This means that ERDandERS both form a spatiotemporal pattern, in which thelocalization of ERD characterizes cortical areas inpreparation to process sensory information or ready andprepared to execute a motor command, and ERS markscortical areas at rest or idling state."?'
In short, the common results of these studies is thatthe alpha band activities of the EEG react to sensoryinputs or cognitive and motor processes, These mayappear as a desynchronization or increase of amplitudeunder certain conditions and over certain brain regions.
There are different approaches to the ran ge of thealpha frequency band, as division into the smaller alphasub-bands. Klimesch et aL'2,'4"I;and Klimesch" havereported that the upper alpha band (l0- 12 Hz) is specif-ically related to semantic memory processes, the lower-1 alpha (6-8 Hz) is related to attentional processes andthe lower-2 alpha band (8-10 Hz) seems to reflectexpectancy," Krause et al." suggested that the lowerand upper alpha bands differ in the 10-12Hz frequencyband exhibiting reactivity to the presence of linguisticcontent while the 8-ıo Hz band shows an unspecificresponse, Considering recent studies showing the sig-nificance of alpha band power changes during cognitiveprocesses, in the present study we investigated thechanges in the RMSamplitude of alpha sub-bands dur-ing perceptual reversals.
However, there are few studies'<'?" performed tounderstand the Necker cube reversal mechanism using
56
the EEG measurements. The alpha range we use coversthe whole alpha band (6-12 Hz), which allows us toobserve the most general characteristics of Neckercube phenomenon. In the second step, the featuresobserved in the broad alpha range were investigated inthe alpha sub-bands as lower-l alpha, lower-2 alphaand upper alpha.
Our findings indicate that a significant decrease ofthe alpha amplitude during perceptual reversal relatedpositivity was obtained when compared with other partsof the recordings, where subjects observed the same pat-tern but no reversal occurred. Additionally, the desyn-chronization effect of the perceptual reversal increasedsignificantly on the lower-l alpha and lower-2 alpha sub-bands, especially for the Fz, Cz and Pz channels.
According to Başar et al.,' a unique frequency com-ponent is generally not sufficient to find the exact elec-trical correlation of brain function. With general inter-pretation it can be said: different cognitive processesare reflected by band power changes in different fre-quency bands over localized regions in the brain. Thechange of two different sub-bands of alpha range mightbe attributed to two different sub-processes underlyingperceptual reversal related positivity.
Our findings indicate that the slow positivity isaccompanied by wide-spread alpha desynchronizationduring perceptual reversal. There is a relationshipbetween the behavior of perceptual reversals and alphafrequency sub-bands of the ERP during the lorıg termEEG recordings by using the Necker cube. This com-
REFERENCES
ı. Başar E. EEG-Brain dynamics: relation between EEG andbrain evoked potentials. Amsterdam: Elsevier; 1980.
2. Başar E. Brain natural frequencies are causal factors forresonanees and induced rhythrns. In: Başar E, Bullock TH,(eds). Induced Rhythms in the Brain. Boston, Basel,Berlin: Birkhauser; 1992.
3. Başar E, Başar-Eroglu C, Parnefjord R, Rahn E, SchurmannM. Evoked potentials: ensembles of brain indueed rhyth-micities in the alpha, theta and gamma ranges. In: Başar E,Bullock TH (eds). Induced Rhythms in the Brain. Boston,Basel, Berlin: Birkhauser; 1992: 155-181.
4. Başar E, Schurmann M, Başar-Eroglu C, Karakas S. Alphaoscillations in brain Iunctioning: an integrative theoıy. IntJ Psychophysiol lüüz; 26: 5-29.
5. Başar E. Functional alphas selectively distributed in thebrain-A theory, In: Başar E, (ed). Brain Function andOscillations. II. Integrative Brain Funetion. Neurophysiol-ogy and Cognitive Processes. Berlin: Springer-Verlag;W99: 331-35ı.
pound reactivity in both the lower-l alpha and lower-2alpha frequency bands, which could attribute to thepresence of a cognitive process, is not affected byfatigue after such long term recording sessions.
Cognitive processes may influence brain processes.It is often asked how this might be possible without vio-lating the physical conservation laws. The commonhypothesis is that the mental effort influences the brainactivity at the moment when it is in a highly unstablestate. Multistable stimuli offer the possibility to investi-gate visual awareness, since they evoke spontaneousalternations between different perceptual interpreta-tion s of the same stimulus. In the present study, weused the Necker cube as a multistable figure and com-pared the properties of the perceptual reversals timewindow with the other parts of the recordings. Our find-ings indicate that the desynchronization effect of theperceptual reversal increased significantly on thelower-l alpha and lower-2 alpha sub-bands. This prop-erty of the alpha desynchronization may reflect aprocess of destabilization of the actual percept until aswitch of visual awareness occurs.
ACKNOWLEDGMENTSThe authors would like to thank Prof. Dr. Erol Başar
for his critical comments and suggestions and to thankProf. Dr. Tamer Demiralp for his permission to use hisdata processing system.
This work was supported by The Research Fund ofThe University of Istanbul, Project number: B-977/1605200 ı.
6. Başar-Eroglu C, Struber D, Stadler M, Kruse P.Multistablevisual perception induces a slow positive EEG wave. Int JNeurosci 1993j 73: iseısı.
7. Başar-Eroglu C, Struber D, Stadler M, Kruse P, Greitschus,F. Slow positive potentials in the EEG during multistablevisual perception. In: Kruse P, Stadler M, (eds). Ambiguityin Mind and Nature. Multistable Cognitive Phenomena.Berlin: Springer-Verlag; 1995: 391-340.
8. Başar-Eroglu C, Struber D, Kruse P, Başar E, Stadler M.Frontal gamma band erıhancement during multistablevisual perception. Int J Psychophysicl Iüüô; 24: 113-125.
9. Berger H.Uber das Elektroenkephalogramm des Menschen.iMitteilung Arch Psychiatr Nervenkr 1929j 87: 527-570.
10. Brarıdt M.Visual and auditery phase resetting ofthe alphaEEG. Int J Psychophysiol lüü'i; 26: 285-298.
iı. Chatrian GE, Petersen MC, Lazarete JA. The blocking ofthe rolandic wicket rhythm and some central changesrelated to movement. Electroencephalogr Clin Neuro-physiol 1959j LL:497-510.
57
)

12. Cohen D. Magnetoeneephalography: evidenee of magnetiefield produeed by alpha rhythm eurrents. Seienee 1968;161: 784-786.
13. Creutzfeldt OD, Watanabe S, Lux HD. Relations betweenEEG phenomena and potentials of single cortical cells. ı.Evoked responses arter thalamic and epicortical stimula-tion. Electroencephalogr Clin Neurophysiol 1966;20: 1-18.
14. Creutzfeldt OD, Rosina A, ıto M, Probst W.Visual evokedresponse of single cells and of EEG in primary visual areaof the cat. J Neurophysiol 1969;32: 127·139.
15. Galambos ll. A comparison of certain gamma band (40·Hz) brain rhythms in eat and man. In: Başar E, BulloekTH, (eds). Induced Rhythms in the Brain. Boston, Basel,Berlin: Birkhauser; 1992.
16. lsoglu-Alkac U, Başar-Eroglu C, Ademoglu A, Demiralp T,Miener M, Stadler M. Analysis of the EEG activity duringthe Necker cube reversals by means of the WaveletTransform (WT). Riol Cyberrı 1998; 79: 437·442.
17. Isoglu-Alkac U, Başar-Eroglu C, Ademoglu A, Demiralp T,Miener M, Stadler M. Alpha activity decreases during theperception of Neeker cube reversals: an application ofwavelet transform. Biol Cybern 2000; 82: 313-320.
18. Jasper HH, Penfield W.Electrocorticograrns in man: effectof the voluntary movement upon the electrical activity ofthe precentral gyrus, Arch Psyehiat Z Neurol 1949; 183:163-174.
19. Kaufrnan L, Schwarz B, Salustri C, Williamson S.Modulation of spontaneous brain activity during mentalimagery, J Cogn Neurosci 1990; 2: 124·132.
20. KIimesch W, Doppelmayer M, Pachinger T, Russegger H.Everıt-related desynchronization in the alpha band andthe processing of semantic information. Brain Res CognBrain Hes 1997a; 6: 83·94.
21. Klimesch W, Doppelmayr M, Schimke H, Ripper B. Thetasynchronization and alpha desynchronization in a memo-11' task. Psychophysiology 1997b; 34: 169-176.
22. KIimesch W, Doppelmayr M, Pachinger T, Russegger H.Event-related desynchronization in the alpha band andthe processing of semantic information. Brain Res CognBrain Res1997c; 6: 83-94.
23. KIimesch W. EEG alpha rhythms and memory processes.In: Başar E, Hari R, Lopes da Silva FH, Schurmann M,(eds). Brain Alpha Activity-New Aspects and FunctionalCorrelates. Int J Psychophysiol 1997; 26: 319-340.
24. KIimesch W, Doppelmayr M, Russegger H, Pachinger T,Sehwaiger J. Induced alpha band power changes in thehuman EEG and attention. Neurosci Lett 1998;244: 73-76.
25. KIimeseh W.EEG alpha and theta oscillations reflect cog-nitiye and memory performance: a reviewand analysis.Brain Res Cogn Brain Res 1999; 29: 169-195.
26. KIimesch W,Doppelmayr M,Röhm D, Pöllhuber D, StadlerW. Simultaneous desynchronization and synchronizationof different alpha responses in the human electroen-eephalograph: a neglected paradox? Neurosci Lett 2000284: 97-100.
27. Kohler W. Dynamics in Psychology, New York: Liveright;1940.
28. Krause CM, Porn B, Lang AH, Laine M. Relative alphadesynchronization and synchronization during speechperception. Brain Res Cogn Brain Res 1997;5: 296·299.
29. Kruse P,Stadler M, Struber D. Psychological moditicationand synergetic modelling of perceptual oscillations. In:Haken H, Stadler M, (eds), Synergetics of Cognition.Berlin: Springer 1991:299-311.
30. Kruse P, Struber D, Stadler M.The signiflcance of percep-tual multistability for research on cognitive self-organiza-tion. In: Kruse P, Stadler M, (eds). Arnbiguity in Mind andNature, Multistable Cognitive Phenomena. Berlin:Springer; 1995:69·84.
31. Lopes da Silva FH, Van Lierop THMT,Schrijer CF, Stormvan Leeuwen W. Organization of thalamic and corticalalpha rhythms: spectra and coherences. Electro-encephalogr Clin Neurophysiol 1973;35: ü2(j·ü39.
32. Lopes da Silva FH. Neural mechanisms underlying brainwaves: from neural membranes to networks. Electro-enceph Clin Neurophysiol W91; 79: 81·93.
33. Lopes da Silva FH, Pijn JP, Velis D, Nijssen PCG. Alpharhythms: noise, dynamics and models, Int J Psychophysiol1997;26: 237-249.
34. Necker LA. Observations on some remarkable phenome-non which occurs on viewing a figure of a crystal or geo-metrieal solid. The London and Edinburgh PhilosophiealMagazine and J Science 1832;3: 329·337.
35. Niedermeyer E. The normal EEG of the waking adult. In:Niedermeyer E, Lopes da Silva FH, (eds). Electroen-cephalography: Basic Prineiples, Clinical Applicationsand Related Fields. Baltimore, MD: Williams & Wilkins;1993: 131-152.
36. Niederrneyer E. Alpha rhythms as physiological andabnormal phenomena. Int J Psychophysiol 1997; 26: 5·29.
37. Pfuıtscheller G, Aranibar A. Event-related cortical desyrı-chronization detected bypower measurements of scalp EEG.Electroencephalogr Clin Neurophysiol1977; 42:817-826.
38. Pfurtscheller G, KIimesch W. Event-related desynchro-nization and desynchronization of alpha and beta wavesin a cognitive task. In: Başar E, Bullock TH, (eds).Induced Rhythms in the Brain. Boston, Basel, Berlin,Birkhauser; 1992.
39. Regan D. Same eharaeteristic of average steady-state andtransient responses evoked by modulated light. Elec-troencephalogr Clin Neurophysiol 1966;20: 238-248.
40. Regan D. Human Brairı Electrophysiology: EvokedPotentials and Evoked Magnetic Fields in Science andMedicine. Amsterdam: Elsevier; i!lSD.
41. Struber D, Başar-Eroglu C, Hoff E, Stadler M. Reversal-rate dependent differences in the EEG gamma-band dur-ing multistable visual perception. Int J Psychophysiol2000; 38: 243-52.
58
Cognltive Potentials to Visual and AuditoryDiscrimination Tasks in Children and Adolescents
M.Zgorzalewicz, B. Galas-Zgorzalewicz and R.NowakUniversity of Medical Scienees, Poznan, Poland
ABSTRACTThis chapter presents methodological and develop-
mental aspects of studies carried out on the Iateendogenous event related potentials, especially P300, indevelopmental age. The method of elieiting P300 tovisual and auditory stimuli has been developed by theChair and Department of Developmental Neurology inthe University of Medical Sciences in Poznan, Poland,and introduced into elinical diagnosis. The investiga-tions were performed on 80 healthy children and ado-lescents age 8 to 18 years. Auditory and visual oddballparadigms were used. The latencies of P300 showed dif-ferences dependent on modality. The significant nega-tive correlation between P300 latencies and age wasfound at Pz derivation. Visual stimuli produced longerlateneies than the auditory task. There were no signifi-cant differences between boys and girls in the examinedparameters of P300 and no statistieal relationshipbetween NI, P2 and N2 latencies and amplitudes forauditory and visual stimulus and age, as well for theirP300 amplitudes. These data confırm P300 lateneychanges related to maturity.
INTRODUCTION AND OBJECTIVESIn 1965 Sutton et aL."7first deseribed P300 as an
event related potential (ERP) associated with cognitivefunction. The P300 wave is accepted as an objectivemethod of mental processing involved in the allocationof attention resources when immediate memory isengaged. Many studies showed that it provided a modemelectrophysiological tool for studying mental processing.Chen and Donchin' related P300 to the process of "con-text update," or the updating of an internal model in thesubject's brain that was required when the external sit-uation had changed significantIy. Verleger'' suggestedthat P300 retlected the "context closure" that occurredwhen the meaningful, awaited stimulus had been detect-ed. Because processes involve the modifieation of mem-ory traees, they should be linked with exeitatory activity.However, simultaneous reeordings from. single neuronsand from the surface of the skull indicated that the sur-faee positive waves originated mainly from the hyperpo-larization of apical dendrites of eortieal eells. Thus, they
should correspond to periods of reduced corticalexcitability. The putative excitatory phenomena could bemasked by stronger inhibitory processes. Desmedt' sug-gested that the P300 potential retleeted an inhibitoryinput of prefrontal cortex to the activating retieular for-mation. Altematively, Elbert and Rockstroh-" suggestedthat this potential retlected a threshold regulationmechanism in the cortex. Rockstroh's hypothesis isinteresting because it pertains to the principles of neu-ronal network operation rather than to the psyehologicalmeaning of the P300 potentiaL. This does not contradictother theories, but it leads to a number of conclusionsthat can be experimentally tested."
P300 is considered to be a manifestation of intellee-tual effort, including memory processing funetions,decision making and attention processes. An endoge-nous component of P300 retlects the moment of theintellectual solution process as indicated by problemstimulus. Therefore, it is considered to be a bioeleetrieparameter of cognitive processes. P300 is a clinieallyrelevant method to study the cognitive function in allage groups including children and adolescents.v" TheP300 component is often elicited with a simple diserim-ination task (oddball paradigm). Auditory or visualstimuli have been used to elicit the P300.1:ı.ıı;.17.:IH.l2
This paper presents methodological and developmen-tal aspeets of studies carried out on P300 in developmen-ta! age. The age-related changes were also studied.
METHODSThe method of elieiting the Iate endogenous event
related potentials of P300 to visual and auditory stimulihas been developed by the Chair and Department ofDevelopmental Neurology in the University of MedicalScienees in Poznan, Poland, and introduced into elini-cal diagnosis. ERPs to visual and auditory stimuli wereperformed on 80 healthy children and adoleseents (40boys, 40 girls) age 8 to 18 years.
According to the IFCN recommendation standards,the auditory oddball paradigm was used to elieit ERPs.IlERPs were avetaged with Multiliner (Toennies,Germany) equipment. The method included two differ-ent tones, 1000 Hz for frequent (non-target) and 2000 Hz
59
)
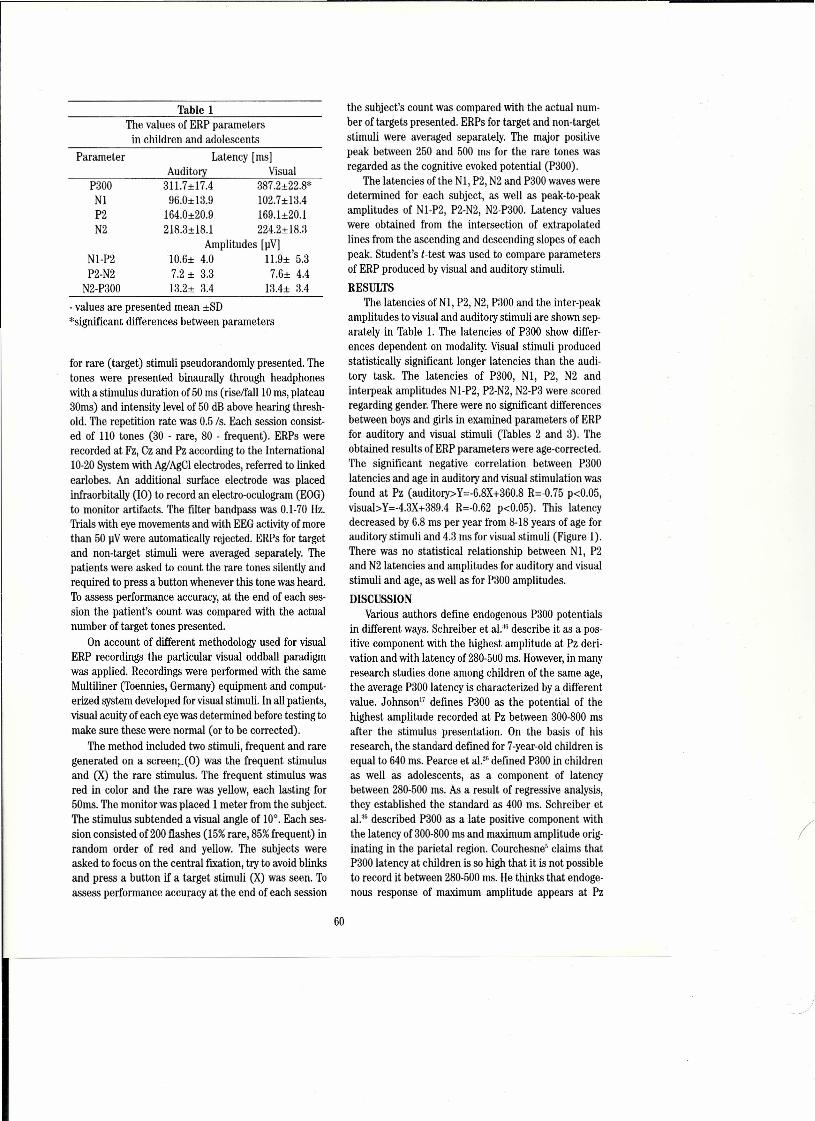
TabIe 1The vaIues of ERP parameters
in children and adoIescentsParameter Latency [ms]
Auditory VisualP300NIP2N2
311.7±I7.4 387.2±22.8*96.0±13.9 102.7±I3.4
164.0±20.9 169.1±20.1218.3±18.1 224.2±18.3
Amplitudes [lıV]10.6± 4.0 11.9± 5.37.2 ± 3.3 7.6± 4.413.2± 3.4 13.4± 3.4
N1-P2P2-N2
N2-P300- values are presented mean ±SD*significant differences between parameters
for rare (target) stimuli pseudorandomly presented. Thetones were presented binaurally through headphoneswith a stimulus duration of 50 ms (rise/fall LO ms, plateau30ms) and intensity level of 50 dB above hearing thresh-old. The repetition rate was 0.5 Is. Each session consist-ed of HO tones (30 - rare, 80 - frequent). ERPs wererecorded at Fz, Cz and Pz according to the International10-20 System with Ag/AgCIelectrodes, referred to linkedearlobes. An additional surface electrode was placedinfraorbitally (10) to record an electro-oculogram (EOG)to monitor artifacts. The filter bandpass was 0.1-70 Hz.TriaIs with eye movements and with EEG activity of morethan 50 }iVwere automatically rejected. ERPs for targetand non-target stimuli were averaged separately. Thepatients were asked to count the rare tones silently andrequired to press a button whenever this tone was heard.To assess performance accuracy, at the end of each ses-sion the patient's count was compared with the actualnumber of target tones presented.
On account of different methodology used for visualERP recordings the particular visual oddball paradigmwas applied. Recordings were performed with the sameMultiliner (Toennies, Germany) equipment and comput-erized system developed for visual stimuIi. In all patients,visual acuity of each eye was determined before testing tomake sure these were normal (or to be corrected).
The method included two stimuli, frequent and raregenerated on a screenı.Iü) was the frequent stimulusand (x) the rare stimulus. The frequent stimulus wasred in color and the rare was yellow, each lasting for50ms. The monitor was placed 1 meter from the subject.The stimulus subtended a visual angle of 10°. Each ses-sion consisted of200 flashes (15%rare, 85%frequent) inrandom order of red and yellow. The subjects wereasked to focus on the central fıxation, try to avoid blinksand press a button if a target stimuli (x) was seen. Toassess performance accuracy at the end of each session
the subject's count was compared with the actual num-ber of targets presented. ERPs for target and non-targetstimuli were average d separately. The major positivepeak between 250 and 500 ms for the rare tones wasregarded as the cognitive evoked potential (P300).
The latencies of the NI, P2, N2 and P300 waves weredetermined for each subject, as well as peak-to-peskamplitudes of NI-P2, P2-N2, N2-P300. Latency valueswere obtained from the intersection of extrapolatedlines from the ascending and descending slopes of eachpeak. Student's t-test was used to compare parametersof ERP produced by visual and auditory stimuli.RESULTS
The latencies of NI, P2, N2, P300 and the inter-peakamplitudes to visual and auditory stimuli are shown sep-arately in Table 1. The lateneies of P300 show differ-ences dependent on modality. Visual stimuli producedstatistieally significant longer latencies than the audi-tory task. The latencies of P300, NI, P2, N2 andinterpeak amplitudes N1-P2, P2-N2, N2-P3 were scoredregarding gender. There were no significant differencesbetween boys and girls in examined parameters of ERPfor auditory and visual stimuli (Tabıes 2 and 3). Theobtained results ofERP parameters were age-corrected.The significant negative eorrelation between P300latencies and age in auditory and visual stimulation wasfound at Pz (auditory>Y=-6.8X+360.8 R=-0.75 p<0.05,visuai>Y=-4.3X+389.4 R=-0.62 p<0.05). This Iateneydeereased by 6.8 ms per year from 8-18 years of age forauditory stimuli and 4.3 ms for visual stimuli (Figure 1).There was no statistical relationship between NI, P2and N2 latencies and amplitudes for auditory and visualstimuli and age, as well as for P300 amplitudes.DlSCUSSION
Various authors define endogenous P300 potentialsin different ways. Sehreiber et al." deseribe it as a pos-itive component with the highest amplitude at Pz deri-vation and with Iateney of 280-500 ms. However, in manyresearch studies done among children of the same age,the average P300 Iateney is eharaeterized by a differentvalue. Johnson" defines P300 as the potential of thehighest amplitude recorded at Pz between 300-800 msarter the stimulus presentation. On the basis of hisresearch, the standard defined for 7-year-old children isequal to 640 ms. Pearce et al." defmed P300 in childrenas well as adolescents, as a eomponent of Iateneybetween 280-500 ms. As a result of regressive analysts,they established the standard as 400 ms. Schreiber etal." deseribed P300 as a Iate positive component withthe Iateney of 300-800 ms and maximum amplitude orig-inating in the parietal region. Courchesne' claims thatP300 Iateney at children is so high that it is not possibleto record it between 280-500 ms. He thinks that endoge-nous response of maximum amplitude appears at Pz
60
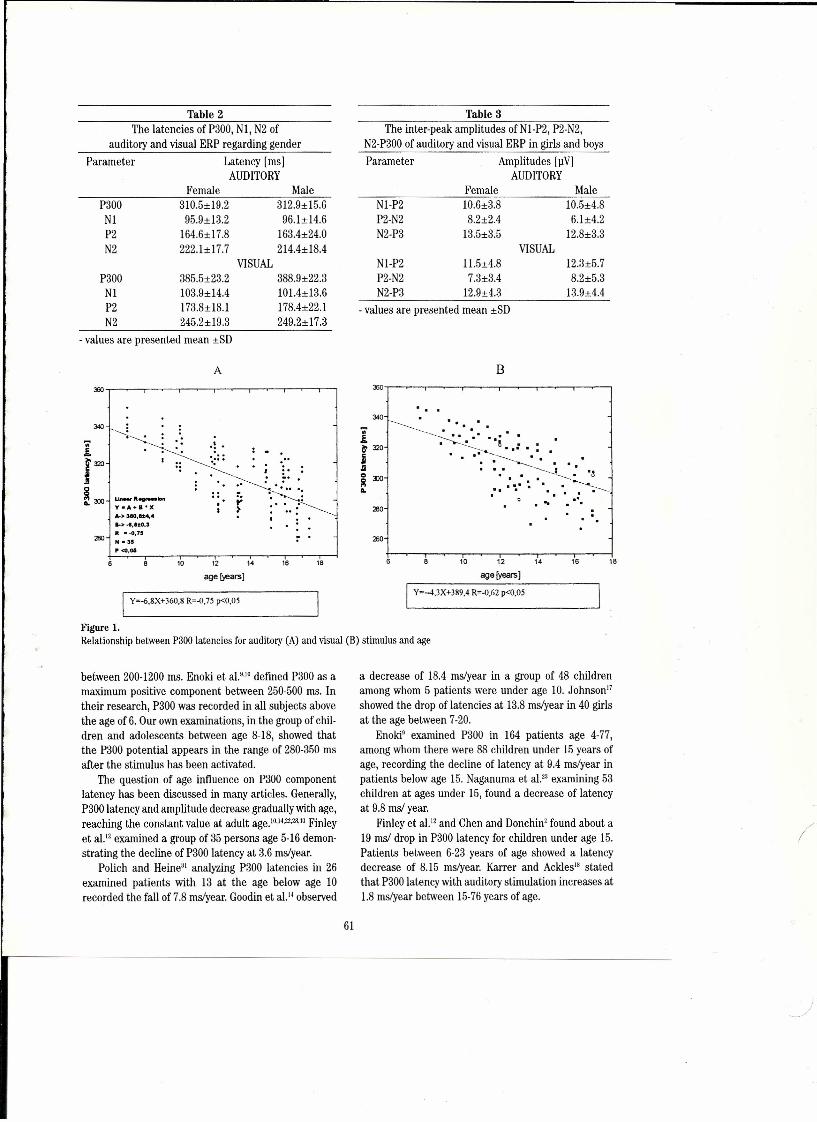
Table 2The latencies of P300, NI, N2 of
auditory and visual ERP regarding genderParameter Lateney [ms]
AUDITORYFemale Male
P300 3ıo.5±19.2 312.9±15.6NI 95.9±13.2 96.1±14.6P2 164.6±17.8 163.4±24.0N2 222.1±17.7 214.4±18.4
VISUALP300 385.5±23.2 388.9±22.3NI 103.9±14.4 101.4±l3.6P2 173.8±18.1 178.4±22.1N2 245.2±19.3 249.2±17.3
- values are presented mean ±SD
A
, <0,06
12 14 16 1810
age []ears]
i Y~-6,8:<:+360,8 R='(),75 p<O,05
Table 3The inter-peak amplitudes of N1-P2, P2-N2,
N2-P300 of auditory and visual ERP in girls and boys
Parameter Amplitudes [JlV]AUDITORY
Female MaleN1-P2 ıo.6±3.8 ıo.5±4.8P2-N2 8.2±2.4 6.1±4.2N2-P3 13.5±3.5 12.8±3.3
VISUALN1-P2 1l.5±4.8 12.3±5.7P2-N2 7.3±3.4 8.2±5.3N2-P3 12.9±4.3 13.9±4.4
- values are presented mean ±SD
B
_ 340 • •
" ~_..1. --:-..:.:.. •• ' "! .it 320 ---;-._ •• :. • •
j .• --- ••.ii • :. ----- __ <,, " '. •
03JO LLL --..1 ~~ • Li ~ Iı .-____.. ...•__.
a.. ••• ••• 1-'''_
.. .1.
10 14 16 1812
age [years]
i Y=-4,3X+389.4 R=-<J,62 p<O,05
Figure ı.Relationship between P300 latencies for auditory CA)and visual CB)stimulus and age
between 200-1200 ms. Enoki et aP'ıu defined P300 as amaximum positive eomponent between 250-500 ms. Intheir researeh, P300 was reeorded in all subjeets abovethe age of 6. Our own examinations, in the group of ehil-dren and adoleseents between age 8-18, showed thatthe P300 potential appears in the range of 280-350 msaf ter the stimulus has been activated,
The question of age influenee on P300 eomponentlateney has been diseussed in many artieles. Generally,P300 lateneyand amplitude deerease gradually with age,reaehing the eonstant value at adult age.ıo,14,22,28,30 Finleyet al." examined a group of 35 persons age 5-16 demon-strating the decline of P300 lateney at 3.6 mSıyear.
Polieh and Heine" analyzing P300 lateneies in 26examined patients with 13 at the age below age 10reeorded the fall of 7.8 mSıyear. Goodin et aL'4 observed
adecrease of 18.4 mSıyear in a group of 48 childrenamong whom 5 patients were under age ıo. Johnson"showed the drop of lateneies at 13.8 mSıyear in 40 girlsat the age between 7-20.
Enoki" examined P300 in 164 patients age 4-77,among whom there were 88 children under 15 years ofage, reeording the decline of lateney at 9.4 mSıyear inpatients below age 15. Naganuma et aLı:ı examining 53children at ages under 15, found a deerease of lateneyat 9,8 mSı year.
Finley et aL'2 and Chen and Donchin' found about a19 mSı drop in P300 lateney for children under age 15.Patients between 6-23 years of age showed a lateneydeerease of 8.15 mSıyear. Karrer and Ackles" statedthat P300 lateney with auditory stimulation inereases at1.8 mSıyear between 15-76 years of age.
61

These examinations were eonfırmed by Syndulko etal.," Brown et aL, i Pfefferbaum et al.," and Pieton et al."
Our own examinations demonstrated the deerease ofP300 lateney at 6.7 ms/year for auditery stimulus and 4.3ms for visual stimulus. The above eonsiderations lead tothe eonclusion that P300 lateney deereases from thestart of life, reaehes the minimum value in the last stageof puberty and then inereases with age. The deerease ofP300 lateney in the developmental age is eonnected withthe maturation of neuroanatomie struetures and neu-ropsyehologieal functions,"
The histologieal observations made by Cohen andPolich" show that forming dendrites in the eerebral cor-tex takes place at the age of 10. Yakovlev and Lecours'"stated that the development of anatomical structuresresponsible for higher nervous system activities takesplaee progressively up to the end of puberty.
Consequently, it may be concluded that physiologi-cal and anatomical changes of cerebral structures areresponsible for the decrease of latency progressing withthe age of children and adolescents. P300 has been gen-erally considered to be independent of gender.I''''~~':'''There were also no statistically signifieant differencesin ERP parameters regarding gender in our study.
Literature deseribes many methods of visual stimu-lation eliciting the generation of endogenous P300potential. Nash and Fernandez" applied two lumines-cent diodes of various colors in their examinations. Thesubject was to react to a stimulus of a defined color thatappeared rarely, a method which is technically simpleto administer. The disadvantage of this method for gen-erating P300 may be the weak light intensity emittedfrom a single diode, which makes the differentiation ofcolors more difficult. This type of stimulation should notbe used for examination of children.
Evers et al. ii and Grotemeyer et al. if> developing thistype of stimulation, elaborated on a method in whichalternating eolors (respectively for the "oddball para-digm" method) appeared on the computer screen.Changing colors presented as computer flashes wereused by Picton et aL2Hin their examinations. They use dstimuli of 50 ms duration and red color (rare) and greencolor (frequent), This type of stimulation reduces thedifficulty in discriminating the characteristics; there-fore, it may be successfully used in examination of chil-dren and adolescents.
The next step in developing the examining methodsof P300 endogenous potentials with the use of visualstimulation was the introduction of graphic elements astrigger stimuli. Pfefferbaum et aJ.2; used two symbols"+" and "-,, and a patient reacted to a «,» symboL
Linking a computer with the research equipmentallowed our group to use more complex methods ofstimulation. Complicated graphic symbols appeared on
the screen, such as figures, letters and drawings. [ntheir examinations Onofrj et al," used as a stimulus hor-izontallines (frequent) and vertical (rare), appearingon the screen with probability of 0.3. Comerchero andPolich' applied black-and-white stripes of differentwidth appearing on the screen at random. Moreover,Polich" deseribes a method us ing a chessboard andstripes as stirnulating elements. Uberall et aL.11I use dgeometrie figures as stimulating elements. They applieda procedure in which a distinguished stimulus was gen-erated at the same time as a sequence of a figure cir-eumference and then its full picture. Simultaneously,the reduction of amplitude and elongation of P300Iateney were observed. The modification of this methodwas the introduction of a definite object and subse-quent picture of its name as stimuli."
Complexity of the subtitle, which was to be recog-nized as proper, seemed to have great influence on thevalue of ERP lateney. Suwazano et al." administered aninnovative teehnique using a triangle with the baseupward or downward. Sangal and Sangal" used S and HIetters as elements eliciting a response. The subjectreacted by pushing the button while seeing S.
The procedure used by the Chair and Department ofDevelopmental Neurology at the University of MedicalSeiences consists of two stimuli, X and O symbols. Theage of patients undargoing ERP examinations in ourDepartment requires the introduction of stimulation.Therefore, except for the diserimination of patterns,every letter is a different color, allowing examination ofchildren who do not yet know Ietters or figures.
Asimilar teehnique was used by Johnson"Emmerson" and Rosenberg et al." However, theseauthors used monoehromatie patterns, redueing theapplieability of this method. The P300 eomponent isclosely associate d with the degree of diffieulty in recog-nition of the X or O symbols presented. The more diffi-eult the task is, the lorıger the Iateney of the potential.The applieation of the eomplex set, eonsisting ofchanges in colors of presented Ietters, results not onlyin neurophysiologieal measurement of selective atten-tion, but in the process of scanning memory.
The effects on modality used for ERP were similarto previous reports by Polich and Heine'" and Rameroand Polich." They observed smailer amplitude andshorter Iateney of P300 parameters for auditory stimu-lus. [n our work, we found statistieally significant dif-ferences only in lateney without changes in amplitude.The teehnieal parameters used for visual stimulationcan be an important faetor influencing the differencesfrom previous reports.
CONCLUSIONSThese data confırm P300 Iateney changes related to
maturity. Differenees between proeedures of ERPs per-
62
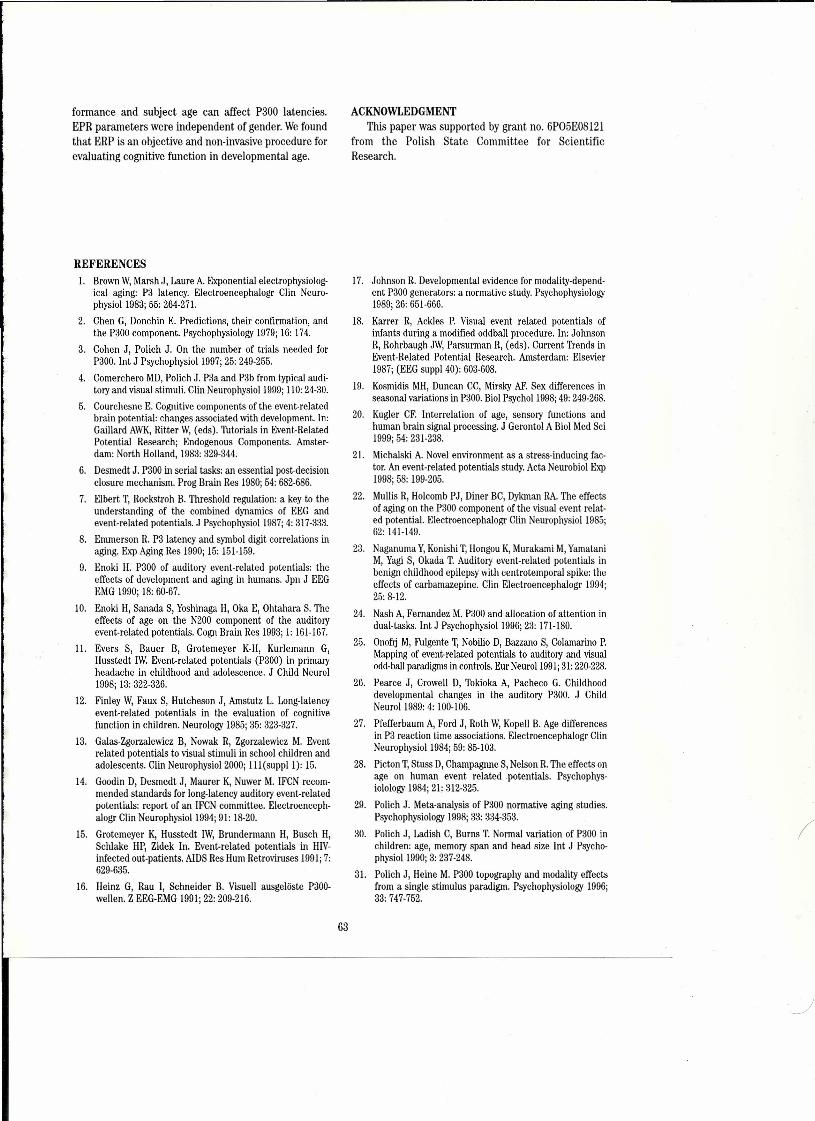
formance and subject age can affect P300 latencies.EPR parameters were independent of gender. Wefoundthat ERP is an objective and non-invasive procedure forevaluating cognitive function in developmental age.
REFERENCESi. Brown W,Marsh J, Laure A. Exponential electrophysiolog-
ical aging: P3 lateney. Eleetroeneephalogr Clin Neuro-physiol 1983; 55: 264-271.
2. Chen G, Donehin E. Predictions, the ir confirmation, andthe P300 component. Psyehophysiology 1979; 16: 174.
3. Cohen J, Polich J. On the number of trials needed forP300. Int J Psychophysiol 1997; 25: 249-255.
4. Comerchero MD, Polich J. P3a and P3b from typical audi-tory and visual stimuli. Clin Neurophysiol 1999; 110:24-30.
5. Courehesne E. Cognitive components of the event-relatedbrain potential: changes associated with development. In:Gaillard AWK,Ritter W, (eds). 1\ıtorials in Event-RelatedPotential Research; Endogenous Components. Amster-dam: North Holland, 1983: 329-344.
6. Desmedt J. P300 in serial tasks: an essential post-decisionclosure mechanism. Prog Brain Res 1980; 54: 682-686.
7. Elbert T, Rockstroh B. Threshold regulation: a key to theunderstanding of the combined dynamies of EEG andevent-related potentials. J Psyehophysiol1987; 4: 317-333.
8. Emmerson R. P3 Iateneyand symbol digit correlations inaging. Exp Aging Res 1990; 15: 151-159.
9. Enoki H. P300 of auditery event-related potentials: theeffects of development and agirıg in humans. Jpn J EEGEMG 1990; 18: 60-67.
ıo. Enoki H, Sanada S, Yoshinaga H, Oka E, Ohtahara S. Theeffeets of age on the N200 component of the auditoıyevent-related potentials. Cogn Brain Res 1993; 1: 161-167.
lL. Evers S, Bauer B, Grotemeyer K-H, Kurlemann G,Husstedt IW. Event-related potentials (P300) in primaryheadaehe in ehildhood and adolescence. J Child Neurol1998; 13: 322-326.
12. Finley W, Faux S, Hutcheson J, Amstutz L. Long-latencyevent-related potentials in the evaluation of cognitivefunction in children. Neurology 1985; 35: 323-327.
13. Galas-Zgorzalewiez B, Nowak R, Zgorzalewiez M. Eventrelated potentials to visual stimuli in school children andadolescents. Clin Neurophysiol2000; 1II (suppl 1): 15.
14. Goodin D, Desmedt J, Maurer K, Nuwer M. IFCN recom-mended standards for long-Iateney auditory event-relatedpotentials: report of an IFCN committee. Electroenceph-alogr Clin Neurophysiol1994; 91: 18-20.
15. Grotemeyer K, Husstedt IW, Brundermann H, Busch H,Schlake HP, Zidek In. Event-related potentials in HIV-infected out-patients. AIDS Res Hum Retroviruses 1991;7:629-635.
16. Heinz G, Rau I, Schneider B. Visuell ausgelöste P300-wellen. Z EEG-EMG 1991; 22: 209-216.
ACKNOWLEDGMENTThis paper was supported by grant no. 6P05E08121
from the Polish State Committee for ScientificResearch.
17. Johnson R. Developmental evidence for modality-depend-ent P300 generatorso a normative study. Psychophysiology1989; 26: 651-666.
18. Karl'er R, Ackles P. Visual event related potentials ofinfants during a modified oddball procedure. In: JohnsonR, Rohrbaugh JW, Parsurman R, (eds). Current Trenda inEvent-Related Potential Research. Amsterdam: EIsevier1987; (EEG suppI40): 603-608.
19. Kosmidis MH, Duncan CC, Mirsky AF. Sex differences inseasonal variations in P300. Biol Psychol1998; 49: 249-268.
20. Kugler CF. Interrelation of age, sensory functions andhuman brain signal processing. J Gerontol A Biol Med Sci1999;54: 231-238.
21. Michalski A. Novel environment as a stress-inducing fac-toroAn event-related potentials study. Acta Neurobiol Exp1998; 58: 199-205.
22. Mullis R, Holcomb PJ, Diner BC, Dykman RA.The effectsof aging on the P300 component of the visual event relat-ed potentiaJ. Electroencephalogr Clin Neurophysiol1985;62: 141-149.
23. Naganuma Y,Konishi T, Hongou K, Murakami M,YamataniM, Yagi S, Okada T. Auditory event-related potentials inbenign childhood epilepsy with centrotemporal spike: theeffects of carbamazepine, Clin Electroencephalogr 1994;25: 8-12.
24. Nash A, Fernandez M. P300 and allocation of attention indual-tasks.lnt J Psychophysiol1996; 23: 171-180.
25. Onofıj M, Fulgente T, Nobilio D, Bazzano S, Colamarino P.Mapping of event-related potentials to auditory and visualodd-ball paradigms in controls. Eur NeUl'011991;31:220-228.
26. Pearce J, Crowell D, Tokioka A, Pacheco G. Childhooddevelopmental changes in the auditory P300. J ChildNeurol 1989: 4: ıoO-l06.
27. Pfefferbaum A, Ford J, Roth W,Kopell B. Age differencesin P3 reaction time associations. Electroencephalogr ClinNeurophysiol 1984; 59: 85-ıoa
28. Picton T,Stuss D, Champagnne S, Nelson R.The effects onage on human event relatedpotentials. Psychophys-iolology 1984; 21: 312-325.
29. Polich J. Meta-analysis of P300 normative aging studies.Psychophysiology 1998; 33: 334-353.
30. Polich J, Ladish C, Burns T. Normal variation of P300 inchildren: age, memory span and head size Int J Psycho-physiol1990; 3: 237-248.
31. Polich J, Heine M. P300 topography and modality effectsfrom a single stimulus paradigm. Psychophysiology 1996;33: 747-752.
63

32. Ramero R, Polich J. P300 habituation from auditory and 39. Syndulko K, Hansch E, Cohen S, Pearce J, Goldberg Z,visual stimuli. Physiol Behav 1996;59: 517-522. Montana B, Tourtellote W, Potvin A. Long latency event
33. Rockstroh B, Müller M, Cohen R, Elbert T. Probing the related potentials in normal aging and dementia. In:
functional brain state during P300 evocation. J Psycho- Courgan J, Mauguire F, Revol M, (eds). Clinical Appli-
physiol1992; 6: 175-184. cation of Evoked Potentials in Neurology. NewYork:Raven
34. Rosenberg C, Nudleman K, Starr A. Cognitive evokedPress; 1982: 126-178.
potentials (P300) in early Huntington's disease. Arch 40. Uberall M, Brandl U, Wenzel D. Stimulus specificity ofNeurol 1985; 42: 984-987. P300. Neuropediatrics 1993;24: 324-33i.
35. Sangal B, Sangal J. Topography of auditory and visual 41. Verleger R. Event-related potentials and cognition: a eri-P300 in normal adults. Clin Eleetroencephalogr 1996; 27:145-150.
tique of the context updating hypothesis and an alterna-tive interpretation of P3. Behav Brain Scienee 1998; 11:
36. Schreiber H, Stolz-Born J, Rothmeier J, Kornhuber A. 343-356.Endogenous event-related brain potentials and psycho-metric performance in children at risk for schizophrenia. 42. Vesco K, Bone R, Ryan J, Polich J. P300 in young and eld-Biol Psyehiatr 1991; 30: 177-189. erly subjects: auditory frequencyand interısity effects.
37. Sutton S, Braren M,Zubin J, John ER. Evokedpotential eor- Electroeneephalogr Clin Neurophysiol 1993;88: 302-308.
relates ofstimulus uncertainty. Science 1965;1187-1188. 43. YakovlevP, Lecours A. The myelogenetic cycles of region-38. Suwazano S, Machado L, Knight T. Predictive value of al maturation of the brain In: Minkowski A (ed). Regional
novel stimuli rnodifies visual event-related potentials and Development of the Brain in Early Life. Ox:ford:Blackwellbehaviour. Clin Neurophysiol 2000; lll: 29-39. Scientific Publ; 1967:3-70.
64
)

CLINICAL
65
)
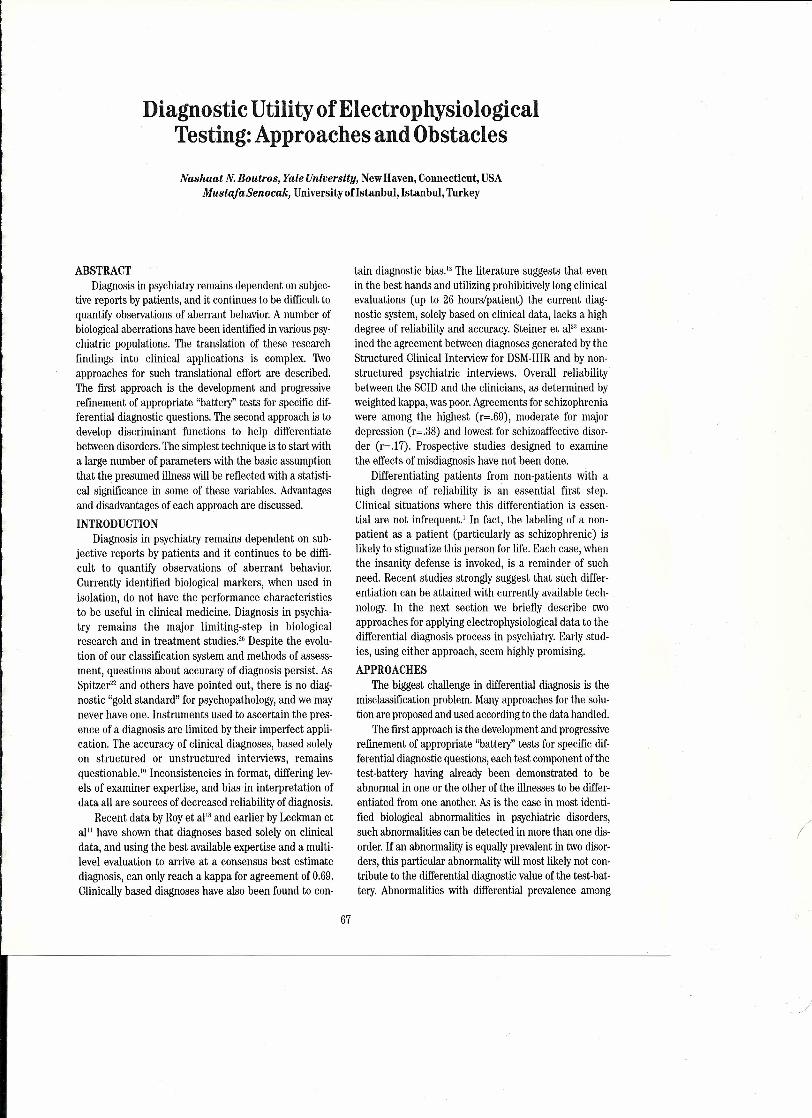
Diagnostic Utility of ElectrophysiologicalTesting. Approaches and ObstaclesNashaat N.Boutros, YaleUniversity, NewHaven, Connecticut, USA
MustafaSenocak, University ofistanbuI, Istanbul, Turkey
ABSTRACTDiagnosis in psychiatry remains dependent on subjec-
tive reports by patients, and it continues to be difficult toquantify observations of aberrant behavior. A number ofbiological aberrations have been identifıed in various psy-chiatric populations. The translation of these researchfindings into elinical applications is complex. 'Iwoapproaches for such translational effort are described.The first approach is the development and progressiverefinement of appropriate "battery" tests for specifıc dif-ferential diagnostic questions. The second approach is todevelop discriminant functions to heIp differentiatebetween disorders. The simplest technique is to start witha large number of parameters with the basic assumptionthat the presumed illness will be reflected with a statisti-cal signifıcance in some of these variables. Advantagesand disadvantages of each approach are discussed.INTRODUCTION
Diagnosis in psychiatry remains dependent on sub-jective reports by patients and it continues to be diffi-cult to quantify observations of aberrant behavior.Currently identified biological markers, when used inisolation, do not have the performance characteristicsto be useful in clinical medicine. Diagnosis in psychia-try remain s the major limiting-step in biologicalresearch and in treatment studies." Despite the evolu-tion of our classification system and methods of assess-ment, questions about accuracy of diagnosis persist. AsSpitzer" and others have pointed out, the re is no diag-nostic "gold standard" for psychopathology, and we maynever have one. Instruments used to ascertain the pres-ence of a diagnosis are limited by their imperfect appli-cation. The accuracy of elinical diagnoses, based solelyon structured or unstructured interviews, remainsquestionable. ii> Inconsistencies in format, differing lev-els of examiner expertise, and bias in interpretation ofdata all are sources of decreased reliability of diagnosis.
Recent data by Royet aP8and earlier by Leckman etapı have shown that diagnoses based solely on elinicaldata, and using the best available expertise and a multi-level evaluation to arrive at a consensus best estimatediagnosis, can only reach a kappa for agreement of 0.69.Clinically based diagnoses have also been found to con-
tain diagnostic bias." The literature suggests that evenin the best hands and utilizing prohibitively long elinicalevaluations (up to 26 hours/patient) the current diag-nostic system, solely based on elinical data, lacks a highdegree of reliability and accuracy. Steiner et aFI exam-ined the agreement between diagnoses generated by theStructured Clinical Interview for DSM-IIIRand by non-structured psychiatric interviews. Overall reliabilitybetween the SCIDand the clinicians, as determined byweighted kappa, was poor.Agreements for schizophreniawere among the highest (r=.69), moderate for majordepression (r=.38) and lowest for schizoaffective disor-der (r=.17). Prospective studies designed to examinethe effects of misdiagnosis have not been done.
Differentiating patients from non-patients with ahigh degree of reliability is an essential first step.Clinical situations where this differentiation is essen-tial are not infrequent.' In fact, the labeling of a non-patient as a patient (particularly as schizophrenic) islikely to stigmatize this person for life. Each case, whenthe insanity defense is invoked, is areminder of suchneed. Recent studies strongly suggest that such differ-entiation can be attained with currently available tech-nology. In the next seetion we briefly deseribe twoapproaches for applying electrophysiological data to thedifferential diagnosis process in psychiatry. Early stud-ies, using either approach, seem highly promising.APPROACHES
The biggest challenge in differential diagnosis is themisclassifıcation problem. Manyapproaches for the solu-tion are proposed and used according to the data handled.
The first approach is the development and progressiverefinement of appropriate "battery" tests for specifıc dif-ferential diagnostic questions, each test component ofthetest-battery having already been demonstrated to beabnormal in one or the other of the illnesses to be differ-entiated from one another. As is the case in most identi-fied biological abnormalities in psychiatric disorders,such abnormalities can be detected in more than one dis-order. if an abnormality is equally prevalent in two disor-ders, this particular abnormality will most likely not con-tribute to the differential diagnostic value of the test-bat-tery. Abnormalities with differential prevalence among
67
)
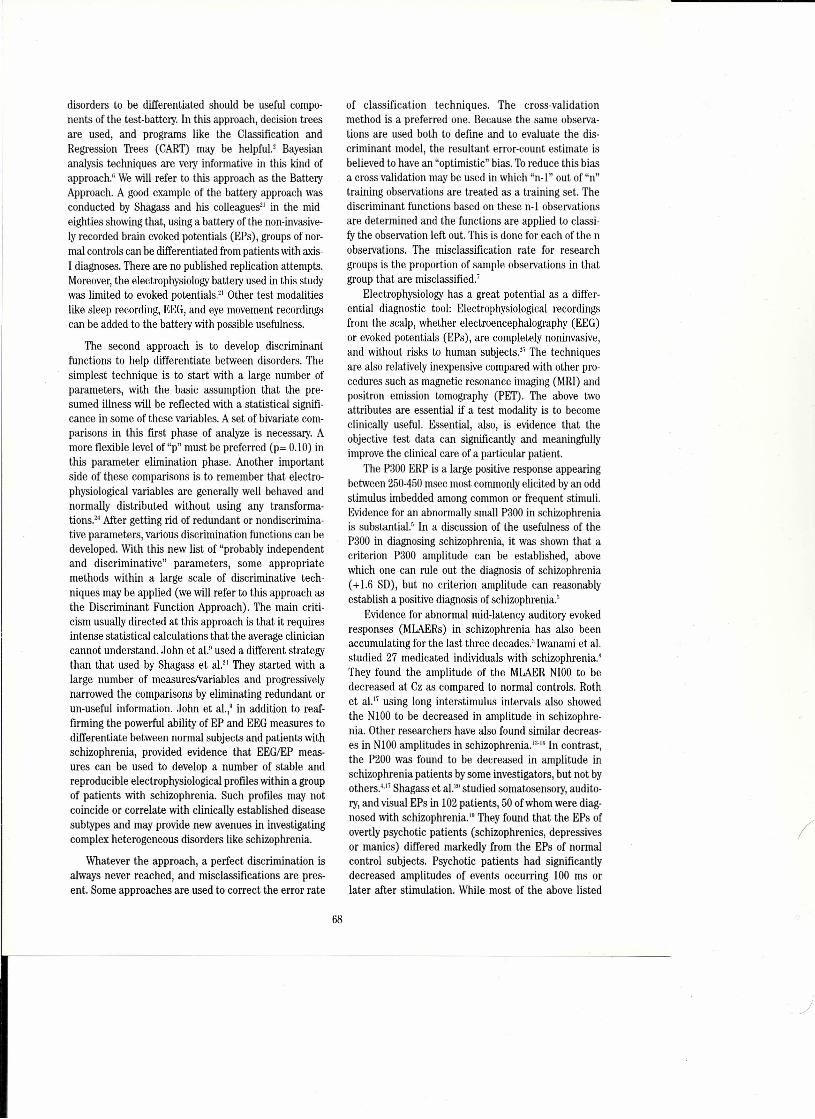
disorders to be differentiated should be useful compo-nents of the test-battery. In this approach, decision treesare used, and programs like the Classification andRegression Trees (CART) may be helpful.' Bayesiananalysis techniques are very informative in this kind ofapproach," Wewill refer to this approach as the BatteryApproach. A good example of the battery approach wasconducted by Shagass and his colleagues" in the mid-eighties showing that, using a battery of the non-invasive-Iy recorded brain evoked potentials (EPs), groups of nor-mal controls can be differentiated from patients with axis-I diagnoses. There are no published replication attempts.Moreover,the electrophysiologybattery used in this studywas limited to evoked potentials," Other test modalitieslike sleep recording, EEG,and eye movement recordingscan be added to the battery with possible usefulness.
The second approach is to develop discriminantfunctions to help differentiate between disorders. Thesimplest technique is to start with a large number ofparameters, with the basic assumption that the pre-sumed illness will be reflected with a statistical sigrıifi-cance in some of these variables. A set of bivariate com-parisons in this fırst phase of analyze is necessary. Amore flexible level of"p" must be preferred (p= 0.10) inthis parameter elimination phase. Another importantside of these comparisons is to remember that electro-physiological variables are generally well behaved andnormally distributed without using any transforma-tions." After getting rid of redundant or nondiscrimina-tive parameters, various discrimination functions can bedeveloped. With this new list of "probably independentand discriminative" parameters, some appropriatemethods within a large scale of discriminative tech-niques may be applied (we will refer to this approach asthe Discriminant Function Approach). The main criti-cism usually directed at this approach is that it requiresintense statistical calculations that the average cliniciancannot understand. John et al," used a different strategythan that used by Shagass et al." They started with alarge number of measures/variables and progressivelynarrowed the comparisons by eliminating redundant orun-useful information. John et al.," in addition to reaf-firming the powerful ability of EP and EEG measures todifferentiate between normal subjects and patients withschizophrenia, provided evidence that EEGIEP meas-ures can be used to develop a number of stable andreproducible electrophysiological profiles within a groupof patients with schizophrenia. Such profiles may notcoincide or correlate with clinieally established diseasesubtypes and may provide new avenues in investigatingcomplex heterogeneous disorders like sehizophrenia.
Whatever the approaeh, a perfect diserimination isalways never reached, and miselassifieations are pres-ent. Some approaches are used to eorreet the error rate
of classifieation techniques. The cross-validationmethod is a preferred one. Because the same observa-tions are used both to define and to evaluate the dis-eriminant model, the resultant error-count estimate isbelieved to have an "optimistic" bias. Toreduce this biasacross validation may be used in which "n-ı" out of "n"training observations are treated as a training set. Thediseriminant functions based on these n-ıobseıvationsare determined and the functions are applied to classi-fy the observation left out. This is done for each of the nobservations. The misclassification rate for researchgroups is the proportion of sample observations in thatgroup that are misclassifled.'
Electrophysiology has a great potential as a differ-ential diagnostic tool: Electrophysiological recordirıgsfrom the sealp, whether electroencephalography (EEG)or evoked potentials (EPs), are completely noninvasive,and without risks to human subjects." The techniquesare also relatively inexpensive compared with other pro-eedures such as magnetic resonance imaging (MRI) andpositron emission tomography (PET). The above twoattributes are essential if a test modality is to becomeclinically useful. Essential, also, is evidenee that theobjective test data can significantly and meaningfullyimprove the elinical care of a particular patient.
The P300 ERP is a large positive response appearingbetween 250-450msec most commonlyelieited byan oddstimulus imbedded among common or frequent stimuli.Evidenee for an abnormally smail P300 in sehizophreniais substantial.' In a discussion of the usefulness of theP300 in diagnosing sehizophrenia, it was shown that acriterion P300 amplitude can be established, abovewhich one can rule out the diagnosis of schizophrenia(+1.6 SO), but no eriterion amplitude can reasonablyestablish a positive diagnosis of schizophrenia.'
Evidence for abnormal mid-Iatency auditory evokedresponses (MLAERs) in schizophrenia has also beenaccumulating for the last three decades.' Iwanami et aL.studied 27 medieated individuals with schizophrenia."They found the amplitude of the MLAERNIOOto bedecreased at Cz as eompared to normal eontrols. Rothet al." using long interstimulus intervals also showedthe N100 to be deereased in amplitude in schizophre-nia. Other researchers have also found similar decreas-es in N100amplitudes in schizophrenia.":" In contrast,the P200 was found to be decreased in amplitude inschizophrenia patients by some investigators, but not byothers.':" Shagass et al." studied somatosensory, audito-ry,and visual EPs in 102patients, 50 ofwhom were diag-nosed with sehizophrenia. LU They found that the EPs ofovertly psyehotie patients (schizophrenics, depressivesor manics) differed markedly from the EPs of normalcontrol subjeets. Psyehotic patients had signifieantlydecreased amplitudes of events oceurring lDOms orlater after stimulation. While most of the above listed
68
)
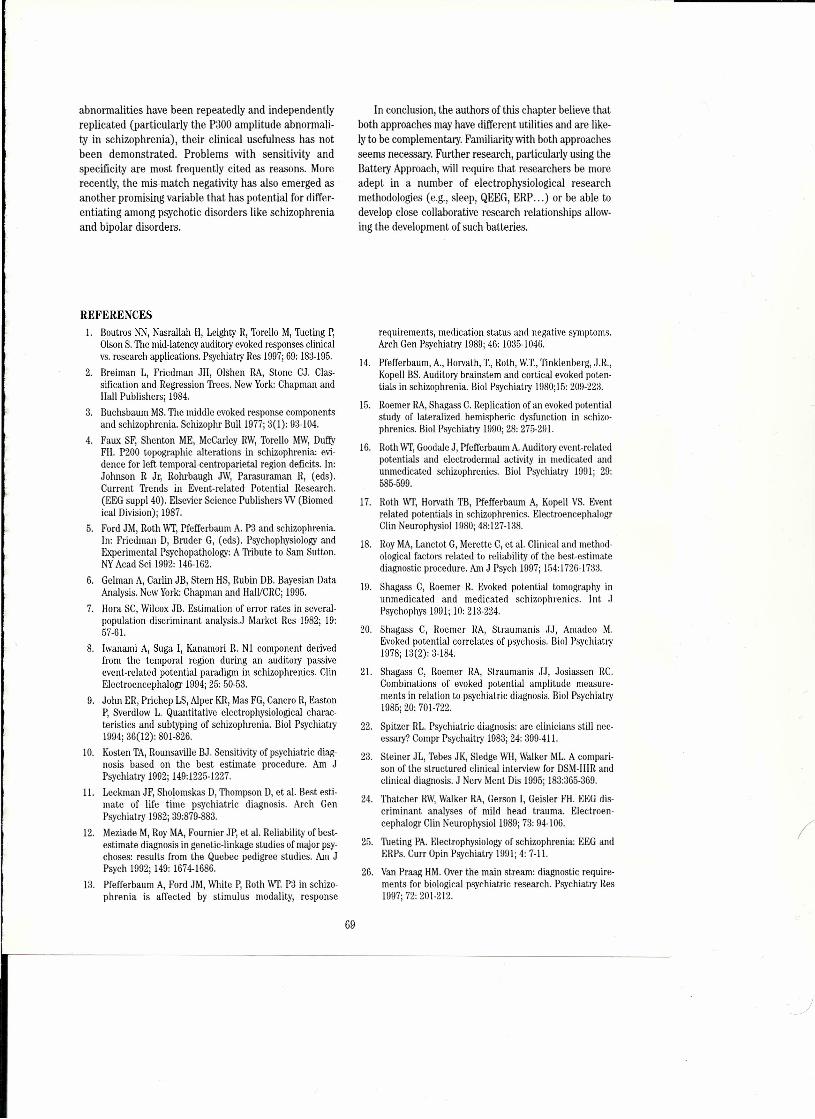
abnormalities have been repeatedly and independentlyreplicated (particularly the P300 amplitude abnorrnali-ty in schizophrenia), their elinical usefulness has notbeen demonstrated. Problems with sensitivity andspecificity are most frequently cited as reasons. Morerecently, the mis-match negativity has alsa ernerged asanother promising variable that has potential for differ-entiating among psychotic disorders \ike schizophreniaand bipolar disorders.
REFERENCESi. Boutros NN, Nasrallah H, Leighty R, Toreilo M, Tııeting 1',
Olson S.The mid-Iatency auditory evoked responses elinicalvs. research applications. Psychiatry Res 1997;69: 183-195.
2. Breiman L, Friedman JH, Olshen RA, Stone CJ. Clas-sil'ication and Regression Trees. New York: Chapman andHall Publishers; 1984.
3. Buchsbaum MS.The middle evoked response componentsand schizophrenia. Schizophr Buil1977; 3(1): 93-104.
4. Faux SF, Shenton ME, McCarley RW,Torello MW, DuffyFH. 1'200 topographic alterations in schizophrenia: evi-dence for left ternporal-centroparietal region deficits. In:Johnson R Jr, Rohrbaugh JW, Parasuraman R, (eds).Current Trerıds in Event-related Potential Research.(EEG suppl 40). EIsevier Science Publishers VV(Biomed-ical Division); 1987.
5. Ford JM, Roth m, Pfefferbaum A. P3 and schizophrenia.In: Friedman D, Bruder G, (eds). Psychophysiology andExperimental Psychopathology: A Tribute to Sam Sutton.NYAcad Sci 1992: 146-162.
6. Gelman A, Carlin JB, Stern HS, Rubin DB. Bayesiarı DataAnalysis. New York:Chapman and HallJCRC; 1995.
7. Hora SC, Wilcox JB. Estimation of error rates in several-population discriminant analysis ..J Market Res 1982; 19:57-61.
8. Iwanami A, Suga I, Kanarneri R. NI component derivedfrom the temporal region during an auditoıy passiyeevent-related potential paradigm in schizophrenics. ClinElectroencephalogr 1994; 25: 50-53.
9. John ER, Prichep LS, Alper KR,Mas FG, Cancro R, Easton1', Sverdlow L. Quantitative electrophysiological charac-teristics and subtyping of schizophrenia. Biol Psychiatry1994; 36(12): 801-826.
10. Kosten TA,Rounsaville BJ. Sensitivity of psychiatric diag-nosis based on the best estimate procedure. Am JPsychiatry 1992; 149:1225-1227.
1i. Leckman JF, Sholomskas D, Thompsorı D, et aL.Best esti-mate of life time psychiatric diagnosis. Arch GenPsychiatry 1982; 39:879-883.
12. Meziade M, Roy MA,Fournier JP, et aL.Reliability of best-estimate diagnosis in genetic-linkage studies of major psy-choses: results from the Quebec pedigree studies. Am JPsych 1992; 149: 1674-1686.
13. Pfefferbaum A, Ford JM, White P, Roth Wl'. P3 in schizo-phrenia is affected by stimulus modality, response
In conclusion, the authors of this chapter believe thatboth approaches may have different utilities and are \ike-ly to be complementary. Familiarity with both approachesseems necessary. Fuıther research, particularly using theBattery Approach, will require that researchers be moreadept in a number of electrophysiological researchmethodologies (e.g., sleep, QEEG, ERP ... ) or be able todevelop close collaborative research relationships allow-ing the development of such batteries.
requirements, medication status and negative symptoms.Arch Gen Psychiatry 1989; 46: 1035-1046.
14. Pfefferbaum, A., Horvath, T., Roth, W'l', Tinklenberg, .LR.,Kopell BS. Auditory brainstem and cortical evoked potert-tials in schizophrenia. Biol Psychiatry 1!)80;15:20!)-22:l.
15. Roemer RA,Shagass C. Replication of an evoked potentialstudy of lateralized hemispheric dysfuncüon in schizo-phrenics. Biol Psychiatry 1990;28: 275-29i.
16. Roth WT,Goodale J, Pfefferbaunı A.Auditery event-relatedpotentials and electrodermal activity in medicated andunmedicated schizophrenics. Biol Psychiatry 1991; 29:585-599.
17. Roth m, Horvath TB, Pfefferbaum A, Kopell VS. Eventrelated potentials in schizophrenics. ElectroencephalogrClin Neurophysiol 1980;48:127-138.
18. Roy MA,Lanctot G, Merette C, et al, Clinical and method-ological factors related to reliability of the best-estimatediagnostie procedure, Am J Psych 1997; 154:1726-1733.
19. Shagass C, Roemer R. Evoked potential tornography inunmedicated and medicated schizophrenics. Int .1Psychophys i99i; iO: 2i3-224.
20. Shagass C, Roemer RA, Straumanis .1.1,Amadeo M.Evoked potential correlates of psyehosis. Biol Psychiatry1978; 13(2): 3-184.
21. Shagass C, Roemer RA, Straumanis JJ, Josiassen RC.Combinations of evoked potential anıplitude measure-ments in relation to psychiatric diagnosis. Biol Psychiatry1985; 20: 701-722.
22. Spitzer RL. Psychiatric diagnosis: are clirıicians still rıec-essaıy? Compr Psychaitry 1983;24: 399-41i.
23. Steiner JL, Tebes JK, Sledge WH, Walker ML.A compari-son of the structured elinical interview for DSM-ıım andelinical diagnosis. J Nerv Ment Dis 1995; 183:365-369.
24. Thatcher RW,Walker RA, Gerson I, Geisler FH. EEG dls-erirninant analyses of mild head trauma. Electroen-cephalogr Clin Neurophysiol 1989; 73: 94-106.
25. Tueting PA. Electrophysiology of schizophrenia: EEG andERPs. Curr Opin Psychiatry 1991;4: 7-11.
26. Van Praag HM.Over the main stream: diagnostic require-ments for biological psychiatric research. Psychiatry Res1997; 72: 201-212.
69
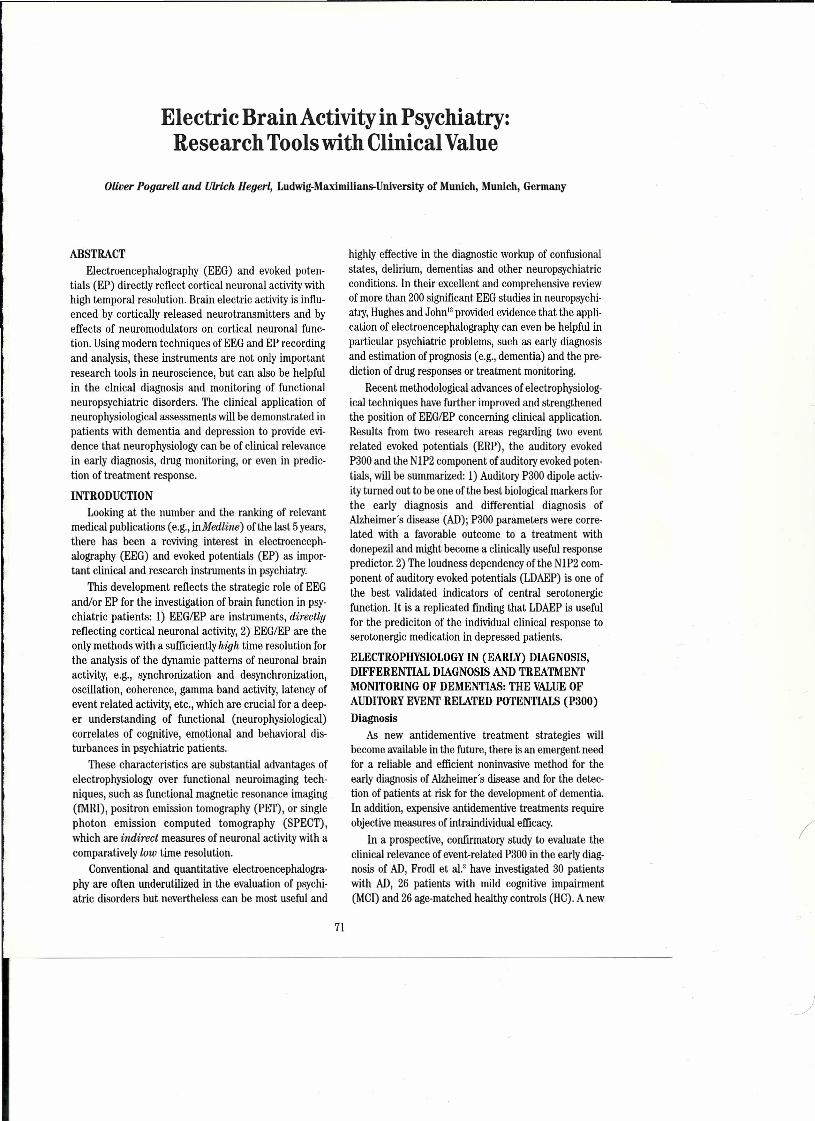
Electric BrainActivityin Psychiatry:Research Tools with Clinical Value
Olioer Pogarell and lJlrich Hegerl, Ludwig-Maximilians-University of Munich, Munich, Germany
ABSTRACTElectroencephalography (EEG) and evoked poten-
tials (EP) directly reflect cortical neuronal activity withhigh temporal resolution. Brain electric activity is influ-enced by cortically released neurotransmitters and byeffects of neuromodulators on cortical neuronal func-tion. Using modern techniques of EEGand EP recordingand analysis, these instruments are not only importantresearch tools in neuroscience, but can also be helpfulin the cInical diagnosis and monitoring of functionalneuropsychiatric disorders. The elinical application ofneurophysiological assessments will be demonstrated inpatients with dementia and depression to provide evi-dence that neurophysiology can be of elinical relevancein early diagnosis, drug monitoring, or even in predic-tion of treatment response.
INTRODUCTIONLooking at the number and the ranking of relevant
medical publications (e.g., inMediine) ofthe last 5 years,there has been a reviving interest in electroenceph-alography (EEG) and evoked potentials (EP) as impor-tant elinical and research instruments in psychiatry.
This development reflects the strategic role of EEGand/or EP for the investigation of brain function in psy-chiatric patients: 1) EEGIEP are instruments, direetlyreflecting cortical neuronal activity, 2) EEGIEP are theonly methods with a sufficiently high time resolution forthe analysis of the dynamic patterns of neuronal brainactivity, e.g., synchronization and desynchronization,oscillation, coherence, gamma band activity, lateney ofevent related activity, ete., which are crucial for a deep-er understanding of functional (neurophysiological)correlates of cognitive, emotional and behavioral dis-turbances in psychiatric patients.
These characteristics are substantial advantages ofelectrophysiology over functional neuroimaging tech-niques, such as functional magnetic resonance imaging(fMR!), positron emission tomography (PET), or singlephoton emission computed tomography (SPECT),which are indireel measures of neuronal activity with acomparatively law time resolution.
Conventional and quantitative electroencephalogra-phy are often underutilized in the evaluation of psychi-atric disorders but nevertheless can be most useful and
highly effective in the diagnostic workup of confusionalstates, delirium, dementias and other neuropsychiatricconditions. In their excellent and comprehensive reviewof more than 200 significant EEGstudies in neuropsychi-atry, Hughes and John" provided evidence that the appli-cation of electroencephalography can even be helpful inparticular psychiatric problems, such as early diagnosisand estimation ofprognosis (e.g., dementia) and the pre-dietion of drug responses or treatment monitoring.
Recent methodological advances of electrophysiolog-ical techniques have further improved and strengthenedthe position of EEGIEP concerning elinical application.Results from two research areas regarding two eventrelated evoked potentials (ERP), the auditory evokedP300 and the NIP2 component of auditery evoked poten-tials, will be summarized: 1) Auditery P300 dipole activ-ity turned out to be one of the best biological markers forthe early diagnosis and differential diagnosis ofAlzheimer's disease (AD); P300 parameters were corre-lated with a favorable outcome to a treatment withdonepezil and might become a c1inicallyuseful responsepredictor. 2) The loudness dependency of the N1P2 com-ponent of auditory evoked potentials (LDAEP) is one ofthe best validated indicators of central serotonergicfunction. it is a replicated finding that LDAEPis usefulfor the prediciton of the individual elinical response toserotonergic medication in depressed patients.
ELECTROPHYSIOLOGY IN (EARLY) DIAGNOSIS,DIFFERENTIAL DIAGNOSIS AND TREATMENTMONlTORING OF DEMENTıAS: THE VALUE OFAUDITORY EVENT RELATED POTENTIALS (P300)Diagnosis
As new antidementive treatment strategies willbecome available in the fııture, there is an emergent needfor a reliable and efficient noninvasive method for theearly diagnosis of Alzheimer s disease and for the detec-tion of patients at risk for the development of dementia.In addition, expensive antidementive treatments requireobjective measures of intraindividual efficacy.
In a prospective, confirmatory study to evaluate theelinical relevance of event-related P300 in the early diag-nosis of AD, Frodl et al," have investigated 30 patientswith AD, 26 patients with mild cognitive impairment(MCI) and 26 age-matched healthy controls (HC). A new
71
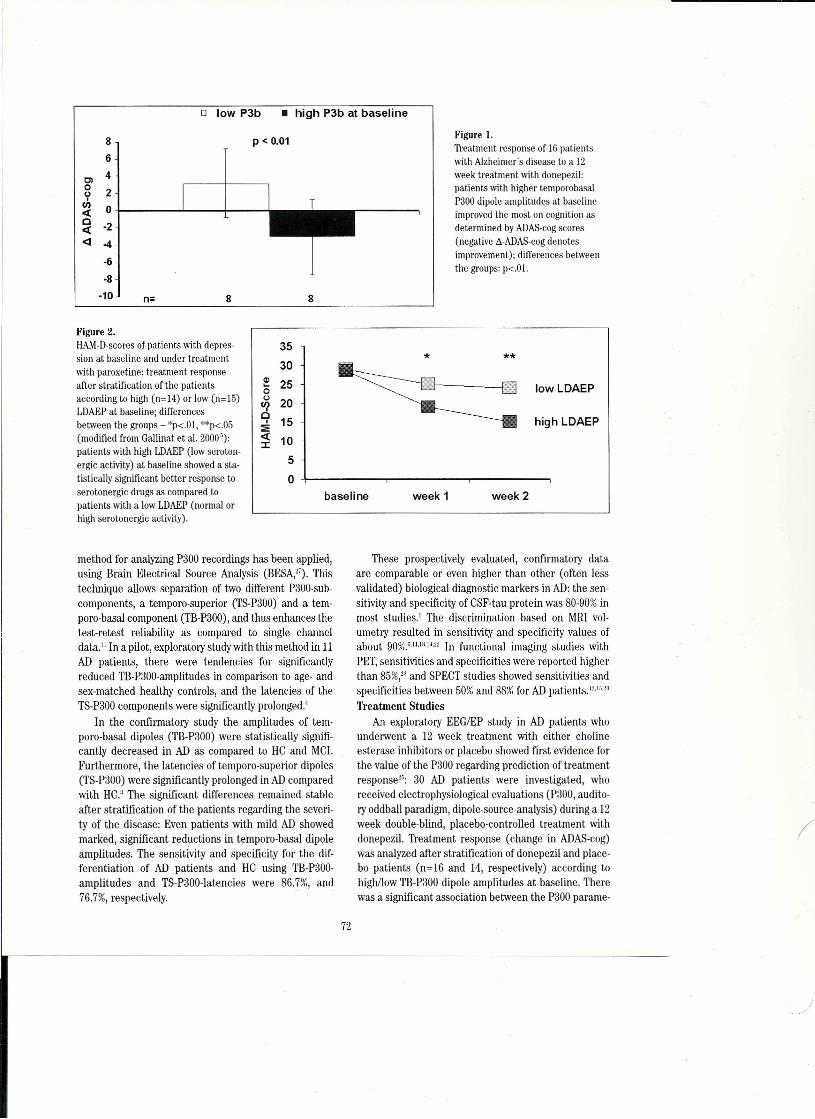
D low P3b • high P3b at baseline
Figure ı.Treatment resporise of lü patientswith Alzheimers disease to a 12week treatment with donepezil:patients with higher temporobasalP300 dipele amplitudes at baselineimproved the most on eognilion asdetermined by ADAS-eogscores(negative LI.-ADAS-cogdenetesimprovement); differenees betweeııthe groups: p<.OI.
86
cı 4o
2o,ci) O i~O -2~<i -4
-6
-8-10 n=
Flgure 2.HAM-D-seoresof patients with depres-sion at baseline and under treatmentwith paroxetine: treatment responseafter stratification of the patientsaccording to high (n=14) or low (n=15)LDAEPat baseline; differencesbetween the groups - *p<.OI, **p<.05(modified from Gallinat et aL.2000'):patients with high LDAEP (Iow seroton-ergic activity) at baseline snowed a sta-tistically significant better response toserotonergic drugs as comparedtopatients with a low LDAEP (normal orhigh serotonergic activity).
8
p < 0.01
8
* **35
30
e 25O
ıi? 20O:ı1: 15~ 10::i:
5O
lowLDAEP
high LDAEP
baseline week 1 week 2
method for analyzing P300 recordings has been applied,using Brain Electrical Source Analysis (BESA,t7).Thistechnique allows separation of two different P300-sub-components, a temporo-superior (TS-P300) and a tem-poro-basal component (TB-P300),and thus enhances thetest-re test reliability as compared to single channeldata." In a pilot, exploratory study with this method in IIAD patients, there were tendencies for significantlyreduced TB-P300-amplitudes in comparison to age- andsex-matched healthy controls, and the latencies of theTS-P300components were significantly prolorıged.'
In the confırmatory study the amplitudes of tem-poro-basal dipoles (TB-P300) were statistically signifı-cantly decreased in AD as compared to HC and MC!.Furthermore, the latencies of temporo-superior dipoles(TS-P300) were significantly prolonged in ADcomparedwith HC."The significant differences remained stableafter stratification of the patients regarding the severi-ty of the disease: Even patients with mild AD showedmarked, significant reductions in temporo-basal dipoleamplitudes. The sensitivity and specificity for the dif-ferentiation of AD patients and HC using TB-P300-amplitudes and TS-P300-latencies were 86.7%, and76.7%,respectively.
These prospectively evaluated, confırmatory dataare comparable or even higher than other (often lessvalidated) biologica] diagnostic markers in AD:the sen-sitivity and specificity of CSF-tau protein was 80-90%inmost studies.' The discrimination based on MR! vol-umetry resulted in sensitivity and specificity values ofabout 90%.11'14,1<"11.,,In functional imaging studies withPET,sensitivities and specificities were reported higherthan 85%,'"and SPECTstudies showed sensitivities andspecificities between 50%and 88%for ADpatients.t-":"Treatment Studies
An exploratory EEGIEP study in AD patients whourıderwent a 12 week treatment with either cholineesterase inhibitors or placebo snowed first evidence forthe value of the P300 regarding prediction of treatmentresponse": 30 AD patients were investigated, whoreceived electrophysiological evaluations (P300, audito-ry oddball paradigm, dipole-source-analysis) during a 12week double-blind, placebo-controlled treatment withdonepezil. Treatment response (change in ADAS-cog)was analyzed after stratifıcation of donepezil and place-bo patients (n=16 and 14, respectively) according tohigh/low TB-P300 dipole amplitudes at baseline. Therewas a signifıcant association between the P300 parame-
72
)
ters at baseline and the mean change in ADAS-cogscores after 12weeks on treamtent: patients with a highP300 amplitude at baseline showed a statistically sig-nificant better treatment response after 12 weeks onverum medication (p<O.OI) (Figure 1). The correspon-ding analyses in the placebo group did not show statis-tically significant differences. This pilot study data pro-vided preliminary evidence that P300 and dipole sourceanalysis may be a useful tool to predict treatmentresponse in ADpatients.
In summary, the event-related P300 presents an easyto perform, non-invasive and reliable diagnostic tool andmight offer complementary information on AD,even forthose patients with mild AD.The P300 diagnostic instru-ments are accurate, clinically available, nonexpensive,noninvasive and reliable markers for AD and might beuseful for the prediciton of treatment response.ASSESSMENT OF THE CENTRAL SEROTONERGICFUNCTIONlNG USING EVOKED POTENTIALS:LDAEP FOR RESPONSE PREDICTIONAND TREATMENT MONlTORING
In many depressed patients, there is a need for drugtrials with several different antidepressants, in order toreach a successful treatment at last. To finally evaluatethe definite non-response of the individual patient to acertain medication, therapists have to await a period ofat least two to three weeks, due to the known Iateney ofthe antidepressant drug effects. In case of non-response, requiring repeated drug trials, this procedureis not only time consuming, but furthermore leads toinereasing distress for the patient and may even raisethe risk of self-harm and suicide.
The development of a neurobiological parameter, asa reliable instrument for the prediction of the individualresponse to antidepressive drugs would allow to imme-diately provide adequate treatment, to shorten the dis-ease process and thus to prevent possible chronificationor therapy-resistance. Additionally, indirect and directcost of treatment could significantly be reduced.
On the basis of today's pathophysiological knowledgeof depression, there is arising number of antidepressantdrugs that selectively influence either the central sero-tonergic or noradrenergic neurotransmission - such asSSRI or NAR!. The use of serotonergic medicationshould primarily be administered in patients, whose dis-
ease is a consequence of a low central serotonergicactivity. However, the identification of this group ofpatients is difficult using biochemical markers thatmainly refiect the peripheral seronotergic activity.
Within the last years, several preclinical and elinicalstudies showed that the loudness dependence of audi-tory evoked potentials (LDAEP) is avaiid indicator ofthe central serotonergic system.,,·ıu.ır..17 The NIP2 sub-component of the AEP, which can be identified usingthe dipole source analysis (BESA"), showed a strongrelationship to the functioning of the serotonergic sys-tem: the LDAEPof the NIP2 components of the primaryauditory cortex is high, when the activity of the sero-tonergic system is law, and vice versa. The elinicalvalue of this variable for prediction of treatment withserotonergic antidepressants has alteady been con-firmed in several elinical studies.
Patients with a strong LDAEP before therapy, i.e.,law serotonergic activity, showed a favorable responseto fluoxetine," fluvoxamine,"fenfluramine,' paroxetine,'and to the acute antidepressive or relapse prophylactictreatment with lithium," compared to patients with aweak LDAEP,indicating arather high or normal sero-tonergic activity (Figure 2). it is currently under inves-tigation whether these latter patients (weak LDEAP,i.e., normal serotonergic activity) respond best to nora-drenergic, rather than serotonergic drugS.21•21;
A reliable prediction of antidepressive treatmentresponse is of greatest elinical relevance by avoidingimportant unfavorable factors (i.e., sustained sufferingof the patient, increased suicide risk, risk of therapy-resisteney and chronicity, high direct and indirect costof treatment). A considerable number of studies show,right now, that the response to antidepressive pharrna-cotherapy (esp. to SSRI) can successfully be predictedby LDAEP-which is by far the best validated indicatorof the central serotonergic system to date. Our ownexperiences have shown that this easily available tool isof value in elinical practice to estimate the success ofserotonergic medication.
In conclusion, these two research areas in psychiatryhighlight the use and applicability of modem electro-physiology (evoked potentials) in patient managementand care and show that these techniques provide benefitnot only for research but also for daily elinical routine.
73
REFERENCES1. Andreasen N, Vanmechelen E, Vande VoordeA, Davidsson
P, Hesse C, Tarvonen S, et aL.Cerebrospinal fluid tau pro-tein as a biochemical marker for Alzheimers disease: acommunity based follow up study. J Neurol NeurosurgPsychiatry 1998;64: 298-305.
2. Bruneau N, Barthelemy C, Roux S, Jouve J, Lelord G.Auditory evoked potential modifications according to clin-ical and biochemical responsiveness to fenfluraminetreatment in children with autistic behavior. Neuropsy-chobiology 1989;21: 48-52.
3. Frodl T, Hampel H, Juckel G, Bürger K, Padberg F, Engelım, et aL.Value of event-related P300 subcomponents inthe elinical diagnosis of mi/d cognitive impairment andAlzheimers disease? Psychophysiology 2002; 39: 175-181.
4. Frodl-Bauch T, Clotz F, Padberg F, Juckel G, Stübner S,Bürger K, Hampel H, et aL.Auditory evoked P300 subcom-ponents in patients with probable dementia of theAlzheimer s type (DAT).Pharmacopsychiatry 1997;30: 168.
5. Gallinat J, Bottlender R, Juckel G, Munke-Puchner A,Stotz G, Kuss HJ, et aL.The loudness deperideney of theauditery evoked Nl/P2-component as a predictor of theacute SSRI response in depression. Psychopharmacology2000; 148: 404-411.
6. Golebiowski M, Barcikowska M, Pfeffer A. Magnetic reso-nance imaging-based hippocampal volumetry in patientswith dementia of the Alzheimer type. Dement Geriat CognDisorder 1992; ıo. 284-288.
7. Hegerl U, Herrmann WM,U!rich G, Muller-OerlinghausenB. Effects of lithium on auditory evoked potentials inhealthy subjects. Biol Psychiatry 1990;27: 555-560.
8. Hegerl U, Wulff H, Muller-Oerlinghausen B. Intensitydependence of auditoryevoked poterıtials and elinicalresponse to prophylacticlithium medication: a replica-tion study. Psychiatry Res 1992;44: 181-190.
9. Hegerl U, Juckel G. Intensity dependence of auditoryevoked potentials as an indicator of central serotonergicneurotransmission: a new hypothesis. Biol Psychiatry1993; 33: 173-187.
10. Hegerl U, Juckel G. Auditory evoked dipole source activi-ty: indieator of central serotonergic dysfunction in psychi-atric patients? Pharmacopsychiatry 1994;27: 75-78.
lL. Hegerl U, Frodl-Bauch T. Dipole source analysis of P300component of the auditory evoked potential: a method-ological advance? Psychiatry Res 1997;74: 109-118.
12. Holman BL,Johnson KA,Gerada B, Carvalho PA,Satıin A.The scintigraphic appearance of Alzheirners disease: aprospective study using Technetium-99mSPECT. JNuclear Med 1992;33: 181-185.
13. Hughes JR, John ER. Conventional and quantitative elec-troencephalography in psychiatry. J Neuropsychiatry ClinNeurosci 1999; 11: 190-208.
14. Jack CR, Peterson RC, O'Brien P, Tanaglos EG. MR-basedhippocampal volumetry in the diagnosis of Alzheimersdisease. Neurology 1992;42: 83-88.
15. Johnson KA,Holman BL, Rosen TJ, Nagel JS, English RJ,Growdon JH. lofetamine i 123 single photon emissioncomputed tomography is accurate in the diagnosis ofAlzheimers disease. Arch Intern Med 1990; 150: 752-756.
16. Juckel G, Hegerl U, Molnar M, Csepe V, Karmos G.Auditory evoked potentials reflect serotonergic neuronalactivity - a study in behaving cats administered drugsacting on 5-HTIAautoreceptors in the dorsal raphe nucle-us. Neuropsychopharmacology 1999;21: 710-716.
17. Juckel G, Molnar M, Hegerl U, Csepe V, Karmos G.Auditory-evoked potentials as indicator of brain seroton-ergic activity - first evidence in behaving cats. BiolPsychiatry 1997;41: 1181-95.
18. Kesslack JP, Nalcioglu O, Cotman Cw. Quantification ofmagnetic resonance seans for hippocampal and parahip-pocampal atrophy in Alzheimers disease. Neurology 1991;41: 51-54.
19. Laakso MP, Soininen H, Partanen K, Lehtovirta M,Hallikainen M,Hanninen T,et aL.MRIof the hippocampusin Alzheimers disease: sensitivity, specificity, and analy-sis of the incorrectly classified subjects. Neurobiol Aging1998; 19:23-31.
20. Müller H, Möller HJ, Stippel A. SPECT patterns in proba-ble Alzheimers disease. Eur Arch Psychiat Clin Neurosci1999;249: 190-196.
21. Mulert C, Pogarell O, Brunnmeier M, Juckel G, Hegerl U.Prediction of treatment response in major depression: therelationship between the serotonin-related LDAEPand theunspeciiic prediction related to anterior cingulate cortexactivity. Pharmacopsychiatry 2003;36: 248-249.
22. O'Brien JT,Desmond P,Ames D,Schweitzer I, Chiu E,TressB (1997). Temporal lobe magnetic resonance imaging candifferentiate Alzheimers disease from normal ageing,depression, vascular dementia and other causes of cogni-tive impairment. Psychological Medicine, 27:1267-1275.
23. Ohyama M, Serıda M, Mishina M, Kitamura S, Tanizaki N,Ishii K, Katayama Y (2000). Semi-automatic ROl place-ment system for analysis of brain PET images based onelastic model: application to diagnosis of Alzheimers dis-ease. Keio Journal of Medicine, 49:105-106.
24. Paige SR, Fitzpatriek DF, Kline JP, Balogh SE, HendricksSE (1994).Event-related potential amplitude/intensityslopes predict response to antidepressants. Neuropsy-chobiology,30:197-201.
25. Pogarell O, Schulz C, Juckel G, Mueller-Siecheneder F,Laux G, Bahra R, Zhang R, Hegerl U (2001). Auditeryevoked P300 and treatment response to donepezil inpatients with Alzheimers disease. World J BiolPsychiatry, 2:264.
26. Pogarell O, Müller-Siecheneder F, Mulert C, Folkerts M,Frodl T, Juckel G, Hegerl U. Effects of citalopram andreboxetine on the loudness dependence of auditoryevoked potentials in patients with major depression.Pharmacopsychiatry 2003; 36: 253.
27. Scherg M, von Cramon D (1985). A new interpretatiorı ofthe generaters of BAEPwaves I-V:results of a spatio-tem-poral dipole modeL. Electroencephalographic ClinicalNeurophysiology,62:290-299.
28. Scherg M, Picton TW (1991). Separation and identifica-tion of event-related potential components by brain elec-trical source analysis. In. Brunia CHM, Mulder G,Verbraten MN(eds.). Event-related brain Research. (EEGsuppI42.), Elsevier, Amsterdam, pp. 24-37.
/
74
•
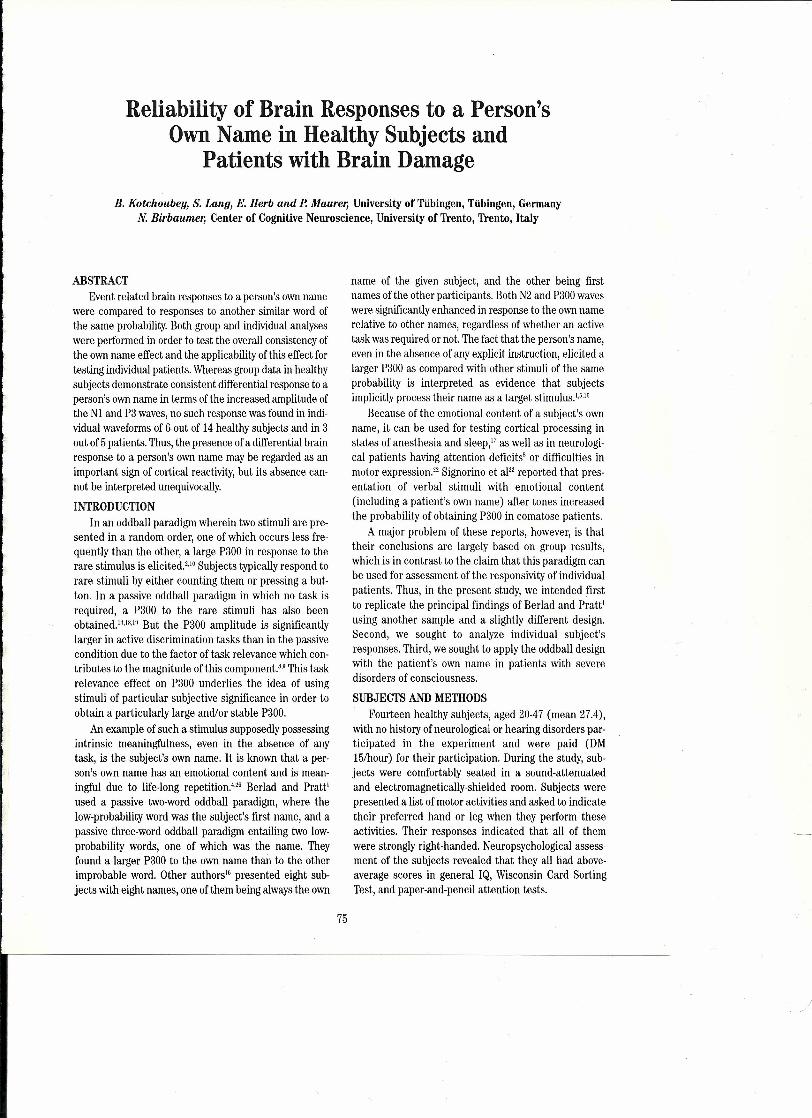
Reliability of Brain Responses to a Person'sOwnName in Healthy Subjects and
Patients with Brain Damage
B. Kotchoubeş, S. Lang, E. Herb and P. Maurer, University of Tübingen, Tübingen, GermanyN. Birbaumer, Center of Cognitive Neuroscience, University of Trento, Trento, ltaly
ABSTRACTEvent re!ated brain responses to a person's own name
were compared to responses to another similar word ofthe same probability. Both group and individua! ana!yseswere performed in order to test the overall consisteney ofthe own name effect and the app!icability of this effect fortesting individua! patients. Whereas group data in healthysubjects demonstrate consistent differentia! response to aperson's own name in terms of the increased amplitude ofthe NI and P3 waves, no such response was found in indi-vidua! waveforms of 6- out of 14 healthy subjects and in 3out of 5 patients. Thus, the presence of a differentia! brainresponse to a person's own name may be regarded as animportant sign of cortica! reactivity, but its absence can-not be interpreted unequivocally.
INTRODUCTIONIn an oddball paradigm wherein two stimuli are pre-
sented in a randam order, one of which occurs !ess fre-quently than the other, a large P300 in response to therare stimu!us is elicited.v" Subjects typically respond torare stimuli by either counting the m or pressing a but-ton. In a passive oddball paradigm in which no task isrequired, a P300 to the rare stimuli has alsa beenobtained.r-'v" But the P300 amplitude is significantlylarger in active discrimination tasks than in the passivecondition due to the factor of task relevance which con-tributes to the magnitude of this component." This taskrelevance effect on P300 underlies the idea of usingstimuli of particular subjective significance in order toobtain a particularly large and/or stable P300.
An example of such a stimulus supposedly possessingintrinsic meaningfulness, even in the absence of anytask, is the subject's own name. it is known that a per-son's own name has an emotional content and is mean-ingful due to life-Iong repetition.'> Berlad and Pratt'used a passive two-word oddball paradigm, where thelow-probability word was the subject's first name, and apassive three-word oddball paradigm entailing two low-probability words, one of which was the name. Theyfound alarger P300 to the own name than to the otherimprobable word. Other authors" presented eight sub-jects with eight names, one of them being always the own
name of the given subject, and the other being firstnames of the other participants. Both N2 and P300 waveswere significantly enhanced in response to the own namerelative to other names, regardless of whether an activetask was required or not. The fact that the person's name,even in the absence of any explicit instruction, elicited alarger P300 as compared with other stimuli of the sameprobability is interpreted as evidence that subjectsimplicitly process their name as a target stimulus.v-"
Because of the emotional content of a subject's ownname, it can be use d for testing cortical processing instates of anesthesia and sleep," as well as in neurologi-cal patients having attention deficits' or difficulties inmotor expression." Signorino et al" reported that pres-entation of verbal stimuli with emotional content(including a patient's own name) after tones increasedthe probability of obtaining P300 in comatose patients,
A major problem of these reports, however, is thattheir conclusions are largely based on group results,which is in contrast to the daim that this paradigm canbe use d for assessment of the responsivity of individualpatients. Thus, in the present study, we intended firstto replicate the principal findings of Berlad and Pratt'using another sample and a slightly different design.Second, we sought to analyze individual subject'sresponses. Third, we sought to apply the oddball designwith the patient's own name in patients with severedisorders of consciousness.
SUBJECTS AND METHODSFourteen healthy subjects, aged 20-47 (mean 27.4),
with no history ofneurological or hearing disorders par-ticipated in the experiment and were paid (DM15/hour) for their participation. During the study, sub-jects were comfortably seated in a sound-attenuatedand electromagnetically-shielded room, Subjects werepresented a list of motor activities and asked to indicatethe ir preferred hand or leg when they perform theseactivities. Their responses indicated that all of themwere strongly right-handed. Neuropsychological assess-ment of the subjects revealed that theyall had above-average scores in general IQ, Wisconsin Card SortingTest, and paper-and-pencil attention tests.
75
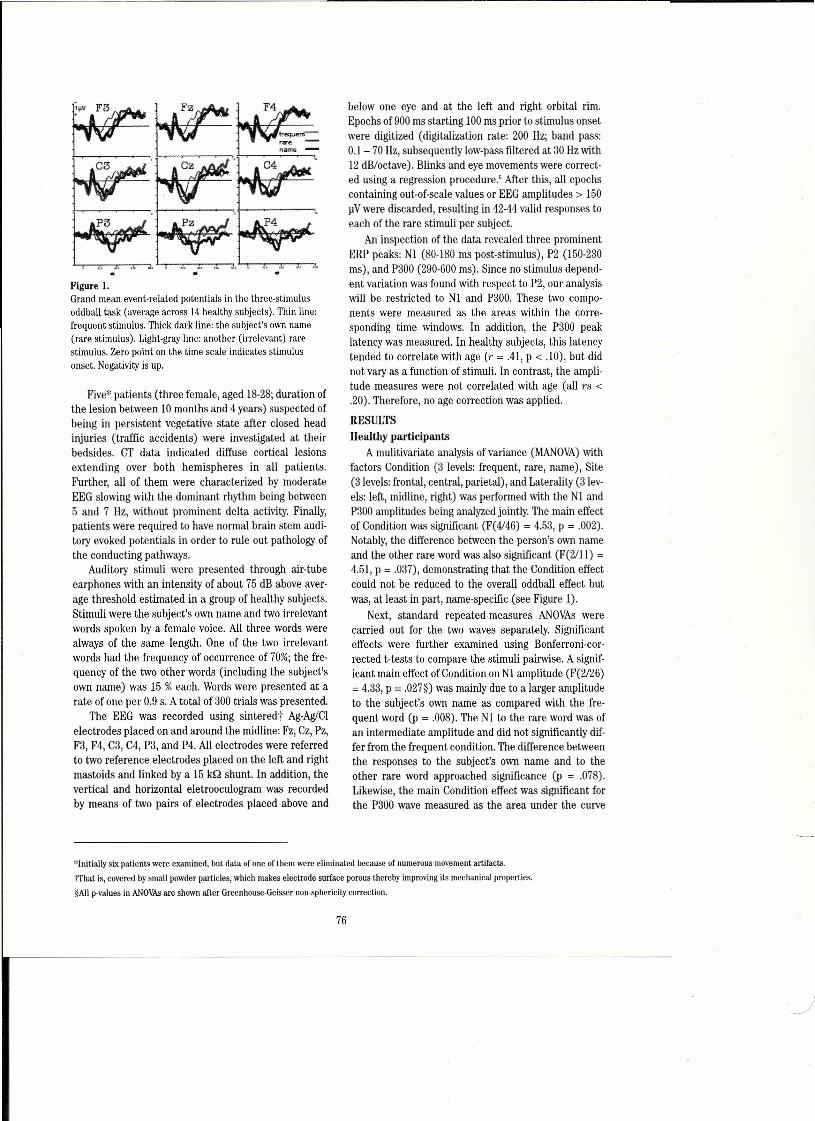
~
~~V F3 ~Z frequent-
rcıre -
,ı-.._~~n;.::.:.:..m.::.---,
~1~1§:~·~~'~
• .••• Ol. •• •• • •• co •• ., • .' •• •..• •••.Figure ı.Grand mean event-related potentials in the three-stimulusoddball task (average across 14 healthy subjects). Thin line:frequent stimulus. Thick dark line: the subject's own name(rare stimulus). Light-gray line: arıother (irrelevant) rarestimulus. Zero point on the time scale indicates stimulusonset. Negativity is up.
Five* patients (three female, aged 18-28; duration ofthe lesion between LO months and 4 years) suspected ofbe ing in persistent vegetative state after closed headinjuries (traffic accidents) were investigated at theirbedsides. CT data indicated diffuse cortical lesionsextending over both hemispheres in all patients.Further, all of them were characterized by moderateEEG slowing with the dominant rhythm being between5 and 7 Hz, without prominent delta activity. Finally,patients were required to have normal brain stern audi-tory evoked potentials in order to rule out pathology ofthe conducting pathways.
Auditory stimuli were presented through air-tubeearphones with an intensity of about 75 dB above aver-age threshold estimated in a group of healthy subjects.Stimuli were the subject's own name and two irrelevantwords spoken by a female voice. All three words werealways of the same length. One of the two irrelevantwords had the frequency of occurrence of 70%; the fre-quency of the two other words (including the subject'sown name) was 15 % each. Words were presented at arate of one per 0.9 s. A total of 300 trials was presented.
The EEG was recorded using sintered] Ag-Ag/CIelectrodes placed on and around the midline: Fz, Cz, Pz,F3, F4, C3, C4, P3, and P4. All electrodes were referredto two reference electrodes placed on the left and rightmastoids and linked by a 15 kQ shunt. In addition, thevertical and horizontal eletrooculogram was recordedby means of two pairs of electrodes placed above and
below one eye and at the left and right orbital rim.Epochs of 900 ms starting 100 ms prior to stimulus onsetwere digitized (digitalization rate: 200 Hz; band pass:0.1 -70 Hz, subsequently Icw-pass filtered at 30 Hz with12 dB/octave). Blinks and eye movements were correct-ed using a regression procedure." After this, all epochscontaining out-of-scale value s or EEG amplitudes > 150ııV were discarded, resulting in 42-44 valid responses toeach of the rare stimuli per subject.
An inspection of the data revealed three prominentERP peaks: NI (80-180 ms post-stimulus), P2 (150-230ms), and P300 (290-600 ms). Since no stimulus depend-ent variation was found with respect to P2, our analysiswill be restricted to NI and P300. These two compo-nents were measured as the areas within the corre-sponding time windows. In addition, the P300 peakIateney was measured. In healthy subjects, this Iateneytended to correlate with age (r = .41, p < .10), but didnot vary as a function of stimuli. In contrast, the arnpli-tude measures were not correlated with age (all rs <.20). Therefore, no age correction was applied.
RESULTSHealthy participants
A mulitivariate analysis of variance (MANOVA) withfaetors Condition (3 levels: frequent, rare, name), Site(3Ievels: frontal, central, parietal), and Laterality (3Iev-els: left, midline, right) was performed with the NI andP300 amplitudes be ing analyzed jointly. The main effectof Condition was significant (F(4146) = 4.53, p = .002).Notably, the difference between the person's own nameand the other rare word was also signifieant (F(2111) =4.51, p = .037), demonstrating that the Condition effectcould not be reduced to the overall oddball effect butwas, at least in part, name-specific (see Figure 1).
Next, standard repeated-measures ANOVAs werecarried out for the two waves separately. Significanteffects were further examined using Bonferroni-cor-rected t-tests to compare the stimuli pairwise. A signif-icant main effect of Condition on NI amplitude (F(2/26)= 4.33, p = .027*) was mainly due to alarger amplitudeto the subject's own name as compared with the fre-quent word (p = .008). The NI to the rare word was ofan intermediate amplitude and did not significantly dif-fer from the frequent condition. The difference betweenthe responses to the subject's own name and to theother rare word approached significance (p = .078).Likewise, the main Condition effect was significant forthe P300 wave measured as the area ünder the curve
*Initially six paticnts were examined, but data of one of the m were eliminated because of numerous movement artifacts.tThat is, covered by smail powder particles, which nıakes electrode surface porous thereby improving its mechanical properties.§AUp-values in ANOVAsare shown arter Greenhouse-Geisser non-sphericity correction.
76
J
Fz
ı-~ __-r__-T__~~ __ 'at ••. •• i •
•••
frequentrare M'!ıı!"!!__ : _T.name
Figure 2.Event-related brain potentials of patient 5 in the same three-stimulus oddball task, recorded at midline electrode sites.The legend see Figure ı. Note a large (highly significant)fronto-central negativity in response to the own name,instead of the expected enhanced P300.
(F(2/26) = 5.96, p = .009) and as peak amplitude(F(2/26) = 5.62, p = .011). Both rare words elicited larg-er P300 amplitudes than the frequent word (p < .001),but the difference between the two rare conditions didnot approach signifıcance (p = .30).
A careful inspection of the data revealed a subjectwhose P300 amplitude to the rare stimulus exceededthe mean plus three standard deviations of the remain-ing thirteen subjects. Thus the group analysis wasrepeated with the data of that subject being dismissed.The main effects of Condition on both N 1 and P300remained highly signifıcant. However, there was no dif-ferences in terms of the NI amplitude between the tworare words any longer (p = .36). On the other hand, thecorresponding difference for the P300 amplitude provedto be signifıcant (F(lI12) = 7.58, p = .018), indicatingthe larger P300 to theperson's own name than to theother stimulus of the same probability.
The signifıcance of name-related effects in individ-ual waveforms was fırst tested using univariate statis-tics identieal to those employed for group analysis. That
is, the mean amplitude was measured in single trials inthe same NI and P300 time windows. This was followedby an ANOVAwith within-subject factors Site (frontal,central, and parietal) and Laterality (left, midline,right). Condition (3 levels: frequent, rare, name) washere regarded as a "between-subject" factor, as "sub-ject" in this analysis was equivalent to a single trial.
Although the main effect of Condition and/or itsinteractions with topographical factors was signifieant in12 of 14 subjects, in 5 subjects this effeet was attributedsolely to alarger P300 amplitude to both rare stimuli ascompared with the frequent stimulus, thus indicatingonly the well-known oddball effect without a specificreaction to the own name. Only in 7 subjects (50%) theP300 was signifıcantly larger to the subject's own nameversus the other rare stimulus [F(lIS7) ranging from 3.47to 12.31,with p-values ranging from .066 to .0001].
The differenees in the NI window did not attain the.05 level of signifıcance in the univariate analysis ofindividual responses. However, it was possible thatthese differences would additionally contribute to sepa-ration of responses to the person's own name versusirrelevant rare stimuli. For this sake a diseriminantanalysis was eondueted with 18 independent variables(9 electrodes by two time windows) and Condition(name versus rare) as a eriterion variable. Like in theunivariate analysis, single trials (42-44 in each condi-tion) were taken as the units of the analysis.
Of the 7 subjeets with signifıeant univariate resultsdepicted above, 6 also demonstrated a statistically sig-nifıcant stimulus effeet in the discriminant analysis (pfrom .040 to .0001). In 5 of them lower p-values wereobtained in the discriminant analysis than in theunvariate analysis (in one subject, both techniquesresul ted in p < .0001), thus suggesting that diserimi-nant analysis had greater power in this eontext.Furthermore, significant differences between theresponses to the subject's own name and to the otherrare word were obtained in two additional participants[FO/87) = 4.77, p =.032; and FO/S7) = 5.79, p = .019]who did not show this effect with univariate analysis. Onthe other hand, one subject with a signifıeantly largerP300 amplitude to the name than to the other rare word(F(lI87) = 4.S1, p = .031) failed to attain statistieal sig-nifıcance in the discriminant anaIysis. Identical resultswere obtained when a multivariate analysis of variance(MANOVA)with single-trial data was performed.Patients
The same 3-way analysis of variance with faetorsCondition, Site, and Laterality was carried out for eachpatient on the basis of single trial data. lmportantly, theintercept in the ANOVAfor the NI time window washighly signifıeant in all fıve patients (p-values < .001).This intereept tests whether the general mean value of
77

the analyzed data is different from zero. Therefore, itssignificance demonstrates that the patients' valueswere, indeed, negative, that is, that exogenous corticalERP components were present. No effect of Conditionon the NI or P300 was found in three of five patients. Inpatient 4, the main effect of Condition (p = .021) wasmostly due to a miıch larger P300 amplitude to thispatient's own name than to the frequent stimulus (p =.005). The P300 to the patient's name also tended to belarger than to the other rare stimulus (p = .lü).
In patient 5 (f, 24, four years since head injury witha questionable vegetative state), substantial differencesin both NI and P300 intervals were found. The analysisof NI amplitude resulted in a highly significantCondition x Laterality interaction (p = .007), which wasattributed to a larger NI to the patient's own name ascompared with the frequent word over the right hemi-sphere (p = .033). Furthermore, the response to thepatient's name was characterized by a large fronto-cen-tral negative wave during the P300 interval (see Figure2). At the same time, the rare irrelevant word elieited,as expected, a large positive wave with a parietal maxi-mum. This resUıted in a significant main effect ofCondition (p = .014) as well as a Site x Condition inter-action (p = .022). As can be seen in Figure 2, this effectwas mainly due to a large and highly-significant differ-ence between the two rare stimuli (p = .002).
This result is indirectly validated by the fact thatthis patient also exhibited reliable P300 amplitude dif-ferences between rare and frequent stimuli in oddballtasks with two vowels (Site x Conditiorı interaction, p =.022, indicating a parietal P300 effect) and with twochords (main effect of Oondition, p = .053).
DlSCUSSIONFirst of all, the present data agree with the previous
findings' indicating alarger P300 to the person's ownname in healthy subjects. Previous studies also found asmail but consistent increase of the Nı amplitude to theown name (see also," for asimilar finding in a differentparadigm). This finding was also replicated in the pres-ent experiment. Thus ERP responses to a person's ownname are shown to consistently differ from the respons-es to other similar stimuli, notwithstanding numerousmethodological differences among the studies whichincluded different control words, different interstimulusintervals, cultural/language differences between subjects(e.g., German in the present studyvs. Hebrew in i), etc.
The fact that NI amplitude was increased (with anonset latency of about 80-90 ms) indicates an impor-tant role of very early attentional processes in the pro-cessing of a person's own name. Probably, after a cou-ple of presentations subjects recognized the signifi-cance of their own names immediately after the pres-entation of the first phoneme. A magnetoencephalo-
graphic (MEG) study is now being prepared with thepurpose of localizing the brain structures responsiblefor this very early processing.
On the other hand, the data of individual participantsindicate that these consistent group effects (i.e., theinerement of the amplitudes of the Nı and P300 compo-nents) can be attributed to a relatively smail number(slightly more than 50%) of the subjects. Not only werethere outliers like the person mentioned above whoexhibited an extremely hig~P300 amplitude to the irrel-evant rare word, but a quite usual amplitude to his ownname. Also some other subjects' ERPs did not statistical-Iy differ between these subjects' own names and theother stimulus of the same probability. In their post-experimental verbal reports, these completely healthysubjects reported that they fully recognized their namesand wondered why it was necessary to adjust the stimu-lation program especially for them. Nevertheless, thesecognitions were not reflected in their brain waves.Moreover,visual inspection of these waves suggests thatthis negative finding is probably not due to the low sta-tistical power of the tests, and, thus, it is improbable thatthis result would improve with an increased number oftrials. Furthermore, the lack of ERP differences cannotbe attributed to topographical distribution of the compo-nents. if topographical effects attained significance (usu-ally, this was a Site x Condition interaction), they simplyreflected the well-known oddball effect, that is, alargerP300 over the parietal cortex in response to both rarewords as compared with the frequent word.
Regarding the patients' data, it should first be notedthat the smail patient sample was rather homogenouswith respect to age (young), etiology (head trauma),behavioral status (complete or nearly complete non-responsiveness), course (chronic), GT findings (diffusecortical lesions), and the EEG pattern (predominanttheta activity). Normal brain stern potentials as well asthe highly significant Nı component clearly indicatethat acoustic information did arrive at the auditory cor-tex of these patients.
In three patients, in which no differential responseto their own name was found, no endogenous ERP activ-ity such as P300 or mismatch negativity was observed inoddball tasks. In contrast, in the other two patients anoddball effect was evident. In one of the m the P300amplitude to this patient's own name tended to be larg-er than to the other rare stimulus, and in that case thedifference might have attained the .05significance levelif more trials were used. In the other patient, her ownname elicited not an enhanced P300 but rather a largeslow negativity, similar to an N400 wave or to the post-imperative negative variation found in schizophrenia":"and other psychiatric and neurological disorders.i:ı.2".~'Of course, this effect cannot be explained on the basis
78
)
r
of a single observation. However, it should be stressedthat this patient's responses significantly differentiatedamong the three types of stimuli, i.e., the frequent word,the rare word, and her own name. These findings maybe interpreted as evidence that the last two patientswere in a better condition than the first three, despitethe similar elinical and behavioral appearance. Theconsistency in the patients' ERP findings should, how-eve1', be taken with caution given the smail size of thepatient group.
it should be further noted that the last patient (i.e.,the one with the most consistent cortical responses)was alsa one with the lorıgest history of the disease (4years). This observation is at odds with what may beexpected on the basis of such terms as "persistant" or"permanent" vegetative state. it also indicates a possi-ble discrepancy between the state and the prognosis.Thus in acute coma, numerous data have been accumu-lated to date which demonstrate the predictive value ofEEG parameters, evoked potentials, and endogenousERP componentsj"·7.11.1r..24roughly speaking, the morenormal the brain waves, the better the prognosis.Urıfortunately, this relation seems less evident regard-
REFERENCES1. Berlad I, Pratt H. P300 in response to the subject's own
name. Eleetroeneephalogr Clin Neurophysiol 1995; 96:472-474.
2. Duncan-Johnson CC,Donchin E. The P300 component ofthe event-related brain potential as an index of informa-tion processing. Biol Psyehol 1982; 14: 1-52.
3. Fischer C, Morlet D, Giard MH. Mismatch negativity andN100 in comatose patients. Audiol Neuro-Otology2000;5:192-197.
4. Fischler I, Jin Y, Boaz T, Perry NW,Childers DG. Brainpoterıtials related to seeing one's own name. Brain Lang1987; 30: 245-262
5. Folmer R,YinglingC.Auditory P3 responses to name stim-uli. Brain Lang 1997; 56: 306-311.
6. Gratton G, Coles MGH,Donchin E. A new method for off-line removal of ocular artifacts. Electroencephalogr ClinNeurophysiol 1983; 55: 468-484
7. Guerit JM, Verougstraete D, Tourtehaninoff M, DebatisseD, Witdoeckt C. ERPs obtained with the auditory oddballparadigm in coma and altered states of conseiousness:elinical relationships prognostic value and origin of com-ponents. Clin Neurophysiol 1999; 110: 1260-1269.
8. Johnson R. The amplitude of the P300 component of theevent-related potential: reviewand synthesis. In: AcklesPK, Jennings JR, Coles MGH,(eds). Advances in Psycho-physiology. Greenwich, CT:JAI Press; 1988:69-138.
9. Johnson R. A triarchic model of P300 amplitude. Psycho-physiology 1986;23: 367-384.
ing patients in the chronic condition, because bothelectrophysiological'v" and positron emission tomegra-phy data=" indicate that, in general, patients who aremore responsiye at the time point of an examinationmay not be those who make more progress in follow-up.
To summarize, the three-word oddball paradigmwith the subject's own name can be used for assessmentof higher cortical functions in severely damagedpatients, but its results should be interpreted with cau-tion. While positive findings unequivocally indicate theability to differentiate between frequent and rare stim-uli (the classical oddball effect) or to perceive signifi-cant stimuli differently (a differential response to theown name), negative findings are meaningless, as thelack of ERP differences with respect to a person's ownname can be observed in many healthy subjects who aresurely able to perceive words and to behaviorallyrespond to the ir name when necessary.
ACKNOWLEDGMENTSThe study was supported by the German Research
Society (Deutcshe Forschungsgemeinschaft, DFG), SFB550 "Erkennen, Lokalisieren, Handeln." The authorsthank M. Riess for his technical assistance.
10. Johnson R, Donehin E. Sequential expeetancies and deci-sion making in a changing environment: an electrophysio-logical approaeh. Psychophysiology 1982; 19: 183-200.
ILKane NM, Moss TH, Curry SH, Butler, SR. Quantitativeelectroencephalographic evaIuation of non-fatal and fataltraumatic coma. EIectroencephalogr Clin Neurophysiol1998; 106: 244-250.
12. Kotehoubey B, Lang S, Baales R, Herb E, Maurer r, MezgerG, et aL.Brain potentials in human patients with severediffuse brain damage. Neurosci Lett 2001; 301: 37-40.
13. Lang S, Kotehoubey B, Lutz A, Birbaumer N. Was tut man,wenn man nichts tut? Kognitive EKP-Komponenten ohnekognitive Aufgabe. [What are you doing while you are doingnothing? Cognitive ERP components without a cognitivetask], Zeitsehrift Experiment Psychol 1997;44: 138-162.
14. Müller HM, Kutas M. What's in anarne? Electrophys-iological differences between spoken nouns proper namesand one's own name. NeuroReport 1996;8: 221-225.
15. Mutschler V,Chaumeil CG,Marcoux L,Wioland N, TempeJD, Kurtz D.Etude du P300 auditif chez des sujets en comapost-anoxique, Donnees preliminaires. [Astudy of audito-ry P300 in subjeets with anoxic coma: preliminaıy data],Neurophysiol Clin 1996;26: 158-163.
16. Perrin F, Garcia-Larrea L, Mauguiere F, Bastuji H. A dif-ferential brain response to the subjeet's own name per-sists during sleep. Clin Neurophysiol1999; l lü. 2153-2164.
79
)

17. Perrin F, Bastuji H, Mauguiere F, Garcia-Larrea L.Functional dissociation of the earlyand Iate portions ofhuman K-complexes. NeuroReport 2000; 11: 1637-1640.
18. Polich J. Comparison of P300 from a passiye ton esequence paradigm and an active discrimination task.Psychophysiology 1987; 24: 41-46.
19. Polich J. P300' from a passiye auditory paradigm.Electroencephalogr Clin Neurophysiol 1989; 74: 312-320.
20. Rudolf J. Beitrag der Positronen - Emissionstomographiezur diagnostischen Zuordnung und prognostischenEinschatzung postanoxischer Hirnschaden. ıA contribu-tion of positron emission tomography to the diagnosis andprognosis of hypoxical brain injuries]. FortschritteNeurologie Psychiatrie 2000; 68: 344-351.
21. Rudoır J, Ghaemi M, Haupt WF, Szelies B, Heiss WD.Cerebral glucose rnetabolism in acute and persistent veg-etative state. J Neurosurg Anesthesiol 1999; 11: 17-24.
22. Signorino M, D'Acunto S, Cercaci S, Pietropaoli P,Angeleri F. The P300 in traumatic coma: conditioning ofthe oddball paradigm. J Psychophysiol 1997; 11: 59-70.
23. Siniatchkin M, Gerber WD, Kropp P, Vein A. Contingentnegative variation in patients with chronic dailyheadache. Cephalgia 1998; 18: 565·569.
24. Thatcher RW, Cantor DS, McAlaster R, Geisler F, Krause P.Comprehensive predictions of outcome in closed head
irıjured patients: the development of prognostic equa-tions. Ann NY Acad Sci 1991; 620: 82-101.
25. Yerleger R, Wascher E, Arolt V, Daase C, Strohm A, KömpfD. Slow EEG potentials (contingent negative variation andpost-irnperative negative variation) in schizophrenia: theirassociation to the present state and to Parkinsonian med-ication effects. Clin Neurophysiol 1999; 110: 1175·1192.
26. Voss U, Harsh J. Information processing and coping st yleduring the wakelsleep transition. J Sleep Res 1998; 7:225·232.
27. Wagner M, Rendtorff N, Kathmann N, Engel RR. CNV,PINV and probe-evoked potentioals in schizophrenics.Electroencephalogr Clin Neurophysioll996; 98: 130-143.
28. Yordanova J, Dumais-Huber C, Rethenberger A, WoemerW. Frontocortical activity in children with cornorbidity oftic disorder and attention-deficit hyperactivity disorder.Biol Psychiat 1997; 41: 585·594.
29. Zapolli R, Versari A, Arnetoli G, Paganini M, Nuscas G,Arneodo M, et aL. Topographlo CNV activity mapping, pre-senile mild primary cognitive decline and Alzheimer-typedementia. Neurophysiol Clin 1991; 21: 473-483.
30. Zeitlhofer J, Steiner M, Oder W, Obergottsberger S, Mayr N,Deecke L. Prognostische Wertigkeit evozierter Potentialein der neurologischen Frührehabilitation bei Patienten imapallischen Syndrom. Predictive value of evoked potentialsin the early neurological rehabilitation of apallic syndrome(in German). Zeitschrift EEG· EMG 1991; 22: 10-14.
80
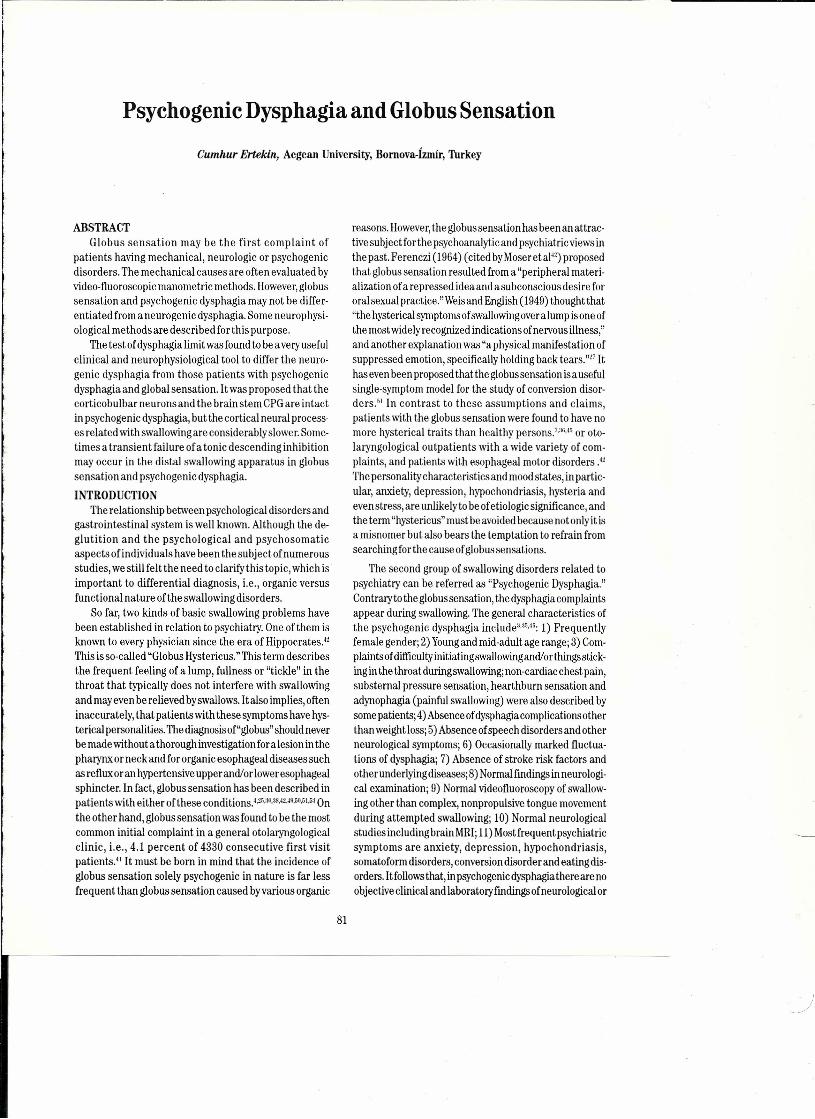
Psychogenic Dysphagia and Globus Sensation
Cumhur Ertekin, Aegean University, Bornova-ızmir, Turkey
ABSTRACTGlobus sensation may be the first complaint of
patients having mechanical, neurologic or psychogenicdisorders. The mechanical causes are often evaluated byvideo-fluoroscopic manometric methods. However,globussensation and psychogenic dysphagia may not be differ-entiated from a neurogenic dysphagia, Some neurophysi-ological methods are deseribed for this purpose.
The test ofdysphagia Iimit was found to be a very usefulelinical and neurophysiological tool to differ the neuro-genic dysphagia from those patients with psychogenicdysphagia and global sensation. itwas proposed that thecorticobulbar neurons and the brain stern CPGare intactin psychogenic dysphagia, but the cortical neural process-es related with swallowingare considerably slower. Some-times a transient failure of a tonic descending inhibitionmay occur in the distal swallowing apparatus in globussensation and psychogenic dysphagia,INTRODUCTION
The relationship between psychological disorders andgastrointestinal system is well known. Although the de-glutitiorı and the psychological and psychosomaticaspects ofindividuals have been the subjectofnumerousstudies, we stili felt the need to clarifythis topic, which isimportant to differential diagnosis, i.e., organic versusfunctional nature ofthe swallowing disorders.
So far, two kinds of basic swallowing problems havebeen established in relation to psychiatry. One ofthem isknown to every physician since the era of Hippocrates."This is so-called "Globus Hystericus." This term deseribesthe frequent feeling of a lump, fullness or "tickle" in thethroat that typically does not interfere with swallowingand mayeven be relieved byswallows. Italso implies, ofteninaccurately, that patients with these syrnptoms have hys-terical personalities. The diagnosis of"globus"should neverbe made without a thorough investigation fora lesion in thepharynx or neck and for organic esophageal diseasessuchas reflux or an hypertensive upper arıd/or lower esophagealsphincter. In fact, globus sensation has been deseribed inpatients with either ofthese conditions.4.2fi.:UI.:1I<.42.4!1.51',5I.~1Onthe other hand, globus sensation was found to be the mostcommon initial complaint in a general otolaryngologicale1inic, i.e., 4.1 percent of 4330 consecutive first visitpatients." it must be bom in mind that the ineidence ofglobus sensation solely psychogenic in nature is far lessfrequent than globus sensation caused byvarious organic
reasons. However,the globus sensation has been an attrac-tive subject for the psychoanalytic and psychiatric views inthepast. Ferenczi (1964) (cited byMoser etal") propose dthat globus sensation resulted from a "peripheral materi-alization ofa repressed ideaand asubconscious desire fororal sexual practice." Weisand English (1949)thought that"the hysterical syrnptomsofswallowingoveralump is one ofthe most widely recognized indications ofnervous illness,"and another explanation was "a physical manifestation ofsuppressed emotion, specifically holding back tears."" ithas even been proposed that the globussensation isa usefulsingle-symptorn model for the study of conversion disor-ders." In contrast to these assumptions and e1aims,patients with the globus sensation were found to have nomore hysterical traits than healthy persons.t-"-" or oto-laryngological outpatients with a wide variety of com-plaints, and patients with esophageal motor disorders ."The personality characteristics and mood states, in partic-ular, anxiety, depression, hypochondriasis, hysteria andeven stress, are unlikely to be ofetiologic significance, andthe term "hystericus" must be avoided becausenotonlyit isa misnomer but also bears the temptation to refrain fromsearching for the cause ofglobus sensations.
The second group of swallowing disorders related topsychiatry can be referred as "Psychogenic Dysphagia."Contraryto the globussensation, the dysphagia complaintsappear during swallowing. The general characteristics ofthe psychogenic dysphagia include:I.:ı;.41;: 1) Frequentlyfemale gender; 2) Youngand mid-adult age range; 3) Com-plaints ofdifficultyinitiatingswallowingand/or things stick-ing in the throat during swallowing;non-cardiac chest pain,substernal pressure sensation, hearthburn sensation andadynophagia (painful swallowing) were also deseribed bysomepatients; 4) Absence ofdysphagiacomplications otherthan weight loss; 5) Absence ofspeech disorders and otherneurological symptoms; 6) Occasionally marked fluctua-tions of dysphagia; 7) Absence of stroke risk factors andotherunderlying diseases; 8) Normal findings in neurologi-cal exarnination; 9) Normal videofluoroscopy of swallow-ing other than complex, nonpropUısive tongue movementduring attempted swallowing; 10) Normal neurologicalstudies ineluding brain MRlj ll) Mostfrequent psychiatricsymptoms are anxiety, depression, hypochondriasis,somatoform disorders, conversion disorder and eating dis-orders. Itfollows that, inpsychogenicdysphagia thereare noobjective elinical and laboratoryfindings ofneurological or
81
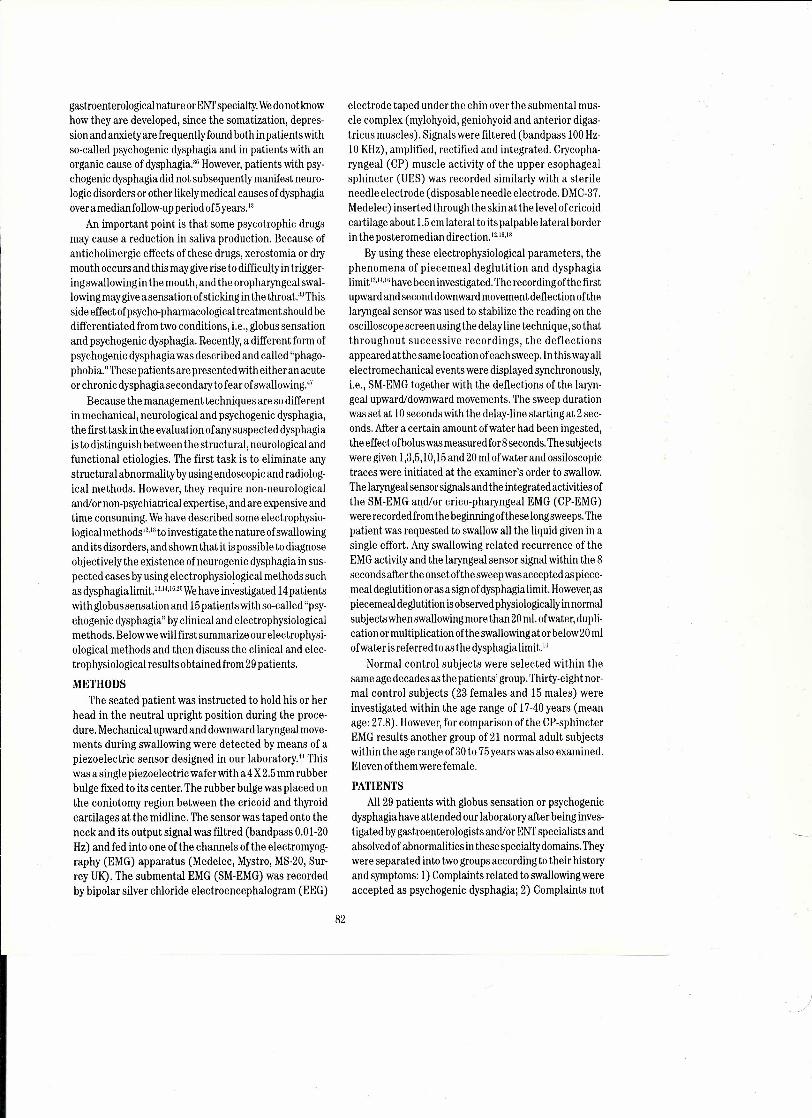
gastroenterological nature or ENT specialty. Wedo notknowhow theyare developed, since the somatization, dep res-sion and anxiety are frequentlyfound both in patients withso-called psychogenic dysphagia and in patients with anorganic cause of dysphagia." However, patients with psy-chogenic dysphagia did not subsequently manifest neuro-logic disorders or other likely medical causes of dysphagiaover amedian follow-up period of5 years."
An important point is that some psycotrophic drugsmay cause a reduction in saliva production. Because ofanticholinergic effects of these drugs, xerostomia or drymouth occurs and this may give rise to difficultyin trigger-ing swallowing in the mouth, and the oropharyngeal swal-lowingmaygive asensation ofstickingin the throat.v'I'hisside effectofpsycho-pharmacological treatmentshould bedifferentiated from two conditions, i.e., globus sensationand psychogenic dysphagia. Recently, a different form ofpsychogenic dysphagia was deseribed and called "phago-phobia." These patients are presented with either an acuteorchronicdysphagiasecondarytofearofswallowing.47
Because the management techniques are so differentin mechanical, neurological and psychogenic dysphagia,the first task in the evaiuation ofany suspected dysphagiais to distinguish between the structural, neurological andfunctional etiologies. The first task is to eliminate anystructural abnormality by using endoscopic and radiolog-ical methods. However, they require norı-neurologicaland/ornon-psychiatrical expertise, and are expensive andtime consuming. We have deseribed so me electrophysio-logical methods'v" to investigate the nature ofswallowingand its disorders, and shown that it is possible to diagnoseobjectively the existence ofneurogenic dysphagia in sus-pected cases by using electrophysiological methods suchas dysphagialimit. ı:ı,14,IG,2UWehave investigated ı4 patientswith globus sensation and 15 patients with so-called "psy-chogenic dysphagia" by elinical and electrophysiologicalmethods. Belowwe will first summarize our electrophysi-ological methods and the n discuss the elinical and elec-trophysiological results obtainedfrom 29 patients.
METHODSThe seated patient was instructed to hold his or her
head in the neutral upright position during the proce-dure. Mechanical upward and downward laryngeal move-ments during swallowing were detected by means of apiezoelectric sensor designed in our laboratory." Thiswas a single piezoelectric waferwith a4 X 2.5 mm rubberbulge fixed to its center, The rubber bulge was placed onthe coniotomy region between the cricoid and thyroidcartilages at the midline. The sensor was taped onto theneck and its output signal was filtred (bandpass 0.0 ı-20Hz) and fed into one of the channels of the electromyog-raphy (EMG) apparatus (Medelec, Mystro, MS-20, Sur-rey OK). The submental EMG (SM-EMG) was recordedby bipolar silver chloride electroencephalogram (EEG)
electrode taped under the chin over the submental mu s-cle complex (mylohyoid, geniohyoid and anterior digas-tricus muscles). Signals were filtered (bandpass 100 Hz-10 KHz), amplified, rectified and integrated. Crycopha-ryngeal (CP) muscle activity of the upper esophagealsphincter (UES) was recorded similarly with a sterileneedle electrode (disposable needle electrode. DMC-37.Medelec) inserted through the ski n at the level of cricoidcartilage about 1.5 cm lateral to its palpable lateral borderin the posteromedian direction.v-":"
By us ing the se electrophysiological parameters, thephenomena of piecemeal deglutition and dysphagialimit 1:ı.14.Whave been investigated. The recording ofthe firstupward and second downward movement detlection of thelaryngeal sensor was use d to stabilize the reading on theoscilloscope screen usingthe delay line technique, so thatthroughout suceessive recordings, the defleetionsappeared at the same location of each sweep.ln this way allelectromechanical events were displayed synchronously,i.e., SM-EMG together with the detlections of the laryrı-geal upward/downward movements. The sweep durationwas set at 10 seconds with the delay-line starting at 2 see-onds. After a eertain amount of water had been ingested,the effect ofbolus was measured for 8 seconds. The subjectswere given 1,3,5,10,15 and 20 ml ofwater and ossiloscopictraces were initiated at the examiner's order to swallow.The laryngeal sensor signals and the integrated activities ofthe SM-EMG and/or crico-pharyngeal EMG (CP-EMG)were reeorded from the beginning ofthese longsweeps. Thepatient was requested to swallowall the liquid given in asingle effort. Any swallowing re Iate d recurrence of theEMG activity and the laryngeal sensor signal within the 8seconds after the onsetofthesweepwasaceepted aspiece-meal deglutition orasasign of dysphagialimit. However, aspiecemeal deglutition is observed physiologically in normalsubjectswhen swallowingmore than 20 ml. ofwater, dupli-cation or multiplication ofthe swallowingat or below 20 mlofwater is referred to as the dysphagia limit. 14
Normal control subjects were selected within thesame age decades as the patients' group. Thirty-eight nor-mal control subjects (23 females and 15 males) wereinvestigated within the age range of 17-40 years (meanage: 27.8). However, for comparison ofthe CP-sphincterEMG results another group of 21 normal adult subjeetswithin the age range of30 to 75 years was als o examined.Eleven of the m were female.
PATIENTSAll 29 patients with globus sensation or psychogenic
dysphagia have attended our laboratory af ter being inves-tigated by gastroenterologists and/or ENT specialists andabsolved of abnormalities in these specialty domains. Theywere separated into two groups according to their historyand symptoms: 1) Complaints related to swallowing wereaceepted as psychogenic dysphagia; 2) Complaints not
82
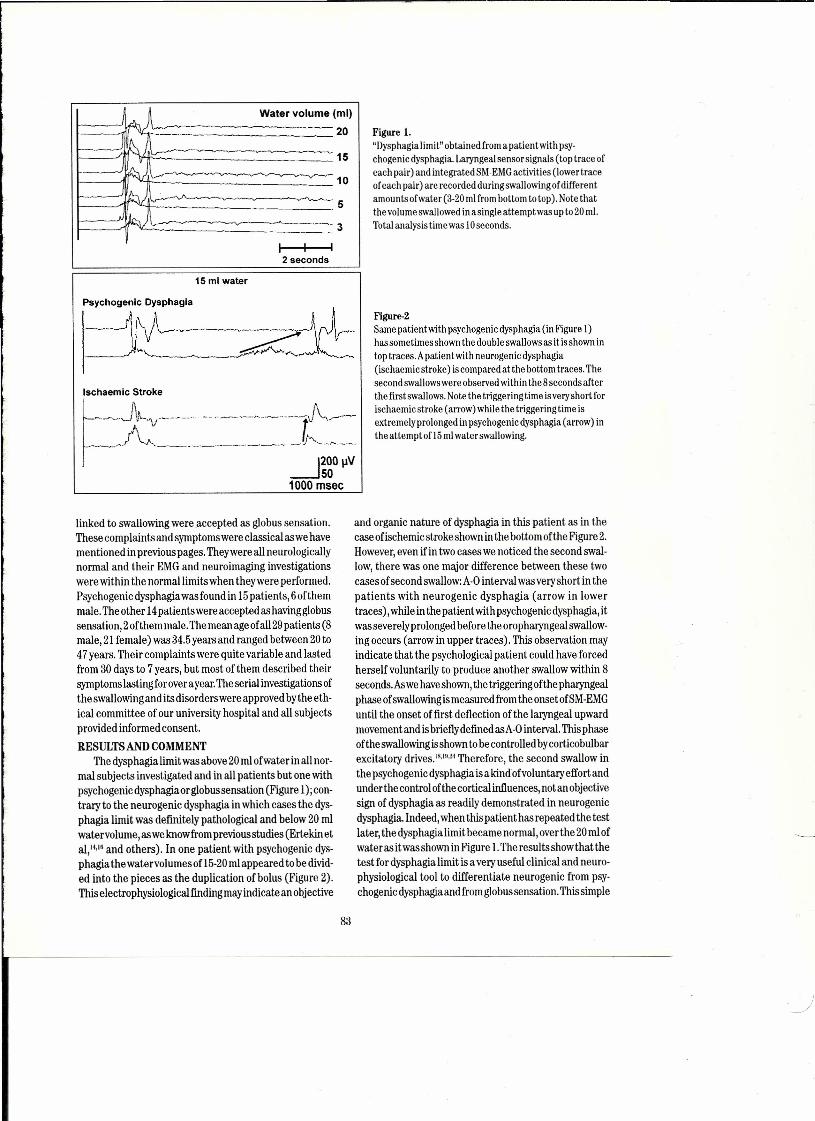
~~.
Water volume (ml)
20
i~ ~.~~~
ı,c....,v____ 15--- ''1. ---V-~ 10
1---- ~ 5ii.!f'-W --------~3
i i i2 seconds
15 ml water
P=E-~. .....'------------------~ v-~~ ~
Ischaemic 5troke
~--'-'~-----------1~-__~_~/\,A-__ .....___ ._._._._._.__~"'._.·1~ __ •.
~2001N50
1000 msec
linked to swallowing were accepted as globus serısation.Thesecomplaintsandsymptomswereclassicalaswehavementioned in previous pages. Theywereall neurologicallynormal and their EMG and neuroimaging investigationswere within the normal limits when theywere performed.Psychogenic dysphagia wasfound in 15patients, Bof'themmale. The other 14patients were accepted as having globussensation, 2ofthem male. The mean age ofall 29 patients (8male, 21 female) was 34.5 years and ranged between 20 to47 years. Their complaints were quite variable and lastedfrom 30 days to 7 years, but most of them deseribed theirsymptoms lasting for over ayear. The serial investigations ofthe swallowing and its disorders were approved by the eth-ical committee of our university hospital and all subjectsprovided informed consent.RESULTSAND COMMENT
The dysphagia limit was above 20 ml ofwater in all nor-mal subjects investigated and in all patients but one withpsychogenic dysphagia or globus sensation (Figure 1);con-trary to the neurogenic dysphagia in which cases the dys-phagia limit was defınitely pathological and below 20 mlwatervolume, as we knowfrom previous studies (Ertekin etal,14,IGand others). In one patient with psychogenic dys-phagia the watervolumes of 15-20 ml appeared to be divid-ed into the pieces as the duplication ofbolus (Figure 2).ThiselectrophysiologicaI fınding mayindicate an objective
83
Figure ı."Dysphagia limit" obtained from a patient with psy-chogenic dysphagia. Laryngeal sensor signals (top trace ofeach pair) and integrated SM-EMGactivities (lowertraceof each pair) are recorded duringswallowingofdifferentamounts ofwater (3-20 ml from bottom to top). Note thattnevolume swallowed in asingleattempt was up to 20 ml.Total analysis time was 10seconds,
Figure-2Same patient with psychogenic dysphagia (in Figure 1)hassometimes shown the double swallowsas it is shown intop traces. Apatient with neurogenic dysphagia(ischaemic stroke) is compared at the bottom traces, Thesecond swallows were observed within the 8seconds af terthe first swallows. Note the triggering time is very short forischaemic stroke (arrow) while the triggering time isextremelyprolonged in psychogenic dysphagia (arrow) inthe attemptof 15ml water swallowing.
and organic nature of dysphagia in this patient as in thecase ofischemic stroke shown in the bottom of the Figure 2.However, even if in two cases we noticed the second swal-low, there was one major difference between these twocases of second swallow: A-Ointerval was very short in thepatients with neurogenic dysphagia (arrow in lowertraces), while in the patient with psychogenic dysphagia, itwas severelyprolonged before the oropharyngeal swallow-ing occurs (arrow in upper traces). This observation mayindicate that the psychological patient could have forcedherself voluntarily to produce another swallow within 8seconds. Aswe have shown, the ınggering of the pharyngealphase of swallowingis measured from the onset of SM-EMGuntil the onset of first deflection ofthe laryngeal upwardmovement and is briefly defined asA-O interva\. This phaseoftheswallowing isshown to be controlled by corticobulbarexcitatory drives.I.,ID.24 Therefore, the second swallow inthe psychogenic dysphagia is a kindofvoluntary effort andunderthe control ofthe corticalinfluences, not an objectivesign of dysphagia as readily demonstrated in neurogenicdysphagia. Indeed, when this patient has repeated the testlater, the dysphagia limit became normal, over the 20 ml ofwater as itwas shown in Figure ı.The results showthat thetest for dysphagia limit is a very useful elinical and neuro-physiological tool to differentiate neurogenic from psy-chogenic dysphagiaand from globus sensation. Thissimple
)
Table 1The summary of statisticel resulIs of oropharyngeal swallowing in
normal subjecls and patients wilh globus sensalion i psychogenic dysphagiaNormal Conlrol Group (n=38) Palienls Group (n=29)Mean ± SEM SD Mean ± SEM SD
p-value
1. Triggering Time ofswallowing (A-O inlerval)
2. Pharyngeal Phase ofswallowing reflex(0-2 inlerval)
3. SM-E MG duralion(A-C inlerval)
4. Amplilude of SM-EMG
565 ± 16
254 ± 17 106 msec 300 ± 21 110 msec
114 msec p<0.001
860 ± 19 119 msec
76 ± 6.0 36 microV
5. CP-EMG Pause (n = 21) 462 ± 18
test while noninvasive and inexpensive is very sensitiye indemonstrating the oropharyngeal neurogenic dysphagiawithout time consumingprocedures.
Single bolus analysis ofSM-EMG and laryngeal sensormovement during 3ml water swallowing has always beenveryuseful in understanding the pathophysiological mech-anism oforopharyngeal dysphagiaofneurological nature."10,22 These methods of measuring the components of theoropharyngeal swallowing did not potentiallyfacilitate thediagnosis or differential diagnosis in a elinical sense, butthey were able to demonstrate the physiological and/orpathophysiological nature oforopharyngeal swallowing ina given case or in aseries ofpatients with the same etiology.in 29 patients with psychogenic dysphagia, the triggeringtime of oropharyngeal swallowıng. the time necessary forthe pharyngeal phase of swallowing reflex and SM-EMGduration andamplitude and CP-EMGpause, were all meas-ured and compared statistically with the normal agematched groups. The summary of the results ofswallowingcomponents isshown in Table ı.
Triggering time from oral phase to swallowing reflexwas denoted asA-O time interva!. This time interval is most-lyunder cortical control and the cortico-bulbar pyramidalsystem during voluntarily initiated swallows as we havementioned before. it is interesting that this time intervalwas found to be statisticallyprolonged in patients with psy-chogenic dysphagia and/or globus sensation (p< 0.01).However, individually, the prolongation ofthe triggering ofthe oropharyngeal swallows was found in 5 patients inwhom this interval was slightly longertharı 400 msec. Thisslowing down was not as high as that encountered inpatients with corticobulbar involvement such as ALSandmultiplelacunar states.18·IDThus,thiskind ofprolongationmayindicate that the cortical processes related to the trig-gering ofthe bolus in the mouth driven by the corticobulbarpyramidal fibers is normal, but the slow action in thesecases can be priorto corticobulbar neuronal firing.
p<0.01
97 msec 683 ± 21
948 ± 45 241 msec p>0.05
66 ± 4.0 23 microV p<0.001
82 msec 479 ± 26 p>0.05106 msec
The pharyngeal phase ofswallowing is demonstrated bythe onsets oftwo laryngeal deflections and denoted as 0-2interva!. This interval is thought to reflect the time neces-sary for the elevation, Cıosure and upward relocation ofthe larynx.12.1:I,IG'I~Thisis a physiological event, that is,one ofthe important components of the swallowing reflex.",:l";'7This time interval wasstatisticallyfound to be prolonged inpsychogenic patients/globus sensation compared to nor-mal control subjects (p< 0.001). Figure 3 shows theoropharyngeal components of swallowing recordings froma normal subject (upper traces) and from a patient withpsychogerıic dysphagia (lower traces). Patients appearedto have aslowerpharyngeal phase ofswallowingwith longer0-2 interval and SM-EMGduration. Nevertheless, such apathological swallowing reflexsurpassing the value of800msec wasonly encountered in 5of29 patients (about 17per-cent ofpatients). In neurogenic dysphagia, slowing in thepharyngeal phase is encountered especially in patientswith neuromuscular disorders":" and extrapyramidal dis-orders such as Parkinson's disease. LG However, in the seabove-mentioned disorders, dysphagia is associated withthe abnormal dysphagia limits contrary to that of psy-chogerıio dysphagia. The lorıger pharyngeal phase of'swal-lowingwas not supported statistically by the SM-EMGdura-tion in that there was no significant prolongation com-pared to the normal subjects (Table 1,p> 0.05). Thisfindingis alsa different from the data obtained from the patientswith neuromuscular and extrapyramidal disorders'v" inwhom both 0-2 and A-C time intervals were prolonged.Taken together, these datamay be explained bythe effectofthe limbic system and its deseending motor fibers on thebulbar swallowingcenter" in psychogenic dysphagia, Thisspeculation is needed to be clarified byfurther studies.
The amplitude ofSM-EMG is statistically lower thanthe normal control group. This mayaıso support the viewthat the SM-muscles were excited by the mild asynchro-nous descending motor drives avoiding the great temporal
84

Normal Subject 12 Laıyngeal A
A
~i SM-EMG
Ai IC
B I~PS_Y_C_ho_g_e_nl_,~rı-_g_ıa ~12
~C~""V200 msec
Figure-3Laryngeal sensor signals and integrated SM-E MG obtained lroma normal subject (A) and one patient with psychogenic dyspha-gia (B). Note the significant prolongation of the pharyngealphase of oropharyngeal swallowing (denoted by 0-2 time inter-val) in patient with psychogenic dysphagia. All traces are aver-ages of five responses.
dispersion of the oropharyngeal muscles excitation inboth oral phase and pharyngeal phase. Howcould suchmild asynchronous descending motor drives affect thecentral pattern generator of the bulbar swallowing cen-ter? This question also remains to be elucidated.
CP-sphincter musc\e-EMG was investigated in ı7patients with psychogenic dysphagia or globus sensation.The cricopharyngeal sphincter !ike other sphincter mus-cles has special functions and properties that are differ-entfrom those ofskeletal muscles. Although it is astriatedmuscle, it is innervated bythe vagus nerve, and thereforeit is not readily controlled bythe voluntarymotor systemand is closed at rest. 2H,:ı",~"During a swallow,the UESopensand the tonic activityofthe CP-muscle ceases simultane-ousıyll,12,,",,,,as can be seen in Figure-4 (lowertraces). Thetonic activity in rest and the CP-EMGpause during swal-lowingdid notdiffer in psychogenic dysphagiaand in nor-mal control subjects (Table ı, p» 0.05). However,in fourpatients with psychogenic dysphagia/globus sensation, anunexpected EMGburst activityduring CP-EMGpause wasencountered (see Figure 4 arrow in the lower traces).Four patients or 23,5 percent ofall psychogenic patientsinvestigated had an unexpected motor unit burst withintheCP-EMGpause.Adisorderedcontractileactivityoftheupper esophageal sphincter has been held responsiblefor the globus sensation in previous studies using mano-metric and/orvideofluoroscopic evaIuation. 1,2,:",~!IHowev-er, there is considerable controversyon whetherdisordersof the se types are in fact related to the symptoms ofpatients.21i,"MM Recently, itwas shown that in globus sen-sation (and probably in psychogenic dysphagia) thereare no upper esophageal pressure changes"Ii,:",~"There-
Laıyngeal
Movement
CP-muscle
t tPa use
---'SOL-ıV
200 msec
B
tL....- __ lPause
Figure-4Laryngeal sensor signals and CP sphincter muscle EMGsrecorded from !WO patients with psychogenic dysphagia (A andB). The traces are the superimposition of five responses. EMGtraces are rectilied and integrated. CP sphincter muscle is nor-mal in both patients, except the unexpected burst ol motor unitaction potentials during swallowing pause ol the cricopharyngealmuscle (oblique arrow in B) in the other patient.
fore, the unexpected EMGburst during CP-EMGpausemay be a transient electrophysiological phenomenonprobably related with the transient failure of the tonicinhibitory drive from the suprasegmentallevels, whichare partly responsible for the CP-EMGpause during vol-untarily triggered swallowing."The motor neurons of theCP-sphincter muscle pass directly (phasic Y' and proba-blyindireetly (tonic) deseending neural eonneetions fromthe eerebral motor cortex and some other supraspinalstructures including!imbie system and basal ganglia, Themotor neurons of CP-sphincter muscle must be tran-siently and funetionally released from the descendinginhibitory control, and eonsequently such motor unitbursts mayappearwithin the pause of the CPmuscle dur-ing swallowing. The central paeemaker or central swal-lowingprogram at the bulbar center beeomes transientlydisturbed byremoval ofthe inhibitory eorticobulbar influ-ences. Asimilar argument has been propose d in neuro-logical patients with hyperreflexieCP-sphincter (i.e.,ALS, laeunar states) with whom in addition to EMGbursts, there is also shortening ofCP-EMGpause and pre-mature closure ofthe upper esophageal sphineter. Thesefindings are prevalent in cas es of neurogenie dyspha-gia. IR,'" üceurrence ofpsyehogenic patients with onlyEMGbursts stronglysuggests that such an inhibition can occurfrom time to time functionally and above the bulbarswal-lowing center, The central pacemaker or central swal-
85
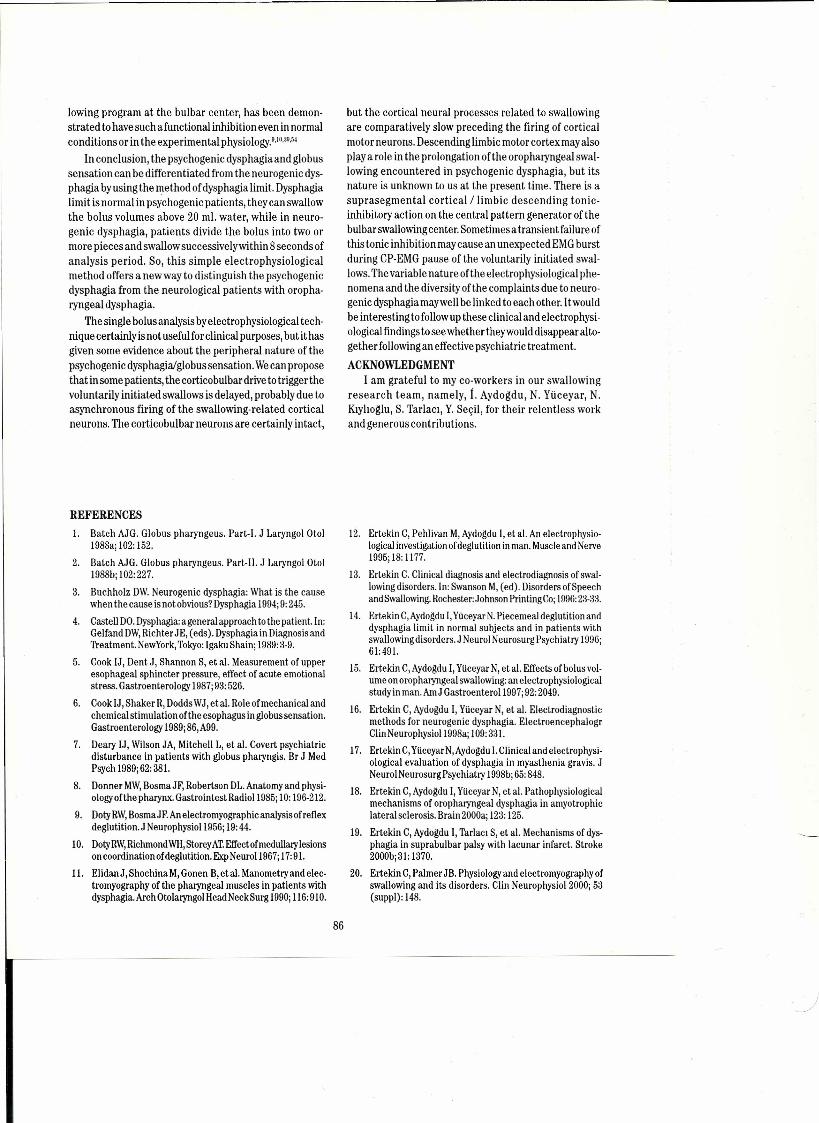
Icwing program at the bulbar center, has been dernon-strated to have such afunctional inhibition even in normalconditionsor in the experimental physiology.9,W,:ıı1.54
In conclusion, the psychogenic dysphagia and globussensation can be differentiated from the neurogenic dys-phagia byusing the method of dysphagia limit. Dysphagialimit is normal in psychogenic patients, they can swallowthe bolus volumes above 20 mı. water, while in neuro-genic dysphagia, patients divide the bolus into two ormore pieces and swallow successivelywithin 8 seconds ofanalysis period. So, this simple electrophysiologicalmethod offers a newway to distinguish the psychogenicdysphagia from the neurological patients with oropha-ryngeal dysphagia.
The single bolus analysis byelectrophysiological tech-nique certainlyis not useful for elinical purposes, but it hasgiven some evidence about the peripheral nature of thepsychogenic dysphagia/globus sensation. We can proposethat in some patients, the corticobulbar drive to trigger thevoluntarily initiated swallows is delayed, probably due toasynchronous firing of the swallowing-related eorticalneurons. The corticobulbar neurons are certainly intact,
REFERENCES1. Batch AJG. Globus pharyngeus. Part-I. J Laryrıgol Otol 12.
1988a; 102: 152.2. Batch AJG. Globus pharyngeus. Part-II. J Laryngol Otol
1988b; 102: 227. 13.
3. Buehholz DW. Neurogenie dysphagia: What is the eausewhen the cause is not obvious? Dysphagia 1994;9:245.
4. Casteıı DO.Dysphagia: ageneralapproach to thepatient. In: 14.Gelfand DW,Richter J E, (eds). Dysphagia in Diagnosis andTreatment. NewYork, Tokyo: Igaku Shain; 1989:3-9.
5. Cook IJ, Dent J, Shannon S, et aL.Measurement of upper 15.esophageal sphincter pressure, effect of acute emotionalstress. Gastroenterology 1987; 93: 526.
6. Cook IJ, Shaker R, Dodds WJ, et aL.Role ofmechanical and 16.chemical stimulation ofthe esophagus in globus sensation.Gastroenterology 1989;86,A99.
7. Deary IJ, Wilson JA, Mitchell L, et aL.Covert psychiatric 17.disturbance in patients with globus pharyngis. Br J MedPsych 19S9; 62: 3SI.
S. Donner MW,Bosma JF, Robertson DL.Anatomy and physi- LS.ology ofthe pharynx. Gastrointest Radiol i985; io: 196-212.
9. Doty RW,BosmaJF. An electromyographic analysis of reflexdeglutition, J Neurophysiol 1956; 19:44. 19.
ıo. DotyRW,RichmondWH;Storey AT.Effectofmedullary lesionson coordination ofdeglutition. Exp Neurol 1967; 17:91.
IL. Elidan J, Shochina M, Gonen B, et aL.Manometry and elec- 20.tromyography of the pharyngeal museles in patients withdysphagia. Arch Otolaryngol Head NeckSurg 1990; i16:9iO.
86
but the cortical neural processes related to swallowingare comparatively slow preceding the firing of corticalmotorneurons. Descending limbic motor cortexmay alsoplaya role in the prolongation ofthe oropharyngeal swal-lowing encountered in psychogenic dysphagia, but itsnature is unknown to us at the present time. There is asuprasegmental cortical / limbic descending tonic-inhibitory action on the central pattern generator of thebulbar swallowing center. Sometimesa transientfailure ofthis tonic inhibition may cause an unexpected EMG burstduring CP-EMG pause of the voluntarily initiated swal-lows. The variable nature ofthe electrophysiological phe-nomena and the diversity ofthe complaints due to neuro-genic dysphagia maywell be linked to each other. It wouldbe interestingto followup these elinical and electrophysi-ological findings to see whether theywould disappear alto-getherfollowing an effective psychiatric treatment.
ACKNOWLEDGMENTıam grateful to my co-workers in our swallowing
research team, namely, f. Aydoğdu, N. Yüceyar, N.Kıylıoğlu, S. 'Iarlacı, Y. Seçil, for their relent1ess workand generous contributions.
Ertekin C, Pehlivan M, Aydogdu I, et aL.An electrophysio-logical investigation ofdeglutition in man. Muscleand Nerve1995; IS: 1177.Ertekin C. Clinical diagnosis and electrodiagnosis of swal-Icwing disorders.ln: Swanson M, (ed). Disorders ofSpeechand Swallowing. Rochester: Johnson Printing Co; 1996:2a-33.Ertekin C,Aydogdu I, Yüceyar N. Piecemeal deglutition anddysphagia limit in normal subjects and in patients withswallowing disorders. J Neurol Neurosurg Psychiatry 1996;61:491.
Ertekin C, Aydoğdu I, Yüceyar N, et aL.Effects ofbolus vol-ume on oropharyngeal swallowing. an electrophysiologicalstudy in man. Am J Gastroenterol1997; 92: 2049.Ertekin C, Aydogdu I, Yüceyar N, et aL.Electrodiagnosticmethod s for neurogenic dysphagia. ElectroerıcephalogrClin Neurophysiol 1995a; 109:331.Ertekin C,Yüceyar N,Aydogdu i. Clinical and electrophysi-ological evaluation of dysphagia in myasthenia gravis. JNeurol Neurosurg Psychiatry 1995b; 65: S48.Ertekin C, Aydoğdu I, Yüceyar N, et aL.Pathophysiologicalmechanisms of oropharyngeal dysphagia in amyotrophiclateral selerosis. Brain 2000a; 123: 125.Ertekin C, Aydogdu I, Tarlacı S, et aL.Mechanisms of dys-phagia in suprabulbar palsy with lacunar infarct. Stroke2000b; 31: 1370.Ertekin C, Palmer JB. Physiology and electromyography ofswallowing and its disorders. Clin Neurophysiol2000; 53(suppl): 14S.
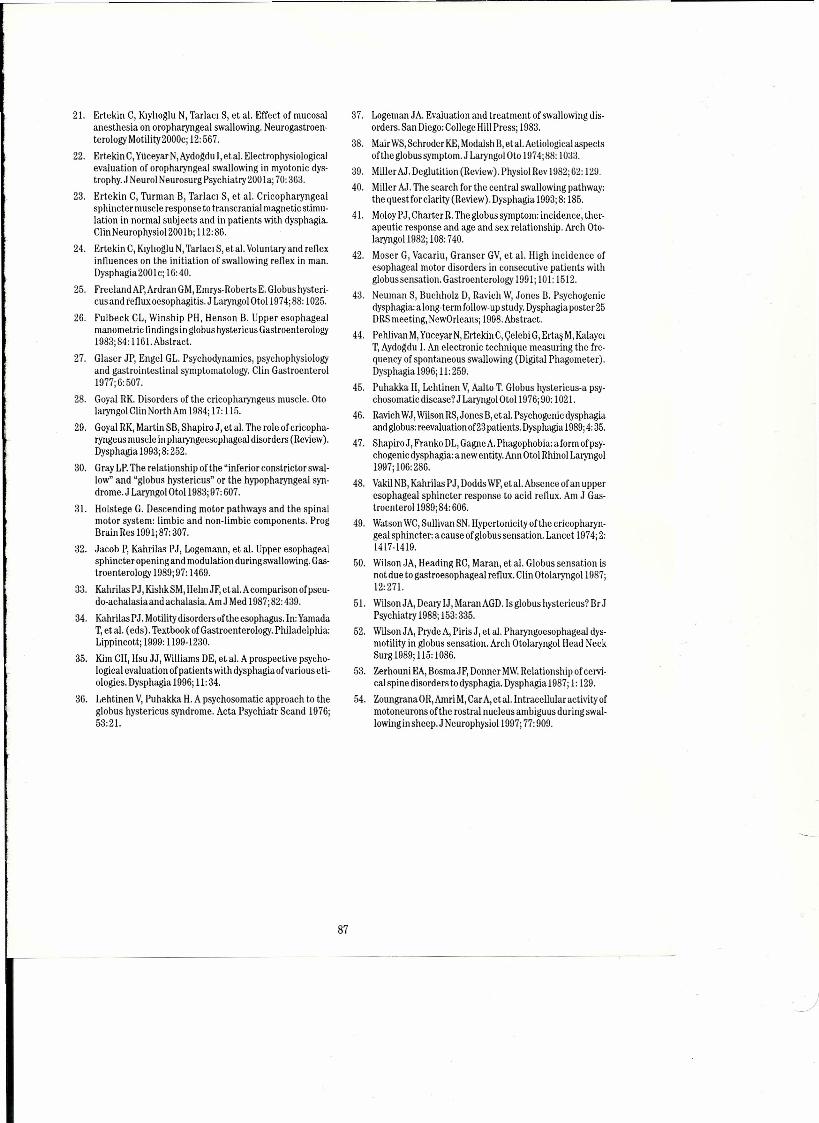
21. Ertekin C, Kıylıoglu N, Tarlacı S, et aL.Effeet of mueosal 37. Logeman JA. Evaluation and treatment of swallowing dis-anesthesia on oropharyngeal swallowing. Neurogastroen- orders. San Diego: College Hill Press; 1983.terology Motility2000cj 12:567. 38. MairWS,Sehroder KE,Modalsh B,et aL.Aetiologieal aspeets
22. Ertekin C,Yüceyar N,Aydogdu l,etal. Electrophysiological of the globus symptom. J Laryrıgol Oto 1974j88: 1033.evaluation of oropharyngeal swallowing in myotonie dys- 39. Miller AJ. Deglutition (Review). Physiol Rev 1982j62: 129.trophy. J Neurol Neurosurg Psychiatry 200laj 70:363.
40. Miller AJ. The search for the central swallowing pathway:23. Ertekin C, Turman B, Tarlacı S, et aL.Cricopharyngeal the questforclarity (Review). Dysphagia 1993j8: 185.
sphinctermuscle response to transcranial magnetic stimu- 41. MoloyPJ, Charter R.The globus symptom: incidence, ther-lation in normal subjects and in patients with dysphagia.apeutic response and age and sex relationship. Arch Oto-ClinNeurophysiol200lbj 112:86.laryngol1982j 108:740.
24. Ertekin C, Kıylıoglu N,Tarlacı S, et aL.Voluntary and reflex 42. Moser G, Vacariu, Granser GV,et aL.High ineidence ofinlluences on the initiation of swallowing rellex in man. esophageal motor disorders in consecutive patients withDysphagia Süül c; 16:40.globussensation. Gastroenterology 1991j 101: 1512.
25. Freeland AP,Ardran GM,Emrys-Roberts E. Globus hysteri- 43. Neuman S, Buchholz D, Ravich W,Jones B. Psyehogeniccus and reflux oesophagitis. J Laryrıgol Otol197 4j 88: 1025. dysphagia: along-term follow-up study. Dysphagia poster2526. Fulbeck CL, Winship PH, Henson B. Upper esophageal DRSmeeting, Newürleans; 1998.Abstract.
manometric Iindings in globus hystericus Gastroenterology 44. Pehlivan M,Yüceyar N,Ertekin C,Çelebi G,Ertaş M,Kalayer1983j84: 1161.Abstract. T,Aydogdu ı.An electronic technique measuring the fre-27. Glaser JP, Engel GL. Psychodynamics, psychophysiology queney of spontaneous swallowing (Digital Phagometer).
and gastrointestinal symptomatology. cıin Gastroenterol Dysphagia 1996j ii: 259.1977j 6:507. 45. Puhakka H, Lehtinen V,Aalto T. Globus hystericus-a psy-
28. Goyal RK. Disorders of the cricopharyngeus muscle. Oto- ehosomatiedisease? J Laryrıgol Oto11976j90: 1021.laryngolClinNorthAm 1984j 17:115. 46. Ravieh WJ,Wilson RS,Jones B,et aL.Psychogenie dysphagia
29. Goyal RK,Martin SB, ShapiroJ, et aL.The role of crieopha- and globus: reevaluation of23 patients. Dysphagia 1989j4:35.ryngeus muscle in pharyngeesophageal disorders (Review). 47. Shapiro J, Franko DL,GagneA. Phagophobia: aform of'psy-Dysphagia 1993j8:252. chogenic dysphagia: a new entity. Ann Otol Rhinol Laryrıgol
30. Gray LP.The relationshlp of the "inferior eonstrictor swal- 1997j 106:286.low" and "globus hysterieus" or the hypopharyngeal syn- 48. VakilNB,Kahrilas PJ, Dodds WF,et aL.Absenee of an upperdrome. J Laryrıgol Otol1983j 97: 607. esophageal sphineter response to aeid rellux. Am J Gas-
31. Holstege G. Deseanding motor pathways and the spinal troenterol1989j84: 606.motor system: limbic and non-limbic components. Prog 49. Watson WC,Sullivan SN. Hypertonicity ofthe cricopharyn-Brain Res 199Ij87: 307. geal sphincter: aeause of globus sensation. Laneet 1974j 2:
32. Jacob P, Kahrilas PJ, Logemann, et aL.Upper esophageal 1417-1419.sphincter opening and modulation during swallowing. Gas- 50. Wilson JA, Heading RC, Maran, et aL.Globus sensation istroenterology 1989j97: 1469. notdue to gastroesophageal rellux. Clin Otolaryngol lüô";
33. Kahrilas PJ, Kishk SM,HelmJF, et aL.Acomparison ofpseu- 12:271.do-achalasiaand achalasia. AmJ Med 1987j82:439. 51. Wilson JA, Deary IJ, Maran AGD.Is globus hystericus? Br J
34. Kahrilas PJ. Motility disorders ofthe esophagus. In:Yamada Psychiatry 1988j 153:335.T, et aL.(eds). Textbook of Gastroenterology. Philadelphia: 52. Wilson JA, Pryde A, Piris J, et aL.Pharyngoesophageal dys-Lippincott; 1999: 1199-1230. motility in globus sensation. Arch Otolaryngol Head Neck
35. Kim CH, Hsu JJ, Williams DE, et aL.A prospective psycho- Surg 1989j 115:1086.logical evaluation ofpatients with dysphagia ofvarious eti- 53. Zerhouni EA,BosmaJF, Donner MW.Relationship of cervi-ologies. Dysphagia 1996j ll: 34. cal spine disorders to dysphagia. Dysphagia 1987j i: 129.
36. Lehtinen V,Puhakka H. A psychosomatic approach to the 54. Zoungrarıa OR,Amri M,Car A,et aL.Intracellular activity ofglobus hystericus syndrome. Acta Psychiatr Scand 1976j motoneurons of the rostral nucleus ambiguus during swal-53:21. lowingin sheep.J Neurophysiol lüü"; 77:909.
87

INDEX
AAge related changes, 19, 59-64, 78, 81Alpha activity, 3, 7, 8, 22, 23, 35, 44, 47-50, 53-57Alzheimer's disease, 28, 72, 73Ambiguous pattern, multistable perception, 53-57Arousal, biological determinants, 18, 19Attention, 4, 11, 15, 16, 18,21-24, 33,45,59,62, 75Auditory evoked potential (AEP), 36, 37, 39, 71-73 (See alsa P300)
BBattery approach, 67-69Bayesian analysis, 68Beta activity, 3, 8, 41-43, 47-50Bipolar disorder, 69Brain Electrical Source Analysis, 72, 73Brain waves, natural history and evolution, 3-8 (See Electroencephalography)
cCellular generators, 4, 6, 45Central site, 15, 16, 19,21,57,68, 78Cerebellum, 7, 10, 11
- Chaos analysis, 4, 7Clinical applications,
neurology, neurophysiology, neuropsychology, psychiatry, 23, 24, 67-69,71-74,75-80,81-87Coherence, 3,6, 7, 11Coma, 75-79Comparative EEG, 3-13Cooperativity, 4, 6Corpus callosum, 22, 47, 50, 51
DDelta frequencies, 3, 4, 8, 23, 38, 53, 56, 76Dementia, 18,28,71-73Depression, 67, 71, 73, 81Depth recording, 3, 8-11,19Discriminant functions, 67, 68Drugs, 19, 36, 71-73,82Dysphagia, 81-87
89
J

EEating disorders, 81-87Electroencephalography (EEG), 3-13,18,22,23,28,33-40,41-46,47,53-57,60,68,69,71, 72, 79EMG,54, 82-86Event-related desynchronization, 22, 53-57Event-related oscillation, 39, 50Event related potential (ERP), 15-29,39,53-64,68,69,71-73,75-80Evoked potential (EP), 5, 9,11,17,18,33-40,42,47-51,60,68,71-73,76Eye movement recording, 41-46, 68
FFast Fourier Transform, 3, 6-8, 36,41,47,49Frontallobe site, 15, 16, 19,21-24,42,43,45,57,59, 78
GGamma range activity, 3, 5, 8, 9,11,39,41-46,71Gastrointestinal system, 81-87Gender, 19, 59-63, 81Globus Sensation, 81-87
HHead injury, closed, 75-80Hippocampal formation, 19-22
iInfraslow frequencies, 4Integrative mechanisms, 4, 6Interhemispheric transfer time, 47-51Invertebrates, biology of brain waves, 3-12
KKanizsa images, 9
LLocal field potential, 3, 7, 8, 11Loudness dependence, evoked potential, 71-73
90
MMagnetic resonance imaging (MR!), 20, 22, 43,68,71-73,81Manic patients, 68Memory, 15-24, 53, 54, 56, 59, 62Methodological and developmental aspects, P300, 59-63Multistable perception, 53-58
NNI, 18,59-62,71,73,75-78N2, 18, 59-61, 75N80, 48N100, 39, 68N160, 47-50N400,78Necker cube paradigm, 53-57Neuropsychology, theoretical overview, 15-29Normal variability, 17, 19,20,24,37-39,68,71,72,75-80,81-86
oOddball paradigm, 15-18,20,21,59,60,62,75,76,78Occipitallobe site, 41-46, 47, 56Origin of EEG, 3-13Own name, differential response, 75-80
PP300, 15-29,59-64,68,69,71-73,75-78P3a, P3b, 15-29P2, 18,59,60, 76P50, 39P100, 47-50, 68P200, 68, 71, 73Parietallobe site, 15, 20-23, 43, 57, 59, 60, 78Parieto-occipital cortex, 43Perceptual reversal related positivity, 53-57Periodic Specific Average, 3, 7-9Phase synchronization, 37, 39Piecewise Prony method, 33, 36, 39Positron emission tomography (PET), 68, 71, 72, 79Psychiatry, 36-39, 67-69, 71-74, 78,86
91
J

QQuantitative, EEG, 73
RReticular formation, 59Ringing artifact, 35, 36, 39
SSaccades, 41-46Schizophrenia, 36-39, 67, 68, 78Seizure, subdural EEG, 9Serotonic function, 71, 73Signals and signs, biology of brain waves, 3-13Single photon emission computer tomography (SPECT), 71, 72Sleep recording, 68, 75Slow wave frequencies, (See Theta, Delta, and Infraslow)Spikes,3,4,6,8, 11Subcellular generators, 4, 6Suicide risk, 73Swallowing disorder, 81-87
TTemporallobe site, 15,20,21,23,72Test batteries, 67-69Theta frequencies, 7-9, 20, 22, 23, 27, 37, 47-50, 78Three-stimulus paradigm, 15, 16, 23, 24Time frequency analysis, collosal transfer, 47-51
VVegetative state, 76, 79Vertebrates, biology of brain waves, 3-12Visual event-related potential (VERP), 15-17,20,23,24,53-58,59-64Visual evoked potential (VEP), 5, 9, 34, 35, 47-51Visual responses, perisaccadic occipital gamma range EEG, 41-46
WWavelet analysis, 3, 8, 13, 22, 33-44
92