brake pad copper reduction status report 2018
TRANSCRIPT
Brake Pad Copper Reduction Status Report 2018
January 2019
California Stormwater Quality Association

Brake Pad Copper Reduction Status Report 2018 Page ii
Preface
This Technical Memorandum was prepared for the California Stormwater Quality Association (CASQA) under the supervision of CASQA’s Watershed Management & Impaired Waters Subcommittee. Because of the reliance on data and information provided by other organizations, neither CASQA, its Board of Directors, the Watershed Management and Impaired Waters Subcommittee, any contributors, nor the authors make any warranty, expressed or implied, nor assume any legal liability or responsibility for any third party's use of this report or the consequences of use of any information, product, or process described in this report. Mention of trade names or commercial products, organizations, or suppliers does not constitute an actual or implied endorsement or recommendation for or against use, or warranty.
Report Preparer and Acknowledgements
TDC Environmental, LLC prepared this report. Kelly D. Moran, Ph.D. was the lead author. The author thanks Ian Wesley, Sean Smith, Teague Powell, Vanessa O’Daniel and their colleagues at the Washington Department of Ecology for their extensive efforts to obtain, complete quality assurance reviews, summarize, and publicly share brake pad chemical content data, the Brake Manufacturers Council and NSF International for the transparency of their brake friction materials registration program, and Richard Watson, Julie Millett, and Kathleen McGowan for their helpful peer reviews of this report.
Copyright © 2019 California Stormwater Quality Association.All rights reserved. CASQA member organizations may include this report in their annual reports provided credit is provided to CASQA. Short sections of text, not to exceed three paragraphs, may be quoted without written permission provided that full attribution is given to the source.
Brake Pad Copper Reduction Status Report 2018 Page 1
Brake Pad Copper Reduction Status Report 2018
Highlights
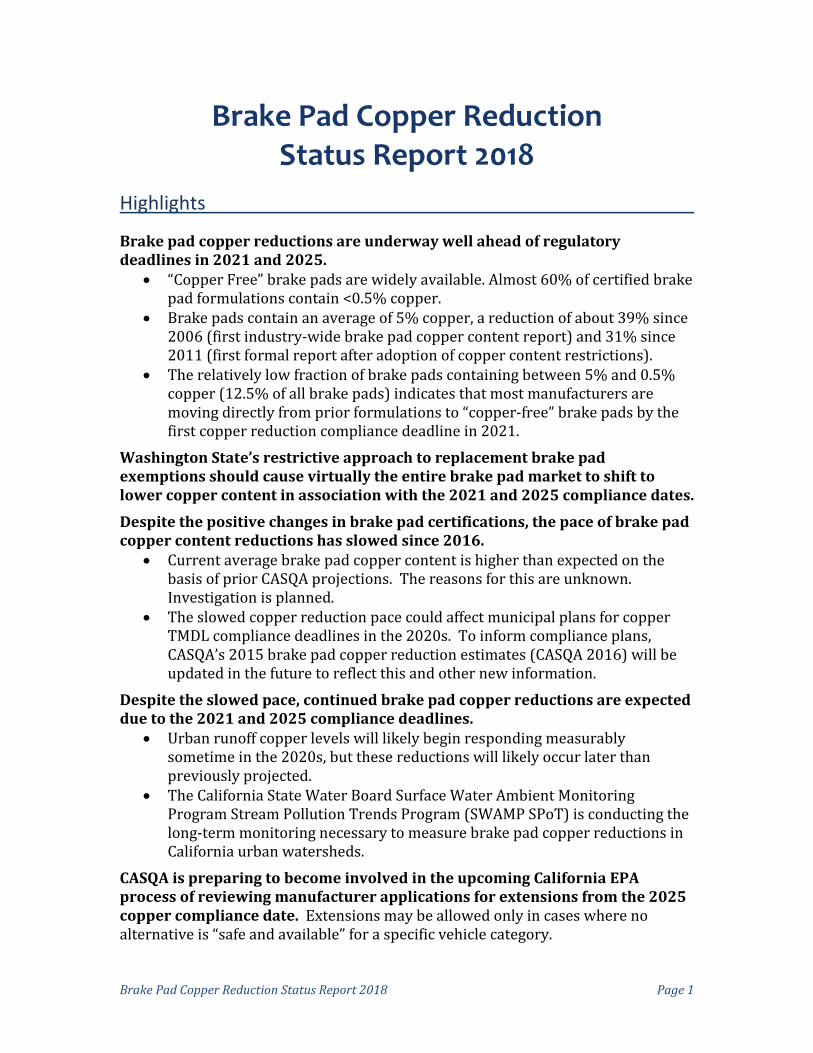
Brake pad copper reductions are underway well ahead of regulatory deadlines in 2021 and 2025.
• “Copper Free” brake pads are widely available. Almost 60% of certified brake pad formulations contain <0.5% copper.
• Brake pads contain an average of 5% copper, a reduction of about 39% since 2006 (first industry-wide brake pad copper content report) and 31% since 2011 (first formal report after adoption of copper content restrictions).
• The relatively low fraction of brake pads containing between 5% and 0.5% copper (12.5% of all brake pads) indicates that most manufacturers are moving directly from prior formulations to “copper-free” brake pads by the first copper reduction compliance deadline in 2021.
Washington State’s restrictive approach to replacement brake pad exemptions should cause virtually the entire brake pad market to shift to lower copper content in association with the 2021 and 2025 compliance dates.
Despite the positive changes in brake pad certifications, the pace of brake pad copper content reductions has slowed since 2016.
• Current average brake pad copper content is higher than expected on the basis of prior CASQA projections. The reasons for this are unknown. Investigation is planned.
• The slowed copper reduction pace could affect municipal plans for copper TMDL compliance deadlines in the 2020s. To inform compliance plans, CASQA’s 2015 brake pad copper reduction estimates (CASQA 2016) will be updated in the future to reflect this and other new information.
Despite the slowed pace, continued brake pad copper reductions are expected due to the 2021 and 2025 compliance deadlines.
• Urban runoff copper levels will likely begin responding measurably sometime in the 2020s, but these reductions will likely occur later than previously projected.
• The California State Water Board Surface Water Ambient Monitoring Program Stream Pollution Trends Program (SWAMP SPoT) is conducting the long-term monitoring necessary to measure brake pad copper reductions in California urban watersheds.
CASQA is preparing to become involved in the upcoming California EPA process of reviewing manufacturer applications for extensions from the 2025 copper compliance date. Extensions may be allowed only in cases where no alternative is “safe and available” for a specific vehicle category.
Brake Pad Copper Reduction Status Report 2018 Page 2
Background
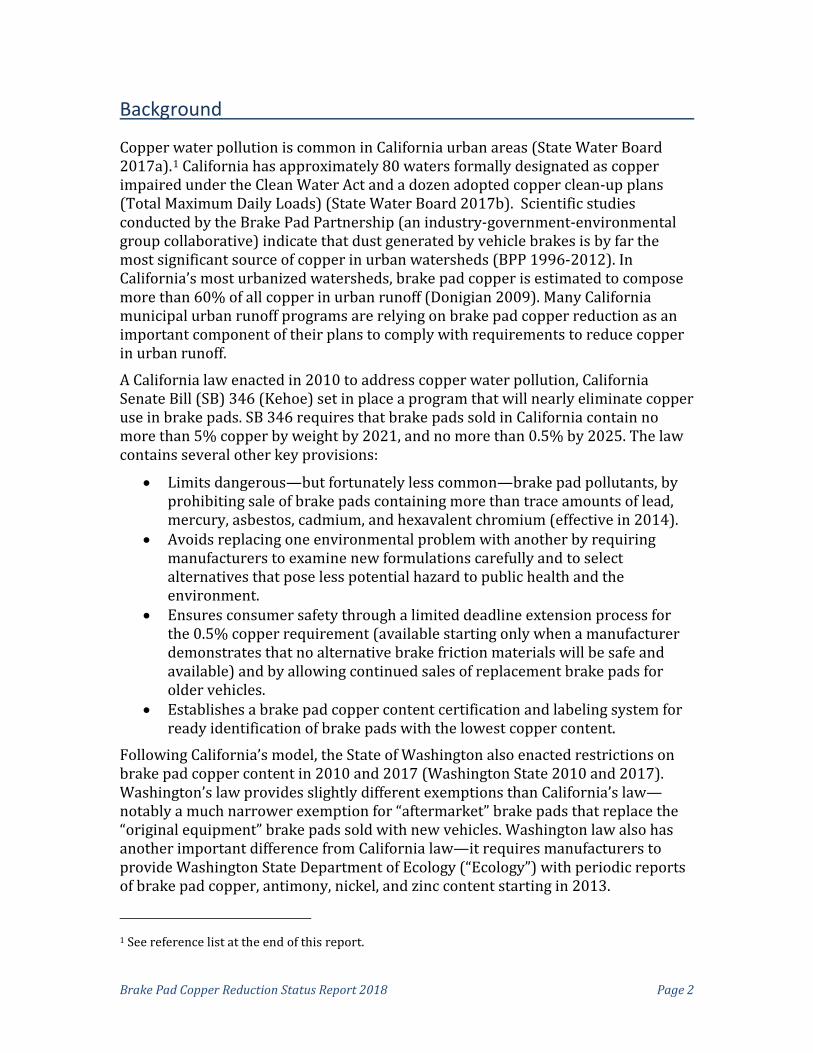
Copper water pollution is common in California urban areas (State Water Board 2017a).1 California has approximately 80 waters formally designated as copper impaired under the Clean Water Act and a dozen adopted copper clean-up plans (Total Maximum Daily Loads) (State Water Board 2017b). Scientific studies conducted by the Brake Pad Partnership (an industry-government-environmental group collaborative) indicate that dust generated by vehicle brakes is by far the most significant source of copper in urban watersheds (BPP 1996-2012). In California’s most urbanized watersheds, brake pad copper is estimated to compose more than 60% of all copper in urban runoff (Donigian 2009). Many California municipal urban runoff programs are relying on brake pad copper reduction as an important component of their plans to comply with requirements to reduce copper in urban runoff.
A California law enacted in 2010 to address copper water pollution, California Senate Bill (SB) 346 (Kehoe) set in place a program that will nearly eliminate copper use in brake pads. SB 346 requires that brake pads sold in California contain no more than 5% copper by weight by 2021, and no more than 0.5% by 2025. The law contains several other key provisions:
• Limits dangerous—but fortunately less common—brake pad pollutants, by prohibiting sale of brake pads containing more than trace amounts of lead, mercury, asbestos, cadmium, and hexavalent chromium (effective in 2014).
• Avoids replacing one environmental problem with another by requiring manufacturers to examine new formulations carefully and to select alternatives that pose less potential hazard to public health and the environment.
• Ensures consumer safety through a limited deadline extension process for the 0.5% copper requirement (available starting only when a manufacturer demonstrates that no alternative brake friction materials will be safe and available) and by allowing continued sales of replacement brake pads for older vehicles.
• Establishes a brake pad copper content certification and labeling system for ready identification of brake pads with the lowest copper content.
Following California’s model, the State of Washington also enacted restrictions on brake pad copper content in 2010 and 2017 (Washington State 2010 and 2017). Washington’s law provides slightly different exemptions than California’s law—notably a much narrower exemption for “aftermarket” brake pads that replace the “original equipment” brake pads sold with new vehicles. Washington law also has another important difference from California law—it requires manufacturers to provide Washington State Department of Ecology (“Ecology”) with periodic reports of brake pad copper, antimony, nickel, and zinc content starting in 2013.
1 See reference list at the end of this report.
Brake Pad Copper Reduction Status Report 2018 Page 3
Reflecting their nationwide commitment to brake pad copper reduction, vehicle industry associations signed a 2015 Memorandum of Understanding (MOU) with the U.S. Environmental Protection Agency (U.S. EPA) committing to taking the California/Washington copper reduction program nationwide (U.S. EPA 2015).
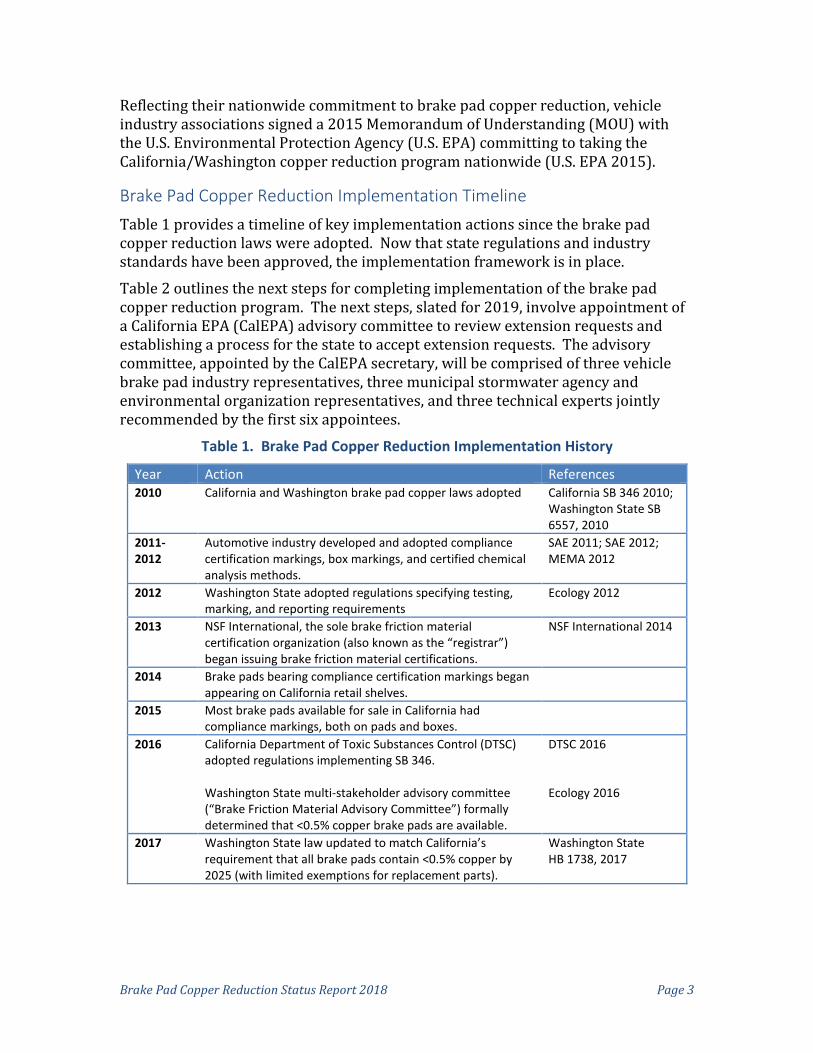
Brake Pad Copper Reduction Implementation Timeline Table 1 provides a timeline of key implementation actions since the brake pad copper reduction laws were adopted. Now that state regulations and industry standards have been approved, the implementation framework is in place.
Table 2 outlines the next steps for completing implementation of the brake pad copper reduction program. The next steps, slated for 2019, involve appointment of a California EPA (CalEPA) advisory committee to review extension requests and establishing a process for the state to accept extension requests. The advisory committee, appointed by the CalEPA secretary, will be comprised of three vehicle brake pad industry representatives, three municipal stormwater agency and environmental organization representatives, and three technical experts jointly recommended by the first six appointees.
Table 1. Brake Pad Copper Reduction Implementation History
Year Action References 2010 California and Washington brake pad copper laws adopted California SB 346 2010;
Washington State SB 6557, 2010
2011-2012
Automotive industry developed and adopted compliance certification markings, box markings, and certified chemical analysis methods.
SAE 2011; SAE 2012; MEMA 2012
2012 Washington State adopted regulations specifying testing, marking, and reporting requirements
Ecology 2012
2013 NSF International, the sole brake friction material certification organization (also known as the “registrar”) began issuing brake friction material certifications.
NSF International 2014
2014 Brake pads bearing compliance certification markings began appearing on California retail shelves.
2015 Most brake pads available for sale in California had compliance markings, both on pads and boxes.
2016 California Department of Toxic Substances Control (DTSC) adopted regulations implementing SB 346. Washington State multi-stakeholder advisory committee (“Brake Friction Material Advisory Committee”) formally determined that <0.5% copper brake pads are available.
DTSC 2016 Ecology 2016
2017 Washington State law updated to match California’s requirement that all brake pads contain <0.5% copper by 2025 (with limited exemptions for replacement parts).
Washington State HB 1738, 2017
Brake Pad Copper Reduction Status Report 2018 Page 4
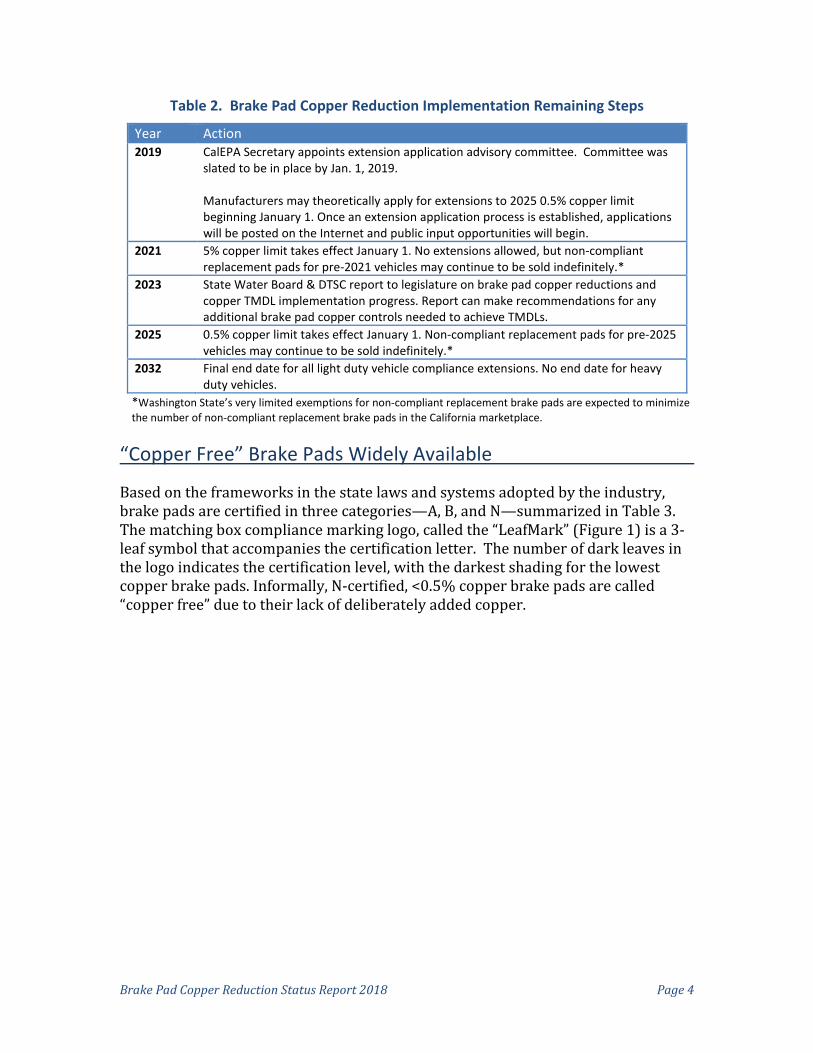
Table 2. Brake Pad Copper Reduction Implementation Remaining Steps
Year Action 2019 CalEPA Secretary appoints extension application advisory committee. Committee was
slated to be in place by Jan. 1, 2019. Manufacturers may theoretically apply for extensions to 2025 0.5% copper limit beginning January 1. Once an extension application process is established, applications will be posted on the Internet and public input opportunities will begin.
2021 5% copper limit takes effect January 1. No extensions allowed, but non-compliant replacement pads for pre-2021 vehicles may continue to be sold indefinitely.*
2023 State Water Board & DTSC report to legislature on brake pad copper reductions and copper TMDL implementation progress. Report can make recommendations for any additional brake pad copper controls needed to achieve TMDLs.
2025 0.5% copper limit takes effect January 1. Non-compliant replacement pads for pre-2025 vehicles may continue to be sold indefinitely.*
2032 Final end date for all light duty vehicle compliance extensions. No end date for heavy duty vehicles.
*Washington State’s very limited exemptions for non-compliant replacement brake pads are expected to minimize the number of non-compliant replacement brake pads in the California marketplace.
“Copper Free” Brake Pads Widely Available
Based on the frameworks in the state laws and systems adopted by the industry, brake pads are certified in three categories—A, B, and N—summarized in Table 3. The matching box compliance marking logo, called the “LeafMark” (Figure 1) is a 3-leaf symbol that accompanies the certification letter. The number of dark leaves in the logo indicates the certification level, with the darkest shading for the lowest copper brake pads. Informally, N-certified, <0.5% copper brake pads are called “copper free” due to their lack of deliberately added copper.

Brake Pad Copper Reduction Status Report 2018 Page 5
Table 3. Brake Pad Copper Content Categories
Certification Level Definition Box Marking Symbol*
A Meets legal standards for asbestos, cadmium, chromium, lead, and mercury
Single shaded leaf
B Same as A and <5% and ≥0.5% copper (“low copper”)
Two shaded leaves
N Same as A and <0.5% copper (“copper free”) All three leaves shaded
Figure 1. “Leaf Mark” Brake Pad Copper Content Box Markings
Source: The LeafMark is a trademark of The Motor and Equipment Manufacturers Association.
The sole current brake pad certification organization, NSF International, maintains a public list of all brake pad formulations that have been certified as to their copper content (and other metals and asbestos). The list, which provides the specific certification level for each certified formulation, is available on the Internet at http://info.nsf.org/Certified/autorp/listings.asp?standard=SAEJ2975.
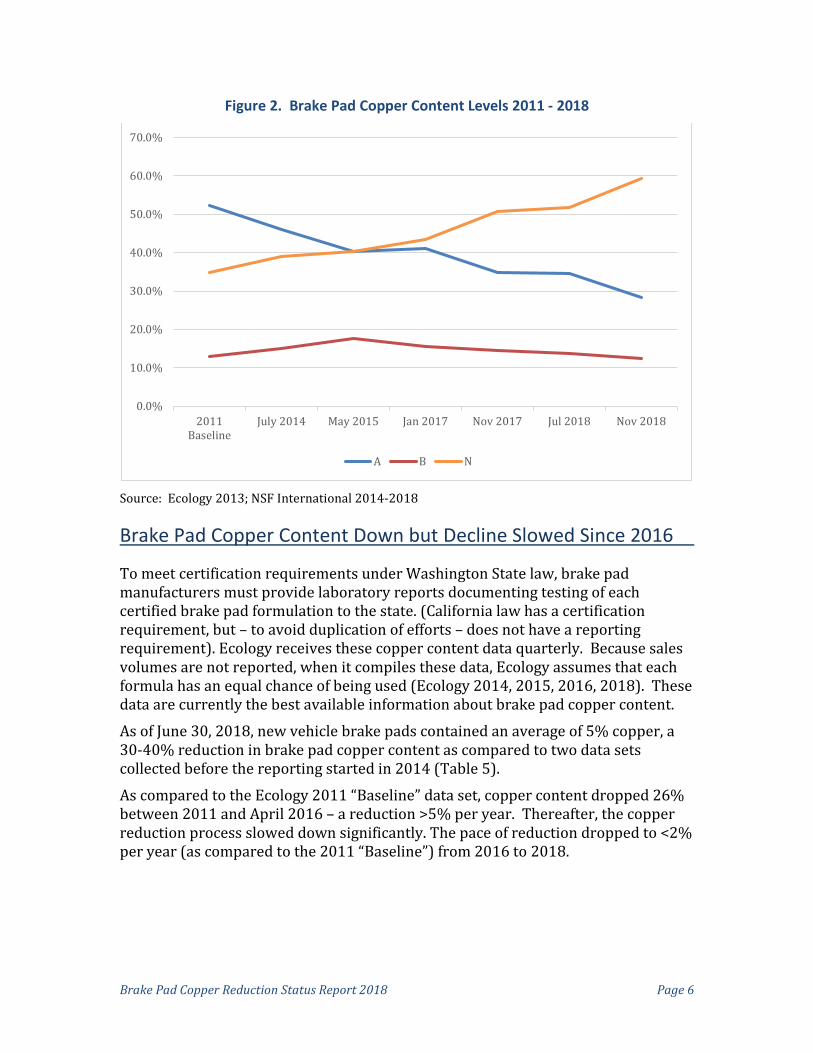
Table 4 compares Ecology’s 2011 “baseline” data (a special data set collected by Ecology prior to initiation of the reporting/certification program) and snapshots of the certifications that were obtained periodically between 2014 and 2018. Figure 2 show the trend in certifications. In 2017, the “copper free” brake pads surpassed 50% of all certifications. By November 2018, these pads composed almost 60% of the market. The relatively low market fraction of “B” certified brake pads indicates that most manufacturers are moving directly from prior formulations to copper-free brake pads.
Table 4. Brake Pad Copper Content Certifications 2014 - 2018
Pad Type
Baseline (2011)
July 2014
May 2015
Jan. 2017
Nov. 2017
July 2018*
Nov. 2018*
# % # % # % # % # % # % % A 741 52 1,881 46 2,013 40 1,911 41 2,169 35 2,199 35 2,207 28 B 183 13 615 15 879 18 720 15 907 15 876 14 972 12
N 496 35 1,612 39 2,008 40 2,026 44 3,154 51 3,285 52 4,616 59
TOTAL 1,420 4,108 4,990 4,657 6,232 6,360 7,795 Source: Ecology 2013; NSF International 2014-2018. *Expired certifications and duplicates removed (these were not significant in older data sets).
Brake Pad Copper Reduction Status Report 2018 Page 6
Figure 2. Brake Pad Copper Content Levels 2011 - 2018
Source: Ecology 2013; NSF International 2014-2018
Brake Pad Copper Content Down but Decline Slowed Since 2016
To meet certification requirements under Washington State law, brake pad manufacturers must provide laboratory reports documenting testing of each certified brake pad formulation to the state. (California law has a certification requirement, but – to avoid duplication of efforts – does not have a reporting requirement). Ecology receives these copper content data quarterly. Because sales volumes are not reported, when it compiles these data, Ecology assumes that each formula has an equal chance of being used (Ecology 2014, 2015, 2016, 2018). These data are currently the best available information about brake pad copper content.
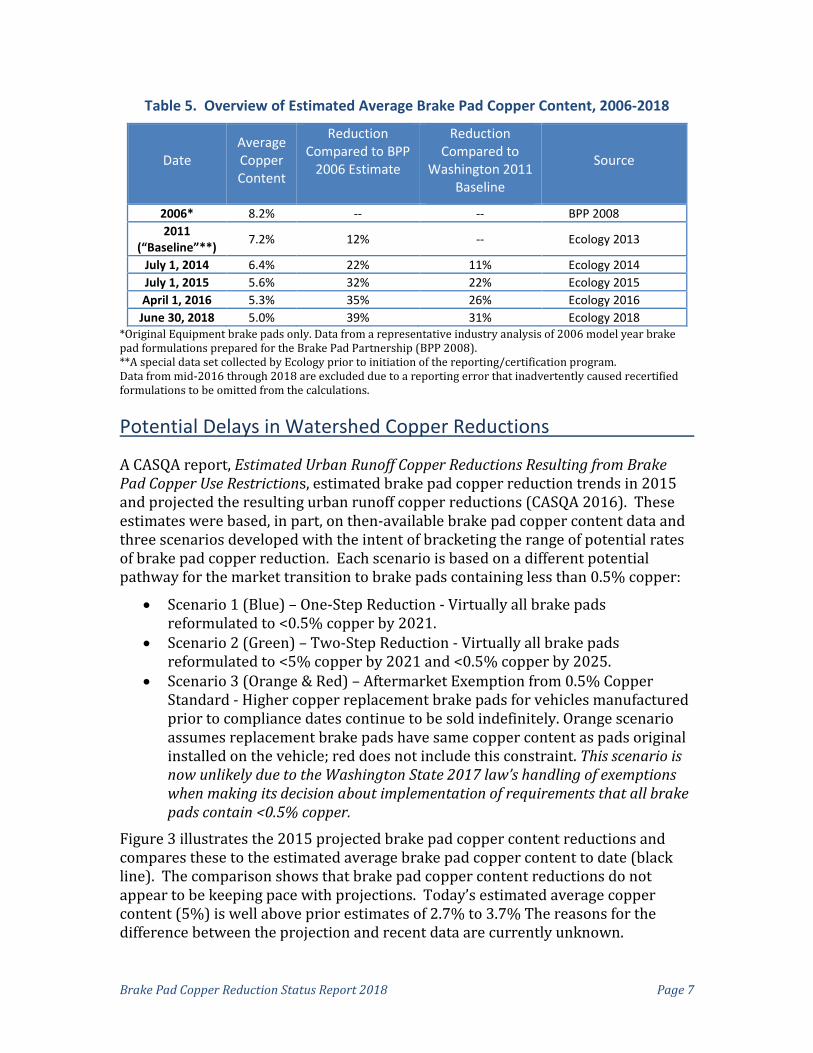
As of June 30, 2018, new vehicle brake pads contained an average of 5% copper, a 30-40% reduction in brake pad copper content as compared to two data sets collected before the reporting started in 2014 (Table 5).
As compared to the Ecology 2011 “Baseline” data set, copper content dropped 26% between 2011 and April 2016 – a reduction >5% per year. Thereafter, the copper reduction process slowed down significantly. The pace of reduction dropped to <2% per year (as compared to the 2011 “Baseline”) from 2016 to 2018.
0.0%
10.0%
20.0%
30.0%
40.0%
50.0%
60.0%
70.0%
2011Baseline
July 2014 May 2015 Jan 2017 Nov 2017 Jul 2018 Nov 2018
A B N
Brake Pad Copper Reduction Status Report 2018 Page 7
Table 5. Overview of Estimated Average Brake Pad Copper Content, 2006-2018
Date Average Copper Content
Reduction Compared to BPP
2006 Estimate
Reduction Compared to
Washington 2011 Baseline
Source
2006* 8.2% -- -- BPP 2008 2011
(“Baseline”**) 7.2% 12% -- Ecology 2013
July 1, 2014 6.4% 22% 11% Ecology 2014 July 1, 2015 5.6% 32% 22% Ecology 2015 April 1, 2016 5.3% 35% 26% Ecology 2016 June 30, 2018 5.0% 39% 31% Ecology 2018
*Original Equipment brake pads only. Data from a representative industry analysis of 2006 model year brake pad formulations prepared for the Brake Pad Partnership (BPP 2008). **A special data set collected by Ecology prior to initiation of the reporting/certification program. Data from mid-2016 through 2018 are excluded due to a reporting error that inadvertently caused recertified formulations to be omitted from the calculations.
Potential Delays in Watershed Copper Reductions
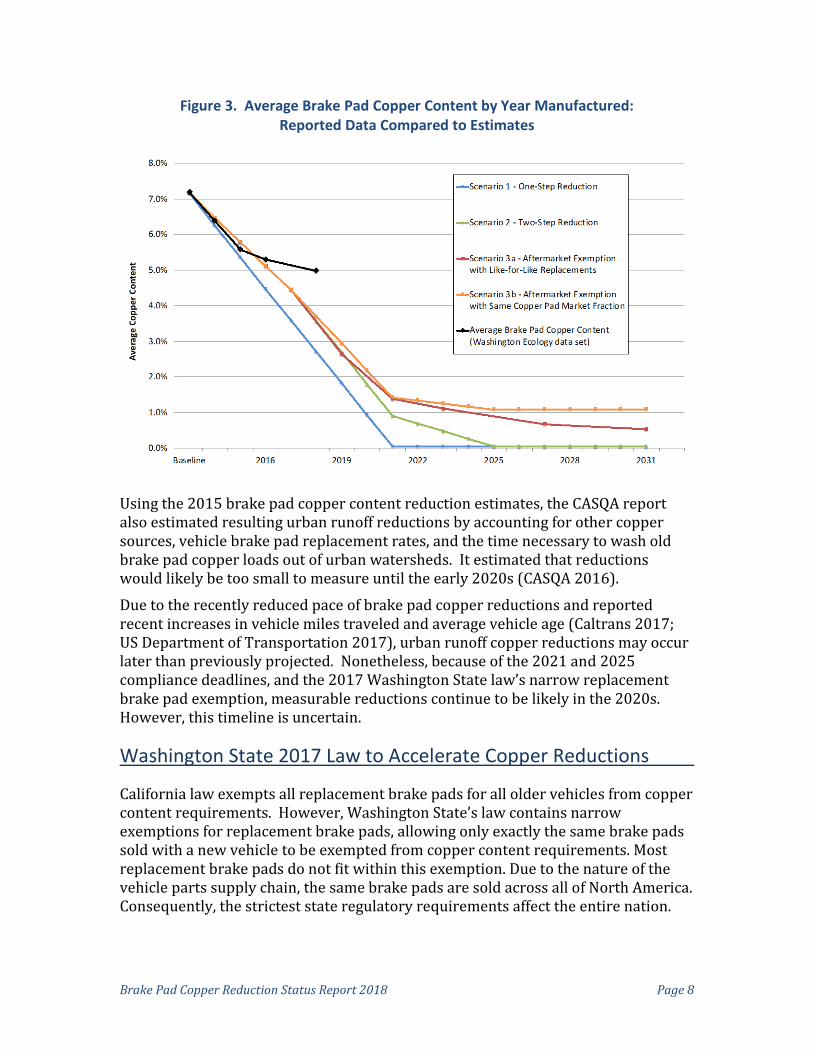
A CASQA report, Estimated Urban Runoff Copper Reductions Resulting from Brake Pad Copper Use Restrictions, estimated brake pad copper reduction trends in 2015 and projected the resulting urban runoff copper reductions (CASQA 2016). These estimates were based, in part, on then-available brake pad copper content data and three scenarios developed with the intent of bracketing the range of potential rates of brake pad copper reduction. Each scenario is based on a different potential pathway for the market transition to brake pads containing less than 0.5% copper:
• Scenario 1 (Blue) – One-Step Reduction - Virtually all brake pads reformulated to <0.5% copper by 2021.
• Scenario 2 (Green) – Two-Step Reduction - Virtually all brake pads reformulated to <5% copper by 2021 and <0.5% copper by 2025.
• Scenario 3 (Orange & Red) – Aftermarket Exemption from 0.5% Copper Standard - Higher copper replacement brake pads for vehicles manufactured prior to compliance dates continue to be sold indefinitely. Orange scenario assumes replacement brake pads have same copper content as pads original installed on the vehicle; red does not include this constraint. This scenario is now unlikely due to the Washington State 2017 law’s handling of exemptions when making its decision about implementation of requirements that all brake pads contain <0.5% copper.
Figure 3 illustrates the 2015 projected brake pad copper content reductions and compares these to the estimated average brake pad copper content to date (black line). The comparison shows that brake pad copper content reductions do not appear to be keeping pace with projections. Today’s estimated average copper content (5%) is well above prior estimates of 2.7% to 3.7% The reasons for the difference between the projection and recent data are currently unknown.
Brake Pad Copper Reduction Status Report 2018 Page 8
Figure 3. Average Brake Pad Copper Content by Year Manufactured: Reported Data Compared to Estimates
Using the 2015 brake pad copper content reduction estimates, the CASQA report also estimated resulting urban runoff reductions by accounting for other copper sources, vehicle brake pad replacement rates, and the time necessary to wash old brake pad copper loads out of urban watersheds. It estimated that reductions would likely be too small to measure until the early 2020s (CASQA 2016).
Due to the recently reduced pace of brake pad copper reductions and reported recent increases in vehicle miles traveled and average vehicle age (Caltrans 2017; US Department of Transportation 2017), urban runoff copper reductions may occur later than previously projected. Nonetheless, because of the 2021 and 2025 compliance deadlines, and the 2017 Washington State law’s narrow replacement brake pad exemption, measurable reductions continue to be likely in the 2020s. However, this timeline is uncertain.
Washington State 2017 Law to Accelerate Copper Reductions
California law exempts all replacement brake pads for all older vehicles from copper content requirements. However, Washington State’s law contains narrow exemptions for replacement brake pads, allowing only exactly the same brake pads sold with a new vehicle to be exempted from copper content requirements. Most replacement brake pads do not fit within this exemption. Due to the nature of the vehicle parts supply chain, the same brake pads are sold across all of North America. Consequently, the strictest state regulatory requirements affect the entire nation.

Brake Pad Copper Reduction Status Report 2018 Page 9
In 2017, Washington State set into law the 0.5% copper compliance deadline of 2025 (matching California), while maintaining its narrow replacement brake pad exemption (Washington State 2017). This restrictive approach should cause virtually the entire brake pad market to shift to lower copper formulations in association with the 2021 and 2025 compliance dates.
Monitoring of Water Quality Improvement Underway
In the long term – once sediments containing previously deposited brake pad copper have washed through watersheds – ambient monitoring data will reflect brake pad copper reductions.
Assuming funding remains available, the California State Water Board Surface Water Ambient Monitoring Program Stream Pollution Trends Program (SWAMP SPoT) intends to provide long-term measurements of copper reductions in sediments from California urban watersheds (Phillips et al. 2016). SWAMP SPoT’s robust monitoring plan, which includes several dozen sites influenced by urban runoff, used statistical power analysis to determine sufficient sampling frequency for measuring anticipated reductions. Its long-term baseline data set, combined with its relatively large number of sampling sites, puts this program in the unique position to identify trends early and track them effectively.
Recommendations
Recommendation 1: Investigate the causes of the reduced pace of brake pad copper reduction. Use this information to update CASQA’s 2015 copper reduction estimates. To provide better estimates of future copper reductions, CASQA should revise its prior copper reduction estimates. Several important changes have occurred that likely affect the pace of future water quality improvement:
• The pace of average brake pad copper content reduction has slowed, but the fraction of “copper-free” brake pads has continued to grow. Examining patterns in the copper content data and any available market information may reveal insights that would be useful for future brake pad copper reduction estimates.
• Although the pace of copper reduction has unexpectedly slowed, “Copper free” brake pads form the majority of the market.
• Washington State’s decision to retain its narrow exemption for replacement brake pads will push non-compliant replacement brake pads out of the marketplace, which should speed the transition to “copper free” brake pads.
• After stagnating for about a decade, vehicle miles traveled in California increased in 2015 and 2016 (Caltrans 2017), which increases brake pad wear and may slow the pace of water quality improvement.
Brake Pad Copper Reduction Status Report 2018 Page 10
• The average age of on-road vehicles has increased by more than 10% over the last decade (US Department of Transportation 2017), which may delay removal of the older higher-copper brake pads from California roads.
• The market share of hybrid and electric vehicles – now at almost 10% (Auto Alliance 2018) has significantly increased in the last decade. These vehicles generally have lower brake pad wear rates because they often have regenerative braking systems.
This updated information can be used not only to update the estimates, but also to refine the assumptions and reduce uncertainties in the copper reduction estimates.
Once information sufficient to support revised brake pad copper reduction models is collected, CASQA’s 2015 brake pad copper reduction estimates should be updated. Updated estimates would assist municipalities with urban runoff copper compliance planning. Updated estimates would be particularly valuable for those municipal urban runoff programs relying on brake pad copper reduction as an important component of their plans to comply with requirements to reduce copper in urban runoff.
Recommendation 2: Prepare for involvement in the process to review applications for individual products to receive extensions from the 2025 <0.5% copper compliance deadline that is likely to begin in 2019. California EPA is responsible for establishing a process to review applications for extension from the 2025 compliance deadline. Despite the fact that the law allows application submittal starting January 1, 2019, no process currently exists to receive, review, and make decisions on applications. Given the legal framework and tight deadlines for processing applications (e.g., applications have to be forwarded to an advisory committee within 30 days of receipt), action is likely in 2019.
The review process will include consideration of the potential copper load associated with exemption applications and whether <0.5% copper brake pads are “safe and available” for the vehicle categories in the extension application. Due to its urban runoff expertise and member reliance on brake pad copper reductions for compliance, CASQA has a special role to play in reviewing the estimated copper load increases associated with extension applications.
Extension applications will be reviewed by a nine-member CalEPA advisory committee to be composed of representatives from industry, municipal urban runoff programs, environmental groups, and technical experts in vehicle and braking safety and economics. In 2018, State Water Board and DTSC staff consulted CASQA while developing a list of recommended members for the three positions that together represent municipal stormwater quality organizations and environmental organizations. Upon appointment, these three people will need to work with the three industry representatives to identify experts in vehicle and braking safety, economics, and other relevant technical areas to serve in the final three advisory committee positions. To ensure that qualified and unbiased experts fill these seats, in early 2019, CASQA should seek to identify appropriate experts for these positions.
Brake Pad Copper Reduction Status Report 2018 Page 11
References
Auto Alliance (2018). Advanced Technology Vehicle Sales Dashboard - California 2013-2018 data. https://autoalliance.org/energy-environment/advanced-technology-vehicle-sales-dashboard/ Accessed December 5 2018.
Brake Pad Partnership (BPP) (1996-2012). Reports available from Sustainable Conservation at http://suscon.org/technical-resources/
Brake Pad Partnership (BPP) (2008). Copper Use Monitoring Program Results for Model Years 1998-2006. Prepared by Sustainable Conservation for the Brake Pad Partnership Steering Committee. February 10.
California Department of Toxic Substances Control (DTSC) (2016). Division 4.5, California Code of Regulations, Title 22 Chapter 35. California Brake Friction Material Requirements.
California Department of Transportation (Caltrans) (2017). Historical Monthly Vehicle Miles of Travel 1972 -2016. http://www.dot.ca.gov/trafficops/census/mvmt.html
California Senate Bill (SB) 346 (Kehoe) (2010). Hazardous Materials: Motor Vehicle Brake Friction Materials. Statutes of 2010, Chapter 307.
California State Water Resources Control Board (State Water Board) (2017a). California Environmental Data Exchange Network (CEDEN). www.ceden.org Accessed Nov. 27 2017.
California State Water Resources Control Board (State Water Board) (2017b). Final 2014/2016 California Integrated Report (Clean Water Act Section 303(d) List / 305(b) Report).
California Stormwater Quality Association (CASQA) (2016). Estimated Urban Runoff Copper Reductions Resulting from Brake Pad Copper Use Restrictions. Prepared by TDC Environmental, LLC. Estimates completed in 2015. Report published April 13 2016.
Donigian, A.S., B.R. Bicknell and E. Wolfram (2009). Modeling the Contribution of Copper from Brake Wear Debris to the San Francisco Bay. Phase 2. Prepared by AQUA TERRA Consultants for the Brake Pad Partnership.
Motor and Equipment Manufacturers Association (MEMA) (2012). 3-Stage Certification Logo. March 14.
NSF International (2014 – 2018). NSF Product and Service Listings. SAE J2975 Measurement of Copper and Other Elements in Brake Friction Materials. http://info.nsf.org/Certified/autorp/listings.asp?standard=SAEJ2975 Accessed July 24 2014, October 14 2015, January 9 2017, November 14 2017, July 20 2018 and November 20 2018.
Phillips, B.M., B.S. Anderson, K. Siegler, J.P. Voorhees, D. Tadesse, L. Weber, R. Breuer (2016). Spatial and Temporal Trends in Chemical Contamination and Toxicity
Brake Pad Copper Reduction Status Report 2018 Page 12
Relative to Land Use in California Watersheds: Stream Pollution Trends (SPoT) Monitoring Program. Fourth Report - Seven-Year Trends 2008-2014. California State Water Resources Control Board, Sacramento, CA.
Society of Automotive Engineers (SAE) (2011). Measurement of Copper and Other Elements in Brake Friction Materials. SAE Technical Standard J2975. (Subsequently updated in 2013 and 2015.)
Society of Automotive Engineers (SAE) (2012). Friction Coefficient Identification and Environmental Marking System for Brake Linings. SAE Technical Standard J866.
US Department of Transportation, Bureau of Transportation Statistics (2017). National Transportation Statistics Table 1-26 “Average Age of Automobiles and Trucks in Operation in the United States” https://www.rita.dot.gov/bts/sites/rita.dot.gov.bts/files/publications/national_transportation_statistics/html/table_01_26.html_mfd
U.S. Environmental Protection Agency (U.S. EPA) and co-signers (2015). Memorandum of Understanding on Copper Mitigation in Watersheds and Waterways between U.S. Environmental Protection Agency and Motor & Equipment Manufacturers Association, Automotive Aftermarket Suppliers Association, Brake Manufacturers Council, Heavy Duty Manufacturers Association, Auto Care Association, Alliance of Automobile Manufacturers, Association of Global Automakers Inc., Truck and Engine Manufacturers Association, and Environmental Council of the States. Signed January 21, 2015.
Washington Department of Ecology (2012). Better Brakes Rule. Chapter 173-901 Washington Administrative Code. Publication 12-04-027. September.
Washington Department of Ecology (2013). Better Brakes Baseline report. Updated Brake Friction Material Release Estimates for Copper, Nickel, Zinc, and Antimony. Publication 13-04-010. July.
Washington Department of Ecology (2016). “Washington’s Better Brakes Law: A National Model for Improving Water Quality.” Report to the legislature from the Brake Friction Material Advisory Committee in compliance with Chapter 70.285 RCW. Ecology Publication No. 16-04-022. December.
Washington Department of Ecology (2014, 2015, 2016, 2018). Data from Better Brakes copper content reporting (summaries and anonymized copper content values). Obtained from Better Brakes coordinator.
Washington State (2010). Washington Senate Bill 6557 (Senate Environment, Water & Energy Committee). Brake Friction Material. Statutes of 2010, Chapter 70.285 RCW.
Washington State (2017). Washington House Bill 1738 (House Committee on Environment). Vehicle Brake Friction Material – Nationwide Agreement. Chapter 204, Laws of 2017.