brand loyalty of chain convenience store (a study...
TRANSCRIPT

BRAND LOYALTY OF CHAIN CONVENIENCE STORE
(A STUDY OF 7-ELEVEN STORES IN BANGKOK)
Pailin Charoensinoran
An Independent Study Presented to
The Graduate School of Bangkok University
In Partial Fulfillment
Of the Requirements for the Degree
Master of Business Administration
2009

©2010
Pailin Charoensinoran
All Rights Reserved

i
Charoensinoran, Pailin. MBA (Business Administration), June 2010, Graduate School, Bangkok University
Brand Loyalty of Chain Convenience Store (a study of 7-Eleven Stores in Bangkok) (77 pp.)
Advisor of Independent Study : Paul TJ James, Ph.D.
ABSTRACT
The study was undertaken with the objectives: (1) To study the both products and service of chain convenience store in Bangkok area. (2) To study the effectiveness of services quality factors, brand awareness, product selection and brand image that 7-Eleven communicate to target customer. (3) To study the demographic group’s viewpoint on relationship between satisfaction rate and brand loyalty of chain convenience store in Bangkok.
The research analysis is based on qualified 400 questionnaires that were collected from 15 April, 2010 until 30 April, 2010 by random population by used accident sampling from the people who visiting 7-Eleven store at Talad Iamsombat market branch which located in Bangkok.
The Statistical Package for the Social Science (SPSS) was used to analyze the data; i.e. percentage, frequency, and crosstab.
According to the objective of this research, the research focuses on the result of brand loyalty in 7-Eleven stores. The result has been gathered from the questionnaires done by the people who use service from one branch of this brand convenience store. The following is the discussion which can be concluded from the effect from demographic factors; effect of service qualities; brand awareness and brand image; and the relationship among consumers’ demographic and satisfactions on the brand loyalty of chain convenience stores.
Furthermore, exclusive and marketing people can enhance more effectiveness of consumers need, increase customer base and make more market share in this segmentation y using marketing strategies which many dealers use, that is the timing, location, service quality and pricing through

ii
modern trade used the form of outside-in, the objective for this strategy is getting through the more consumers’ need.

iii
ACKNOWLEDGEMENT
I would like to acknowledge the help and support of many people without whom this study would not have been completed. I wish to express my sincere appreciation to Dr. Paul T J James, my advisor for time, steady support, statistical proficiency and direction throughout my research study.
I also like to state my special appreciation to my committee members; for their kindly comments and useful suggestions during the implementation process of this study.
I would like to express my deepest gratitude to my beloved father, mother, sister and brother for their strongly support, love, encouragement, understanding and contribution.
Last but not least, it is unforgettable to thank to all my friends for their provision of tangible and intangible support and assistance and for sharing this great experience with me.

iv
TABLE OF CONTENTS
Page
ABSTRACT ………………………………………………………………….. i
ACKNOWLEDGMENT ………………………………………………………
iii
LIST OF TABLES …………………………………….………………………
vi
LIST OF FIGURES …………………………………….……………………..
viii
CHAPTER 1: INTRODUCTION
1.1 Background ……………………………………………………………. 1
1.2 Statement of Problem …………………………………………………. 3
1.3 Intention and Reason for Study ……………………………………….. 3
1.4 Research Objectives …………………………………………………… 3
1.5 Research Question ……………………………………………………... 4
1.6 Scope of Study ………………………………………………………… 4
1.7 Assumptions …………………………………………………………… 5
1.8 Benefits of Research …………………………………………………… 5
1.9 Limitations of Research ………………………………………………..
5
CHAPTER 2: LITERATURE REVIEW
2.1 Introduction …………………………………………………………….. 6
2.2 Retailing Business ……………………………………………………… 6
2.2.1 Retailing Business ……………………………………………….. 6
2.2.2 Retailing Mix …………………………………………………….. 7
2.2.3 Retailing Ownership ……………………………………………... 7
2.2.4 Franchise Business ………………………………………………. 8
2.3 Concept of convenience store …………………………………………. 9
2.4 Convenience store in Thailand ………………………………………… 10
2.5 Demography in Thailand ………………………………………………. 11
2.6 Brand Loyalty ………………………………………………………….. 12
2.7 Related Research ………………………………………………………. 14
2.8 Conclusion ……………………………………………………………... 15
CHAPTER 3: METHODOLOGY
3.1 Introduction ……………………………………………………………. 16
3.2 Literature Review – Methodology …………………………………….. 16
3.3 Research Question – Possible research orientations …………………… 18
3.4 Methods of Inquiry …………………………………………………….. 19
3.5 Research Methodology ………………………………………………… 19
3.5.1 Research Strategies ………………………………………………. 20
3.5.1.1 Quantitative Methods ………………………………………. 21

v
TABLE OF CONTENTS (CONTINUED)
Page
3.5.1.2 Qualitative Methods ……………………………………….. 22
3.5.1.3 Mixed Methods ……………………………………………. 23
3.6 Sampling Design ……………………………………………………… 23
3.6.1 Non-probabilistic Sampling Technique …………………………. 23
3.6.2 Probabilistic Sampling Technique ………………………………. 24
3.6.3 Population ……………………………………………………….. 25
3.7 Surveys/ Interview design …………………………………………….. 26
3.8 Coding structures ……………………………………………………… 27
3.9 Reporting ……………………………………………………………… 27
3.10 Statement of Research Method Used ………………………………… 28
3.10.1 Research methodology ………………………………………… 28
3.10.2 Research question ……………………………………………… 28
3.10.3 Methods of inquiry ……………………………………………... 29
3.10.4 Sampling design ………………………………………………... 30
3.10.5 Surveys/Interview design and development ……………………. 30
3.10.6 Coding structure ………………………………………………… 33
3.11 Conclusion ……………………………………………………………. 35
CHAPTER 4: DATA PRESENTATION AND ANALYSIS
4.1 Data Presentation ………………………………………………………. 37
CHAPTER 5: DISCUSSION AND CONCLUSION
5.1 Research questions with result of research …………………………….. 61
5.1.1 Factor that build brand loyalty of consumer ……………………... 61
5.1.2 Factors that effect to consumer’s decision making ………………. 62
5.1.3 Relationship between consumer’s demography and purchasing
Behavior ………………………………………………………….
62
5.1.4 Relationship between the frequency of visiting and brand
Preference ………………………………………………………...
62
5.2 Conclusions ……………………………………………………………. 63
CHAPTER 6: RECOMMENDATION
6.1 Recommendations ……………………………………………………… 65
BIBLIOGRAPHY ……………………………………………………………..
66
APPENDIX
APPENDIX I: QUESTIONNAIRE (ENGLISH) ………………………….. 69
APPENDIX II: QUESTIONNAIRE (THAI) …………………………….. 74

vi
LIST OF TABLES
Table Page
1.1 Number of 7-Eleven stores from year 2007-2009 ………………………… 2
1.2 Modern Trade in Thailand ………………………………………………… 2
2.1 Number of chain convenience store in Thailand, 2002 …………………… 11
2.2 Generational Cohort, 2009 ………………………………………………… 12
3.1 Research Strategies ………………………………………………………... 21
3.2 The sample size for a given population …………………………………… 26
3.3 The sections of report ……………………………………………………… 28
3.4 Observation result at 7-Eleven store ………………………………………. 30
3.5 Result of reliability statistics ………………………………………………. 31
3.6 Result of reliability statistics2 ……………………………………………... 32
3.7 Result of Reliability statistics separated by question ……………………… 32
3.8 Coding of questionnaire ……………………………………………………
33
4.1.1 Gender of respondents …………………………………………………...
38
4.1.2 Age of respondents …………………………………………………........
39
4.1.3 Education of respondents ………………………………………………..
40
4.1.4 Marriage status of respondents …………………………………………..
41
4.1.5 Occupation of respondents ……………………………………………….
42
4.1.6 Income of respondents …………………………………………………...
43
4.1.7 Transportation of respondents ……………………………………………
44
4.2.1 Purchasing experiences of respondents ………………………………….
45
4.2.2 Frequency of purchasing at 7-Eleven stores ……………………………..
46
4.2.3 Spending amount at 7-Eleven stores ……………………………………..
47

vii
LIST OF TABLES(CONTINUED)
Table
4.2.4 Purpose of visiting 7-Eleven stores of respondents ……………………..
Page
48
4.3.1 Preference of 7-Eleven over other brands in respondents’ opinion ……..
49
4.3.2 7-Eleven brand value in respondents’ opinion ………………………….
50
4.3.3 Respondents’ opinion about suggest 7-Eleven to others ………………..
51
4.3.4 Rank of factors that motivate respondents to purchase at 7-Eleven …….
52
4.4.1 Reason of purchase at 7-Eleven separate by Gender ……………………
56
4.4.2 Relationship between frequency of visiting 7-Eleven and brand
Preference ………………………………………………………………..
57
4.4.3 Relationship between ages of respondents and brand preference ………
58
4.4.4 Relationship between attitude of respondents and frequency of
Purchasing ……………………………………………………………….
59
4.4.5 Relationship between different occupation and purchasing behavior …..
59

viii
LIST OF FIGURES
Figure Page
4.8 Purchasing experiences of respondents …………………………………… 45
4.9 Frequency of purchasing at 7-Eleven stores ……………………………… 46
4.10 Spending amount at 7-Eleven stores …………………………………….. 47
4.11 Purpose of visiting 7-Eleven stores of respondents ……………………… 48
4.12 Preference of 7-Eleven over other brands in respondents’ opinion ……… 49
4.13 7-Eleven brand value in respondents’ opinion …………………………… 50
4.14 Respondents’ opinion about suggest 7-Eleven to others ………………… 51
4.15 relationship between ages of respondents and brand preference ………… 58

1
CHAPTER 1 INTRODUCTION
1. Background Nowadays, the lifestyle of people who lives in cities has many styles. Some groups of people stay awake at night and sleep on day time while normal lifestyle is to sleep at night and awake on day time. The busy life, that everyone are hurry and serious. The shops are open all day and night to response the needs of customers. Bangkok city where's well deserved reputation for 24 hours street foods (www.cnngo.com. 1-Feb-10). The modern convenience store where offer 24 hours open for their customers and offer the limited. The modern convenience store is one categories of the fives modern trade group which are including discount store, department store, supermarket, special store or category killer and convenience store. The convenience stores are different from discount stores such Tesco Lotus, Carrefour, BigC which “usually selling numerous products in cheap prices that might be even less than their average selling price” (Advocate Roi Bak, Thailand's New Retail Act) The convenience store offer the less number of the discount store and always sell at standard rate or even higher for some product when compare to discount store prices. The convenience store is becoming more popular along with the changing of demand in markets while the local retail stores are reducing. The expansion of convenience stores in Thailand are increasing everyday and in every corner of street. There are numbers of convenience stores in Thailand but there’s only some brands existing and growing in the market. In the past, Thai customers normally purchase from traditional stores which own by the local merchant which sizes of store are not big but presently the modern trade style are increasing rapidly. In Thailand modern trade of convenience store or another name of modern retailing industry which offer systematic and high performance trade. 7-Eleven is one successful chain convenience store all around the world including Thailand. The fast growth of chain convenience store has been phenomenal in the past few years as the

2
proof can be found in the increasing number of 7-Eleven branches in all around Thailand and the increasing of the product selections. Table 1.1: Number of 7-Eleven Stores from year 2007-2009
Year 2007 2008 2009 Dec 2009
Number of Store 3784 4279 4778 5270
( Ref : 7eleven.co.th 14 Feb 2010) In October 2009, Modern Trade in Thailand has total 9,921 branches including 636 branch of Tesco Lotus, small Convenience stores 460 branches, BigC 77 branches, Carrefour 38 branches, Makro 43 branches, 7-Eleven 5,100 branches and others. Table 1.2: Modern Trade in Thailand
Modern Trade Branch (October 2009)
Tesco Lotus (Lotus Express) 636
Small Convenience Store 460
Big C 77
Carrefour 38
Makro 43
7-Eleven 5100
Others 3567
(Ref: bangkokbiznews.com 10 Feb 2010) 7-Eleven, Inc. was founded in Dallas, Texas in 1927 and in 1989 the first branch of 7-Eleven in Thailand which CP Cooperation company bought its license in 1988. 7-Eleven is brand name of top number one chain convenience stores in Thailand and around the world from their total number of 32,208 branches in total counted on 31st March 2007 (www.7eleven.co.th). From the day of first branch start at Phatphong road in Bangkok until year 2009, 7-Eleven has more than 5,100 branches which exist in most street corners in Thailand and develop to service inside PTT gasoline stations which lead to 7-Eleven have more than 4 million customers in one day.

3
7-Eleven created big success business and they become very unique and still keep expanding throughout Thailand and other countries. 2. Statement of Problem There are various brands of convenience stores in Thailand existing all around the city. In Bangkok city have huge number of convenience stores and there is important problem of convenience stores in Thailand is high rate of competitors who develop and invest in marketing strategy to get customers such as the improvement on product selections, price cutting, interesting promotions, attractive advertisements and expansion branch rapidly. In order to increase customer who give interest to on the convenience both service and selection and time saving, customer satisfactions and brand loyalty are carry the important role to make the customer purchase and revisit their brand. Researcher is interested in “The satisfaction and brand loyalty of Convenience store” for research the possible factors that could create customer satisfaction and effect on brand loyalty of convenience store such as demography, services, brand awareness, product selections, and brand images. 3. Intention and Reason for Study
In this research the researcher is willing to find out the important factors that could affect the brand loyalty in retailing business and specifically focus on the chain convenience stores business in Bangkok. This research will study the effectiveness of the communication between brands to its customers and study of satisfaction factors which could be used for develop the marketing plan of the chain convenience stores in Bangkok. 4. Research Objectives
The objective of this research could be separated into 3 major objectives
1. To study both products and service of chain convenience store in Bangkok Area

4
2. To study the effectiveness of services quality factors, brand awareness, product selection and brand image that 7-Eleven communicate to target customer
3. To study the demographic group’s viewpoint on relationship between satisfaction rate and brand loyalty of chain convenience store in Bangkok.
5. Research Question
Major Question : What are the main factors that build brand loyalty of consumer at 7-Eleven convenience stores? Sub Questions :
- What factors that effect to the consumer’s decision making to purchase at 7- Eleven store?
- What is the relationship between group of consumer demography and purchasing decision at 7-Eleven stores?
- What are relationship between the visiting frequency and brand preference of 7-Eleven stores?
6. Scope of Study
This research will be survey within Bangkok in some area which has 7-Eleven stores. This research focus on study consumers’ opinion that’s present in 7-Eleven at the research time. Study will try to find out the factors that effects on customers’ satisfaction and factors that brand loyalty was depending on. Study will study in the possible mode such as mode of demographic, service quality, brand awareness, product selection and brand image. The research will be using the questionnaire which concern with the customer satisfaction and brand loyalty by separate survey into 4 period of times; morning , afternoon, evening, night at some branches in front of 7-Eleven store.

5
7. Assumptions
Consumers whose genders, ages and occupations which have different number of family’s members may have different opinion, rate of satisfaction and loyalty toward the on 7-Eleven chain convenience stores in Bangkok which differences could be seen in number of statistics. Majority group of people who’re similar in basic fixation could have similar idea and reason. 8. Benefit of Research
- To have a better understanding the relationship between modes of demographic, service
quality, brand awareness, product selection, and brand image of retailing business. - To provide the research information to who need to build effective retailing, to increase
customer base and improve the market share in this retailing segment. - The research result could be useful for marketer who interest to understand the behavior
of Thai’s consumers.
9. Limitations of Research
This research will be only located in capital city of Thailand which is Bangkok province. Bangkok is the center area for any types of business in Thailand and Bangkok is the area of most Thai population stayed. This research will only study in Bangkok area within year 2010 by study from the biggest chain convenience store (franchise) in Thailand which is 7-Eleven brands.

6
CHAPTER 2 LITERATURE REVIEW
“Brand Loyalty raises profit” (East R.1997, p.10) The customer select to purchase product from some place many times and some of them never change even though there are another similar shop are next to there. The shop would get greater benefit comparing to their competitors from this preference of customer. The word Brand Loyalty is been referred by many books which always including of three feeling of consumer. Firstly, “Loyalty consumer always has positive feeling or attitude toward the brand. Second, Loyalty consumer always buys the brand more than other brand in the same category or it is as brand preference. Third, Loyalty consumer always continues to buy the brand over long periods of time”. (East R.1997, p.30) Consumer have positive attitude toward brand and prefer to shop with one brand and continuously consume and difficult to change because of the consumer already experience in positive way toward the brand and not sure with another brand which they never experience even though there is a chance of better service or quality as long as the old brand never dissatisfy them. This chapter consists of two sections. First section suggests the literature review of business categories. Second section explain the related topic that effects to consumers satisfaction and loyalty. The foremost of the chapter is to provide insight into topic and give reader the background Retailing Business Retailing business has four main functions which play major roles on providing an assortment of products and services, breaking bulk, holding inventory, and providing services. This all functions create activities that add value to products and services which sold to consumers. As normally retailing only as the sale of products in stores but Levy and Weitz stated that “Retailing also involves the sales of services and not all retailing is done in stores” (Levy & Weitz, 1998, p.9) There are many characteristics of retailing business but the most basics characteristic of retailer is the retail mix which used by retailers to satisfy their customers’ needs.

7
Retailing Mix There are four elements of retail mix are particularly useful for classifying retailers business. First one is the type of merchandise sold which each retailing store have different outcome depending on their customers and their offers. Levy and Weitz said that while a retailer’s principal competitors may be other retailer in the same classification and there are many exceptions. For example, convenience stores such 7-Eleven, traditional supermarkets, and warehouse grocery stores and all other retailing stores which ma offer the same type of merchandise, but they satisfy different consumer needs and thus appeal different market segments. Second, The Variety and assortment, the different of merchandise offer in the retailer store and the assortment is the different number of items in a category within store. The numbers different could create the different outcome of each retail stores. “Variety is often referred to as the breadth of merchandise carried by a retailers but assortment is referred to as the depth of merchandise” (Levy & Weitz, 1998, p.30) Third, customer services which each retailers also differ in the services they offer customers. There’s customers expect retailers to provide some services and there’s many retailers that cater to service-oriented consumers offer customers most of these services at no charge. A last characteristic is about the cost of offering breadth and depth of merchandise and services. In some small retailer, the inventory investment could not make so much variety and deep assortment but in commonly the retailer must have back up stock. “A critical retail decision involves the trade-off between costs and benefits of maintaining additional inventory or providing additional service” (Levy & Weitz, 1998, p.32) Retailing Ownership There are many way that can classify the retailing business. One unique and well known in many books are to separate retailing business into the ownership type, which there are three types of ownership or the retailers Independent, Single-Store Establishments, Corporate Retail Chains, and Franchise. First one is the independent, single-store establishments which classify the group of retailers who manage the store by their own “the convenience store is a modern type of business management which presents modern trade styles. There are shelf management technique and technology

8
development using to support the retailing business. Most of the products in convenience stores are FMCG or Fast Moving Consumer Goods and spend less time in purchasing or order. The open hours of convenience store are offer long open hours in a day and many stores open 24 hours every day to fulfill the needs of consumer in this modern lifestyle especially in city. Second type of ownership is corporate retail chains which is a company operating multiple retail units under common ownership and usually having some centralization of decision making in defying and implementing its strategy. “There has been considerable concern that corporate retail chains will eventually drive independent retailers out of business but local retailers offering merchandise and service that aren’t available at corporate chains can still prosper” (Levy & Weitz, 1998, p.53) Then, when each retailers offer the same merchandise, it could lead to retailer to create more competitive advantage by offering newer thing, newer service or even something better to gain more customer as Arnould said in Consumers book that “Listening carefully to customers and remaining market focused leads to market offering that are different from competitors’ products and to improved profit margins.” (Consumers, Arnould E., 2002, P.31) The last type of ownership is Franchising, “franchising is a contractual agreement between a franchisor and a franchisee that allows the franchisee to operate a retail outlet using a name and format developed and supported by the franchisor.” (Levy & Weitz, 1998, p.55) The franchise business offering the assistance in business, build brand, promote and manage products for the franchisee which could help franchisee to have professional retail store. In a return the franchisor or franchising owner will gain the lump sum and royalty on all sales create in the franchisee store. Franchise Business The franchise business could be both of services and merchandise retailers. The service retailers are including the intangibility which is general of service retailer. “Customer cannot see touch, or feel them” (Levy & Weitz, 1998, p.49) The service retailing are about action rather than objects. Presently, the high competitive situation in the market, any type of retailing cannot only sell and ignore servicing.

9
The way to convince people to become customer of retailing store could be depending on each store how different could they offer to their existing customer and potential customer. Arnould stated that “Differentiation means offering customers something they value and those competitors don’t have. Differentiation can occur at any point in the consumption chain – from how and when the product is acquired, to when consumers decide they no longer want it and decide to dispose of it.” (Consumers, Arnould E., 2002, P.34) The store should offer something different from its competitor and could consider its marketing concept, the business philosophy, idea and policy statement which is important if the retailers know the customers feeling and could get closer to their customers by learning from their behavior and use marketing technique to assist the main idea. The essential of the marketing concepts is a market-focused, customer-oriented, coordinated marketing effort aimed at generating customer satisfaction as the key to satisfying organizational needs. (Consumers, Arnould E., 2002, P.33) by using marketing concept analyze the target group and learn them, then use marketing strategy to create strength in customer relation. To find out what is the needs to attract the target group and create the marketing plan to support and develop retailing business may requires the understanding of planner and the creativity and imagination of marketer in order to crate the strategies that match to target customer and get effective outcome. “The connection between understanding customers and designing effective marketing strategies requires creativity and imagination. (Consumers, Arnould E., 2002, P.40) But there is not only to improve the sales or create the sales for store. Sometime, there is need for matching the consumer’s problem and its solution as Arnould said that “Marketing imagination doesn’t just involve finding solutions to consumer problems; sometime it involves a different type of matching of consumer problems and solutions.” Concept of convenience store The convenience store is representing its own characteristic of simple, no time consuming, and comfortable to consumers. “Convenience stores enable consumers to make purchases quickly without having to search through a large store and wait in long checkout processes” (Levy & Weitz, 1998, p.35). Normally the convenience stores provide a limited variety and assortment of merchandise at a convenient location. Convenience stores enable consumers to make purchases

10
simple, easy, and comfortable without having to search through a large store and wait in long checkout lines. The convenience store only offers the limited assortment and variety and charges higher prices than supermarkets. The convenience stores are a good example that lowest price is not the only one factor that could invite consumers to entrance to stores and spend money on purchasing them. There are other factors that could make convenience store have customers and continuously purchase from them. The management of retailing store needs to consider the other factor that could create more sales volume for them which could be services, innovative idea and the marketing strategy. Arnould suggested in his book “Consumers” that “Paying attention to the customer is certainly not a new idea, and yet many companies don’t do it or don’t do it well. (Consumers, Arnould E., 2002, P.33) Convenience store in Thailand In Thailand, Convenience store or Minimart are developed from the traditional trade and mixed with supermarket style but much smaller sizes. Thanin Jieravanond the president of CP corporation inc. in year 2003 said that the convenience stores mostly locate in the cities location where big number of target groups has with standard price of products and specially sell foods and beverages which consumers could get fast. (Jieravanond T, 2003) 7-Eleven brands are number one of chain convenience store in Thailand in year 2002 when comparing to another brand which license come from the different places such Japan or United States. 7-Elven is origin from the United States as researcher has mentioned previously. 7-Eleven stores provide varieties of products which are basic type of products which is needed by the most consumers such as foods, bakeries, beverages, candy, gum, drugs, snacks, dairy, ice-cream, software and etc. In recent year 7-Eleven has develop services of “counter services” which allow customers to pay for the utilities’ bills at their cashier counter by just use the bar codes on the bill and linked to service providers. (www.7eleven.co.th, 2nd March 2010) Additionally, 7-Eleven stores in Thailand have offer “Thai Smart Card” or prepaid card which allows consumers whose ages 18 years or more could use it and with this “Thai Smart Card” the consumers could

11
get more benefit with the other networks of their business partners. TAble 2.1: Number of chain convenience store in Thailand, 2002
Conventional C-Store
Name Country of Origin 2002
2001 2000 1999 BKK Provinces Total
7-Eleven * US 2050 1800 1520 1200
FamilyMart Japan 250 150 100
Fresh Mart Thailand 117
AM/PM * US 53 44 97 100 130 300
Central Minimart Thailand 22
Total 2514
* Including in PTT gasoline stations (Ref : www.siamfuture.com on 1 Mar 2010) Demography in Thailand Different people have different taste. The demographics of Thai people, generally different ages would prefer different type of products and even different pricing, images, fashion and quality. “People within the same generation have the similar purchase behaviors because they have shared experiences and are in the same stage of life.”(Levy & Weitz, 1998, p.97) In the marketing research, to segment the target group could be made more effectively when the researcher or marketer could use demographics in Thailand to analyze and segment the target into smaller group for easy to focus. There are four major groups that Levy and Weitz suggested to cut the generational pie. The exact definitions for each group would shift as time goes by.
12
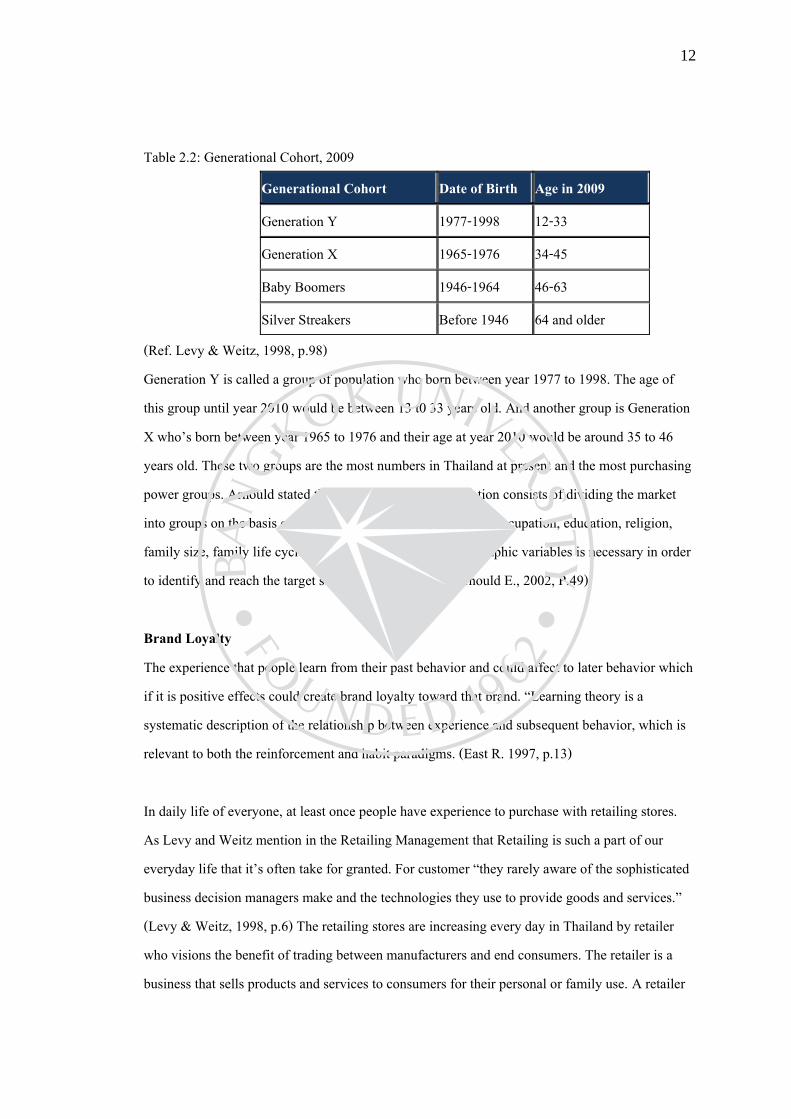
Table 2.2: Generational Cohort, 2009
Generational Cohort Date of Birth Age in 2009
Generation Y 1977-1998 12-33
Generation X 1965-1976 34-45
Baby Boomers 1946-1964 46-63
Silver Streakers Before 1946 64 and older (Ref. Levy & Weitz, 1998, p.98) Generation Y is called a group of population who born between year 1977 to 1998. The age of this group until year 2010 would be between 13 t0 33 years old. And another group is Generation X who’s born between year 1965 to 1976 and their age at year 2010 would be around 35 to 46 years old. These two groups are the most numbers in Thailand at present and the most purchasing power groups. Arnould stated that “Demographic segmentation consists of dividing the market into groups on the basis of variables such as age, sex, income, occupation, education, religion, family size, family life cycle, and ethnicity. A link to demographic variables is necessary in order to identify and reach the target segment.” (Consumers, Arnould E., 2002, P.49) Brand Loyalty The experience that people learn from their past behavior and could affect to later behavior which if it is positive effects could create brand loyalty toward that brand. “Learning theory is a systematic description of the relationship between experience and subsequent behavior, which is relevant to both the reinforcement and habit paradigms. (East R. 1997, p.13) In daily life of everyone, at least once people have experience to purchase with retailing stores. As Levy and Weitz mention in the Retailing Management that Retailing is such a part of our everyday life that it’s often take for granted. For customer “they rarely aware of the sophisticated business decision managers make and the technologies they use to provide goods and services.” (Levy & Weitz, 1998, p.6) The retailing stores are increasing every day in Thailand by retailer who visions the benefit of trading between manufacturers and end consumers. The retailer is a business that sells products and services to consumers for their personal or family use. A retailer

13
is the final business in a distribution channel that links manufacturers with consumers. (Levy & Weitz, 1998, p.7) Business need to create loyalty among their brand would be because of greater benefit as Hallberg said that “the degree of loyalty has a strong influence on the share of total category purchases consumers give to any particular brand. It also has a significant effect on the price the marketer can charge for the brand.”(Hallberg G., 1995 p.50) The loyalty in brand is mostly solo brand buyer and other loyalty buyers are found in low profit segment. Hallberg stated the reason that “loyal buyers tend to be light buyers as most of them are found in the low-profit segment. They have little opportunity to switch brands because they make relatively few purchases. In extreme cases, light buyers have no occasion to be disloyal.”(Hallberg G., 1995 p.54) Most of brand loyalty could be found in the market of high consideration rate. The purchasing in market now have brands to select numbers greater than buyers number. “The consumers in the market for high-profit segment are multiple brand considerers rather than multiple brand buyers” “So, for durables, loyalty can logically be measured by share of mind or share of consideration and not just by straight repurchase rate.” (Hallberg G., 1995 p.56) The changing of consumers’ behavior could have much effect toward brand loyalty, as researcher could found this change is the graph in figure 2.3 that research from nine brands that marginally increased or manage to maintain their loyal heavy buyer penetration. The result of survey has shown that “the remaining seventeen brands, the average percentage of loyal high-profit buyers declined by roughly half. This means that almost 90 percent of the high profit buyers of brand give it less than half their business.” (Hallberg G., 1995 p.31)

14
Figure 2.1: Fifteen-year brand loyalty trends showing category heavy buyers of twenty-six brands.
(source: MRCA.) Above graph is result from the research of contribution of marginal consumers and brand disloyalty in a representative packaged-goods brand franchise. The result of above is from the automotive industry “Honda” research. They found that the brand loyalty toward the automotive is 33% loyal heavy buyers while no-loyal heavy are greater at 34% and the leftover 33% is group of people who’s not strongly loyal but the loyalty level is only in medium and light. Figure 2.2: Source of representative brand volume by profit segment and 50-percent-plus loyalty.
(Source: MRCA.) Related Research The research of “Measuring brand power: validating a model for optimizing brand equity” by Woon, Marshall, Keller (1999). The research had concluded that the way to measuring brand equity could be done not only in traditional approach but could be done by “concerning with

15
optimizing brand equity through parsimonious manipulation of the marketing mix” The research of Grace and O’Cass, (2005) “Examining the effects of service brand communications on brand evaluation” had concluded that “the controlled communications and brand name are pivotal in establishing consumer expectations, thus influencing satisfaction and brand attitudes.” Therefore, the advertising type should be utilized to be realistic in communication to consumers. Conclusion The demography of people are important factor that marketer need to study and use it effectively to divide the target group into groups and select the specific group who could match to the business and focus in dept to develop plan on communication with that target group. The links between supplier and target group could create the most benefit if the marketer links them correctly. As same as marketing strategy which is important to create marketing plan, base on the availability of supplier or resources and create the communication to their consumers. “Marketing strategy is built on important skills and resources, none is more critical than the ability to sense the market.” (Consumers, Arnould E., 2002, P.31) The retailing business which presently have more choices for customers related from the higher rate of competitor. So, the retailers are also responding to changes in consumer values and behavior. “Many have found that a strong social consciousness is good not only for society, but also for business.” (Levy & Weitz, 1998, p.116)
16
CHAPTER 3 RESEARCH METHODOLOGY
Introduction This chapter describes the research methodology by explaining the steps of methodology, the different categories of research methodology, and the components of the research. There are starting from the literature review about the research methodology, research questions, method of inquiry, the research design, survey/interview design and development, coding structures, reporting and statement of research method used. Literature Review - Research Methodology
“Research is a process for collecting, analyzing and interpreting information to answer questions. But to qualify as research, the process must have certain characteristics.” (Kumar R. 2005, p.7) The certain characteristics of research that Kumar mentioned as possible if the research are controlled, rigorous, systematic, valid and verifiable, empirical, and critical. Research is one of many different way to know and understand something which research is principally different from the other way of knowing something as Mertens stated that “Research is different from other ways of knowing, such as insight, divine inspiration, and acceptance of authoritative dictates, in that it is a process of systematic inquiry that is designed to collect, analyze, interpret and use data to understand, describe or predict” (Mertens D.M., 2005, p.2) According to the research methodology framework, the research can be classified from three perspectives. The three perspectives are including application, objectives and the inquiry process.(Kumar R. 2005, p.8) For the application of research study could be separated into two categories. There are pure research and applied research. “Pure research involves developing and testing theories and hypotheses that are intellectually challenging to the research but may or may not have practical application at the present time or in

17
the future. Thus such work often involves the testing of hypotheses containing very abstract and specialties concepts” (Bailey 1978, p.17) Kumar has explained more base on Bailey concept he said that the “pure research is also concerned with the development, examination, verification and refinement of research methods, procedures, techniques and tools that form the body of research methodology” (Kumar R., 2005, p.9) Applied research could be found in most of the research which is in the social sciences such as the research techniques, procedures and methods that form the body of research methodology are applied to the collection of information about various aspects of a situation, issue, problem or phenomenon. From here Kumar has suggest that after all processes the “information gathered can be used in other ways-such as for policy formulation, administration and the enhancement of understanding of a phenomenon. (Kumar R., 2005, p.9) The methodology could be improve if researcher have done the literature review which could help researcher to find the answer to which similar research questions as Kumar stated in Research Methodology: a step-by-step guide for beginners that “A literature review tells you if others have used procedures and methods similar to the ones that you are proposing, which procedures and methods have worked well for them, and what problems they have faced with them” (Kumar R., 2005, p.31) “If methods refer to techniques and procedures used in the process of data-gathering, the aim of methodology then is, in Kaplan’s words: The principle of informed consent arises from the subject’s right to freedom and self-determination. Being free is a condition of living in a democracy and when restrictions and limitations are placed on that freedom the must be justified and consented to, even in research proceedings” (Cohen L., 2003, p.45)

18
Research question – possible research orientations “The central question is a statement of the question being examined in its most general form.” (Creswell J.W., 2003, p.105) The questions that will be developing to use in questionnaire would be effective if the question is being use in the general term and easy to understand for both questioner and answerer. The qualitative research questions are different from the qualitative research questions as Cheswell (2003) suggested that the qualitative research should identifying specific questions or hypotheses. “Begin the research questions with the words what or how to convey an open and emerging design. “Why” suggests cause and effect, and approach consistent with quantitative research.” (Creswell J.W., 2003, p.106) In quantitative research question and hypotheses mostly use by the investigators to shape and specifically focus the purpose of the study. The quantitative questions are numeric estimates of population values based on data collected from samples” (Creswell J.W., 2003, p.111) There are two question types which these questions types could help to determine what type of information is collected. The types of questions could be separated as follow. Open-Ended Types “Open-ended questions are those that allow respondents to answer in their own words.” (Brace I., 2004, p.55) The open-ended questions are good to use when ask about the attitude or the feeling of respondent and also could be good match for recalling memory or getting comments. Closed-Ended Type “Closed-Ended questions are those with pre-designed answers with a small or large set of potential choices”. (Brace I., 2004, p.55) It is the type of question that allows respondents to choose the answer from provided choices. Ranked or Ordinal Question The question that asks respondents to indicate important level of each choices is called Ranked

19
Questions. “Ranking questions which are best to use when all the choices listed should be ranked according to a level of specification.”(Weddington H., 2000) Matrix & Rating Types “The matrix & rating questions are used when surveying the frequency of something like behavior or attitude.” (Meric, H.&J.Wagner, 2006, p.3) Methods of Inquiry
There are two approaches to inquiry; the structured approach and the unstructured approach. The structured approach to inquiry is usually classified as quantitative research and unstructured as qualitative research. “In the structured approach everything that forms the research process like objectives, design, sample, and the questions that you plan to ask of respondents is predetermined.” (Kumar R., 2005, p.12) The structured approach is more appropriate to determine the extent of problem or issue while the unstructured approach is explore in the nature. “The unstructured approach, by contrast, allows flexibility in all these aspects of the process.” (Kumar R., 2005, p.12) Research Methodology The research could be found in different form of data collection and analysis which could be found in Quantitative Strategy, Qualitative Strategy and the last one is Mixed Methods Strategy which all these three strategy have the uniqueness of each strategy. The research strategies have been changed from time to time adapting to the changing of world as Creswell had compared to the computer technology in his book that “Strategies have multiplied over the years as computer technology has pushed forward data analysis and the ability to analyze complex models, and as individuals have articulated new procedures for conducting social science research.” (Creswell J.W., 2003, p.13)

20
Research Strategies Strategies associated with the quantitative approach are the strategies involved complex experiments with many variables and treatments such as factorial designs and repeated measure designs. “They also included elaborate structural equation models that incorporated causal paths and the identification of collective strength of variables.” (Creswell J.W., 2003, p.14) In this type of research strategy it could be mainly focus on experiments and surveys which experiments is included the true examine and for surveys are included in cross-sectional and longitudinal studies by using questionnaire or structured interview for data collection to do predetermined instrument that yield statistical data. Strategies associated with the qualitative approach are the strategy is a way of “narrative researchers do” (Creswell J.W., 2003, p.14) which research is specifically focus on the ethnographies or grounded theory. In ethnographies is research that “studies an intact cultural group in a natural setting over a prolonged period of time by collecting, primarily, observational data” (Creswell J.W., 2003, p.14) Table 3.1: Research Strategies
(Ref. Creswell J.W., 2003) The research is flexible and mainly response to the reality of the research field. Another type in qualitative research is grounded theory, which researcher attempts to derive a general, abstract theory of a process, action or interaction grounded in the views of participants in a study. “The

21
two primary characters of this design are the constant comparison of data with emerging categories and theoretical sampling of different groups to maximize the similarities and the differences of information” (Creswell J.W., 2003, p.14) The main reason is to develop themes from data. For mixed methods are research methods that combining both quantitative and qualitative research methods and both predetermined and emerging methods. “It employs strategies of inquiry that involve collecting data either simultaneously or sequentially to best understand research problem.” (Creswell J.W., 2003, p.20) In this research method, it is involves on gathering both numeric information and text information which could lead to final database represent both quantitative and qualitative information. Quantitative Methods The quantitative methods could be named as numeric methods of survey. “A survey design provides a quantitative or numeric description of trends, attitudes, or opinions of a population by studying a sample of that population” (Creswell J.W., 2003, p.154) In the research, the researcher could identify a sample and generalize to population which its basic intent to test the impact of treatment on outcome while controlling all other factors that might influence the outcome. In quantitative research, the first part of method section can introduce readers to the basic purpose and rationale for survey research. “Begin the discussion by reviewing the purpose of a survey and the rationale for its selection as a design in the proposed study” (Creswell J.W., 2003, p.154) - Identify the purpose of survey research - Indicate why a survey is the preferred type of data collection procedure for the study. - Indicate whether the survey will be cross-sectional, with the date collected at one point
in time, or whether it will be longitudinal with data collected over time. - Specify the form of data collection - Discuss the procedures for selecting the sample from available lists. - Indicate the number of people in the sample and the procedures used to compute this
number.

22
“An image, perception or concept that is capable of measurement – hence capable of taking on different values is called a variable.” (Kumar R., 2005, p.55) The variable in the research could be related to the specific questions on the instrument on the research plan section. Creswell has suggested that “In a research plan, one technique is to relate the variables, the research questions, and items on the survey instrument so that a reader can easily determine how the researcher will use the questionnaire items.” (Creswell J.W., 2003, p.159) Instrumentation and materials in the quantitative research method is useful when the instruments use for observations or obtaining in both pre- or posttest stage of the procedure. The instrument is use in development of the research items, scales and reports of reliability and validity of scores. Creswell has suggested in his book that researcher should report on the materials used for the experimental treatment in the study. Qualitative Methods The qualitative research methods would be selected base on the needs of audiences and that requires the audiences’ members to be knowledgeable enough about the characteristics of the qualitative research. “Qualitative research uses multiple methods that are interactive and humanistic. The methods of data collection are growing and they increasingly involve active participation by participants and sensitivity to the participants in the study.” (Creswell J.W., 2003, p.181) Creswell suggested in his book that the qualitative research should be takes place in the natural selling such as the researcher often goes to the site like home or office of the participant to conduct the research. This way of conducting survey could help the researcher to develop a level of detail about the individual or place and to be highly involved in actual experiences of the participants. The qualitative researcher systematically reflects on researcher in the inquiry and its sensitive to their personal biography and that show how it shapes to the study. “The qualitative researcher uses complex reasoning that is multifaceted, iterative, and simultaneous.” (Creswell J.W., 2003, p.182) The way to collect the data for qualitative research could be very effective such as direct interview which the researcher conducts face-to-face interviews with participant. Creswell also

23
suggested about the telephone interview, or engages in focus group interviews with six to eight interviewees in each group. These interviews involve unconstructed and generally open-ended questions that are few in number and intended to elicit views and opinions from the participants. Mixed Methods The mixed methods research is researched which mixed between qualitative and quantitative methods research. It is some time called as distinct research “the mixed methods research is relatively new in the social and human sciences as a distinct research approach, it is useful to convey in a proposal” (Creswell J.W. 2003, p.209) It is not only useful for proposal but it is also useful in a basic definition and description of the approach of research. In the time pass by the more complicated research are developing along with the time. “Mixed methods research was more common in earlier times, when methods were less specialized and compartmentalized and the paradigm wars were less heated.” (Tashakkori A., 2003, p.242) Some proof that the mixed methods are changing with the time is “when the field of organizational behavior was beginning in the 1950s, there was less of orthodoxy in method. People observed, participated, counted, and cross-tabulated. There was ready admission that each methodology was flawed” (Staw, 1992, p.136) Sampling Design The different number of sampling could lead to different result of survey. The large number of sample would be better and could affect to reduce the number of error of statistic result. “The larger the sample, the more likely it represents the population” (Newman I. & McNeil K.A. 1998, p.49). The sampling techniques can be separated into two broad categories: non-probabilistic and probabilistic. The major differences between these two techniques are defining in later paragraph. Non-Probabilistic Sampling Technique Non-probabilistic sampling is not uses when the research is possible to take a random sample. New man stated in his book that there’s usually unavoidable case like “some weaknesses of non-probabilistic sampling can be lessened by replicating the study on subsequent samples.”

24
(Newman I. & McNeil K.A. 1998, p.49) There are three kinds of non-probabilistic sampling: incidental, quota, and purposive. The most general sampling is incidental sampling which pick any sample which is convenience for the researcher but Newman suggested that it is the least accurate available “Incidental sampling is the most frequently used sampling procedure, although the least accurate available” (Newman I. & McNeil K.A. 1998, p.50) The next sampling is quota sampling, it is required the prior information from many groups to support the research and make the research more population’s interest. “The quota sampling is chosen to reflect the percentage of population.” (Newman I. & McNeil K.A. 1998, p.50) The non-probabilistic sampling is not able to be determining if sample represents the population to which one wants to infer. But there are also advantages of non-probabilistic sampling such as less expensive and it is easier to be handled. Probabilistic Sampling Technique “Probabilistic sampling is a procedure that requires a known probability of being chosen for each participant in the population.” (Anderson D.R., 2009, p.290) There are four basic procedures for accomplishing the probabilistic sampling and each of them was named as simple random sampling: simple random sampling, systematic sampling, stratified random sampling, and cluster sampling. Simple Random Sampling “Simple random sampling is a procedure in which a sample of a population is drawn so that each person has an equal chance of being selected.” (Newman I. & McNeil K.A. 1998, p.50) Systematic sampling Systematic sampling is mentioned by Anderson (2009) that it is an alternative to simple random sampling. It is especially applicable when the list of elements in the population is a random ordering of the elements. Stratified random sampling

25
Stratified random sampling is such population belongs to one and only one factor. Anderson (2009) suggested that the basis for forming this Stratified Random Sampling such as department, location, age, industry type which is at discretion of the designer of sample. And Anderson suggested that “the value of stratified random sampling depends on how homogeneous the elements are within the strata. If strata are homogenous, the stratified random sampling procedure provides results just as precise as those of simple random sampling by using a smaller size” (Anderson D.R., 2009, p.289) Cluster sampling Cluster sampling is area sampling. “Cluster sampling generally requires a larger total sample size than either simple random sampling or stratified random sampling.” (Anderson D.R., 2009, p.289) Because of many sample observation can obtained in a relatively short time. And the large sample size is possible to be obtainable with a significantly lower the total cost. The different simple random samples provide different values for the point estimators. Population “Even if the entire current population can be surveyed, the entire population to which you want to generalize to cannot be surveyed.” (Newman I. & McNeil K.A. 1998, p.13) Newman suggested that this is true in all research, not just survey research. The population group who can be interviewed could be any one who’s possible to be future clients. And it is impossible to interview all potential clients but it is not a problem if get a sufficient number. As Anderson stated that “Sample results provide only estimates of the value of the population characteristics” (Anderson D.R. 2009, p.259) “Numerical characteristics of a population, such as the mean and standard deviation, are called parameters” “A primary purpose of statistical inference is to develop estimates and test hypotheses about population parameters using information contained in a sample” (Anderson D.R. 2009, p.258)

26
Table 3.2: The sample size for a given population
(Yamane, 1967 URL : http://www.prm.nau.edu/prm447/sample_size.htm ) Surveys/Interview design and development At the beginning stage that researcher would do is to test the questionnaire to proof if the questionnaire of researcher is reliable or not. The reliability is “addresses whether repeated measurements or assessments provide a consistent result given the same initial circumstances.” (Last, J. 2001) Therefore, in the research the term reliability would be considered reliable if it would use the same result over and over again.

27
Coding structures Quantitative research results represented in large amounts of context number and detail data and have to minimize to describe in major themes or categories. “Qualitative data analysis consists of identifying, coding, and categorizing patterns found in the data” (Bryne 2001, p.1). Foss & Waters (2003) mentioned that coding and analyzing data process is very important and critical part for quantitative research which has 4 steps as following, Step 1: Coding the data Step 2: Developing theme from the data Step 3: Developing conceptual schema from the data Step 4: Writing up the analysis Reporting The reporting will be presented the result of evaluating through text. “The questions are organized according to the sections of the research report.” (Mertens D.M., 2005, p.104) The report should contain all the answers in each parts of research in clear reporting. Table 3.3: The sections of Report Section Key Aspects
Abstracts Function of an Abstract (or Summary) Structure of an (IMRAD) Abstract
Introduction What is an Introduction? Sequence of "moves" in an Introduction
Methods Reporting What you Did, Questionnaires: Procedures & Factors Checking for Bias
Results Findings & Interpretation
[General] Discussion
Matching Claims to evidence, Making Recommendations
Conclusions Content of a conclusion, The perspective of a conclusion
(Ref. The University of Hong Kong, 2010)

28
The structure of the report would be start with the data analysis, follows with the type of strategy chosen for the proposed study. “In a concurrent study, the quantitative and qualitative data collection may be presented in separate section, but the analysis and interpretation combines the two forms of data to seek convergence among the result.” (Cheswell J.W., 2003, p.222) The design of reports was sections by the University of Hong Kong (2010) as following table.
Statement of Research Method Used In this research, the study of consumers’ believe and attitude which express the rate of brand loyalty which could have affection from the demographic, service quality, brand awareness, product selection and brand image through survey from the people around the metropolitan area of Bangkok by applied the research method as following.
Research Methodology
In this study, the researcher would use the quantitative approach by using the survey technique of collecting data from a sample group of people by using questionnaire in order to understand the opinions and attitudes of people within Bangkok area. To find out the consumer’s opinion and decision making in purchasing behavior which could represent the brand loyalty of customers of the convenience stores. Research question The questionnaire will be designed into short with conceptually clear and summarizing statements is judged to be desirable for both respondents and the researcher. The questions should be specific and understandable to the respondents. In the questions of this research will be major purpose of study the brand loyalty level of chain convenience stores in Bangkok by focusing to study 7-Eleven stores and find out what are the main factors that build brand loyalty of consumer at 7-Eleven convenience. Therefore, the questions will be using question’s word of what, where,

29
when, why, how, and include the questions which consist of answering the hypothetical question and solution questions which lead to the conclusion of research. Sub Questions :
- What factors that effect to the consumer’s decision making to purchase at 7- Eleven store?
- What is the relationship between group of consumer demography and purchasing decision at 7-Eleven stores?
- What are relationship between the visiting frequency and brand preference of 7-Eleven stores?
Methods of Inquiry The primary data will be collected from people around the convenience store in the area of Bangkok city by using descriptive research design and data collection method is self-administered survey by distributing the questionnaires to the respondents. Sampling Design The sampling group was planned and calculated from the number of target population whose age is older than 15 years who visit 7-Eleven during one week of observation time. The observation was taken the busiest days of the week which is Sunday. Researcher has separated time of observe into 4 periods. There is morning, afternoon, evening, night period. Researcher was randomly observed 4 times in one day and each time took 1 hour. The result of observation is in table below.

30
Table 3.4: Observation result at 7-Eleven store
Observation Time Visiting Number/hour 0:00 - 6:00 am 22 6:00 – 12:00 am 48 12:00 – 6:00 pm 47 6:00 – 12:00 pm 65 Total 182
(Ref. Observation at Iamsombat Market during 25 Apr 2010) The average visitor’s number of 7-Eleven is 45.50 people per hour. Therefore the number of 7-Eleven customers in a day is equaled to 1,092 people and average of 32,760 people in one month. Then, the sampling size of this research is calculated from the average population from the customers group by using Yamane Taro sample size table (1967) in table 3.2 by selecting the 95% confidence level with n=50,000 the sample size would be 397 respondents. So, the sample size of this survey has been recommended for 397 respondents or bigger. Researcher decided to do survey of bigger number of sample to be 400 respondents. Surveys/Interview design and development
Researcher will use simple random sampling by draw lots of 1 branch of 7-Eleven in Bangkok and random population by using accident sampling from people who purchase and using services in each branch of 7-Eleven chain convenience stores. The demography of this study will focus on 7-Eleven customers whose ages older than 15 years old because this group would have power on purchasing and decision making and importantly who could freedom explain the viewpoint. The interview time will be made on both weekday and weekend two periods of times in morning

31
and evening on weekend and at evening on weekday. To analyze the data
a. Descriptive Statistics ; to study the characteristics of data such as gender, age, status, education, income, purchasing frequency, percentage, mean and standard deviation
b. Analytical Statistics ; to compare the satisfaction of customers separated by age, status, education, income, and the characteristics of purchasing by using techniques of One-Way Analysis of variance.
In the questionnaire part three is the part that ask about the consumer attitude and the opinion toward the chain convenience store. The question number 16 – 25 asks the 31 respondents on factors that could effect to decision making of respondents. Researcher used SPSS Statistics 17.0 version to calculate the reliability rate. Table 3.5 Result of reliability statistics
N %
Cases Valid 31 100.0
Excludeda 0 .0
Total 31 100.0
(Ref. Reliability statistics from calculating by SPSS software) Table 3.6: Result of reliability statistics2
Reliability Statistics
Cronbach's Alpha N of Items
.873 10
(Ref. Reliability statistics from calculating by SPSS software )

32
Table 3.7: Result of Reliability statistics separated by question
Item-Total Statistics
Scale Mean if Item Deleted
Scale Variance if Item Deleted
Corrected Item-Total Correlation
Cronbach's Alpha if Item Deleted
Q.19 17.32 27.159 .267 .883
Q.20 17.00 23.467 .710 .852
Q.21 16.97 23.499 .645 .857
Q.22 17.00 23.333 .647 .857
Q.23 17.35 23.970 .688 .854
Q.24 17.32 27.159 .267 .883
Q.25 17.00 23.467 .710 .852
Q.26 17.35 23.970 .688 .854
Q.27 16.97 23.499 .645 .857
Q.28 17.00 23.333 .647 .857
(Ref. Reliability statistics from calculating by SPSS software ) From the figure 3.3 to 3.5 shows that the number of Cronbach’s Alpha is equal to 0.873 which greater than 0.70 and considered as acceptable reliability.

33
Coding Structure In this research, the coding structure would be separate into four parts based on the questionnaire design. Table 3.8: Coding of questionnaire Part 1: Demographic Information
Variable Coding 1) Gender 1 = Male 2 = Female
2) Age 1 = Below 20 years 2 = 20-30 years 3 = 31-40 years 4 = 41-50 years 5 = 51-60 years 6 = Over 60 years
3) Education Level 1 = Primary School 2 = High School 3 = Bachelor degree 4 = Master degree 5 = Doctoral Degree or
4) Social Status 1 = Single 2 = Married 3 = Divorced/Dead
5) Employee Status 1 = Student 2 = Housewife/husband 3 = Company officer 4 = Government officer 5 = Businessman/owner 6 = Unemployed
6) Income (THB) 1 = Below 10,000 2 = 10,001-20,000 3 = 20,001-30,000 4 = 30,001-40,000 5 = 40,001-50,000 6 = Over 50,000
7) Transportation 1 = By Car 2 = Motor Bike 3 = Bicycle 4 = Public Transport 5 = Walk

34
Table 3.8: Coding of questionnaire (Continued) Part 2: Purchasing information of respondents
Variable Coding 8) Purchase at Convenience
Stores 1 = Yes 2 = No
9) Preferred Convenience Stores
1 = 7-Eleven 2 = Family Mart 3 = Tesco Express 4 = 108 shop 5 = Other place
10) Frequency of purchase t Convenience Stores
1 = Daily 2 = 2-3 times/week 3 = Once a week 4 = Once a month 5 = Once a year or less
11) Average Spending at Convenience Stores
1 = Less than 100 2 = 101-500 3 = 501-1,000 4 = 1,000 or more
12) Frequency of purchase at 7-Eleven
1 = 7-Eleven 2 = Family Mart 3 = Tesco Express 4 = 108 shop 5 = Other place
13) Average Spending at 7-Eleven
1 = Less than 100 2 = 101-500 3 = 501-1,000 4 = 1,000 or more
14) Product Type 1 = Snack/Candy 2 = Baverages 3 = Foods 4 = Books/CDs Entertainment 5 = Alcohol 6 = Drugs 7 = Utilities Bill 8 = Other

35
Table 3.8: Coding of questionnaire (Continued) Part 3: Information about Respondents’ attitudes and opinion toward purchasing at 7-Eleven stores.
Variable Coding 15) Prefer 7-Eleven or Other Store 1 = 7-Eleven 2 = Other 3 = Not sure
16) Is 7-Eleven Better? 1 = Better 2 = Not Better 3 = Not sure
17) Recommend 7-Eleven 1 = Sure 2 = Never 3 = Not sure
18) Ranking 7-Eleven’s Purchasing Factors from 1-7 Ranking number 1 = most Ranking number 7 = least
1 = Ranking number 1 2 = Ranking number 2 3 = Ranking number 3 4 = Ranking number 4
5 = Ranking number 5
6 = Ranking number 6 7 = Ranking number 7
Attitudes and opinions Points Strongly agree equaled 1 points Agree equaled 2 points Uncertain equaled 3 points Disagree equaled 4 points Strongly disagree equaled 5 point Conclusion In this chapter, researcher have reviewed the process of conducting marketing research and described research methodology that is used for this study. The study of “Brand loyalty of chain convenience store in Bangkok” which use quantitative approach describing the research design and collecting primary data by distributed the questionnaires to ask the respondents who are the

36
consumers from 7-Eleven in the Bangkok area with a required sample size of 397 people and researcher have decided to collect data of 400 people in order to make number simple to be remembered and calculation. The data was collected from random respondents whose visiting the 7-Eleven at that time under condition of sample population age must be older than 15 years old. The data will be analyzed and present in next chapter by using “The Statistical Package for the Social Science Program (SPSS) version 17.0”.

37
CHAPTER 4 DATA PRESENTATION
In this chapter will present the result data from the questionnaires that researcher had distributed to 400 respondents. The data was collected based on the research objective in order to answer the research questions that state in chapter 1. The results of this study of brand loyalty and the effect from consumer satisfaction on demography, communication, service quality, product selection and brand image on brand 7-Eleven store will present into three main parts as following. Data Presentation 4.1 Demographic information of respondents Table 4.1.1: Gender of respondents Table 4.1.2: Age of respondents Table 4.1.3: Education of respondents Table 4.1.4: Marriage status of respondents Table 4.1.5: Occupation of respondents Table 4.1.6: Income of respondents Table 4.1.7: Transportation of respondents 4.2 Purchasing information of respondents Table 4.2.1: Purchasing experiences of respondents Table 4.2.2: Frequency of purchasing at 7-Eleven stores Table 4.2.3: Spending amount at 7-Eleven stores Table 4.2.4: Purpose of visiting 7-Eleven stores of respondents 4.3 Information about attitude and opinion of respondents Table 4.3.1: Preference of 7-Eleven over other brands in respondents’ opinion Table 4.3.2: 7-Eleven brand value in respondents’ opinion Table 4.3.3: Respondents’ opinion about suggest 7-Eleven to others Table 4.3.4: Rank of factors that motivate respondents to purchase at 7-Eleven 4.4 Data to answer research questions Table 4.4.1: Reason of purchase at 7-Eleven separate by Gender
38
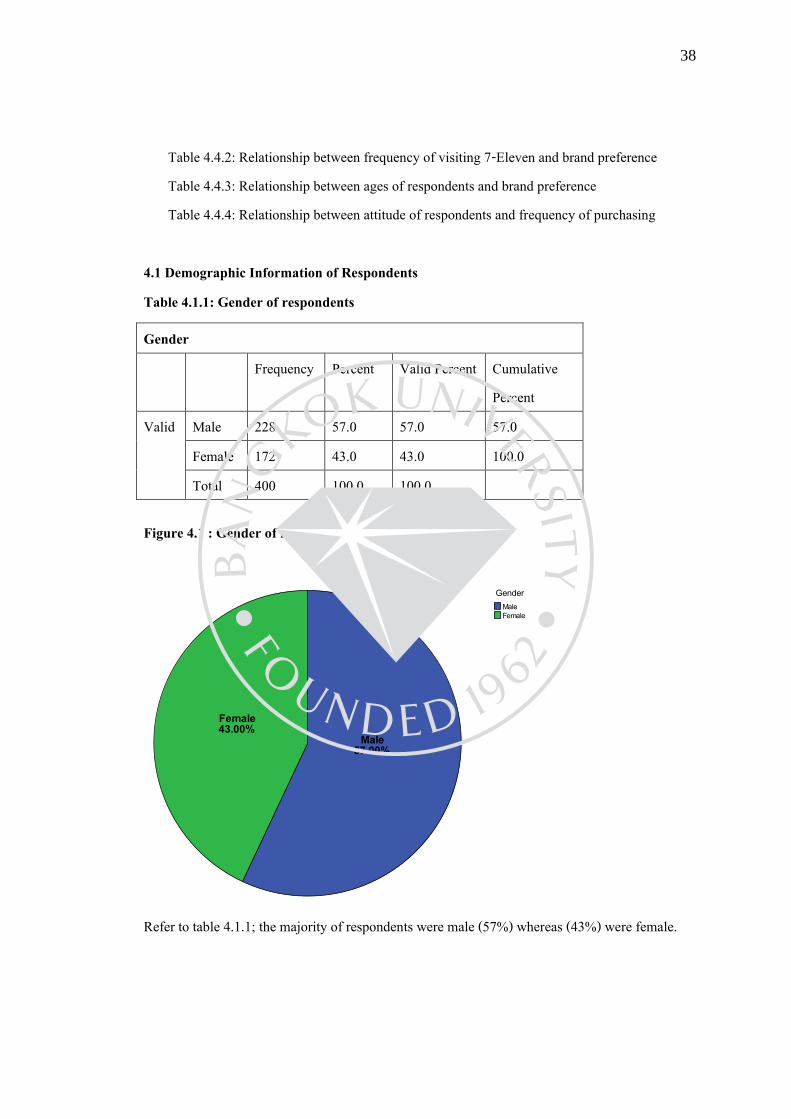
Table 4.4.2: Relationship between frequency of visiting 7-Eleven and brand preference Table 4.4.3: Relationship between ages of respondents and brand preference Table 4.4.4: Relationship between attitude of respondents and frequency of purchasing 4.1 Demographic Information of Respondents Table 4.1.1: Gender of respondents
Figure 4.1 : Gender of respondents
Refer to table 4.1.1; the majority of respondents were male (57%) whereas (43%) were female.
Gender Frequency Percent Valid Percent Cumulative
Percent Valid Male 228 57.0 57.0 57.0
Female 172 43.0 43.0 100.0 Total 400 100.0 100.0

39
Table 4.1.2: Age of respondents
Age Frequency Percent Valid Percent Cumulative
Percent Valid <20 years 39 9.75 9.75 9.75
20-30 years 82 20.50 20.50 30.25 31-40 years 159 39.75 39.75 70.0 41-50 years 69 17.25 17.25 87.25 51-60 years 31 7.75 7.75 95.00 > 60 years 20 5.00 5.00 100.0 Total 400 100.0 100.0
Figure 4.2: Age of respondents
Refer to table 4.1.2; most age of respondents are aged between 31-40 years (39.8%) from all respondents, (20.50%) were aged between 20-30 years, (17.25%) were aged between 41-50 years, (9.75%) were aged below 20 years, (7.75%) were aged between 51-60 years, and only (5.00%) of respondents were aged over 60 years.

40
Table 4.1.3: Education of respondents
Education
Frequency Percent Valid Percent
Cumulative Percent
Valid Primary School 22 5.50 5.50 5.50
High School 103 25.75 25.75 31.25
Bachelor Degree 198 49.50 49.50 80.75
Master Degree 60 15.00 15.00 95.75
Doctorate or higher 17 4.25 4.25 100.0
Total 400 100.0 100.0
Figure 4.3: Education level of respondents
Refer to table 4.1.3; Bachelors’ degree was the most education level of respondents (49.50%), (25.75%) was high school level, (15.00%) was master degree level, (5.50%) was primary school level, and only (4.25%) was doctorate or higher degree.

41
Table 4.1.4: Marriage status of respondents Status
Frequency Percent Valid Percent
Cumulative Percent
Valid Single 168 42.00 42.00 42.00
Married 215 53.75 53.75 95.75
Divorced/Separated 17 4.25 4.25 100.00
Total 400 100.0 100.0
Figure 4.4: Marriage Status of Respondents
Refer to table 4.1.4; Married status was the most group of respondents (53.75%), (42.00%) was group of single status, and only (4.25%) was group of divorced or separated status.

42
Table 4.1.5: Occupation of respondents
Occupation
Frequency Percent Valid Percent Cumulative Percent
Valid Student 40 10.00 10.00 10.0
Housewife/husband 43 10.75 10.75 20.75
Employee 142 35.50 35.50 56.25
Government Employee 80 20.00 20.00 76.25
Business owner 88 22.00 22.00 98.25
Unemployed 7 1.75 1.75 100.0
Total 400 100.0 100.0
Figure 4.5: Occupation of respondents
Refer to table 4.1.5; Most of respondents were company’s employees (35.50%), Business Owner were (22.00%), Government Employee were (20.00%), Housewife/husband were 10.75%), Students were (10.00%) and only (1.75%) were unemployed.

43
Table 4.1.6: Income of respondents
Income
Frequency Percent Valid Percent Cumulative Percent
Valid <10,000 THB 65 16.25 16.25 16.25
10,001-20,000 THB 109 27.25 27.25 43.5
20,001-30,000 THB 94 23.50 23.50 67.00
30,001-40,000 THB 56 14.00 14.00 81.00
40,001-50,000 THB 33 8.25 8.25 89.25
>50,000 THB 43 10.75 10.75 100.0
Total 400 100.0 100.0
Figure 4.6; Monthly income of respondents
Refer to table 4.1.6; the most monthly income group was between 10,001-20,000 Thai Baht (27.25%), income between 21,001-30,000 Thai Baht were (23.50%), income lower than 10,000 Thai Baht were (16.25%), income between 30,001-40,000 Thai Baht were (14.00%), income over 50,000 Thai Baht were(10.75%) , and the only (8.25%) was income between 40,000 – 50,000 Thai Baht.

44
Table 4.1.7: Mode of transportation of respondents
Transportation
Frequency Percent Valid Percent Cumulative Percent
Valid Car 130 32.50 32.50 32.50
Motorcycle 81 20.25 20.25 52.75
Bicycle 10 2.50 2.50 55.25
Public Transportation 160 40.0 40.0 95.25
Walk 19 4.75 4.75 100.0
Total 400 100.0 100.0
Figure 4.7; Respondents’ modes of transportation
Refer to table 4.1.7: the majority of respondents’ transportation was public transportation (40%), own car was (32.50%), motorcycle was (20.25%), walk was (4.50%) and only (2.50%) was transport by own bicycle.

45
4.2 Purchasing behavior information of respondents Table 4.2.1: Purchasing experiences of respondents
Where do you buy/visit most often?
Frequency Percent Valid Percent Cumulative Percent
Valid 7-Eleven 261 65.25 65.25 65.25
Family Mart 34 8.50 8.50 73.75
Tesco Express 66 16.50 16.50 90.25
108 Shop 21 5.25 5.25 95.50
Other 18 4.50 4.50 100.0
Total 400 100.0 100.0
Figure 4.8: purchasing store which respondents experienced most
Refer to table 4.2.1; the majority of respondents’ purchasing experience was at 7-Eleven Store (65.25%), (16.50%) was purchased at Tesco Express, (8.50%) was purchased at Family Mart , (5.25%) was purchased at 108 Shop, and only (4.50%) was purchased at other places.

46
Table 4.2.2: Frequency of purchasing at 7-Eleven stores
Frequency of purchasing at 7-Eleven stores
Frequency Percent Valid Percent Cumulative Percent
Valid Daily 157 39.25 39.25 39.25
2-3 times/week 96 24.00 24.00 63.25
Once a week 38 9.50 9.50 72.75
Once a month 99 24.75 24.75 97.50
Once a year or less 10 2.50 2.50 100.00
Total 400 100.0 100.0
Figure 4.9: Frequency of purchasing at 7-Eleven stores
Refer to table 4.2.2; the most frequent for purchasing at convenience stores were everyday (39.75%), (24.75%) were purchase once a month, (24.00%) were purchasing around 2-3 times a week, (9.50%) were purchased once a week and only (2.50%) were purchased at convenience stores very less within one year or once a year.

47
Table 4.2.3: Spending amount at 7-Eleven stores
Spending amount at 7-Eleven stores per time
Frequency Percent Valid Percent
Cumulative Percent
Valid <100 THB 172 43.0 43.0 43.0
101-500 THB 164 41.0 41.0 84.0
501-1,000 THB 55 13.75 13.75 97.75
>1,000 THB 9 2.25 2.25 100.0
Total 400 100.0 100.0
Figure 4.10: Spending amount at 7-Eleven store of respondents
Refer to table 4.2.3; the majority were spent around 100 Thai Baht or less per time (43.00%), (41.00%) were spent between 101-500 Thai Baht, (13.75%) were spend between 501-1,000 Thai Baht and only (2.25%) were spend more than 1,000 Thai Baht.

48
Table 4.2.4: Purpose of visiting 7-Eleven of respondents
Purpose of your visiting 7-Eleven?
Frequency Percent Valid Percent Cumulative Percent
Valid Snack / Candy 24 6.0 6.0 6.0
Drink / Beverage 99 24.75 24.75 30.75
Meals 49 12.25 12.25 43.00
Books / CDs 27 6.75 6.75 49.75
Alcohol / Cigarette 136 34.00 34.00 83.75
Drugs 26 6.50 6.50 90.25
Utilities Bills 27 6.75 6.75 97.00
Other 12 3.00 3.00 100.0
Total 400 100.0 100.0
Figure 4.11: Purpose of visiting 7-Eleven stores
Refer to table 4.2.4; the most purpose of visiting 7-Eleven store of respondents were purchased Alcohol or Cigarette (34%), (24.75%) were purposed for drinks or beverages , (12.25%) were purposed for meals , (6.75%) were purposed for pay the utilities bills which equal to purposed for books or CDs, (6.50%) were visited for purchase drugs, (6.00%) were visited for candies and snacks, and only (3.00%) were visited 7-Eleven for other purposes.

49
4.3 Information about attitude and opinion of respondents Table 4.3.1: Preference of 7-Eleven over other brands in respondents’ opinion
Preference of 7-Eleven over other brands in respondents’ opinion
Frequency Percent Valid Percent Cumulative Percent
Valid 7-Eleven 134 33.5 33.5 33.5
Other Brand 234 58.5 58.5 92.0
Not Sure 32 8.0 8.0 100.0
Total 400 100.0 100.0
Figure 4.12: Preference of 7-Eleven in respondents’ opinion
Refer to table 4.3.1; the majority of respondents preferred other brand (58.50%), (33.50%) preferred 7-Eleven brand and (8.00%) were not sure.

50
Table 4.3.2: 7-Eleven brand value in respondents’ opinion
Brand value of 7-Eleven comparing to other brand
Frequency Percent Valid Percent
Cumulative Percent
Valid Better 199 49.75 49.75 49.75
Not Sure 170 42.50 42.50 92.25
Not Better 31 7.75 7.75 100.0
Total 400 100.0 100.0
Figure 4.13: 7-Eleven values in respondents’ opinion
Refer to table 4.3.2; the majority of respondents agreed that 7-Eleven brand is better than other brand (49.75%), (42.50%) were not sure and only (7.75%) were not think that 7-Eleven is better.

51
Table 4.3.3: Respondents’ opinion about suggest 7-Eleven to others
Would you recommend others to buy @ 7-Eleven
Frequency Percent Valid Percent
Cumulative Percent
Valid Sure 66 16.5 16.5 16.5
Not Sure 286 71.5 71.5 88.0
Never 48 12.0 12.0 100.0
Total 400 100.0 100.0
Figure 4.14: Respondents’ opinion about suggest 7-Eleven to others
Refer to table 4.3.3; the most respondents were not sure about suggesting 7-Eleven to others(71.50%), (16.50%) were suggested to others, and only (12.00%) were never suggest to others.

52
Table 4.3.4: Rank of factors that motivate respondents to purchase at 7-Eleven
Rank of factors that motivate respondents to purchase at 7-Eleven
First Preferred Responses
Percent of Cases N Percent
$FirstPreferreda Location 99 24.8% 24.8%
Timing 238 59.5% 59.5%
Service 18 4.5% 4.5%
Product Selection 8 2.0% 2.0%
Price 23 5.8% 5.8%
Promotion 13 3.3% 3.3%
Brand 1 .3% .3%
Total 400 100.0% 100.0%
Second Preferred Responses
Percent of Cases N Percent
$SecondPreferreda Location 196 49.0% 49.0%
Timing 54 13.5% 13.5%
Service 73 18.3% 18.3%
Product Selection 25 6.3% 6.3%
Price 26 6.5% 6.5%
Promotion 22 5.5% 5.5%
Brand 4 1.0% 1.0%
Total 400 100.0% 100.0%

53
Table 4.3.4: Rank of factors that motivate respondents to purchase at 7-Eleven (Continued)
Third Preferred Responses
Percent of Cases N Percent
$ThirdPreferreda Location 38 9.5% 9.5%
Timing 43 10.8% 10.8%
Service 98 24.5% 24.5%
Product Selection 35 8.8% 8.8%
Price 77 19.3% 19.3%
Promotion 79 19.8% 19.8%
Brand 30 7.5% 7.5%
Total 400 100.0% 100.0%
Fourth Preferred Responses
Percent of Cases N Percent
$FourthPreferreda Location 25 6.3% 6.3%
Timing 19 4.8% 4.8%
Service 53 13.3% 13.3%
Product Selection 75 18.8% 18.8%
Price 89 22.3% 22.3%
Promotion 79 19.8% 19.8%
Brand 60 15.0% 15.0%
Total 400 100.0% 100.0%

54
Table 4.3.4: Rank of factors that motivate respondents to purchase at 7-Eleven (Continued)
Fifth Preferred Responses
Percent of Cases N Percent
$FifthPreferreda Location 23 5.8% 5.8%
Timing 22 5.5% 5.5%
Service 45 11.3% 11.3%
Product Selection 41 10.3% 10.3%
Price 90 22.5% 22.5%
Promotion 98 24.5% 24.5%
Brand 81 20.3% 20.3%
Total 400 100.0% 100.0%
Sixth Preferred Responses
Percent of Cases N Percent
$SixthPreferreda Location 13 3.3% 3.3%
Timing 8 2.0% 2.0%
Service 86 21.5% 21.5%
Product Selection 77 19.3% 19.3%
Price 66 16.5% 16.5%
Promotion 56 14.0% 14.0%
Brand 94 23.5% 23.5%
Total 400 100.0% 100.0%

55
Table 4.3.4: Rank of factors that motivate respondents to purchase at 7-Eleven (Continued)
Seventh Preferred Responses
Percent of Cases N Percent
$SeventhPreferreda Location 6 1.5% 1.5%
Timing 16 4.0% 4.0%
Service 27 6.8% 6.8%
Product Selection
139 34.8% 34.8%
Price 29 7.3% 7.3%
Promotion 53 13.3% 13.3%
Brand 130 32.5% 32.5%
Total 400 100.0% 100.0%
Factors Responses N Ranking
Timing 238 No.1 Location 196 No.2 Service 98 No.3 Price 89 No.4 Promotion 98 No.5 Brand 94 No.6 Product Selection 139 No.7
Refer to table 4.3.4; the majority voted for opening time in 7-Eleven is the top number one factor that motivate them (59.50%), the location were second preferred factor (49.00%), the service were third preferred factor (24.50%), pricing were fourth preferred factor (22.30%), promotion were ranked in fifth factor (24.50%), brand were ranked in sixed factor (23.50%) and the product selection factor were last in the rank that could motivated respondents(34.80%).

56
4.4 Data to answer research questions Table 4.4.1: Reason of purchase at 7-Eleven separate by Gender Reason of purchase at 7-Eleven separate by Gender
Count Gender
Male Female Total
Purpose of your visiting 7-Eleven?
Snack / Candy 11 13 24
Drink / Beverage 53 46 99
Meals 22 27 49
Books / CDs 13 14 27
Alcohol / Cigarette 95 41 136
Drugs 11 15 26
Utilities Bills 17 10 27
Other 6 6 12
Total 228 172 400
Refer to table 4.4.1; the most purpose of male who visit 7-Eleven store is to purchase alcohol or cigarette (95 people) and the most purpose of female who visit 7-Eleven store is to purchase drinks or beverage, the second purpose of visit 7-Eleven store for male is purchase drink & beverage but for female the second purpose is to purchase alcohol or cigarette.

57
Table 4.4.2: Relationship between frequency of visiting 7-Eleven and respondents preference Relationship between frequency of visiting 7-Eleven and respondents preference
Count Would you prefer 7-Eleven over other brand?
7-Eleven Other Brand Not Sure Total
Frequency of purchase at 7-Eleven?
Daily 62 84 11 157
2-3 times/week 27 56 13 96
Once a week 18 19 1 38
Once a month 25 68 6 99
Once a year or less 2 7 1 10
Total 134 234 32 400
Refer to table 4.4.2; the people who visit 7-Eleven store everyday prefer to purchase other brand the most (84 people from total 157 people), people who visit once a month prefer other brands more than purchase at 7-Eleven store ( 68 people from total 99 people), people who visit 2-3 times a week prefer other brand more than 7-Eleven (56 people from total 96 people), people who visit 7-Eleven store once a week prefer other brand more than 7-Eleven (19 people from total 38 people), and also people who visit 7-Eleven once a year or less prefer to purchase at other brand rather than purchase from 7-Eleven.

58
Table 4.4.3: Relationship between ages of respondents and brand preference Relationship between ages of respondents and brand preference
Count Age
<20 years
20-30 years
31-40 years
41-50 years
51-60 years
> 60 years Total
Prefer 7-Eleven over other brand?
7-Eleven 20 32 47 17 10 8 134
Other Brand
14 44 101 46 19 10 234
Not Sure 5 6 11 6 2 2 32
Total 39 82 159 69 31 20 400
Figure 4.15: relationship between ages of respondents and brand preference
Refer to table 4.4.3; the respondents group of ages 20-30 years, 31-40 years, 41-50 years, 51-60 years and older than 60 years would prefer to purchase at other brands rather than purchase at 7-Eleven stores, and only age younger than 20 years old were preferred to purchase from 7-Eleven stores more than other brand.

59
Table 4.4.4: Relationship between attitude of respondents and frequency of purchasing
Count How often do you purchase at 7-Eleven?
Daily
2-3 times/week
Once a week
Once a month
Once a year or less Total
Brand value of 7-Eleven better than other brand
Better 77 49 20 52 1 199
Not Sure
70 41 17 39 3 170
Not Better
10 6 1 8 6 31
Total 157 96 38 99 10 400
Refer to table 4.4.4; the most respondents thought 7-Eleven is better than other stores visit 7-Eleven once a week (52.63%), (52.52%) visit 7-Eleven once a month, (51.04%) visit 7-Eleven 2-3 times per week, (49.00%) visit 7-Eleven every day, and only (10.00%) of respondents who think 7-Eleven is better than other store visit once a year or less. Table 4.4.5: Relationship between different occupation and purchasing behavior
Count How much do you spend at 7-Eleven each time?
<100 THB 101-500 THB 501-1,000 THB >1,000 THB Total
Occupation Student 21 18 0 1 40
Housewife/husband 20 18 5 0 43
Employee 51 60 26 5 142
Government Employee 35 30 15 0 80
Business owner 41 35 9 3 88
Unemployed 4 3 0 0 7
Total 172 164 55 9 400
Refer to table 4.4.5; the majority was spent less than 100 THB per time. The respondents spent between 100-500 THB was the second large group following with spent 501-1,000 THB and

60
more than 1,000 THB. The respondents who worked as company employee spent 100-500 THB per time (42.00%), government employee mostly spent less than 100 THB (43%) as same as business owner spent less than 100 THB (46.59%). For housewife/husband spent less than 100 THB per time (46.51%), student group spent less than 100 THB (52.50%) and unemployed people spent less than 100 THB (57.12) the largest percent in this research question.

61
CHAPTER 5 DISCUSSION, CONCLUSION
This chapter presents the discussion, conclusions of this research study to solve the research questions for both major and sub questions about the brand loyalty in chain convenience store business by checking the relationship between respondents’ demography and the purchasing behavior and brand preferences. Research Questions The research studied to seek the answer of research questions which focus on the existence of relationship between independent variables and dependent variables. The first research question dealt with the factors that effect to consumer’s decision making. Second research question dealt with the relationship between consumer’s demography and purchasing behavior. Last question dealt with the relationship between the frequency of visiting and brand preference of 7-Eleven stores. 5.1.1 Factor that build brand loyalty of consumer Refer to result of research in table 4.4.2; the respondents who visit 7-Eleven everyday (53.50%) do not prefer to purchase from 7-Eleven store and only (34.49%) of daily visitor prefer 7-Eleven brand over other brand. In the group of 2-3 times per week there were (58.40%) who do not prefer 7-Eleven brand and only (28.15%) prefer 7-Eleven brand over the other brand. The most factor of timing or time opening of 7-Eleven was the most preferred by respondents. The second preference of respondents were the location, service, price, promotion, brand and the least prefer is product selection. Therefore the most effective factors that build brand loyalty of 7-Eleven customers were the opening time.

62
5.1.2 Factors that effect to consumer’s decision making Refer to result of research in table 4.4.4; the most respondents who think that 7-Eleven stores are better when compare to another convenience stores in Thailand purchase at 7-Eleven at least once a month. Respondents who visit 7-Eleven every once a week think that brand 7-Eleven was better than other brand. Similar to majority group of respondents who visit very 2-3 time per week and daily visiting think that brand 7-Eleven is better when compare to the other convenience store brand. There was only a group of respondents who visit 7-Eleven once a year or less thinks that 7-Eleven is not better than other brand. Therefore, the consumers who have positive attitude toward 7-Eleven brands are visit and purchase more often than consumers who think that 7-Eleven was not better. 5.1.3 Relationship between consumer’s demography and purchasing behavior Refer to the result of research in table 4.4.5; majority group spent less than 100 THB per time even though each group were in different occupation except the group of company employee which majority spent around 100-500 THB. The other occupations like group of unemployed and students had high percentage of spending less than 100 THB per time (57.12% and 52.50%). Housewife/husband and business owner have familiar percentage of purchasing amount (46.51%, 46.59%). The government employee spent less than 100 THB per time (43%). Therefore the different type of occupation and income could affect the purchasing behavior of each different group of consumers. 5.1.4 Relationship between the frequency of visiting and brand preference Refer to the result of research in table 4.4.3; the respondents who were different age have different level of 7-Eleven brand loyalty. The young age of younger sampling group whose older
63
than 15 but not over 20 years and the old age of older than 60 years have high level of brand loyalty (51.28%) and (40.00%). The respondent whose age in between 20-30 years and 51-60 years had the level of brand loyalty in third and fourth rank of group which are (39.02%) and (32.25%). The lease brand loyalty in this research found in group of respondents who were between 31-40 years and 41-50 years with percentage of (29.50%) and 24.63%) From the research result we could find the different ages of respondents had different level of brand loyalty for 7-Eleven convenience stores. Conclusion According to the result of this research study, group of people who have different demography like gender, age, occupations have a different level of brand loyalty, frequency, purchase significantly. Convenience stores’ opening time is most important factor that match to the needs of consumers in this research and that is one main reason that consumers choose to take service from this kind of convenience store as same as the location that people are much concerned about the location of the stores nearly to opening time. The convenience for consumer to travel to use service from is one strong cause that people repeat to purchase from every time. Researcher found in this study that customers from convenience store understand about the price of product which is higher than other stores but still be acceptable as long as that convenience store serve the convenience on timing, location and service. The different of genders create no different result which manager should consider about the products that could serve to both male and female. In the convenience store there are some purchasing habits such as less decision time and fast purchasing style that make no different in product selection and that product selection become the last concern from consumer in this research.

64
The opening time is the most important factor that respondents pay attention to; followed by the location, service quality, pricing, promotion, brand, and product selection. From the research result can tell that the most people give important to timing and location in this convenience store business. Brand loyalty of 7-Eleven convenience stores brand have less than 50 percent of brand preference but the sampling group put more focus on timing and location which serve the most convenience to consumers.

65
CHAPTER 6 RECOMMENDATIONS
Recommendations are present here for the business owner and merchant to see more clear vision about the target groups of convenience store business type. The business developers could be increase efficiency of the marketing strategy that should be concern and focus on. From the study result, researcher has found that the convenience stores customers do not give much important on product selections but they did important role for opening time, locations, and service. The convenience stores should have expand branches to anywhere that have community and should offer to standard product that could serve to the basic needs of that community such as in Muslim area should have more products that have beef and chicken meat more than pork. This research has focused only on opinion of consumers that is one part of this business category. There should be study more about the opinion of business owner to study and compare the attitudes of both sellers and customers. There is more different type of convenience stores existing in the market and that should be study and compare the consumers acceptant for each type of convenience stores.

66
BIBLIOGRAPHY
Books
Anderson D.R., Seeney D.J., Williams T.A. (2009). Statistics for business and economics (10th Ed.), Thomson South-Western, Ohio, United States Arnould E. & Price L. & Zinkhan G. (2002). Consumers, McGraw-Hill Companies, United States Brace I. (2004). Questionnaire Design: how to plan, structure and write survey material for effective market research, Market Research in Practice Series, London, UK.
Cohen L., Manion L. & Morrison K. (2003). Research methods in education, (5th Ed.), Routledge Falmer, New York, USA Creswell J.W. (2003). Research Design: qualitative, quantitative, and mixed method approaches (2nd Ed.), SAGE Publications Inc, California, USA. East R. (1997). Consumer Behavior; Advances and Applications in Marketing, Biddles Ltd. And King Lynn, Great Britain Hallberg G. (1995). All consumers are not created equal: the differential marketing strategy for brand loyalty and profits, John Wiley & Sons, Inc. Canada Hardy A.M., & Bryman A. (2004). Handbook of data analysis, SAGE Publications Ltd., London, UK Kumar R. (2005). Research Methodology: a step-by-step guide for beginners (2nd Ed.), SAGE Publications Ltd., London, UK Last, J. (2001). International epidemiological association. A dictionary of epidemiology (4th Ed.),

67
New York: Oxford University Press Levy M & Weitz A. B.(1998). Retailing Management (3rd Ed.), Irwin/McGraw-Hill, United States. Merten D.M. (2005). Research and Evaluation in Education and Psychology: integrating diversity with quantitative, qualitative, and mixed methods (2nd Ed.), SAGE Publication, Inc., USA. Newman I., McNeil K.A. (1998). Conducting survey research in the social sciences, University Press of America, Inc., Oxford, USA Powell R.R. (1997). Basic research methods for librarians (3rd Ed.), Ablex Publishing, USA Sekaran, U (2003). Research methods for business: a skill building approach, John Wiley and Sons Inc., California, USA Tashakkori A. & Teddlie C. (2003), Handbook of mixed methods in social & behavioral research, SAGE publications Inc., California, USA. Tashakkori A. & Teddlie C. (1998). Mixed Methodology: combining qualitative and quantitative approaches, SAGE Publications, Inc., California, USA Internet
Bangkokbiznews.com (2009). Modern Trade in Thailand, Retrieved February 10,2010, from http://www.bangkokbiznews.com/home/detail/business/business/20091117/86933.html Jieravanond T. (2003) Retailing Business Press. Retrieved February 11, 2010, from http://www.nidambe11.net/ekonomiz/2002q4/article2002dec21p3.htm

68
Meric H. & Wagner J. (2006). Rating Scale Format Choices for multi-item measures; does numbering and balance-ness matter?, Retrieved April 13, 2010 from http://www.westga.edu/~bquest/2006/rating.pdf, 15th April, 2010 Muanmat A. (2009). Strategy of 7-Eleven, Positioning Magazine, Retrieved March 30, 2010, from http://www.positioningmag.com/magazine/PrintNews.aspx?id=76587 Siam Future Development (2002). Convenience Store in Thailand, Retrieved February 11, 2010, from http://www.siamfuture.com/RetailBusCenter/RetailersCenter/ConvenStore.asp Waddington H. (2000). Types of survey questions (B.Hoffman Ed.), Encyclopedia of Educational Technology, Retrieved April 15, 2010, from http://coe.sdsu.edu/eet/Articles/surveyquest/start.htm Warehouselogistic.igetweb.com (2010). The retailing business in Thailand, Retrieved February 15, 2010, from http://warehouselogistic.igetweb.com/index.php?mo=3&art=257061

69
APPENDIX
Questionnaire (English)
The purpose of this research is to understand the main factors that has effect toward brand loyalty of the chain convenience store such 7-Eleven in Bangkok. This questionnaire is part of an independent study subject in order to complete the Degree Master of Business Administration, Bangkok University, Thailand
The questions are divided into four parts as following:
Part 1: Consumer demographics
Part 2: Consumer Behavior on Current Purchasing Pattern
Part 3: Consumer Attitude and Opinion toward the Chain Convenience Store; 7-Eleven
Part 1: Consumer demographics
1. Gender
1. Male 2. Female
2. Age
1. Below 20 Years 2. Between 23-30 Years 3. Between 31-40 Years
4. Between 41-50 Years 5. Between 51-60 Years 6. More than 61 year
3. Education Level
1. Primary School 2. High School 3. Bachelor’s Degree /equal 4. Master Degree /equal 5.Doctor’s Degree or higher
1. Social Status
1. Single 2. Married 3. Divorced

70
2. Employee Status
1. Student
2. Housewife/man
3. Company’s Employee
4. Government Enterprise
5. Business Owner
6. Unemployed
3. Monthly Income
1. Less or equal 10,000 Baht
2. 10,001-20,000 Baht
3. 20,001-30,000 Baht
4. 30,001-40,000 Baht
5. 40,001-50,000 Baht
6. More than 50,001 Baht
4. What is your type of transportation in daily live?
1. Own Vehicle; Car/Pick up
2. Own Motor Bike
3. Own Bicycle
4. Public Transportation; taxi, taxi bike, bus, BTS,MRT
5. Walk
Part 2: Purchasing Information
5. Have you experienced to purchase or visit any convenience store in Thailand?
1. Yes 2. No
6. Which convenience stores do you most often to purchase anything from?
1. 7-Eleven
2. Family Mart
3. Tesco Express
4. 108 shop
5. Other

71
7. How often you purchase anything from that convenience store?
1. Daily
2. 2-3 times/week
3. 1 time/week
4. 1 time/month
5. 1 time/year or less
8. How much estimate do you spend in each shopping time?
1. Less than 100 THB
2. 101 – 500 THB
3. 501 – 1,000 THB
4. More than 1,001 THB
9. How often you purchase anything from 7-Eleven Stores?
1. Daily
2. 2-3 times/week
3. 1 time/week
4. 1 time/month
5. 1 time/year or less
10. How much estimate do you spend in each shopping time at 7-Eleven stores?
1. Less than 100 THB
2. 101 – 500 THB
3. 501 – 1,000 THB
4. More than 1,001 THB
11. What is the most categories that you purchase from 7-Eleven
1. Buy Snack/ Candy / Gums
2. Buy drink/ Beverages
3. Buy Meals
4. Buy Books/CD
5. Buy Alcohol/ Cigarette (prohibit products)
6. Buy Drugs
7. Pay for utilities bill
8. Other

72
Part 3: Information about attitudes and opinions
12. If the location of 7-Eleven is nearby another convenience store, will you select 7-Eleven as number 1 choice or not?
1. Choose 7-Eleven 2. Not Sure 3. No, choose other
13. In your opinion, Is 7-Eleven is better than another convenience stores or not?
1. Better 2. Not Sure 3. No, not better
14. Would you suggest or tell friends/family members to be customer of 7-Eleven stores in the future?
1. Yes, sure 2. Not sure 3. Never
15. Please rank the following factors which motivate you to visit/purchase at 7-Eleven stores. (Rank 1 to 7, by 1=Most, 7=Least)
___ Location
___ Opening Times
___ Customer Service
___ Products
___ Price
___ Promotion
___ Brand

73
What factors motivate you to decide to purchase at 7-Eleven store: (Ranking 1 = Most, 5=Least)
Reason of Purchase at 7-Eleven Strongly Agree
(1)
Agree
(2)
Neutral
(3)
Disagree
(4)
Strongly Disagree
(5)
19.Convenience Location
20.Opening Time (24 hours)
21.Short cue (waiting line)
22.Various type of products
23.Product available on shelf
24.Price
25.Customer services
26.Promotion; collection/gift
27.Brand
THANK YOU

74
แบบส าหรวจความคิดเห็นของผูบ้ริโภค แบบสอบถามน้ีเป็นส่วนหน่ึงของวชิา Independent Study ของนกัศึกษาปริญญาโท มหาวทิยาลยักรุงเทพ โดยมีจุดประสงคเ์พื่อศึกษาความพึงพอใจ และความภกัดีในตราสินคา้ประเภท ร้านคา้สะดวกซ้ือ 7-Eleven เพื่อใหเ้กิดความเขา้ใจในองคป์ระกอบต่าง ๆ ทางดา้นการตลาดของผูบ้ริโภค
Part 1 : Consumer demographics 1. เพศ
1) ชาย 2) หญิง 2. อาย ุ
1. ต ่ากวา่ 20 ปี บริบูรณ์ 2. ระหวา่ง 20-30 ปี 3. ระหวา่ง 31-40 ปี 4. ระหวา่ง 41-50 ปี
5. ระหวา่ง 50-60 ปี 6. เท่ากบัหรือมากกวา่ 60 ปี
บริบูรณ์
3. การศึกษาสูงสุด 1. ประถม 2. มธัยม 3. ปริญญาตรี/เทียบเท่า
4. ปริญญาโท/เทียบเท่า 5. ปริญญาเอก หรือสูงกวา่
4. สถานะ 1. โสด 2. แต่งงาน 3. หยา่ร้าง
5. อาชีพ 1. นกัเรียน/นกัศึกษา 2. แม่บา้น/พอ่บา้น 3. พนกังานบริษทั
4. เจา้หนา้ท่ีรัฐบาล 5. เจา้ของกิจการ 6. อ่ืน ๆ โปรดระบุ ...............
6. รายได ้1. ต ่ากวา่ 10,000 บาท 2. 10,001 – 20,000 บาท 3. 20,001 – 30,000 บาท
4. 30,001 – 40,000 บาท 5. 40,001 – 50,000 บาท 6. 50,000 หรือสูงกวา่
7. ท่านใชก้ารเดินทางโดยทัว่ไป ดว้ยวธีิใด 1. รถยนต ์2. จกัรยานยนต ์3. จกัรยาน
4. รถโดยสารสาธารณะ 5. เดิน

75
Part 2: Purchasing Information 8. โดยปกติ ท่านซ้ือสินคา้จาก 7-Eleven หรือ ร้านสะดวกซ้ือใด ๆ หรือไม่
1. ใช่ 2. ไม่ใช่ 9. ร้านคา้สะดวกซ้ือใดท่ีท่านเลือกท่ีจะซ้ือบ่อยท่ีสุด
1. 7-Eleven 2. Family Mart 3. Tesco Express
4. 108 Shop 5. อ่ืน ๆ
10. ท่านซ้ือของจากร้านสะดวกซ้ือ บ่อยเท่าไร 1. ทุกวนั 2. 2-3 คร้ัง/สัปดาห์ 3. 1 คร้ัง / สัปดาห์
4. 1 คร้ัง / เดือน 5. 1 คร้ัง/ปี หรือต ่ากวา่
11. ในแต่ละคร้ังของการซ้ือสินคา้ในร้านสะดวกซ้ือ ท่านใชจ่้ายประมาณเท่าไร 1. ต ่ากวา่ 100 บาท/คร้ัง 2. 101 – 500 บาท
3. 501 – 1000 บาท 4. สูงกวา่ 1000 บาท/คร้ัง
12. ท่านซ้ือสินคา้/ใชบ้ริการท่ี 7-Eleven บ่อยเท่าไร 1. ทุกวนั 2. 2-3 คร้ัง/สัปดาห์ 3. 1 คร้ัง / สัปดาห์
4. 1 คร้ัง / เดือน 5. 1 คร้ัง/ปี หรือต ่ากวา่
13. ในแต่ละคร้ังของการซ้ือสินคา้ในท่ี 7-Eleven ท่านใชจ่้ายประมาณเท่าไร
1. ต ่ากวา่ 100 บาท/คร้ัง 2. 101 – 500 บาท
3. 501 – 1000 บาท 4. สูงกวา่ 1000 บาท/คร้ัง
14. ท่านจะเลือกซ้ือสินคา้ประเภทใด ในร้าน 7-Eleven 1. ขนมขบเค้ียว/ลูกอม 2. เคร่ืองด่ืม/น ้าอดัลม 3. อาหาร 4. หนงัสือ/แผน่ซีดี
5. เคร่ืองด่ืมแอลกอฮอล ์บุหร่ี 6. ยา 7. จ่ายบิลค่าบริการต่าง ๆ 8. อ่ืน ๆ ..............................

76
Part 3: Information about attitudes and opinions 15. ถา้ร้าน 7-Eleven และร้านสะดวกซ้ือยีห่อ้อ่ืน ๆ อยูใ่กล ้ๆ กนั ท่านจะเลือกใชบ้ริการของ ท่ี
7-Eleven หรือไม่ 1. เลือก 7-Eleven 2. ไม่แน่ใจ 3. เลือกท่ีอ่ืน ๆ
16. ท่านคิดวา่ร้าน 7-Eleven ดีกวา่ร้านสะดวกซ้ืออ่ืน ๆ หรือไม่
1. ดีกวา่ 2. ไม่แน่ใจ 3. ไม่ดีกวา่
26. ท่านบอกหรือแนะน า เพื่อน หรือสมาชิกครอบครัว ใหซ้ื้อสินคา้ท่ี 7-Eleven บา้งหรือไม่
1. แน่นอน 2. ไม่แน่ใจ 3. ไม่แนะน า
เหตผลในการซ้ือสินคา้ท่ี 7-Eleven เห็นดว้ย อยา่งยิง่
เห็นดว้ย กลางๆ ไม่เห็นดว้ย ไม่เห็นดว้ย อยา่งยิง่
17. ท าเลสะดวก
18. เวลาเปิด 24 ชัว่โมง ตรงตามความตอ้งการ
19. คิวไม่ยาว
20. สินคา้หลากหลาย
21. สินคา้ใหเ้ลือกเยอะ
22. ราคาดี
23. บริการดี
24. โปรโมชัน่และของแถม
25. ช่ือเสียงของร้านน่าเช่ือถือ

77
27. ปัจจยัใดกระตุน้ใหท้่านซ้ือสินค/้บริการ ท่ี 7-Eleven (ใน ล าดบั 1ถึง6 ในช่องวา่ง, โดย 1 = มากท่ีสุด, 7= นอ้ยท่ีสุด)
__ ท าเล __ เวลาในการเปิด 24 ชม __ การบริการ __ สินคา้
__ ราคา __ โปรโมชัน่ __ ยีห่อ้
ท่านคิดวา่ตราสินคา้ 7-Eleven เป็นอยา่งไร (1 = เห็นดว้ยอยา่งยิง่, 5= ไม่เห็นดว้ยอยา่งยิง่)
THANK YOU