brazil annual fresh deciduous fruit report - usda gain publications/annual fresh... · annual fresh...
TRANSCRIPT
Page 1
THIS REPORT CONTAINS ASSESSMENTS OF COMMODITY AND TRADE ISSUES MADE BY
USDA STAFF AND NOT NECESSARILY STATEMENTS OF OFFICIAL U.S. GOVERNMENT
POLICY
-
Date:
GAIN Report Number:
Post:
Report Categories:
Approved By:
Prepared By:
Report Highlights:
For calendar year (CY) 2016, Post revised its apples production forecast down to 1 million metric tons
(MMT), an 18 percent drop. The decrease in apple production is a result of unfavorable weather
conditions and an ongoing decline of planted area. Apple imports increased 99 percent reaching 82,368
metric tons (MT) in CY2016. Total fresh pear imports were projected to drop 14 percent in CY 2015 to
179,306 MT when compared to the previous year. On the other hand, a 6 percent increase is estimated
in CY 2016, reaching 205,000 MT of imported fresh pears. For grapes, production is projected to
decrease significantly to 959,482 MT from the past estimate of 1.4 MMT, as a result of the weather
problems experienced in 2015.
Priscila Ming, Agricultural Specialist
Clay Hamilton, Agricultural Minister Counselor
Fresh Deciduous Fruit
Annual Fresh Deciduous Fruit Report
Brasilia
Brazil
BR 1617
10/21/2016
Public Voluntary
Page 2
General Information:
Apples
Area:
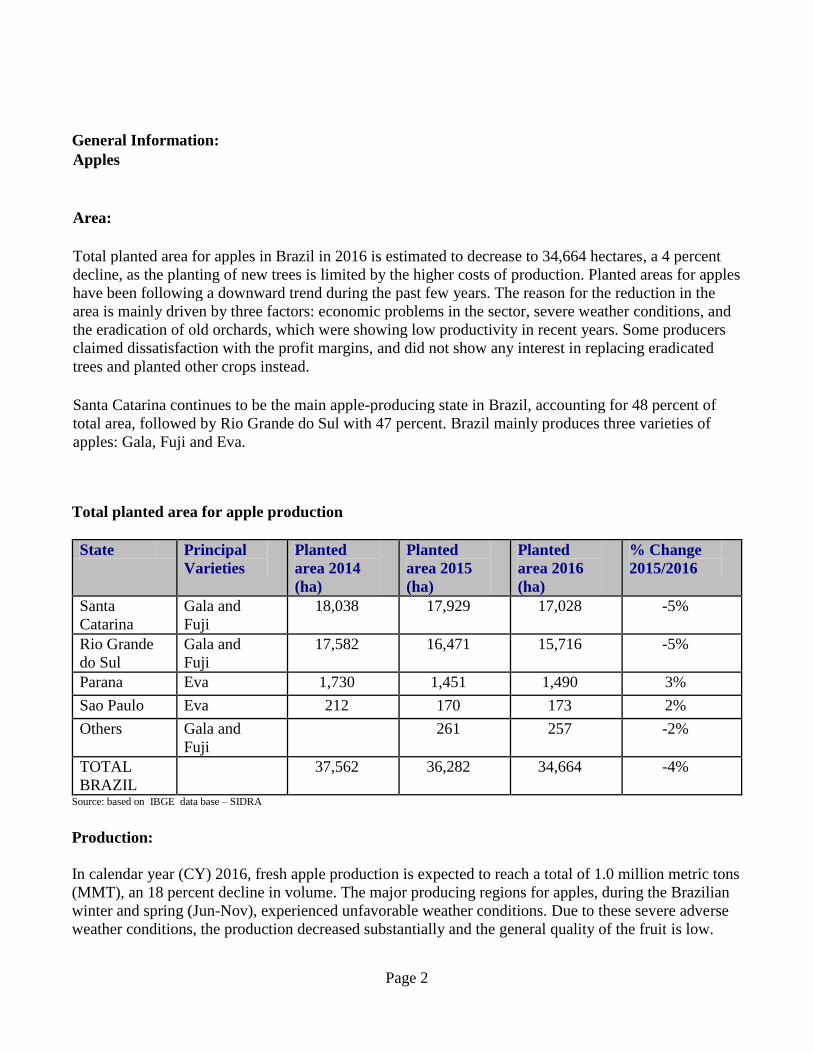
Total planted area for apples in Brazil in 2016 is estimated to decrease to 34,664 hectares, a 4 percent
decline, as the planting of new trees is limited by the higher costs of production. Planted areas for apples
have been following a downward trend during the past few years. The reason for the reduction in the
area is mainly driven by three factors: economic problems in the sector, severe weather conditions, and
the eradication of old orchards, which were showing low productivity in recent years. Some producers
claimed dissatisfaction with the profit margins, and did not show any interest in replacing eradicated
trees and planted other crops instead.
Santa Catarina continues to be the main apple-producing state in Brazil, accounting for 48 percent of
total area, followed by Rio Grande do Sul with 47 percent. Brazil mainly produces three varieties of
apples: Gala, Fuji and Eva.
Total planted area for apple production
State Principal
Varieties
Planted
area 2014
(ha)
Planted
area 2015
(ha)
Planted
area 2016
(ha)
% Change
2015/2016
Santa
Catarina
Gala and
Fuji
18,038 17,929 17,028 -5%
Rio Grande
do Sul
Gala and
Fuji
17,582 16,471 15,716 -5%
Parana Eva 1,730 1,451 1,490 3%
Sao Paulo Eva 212 170 173 2%
Others Gala and
Fuji
261 257 -2%
TOTAL
BRAZIL
37,562 36,282 34,664 -4%
Source: based on IBGE data base – SIDRA
Production:
In calendar year (CY) 2016, fresh apple production is expected to reach a total of 1.0 million metric tons
(MMT), an 18 percent decline in volume. The major producing regions for apples, during the Brazilian
winter and spring (Jun-Nov), experienced unfavorable weather conditions. Due to these severe adverse
weather conditions, the production decreased substantially and the general quality of the fruit is low.
Page 3
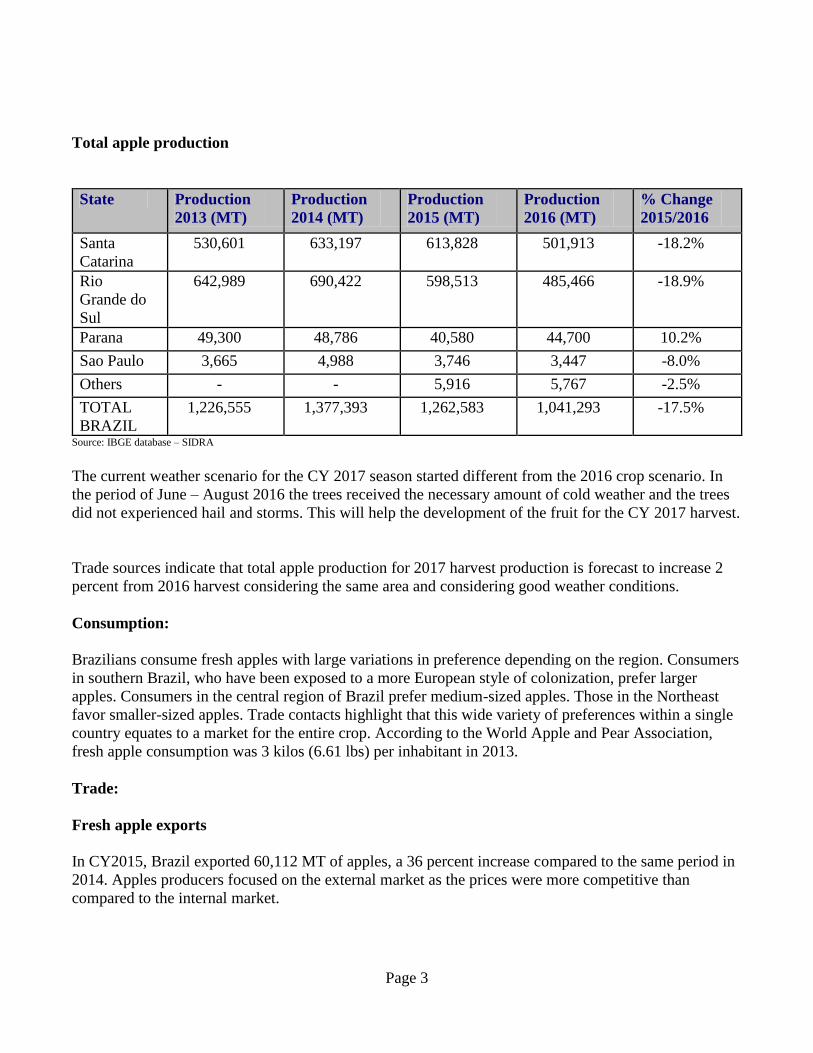
Total apple production
State Production
2013 (MT)
Production
2014 (MT)
Production
2015 (MT)
Production
2016 (MT)
% Change
2015/2016
Santa
Catarina
530,601 633,197 613,828 501,913 -18.2%
Rio
Grande do
Sul
642,989 690,422 598,513 485,466 -18.9%
Parana 49,300 48,786 40,580 44,700 10.2%
Sao Paulo 3,665 4,988 3,746 3,447 -8.0%
Others - - 5,916 5,767 -2.5%
TOTAL
BRAZIL
1,226,555 1,377,393 1,262,583 1,041,293 -17.5%
Source: IBGE database – SIDRA
The current weather scenario for the CY 2017 season started different from the 2016 crop scenario. In
the period of June – August 2016 the trees received the necessary amount of cold weather and the trees
did not experienced hail and storms. This will help the development of the fruit for the CY 2017 harvest.
Trade sources indicate that total apple production for 2017 harvest production is forecast to increase 2
percent from 2016 harvest considering the same area and considering good weather conditions.
Consumption:
Brazilians consume fresh apples with large variations in preference depending on the region. Consumers
in southern Brazil, who have been exposed to a more European style of colonization, prefer larger
apples. Consumers in the central region of Brazil prefer medium-sized apples. Those in the Northeast
favor smaller-sized apples. Trade contacts highlight that this wide variety of preferences within a single
country equates to a market for the entire crop. According to the World Apple and Pear Association,
fresh apple consumption was 3 kilos (6.61 lbs) per inhabitant in 2013.
Trade:
Fresh apple exports
In CY2015, Brazil exported 60,112 MT of apples, a 36 percent increase compared to the same period in
2014. Apples producers focused on the external market as the prices were more competitive than
compared to the internal market.
Page 4
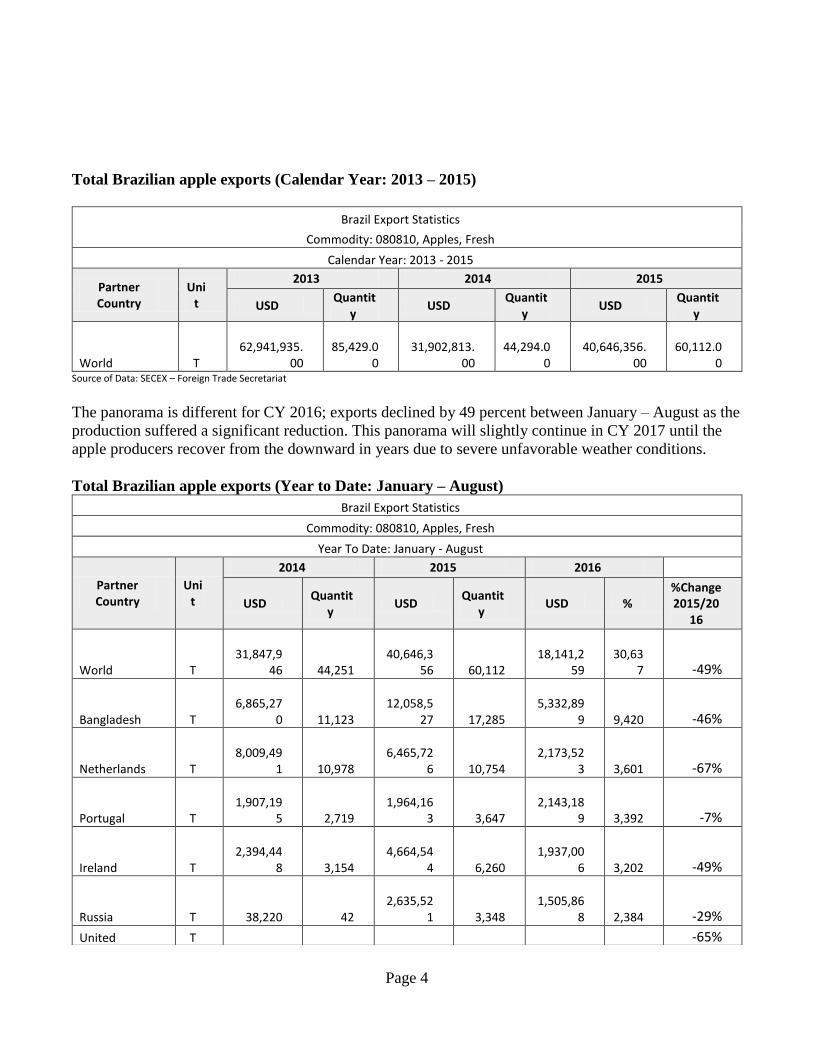
Total Brazilian apple exports (Calendar Year: 2013 – 2015)
Brazil Export Statistics
Commodity: 080810, Apples, Fresh
Calendar Year: 2013 - 2015
Partner Country
Unit
2013 2014 2015
USD Quantit
y USD
Quantity
USD Quantit
y
World T
62,941,935.
00
85,429.0
0
31,902,813.
00
44,294.0
0
40,646,356.
00
60,112.0
0 Source of Data: SECEX – Foreign Trade Secretariat
The panorama is different for CY 2016; exports declined by 49 percent between January – August as the
production suffered a significant reduction. This panorama will slightly continue in CY 2017 until the
apple producers recover from the downward in years due to severe unfavorable weather conditions.
Total Brazilian apple exports (Year to Date: January – August)
Brazil Export Statistics
Commodity: 080810, Apples, Fresh
Year To Date: January - August
Partner Country
Unit
2014 2015 2016
USD Quantit
y USD
Quantity
USD % %Change 2015/20
16
World T
31,847,9
46
44,251
40,646,3
56
60,112
18,141,2
59
30,63
7 -49%
Bangladesh T
6,865,27
0
11,123
12,058,5
27
17,285
5,332,89
9
9,420 -46%
Netherlands T
8,009,49
1
10,978
6,465,72
6
10,754
2,173,52
3
3,601 -67%
Portugal T
1,907,19
5
2,719
1,964,16
3
3,647
2,143,18
9
3,392 -7%
Ireland T
2,394,44
8
3,154
4,664,54
4
6,260
1,937,00
6
3,202 -49%
Russia T
38,220
42
2,635,52
1
3,348
1,505,86
8
2,384 -29%
United T -65%
Page 5
Kingdom 3,465,899
3,938 2,804,160
3,803 817,817 1,349
Source of Data: SECEX – Foreign Trade Secretariat
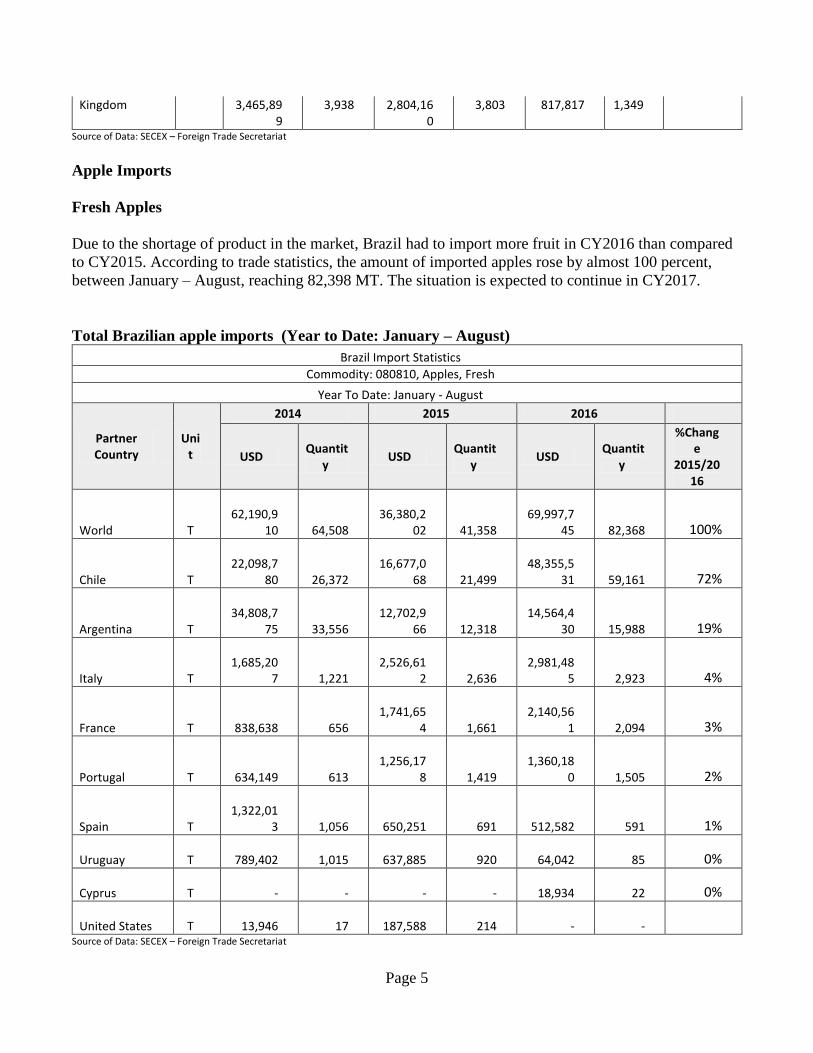
Apple Imports
Fresh Apples
Due to the shortage of product in the market, Brazil had to import more fruit in CY2016 than compared
to CY2015. According to trade statistics, the amount of imported apples rose by almost 100 percent,
between January – August, reaching 82,398 MT. The situation is expected to continue in CY2017.
Total Brazilian apple imports (Year to Date: January – August)
Brazil Import Statistics
Commodity: 080810, Apples, Fresh
Year To Date: January - August
Partner Country
Unit
2014 2015 2016
USD Quantit
y USD
Quantity
USD Quantit
y
%Change
2015/2016
World T
62,190,9
10
64,508
36,380,2
02
41,358
69,997,7
45
82,368 100%
Chile T
22,098,7
80
26,372
16,677,0
68
21,499
48,355,5
31
59,161 72%
Argentina T
34,808,7
75
33,556
12,702,9
66
12,318
14,564,4
30
15,988 19%
Italy T
1,685,20
7
1,221
2,526,61
2
2,636
2,981,48
5
2,923 4%
France T
838,638
656
1,741,65
4
1,661
2,140,56
1
2,094 3%
Portugal T
634,149
613
1,256,17
8
1,419
1,360,18
0
1,505 2%
Spain T
1,322,01
3
1,056
650,251
691
512,582
591 1%
Uruguay T
789,402
1,015
637,885
920
64,042
85 0%
Cyprus T
-
-
-
-
18,934
22 0%
United States T
13,946
17
187,588
214
-
- Source of Data: SECEX – Foreign Trade Secretariat
Page 6
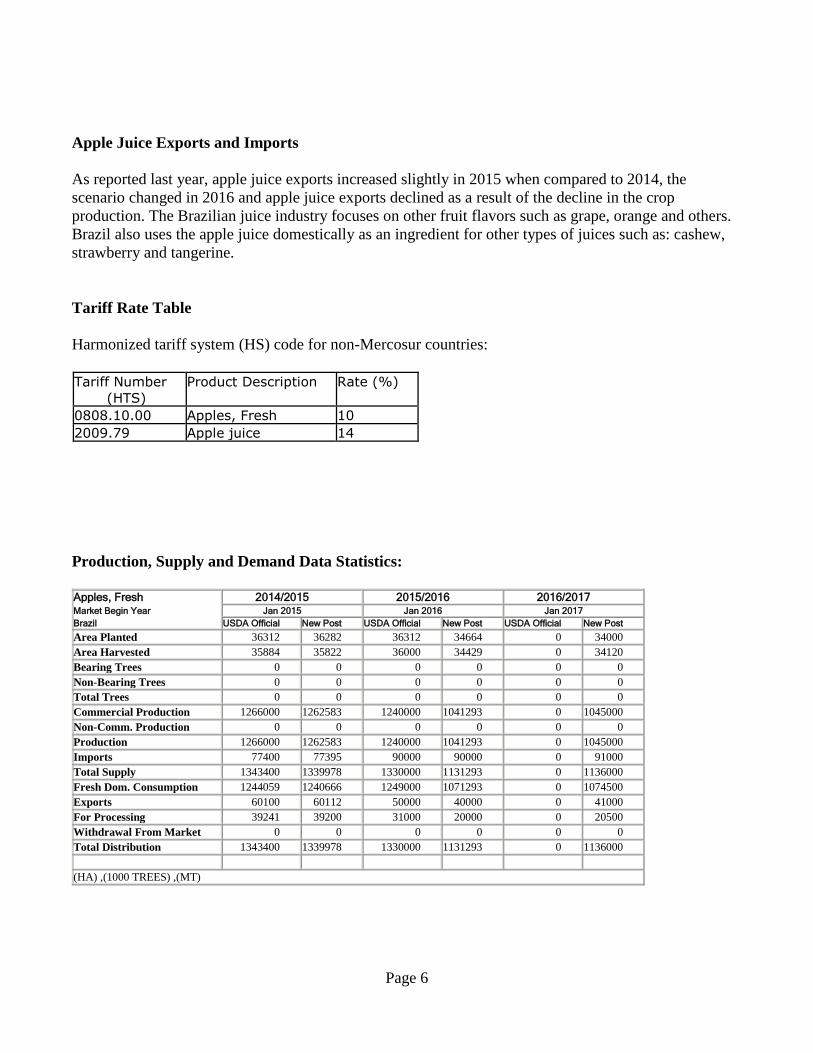
Apple Juice Exports and Imports
As reported last year, apple juice exports increased slightly in 2015 when compared to 2014, the
scenario changed in 2016 and apple juice exports declined as a result of the decline in the crop
production. The Brazilian juice industry focuses on other fruit flavors such as grape, orange and others.
Brazil also uses the apple juice domestically as an ingredient for other types of juices such as: cashew,
strawberry and tangerine.
Tariff Rate Table
Harmonized tariff system (HS) code for non-Mercosur countries:
Tariff Number (HTS)
Product Description Rate (%)
0808.10.00 Apples, Fresh 10 2009.79 Apple juice 14
Production, Supply and Demand Data Statistics:
Apples, Fresh 2014/2015 2015/2016 2016/2017 Market Begin Year Jan 2015 Jan 2016 Jan 2017
Brazil USDA Official New Post USDA Official New Post USDA Official New Post
Area Planted 36312 36282 36312 34664 0 34000
Area Harvested 35884 35822 36000 34429 0 34120
Bearing Trees 0 0 0 0 0 0
Non-Bearing Trees 0 0 0 0 0 0
Total Trees 0 0 0 0 0 0
Commercial Production 1266000 1262583 1240000 1041293 0 1045000
Non-Comm. Production 0 0 0 0 0 0
Production 1266000 1262583 1240000 1041293 0 1045000
Imports 77400 77395 90000 90000 0 91000
Total Supply 1343400 1339978 1330000 1131293 0 1136000
Fresh Dom. Consumption 1244059 1240666 1249000 1071293 0 1074500
Exports 60100 60112 50000 40000 0 41000
For Processing 39241 39200 31000 20000 0 20500
Withdrawal From Market 0 0 0 0 0 0
Total Distribution 1343400 1339978 1330000 1131293 0 1136000
(HA) ,(1000 TREES) ,(MT)
Page 7
Pear
Production
Pear production in Brazil decreased 21 percent to 15,000 MT; this was a result of the unfavorable
weather conditions that also apples producers experienced in CY 2015. Brazil in general has an
insignificant pear production. Thus, the majority of demand for pears is met by imports. This small
production is concentrated in the states of Rio Grande do Sul, Santa Catarina, Parana, Sao Paulo and
Minas Gerais. The fruit is sold locally, mostly in small cities and with little impact on the big wholesale
markets. The cost of pear production is expensive when compared to other tropical fruit available in
Brazil, which does not attract new growers to this market.
Trade
Imports
Total pear imports were down 14 percent in CY 2015 to 179,306 MT versus 208,346 MT for the
previous year.
Trade sources and U.S. cooperators indicates that Brazil is a maturing market for U.S. pears. As it is
maturing, the import volume will fluctuate each season due to the external factors more so than growth
in the export market from increasing consumer acceptance or familiarity of U.S. pears. The external
factors are the U.S. Dollar – Brazilian Real exchange rate, the volume and prices of competitors’ pears
Page 8
in the market (namely Argentina and Spanish pears), the FOB prices for U.S. pears, and the confidence
in the U.S. pear shippers to ship to Brazil. Another example of external factors is that U.S. pear crop
manifest was full of extremely large size pears (peaking on sizes 80’s, 90’s and 70’s) and Brazil prefers
the smaller to medium sized pears, which were being priced at a premium in the 2014 season. And
many U.S. pear shippers are still very cautious about shipping large volumes of pears to Brazil due to
past seasons’ claim issues. The pears that were shipped to Brazil were still very expensive and left the
importers and wholesalers with very small margins this season. This tempered their confidence in
buying more volumes in the 2013-14 seasons.
Nevertheless, Brazil continues to be one of the strong markets for the U.S. pears specially the Bartlett
variety which has strong acceptance in Northeast region of Brazil.
Trade sources forecast that 2016 pears imports will increase nearly 6 percent, reaching a similar volume
imported in 2013. The situation is expected to follow this trend for CY 2017. The Brazilian economy
and the depreciating exchange rate are the two biggest concerns and the final import number for CY
2016 and 2017 is strongly linked to that.
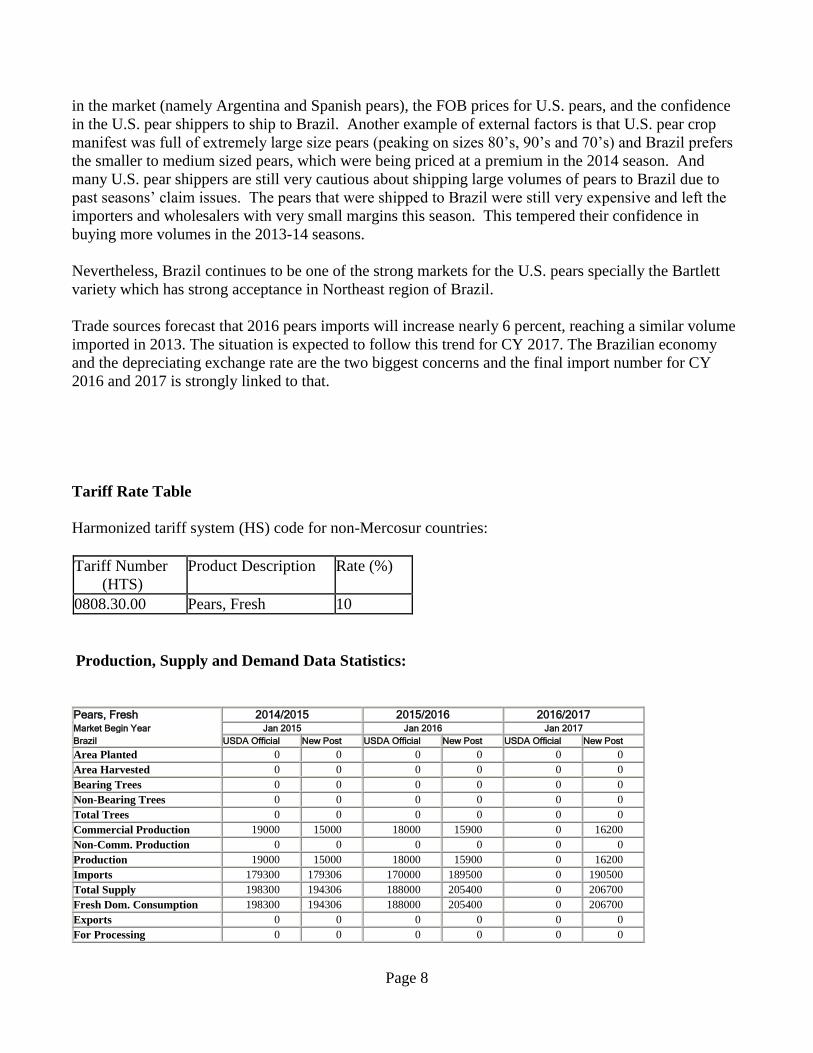
Tariff Rate Table
Harmonized tariff system (HS) code for non-Mercosur countries:
Tariff Number
(HTS)
Product Description Rate (%)
0808.30.00 Pears, Fresh 10
Production, Supply and Demand Data Statistics:
Pears, Fresh 2014/2015 2015/2016 2016/2017 Market Begin Year Jan 2015 Jan 2016 Jan 2017
Brazil USDA Official New Post USDA Official New Post USDA Official New Post
Area Planted 0 0 0 0 0 0
Area Harvested 0 0 0 0 0 0
Bearing Trees 0 0 0 0 0 0
Non-Bearing Trees 0 0 0 0 0 0
Total Trees 0 0 0 0 0 0
Commercial Production 19000 15000 18000 15900 0 16200
Non-Comm. Production 0 0 0 0 0 0
Production 19000 15000 18000 15900 0 16200
Imports 179300 179306 170000 189500 0 190500
Total Supply 198300 194306 188000 205400 0 206700
Fresh Dom. Consumption 198300 194306 188000 205400 0 206700
Exports 0 0 0 0 0 0
For Processing 0 0 0 0 0 0
Page 9
Withdrawal From Market 0 0 0 0 0 0
Total Distribution 198300 194306 188000 205400 0 206700
(HA) ,(1000 TREES) ,(MT)
Grapes
Area
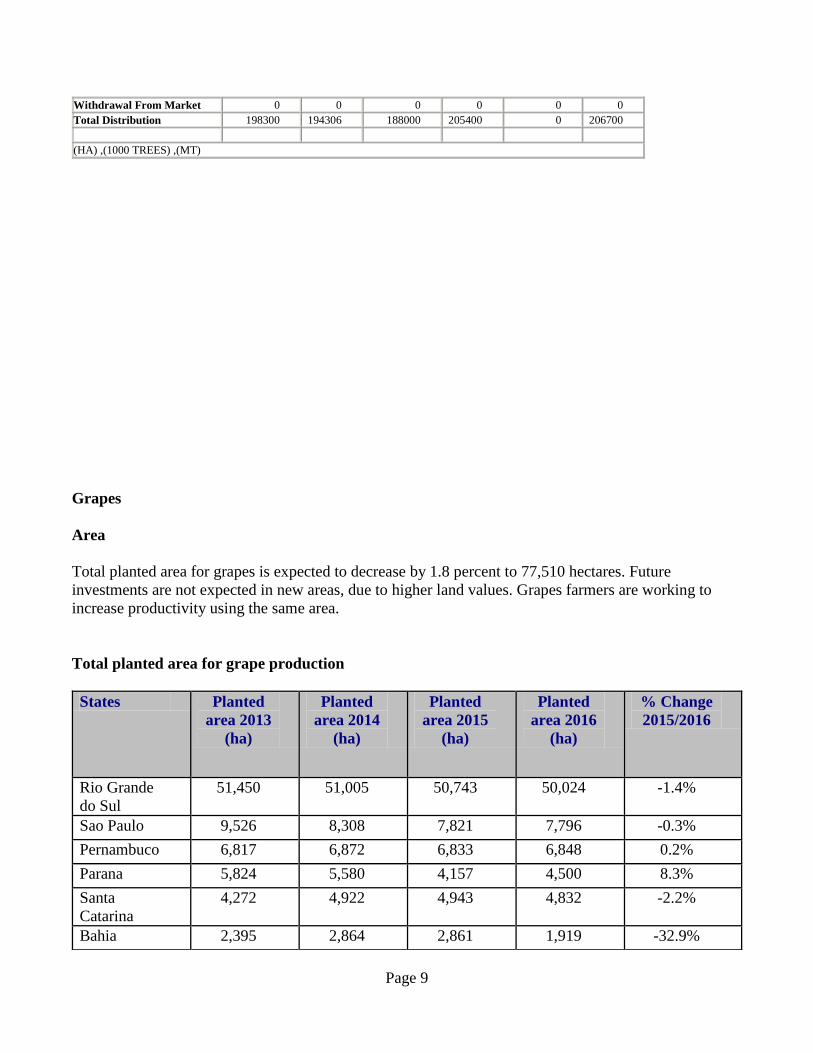
Total planted area for grapes is expected to decrease by 1.8 percent to 77,510 hectares. Future
investments are not expected in new areas, due to higher land values. Grapes farmers are working to
increase productivity using the same area.
Total planted area for grape production
States Planted
area 2013
(ha)
Planted
area 2014
(ha)
Planted
area 2015
(ha)
Planted
area 2016
(ha)
% Change
2015/2016
Rio Grande
do Sul
51,450 51,005 50,743 50,024 -1.4%
Sao Paulo 9,526 8,308 7,821 7,796 -0.3%
Pernambuco 6,817 6,872 6,833 6,848 0.2%
Parana 5,824 5,580 4,157 4,500 8.3%
Santa
Catarina
4,272 4,922 4,943 4,832 -2.2%
Bahia 2,395 2,864 2,861 1,919 -32.9%
Page 10
Others 1,154 997 1,573 1,591 1.1%
Brazil total
area
81,438 80,548 78,931 77,510 -1.8%
Source: Based on IBGE data
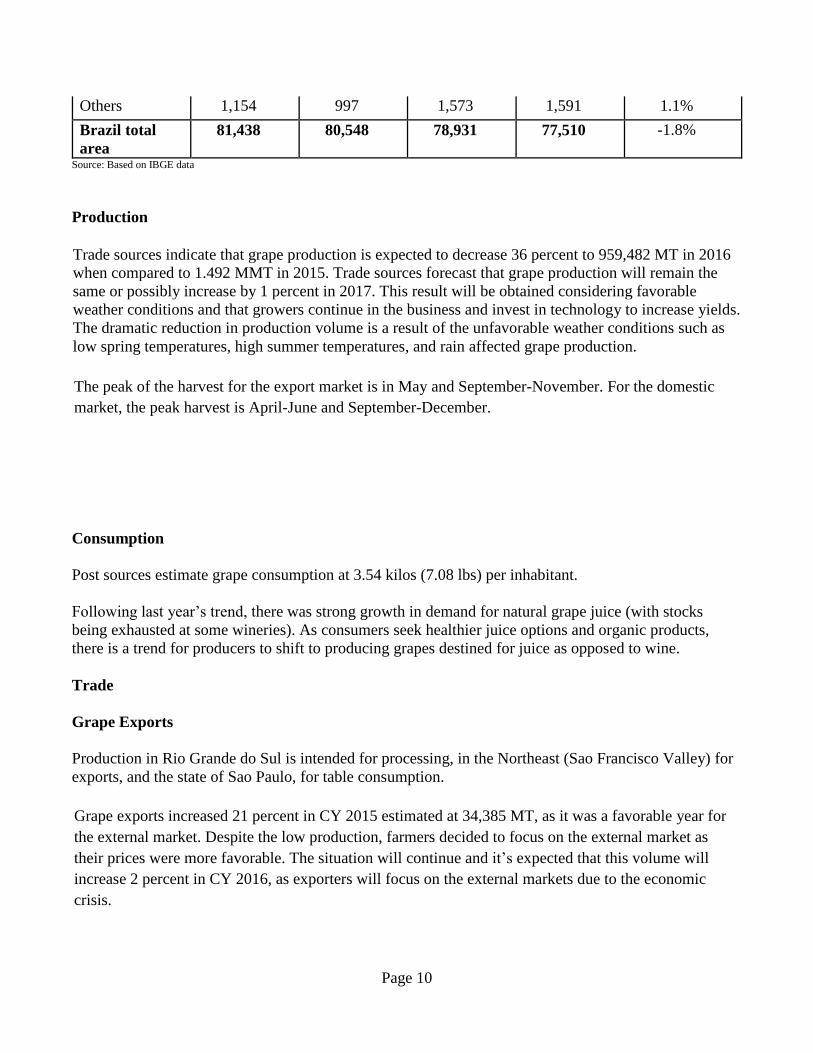
Production
Trade sources indicate that grape production is expected to decrease 36 percent to 959,482 MT in 2016
when compared to 1.492 MMT in 2015. Trade sources forecast that grape production will remain the
same or possibly increase by 1 percent in 2017. This result will be obtained considering favorable
weather conditions and that growers continue in the business and invest in technology to increase yields.
The dramatic reduction in production volume is a result of the unfavorable weather conditions such as
low spring temperatures, high summer temperatures, and rain affected grape production.
The peak of the harvest for the export market is in May and September-November. For the domestic
market, the peak harvest is April-June and September-December.
Consumption
Post sources estimate grape consumption at 3.54 kilos (7.08 lbs) per inhabitant.
Following last year’s trend, there was strong growth in demand for natural grape juice (with stocks
being exhausted at some wineries). As consumers seek healthier juice options and organic products,
there is a trend for producers to shift to producing grapes destined for juice as opposed to wine.
Trade
Grape Exports
Production in Rio Grande do Sul is intended for processing, in the Northeast (Sao Francisco Valley) for
exports, and the state of Sao Paulo, for table consumption.
Grape exports increased 21 percent in CY 2015 estimated at 34,385 MT, as it was a favorable year for
the external market. Despite the low production, farmers decided to focus on the external market as
their prices were more favorable. The situation will continue and it’s expected that this volume will
increase 2 percent in CY 2016, as exporters will focus on the external markets due to the economic
crisis.
Page 11
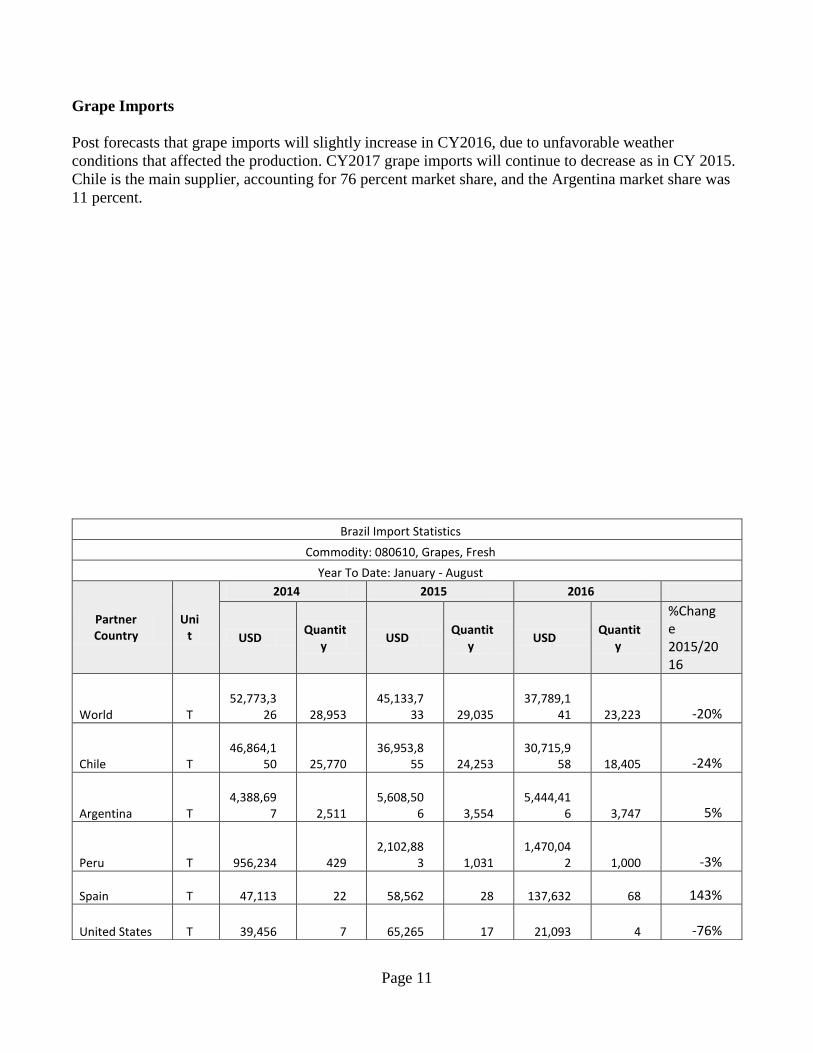
Grape Imports
Post forecasts that grape imports will slightly increase in CY2016, due to unfavorable weather
conditions that affected the production. CY2017 grape imports will continue to decrease as in CY 2015.
Chile is the main supplier, accounting for 76 percent market share, and the Argentina market share was
11 percent.
Brazil Import Statistics
Commodity: 080610, Grapes, Fresh
Year To Date: January - August
Partner Country
Unit
2014 2015 2016
USD Quantit
y USD
Quantity
USD Quantit
y
%Change 2015/2016
World T
52,773,3
26
28,953
45,133,7
33
29,035
37,789,1
41
23,223 -20%
Chile T
46,864,1
50
25,770
36,953,8
55
24,253
30,715,9
58
18,405 -24%
Argentina T
4,388,69
7
2,511
5,608,50
6
3,554
5,444,41
6
3,747 5%
Peru T
956,234
429
2,102,88
3
1,031
1,470,04
2
1,000 -3%
Spain T
47,113
22
58,562
28
137,632
68 143%
United States T
39,456
7
65,265
17
21,093
4 -76%
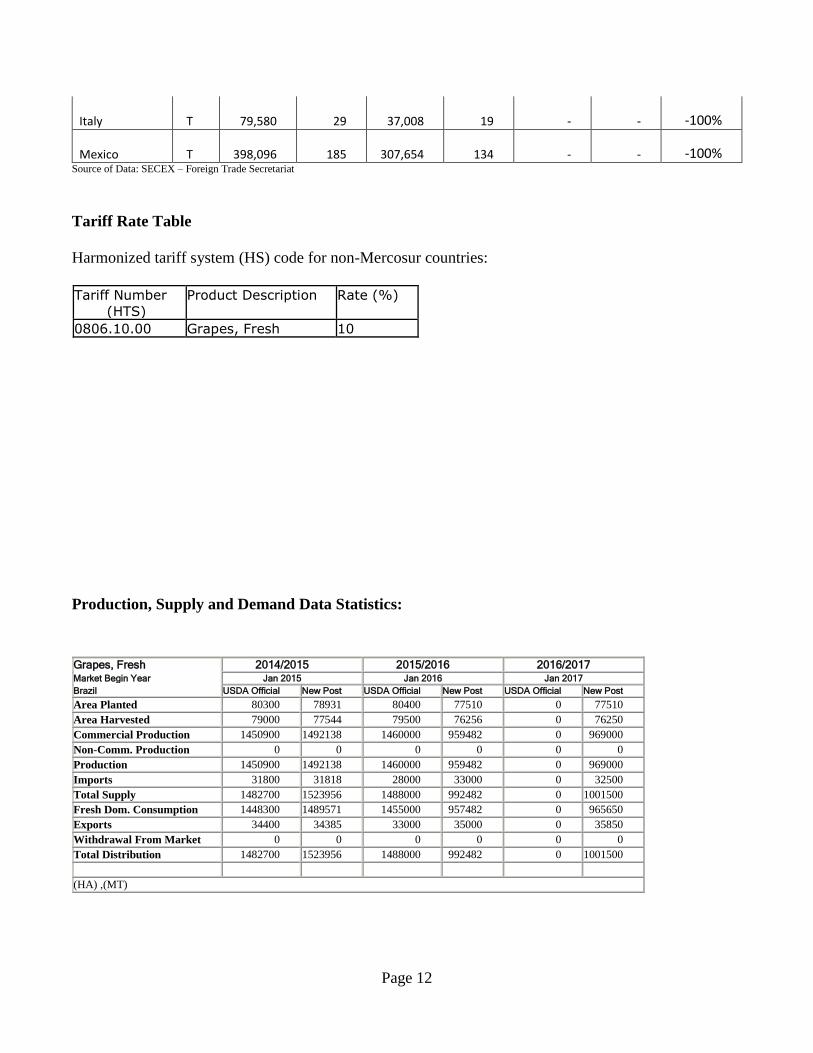
Page 12
Italy T
79,580
29
37,008
19
-
- -100%
Mexico T
398,096
185
307,654
134
-
- -100% Source of Data: SECEX – Foreign Trade Secretariat
Tariff Rate Table
Harmonized tariff system (HS) code for non-Mercosur countries:
Tariff Number (HTS)
Product Description Rate (%)
0806.10.00 Grapes, Fresh 10
Production, Supply and Demand Data Statistics:
Grapes, Fresh 2014/2015 2015/2016 2016/2017 Market Begin Year Jan 2015 Jan 2016 Jan 2017
Brazil USDA Official New Post USDA Official New Post USDA Official New Post
Area Planted 80300 78931 80400 77510 0 77510
Area Harvested 79000 77544 79500 76256 0 76250
Commercial Production 1450900 1492138 1460000 959482 0 969000
Non-Comm. Production 0 0 0 0 0 0
Production 1450900 1492138 1460000 959482 0 969000
Imports 31800 31818 28000 33000 0 32500
Total Supply 1482700 1523956 1488000 992482 0 1001500
Fresh Dom. Consumption 1448300 1489571 1455000 957482 0 965650
Exports 34400 34385 33000 35000 0 35850
Withdrawal From Market 0 0 0 0 0 0
Total Distribution 1482700 1523956 1488000 992482 0 1001500
(HA) ,(MT)

Page 13