brazil aviation market analysis
DESCRIPTION
Brazil Aviation Market AnalysisTRANSCRIPT


a UBM Aviation brand
First Published: May 2012

1
1. INTRODUCTION ................................................................................. 2
2. EXECUTIVE SUMMARY ....................................................................... 2
3. BRAZIL AVIATION MARKET OVERVIEW ............................................. 3
3.1 FREQUENCY ..................................................................................... 4
3.2 CAPACITY ........................................................................................ 6
3.3 MARKET SHARE WITHIN SOUTH AMERICA .................................................. 7
3.4 DOMESTIC MARKET VS INTERNATIONAL ..................................................... 8
3.5 TOP AIRPORTS ................................................................................ 10
3.6 TOP AIRLINES ................................................................................ 12
3.7 FLEET ANALYSIS .............................................................................. 15
3.8 INVESTMENTS ................................................................................. 17
3.8.1 EMBRAER ............................................................................. 17
3.8.2 AIRPORTS ............................................................................ 18
4. SUMMARY ........................................................................................ 19
© 2012 UBM Aviation Worldwide Limited. All rights reserved. A UBM plc company. 2
1. Introduction
The purpose of this analysis is to review the dynamic and changing aviation market
environment in Brazil and to demonstrate the growing opportunities for the aviation
industry.
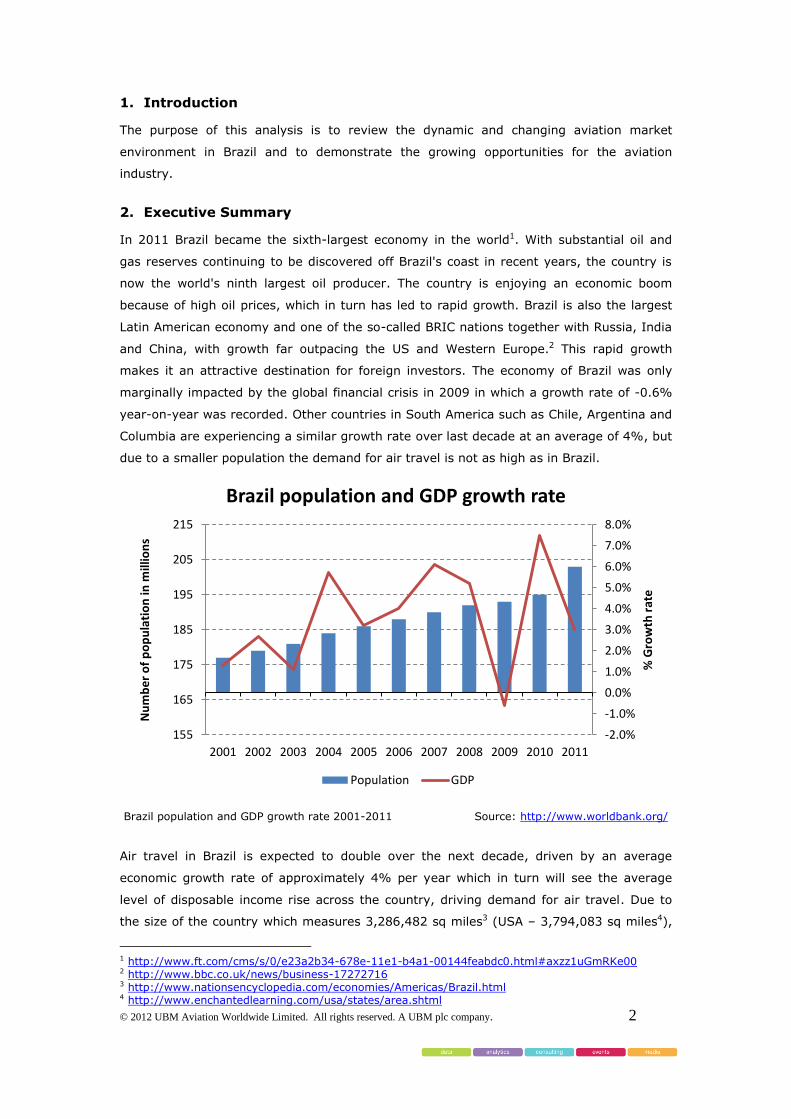
2. Executive Summary
In 2011 Brazil became the sixth-largest economy in the world1. With substantial oil and
gas reserves continuing to be discovered off Brazil's coast in recent years, the country is
now the world's ninth largest oil producer. The country is enjoying an economic boom
because of high oil prices, which in turn has led to rapid growth. Brazil is also the largest
Latin American economy and one of the so-called BRIC nations together with Russia, India
and China, with growth far outpacing the US and Western Europe.2 This rapid growth
makes it an attractive destination for foreign investors. The economy of Brazil was only
marginally impacted by the global financial crisis in 2009 in which a growth rate of -0.6%
year-on-year was recorded. Other countries in South America such as Chile, Argentina and
Columbia are experiencing a similar growth rate over last decade at an average of 4%, but
due to a smaller population the demand for air travel is not as high as in Brazil.
Brazil population and GDP growth rate 2001-2011 Source: http://www.worldbank.org/
Air travel in Brazil is expected to double over the next decade, driven by an average
economic growth rate of approximately 4% per year which in turn will see the average
level of disposable income rise across the country, driving demand for air travel. Due to
the size of the country which measures 3,286,482 sq miles3 (USA – 3,794,083 sq miles4),
1 http://www.ft.com/cms/s/0/e23a2b34-678e-11e1-b4a1-00144feabdc0.html#axzz1uGmRKe00 2 http://www.bbc.co.uk/news/business-17272716 3 http://www.nationsencyclopedia.com/economies/Americas/Brazil.html 4 http://www.enchantedlearning.com/usa/states/area.shtml
-2.0%
-1.0%
0.0%
1.0%
2.0%
3.0%
4.0%
5.0%
6.0%
7.0%
8.0%
155
165
175
185
195
205
215
2001 2002 2003 2004 2005 2006 2007 2008 2009 2010 2011
% G
row
th r
ate
Nu
mb
er
of
po
pu
lati
on
in m
illio
ns
Brazil population and GDP growth rate
Population GDP

© 2012 UBM Aviation Worldwide Limited. All rights reserved. A UBM plc company. 3
air transportation is a crucial link in Brazil’s infrastructure. The National Civil Aviation
Agency (Agência Nacional de Aviação Civil), or ANAC, is the regulatory body in the
country. The Brazilian aviation industry has experienced a significant capacity growth of
39% over last five years5 driven mainly by the introduction of low cost carriers into the
region. As the region’s economies grow, Brazil presents opportunities for international
carriers and the aviation industry as a whole.
3. Brazil aviation market overview
The Brazilian aerospace industry is dominated by Embraer and its suppliers, now the third-
largest commercial aircraft producer in the world. Added to this, the nation’s over-200
million population and vast geographic area, air travel will continue to grow6.
The aviation industry in Brazil deals with all the aspects of the sector which include design
and manufacturing of aircraft, sales, customer support and maintenance. All products
relating to aviation such as engines and equipment, on-board systems, structural parts,
airplanes, and helicopters as well as the air-traffic control systems are home-grown in
Brazil.7
International flights from Brazil 1980 Source: OAG Mapper
5 OAG Schedules iNet 6 http://www.aviationbusiness.com.au/news/the-global-airline-industry-from-turbulence-to-clear-skies 7 http://investinbrazil.biz/industry/aviation/aviation-industry

© 2012 UBM Aviation Worldwide Limited. All rights reserved. A UBM plc company. 4
International flights from Brazil 2012 Source: OAG Mapper
Since 1980 to 2012 route networks to/from Europe increased from 14 to 43 and to/from
US from 3 to 27.
3.1 Frequency
The growth in capacity in Brazil has driven the number of frequencies up at the major
airports across the country. At the same time an increase in flights from international
destinations began to place challenges on the Brazilian air traffic and infrastructure
system.
Frequency 2001-2011 Source: OAG Schedules iNet
-
200
400
600
800
1,000
1,200
Nu
mb
er
of
flig
hts
Tho
usa
nd
s
Brazil Domestic and International Scheduled Non-Stop Passenger Departure Flights Frequency Totals for Years 2001-2011

© 2012 UBM Aviation Worldwide Limited. All rights reserved. A UBM plc company. 5
In 2003, Brazilian aviation authorities, following directives of the new federal government,
started implementing new measures to manage the growth. Re-regulation defined
controlling an alleged excess capacity route and over-competition in the market but the
authorities are to impose restrictions only if carriers are in a poor financial position. New
aircraft imports were banned and price competition controls were put into practice once
again. Strategic movements increasing market concentration, such as the code-share
agreements between the two major airlines, Varig and TAM, were neither disallowed nor
discouraged. Re-regulation in 2003 made it possible for the regulator to concede increases
in capacity for a given airline only in case it will not damage its rivals.8
A steady growth in frequencies continued after 2003 at an average rate of 14% since 2005
to 2011 after the biggest Brazilian airline TAM Linhas Aereas joined Star Alliance in 2010.
Frequency YoY 2001-2011 Source: OAG Schedules iNet
Frequency year-on-year trend presents stable growth at an average rate of 5%. 2010
demonstrates the highest frequency growth over last decade at the level of 29% year-on-
year.
8 http://www.aerlines.nl/issue_33/33_Oliveira_Airline_Regulation_Brazil.pdf
-30%
-20%
-10%
0%
10%
20%
30%
40%
Pe
rce
nt
Ch
ange
Brazil Domestic and International Scheduled Non-Stop Passenger Departure Flights Percent Change Year-on-Year 2001-2011

© 2012 UBM Aviation Worldwide Limited. All rights reserved. A UBM plc company. 6
3.2 Capacity
Capacity 2001-2011 Source: OAG Schedules iNet
Capacity YoY 2001-2011 Source: OAG Schedules iNet
Since 2003 when the new aviation directives were implemented by the Brazilian
government allowing the regulator to only permit increases in capacity for an airline in the
case it will not damage its rivals, the capacity year-on-year growth rate has been growing
at an average of 10% year-on-year which has increased to an average of 14% year-on-
year since 2005. The Brazilian passenger traffic and aircraft movements continued to grow
as Brazil’s middle class was developing and increasing disposable income levels, leading to
additional airline capacity into the country9.
9 http://www.centreforaviation.com/analysis/brazils-aviation-infrastructure-scramble-34425
-
20
40
60
80
100
120
140
160
Seat
s
Mill
ion
s Brazil Domestic and International Scheduled Non-Stop Passenger
Departure Flights Seat Capacity Totals for Years 2001-2011
-20%
-15%
-10%
-5%
0%
5%
10%
15%
20%
25%
Pe
rce
nt
Ch
ange
Brazil Domestic and International Scheduled Non-Stop Passenger Departure Flights Seat Capacity Percent Change Year-on-Year 2001-
2011

7
53.0%
10.0% 11.1%
7.1%
5.0%
9.1%
1.1%
1.9%
0.7% 0.3%
0.2%
0.3%
0.1%
Market share 2001 Brazil
Colombia
Argentina
Chile
Peru
Venezuela
Ecuador
Bolivia
Uruguay
Paraguay
Guyana
French Guiana
Surinam
61.0% 11.1%
7.0%
6.1% 5.4%
3.5% 3.3% 1.5%
0.6% 0.3%
0.1%
0.1%
Market share 2011
3.3 Market Share within South America
All Scheduled Non-Stop Passenger Departure Flights Seat Capacity for South America
Percentages for Years 2001 through 2011 Source: OAG Schedules iNet
Market share 2001 vs 2011 Source: OAG Schedules iNet
Brazil increased its market share within South America 8% over last decade and the
country still dominates the region, holding 61% of the aviation market in 2011.
South America Countries
2001 2002 2003 2004 2005 2006 2007 2008 2009 2010 2011
Brazil 53.01% 55.25% 52.90% 51.98% 51.13% 51.00% 54.26% 56.17% 56.81% 58.65% 60.90%
Colombia 10.02% 10.65% 12.35% 12.01% 11.99% 12.49% 11.46% 11.03% 11.40% 11.72% 11.05%
Argentina 11.10% 9.11% 9.38% 9.92% 9.51% 8.89% 8.75% 8.43% 8.53% 7.79% 7.02%
Chile 7.12% 6.69% 7.67% 7.84% 7.32% 7.15% 6.40% 6.28% 6.08% 5.99% 6.07%
Peru 4.97% 4.73% 5.39% 5.43% 6.52% 5.78% 5.22% 5.40% 5.14% 5.05% 5.44%
Venezuela 9.15% 8.62% 6.28% 6.63% 6.98% 6.42% 6.11% 5.35% 4.84% 3.93% 3.46%
Ecuador 1.07% 1.33% 1.83% 2.13% 2.54% 4.54% 4.28% 4.13% 4.12% 3.84% 3.34%
Bolivia 1.91% 1.99% 2.45% 2.17% 2.22% 2.13% 1.97% 1.71% 1.75% 1.69% 1.47%
Uruguay 0.74% 0.71% 0.76% 0.82% 0.77% 0.65% 0.67% 0.58% 0.50% 0.57% 0.57%
Paraguay 0.34% 0.38% 0.40% 0.43% 0.47% 0.41% 0.43% 0.44% 0.37% 0.35% 0.30%
Guyana 0.19% 0.27% 0.29% 0.28% 0.26% 0.25% 0.19% 0.18% 0.16% 0.15% 0.14%
French Guiana
0.29% 0.16% 0.17% 0.18% 0.16% 0.15% 0.13% 0.13% 0.15% 0.14% 0.12%
Surinam 0.09% 0.11% 0.13% 0.17% 0.14% 0.12% 0.13% 0.14% 0.14% 0.14% 0.11%

© 2012 UBM Aviation Worldwide Limited. All rights reserved. A UBM plc company. 8
90.0%
4.8%
2.5% 2.4%
0.2% 0.1%
0.0%
0.1%
Flight movements 2001
South American(Brazil) - DomesticSouth American -Int'lEurope
United States
Central America
Africa
Middle East
Canada
88.7%
5.6%
2.4% 2.2%
0.6% 0.2%
0.2%
0.1%
Flight movements 2011
3.4 Domestic market vs international
Brazil’s commercial aviation market is primarily domestic operations (88.7% in 2011). The
major international service is split between South America, Europe, and the USA. Over the
past 5 years service is growing to the Middle East, Africa and Central America (Panama).
Brazil to/From the World Scheduled Non-Stop Passenger Flights
Domestic and Int’l Flight Totals by World Regions for Years 2001-2011 Source: OAG Schedules iNet Domestic and Int’l Scheduled Flight Totals by Regions 2001 vs 2011 Source: OAG Schedules iNet
Brazil to/From the World Scheduled Non-Stop Passenger Flights
Domestic and Int’l Seat Capacity by World Regions for Years 2000-2011 Source: OAG Schedules iNet
World Region 2001 2002 2003 2004 2005 2006 2007 2008 2009 2010 2011
South American (Brazil) - Domestic
90.0% 91.2% 88.8% 87.4% 86.1% 86.9% 86.5% 86.9% 87.8% 89.3% 88.7%
South American - Int'l 4.8% 4.0% 5.3% 6.1% 6.8% 6.2% 6.8% 6.2% 5.7% 5.1% 5.6%
Europe 2.5% 2.4% 3.1% 3.3% 3.6% 3.4% 3.4% 3.6% 2.9% 2.4% 2.4%
United States 2.4% 2.0% 2.3% 2.5% 2.7% 2.7% 2.4% 2.3% 2.5% 2.2% 2.2%
Central America 0.2% 0.2% 0.3% 0.4% 0.6% 0.5% 0.6% 0.6% 0.6% 0.5% 0.6%
Africa 0.1% 0.1% 0.1% 0.2% 0.2% 0.2% 0.2% 0.2% 0.2% 0.2% 0.2%
Middle East 0.0% 0.0% 0.0% 0.0% 0.0% 0.0% 0.0% 0.1% 0.1% 0.2% 0.2%
Canada 0.1% 0.1% 0.1% 0.1% 0.1% 0.1% 0.1% 0.1% 0.1% 0.1% 0.1%
World Region 2001 2002 2003 2004 2005 2006 2007 2008 2009 2010 2011
South American (Brazil) - Domestic
83.7% 86.5% 84.1% 82.9% 81.4% 82.5% 83.0% 82.8% 84.0% 85.3% 85.5%
South American - Int'l 6.1% 4.6% 5.9% 6.4% 7.3% 6.6% 7.0% 6.6% 6.0% 5.6% 5.5%
Europe 5.1% 4.5% 5.4% 5.9% 6.3% 6.0% 5.7% 6.1% 5.0% 4.5% 4.3%
United States 4.5% 3.7% 3.7% 3.8% 3.9% 3.9% 3.3% 3.3% 3.5% 3.2% 3.1%
Central America 0.3% 0.3% 0.4% 0.5% 0.6% 0.5% 0.5% 0.6% 0.6% 0.5% 0.6%
Africa 0.1% 0.2% 0.2% 0.3% 0.3% 0.3% 0.3% 0.4% 0.4% 0.4% 0.4%
Middle East 0.0% 0.0% 0.0% 0.0% 0.0% 0.0% 0.0% 0.2% 0.2% 0.3% 0.4%
Canada 0.2% 0.1% 0.2% 0.2% 0.2% 0.2% 0.2% 0.2% 0.2% 0.1% 0.1%
Australasia and Oceania 0.0% 0.0% 0.0% 0.0% 0.0% 0.0% 0.0% 0.0% 0.0% 0.0% 0.1%

© 2012 UBM Aviation Worldwide Limited. All rights reserved. A UBM plc company. 9
85.5%
5.5%
4.3% 3.1%
0.6% 0.4% 0.4%
0.1%
Seat capacity movements 2011
83.7%
6.1% 5.1% 4.5%
0.3% 0.1% 0.0%
0.2%
Seat capacity movements 2001
South American(Brazil) - DomesticSouth American - Int'l
Europe
United States
Central America
Africa
Middle East
Canada
Domestic and Int’l Scheduled Seat Capacity by Regions 2001 vs 2011 Source: OAG Schedules iNet

10
3.5 Top Airports
Brazil has 165 airports providing commercial flight service.10 The top 13 airports for
domestic service in Brazil accounts for 60%-73% of the overall domestic flights between
years 2001 to 2011. Seat capacity for these airports accounts for 69%-75% of the overall
domestic markets for the same period. The top 3 airports providing international service
in Brazil account for 87%-93% of the overall international flights between years 2001 to
2011 with seat capacity covering 86%-95% by the top 3 airports in the international
markets for the same period. Airports including Sao Paulo Congonhas (CGH) and Sao
Paulo International (GRU), Rio De Janeiro Dumont (SDU) and Rio De Janeiro International
(GIG), and Brasilia (BSB) rank within the top 150 airports worldwide for flight service and
passenger capacity.
Domestic Scheduled Seat Capacity by Airports 2011 Source: OAG Schedules iNet
International Scheduled Seat Capacity by Airports 2011 Source: OAG Schedules iNet
10 OAG Schedules iNet
0%
5%
10%
15%
20%
25%
30%
Percentage Domestic market share by scheduled capacity for 2011 by Airport
0%
20%
40%
60%
80%
GRU - Sao Paulo(Intl) SDU - Rio DeJaneiro(Dumont)
POA - Porto Alegre All Other Airport (28)Totals
Percentage International market share by capacity for 2011 by Airport

© 2012 UBM Aviation Worldwide Limited. All rights reserved. A UBM plc company. 11
Destinations served from GRU - Sao Paulo (Int) 2012 Source: OAG Mapper

© 2012 UBM Aviation Worldwide Limited. All rights reserved. A UBM plc company. 12
3.6 Top Airlines
Top 10 domestic carriers by capacity 2011 Source: OAG Scheduled iNet
In terms of total scheduled domestic capacity the Top10 represents 99% of all domestic
carriers in Brazil.
TAM Linhas Aereas (JJ) destinations 2012 Source: OAG Mapper
Azul Linhas Aéreas Brasileiras SA is a Brazilian domestic low-cost airline based in Barueri,
close to Sao Paulo. The carrier was established on 5th May 2008 by David Neeleman,
founder and former-CEO of JetBlue. The airline began service on 15th December 2008.11
Neeleman has raised $150 million, about a third of that from Brazilian investors, the rest
from the U.S., and has invested $10 million of his own money. Neeleman holds joint
Brazilian and U.S. citizenship, which gets him around a Brazilian law blocking foreign
citizens from owning more than 20% of an airline.12
11 http://en.wikipedia.org/wiki/Azul_Brazilian_Airlines 12 http://www.usatoday.com/travel/flights/2008-05-09-neeleman-azul-brazil_N.htm
TOP 10 Domestic carriers by capacity 2011
NUMBER PUBLISHED CARRIER CODE
PUBLISHED CARRIER Seat capacity 2011
1 JJ TAM Linhas Aereas 51,127,299
2 G3 VARIG-GOL Airlines 50,486,572
3 AD Azul Airlines 10,177,344
4 T4 TRIP Linhas Aereas 7,901,721
5 WH Webjet 7,494,428
6 O6 OceanAir 3,821,118
7 P3 Phoenix Aviation 1,619,220
8 Z4 Puma Air 529,166
9 N7 NHT Linhas Aereas 176,016
10 SBA Sol Linhas Aereas Ltda 7,560
TOTAL 133,340,444

© 2012 UBM Aviation Worldwide Limited. All rights reserved. A UBM plc company. 13
LCC Azul Linhas Airlines (AD) destinations 2009 vs 2012 Source: OAG Mapper
Top 20 International carriers Source: OAG Schedules iNet
International capacity into Brazil accounts for less than 7m seats. In comparison the top
10 domestic carriers account for 133m seats, or 95% of the total capacity into Brazil.
TOP 20 International carriers by seat capacity 2011 in Brazil
NUMBER PUBLISHED CARRIER CODE
PUBLISHED CARRIER Seat capacity 2011
1 TP TAP Air Portugal (NC) 924,432 2 AA American Airlines 825,632 3 LA Lan Airlines 621,701 4 AR Aerolineas Argentinas 500,471 5 AF Air France 405,314 6 DL Delta Air Lines 359,368 7 IB Iberia 356,762 8 CM Copa Airlines 329,536 9 PZ Transport Aereos Mercosur 273,600
10 LH Lufthansa German Airlines 232,396 11 CO Continental Airlines 212,953 12 UA United Airlines 201,009 13 BA British Airways 193,571 14 QR Qatar Airways 189,070 15 PU PLUNA 185,350 16 TA Taca Intl Airlines 163,976 17 SA South African Airways 149,792 18 AV Avianca 143,422 19 AZ Alitalia-Compagnia Aerea 134,617 20 KL KLM-Royal Dutch Airlines 131,908
TOTAL 6,534,880

© 2012 UBM Aviation Worldwide Limited. All rights reserved. A UBM plc company. 14
AA capacity into Brazil 2001-2011 Source: OAG Schedules iNet
American Airlines (AA) destinations into Brazil 2001 vs 2011 Source: OAG Mapper
-30%
-25%
-20%
-15%
-10%
-5%
0%
5%
10%
15%
20%
25%
2002 2003 2004 2005 2006 2007 2008 2009 2010 2011
American Airlines capacity into Brazil 2001-2011

15
31%
27% 6%
6%
6%
3%
3% 18%
Fleet 2011 B737
A320
ATR
A330
ERJ170
B777
CITATION
OTHERS
37%
12% 8% 7%
6%
5%
2%
2%
2% 2%
16%
Fleet 2001 B737
A320
DC10
B767
F28
A330
EMB110
CITATION
ATR
EMB120
ORTHERS
3.7 Fleet Analysis
Embraer is one of the world's largest aircraft manufacturers and is a Brazilian aerospace
conglomerate that produces commercial, military and executive aircraft along with other
aviation services. In the mid-1990s the company pursued a product line more focused on
small commercial aircraft but has expanded into military aircraft larger regional jets (with
70-110 seats) and smaller business jets. Today the company is well established in both the
military and commercial aviation market.13
Fleet 2001 vs 2011 Source: OAG Schedules iNet
34% of the Brazilian domicile carrier’s fleet are Boeing aircraft, with Airbus accounting for
33% of the fleet in 2011. Other manufacturers such as Embraer, ATR and others make up
the rest fleet percentage at 33%. Over last decade the Brazilian fleet structure has shifted
to focus on more efficient turbo-props such as ATR’s due to the increasing fuel costs as a
result of the upward trend in global oil prices.. Long haul aircraft such as the Boeing 777
have also benefited from Brazil’s growth as demand for long haul destinations has
increased.
Fleet percentage change 2001 vs 2011
Fleet percentage change Source: OAG Schedules iNet
13 http://en.wikipedia.org/wiki/Embraer

© 2012 UBM Aviation Worldwide Limited. All rights reserved. A UBM plc company. 16
Fleet orders forecast 2012-2020 Source: OAG CAMRO
The forecast fleet projections for Brazil indicate that the country will see an increasing
number of Embraer aircraft delivered over the next 8 years. On average 37% of all new
aircraft ordered by the Brazilian carriers will be ‘home-grown’ with Boeing taking the next
substantial share of the orders.. By the end of 2020, Brazil’s domicile fleet is forecast to
have 243 Embraer aircraft, 213 Boeing and 126 Airbus aircraft.14
14 OAG CAMRO
19% 19% 19% 25% 19% 19% 19% 16% 16%
36% 36% 34% 37% 33% 32% 30% 27% 27%
7% 7% 7% 5% 4% 4% 3% 3% 3%
37% 37% 37% 38% 37% 37% 37% 37% 36%
1% 1% 1% 1% 1% 1%
2012 2013 2014 2015 2016 2017 2018 2019 2020
Brazil carriers order forecast by manufacturer
AIRBUS BOEING DOUGLAS EMBRAER FOKKER

17
3.8 Investments
3.8.1 Embraer
The Brazilian airframer Embraer has become in the past five years a stakeholder in state-
controlled aerostructures, maintenance, repair and overhaul house OGMA and is building
two aerostructures plants, one for composites, the other for metals, that are due to open
by the end of 2012. Embraer will build metallic and composite structures, initially wings
and horizontal stabilisers for the new Legacy 450 and 500 business jets. Embraer's
investment amounts to almost €150 million ($195 million). Just as Embraer has invested
on the other side of the Atlantic, Portuguese aerospace and technology companies are
increasingly looking to do business in Brazil.15
Embraer investments 2001-2011 Source: http://ri.embraer.com.br*
* (Investments in Property, Plant and Equipment and Research and Development refers to gross
amounts invested in Commercial and Corporate Aviation)
Embraer SA also plans to invest $25 million in the next five years for a new maintenance
centre near Sao Paulo to serve customers from its executive-aviation unit.16
15 http://www.flightglobal.com/news/articles/in-focus-embraers-investment-set-to-transform-portugals-fledgling-aerospace-industry-366128/ 16 http://www.marketwatch.com/story/embraer-plans-25m-investment-for-services-center-2012-03-28
0
50
100
150
200
250
300
350
400
450
500
2001 2002 2003 2004 2005 2006 2007 2008 2009 2010 2011
US$
M
illio
ns
Embraer Investments in Commercial and Corporate Aviation

© 2012 UBM Aviation Worldwide Limited. All rights reserved. A UBM plc company. 18
3.8.2 Airports
Since Brazil won the right to host the 2014 football World Cup and the 2016 Olympics,
Brazil's airports are undergoing their biggest makeover in history. Infraero, the state
controlled company that runs the 67 largest airports in Brazil, declares it will invest heavily
in infrastructure in advance of the World Cup, including plans for R$2bn ($1.16bn) of
spending at Viracopos and Guarulhos airports in São Paulo alone.17 Infraero has promised
to invest in total R$7.1bn ($4bn) to modernise and expand the airport capacity of 12 host
cities. However, the government has taken some further action and privatised three of the
country's biggest airports in an auction at the beginning of February 2012, a historic step
for the industry. On sale was 51% of a public-private partnership with Infraero and the
airports included in the sale were the country's largest, São Paulo-Guarulhos, Brasília
International and Viracopos-Campinas. Winning bids exceeded all expectations and
scooped R$24.5bn ($14.2bn). Currently, about R$626.5m ($362.5m) is expected to be
invested in Brasilia in advance of the event, with construction of a new terminal to cater to
two million passengers a year, investment in Viracopos will total around R$873m
($505.2m) with a new terminal for at least 5.5 million passengers a year and Guarulhos
will swallow R$1.38bn ($798m) and will get a new terminal for accommodating seven
million passengers each year, improvements to the runways, yards, parking lots and
access roads. 18
17 http://www.ft.com/cms/s/0/e95415ca-f344-11df-a4fa-00144feab49a.html#axzz1uMtEHxqn 18 http://www.airport-technology.com/features/featurebrazil-airport-expansion-ready-for-take-off/

© 2012 UBM Aviation Worldwide Limited. All rights reserved. A UBM plc company. 19
4. Summary
The civil aviation industry is an important link in the continuing growth of Brazil and to
connect the most populous cities across the country. The dependence on this system,
along with the country’s policy to improve the industry, makes the aviation sector an
excellent area for investment.
The Brazilian aviation industry is going through a period of rapid growth, with a growth in
passenger demand for travel combined with greater domestic and international investment
into the country. Brazil has seen passenger growth jump by 39% over the past five years
with the economies expected to double over the next 10 years with the upcoming World
Cup and Olympics helping to drive growth. The rapid growth has presented a challenge to
the airports and surrounding infrastructure as they try to keep pace. But investment
continues into the country as Brazil’s economy and the rest of South America’s economy
strengthens, presenting new opportunities for growth for US and European carriers looking
for strong yielding routes.

© 2012 UBM Aviation Worldwide Limited. All rights reserved. A UBM plc company. 20
MEDIA CONTACT:
Corporate Communications
UBM Aviation Worldwide
450 Capability Green
Luton
Bedfordshire
LU1 3LU
United Kingdom
Email: [email protected]
This is an unpublished work the copyright in which vests in UBM Aviation Worldwide Limited. All rights reserved. The information contained here in is confidential and the property of UBM Aviation Worldwide Limited and is supplied without liability for errors or omission. No part may be reproduced or used except as authorised by contract or other written permission. The copyright and the foregoing restriction on reproduction and use extend to all media in which the information may be embodied.
UBM Aviation Worldwide Limited a subsidiary of UBM plc, registered in England and Wales, No. 4226716, with it’s registered office at Ludgate House, 245 Blackfriars Road, London, SE1 9UY, with it’s principle place of business at 450 Capability Green, Luton, Bedfordshire, LU1 3LU, United Kingdome