brazil energy outlook - international energy agency · brazil energy outlook ali al-saffar energy...
TRANSCRIPT

© OECD/IEA 2013
Brazil Energy Outlook
Ali Al-Saffar Energy Analyst, IEA
7 April 2014

© OECD/IEA 2013
Brazil – The energy context
Brazil has a unique starting position, underpinned by abundant and diverse resources and a fast growing economy.
Development of the deepwater resources in the coming decades moves the country into the top ranks of global energy producers
Increases not limited to the supply-side. Domestic demand increases by 80% to 2035
The success of Brazil’s energy outlook will be contingent on it maintaining high levels of investment, averaging $90 billion per year
Success will mean that Brazil simultaneously cements its position as a world leader in renewable energy and low carbon growth, while at the same becoming one of the world’s largest producers of oil.

© OECD/IEA 2013
Demographics play a central role in Brazil’s development
Changes in income distribution in Brazil
As a result of targeted programmes, real wages have risen 75% in the last 10 years, elevating 25 million people to the middle-income group
High income
Middle income
49% 49% 40% 34% 33%
40% 40% 47%
52% 55%
11% 11% 13% 14% 12%
20%
40%
60%
80%
100%
1999 2003 2006 2009 2011
Shar
e o
f p
op
ula
tio
n
Low income
© OECD/IEA 2013
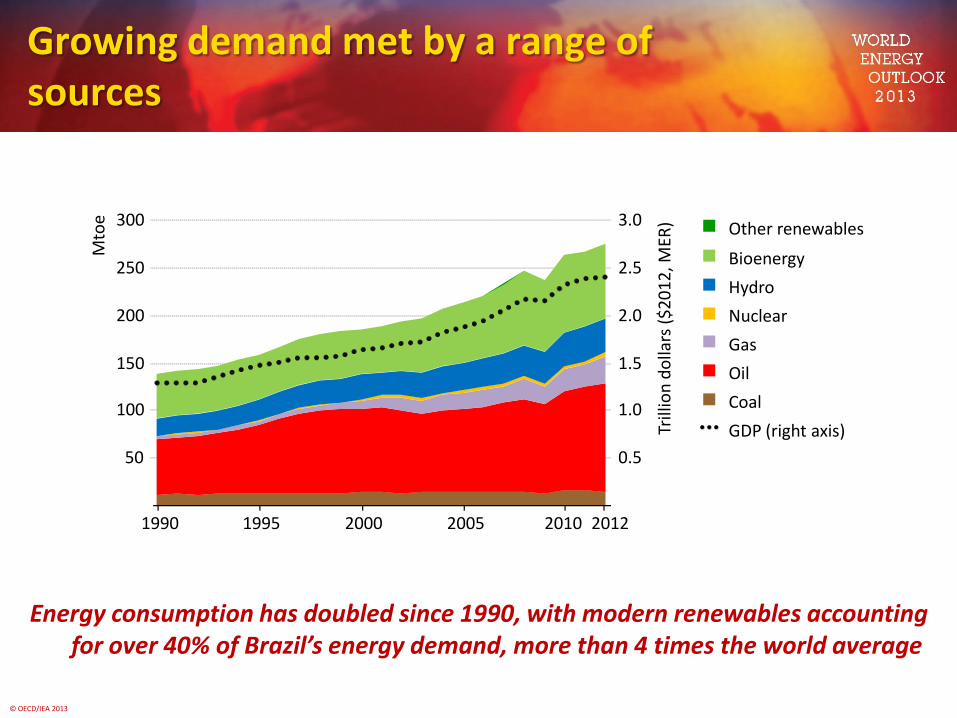
Growing demand met by a range of sources
Energy consumption has doubled since 1990, with modern renewables accounting for over 40% of Brazil’s energy demand, more than 4 times the world average
50
100
150
200
250
300
1990 1995 2000 2005 2010
0.5
1.0
1.5
2.0
2.5
3.0 Other renewables
Bioenergy
Hydro
Nuclear
Gas
Oil
Coal
GDP (right axis)
2012
Mto
e
Trill
ion
do
llars
($
20
12
, MER
)

© OECD/IEA 2013
Brazil has abundant and diverse energy resources
Primary energy mix in Brazil and the world in the New Policies Scenario
Brazil’s moves into the top ranks of global energy producers and sees it domestic demand grow by 80% between now and 2035
20%
40%
60%
80%
100%
Brazil World Brazil World
Other renewables
Bioenergy
Hydro
Nuclear
Coal
Gas
Oil
2011 2035
© OECD/IEA 2013
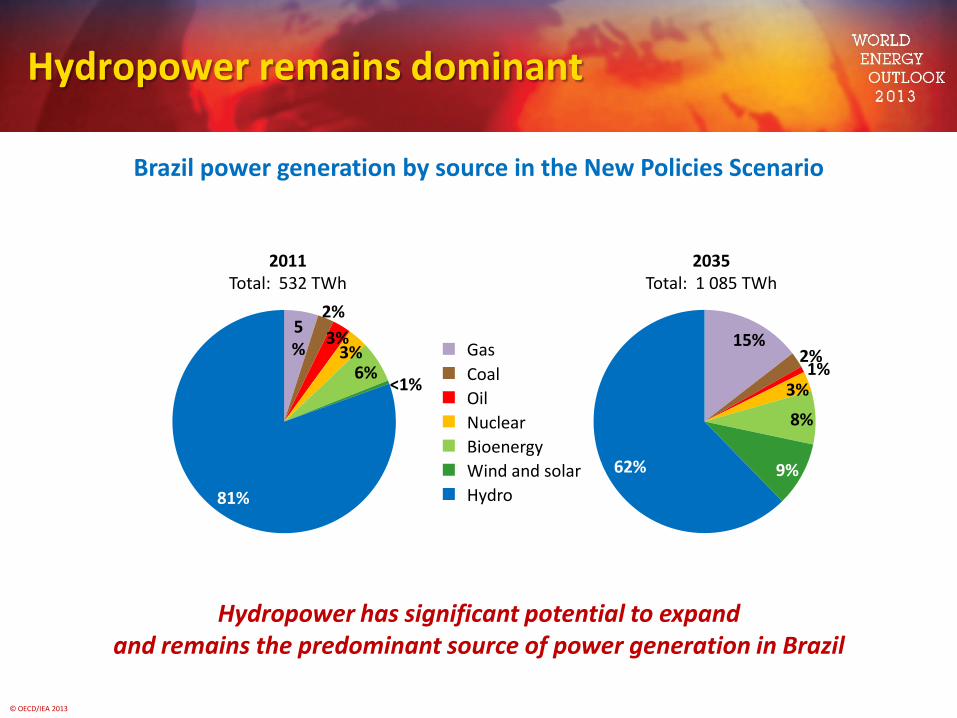
Hydropower remains dominant
Brazil power generation by source in the New Policies Scenario
Hydropower has significant potential to expand and remains the predominant source of power generation in Brazil
5%
2%
3% 3%
6%
81%
Gas
Coal
Oil
Nuclear
Bioenergy
Wind and solar
Hydro
<1%
2011 Total: 532 TWh
2035 Total: 1 085 TWh
15% 2% 1%
3%
8%
9% 62%
© OECD/IEA 2013
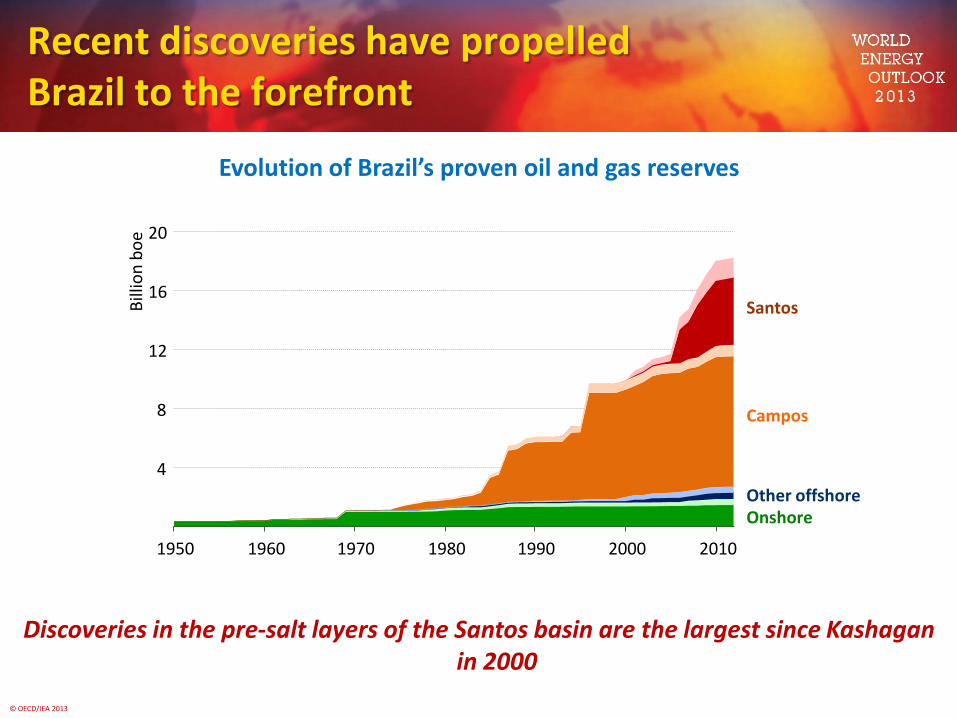
Recent discoveries have propelled Brazil to the forefront
Evolution of Brazil’s proven oil and gas reserves
Discoveries in the pre-salt layers of the Santos basin are the largest since Kashagan in 2000
4
8
12
16
20
1950 1960 1970 1980 1990 2000 2010
Bill
ion
bo
e
Onshore Other offshore
Santos
Campos
© OECD/IEA 2013
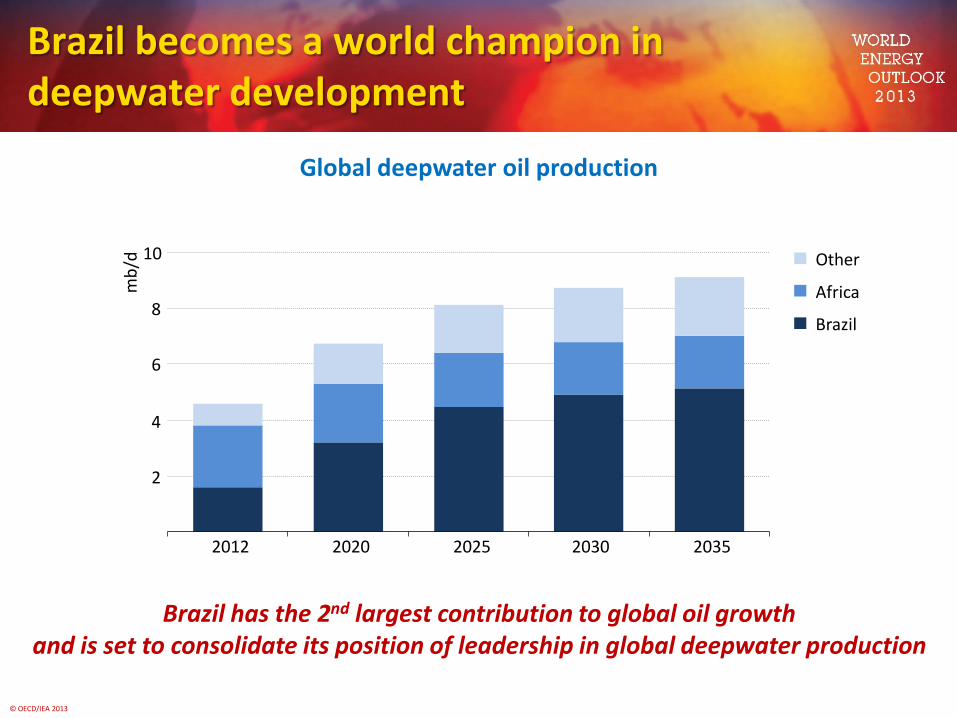
Brazil becomes a world champion in deepwater development
Global deepwater oil production
Brazil has the 2nd largest contribution to global oil growth and is set to consolidate its position of leadership in global deepwater production
2
4
6
8
10
2012 2020 2025 2030 2035
mb
/d
Other
Africa
Brazil

© OECD/IEA 2013
Brazil enters the top 10
Major contributors to global oil supply growth 2012-2035
1 2 3 4 5
United States
Kazakhstan
Canada
Brazil
Iraq
mb/d
Brazil’s output growth to 2035 is by far the highest among non-OPEC countries, second only to Iraq in the world over the period

© OECD/IEA 2013
Exports on the horizon
Brazil oil balance in the New Policies Scenario
Development of the pre-salt fields means that Brazil becomes the first country since Canada, in the 1980s, to go from being a major importer, to a major exporter
-1
0
1
2
3
4
5
6
2000 2005 2010 2015 2020 2025 2030 2035
mb
/d
Net exports
Production
Consumption

© OECD/IEA 2013
A development trajectory contingent on sustained investment
Average annual investment in Brazil’s energy supply infrastructure
Can Brazil maintain investment levels in the energy sector of $90 bn per year?
Oil
Gas
Biofuels
Power
2013 - 2035 $90 billion per year
64%
7%
2%
27%

© OECD/IEA 2013
Revenues from oil are significant, but not transformative
Oil export revenue as a share of GDP in selected countries in the New Policies Scenario
10% 20% 30% 40% 50% 60% 70%
Kuwait
Saudi Arabia
Iraq
UAE
Nigeria
Kazakhstan
Russia
Norway
Iran
Brazil 2012
2035
The relatively low proportion of oil export revenues in GDP suggests that Brazil is well placed to deal with “resource curse” risks