bre publication bepac research report - · pdf filebre publication bepac research report ......
TRANSCRIPT
BRE Publication
BEPAC Research Report
The Harmonisation of Thermal Properties of Building Materials
J A Clarke1, P P Yaneske1 & A A Pinney2
(1) Energy Simulation Research Unit, Department of Architecture and Building Science,University of Strathclyde, (2) Building Research Establishment, Watford.
SUMMARY
This report presents a thorough review of existing data-sets of thermo-physical properties of building mate-rials, devises and applies a suitable merging method for these data-sets, and proposes a summary specifica-tion for an electronic database for the containment and context dependent extraction of the data. The reportalso discusses the need for a standard test procedure, and identifies areas for further attention to andimprovement of existing data.
In total, 14 data sets were obtained. Examination revealed the following key points:
-1 The range of properties for which values are quoted is often limited to only thermal conductivity,density and vapour resistivity as required for simple steady state heat loss and condensation calcula-tions.
-2 The sources of much of the data are not identified, and little information is given on the underlyingexperimental conditions or procedure, which may be with non-standard apparatus or from a datewhich precedes modern standards. As a consequence it is often impossible to check compatibilitybetween different values.
-3 Much of the agreement that does exist between different data-sets may be attributable to historical‘borrowing’ one from the other. This may lead, erroneously, to an optimistic assessment of the inher-ent uncertainty.
-4 No guidance is given on the variation in properties such as density and internal structure inherent inthe production of many building materials, and there is no agreement on the procedure for determin-ing the thermal conductivity of materials as the moisture content varies. Such variations can lead tovery large differences in reported material properties.
The report distinguished between two contexts in which the data might be used. The first is in comparativestudies, where the aim might be to compare different buildings made of ostensibly the same materials. Insuch cases, the absolute accuracy of data is not paramount and, although not attempted in this study, theselection of ‘reference’ data is easier (such selection is being undertaken by, for example, CEN, in the con-text of a European standard building assessment procedure).
The second is in the calculation of real building performance. In such cases, the importance of, for exam-ple, variations of properties with moisture content, and the inherent uncertainties in the manufacture anduse of building materials, are of key importance. In this context, the report examines current testing proce-dures, and makes recommendations as to how these should be improved or standardised.
July 1990
Contract Item: CDS/001/2Research Project: EM243Research Customer: Construction Industry Directorate, DOE
File: BRE/169/12/1
PD 109/90
Page 2
Table of Contents
SECTION 1: Introduction . . . . . . . . . . . . . . . . . . . . . . . . . . . . . . . . . . . . . . . 31.1 Introduction . . . . . . . . . . . . . . . . . . . . . . . . . . . . . . . . . . . . . . . . . . 31.2 Thermophysical Properties of Interest . . . . . . . . . . . . . . . . . . . . . . . . . . . . . . . . . . 31.3 The Process . . . . . . . . . . . . . . . . . . . . . . . . . . . . . . . . . . . . . . . . . . 31.4 Deliverables . . . . . . . . . . . . . . . . . . . . . . . . . . . . . . . . . . . . . . . . . . 41.5 Acknowledgements . . . . . . . . . . . . . . . . . . . . . . . . . . . . . . . . . . . . . . . . 41.6 References . . . . . . . . . . . . . . . . . . . . . . . . . . . . . . . . . . . . . . . . . . . 4SECTION 2: Summary of Questionnaire Returns . . . . . . . . . . . . . . . . . . . . . . . . . . . . . . . . 52.1 Questionnaire to Model Users/Developers . . . . . . . . . . . . . . . . . . . . . . . . . . . . . . . . . 52.1.1 Analysis of Returns . . . . . . . . . . . . . . . . . . . . . . . . . . . . . . . . . . . . . . . 62.2 Questionnaire to Material Testing Organisations . . . . . . . . . . . . . . . . . . . . . . . . . . . . . . . 72.2.1 Analysis of Returns . . . . . . . . . . . . . . . . . . . . . . . . . . . . . . . . . . . . . . . 7SECTION 3: Review of Existing Data-Sets . . . . . . . . . . . . . . . . . . . . . . . . . . . . . . . . . . 93.1 ASHRAE . . . . . . . . . . . . . . . . . . . . . . . . . . . . . . . . . . . . . . . . . . . 93.2 University of Leuven, Belgium . . . . . . . . . . . . . . . . . . . . . . . . . . . . . . . . . . . . 133.3 UK BRE . . . . . . . . . . . . . . . . . . . . . . . . . . . . . . . . . . . . . . . . . . . 143.4 BS 5250 . . . . . . . . . . . . . . . . . . . . . . . . . . . . . . . . . . . . . . . . . . . 163.5 CIBSE . . . . . . . . . . . . . . . . . . . . . . . . . . . . . . . . . . . . . . . . . . . . 183.6 CSTC, Belgium . . . . . . . . . . . . . . . . . . . . . . . . . . . . . . . . . . . . . . . . . 223.7 DOE-2, USA . . . . . . . . . . . . . . . . . . . . . . . . . . . . . . . . . . . . . . . . . . 243.8 ESP, UK . . . . . . . . . . . . . . . . . . . . . . . . . . . . . . . . . . . . . . . . . . . 253.9 France . . . . . . . . . . . . . . . . . . . . . . . . . . . . . . . . . . . . . . . . . . . . 263.10 Germany . . . . . . . . . . . . . . . . . . . . . . . . . . . . . . . . . . . . . . . . . . . 273.11 The Netherlands . . . . . . . . . . . . . . . . . . . . . . . . . . . . . . . . . . . . . . . . . 283.12 Italy . . . . . . . . . . . . . . . . . . . . . . . . . . . . . . . . . . . . . . . . . . . . 293.13 India . . . . . . . . . . . . . . . . . . . . . . . . . . . . . . . . . . . . . . . . . . . . 303.14 Leeds University, UK . . . . . . . . . . . . . . . . . . . . . . . . . . . . . . . . . . . . . . . 31SECTION 4: The Merging Process and the Final Data-Sets . . . . . . . . . . . . . . . . . . . . . . . . . . . . . 324.1 Computational Context . . . . . . . . . . . . . . . . . . . . . . . . . . . . . . . . . . . . . . . 324.2 The Merging Process . . . . . . . . . . . . . . . . . . . . . . . . . . . . . . . . . . . . . . . 324.3 Impermeables . . . . . . . . . . . . . . . . . . . . . . . . . . . . . . . . . . . . . . . . . . 344.4 Non-Hygroscopic . . . . . . . . . . . . . . . . . . . . . . . . . . . . . . . . . . . . . . . . . 384.5 Inorganic-Porous . . . . . . . . . . . . . . . . . . . . . . . . . . . . . . . . . . . . . . . . . 454.6 Organic-Hygroscopic . . . . . . . . . . . . . . . . . . . . . . . . . . . . . . . . . . . . . . . 614.7 Absorptivity and Emissivity . . . . . . . . . . . . . . . . . . . . . . . . . . . . . . . . . . . . . 674.8 Vapour Resistivity . . . . . . . . . . . . . . . . . . . . . . . . . . . . . . . . . . . . . . . . 694.9 References . . . . . . . . . . . . . . . . . . . . . . . . . . . . . . . . . . . . . . . . . . . 71SECTION 5: Recommendations for the Future . . . . . . . . . . . . . . . . . . . . . . . . . . . . . . . . . 725.1 Review of Data-sets . . . . . . . . . . . . . . . . . . . . . . . . . . . . . . . . . . . . . . . . 725.2 Review of Bulk Properties . . . . . . . . . . . . . . . . . . . . . . . . . . . . . . . . . . . . . . 725.3 Review of Test Methods . . . . . . . . . . . . . . . . . . . . . . . . . . . . . . . . . . . . . . 785.4 Review of Classifications . . . . . . . . . . . . . . . . . . . . . . . . . . . . . . . . . . . . . . 795.5 The Data-Sets Compared . . . . . . . . . . . . . . . . . . . . . . . . . . . . . . . . . . . . . . 805.6 Summary Specification of an Electronic Database . . . . . . . . . . . . . . . . . . . . . . . . . . . . . . 805.7 References . . . . . . . . . . . . . . . . . . . . . . . . . . . . . . . . . . . . . . . . . . . 81
Section 1, Page 3
Section One: Introduction
1.1 Introduction
At the present time several modelling systems exist which are capable of predicting the environmen-tal states and energy demands of a building on the basis of inputs which define its form, fabric and opera-tion. These systems have reached a stage in their evolution where a growing number of users are attempt-ing to apply them in a real design context. Three current organisations are cited as evidence of an accelerat-ing rate of uptake: the Building Environmental Performance Analysis Club operating in the UK [1,2], theInternational Building Performance Simulation Association recently established in North America [3] andthe Royal Incorporation of Architect in Scotland’s Energy Design Advisory Service [4] now in its third yearof operation in Scotland.
In support of this uptake, the BEPAC task group on standardisation (Task Group 4) has identified sev-eral desirable developments, including the need for a common set of material thermo-physical propertiesfrom which the different programs could draw. To meet this requirement a project was set up, having thefollowing objectives:
1. To determine the requirements of those who use building environmental prediction methods for mate-rial thermo-physical properties.
2. To review the existing data-sets in terms of data source, underlying test procedures and degree ofconsensus.
3. To comment on the need for a standard test procedure.
4. To suggest areas for further attention and improvement to the data.
5. To consolidate the currently available data-sets and deliver the result in a form compatible with futuretransformation to an electronic database.
6. To prepare an outline specification for the structure of such a database.
1.2 Thermophysical Properties of Interest
The following material properties were addressed within the project
conductivity ( W /mK )density ( kg/m3 )specific heat ( J /kgK )surface emissivity (-)surface shortwav e absorptivity (-)vapour resistivity and resistance ( MNs/gm or MNs/g ).
In particular an attempt was made to obtain data which described the variation of these properties asa function of temperature and/or moisture content.
Some materials, particularly those such as insulation, in which there are large numbers of air pockets,transfer heat by a combination of conduction, convection and longwav e exchange within the material. How-ev er, these processes are usually aggregated, and the resulting overall heat transfer coefficient is called the‘conductivity’. In this report, such conductivities are referred to as apparent conductivities, to distinguishthem from materials which transfer heat solely by conduction.
1.3 The Process
The project was carried out in four stages as follows.
Stage One: The starting point was to contact a representative sample of program users/developers and mate-rial testing groups to obtain information on the data-sets in current use and to develop an understanding ofthe underlying test procedures. A wide range of organisations was polled including:

Section 1, Page 4
Professional bodies such as CIBSE and ASHRAE.Architectural and Engineering design practices.Government laboratories.Academic groups.Software vendors.Material manufacturers.Research organisations.Testing laboratories.All BEPAC and IBPSA members.
Tw o questionnaires were devised for this purpose. In total some 400 questionnaires were despatchedand 100 replies received. Section Tw o shows the form of the two questionnaires and gives a summary ofthe information contained in the replies.
Stage Two: A selective follow-up was then initiated to obtain the data-sets identified on the questionnairereturns and to document these in terms of their source, size and associated test procedures. This stage isreported in Section Three.
Stage Three: A mechanism for merging the collected data-sets was then devised. Section Four reports onthe outcome and lists the merged data-sets.
Stage Four: This gives recommendations for future data-set refinement and presents a summary specifica-tion for an electronic database.
1.4 Deliverables
The deliverables from the project include:
1. The information from the questionnaire returns.
2. The 14 data-sets as collected and a description of each in terms of data source and underlying testprocedure.
3. A description of the mechanism used to merge and categorise the data.
4. The merged collection.
5. A set of recommendations for future test procedures.
6. An outline specification for an electronic database to manipulate the collated data and provide con-text dependent values.
1.5 Acknowledgements
We are indebted to the the many individuals/organisations who responded to our questionnaires andwere so willing to give us advice and their data-sets. We are also grateful to Dr V V Verma, a visitingBritish Council Scholar from the Central Building Research Institute at Roorkee, India, who assisted in thecompilation and review of the project databases.
This work is part of the research programme of the Building Research Establishment, and is pub-lished with the permission of the Director.
1.6 References
1. Irving, S. 1989 ‘BEPAC, Building Environmental Performance Analysis Club’ Proc. of BuildingSimulation ’89, Vancouver, Canada, June 23-24, pp 1-4.
2. Pinney, A.A. 1988 ‘The Need for Standards in Environmental Modelling’ Paper to the BEPAC meet-ing, Polytechnic of Central London, June 14. Available from the Building Research Establishment,Watford.
3. ‘IBPSA Bylaws and Charter Statement’ Available from: Sowell, E., Department of Computer Sci-ence, Cal State Fullerton, Fullerton, California.
4. Emslie S V 1988 ‘The Energy Design Advisory Service in Scotland: Technology Transfer inAdvanced Building Energy Simulation’ Proc. 2rd European Simulation Congress Ostend, Belgium.
Section 2, Page 5
Section Two: Summary of Questionnaire Returns
2.1 Questionnaire to Model Users/ Developers
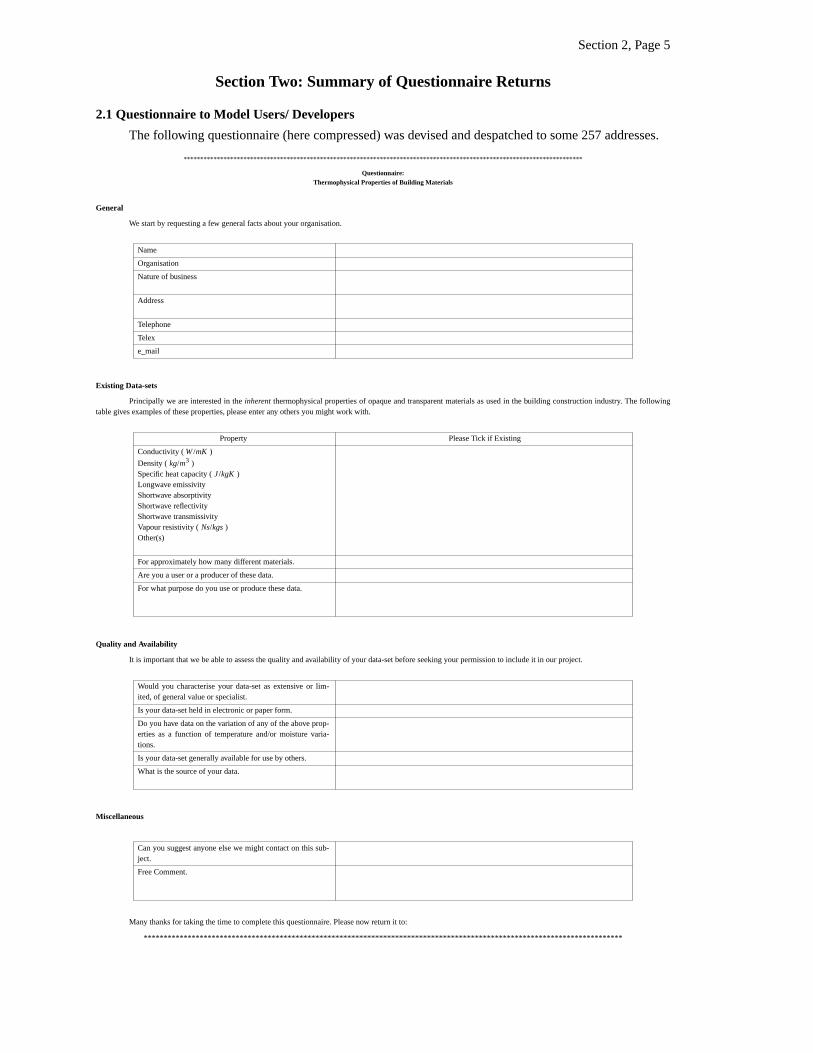
The following questionnaire (here compressed) was devised and despatched to some 257 addresses.
************************************************************************************************************************
Questionnaire:Thermophysical Properties of Building Materials
General
We start by requesting a few general facts about your organisation.
Name
Organisation
Nature of business
Address
Telephone
Telex
e_mail
Existing Data-sets
Principally we are interested in the inherent thermophysical properties of opaque and transparent materials as used in the building construction industry. The followingtable gives examples of these properties, please enter any others you might work with.
Property Please Tick if Existing
Conductivity ( W /mK )
Density ( kg/m3 )Specific heat capacity ( J /kgK )Longwav e emissivityShortwav e absorptivityShortwav e reflectivityShortwav e transmissivityVapour resistivity ( Ns/kgs )Other(s)
For approximately how many different materials.
Are you a user or a producer of these data.
For what purpose do you use or produce these data.
Quality and Availability
It is important that we be able to assess the quality and availability of your data-set before seeking your permission to include it in our project.
Would you characterise your data-set as extensive or lim-ited, of general value or specialist.
Is your data-set held in electronic or paper form.
Do you have data on the variation of any of the above prop-erties as a function of temperature and/or moisture varia-tions.
Is your data-set generally available for use by others.
What is the source of your data.
Miscellaneous
Can you suggest anyone else we might contact on this sub-ject.
Free Comment.
Many thanks for taking the time to complete this questionnaire. Please now return it to:
************************************************************************************************************************
Section 2, Page 6
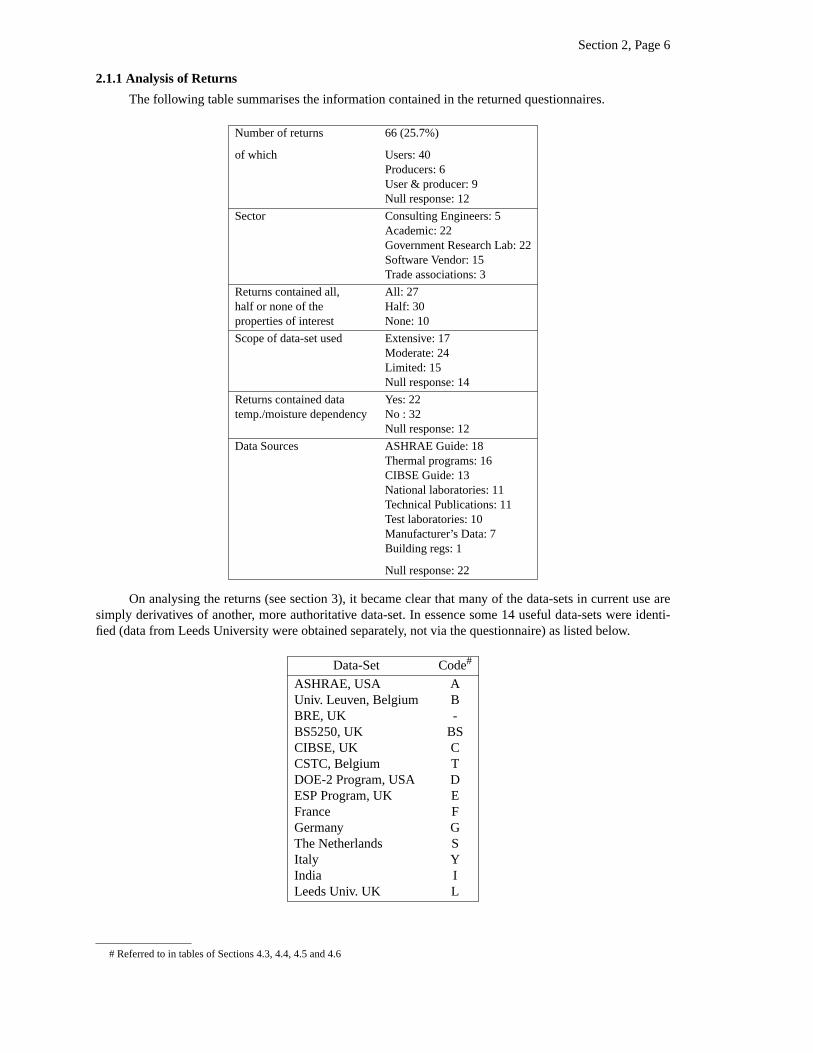
2.1.1 Analysis of Returns
The following table summarises the information contained in the returned questionnaires.
Number of returns 66 (25.7%)
of which Users: 40Producers: 6User & producer: 9Null response: 12
Sector Consulting Engineers: 5Academic: 22Government Research Lab: 22Software Vendor: 15Trade associations: 3
Returns contained all, All: 27half or none of the Half: 30properties of interest None: 10
Scope of data-set used Extensive: 17Moderate: 24Limited: 15Null response: 14
Returns contained data Yes: 22temp./moisture dependency No : 32
Null response: 12
Data Sources ASHRAE Guide: 18Thermal programs: 16CIBSE Guide: 13National laboratories: 11Technical Publications: 11Test laboratories: 10Manufacturer’s Data: 7Building regs: 1
Null response: 22
On analysing the returns (see section 3), it became clear that many of the data-sets in current use aresimply derivatives of another, more authoritative data-set. In essence some 14 useful data-sets were identi-fied (data from Leeds University were obtained separately, not via the questionnaire) as listed below.
Data-Set Code#
ASHRAE, USA AUniv. Leuven, Belgium BBRE, UK -BS5250, UK BSCIBSE, UK CCSTC, Belgium TDOE-2 Program, USA DESP Program, UK EFrance FGermany GThe Netherlands SItaly YIndia ILeeds Univ. UK L
# Referred to in tables of Sections 4.3, 4.4, 4.5 and 4.6
Section 2, Page 7
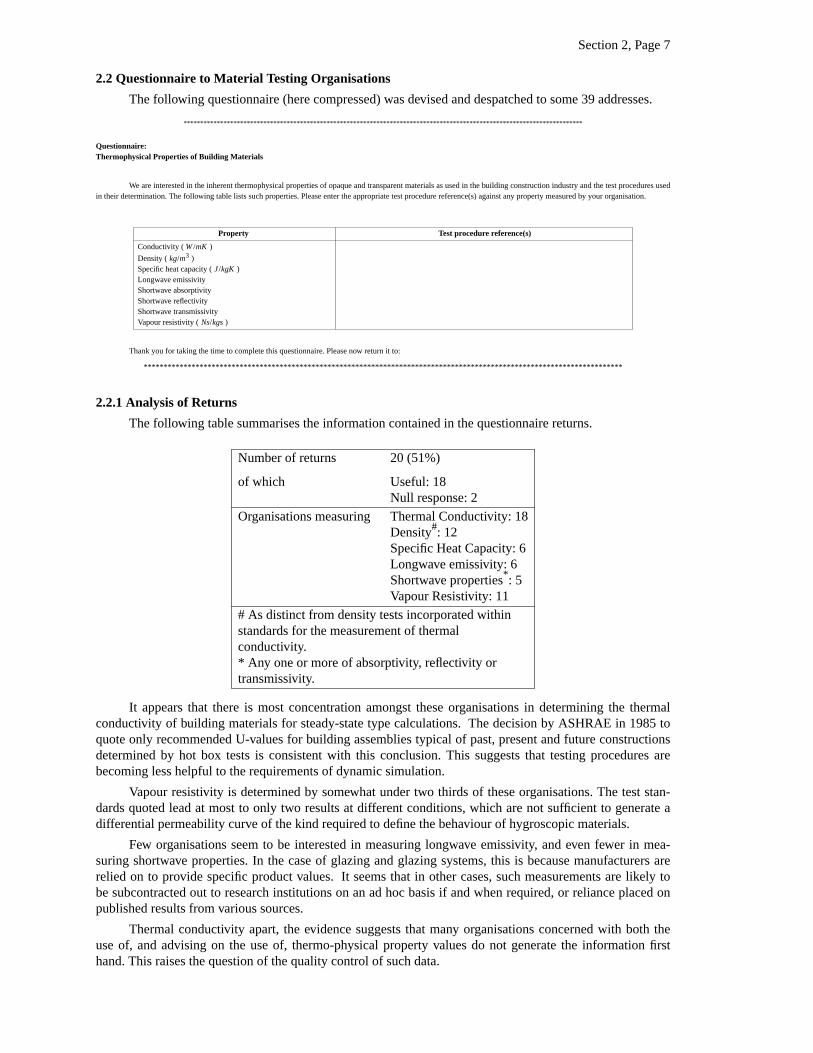
2.2 Questionnaire to Material Testing Organisations
The following questionnaire (here compressed) was devised and despatched to some 39 addresses.
************************************************************************************************************************
Questionnaire:Thermophysical Properties of Building Materials
We are interested in the inherent thermophysical properties of opaque and transparent materials as used in the building construction industry and the test procedures usedin their determination. The following table lists such properties. Please enter the appropriate test procedure reference(s) against any property measured by your organisation.
Property Test procedure reference(s)
Conductivity ( W /mK )
Density ( kg/m3 )Specific heat capacity ( J /kgK )Longwav e emissivityShortwav e absorptivityShortwav e reflectivityShortwav e transmissivityVapour resistivity ( Ns/kgs )
Thank you for taking the time to complete this questionnaire. Please now return it to:
************************************************************************************************************************
2.2.1 Analysis of Returns
The following table summarises the information contained in the questionnaire returns.
Number of returns 20 (51%)
of which Useful: 18Null response: 2
Organisations measuring Thermal Conductivity: 18Density#: 12Specific Heat Capacity: 6Longwav e emissivity: 6Shortwav e properties*: 5Vapour Resistivity: 11
# As distinct from density tests incorporated withinstandards for the measurement of thermalconductivity.* Any one or more of absorptivity, reflectivity ortransmissivity.
It appears that there is most concentration amongst these organisations in determining the thermalconductivity of building materials for steady-state type calculations. The decision by ASHRAE in 1985 toquote only recommended U-values for building assemblies typical of past, present and future constructionsdetermined by hot box tests is consistent with this conclusion. This suggests that testing procedures arebecoming less helpful to the requirements of dynamic simulation.
Vapour resistivity is determined by somewhat under two thirds of these organisations. The test stan-dards quoted lead at most to only two results at different conditions, which are not sufficient to generate adifferential permeability curve of the kind required to define the behaviour of hygroscopic materials.
Few org anisations seem to be interested in measuring longwav e emissivity, and even fewer in mea-suring shortwav e properties. In the case of glazing and glazing systems, this is because manufacturers arerelied on to provide specific product values. It seems that in other cases, such measurements are likely tobe subcontracted out to research institutions on an ad hoc basis if and when required, or reliance placed onpublished results from various sources.
Thermal conductivity apart, the evidence suggests that many org anisations concerned with both theuse of, and advising on the use of, thermo-physical property values do not generate the information firsthand. This raises the question of the quality control of such data.

Section 2, Page 8
The fact that a standard exists does not, of course, guarantee that it is actually in use. Standards tendto vary by material and there are, for example, hundreds of standards in the USA alone. Any one organisa-tion is likely to test only a limited subset of what is possible. A listing by thermophysical property of stan-dards which have been quoted in the questionnaire returns is given in the following table.
Thermal Conductivity:
UK BS 874, BS 1142, BS 3837, BS 3927, BS4370, BS 4840, BS 5608, BS 5617
USA ASTM C-158, ASTM C-177, ASTM C 236,ASTM C 335, ASTM C 518, ASTM C 687,ASTM C 691
West Germany DIN 52612Belgium NBN B62-200, NBN B62-201, NBN
B62-203
Density:
UK BS 874, BS 2972, BS 4370, BS 5669USA ASTM C-158, ASTM C-177, ASTM C-209,
ASTM C-302, ASTM C-303, ASTM C-519,ASTM C-520, ASTM C-1622
Belgium STSO8.82.41, STSO8.82.5
Specific Heat Capacity:
UK Yarsley: in-houseUSA ASTM C-351East Germany TGL 20475
Longwav e Emissivity:
UK Draft BS 87/12988USA ASTM E-408, Manville: in-houseAustralia CSIRO: in-house
Shortwav e Properties:
UK Draft BS 87/12988USA ASHRAE 74-73East Germany Sonntag’s Pyranometer
Vapour Resistivity:
UK BS 2782, BS 2972, BS 3177, BS 4370:1973, Part 2, DD 146
USA ASTM C755, ASTM E96West Germany DIN 52615Austria ONORM B 6016
An examination of the BSI and ASTM yearbooks shows that standards change perhaps as often asev ery 3 to 5 years. Current standards will not affect data already in use for some time to come. For exam-ple, much of the CIBSE thermal properties data-set predates 1970 and several amendments of BS 874. Anhistorical perspective may be of some value in assessing data-sets.
Particular national standards may not cover certain areas and, in any case, a catalogue of standardswould fail to reveal the use of in-house testing procedures. Some such in-house procedures have, in fact,been identified.

Section Three (ASHRAE), Page 9
Section Three: Review of Existing Data-Sets
3.1 ASHRAE
3.1.1 General Observations
The tabulated values of thermal properties in the 1985 ASHRAE Handbook [1] for individual materi-als as opposed to multi-layered constructions are, for the most part, the same as in the 1981 edition. Table3A of Chapter 23, entitled ‘Thermal Properties of Typical Building and Insulating Materials - Design Val-ues’, gives information on conductivity or conductance and specific heat. The table has been slightlyreordered and revised since the 1981 edition. A new section ‘Field Applied’ has been inserted whichreplaces and revises the information on the properties of insulation materials applied in-situ which werepreviously given in Table 3C in Chapter 23 of the 1981 handbook. The information on the thermal proper-ties of woods has been refined in detail.
The logic and consequences of the difference between thermal conductivity as a defined property of athermally homogeneous material and as an apparent property of materials which support other modes ofheat transmission is made explicit. In particular, the behaviour of thermal insulation materials is discussedin Chapter 20. The logic follows through into testing procedures and the presentation of thermal data. Thisleads to a conclusion that for non-homogeneous materials (for example tiles and blocks with voids andinsulation materials) the basic quantum of thermal data is the conductance of the manufactured unit. It isnoticeable that most of the values given in Table 3A are of the thermal conductance of specimens of statedthickness rather than of thermal conductivity. This is markedly different to, for example, the CIBSE philos-ophy where the conductance of such items is estimated by combining the individual thermal conductivitiesof the solid parts and the thermal resistances of the voids.
Further values of the (apparent) thermal conductivities of insulating materials that can be found inexisting buildings but which are no longer commercially available are listed separately in Table 3B. Designvalues for industrial insulation are listed in Table 6 for cryogenic through to elevated temperatures. Valuesfor soils, in the context of buried lines, are given in Table 9.
Water vapour transmission is dealt with in Chapter 21: vapour permeance and permeability values ofmaterials being listed in Table 2 of that chapter. Again, the values are given for design guidance only.Longwav e emissivities are quoted for some surfaces in Table 2A of Chapter 23: the context is the thermalresistance of plane air spaces. The solar absorptance of opaque surfaces appears implicitly in Chapter 26within the context of the computation of sol-air temperature. Solar reflectances for some opaque surfacesappear in Table 12 of Chapter 27 within the context of solar heat gains through fenestration, where the asso-ciated properties of glass and fenestration are considered.
The tables of values are accompanied by numerous informative footnotes offering useful interpreta-tions of and guidance about the data.
It is important to understand the meaning of the term ‘design values’ as used in this database. Theyare NOT representative of values to be found in practice where, for example, moisture content may beimportant. Design values are explicitly stated to be different to specification values that are representativeof materials in normal use. In the latter case, the user is referred to values supplied by the manufacturer orobtained from unbiased tests. This is different to the approach adopted in the CIBSE database where valuesare deliberately derived and quoted that are representative of actual use.
One obvious difference between the 1981 and 1985 versions of Chapter 23 is the removal of Tables4A through to 4K from the later edition. The significance of this to test methodology and future databasematerial is discussed later. A list of the physical properties of materials is given in Chapter 39 with sourcesreferenced. However, the Handbook explicitly identifies Chapter 23 as the source for building materials.
The footnotes to Tables 3A and 6 of Chapter 23 offer guidance on the effect of ageing on the thermalproperties of polyurethane and polyisocyanurate boards. Reference is also made to the effects of ageing onreflective surfaces, for example through oxidation and dust accumulation in reducing thermal resistance inthe context of air spaces. No numerical information is provided, but the user is advised to make direct mea-surement of surface emittance values using, for example, ASTM C-445 or of thermal conductances usingASTM hot box tests on the appropriate construction.
Section Three (ASHRAE), Page 10
3.1.2 Classifications
The entries in the first three tables noted in 3.1.1 are arranged by a mixture of generic building mate-rial type (for example building board), method of installation (for example loose fill) and by constructiontype (for example roofing). Otherwise, classification is by broad building material type. The headings donot follow in simple alphabetical order.
As noted above, insulants are distinguished according to whether they are for industrial use or not,and whether they are in current use.
Thermal conductivity/conductance values correspond to dry materials, except for wood which is con-ditioned to 12% moisture content by weight in all cases. Hence, no attempt is made to classify materials bydegree of exposure. For water vapour permeance/permeability, some values are quoted for both wet- anddry-cup measurements giving some idea of behaviour under different conditions. This is far from universaland is not applied to wood, for instance, which has a permeability very sensitive to vapour pressure.
With respect to radiative heat transfer, materials are divided into three classes of emissivity for thepurposes of calculating surface conductances. In the case of solar absorptance, opaque surfaces are classi-fied as either dark or light coloured for the purpose of calculating fabric solar heat gain. For solarreflectance, a subgroup of materials is identified as ‘foreground surfaces’ for the purposes of calculatingsolar heat gains through glass.
3.1.3 Sources of Data
The selection of the design values for the thermal conductivity/conductance of typical building andinsulating materials, and for industrial insulation appearing in Chapter 23, Tables 3A and 6 respectively, isattributed to ASHRAE Technical Committee 4.4. Only the sources for wood are specifically referenced [2 -6]. The test conditions are reasonably well documented. The behaviour of the apparent thermal conductiv-ity of low density thermal insulation materials as a function of density, mean temperature and, for fibrousinsulations, fibre diameter is shown in figures 1 through 4 in Chapter 20. The non-linear behaviour withthickness is also mentioned [7]. The source of the values for the obsolete insulating materials appearing inTable 3B of Chapter 23 is referenced [8]. The mean test temperatures are recorded.
The source of the values of specific heat appearing in Table 3A of Chapter 23 is not referenced otherthan to selection by ASHRAE Technical Committee 4.4.
The sources of permeance/permeability values quoted in Chapter 21, Table 2, are extensively refer-enced [9 - 24]. All quoted thermal properties are for dry materials other than for wood at 12% moisturecontent [2 - 6]. No attempt is made to relate thermal conductivity or conductance to degree of moisturecontent.
For the purposes of calculating surface conductances, materials are given either a high emissivity of0.9, a low emissivity of 0.2 or a very low emissivity of 0.05. Explicit mention is made of the significance ofan error in the estimated value of surface conductance to the overall error in calculating the thermal trans-mittance. The reflectivity and emissivity values of various surfaces are given in Table 2B of Chapter 23.No source is referenced.
For opaque surfaces, no explicit value of solar absorptance is given in Chapter 26. However, it can bededuced that the value for a light or dark coloured surface is about the same as that quoted in the CIBSEGuide. No reference is given for these values. A limited number of reflectances appear in Table 12 of Chap-ter 27 for foreground surfaces. They are given as a function of the angle of incidence. The source isacknowledged [25].
For transparent surfaces some information on the solar optical properties of glass and of plastic sheet-ing is given in Figures 11, 12 and 34 of Chapter 27. The values in Table 34 are referenced [26,27].
3.1.4 Test Methods
For thermal conductivity/conductance values as listed in Chapter 23, Tables 3A and 3B, the data areexplicitly attributed to measurements using the test procedures of ASTM C-518 or ASTM C-177. The for-mer refers to the guarded hot plate method which is also the method referred to in section A3 of the CIBSEGuide (in the context of BS 874). The latter refers to the heat flow meter method which is not referred toby the CIBSE Guide but is described in BS 874. There is no specific reference to any test method in rela-tion to the values of thermal conductivity of industrial insulation quoted in Table 6.
Section Three (ASHRAE), Page 11
Direct measurement on representative sections of building construction using the guarded hot boxmethod (ASTM C-236) or the calibrated hot box method (ASTM C-976) is positively recommended. Infact, Chapter 23 states
“The most exact method of determining the heat transmission coefficient for a given combination ofbuilding materials as a building section is to test a representative sample in a guarded hot box or cali-brated hot box.”
Interestingly, only in the absence of such measurements are calculation techniques based on the prop-erties of the individual components of construction recommended. The reason for the removal of Tables4A through to 4K from the 1985 edition of the ASHRAE Handbook which was referred to above, isdirectly related to this approach. The intention is that a ‘Manual of Heat Transmittance Coefficients forBuilding Components’ based on measurements using the hot box methodology will act as a source ofdesign values of thermal transmittances for typical past, present and future building constructions.
The values of water vapour permeance and permeability given in Chapter 21 are identified with testmethods. For the most part these are wet- and/or dry-cup tests after ASTM E 96 and ASTM C 355.
With respect to longwav e emissivity, reference is made to ASTM C-445. The use of ASHRAE 74-73can be inferred in relation to solar absorptance/reflectance data in the context of fenestration.
With respect to specific heat and moisture content, no test methods are identified.
3.1.5 Use of Data
The material thermal properties listed in Chapter 23 are intended to be used in the computation of thesteady state thermal transmittances of assembled building constructions. In the case of heat-bridged con-structions, a calculation method is put forward to enable an estimate of the thermal transmittance to beobtained from the properties of the components. Nevertheless, it is only to be used where direct measure-ment by a hot box test cannot be carried out. The vapour permeances and permeabilities listed in Chapter21 are intended to be used in simple steady state vapour transmission calculations in direct analogy with thethermal calculations. They assume conditions of no condensation. The results so calculated are for designguidance and therefore are not representative of actual service conditions. This is primarily because there isno allowance or correction for moisture content.
3.1.6 References
2. American Soc. of Heating, Refrogeration and Air-conditioning Engineers, Inc. US ASHRAE Hand-book, 1985 Applications.
2. Forest Products Laboratory US Department of Agriculture Handbook No.72 (Tables 3-7 and 4-2and Figures 3-4 and 3-5) 1974.
3. Adams L ‘Supporting cryogenic equipment with wood’ Chemical Engineering 17 May 1971.
4. MacLean J D ‘Thermal conductivity of wood’ ASHVE Trans. V47 p323 1941.
5. Wilkes K E ‘Thermophysical properties database activities at Owens-Corning Fiberglas’ Proc. conf.on Thermal Performance of the Exterior Envelope of Buildings ASHRAE SP28 p662 December1979.
6. Goss W P ‘Thermal properties of Wood’ ASHRAE SP (To be published).
7. Pelanne C M ‘Thermal insulation heat flow measurements: requirements for implementation’ASHRAE Journal V21(3) p51 March 1979.
8. Heating, Ventilating and Air-Conditioning Guide, pp95-8 1939.
9. US Housing and Home Finance Agency ‘Condensation control in dwelling construction’ June 1950.
10. Anderson L O ‘Condensation problems: their prevention and solution’ USDA Forest ServiceResearch Paper FPL 132 US Dept. of Agriculture 1971.
11. Queer R E and McLaughlin E R ‘Condensation control in metal buildings’ Actual Specifying Engi-neer V23(10) p124 October 1969.
12. ‘Water vapor transmission testing’ Materials research & Standards V1(2) p117 February 1961.
13. Joy F A, Queer E R and Schreiner R E. ‘Water Vapor Transfer Through Building Materials’ BulletinNo.61 Pennsylvania State College, Engineering Experiment Station, December 1948.
Section Three (ASHRAE), Page 12
14. Babbitt J D ‘The diffusion of water vapor through various building materials’ Canadian Journal ofResearch p15 February 1939.
15. Teesdale L V ‘Remedial Measures for Building Construction’ US Forest Products LaboratoryReport R1710 US Dept. of Agriculture 1947.
16. Rowley F B, Algren A B and Lund C E ‘Methods of Moisture Control and Their Application toBuilding Construction’ Bulletin No.17 University of Minnesota, Engineering Experiment Station.
17. Barre H J ‘The Relation of Wall Constructions to Moisture Accumulation in the Fill-Type Insulation’Bulletin No.271 Iowa State College of Agriculture and Mechanic Arts, Agricultural Experiment Sta-tion, 1940.
18. McDermott P F ‘Moisture migration: a survey of theory and existing knowledge’ RefrigeratingEngineer p103 August 1941.
19. Wray R I and Van Vorst A R ‘Permeability of paint films to moisture’ Industrial and EngineeringChemistry V25 p.842 1933.
20. Britton R R and Reichel R C ‘Water Vapor Transmission of Building Materials Using Four DifferentTesting Methods’ Technical Bulletin No.12 US Housing and Home Finance Agency, January 1950.
21. Bell E R, Seidl M G and Kruger N. T ‘Water-vapor permeability of building papers and other sheetmaterials’ ASHVE Transactions V57 p287 1951.
22. ‘How to estimate the amount of water vapor transmitted through building walls’ Heating and Venti-lating September 1942.
23. Edwards J D and Strohm D B ‘Measuring permeability’ Modern Packaging October 1945.
24. Lotz W A ‘Vapor barrier design, neglected key to freezer insulation effectiveness’ Quick FrozenFoods November 1964.
25. Bliss R W ‘Atmospheric radiation near the surface of the ground’ Solar Energy V5(3) p103 1961.
26. Burkhardt W C ‘Acrylic plastic glazing: properties, characteristics and engineering data’ ASHRAETrans. V82 Part 1 p683 1986.
26. Burkhardt W C ‘Solar optical properties of gray and brown solar control series transparent acrylicsheet’ ASHRAE Technical Symposium Atlantic City January 1975.
Section Three (Belgium), Page 13
3.2 University of Leuven, Belgium
3.2.1 General Observations
This database contains values of bulk density and thermal conductivity or thermal resistance forbuilding and insulating materials for both indoor and outdoor conditions. It refers to a relatively limited setof materials. As such it only applies to materials at normal environmental temperatures. The temperaturelimits for use of the listed values are -10°C to 30°C [1].
3.2.2 Classifications
The entries in this database are by broad generic building material type. Within each entry, values arelisted against the various forms in which the material appears. There is a subdivision of values into thosefor use under indoor conditions and those for use under outdoor conditions. Materials which are not recom-mended for exposure to external conditions are specifically identified as such. Values for metals are listedunder outdoor conditions. There is a separate section for non-homogeneous materials. The thermal resis-tance and associated thickness of the manufactured unit are given. Examination of the database shows thatmaterials for which the thermal conductivity is an apparent property are included. However, there is no ref-erence to apparent thermal conductivity as such.
3.2.3 Sources of Data
Thermal conductivity/resistance values are attributed to a single Belgian Standard [2].
Moisture content values for indoor use are attributed to any material layer which cannot be wetted byrain or which will come to hygroscopic equilibrium with the environment. The values for outdoor use areto be attributed to any material wetted by rain.
3.2.4 Test Methods
No test methods are identified for thermal conductivity or moisture content, the only two propertiesgiven.
3.2.5 Use of Data
The data are intended for use in the calculation of steady state thermal transmittances.
3.2.6 References
1. IEA Annex XIV, Condensation and Energy: 1. Material Properties, Laboratorium voor Bouwfysica,Katholieke Universiteit Leuven.
2. Belgium Standard NBN B62-002, Thermische geleidbaarheid van de bouwmaterialen, Conductivitiesthermiques des materiaux de construction, Brussel, 1980.

Section Three (BRE), Page 14
3.3 UK BRE
3.3.1 General Observations
Although the listing of this database is now no longer available, it is known that it was structured tostore up to seven material properties. These were density, thermal conductivity, vapour resistivity, specificheat, linear expansion, porosity and strength (either tensile or crushing). Values for at least the first fourproperties had to be given for any material to be stored in the database. An interesting feature of thisdatabase was the fact that each item of data was associated with a 4-character code which identified the ref-erence source for the data. Unfortunately the sources, and any index to them, are also no longer available.Another interesting feature was the facility to list materials conforming to a desired value of one of thematerial properties. Some documentation which describes the structure and operation of the database is stillavailable [1, 2, 3 & 4]. Examination of a hardcopy of the database structure shows that it was divided into afirst part consisting of a listing of approximate properties of materials for general calculation purposes, fol-lowed by a more detailed listing of properties. It is noteworthy that only a single figure for vapour resistiv-ity was stored, irrespective of whether the material was hygroscopic or not. Taken together with the listingof approximate values, this suggests the expected accuracy of calculations was not high. Some recent val-ues developed by the BRE on vapour resistance and on solar absorptivity and longwav e emissivity havebeen passed to ESRU. The latter two properties were not included in the original database.
3.3.2 Classifications
All entries were by broad generic building material type. Each entry was then subdivided into the var-ious forms in which the material appears, and arranged in alphabetic order. The actual group headings wereAsbestos, Asphalt, Brick, Concrete, Felt, General, Glass, Plaster, Plastic, Timber and Wool. The morerecent data follow the same logic but with different group headings and materials.
3.3.3 Sources of Data
The source of the thermal conductivity and specific heat data is unknown, but for water vapour trans-mission there are two sources [5 & 6]. Concerning moisture content there is evidence in the documentationthat the thermal conductivities for wet masonry were stored, and correspond to the values given in theCIBSE Guide. These would have been derived by using the Jakob corrections, and cannot be consideredreliable. All longwav e emissivity and shortwav e absorptance data come from a single source [7].
3.3.4 Test Methods
The test methods for thermal conductivity, specific heat, moisture content and longwav e emissivityare unknown. Water vapour transmission is based on a wet cup modification of BS 3177 [6]. With short-wave absorptance no specific test method is identified, although one source [8] does reference the instru-mentation employed.
3.3.5 Use of Data
The data are intended for use in the calculation of steady state thermal transmittances, admittancesand dewpoint profiles [4].
3.3.6 References
1. Filmer R N Technical Bulletin T69 Building Research Establishment, January 1977.
2. Wordsworth L M and Filmer R N Technical Bulletin T70 Building Research Establishment, January1977.
3. Filmer R N Technical Bulletin T76 Building Research Establishment, January 1978.
4. Filmer R N Technical Bulletin T77 Building Research Establishment, January 1978.
5. McIntyre I S ‘Timber Housing Performance’ Private Communication, Building Research Establish-ment, 1989.
6. Covington S A and McIntyre R S ‘Timber Frame Wall Materials: Measurement of Vapour Resis-tance’ Timber in Building pp207-10.

Section Three (BRE), Page 15
7. Penwarden A ‘Solar absorptivity and longwav e emissivity values for a wide range of materials’Unpublished paper, Building Research Establishment, January 1989.
8. Beckett H E ‘The Exclusion of Solar Heat’ JIHVE V3(25), pp84-8, 1935.
Section Three (BS 5250), Page 16
3.4 BS 5250
3.4.1 General Observations
Following the withdrawal of the original BS 5250, a much revised version was published in 1989.The revision concerns both the method of condensation risk calculation and the data to be used. As such,the Standard contains tables of thermal and vapour resistivities. In particular, the vapour resistivities havebeen heavily revised and represent a considerable accumulation of practical experience. Much of that expe-rience is contained internally within organisations and not generally published. It should be noted that thevalues quoted do not allow for the effects of installation.
3.4.2 Classifications
The database entries are by building material type, listed alphabetically. A single value of thermalconductivity is associated with each material entry. In the case of the vapour resistivity, both a typical valueand upper and lower bounds of the range of values found for a particular material are quoted. A separatetable is given for the vapour resistances of vapour barriers. A further table is devoted to the thermal resis-tance of airspaces. Examination of the database shows that materials for which the thermal conductivity isan apparent property are included. However, there is no reference to apparent thermal conductivity as such.
3.4.3 Sources of Data
Although there is no direct reference to the source of thermal resistivity/resistance values in the Stan-dard, enquiry has revealed that the values are derived from the CIBSE Guide [1].
The vapour resistivities and resistance values are derived from a large number of sources, with selec-tion based on practical experience. Fortunately, a note of these sources has been kept and obtained from oneof the committee members who worked on the Standard [2,3,4,5,6,7,8,9,10,11,12,13,14,15,16].
While there is no specific reference to moisture content in the tabulated data, examination of the ther-mal conductivity values shows that most are equivalent to the CIBSE values for exposed conditions. Fur-ther enquiry has confirmed this, and revealed that the reason for so doing lies in the belief that the CIBSEvalues significantly underestimate the true moisture content of materials found in practice [17].
3.4.4 Test Methods
Concerning thermal resistivity/resistance, no test method is identified (as the historic CIBSE sourcedata set contains no reference). Similarly for water vapour transmission no test method is identified. How-ev er, many of the source references quote wet and dry cup test methodology.
3.4.5 Use of Data
The data are intended for use in the steady state calculation of condensation risk based on the methodgiven by Glaser [18].
3.4.6 References
1. CIBSE Guide Section A3, 1980.
2. National House Building Council, internal data.
3. Department of the Environment Northern Ireland, internal data.
4. Timber Research and Development Association, internal data.
5. Pilkington Bros Ltd, internal data.
6. Princes Risborough Laboratory, internal data.
7. Building Research Establishment, internal data.
8. ‘Condensation’ BRE Digest 110 Building Research Establishment, Watford, 1972.
9. BS 5250 ‘Code of basic data for the design of buildings: the control of condensation in dwellings’,1975.
10. BS 6229 ‘Flat roofs with continuously supported coverings’.
Section Three (BS 5250), Page 17
11. CIBSE Guide Section A10 1986.
12. Prangnell R D ‘The water vapour resistivity of building materials - a literature survey’ Materiaux etConstructions 4(24) November 1971.
13. ASHRAE Handbook Fundamentals Volume 1985 .
14. ‘Condensation, Part 1: The risks’ and ‘Part 2: The remedies’ AJ 9 and 16 April 1986.
15. AJ <book of about 3 years ago>.
16. Sieffert K ‘Damp diffusion and buildings: prevention of damp diffusion damage in buildings’ Else-vier 1970.
17. Cornish P C Personal communication BRE Scottish Laboratory.
18. Derricott R and Chissick S S (Eds) Energy Conservation and Thermal Insulation Chapter 21 JohnWiley & Sons Ltd 1981.
Section Three (CIBSE), Page 18
3.5 CIBSE
3.5.1 General Observations
The source of these data is the CIBSE Guide [1]. The tabulated thermal properties of materialsappear mainly in Section A3 (1980), and are largely based on the values previously given in section A3 ofthe 1970 edition of the Guide. In particular, the bulk densities, thermal conductivities and resistivities ofmiscellaneous materials, as given in Table A3.22 of the 1980 edition, are identical to those given in TableA3.23 of the 1970 edition. The thermal conductivities of homogeneous masonry, as giv en in Table A3.1 ofthe 1980 edition, differ from Table A3.3 of the 1970 edition in that the values for concrete with foamed slagaggregate are now quoted separately from other forms of concrete. Otherwise, the values for concrete andbrickwork remain unchanged from the 1970 edition. As stated in the introduction to the 1980 edition ofSection A3, values were ‘selected impartially’ against a policy to use only ‘traditionally accepted’ values asgiven in the 1970 edition wherever possible. The descriptors ‘impartial’ and ‘traditional’ appear to meanhistorical consensus rather than recently validated test results. Indeed, the 1980 edition states
“The thermal conductivities and other properties of materials contained in this section are drawnmainly from historical data”.
A noteworthy feature of the 1980 edition is the considerable extension of precalculated thermal prop-erties for composite constructions now including both thermal transmittance and admittance. The latter didnot appear in the 1970 edition of section A3. The values of density, thermal conductivity, specific heatcapacity and surface resistance used to calculate transmittance and admittance are given in Table A3.15.These values form a subset of representative or typical values on which to base computations of the thermalproperties of composite building constructions.
Vapour resistivities for materials and resistances for films are given in Section A10 (1986). This Sec-tion has been much revised and extended. It bears little resemblance to the 1970 version, and now reflects amuch greater interest in condensation. Table A10.4 contains both vapour resistivities and thermal conduc-tivities as an aid to condensation calculations.
Longwav e emissivities are quoted in Section C3. Values of solar absorptance and reflectance foropaque surfaces appear in Section A2 (1982) (originally in Section A6 which has now been discontinued).The absorptance values for clean surfaces has been dropped. Solar reflectance continues to receive the samecursory treatment as before. In the context of solar gains, the properties of glazing are treated separately insection A5.
The effect of ageing on the properties of polyurethane is given in Table A3.22.
3.5.2 Classifications
The miscellaneous materials for which thermal properties are given in Table A3.22 are listed bygeneric building material type in simple alphabetic order. Under each entry, values are attributed to the vari-ous forms in which the material may appear.
Because of their temperature dependence, the thermal conductivities of common insulating materialsfor use at elevated temperatures are given separately in Section C3 in the context of pipe insulation. Soilthermal conductivities are also quoted in Section C3 in the context of underground services.
The thermal conductivity of any porous building material is affected by the moisture content of thepores. This is the reason why the thermal conductivities of homogeneous concrete and brickwork are listedseparately in Table A3.1. Such materials may contain amounts of moisture significantly above that due tothermal equilibrium with the ambient air, either because they are hygroscopic or because of exposure torain. This requires a further classification of thermal conductivities for masonry materials according to thedegree of exposure. The basic hypothesis, as expressed in Table A3.2, is that a standard moisture contentcan be attributed to brickwork and concrete according to whether the material is in a protected or exposedcondition. The Guide gives the following definitions of these conditions:
‘Protected’ covers internal partitions, inner leaves separated from outer leaves by a continuousairspace, masonry protected by tile hanging, sheet cladding or other such protection, separated bycontinuous airspace.
‘Exposed’ covers masonry directly exposed to rain, unrendered or rendered. The standard moisturecontents are to be used throughout the UK without further corrections for macro- or micro-climatic

Section Three (CIBSE), Page 19
corrections.
The vapour resistivities in Table A10.4 are classed under minimum or typical. According to theGuide:
(‘minimum values’) are the smallest values found in the relevant literature and should not be used forgeneral calculations. ‘Typical values’ are taken from the middle range of values for each materialand may be used for calculation in the absence of more specific data.
The meaning of this classification becomes unclear when the accompanying thermal conductivitiesare examined. The values for brick and concrete clearly relate to the standard moisture content for exposedconditions (Table A3.1). The conductivities for other materials are in agreement with those in Table A3.22for dry or air-dry conditions. The interpretation of ‘typical vapour resistivity’ is therefore not obviouslyrelated to moisture content or degree of exposure or, importantly, the degree of condensation risk.
With respect to radiative heat transfer from building surfaces, only two classes of materials are distin-guished for the purposes of attributing emissivity values. These are common building materials, generallydeemed to be of high emissivity, and polished metal finishes of low emissivity. With respect to solarabsorptance for opaque materials, two classes of surfaces are distinguished: dark or light coloured. Therepresentative values given in Table A3.15 used in deriving the thermal transmittances and admittances ofthe constructions quoted in Tables A3.16 to A3.21 are classified by construction element type (Walls, Sur-face Finishes, Roofs and Floors) except in the one case where the classification is by the generic materialtype (Insulation).
3.5.3 Sources of Data
The majority of thermal conductivities for masonry materials are derived from an empirical relation-ship between density and thermal conductivity. The source of this relationship is not referenced in the textof section A3. As noted above, the thermal conductivities and other properties of materials contained insection A3 are drawn mainly from historical data. Examination of Table A3.22 shows that the test condi-tions under which the thermal properties were measured are unknown or incomplete in most cases. Thereare also many instances of values being identified as representative and for use in the absence of preciseinformation. Further information on the thermal conductivities of commonly used insulating materials athigher temperatures is given in Table C3.2. The values are otained from section A3 and BS 3958 [2]. Thesoil conductivities listed in Table C3.21 are from reference [3].
Specific heat values are quoted in Table A3.15. There is no mention of the source of these values.The water vapour resistances appearing in Table A10.4 are attributed to two sources [4 & 5]. The filmvapour resistances appearing in Table A10.6 are not referenced. Equilibrium moisture contents for somematerials are quoted in Table A10.1, and the source is cited [6]. The standard moisture contents formasonry materials are based on the empirical work of Arnold [7]. Where the thermal conductivity is mea-sured at other than the standard moisture content, it is to be corrected to the latter value by use of the empir-ical correction factors in Table A3.23 as proposed by Jakob [8].
Longwav e emissivity values, normal to the surface, are given in Table C3.7. Correction factors forhemispherical emissivities are also quoted. The contents of the Table are unreferenced. For the purposes ofcalculating building heat losses, materials are either given a high emissivity of 0.9 or a low emissivity of0.05. No particular reference for this choice of values is given, but the implication is that a higher degree ofaccuracy is not required in calculating the thermal performance of building constructions.
Opaque surface solar absorptance enters into the precalculated values of sol-air temperature given inTable A2.33. In calculating these temperatures, the values of solar absorptance are taken as 0.9 for dark sur-faces and 0.5 for light surfaces. No reference is given for these values but examination of the 1970 Guideshows that the values are taken from Table A6.14 for building surfaces when dirty. These represent ‘in-use’surfaces and not laboratory clean specimens. The value of 0.8 for medium dirty surfaces has been dropped.Solar reflectance appears in the context of ground reflected solar radiation in Section A2 where it is given ina very simplified form. Ground reflection factors are quoted in Table A2.31 with one of two values, either0.5 for arid tropical localities or 0.2 elsewhere. There is no allowance for angle of incidence. The sourceof these values is not referenced but they are identical to those quoted in the 1970 Guide.
For glass, solar transmittance, absorptance and reflectance near normal incidence is given in TableA5.2. No source is quoted, but manufacturers are recommended as the source of more detailed data.

Section Three (CIBSE), Page 20
3.5.4 Test Methods
With respect to conductivity, the data in section A3 are historical or based on empirical relations withan incomplete record of, or reference to, the test conditions and methodology. For this reason it is difficultto comment on the underlying test method. However, it is stated that any future values to be incorporatedin section A3 will have to be determined using the guarded or unguarded hot plate apparatus in accordancewith BS 874 [9]. This Standard also covers methods suitable for measurements on high temperature insula-tions and on soils in situ. Section A3 recommends the acceptance of measurements only when carried outby a laboratory accredited by the British Calibration Service now under NAMAS [10]. This seems not todistinguish between calibration and testing as accredited by NATLAS [11]. A caveat is also given on qual-ity assurance, in that the test sample should be representative of the actual product which will be supplied.On the basis of the work of Jespersen [12], it is recommended that the thermal conductivities of masonrymaterials should be derived from measurements made in the moisture content range of 1-5% by volume.This is to ensure that the Jakob correction will not lead to an erroneous result particularly where the mea-surements are carried out on test specimens in the dry state. Finally, reference is made to the thermal con-ductance testing of complete or almost complete constructions. The absence of a precise UK standard isgiven as the reason for expressing doubt over thermal properties determined in this way. It is also noted thatthe Jakob correction cannot be applied to thermal conductance test measurements. A set of measurementsat the minimum of three moisture contents spanning the standard moisture content is recommended.
For specific heat there is no reference to any test method, and BS 874 offers only the broadest ofguidance. With water vapour transmission, examination of the source literature shows that some of the datawere derived using dry- and/or wet-cup techniques but under a variety of conditions [4]. No method is men-tioned in the other reference [5]. With moisture content, the weight of a sample of wet material is comparedwith the dry weight.
No test method is identified for longwav e emittance or shortwav e absorptance.
3.5.5 Use of Data
The general context of all thermal properties is steady state heat transfer calculation. As noted above,Section A3 gives values of bulk density and thermal conductivity for a broad range of materials in TableA3.22, and values modified for standard moisture content for masonry materials in Table A3.1. It is, how-ev er, the representative subset in Table A3.15 that is intended to be used in the calculation of U- and Y-val-ues. The computation of the thermal resistance of non-homogeneous and heat-bridged constructions fromthe properties of the individual material components is recognised as being complicated. Nevertheless, the1980 edition of Section A3 is the first edition to incorporate a simple calculation method for dealing withthermal bridges. It is, therefore, still proposed that the thermal performance of building constructions becomputed from the individual properties of their component material parts, albeit from a modified subset.
The vapour resistivities and resistances are intended to be used for simple steady state (non-condens-ing) calculations of moisture transmission through building structures.
3.5.6 References
1. CIBSE Guides A2, A3, A5, A10 & C3, Chartered Institution of Building Services Engineers, Lon-don, 1980, 1982 and 1986.
2. BS 3958, ‘Thermal insulating materials’ (6 parts).
3. Mochlinski K and Gosland L ‘Field Evidence on Soil Properties Affecting Cable Ratings’, ERA70-88, Electrical Research Station, 1970.
4. Prangnell R D ‘The water vapour resistivity of building materials: a literature survey’ Materiaux etConstructions V4(24), November 1971.
5. ‘Condensation’, Digest 110 Building Research Establishment, 1972.
6. Johansson C H ‘Moisture transmission and moisture distribution in building materials’ TechnicalTranslation TT 189 National Research Council, Canada.
7. Arnold P J ‘Thermal Conductivity of Masonry Materials’ Current Paper CP 1/70 BuildingResearch Establishment, 1970.

Section Three (CIBSE), Page 21
8. Jakob M Heat Transfer, Part 1 Chapman Hall, London, 1949.
9. BS 874 ‘Methods for determining thermal insulating properties with definitions of thermal insulatingterms’ Nov. 1973 with amendment 3006, Aug. 1979.
10. NAMAS document M1 ‘Introducing NAMAS National Physical Laboratory, Middlesex, 1985.
11 NATLAS document N1 ‘NATLAS Accreditation Standard’ National Physical Laboratory, Middle-sex, 1986.
12. Jespersen H B ‘Thermal Conductivity of Moist Materials and its Measurement’ JIHVE V21,pp157-74, August 1953.
Section Three (CSTC), Page 22
3.6 CSTC, Belgium
3.6.1 General Observations
This database has been derived to provide a common, verified set of values for use in calculationscarried out in accordance with the requirements of the Thermal Regulation for new dwellings adopted on29 February 1984 by the Executive of the Flemish speaking region of Belgium. This regulation, which con-cerns thermal insulation, requires U-values to be calculated and submitted along with the application for abuilding permit. Although only two thermal calculation procedures are allowed, it was recognised that thewide variation in available values for thermal properties being used in calculations made the assessment ofsubmissions difficult. Hence, there was a need to produce a set of agreed values to be used with the speci-fied calculation procedures.
The values for both thermal and water vapour transmission calculations are listed together. The prop-erties for any building material listed can be read off in a single line. Although not included in the materialprovided, the accompanying documentation refers to the fact that tables of precalculated U-values for dif-ferent types of partitions are also available to designers. Preference is given to values appearing in BelgianStandard NBN B62-002 [1]. Only three other sources are recognised for the purposes of providing addi-tional values, chiefly, but not exclusively, for moisture transmission properties [2, 3 & 4]. A useful featureof this database is that the source of the values for each material is quoted, although only four sources areinvolved.
3.6.2 Classifications
The database is divided into a series of sections, each identified with a particular building materialtype. Within each section, values are listed against the various forms in which the material may appear. Asubclassification of thermal properties according to whether they apply to inside or outside use is enforced,whether appropriate or not to the use of the particular material. Where a material is not suitable for outsideuse, it is positively identified as being unsuitable - but only if a value for the dry state is quoted. Inside useis appropriate to any layer which cannot be wetted by rain or which may dry to hygroscopic equilibriumafter an initially high moisture content. Outside use applies to any layer that can be wetted by rain.
Non-homogeneous materials, for which thermal conductivity is not a defined property, are listed in aseparate section. Here, the values of thermal resistance and the associated thickness of the manufacturedunit are recorded instead. Examination of this section reveals that it refers to products containing voids orcomposed of different material layers. Nevertheless, a material such as cellular concrete appears in thehomogeneous material section where it is associated with both thermal conductivity and thermal resistancevalues for a known thickness. Materials which support modes of heat transfer other than conduction aregenerally included with those which do not. Hence, the values of conductivity shown include values ofapparent conductivity. In addition to wet- and dry-cup values for the dimensionless water vapour diffusionresistance factor µ or, for materials without a conveniently defined thickness d (m), of the product µ × d ,there is an additional subclass of values of µ × d which take account of joints and leakages for the purposesof practical calculations.
3.6.3 Sources of Data
Three sources are acknowledged for thermal conductivity and specific heat [1, 2 & 3]. The moisturetransmission and content data are attributed to NBN B62-002 and three other sources [2, 3 & 4]. In the caseof longwav e emissivity and shortwav e absorptivity no source is given.
3.6.4 Test Methods
No test methods are identified for thermal conductivity. Howev er, direct communication with CSTChas established that this parameter is based on NBN B62-200, NBN B62-201 and B62-203. Allied densitymeasurements are carried out according to Belgium Technical specifications STS 08.82.41 and STS08.82.5. No test method is identified for specific heat, moisture content or water vapour transmission. Forthe latter, direct communication with CSTC revealed that diffusion resistance factor measurements are car-ried out according to DIN 52615.
Section Three (CSTC), Page 23
3.6.5 Use of Data
As noted earlier, the purpose of this database is specifically related to the need to provide explicit cal-culations of heat losses and condensation risk for new dwellings when applying for a building permit. Assuch, the data set provides a common, verified set of values for use in calculation in accordance with therequirements of the Thermal Regulation adopted by the Executive of the Flemish speaking region of Bel-gium on 29 February 1984. The Regulation further stipulates the methods of calculation, and only twomethods are recognised, namely K 70 and Be 500.
3.6.6 References
1. Belgium Standard NBN B62-002, Thermische geleidbaarheid van de bouwmaterialen/Conductivitiesthermiques des materiaux de construction, Brussel 1980.
2. van Hees R ‘Eigenschappen van bouwen isolatiematerialen’, No.9, 3eme edition, Publie par le Sticht-ing Bouwresearch.
3. Hens H ‘Catalogue des properties hygothermiques des materiaux de construction et d’isolation’, Pub-lie par les Services de Programmation de la Politique Scientifique, 1984.
4. Uyttenbroek J and Carpentier G ‘Coefficient de conduction de la vapeur d’eau Delta et facteur deresistance a la diffusion Mu des materiaux de construction’, Cours - conferences No.35 du CSTC,1983.

Section Three (DOE-2), Page 24
3.7 DOE-2, USA
3.7.1 General Observations
This database, obtained from the Lawrence Berkeley Laboratory, contains values of thickness, bulkdensity, specific heat, thermal conductivity and thermal resistance for building and insulating materials.Each entry for a given material is associated with a single value for each property. Not all the entries arecomplete. Direct enquiry to the Lawrence Berkeley Laboratory has established that the materials propertieswere compiled by a student 11 years ago (his whereabouts is now unknown). It is known that, for the mostpart, the data are based on information developed by ASHRAE but, unfortunately, there is now no docu-mentary evidence of the exact references for the data. The numerical values are quoted in Imperial units.Conversion to SI units is therefore required to bring them into line with other databases.
3.7.2 Classifications
The database is divided into listings for building materials and for insulating materials. A third list-ing, for air films and spaces, also exists. The entries for building materials are listed basically by productform in alphabetic order. Those for insulation materials are listed by generic material type but not in alpha-betic order. In each listing, values are listed against the various forms and thicknesses in which the productappears. The separate listing of insulation materials does not appear to be a recognition of the concept ofapparent thermal conductivity. The values quoted show no variation with thickness, and there is no informa-tion on other non-linear behaviour such as, for instance, variation with density or temperature. There is alsono separate section for non-homogeneous materials. Examination of the database shows that building prod-ucts such as blocks with voids or insulation fillings appear alongside homogeneous products, with both athermal conductivity and a thermal resistance quoted. Clearly, in the case of non-homogeneous products,the thermal conductivity quoted is peculiar to the product form as, indeed, is the thermal resistance.
3.7.3 Sources of Data
With conductivity and specific heat, the listings are extracted from a single document [1]. However,as noted earlier, no record can be found of the source references for the values in this document or else-where. There are no data for vapour transmission, moisture content, longwav e emissivity and shortwav eabsorptivity.
3.7.4 Test Methods
No test methods are specified.
3.7.5 Use of Data
If based on the work of ASHRAE 11 years ago, it can be inferred that the data are intended for use inmanual thermal calculations.
3.7.6 References
1. DOE-2 Reference Manual Lawrence Berkeley Laboratory, Report No.LBL-8706, Rev.4, May 1984.
Section Three (ESP), Page 25
3.8 ESP, UK
3.8.1 General Observations
This database, obtained from the Energy Simulation Research Unit of the University of Strathclyde,contains values of thermal conductivity, bulk density, specific heat capacity, longwav e emissivity, shortwav eabsorptivity and vapour diffusivity for a range of building and insulating materials. Each entry for a givenhomogeneous material is associated with a single value for each property. The data-set was compiled in1976 by reviewing the (then) IHVE guide, various technical publications and manufacturers’ catalogues.Only those materials for which the various sources were in agreement were included in the final data-set.Unfortunately the process documentation has been lost and so the original source of the entries areunknown.
3.8.2 Classifications
The database is divided into 14 classifications as follows:
AsbestosAsphalt and BitumenBrickCarpetConcreteEarthGlassInsulationMetalPlasterScreeds and RendersStoneTilesWood
with some 108 materials arranged in alphabetical order. No information is given on the variation of proper-ties with temperature or moisture content.
3.8.3 Sources of Data
All data were extracted from a single document [1]. However, as noted earlier, no record can befound of the source references for the values in this document or elsewhere.
3.8.4 Test Methods
No test methods are specified.
3.8.5 Use of Data
The data are intended for use with the ESP system, and to this end a database management programexists which allows the materials to be combined into multi-layered constructions for use at building defini-tion time.
3.8.6 References
1. ESP Reference Manual Energy Simulation Research Unit, University of Strathclyde, September1989.
Section Three (France), Page 26
3.9 France
3.9.1 General Observations
This database, obtained from the CSTB, contains values of bulk density and thermal conductivity forbuilding and insulating materials. Each material is associated with a single value of thermal conductivity.The temperature limits for use of the listed values are -20°C to 30°C [1]. Explanatory notes are included inthe listings. Standards relevant to material specifications are noted. The text accompanying this databasedraws attention to further extensive listings of the thermal resistances of masonry walls, hollow concretefloors, etc. In other words, extensive pre-calculated thermal resistances for building constructions are avail-able.
3.9.2 Classifications
The entries in this database are by broad generic building material type. Within each entry, values arelisted against the various forms in which the material appears. There is no separate section for non-homoge-neous materials. Examination of the database shows that materials for which the thermal conductivity is anapparent property are included. This is made clear in the one particular case of stonework including joints.
3.9.3 Sources of Data
Thermal conductivity values are attributed to a single French Standard [2]. The other properties arenot referenced.
3.9.4 Test Methods
No test methods are identified.
3.9.5 Use of Data
The data are intended for use in the calculation of steady state thermal transmittances.
3.9.6 References
1. IEA Annex XIV, ‘Condensation and Energy: 1. Material Properties’, Laboratorium voor Bouwfysica,Katholieke Universiteit Leuven.
2. DTU, Regles Th-K77, Cahiers du CSTB, Cahier 1478, Nov.1977.
Section Three (Germany), Page 27
3.10 Germany
3.10.1 General Observations
This database contains values of bulk density, thermal conductivity and vapour diffusion resistancefor building and insulating materials. Each material is associated with a single value of thermal conductiv-ity. In general, the vapour diffusion resistance is represented by both a lower and upper value. The tempera-ture limits for use of the listed values are -20°C to 30°C [1]. Standards relevant to particular material speci-fications are comprehensively noted in the listing. A series of explanatory notes is appended which arereferred to in the listing.
3.10.2 Classifications
The entries in this database are classed by constructional element type in some cases, and by genericbuilding material type in others. Within each class, values are listed against the various forms in which therelevant material appears. There is no separate section for non-homogeneous materials. Materials forwhich the thermal conductivity is an apparent property are included without comment.
3.10.3 Sources of Data
Thermal conductivity and vapour diffusion resistance values are attributed to a single German Stan-dard [2].
3.10.4 Test Methods
No test methods are identified.
3.10.5 Use of Data
The data are intended for use in the calculation of steady state thermal transmittances.
3.10.6 References
1. IEA Annex XIV, ‘Condensation and Energy: 1. Material Properties’, Laboratorium voor Bouwfysica,Katholieke Universiteit Leuven.
2. DIN 4108, Warmeschutz im Hochbau, Warme und feuteschutztechnische Kenwerte, August 1981.
Section Three (The Netherlands), Page 28
3.11 The Netherlands
3.11.1 General Observations
This database contains a wide number of properties. In addition to the more commonly quoted prop-erties associated with the transmission of heat and water vapour through building and insulating materials,it also lists values for the thermal coefficient of linear expansion, the equilibrium moisture content as afunction of humidity, irreversible shrinkage due to drying and modulus of elasticity. The listed values applyto materials at normal environmental temperatures. Emissivities are quoted for 0°C to 200°C; otherwise thetemperature limits for use of the listed values are -10°C to 30°C [1].
The change in thermal conductivity of insulating plastic foams as the Freon gas disappears over timeis specifically noted.
3.11.2 Classifications
The database is divided into three main sections identified respectively with thermal properties,hygrometric properties and the properties of thermal expansion, elastic modulus and irreversible shrinkage.Additional smaller tabulations list longwav e emissivities for surfaces, thermal conductivities of gases andhygrometric properties for vapour barriers.
The entries in each of the three main sections are listed identically by broad generic building materialtype. Within each entry, values are listed against the various forms in which the material appears, althoughsome of the forms may not appear in all lists. In each case, the listing of materials and their densities isrepeated. In the case of thermal conductivity, there is a subdivision of values into those for use in indoorconditions and those for use in outdoor conditions. Examination of the database also shows that materialsfor which the thermal conductivity is an apparent property are included. However, there is no reference toapparent thermal conductivity as such. There is no separate section for non-homogeneous materials.
The listings are accompanied by a few explanatory footnotes. One of those to the hygrometric prop-erties listing is of interest as it draws attention specifically to the strong rise in permeability of certain tim-ber products above a relative humidity of 60%.
3.11.3 Sources of Data
Thermal conductivity, specific heat, vapour transmission and long-wav e emissivity values appear in asingle report [2]. Moisture content values for indoor use are attributed to any material layer which cannotbe wetted by rain or which will come to hygroscopic equilibrium with the environment. The values for out-door use are to be attributed to any material wetted by rain [3]. There is no reference to shortwav e absorp-tivity.
3.11.4 Test Methods
No test method is identified for any parameter.
3.11.5 Use of Data
The data are usable for both steady state and dynamic calculations.
3.11.6 References
1. IEA Annex XIV, ‘Condensation and Energy: 1.Material Properties’ Laboratorium voor Bouwfysica,Katholieke Universiteit Leuven.
2. ‘Eigenschappen van bouwen isolatiematerialen’ Report no.17, Stichting Bowresearch.
3. Belgium Standard NBN B62-002, Thermische geleidbaarheid van de bouwmaterialen - Conductivi-ties thermiques des materiaux de construction, 1980.
Section Three (Italy), Page 29
3.12 Italy
3.12.1 General Observations
This database contains values of bulk density and thermal conductivity for building and insulatingmaterials and thermal conductances for some non-homogeneous products. It is the only current databaseexamined (apart from DOE-2) which is not quoted in SI units. The introductory heading to the listing statesthat the values are to be taken as representing conditions of normal humidity and not exposed to badweather unless otherwise stated. The temperature limits for use of the listed values are -10°C to 30°C [1].
3.12.2 Classifications
The entries in this database are by building material type simply listed alphabetically. While there isno general subdivision of values into those for use in indoor conditions and those for use in outdoor condi-tions, some materials are identified with both an internal and an external value of thermal conductivity.There is a separate section for non-homogeneous materials for hollow brick and blockwork. The dimen-sions and geometry of each manufactured unit are shown associated with a value of thermal conductance.Examination of the database shows that materials for which the thermal conductivity is an apparent prop-erty are included. However, there is no reference to apparent thermal conductivity as such.
3.12.3 Sources of Data
Thermal conductivity values appear in a single Italian Standard [2]. Contrary to what has been statedelsewhere [1], the listing does distinguish between internal and external climatic conditions with respect tohumidity and, hence, moisture content.
3.12.4 Test Methods
No test methods are identified.
3.12.5 Use of Data
The data are intended for use in the calculation of steady state thermal transmittances.
3.12.6 References
1. IEA Annex XIV, ‘Condensation and Energy: 1. Material Properties’, Laboratorium voor Bouwfysica,Katholieke Universiteit Leuven.
2. Italian Standard UNI 7357.
Section Three (India), Page 30
3.13 India
3.13.1 General Observations
The context of this database differs from most of the others examined in that the main problem ofthermal design is to minimise solar heat gain rather than to prevent heat loss. Hence the thermal propertiesquoted are for a mean temperature of 50°C which is appropriate to the tropical Indian climate.
This database contains values of bulk density, thermal conductivity and specific heat capacity forbuilding and insulating materials. It refers to a relatively limited set of materials that are appropriate to thetypes of construction found in India. A single value for each property is attributed to each material. List-ings also exist for the thermal performance of walls and roofs, both flat and sloping. These include U-valuesand other factors useful in the calculation of fabric solar gain [1].
3.13.2 Classifications
Entries are listed either under building materials or insulating materials. Each entry is numbered sep-arately, both for different materials and variants of the same material. The entries do not follow alphabeti-cally. Examination of the database shows that materials for which the thermal conductivity is an apparentproperty are included. However, there is no reference to apparent thermal conductivity as such, nor any ref-erence to non-homogeneous materials.
3.13.3 Sources of Data
Thermal conductivity and specific heat values are attributed to a single Indian Standard [2]
3.13.4 Test Methods
No test methods are referenced although the test methods for determining thermal conductivity arefor materials in the dry state.
3.13.5 Use of Data
The data are intended for use in the calculation of steady state thermal transmittances and in pseudosteady state heat transfer calculations for solar gain.
3.13.6 References
1. Building Digest 138, ‘Thermal Performance of Wall and Roof Sections’, Central Building ResearchInstitute, Roorkee, India, February 1980.
2. IS:3792-1978, ‘Revised guide for heat insulation of non industrial buildings’, Indian Standards Insti-tution, New Delhi, India.
3. IS:3346-1980, ‘Guarded Hot Plate Apparatus’, Indian Standards Institution, New Delhi, India.
4. IASTM C177-1966, ‘Test Method for Steady-State Heat Flux Measurements and Thermal Transmis-sion Properties by means of a Guarded Hot Plate Apparatus’, American Society for Testing Materi-als, Philadelpia, USA.
Section Three (Leeds University), Page 31
3.14 Leeds University
3.14.1 General Observations
Although not a database in the same sense as the others mentioned above (data are not collectedtogether in a single document or computer database), many measurements have been carried out by staff atLeeds University, particularly on concrete and mortar [1,2,3]. Results give conductivity for a range of den-sities and moisture content of each material. Where data are expressed at the ‘standard’ 3% moisture con-tent, corrections were made using the Jakob correction factors.
3.14.2 Classifications
Results are often presented in graphical format, with measured values of conductivity given againstdifferent density values. Some tabular values are given, with each entry being listed by mortar grade, mixproportions (cement:sand), density, moisture content and resulting conductivity.
3.14.3 Sources of Data
All data are obtained directly from measurement.
3.14.4 Test Methods
All measurements are made to BS 874, in a plain hot plate apparatus. Apparatus calibration was regu-larly monitored by duplicate testing of selected samples at a BCS laboratory.
3.14.5 Use of Data
The data are not intended for any specific purpose. The lack of any surface properties makes theirwidespread use limited.
3.14.6 References
1. PhD Thesis. Aspects of mix proportioning and moisture content on the thermal conductivity oflightweight aggregate concretes. J.A. Tinker, University of Salford, 1984.
2. Tinker, J.A. & O’Rouke, A. Development of a low thermal conductivity building mortar. SecondEurop. Conf. on Architecture, Paris, 4th - 8th Dec., 1989.
3. Tinker, J.A. 1989 Personnel communication.
Section Four, Page 32
Section Four: The Merging Process and the Final Data-sets
4.1 Computational Context
A distinction can be made between the context of design calculations and that of calculationsintended to simulate reality. Design calculations are carried out to ensure compliance with set target valuesfor conditions as specified in building regulations and codes. They only make sense, of course, if they arereferred to a single database of material properties. As a result, standard lists of values have been generatedin many countries to support design calculations.
The context of such calculations is not to simulate any particular real behaviour, but to minimise therisk of failure such as excessive heat loss or the occurrence of condensation. In practice, the choice of cal-culation procedures, target conditions and associated standard lists of material property values reflect theneed for robust methods of risk assessment that implicitly accept the inherently uncertain nature of buildingmaterial property values. The disadvantage of such procedures is that they are not capable of providingmuch insight into the detailed hygrothermal behaviour of buildings, particularly where new materials, sys-tems or situations may be involved. Nevertheless, the inherent uncertainty of present building materialproperty values has to be recognised as also placing a limit on the accuracy with which any real situationcan be modelled, irrespective of the degree of accuracy of the computational model.
The recognition that all predictive methods concerning the behaviour of buildings and their compo-nents operate within a probabilistic context has been, and continues to be, a source of considerable interestand concern. A useful overview of the problem has been presented by Keeble [1]. Computational tech-niques also influence the choice of data. Given that design calculations have evolved within the context ofsimplified, steady state models, the range of properties required to be listed has been restrictive, and hasinfluenced the range and kind of test procedures currently in use. One aspect of this has been the movetowards the steady state testing of whole building assemblies, first in North America and latterly in Europe,as a preferred option to computing behaviour from individual material constituents.
The 1985 edition of the ASHRAE Handbook of Fundamentals departed from previous practice byremoving tables of calculated U-values for building assemblies in favour of placing reliance on U-valuesdetermined by calibrated or guarded hot box tests. The justification was based on the difficulty of calculat-ing the thermal performance of heat bridged assemblies. Irrespective of the merits of the argument, currenthot box test methods provide only steady state values of overall heat conductance for particular assemblies,not materials. This suggests that testing procedures may be becoming less helpful in providing data to meetthe needs of dynamic computer modelling.
4.2 The Merging Process
From consideration of the use context of the materials, and the reliability/scope of their underlyingtest procedures, the following mechanism was adopted for material grouping:
1. Materials with real conductivities which are not affected by moisture.
2. Materials with apparent conductivities which are not affected by moisture.
3. Materials with real conductivities which are strongly affected by moisture but whose vapour perme-abilities are not affected by moisture.
4. Materials with real conductivities which are not affected by moisture but whose vapour permeabili-ties are strongly affected by moisture.
Such a mechanism is strongly related to the reliability of the test procedures, with the certaintydecreasing from 1 to 4. For example the vapour permeability of type 4 materials is underestimated in cur-rent data bases for materials at high humidities. This mechanism gives rise to the following four materialcategories:
Category 1: Impermeables
Materials which act as a barrier to water in the vapour and/or liquid states and do not alter theirhygrothermal properties by absorbing or being wetted by water.
Category 2: Non-Hygroscopic
Lightweight insulations, such as mineral wools and foamed plastics, which display water vapour per-meability, zero hygroscopic water content and an apparent thermal conductivity, and which operate under

Section Four, Page 33
conditions of air-dry equilibrium normally protected from wetting by rain.
Category 3: Inorganic-Porous
Masonry and related materials which are inorganic, porous and may contain significant amounts ofwater due to hygroscopic absorption from the air or wetting by rain, which affects their hygrothermal prop-erties and their thermal conductivity in particular.
Category 4: Organic-Hygroscopic
Organic materials such as wood and wood based products which are porous and strongly hygroscopicand which display a highly non-linear water vapour permeability characteristic.
It is important to note that the data presented in the tables which follow hav e not been subject to anyverification procedure. They are merely the original data reorganised and reclassified.
Within each table, the ‘Source’ column refers to the original data-set from which the material entrywas extracted. The key letters are defined in Section 2.1. Owing to the large number of data points for simi-lar materials, but of different densities, from Leeds University, only a representative sample of their data ispresented.
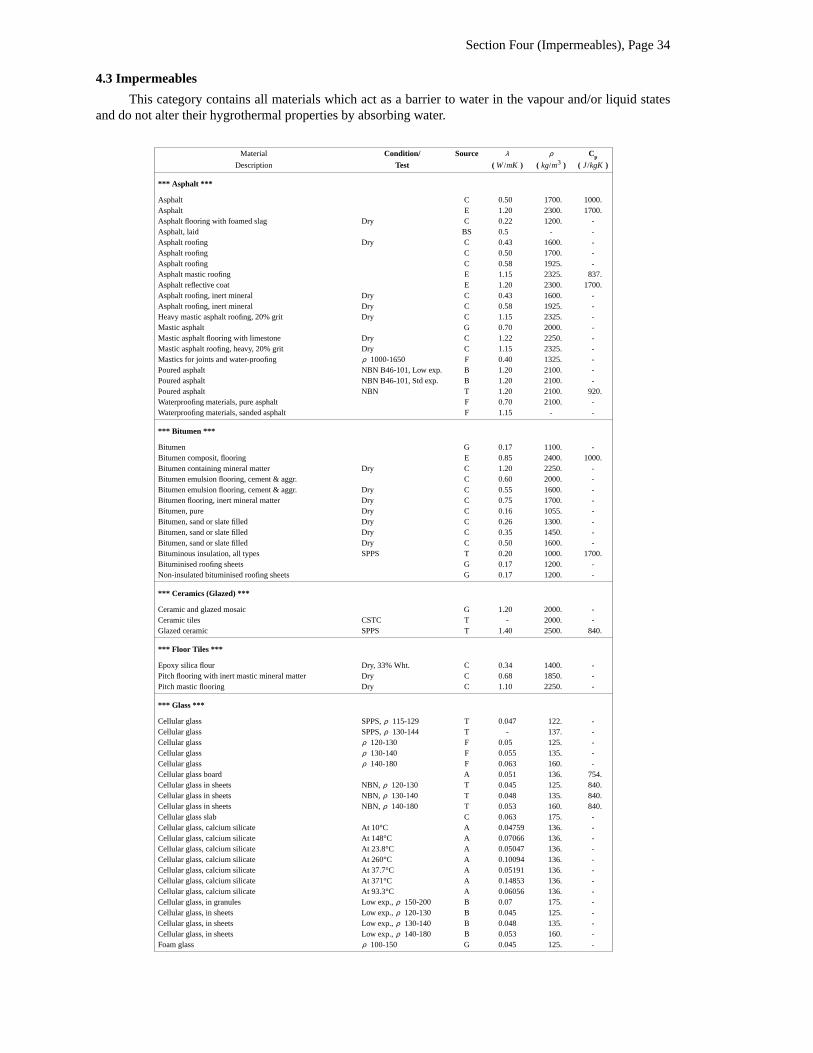
Section Four (Impermeables), Page 34
4.3 Impermeables
This category contains all materials which act as a barrier to water in the vapour and/or liquid statesand do not alter their hygrothermal properties by absorbing water.
Material Condition/ Source λ ρ Cp
Description Test ( W /mK ) ( kg/m3 ) ( J /kgK )
*** Asphalt ***
Asphalt C 0.50 1700. 1000.Asphalt E 1.20 2300. 1700.Asphalt flooring with foamed slag Dry C 0.22 1200. -Asphalt, laid BS 0.5 - -Asphalt roofing Dry C 0.43 1600. -Asphalt roofing C 0.50 1700. -Asphalt roofing C 0.58 1925. -Asphalt mastic roofing E 1.15 2325. 837.Asphalt reflective coat E 1.20 2300. 1700.Asphalt roofing, inert mineral Dry C 0.43 1600. -Asphalt roofing, inert mineral Dry C 0.58 1925. -Heavy mastic asphalt roofing, 20% grit Dry C 1.15 2325. -Mastic asphalt G 0.70 2000. -Mastic asphalt flooring with limestone Dry C 1.22 2250. -Mastic asphalt roofing, heavy, 20% grit Dry C 1.15 2325. -Mastics for joints and water-proofing ρ 1000-1650 F 0.40 1325. -Poured asphalt NBN B46-101, Low exp. B 1.20 2100. -Poured asphalt NBN B46-101, Std exp. B 1.20 2100. -Poured asphalt NBN T 1.20 2100. 920.Waterproofing materials, pure asphalt F 0.70 2100. -Waterproofing materials, sanded asphalt F 1.15 - -
*** Bitumen ***
Bitumen G 0.17 1100. -Bitumen composit, flooring E 0.85 2400. 1000.Bitumen containing mineral matter Dry C 1.20 2250. -Bitumen emulsion flooring, cement & aggr. C 0.60 2000. -Bitumen emulsion flooring, cement & aggr. Dry C 0.55 1600. -Bitumen flooring, inert mineral matter Dry C 0.75 1700. -Bitumen, pure Dry C 0.16 1055. -Bitumen, sand or slate filled Dry C 0.26 1300. -Bitumen, sand or slate filled Dry C 0.35 1450. -Bitumen, sand or slate filled Dry C 0.50 1600. -Bituminous insulation, all types SPPS T 0.20 1000. 1700.Bituminised roofing sheets G 0.17 1200. -Non-insulated bituminised roofing sheets G 0.17 1200. -
*** Ceramics (Glazed) ***
Ceramic and glazed mosaic G 1.20 2000. -Ceramic tiles CSTC T - 2000. -Glazed ceramic SPPS T 1.40 2500. 840.
*** Floor Tiles ***
Epoxy silica flour Dry, 33% Wht. C 0.34 1400. -Pitch flooring with inert mastic mineral matter Dry C 0.68 1850. -Pitch mastic flooring Dry C 1.10 2250. -
*** Glass ***
Cellular glass SPPS, ρ 115-129 T 0.047 122. -Cellular glass SPPS, ρ 130-144 T - 137. -Cellular glass ρ 120-130 F 0.05 125. -Cellular glass ρ 130-140 F 0.055 135. -Cellular glass ρ 140-180 F 0.063 160. -Cellular glass board A 0.051 136. 754.Cellular glass in sheets NBN, ρ 120-130 T 0.045 125. 840.Cellular glass in sheets NBN, ρ 130-140 T 0.048 135. 840.Cellular glass in sheets NBN, ρ 140-180 T 0.053 160. 840.Cellular glass slab C 0.063 175. -Cellular glass, calcium silicate At 10°C A 0.04759 136. -Cellular glass, calcium silicate At 148°C A 0.07066 136. -Cellular glass, calcium silicate At 23.8°C A 0.05047 136. -Cellular glass, calcium silicate At 260°C A 0.10094 136. -Cellular glass, calcium silicate At 37.7°C A 0.05191 136. -Cellular glass, calcium silicate At 371°C A 0.14853 136. -Cellular glass, calcium silicate At 93.3°C A 0.06056 136. -Cellular glass, in granules Low exp., ρ 150-200 B 0.07 175. -Cellular glass, in sheets Low exp., ρ 120-130 B 0.045 125. -Cellular glass, in sheets Low exp., ρ 130-140 B 0.048 135. -Cellular glass, in sheets Low exp., ρ 140-180 B 0.053 160. -Foam glass ρ 100-150 G 0.045 125. -
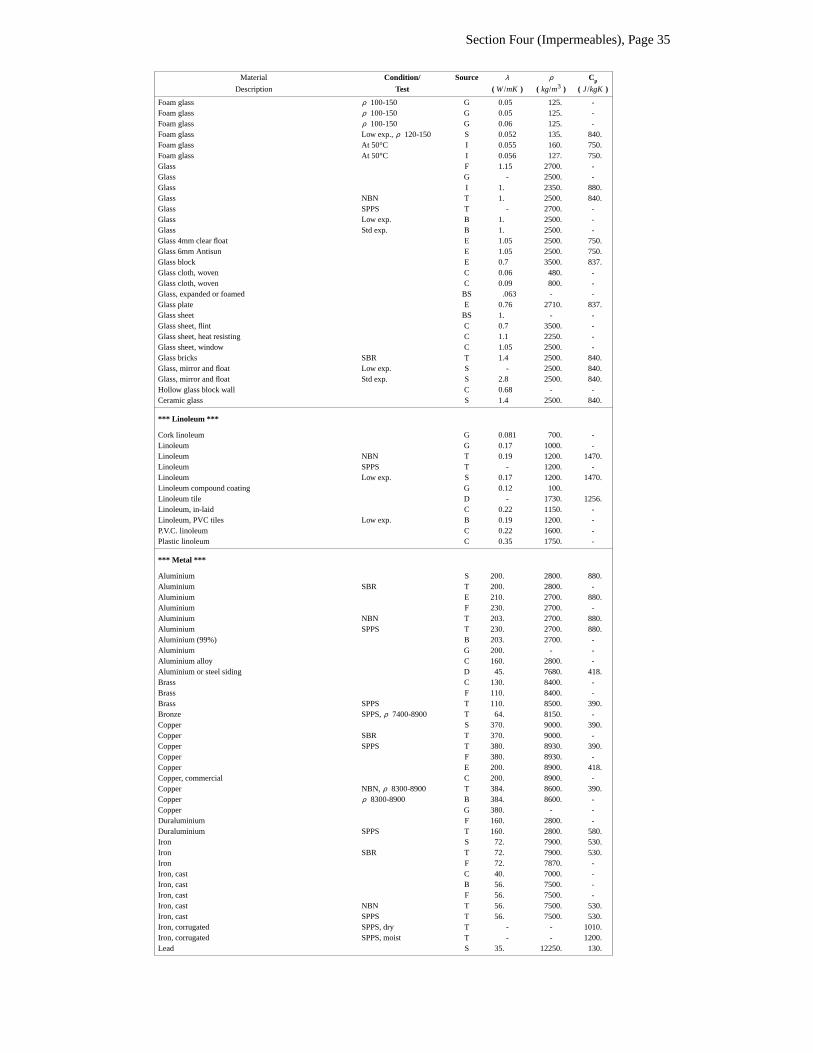
Section Four (Impermeables), Page 35
Material Condition/ Source λ ρ Cp
Description Test ( W /mK ) ( kg/m3 ) ( J /kgK )
Foam glass ρ 100-150 G 0.05 125. -Foam glass ρ 100-150 G 0.05 125. -Foam glass ρ 100-150 G 0.06 125. -Foam glass Low exp., ρ 120-150 S 0.052 135. 840.Foam glass At 50°C I 0.055 160. 750.Foam glass At 50°C I 0.056 127. 750.Glass F 1.15 2700. -Glass G - 2500. -Glass I 1. 2350. 880.Glass NBN T 1. 2500. 840.Glass SPPS T - 2700. -Glass Low exp. B 1. 2500. -Glass Std exp. B 1. 2500. -Glass 4mm clear float E 1.05 2500. 750.Glass 6mm Antisun E 1.05 2500. 750.Glass block E 0.7 3500. 837.Glass cloth, woven C 0.06 480. -Glass cloth, woven C 0.09 800. -Glass, expanded or foamed BS .063 - -Glass plate E 0.76 2710. 837.Glass sheet BS 1. - -Glass sheet, flint C 0.7 3500. -Glass sheet, heat resisting C 1.1 2250. -Glass sheet, window C 1.05 2500. -Glass bricks SBR T 1.4 2500. 840.Glass, mirror and float Low exp. S - 2500. 840.Glass, mirror and float Std exp. S 2.8 2500. 840.Hollow glass block wall C 0.68 - -Ceramic glass S 1.4 2500. 840.
*** Linoleum ***
Cork linoleum G 0.081 700. -Linoleum G 0.17 1000. -Linoleum NBN T 0.19 1200. 1470.Linoleum SPPS T - 1200. -Linoleum Low exp. S 0.17 1200. 1470.Linoleum compound coating G 0.12 100.Linoleum tile D - 1730. 1256.Linoleum, in-laid C 0.22 1150. -Linoleum, PVC tiles Low exp. B 0.19 1200. -P.V.C. linoleum C 0.22 1600. -Plastic linoleum C 0.35 1750. -
*** Metal ***
Aluminium S 200. 2800. 880.Aluminium SBR T 200. 2800. -Aluminium E 210. 2700. 880.Aluminium F 230. 2700. -Aluminium NBN T 203. 2700. 880.Aluminium SPPS T 230. 2700. 880.Aluminium (99%) B 203. 2700. -Aluminium G 200. - -Aluminium alloy C 160. 2800. -Aluminium or steel siding D 45. 7680. 418.Brass C 130. 8400. -Brass F 110. 8400. -Brass SPPS T 110. 8500. 390.Bronze SPPS, ρ 7400-8900 T 64. 8150. -Copper S 370. 9000. 390.Copper SBR T 370. 9000. -Copper SPPS T 380. 8930. 390.Copper F 380. 8930. -Copper E 200. 8900. 418.Copper, commercial C 200. 8900. -Copper NBN, ρ 8300-8900 T 384. 8600. 390.Copper ρ 8300-8900 B 384. 8600. -Copper G 380. - -Duraluminium F 160. 2800. -Duraluminium SPPS T 160. 2800. 580.Iron S 72. 7900. 530.Iron SBR T 72. 7900. 530.Iron F 72. 7870. -Iron, cast C 40. 7000. -Iron, cast B 56. 7500. -Iron, cast F 56. 7500. -Iron, cast NBN T 56. 7500. 530.Iron, cast SPPS T 56. 7500. 530.Iron, corrugated SPPS, dry T - - 1010.Iron, corrugated SPPS, moist T - - 1200.Lead S 35. 12250. 130.
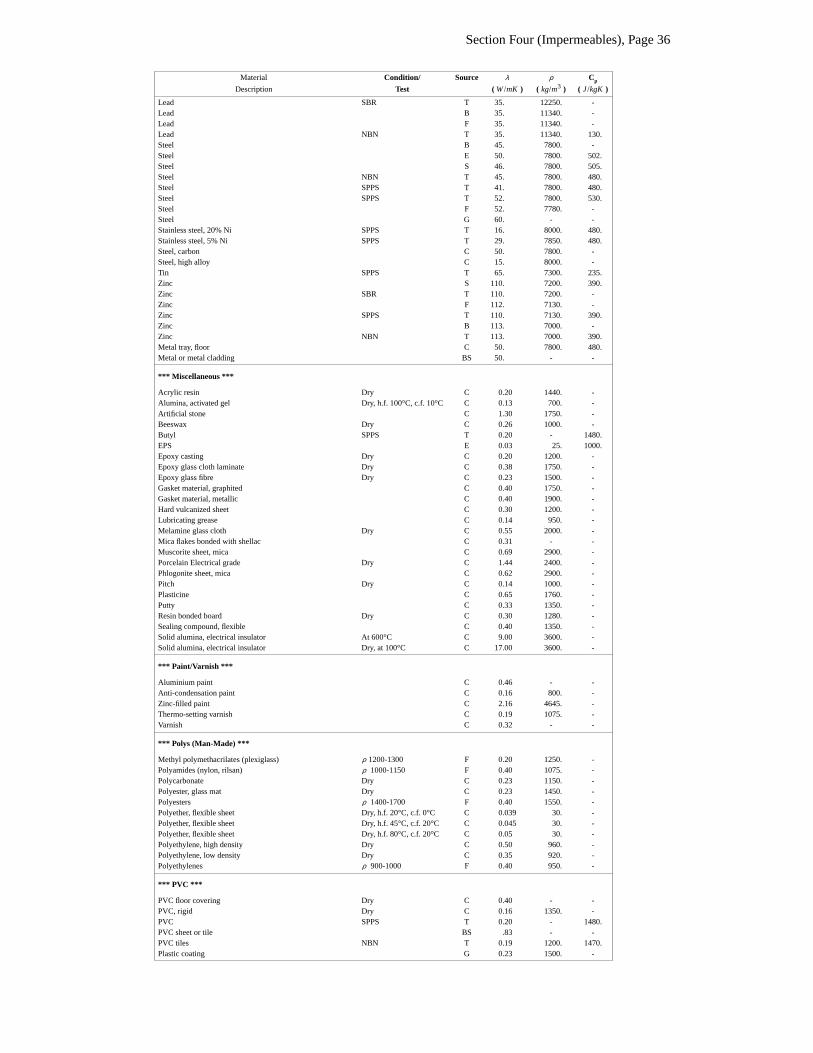
Section Four (Impermeables), Page 36
Material Condition/ Source λ ρ Cp
Description Test ( W /mK ) ( kg/m3 ) ( J /kgK )
Lead SBR T 35. 12250. -Lead B 35. 11340. -Lead F 35. 11340. -Lead NBN T 35. 11340. 130.Steel B 45. 7800. -Steel E 50. 7800. 502.Steel S 46. 7800. 505.Steel NBN T 45. 7800. 480.Steel SPPS T 41. 7800. 480.Steel SPPS T 52. 7800. 530.Steel F 52. 7780. -Steel G 60. - -Stainless steel, 20% Ni SPPS T 16. 8000. 480.Stainless steel, 5% Ni SPPS T 29. 7850. 480.Steel, carbon C 50. 7800. -Steel, high alloy C 15. 8000. -Tin SPPS T 65. 7300. 235.Zinc S 110. 7200. 390.Zinc SBR T 110. 7200. -Zinc F 112. 7130. -Zinc SPPS T 110. 7130. 390.Zinc B 113. 7000. -Zinc NBN T 113. 7000. 390.Metal tray, floor C 50. 7800. 480.Metal or metal cladding BS 50. - -
*** Miscellaneous ***
Acrylic resin Dry C 0.20 1440. -Alumina, activated gel Dry, h.f. 100°C, c.f. 10°C C 0.13 700. -Artificial stone C 1.30 1750. -Beeswax Dry C 0.26 1000. -Butyl SPPS T 0.20 - 1480.EPS E 0.03 25. 1000.Epoxy casting Dry C 0.20 1200. -Epoxy glass cloth laminate Dry C 0.38 1750. -Epoxy glass fibre Dry C 0.23 1500. -Gasket material, graphited C 0.40 1750. -Gasket material, metallic C 0.40 1900. -Hard vulcanized sheet C 0.30 1200. -Lubricating grease C 0.14 950. -Melamine glass cloth Dry C 0.55 2000. -Mica flakes bonded with shellac C 0.31 - -Muscorite sheet, mica C 0.69 2900. -Porcelain Electrical grade Dry C 1.44 2400. -Phlogonite sheet, mica C 0.62 2900. -Pitch Dry C 0.14 1000. -Plasticine C 0.65 1760. -Putty C 0.33 1350. -Resin bonded board Dry C 0.30 1280. -Sealing compound, flexible C 0.40 1350. -Solid alumina, electrical insulator At 600°C C 9.00 3600. -Solid alumina, electrical insulator Dry, at 100°C C 17.00 3600. -
*** Paint/Varnish ***
Aluminium paint C 0.46 - -Anti-condensation paint C 0.16 800. -Zinc-filled paint C 2.16 4645. -Thermo-setting varnish C 0.19 1075. -Varnish C 0.32 - -
*** Polys (Man-Made) ***
Methyl polymethacrilates (plexiglass) ρ 1200-1300 F 0.20 1250. -Polyamides (nylon, rilsan) ρ 1000-1150 F 0.40 1075. -Polycarbonate Dry C 0.23 1150. -Polyester, glass mat Dry C 0.23 1450. -Polyesters ρ 1400-1700 F 0.40 1550. -Polyether, flexible sheet Dry, h.f. 20°C, c.f. 0°C C 0.039 30. -Polyether, flexible sheet Dry, h.f. 45°C, c.f. 20°C C 0.045 30. -Polyether, flexible sheet Dry, h.f. 80°C, c.f. 20°C C 0.05 30. -Polyethylene, high density Dry C 0.50 960. -Polyethylene, low density Dry C 0.35 920. -Polyethylenes ρ 900-1000 F 0.40 950. -
*** PVC ***
PVC floor covering Dry C 0.40 - -PVC, rigid Dry C 0.16 1350. -PVC SPPS T 0.20 - 1480.PVC sheet or tile BS .83 - -PVC tiles NBN T 0.19 1200. 1470.Plastic coating G 0.23 1500. -

Section Four (Impermeables), Page 37
Material Condition/ Source λ ρ Cp
Description Test ( W /mK ) ( kg/m3 ) ( J /kgK )
PVC E 0.16 1379. 1004.
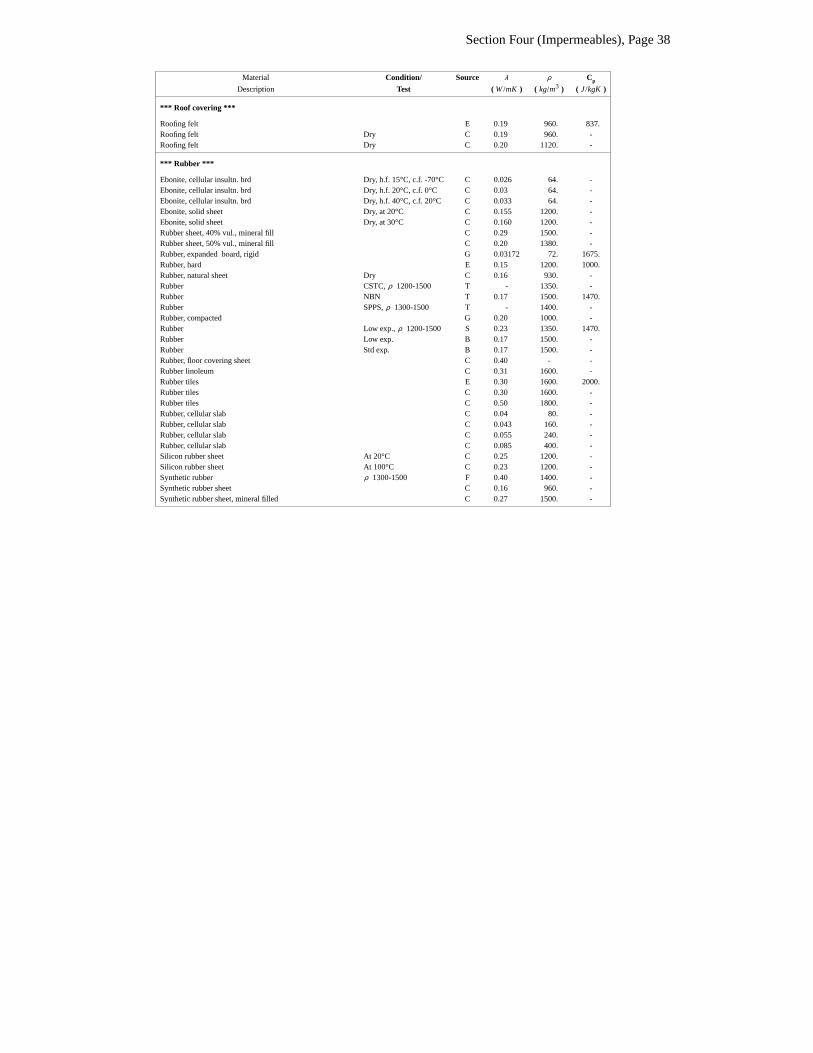
Section Four (Impermeables), Page 38
Material Condition/ Source λ ρ Cp
Description Test ( W /mK ) ( kg/m3 ) ( J /kgK )
*** Roof covering ***
Roofing felt E 0.19 960. 837.Roofing felt Dry C 0.19 960. -Roofing felt Dry C 0.20 1120. -
*** Rubber ***
Ebonite, cellular insultn. brd Dry, h.f. 15°C, c.f. -70°C C 0.026 64. -Ebonite, cellular insultn. brd Dry, h.f. 20°C, c.f. 0°C C 0.03 64. -Ebonite, cellular insultn. brd Dry, h.f. 40°C, c.f. 20°C C 0.033 64. -Ebonite, solid sheet Dry, at 20°C C 0.155 1200. -Ebonite, solid sheet Dry, at 30°C C 0.160 1200. -Rubber sheet, 40% vul., mineral fill C 0.29 1500. -Rubber sheet, 50% vul., mineral fill C 0.20 1380. -Rubber, expanded board, rigid G 0.03172 72. 1675.Rubber, hard E 0.15 1200. 1000.Rubber, natural sheet Dry C 0.16 930. -Rubber CSTC, ρ 1200-1500 T - 1350. -Rubber NBN T 0.17 1500. 1470.Rubber SPPS, ρ 1300-1500 T - 1400. -Rubber, compacted G 0.20 1000. -Rubber Low exp., ρ 1200-1500 S 0.23 1350. 1470.Rubber Low exp. B 0.17 1500. -Rubber Std exp. B 0.17 1500. -Rubber, floor covering sheet C 0.40 - -Rubber linoleum C 0.31 1600. -Rubber tiles E 0.30 1600. 2000.Rubber tiles C 0.30 1600. -Rubber tiles C 0.50 1800. -Rubber, cellular slab C 0.04 80. -Rubber, cellular slab C 0.043 160. -Rubber, cellular slab C 0.055 240. -Rubber, cellular slab C 0.085 400. -Silicon rubber sheet At 20°C C 0.25 1200. -Silicon rubber sheet At 100°C C 0.23 1200. -Synthetic rubber ρ 1300-1500 F 0.40 1400. -Synthetic rubber sheet C 0.16 960. -Synthetic rubber sheet, mineral filled C 0.27 1500. -
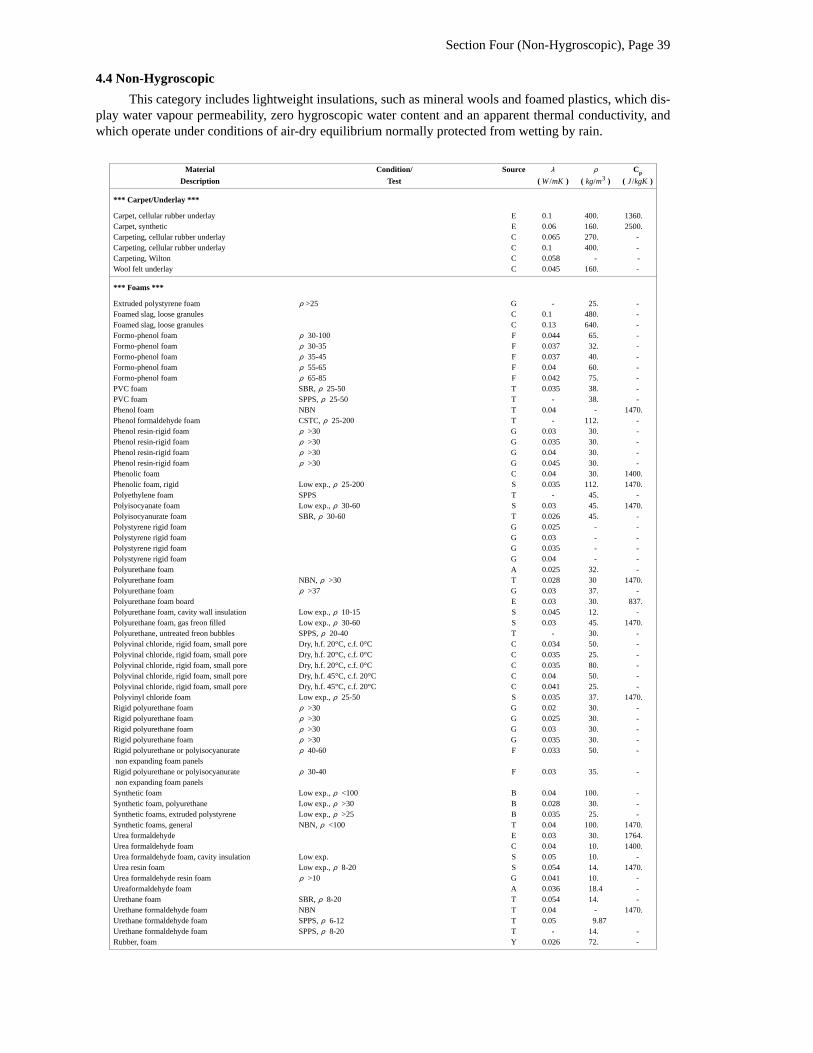
Section Four (Non-Hygroscopic), Page 39
4.4 Non-Hygroscopic
This category includes lightweight insulations, such as mineral wools and foamed plastics, which dis-play water vapour permeability, zero hygroscopic water content and an apparent thermal conductivity, andwhich operate under conditions of air-dry equilibrium normally protected from wetting by rain.
Material Condition/ Source λ ρ Cp
Description Test ( W /mK ) ( kg/m3 ) ( J /kgK )
*** Carpet/Underlay ***
Carpet, cellular rubber underlay E 0.1 400. 1360.Carpet, synthetic E 0.06 160. 2500.Carpeting, cellular rubber underlay C 0.065 270. -Carpeting, cellular rubber underlay C 0.1 400. -Carpeting, Wilton C 0.058 - -Wool felt underlay C 0.045 160. -
*** Foams ***
Extruded polystyrene foam ρ >25 G - 25. -Foamed slag, loose granules C 0.1 480. -Foamed slag, loose granules C 0.13 640. -Formo-phenol foam ρ 30-100 F 0.044 65. -Formo-phenol foam ρ 30-35 F 0.037 32. -Formo-phenol foam ρ 35-45 F 0.037 40. -Formo-phenol foam ρ 55-65 F 0.04 60. -Formo-phenol foam ρ 65-85 F 0.042 75. -PVC foam SBR, ρ 25-50 T 0.035 38. -PVC foam SPPS, ρ 25-50 T - 38. -Phenol foam NBN T 0.04 - 1470.Phenol formaldehyde foam CSTC, ρ 25-200 T - 112. -Phenol resin-rigid foam ρ >30 G 0.03 30. -Phenol resin-rigid foam ρ >30 G 0.035 30. -Phenol resin-rigid foam ρ >30 G 0.04 30. -Phenol resin-rigid foam ρ >30 G 0.045 30. -Phenolic foam C 0.04 30. 1400.Phenolic foam, rigid Low exp., ρ 25-200 S 0.035 112. 1470.Polyethylene foam SPPS T - 45. -Polyisocyanate foam Low exp., ρ 30-60 S 0.03 45. 1470.Polyisocyanurate foam SBR, ρ 30-60 T 0.026 45. -Polystyrene rigid foam G 0.025 - -Polystyrene rigid foam G 0.03 - -Polystyrene rigid foam G 0.035 - -Polystyrene rigid foam G 0.04 - -Polyurethane foam A 0.025 32. -Polyurethane foam NBN, ρ >30 T 0.028 30 1470.Polyurethane foam ρ >37 G 0.03 37. -Polyurethane foam board E 0.03 30. 837.Polyurethane foam, cavity wall insulation Low exp., ρ 10-15 S 0.045 12. -Polyurethane foam, gas freon filled Low exp., ρ 30-60 S 0.03 45. 1470.Polyurethane, untreated freon bubbles SPPS, ρ 20-40 T - 30. -Polyvinal chloride, rigid foam, small pore Dry, h.f. 20°C, c.f. 0°C C 0.034 50. -Polyvinal chloride, rigid foam, small pore Dry, h.f. 20°C, c.f. 0°C C 0.035 25. -Polyvinal chloride, rigid foam, small pore Dry, h.f. 20°C, c.f. 0°C C 0.035 80. -Polyvinal chloride, rigid foam, small pore Dry, h.f. 45°C, c.f. 20°C C 0.04 50. -Polyvinal chloride, rigid foam, small pore Dry, h.f. 45°C, c.f. 20°C C 0.041 25. -Polyvinyl chloride foam Low exp., ρ 25-50 S 0.035 37. 1470.Rigid polyurethane foam ρ >30 G 0.02 30. -Rigid polyurethane foam ρ >30 G 0.025 30. -Rigid polyurethane foam ρ >30 G 0.03 30. -Rigid polyurethane foam ρ >30 G 0.035 30. -Rigid polyurethane or polyisocyanurate ρ 40-60 F 0.033 50. -non expanding foam panelsRigid polyurethane or polyisocyanurate ρ 30-40 F 0.03 35. -non expanding foam panelsSynthetic foam Low exp., ρ <100 B 0.04 100. -Synthetic foam, polyurethane Low exp., ρ >30 B 0.028 30. -Synthetic foams, extruded polystyrene Low exp., ρ >25 B 0.035 25. -Synthetic foams, general NBN, ρ <100 T 0.04 100. 1470.Urea formaldehyde E 0.03 30. 1764.Urea formaldehyde foam C 0.04 10. 1400.Urea formaldehyde foam, cavity insulation Low exp. S 0.05 10. -Urea resin foam Low exp., ρ 8-20 S 0.054 14. 1470.Urea formaldehyde resin foam ρ >10 G 0.041 10. -Ureaformaldehyde foam A 0.036 18.4 -Urethane foam SBR, ρ 8-20 T 0.054 14. -Urethane formaldehyde foam NBN T 0.04 - 1470.Urethane formaldehyde foam SPPS, ρ 6-12 T 0.05 9.87Urethane formaldehyde foam SPPS, ρ 8-20 T - 14. -Rubber, foam Y 0.026 72. -

Section Four (Non-Hygroscopic), Page 40
Material Condition/ Source λ ρ Cp
Description Test ( W /mK ) ( kg/m3 ) ( J /kgK )
*** Gases ***
Air C 0.026 1.17 -Carbon dioxide C 0.017 1.84 -Hydrogen C 0.18 0.082 -
*** Glass Fibre/Wool ***
Glass fibre BS .04 - -Glass fibre quilt E 0.04 12. 840.Glass fibre, lightwt mats & quilts Conditioned, 40%rh C 0.032 65. -Glass fibre, lightwt mats & quilts Dry at 10°C C 0.04 12. -Glass fibre, lightwt mats & quilts Dry, h.f. 15°C, c.f. 0°C C 0.033 50. -Glass fibre, lightwt mats & quilts Dry, h.f. 40dg, c.f. 10°C C 0.036 50. -Glass fibre, lightwt mats & quilts Dry, h.f. 40dg, c.f. 10°C C 0.042 12. -Glass fibre, loose mats & quilts Dry, h.f. 200°C, c.f. 40°C C 0.053 130. -Glass fibre, loose mats & quilts Dry, h.f. 300°C, c.f. 40°C C 0.062 130. -Glass fibre, loose mats & quilts Dry, h.f. 400°C, c.f. 40°C C 0.075 130. -Glass fibre, loose mats & quilts Dry, h.f. 40°C, c.f. 10°C C 0.035 80. -Glass fibre, loose mats & quilts Dry, h.f. 90°C, c.f. 40°C C 0.039 80. -Glass fibre, loose mats & quilts Dry, h.f. 90°C, c.f. 40°C C 0.045 130. -Glass fibre, loose wool blanket Dry, h.f. 100°C, c.f. 25°C C 0.046 145. -Glass fibre, loose wool blanket Dry, h.f. 200°C, c.f. 25°C C 0.053 145. -Glass fibre, loose wool blanket Dry, h.f. 300°C, c.f. 25°C C 0.062 145. -Glass fibre, loose wool blanket Dry, h.f. 40°C, c.f. 25°C C 0.042 145. -Glass fibre, rigid pipe sections Dry, h.f. 100°C, c.f. 25°C C 0.042 160. -Glass fibre, rigid pipe sections Dry, h.f. 150°C, c.f. 25°C C 0.046 160. -Glass fibre, rigid pipe sections Dry, h.f. 200°C, c.f. 25°C C 0.052 160. -Glass fibre, rigid pipe sections Dry, h.f. 250°C, c.f. 25°C C 0.058 160. -Glass fibre quilt C 0.04 12. 840.Glass fibre slab C 0.035 25. 1000.Glass wool SPPS, ρ 10-14 T - 12. -Glass wool SPPS, ρ 20-150 T - 85. -Glass wool, unbonded I 0.043 69. 920.Glass wool, unbonded I 0.04 189. 920.Glasswool E 0.04 250. 840.Glass fibre, strawboard like Low exp., ρ 250-350 S 0.085 300. 2100.Resin bonded glass wool At 50°C I 0.04 16. 1000.Resin bonded glass wool At 50°C I 0.036 24. 1000.Semi-rigid panels and supple fibre F 0.041 - -matting in rock wool or glass woolFibreglass ρ 15-110 Y 0.03 60. -Mineral fibre, blanket, org. bonded At -31°C A 0.02740 48. 712.Mineral fibre, blanket, org. bonded At -31°C A 0.03028 24. 712.Mineral fibre, blanket, org. bonded At -31°C A 0.03461 12. 712.Mineral fibre, blanket, org. bonded At -17.7°C A 0.02884 48. 712.Mineral fibre, blanket, org. bonded At -17.7°C A 0.03605 12. 712.Mineral fibre, blanket, org. bonded At-17.7°C A 0.03172 24. 712.Mineral fibre, blanket, org. bonded At -3.8°C A 0.03020 48. 712.Mineral fibre, blanket, org. bonded At -3.8°C A 0.03317 24. 712.Mineral fibre, blanket, org. bonded At -3.8°C A 0.03893 12. 712.Mineral fibre, blanket, org. bonded At 10°C A 0.03172 48. 712.Mineral fibre, blanket, org. bonded At 10°C A 0.03605 24. 712.Mineral fibre, blanket, org. bonded At 10°C A 0.04182 12. 712.Mineral fibre, blanket, org. bonded At 23.8°C A 0.03316 48. 712.Mineral fibre, blanket, org. bonded At 23.8°C A 0.03893 24. 712.Mineral fibre, blanket, org. bonded At 23.8°C A 0.04614 12. 712.Mineral fibre, blanket, org. bonded At 37.7°C A 0.03461 48. 712.Mineral fibre, blanket, org. bonded At 37.7°C A 0.04038 24. 712.Mineral fibre, blanket, org. bonded At 37.7°C A 0.04903 12. 712.Mineral fibre, blanket, org. bonded At 93.3°C A 0.04470 48. 712.Mineral fibre, blanket, org. bonded At 93.3°C A 0.05335 24. 712.Mineral fibre, blanket, org. bonded At 93.3°C A 0.06922 12. 712.Min. fibre, textile, org. bonded At -17.7°C A 0.04038 10.4 712.Min. fibre, textile, org. bonded At -3.8°C A 0.04182 10.4 712.Min. fibre, textile, org. bonded At -31°C A 0.03893 10.4 712.Min. fibre, textile, org. bonded At 10°C A 0.04326 10.4 712.Min. fibre, textile, org. bonded At 148.8°C A 0.03542 24. -Min. fibre, textile, org. bonded At 148.8°C A 0.05912 48. 712.Min. fibre, textile, org. bonded At 148.8°C A 0.08652 16. 712.Min. fibre, textile, org. bonded At 148.8°C A 0.09517 12. 712.Min. fibre, textile, org. bonded At 148.8°C A 0.09806 10.4 712.Min. fibre, textile, org. bonded At 23.8°C A 0.03461 48. 712.Min. fibre, textile, org. bonded At 23.8°C A 0.03890 24. -Min. fibre, textile, org. bonded At 23.8°C A 0.04182 16. 712.Min. fibre, textile, org. bonded At 23.8°C A 0.04470 12. 712.Min. fibre, textile, org. bonded At 23.8°C A 0.04470 10.4 712.Min. fibre, textile, org. bonded At 37.7°C A 0.04614 10.4 712.Min. fibre, textile, org. bonded At 37.7°C A 0.04614 12. 712.Min. fibre, textile, org. bonded At 37.9°C A 0.03605 48. 712.Min. fibre, textile, org. bonded At 37.9°C A 0.04180 24. -Min. fibre, textile, org. bonded At 37.9°C A 0.04470 16. 712.
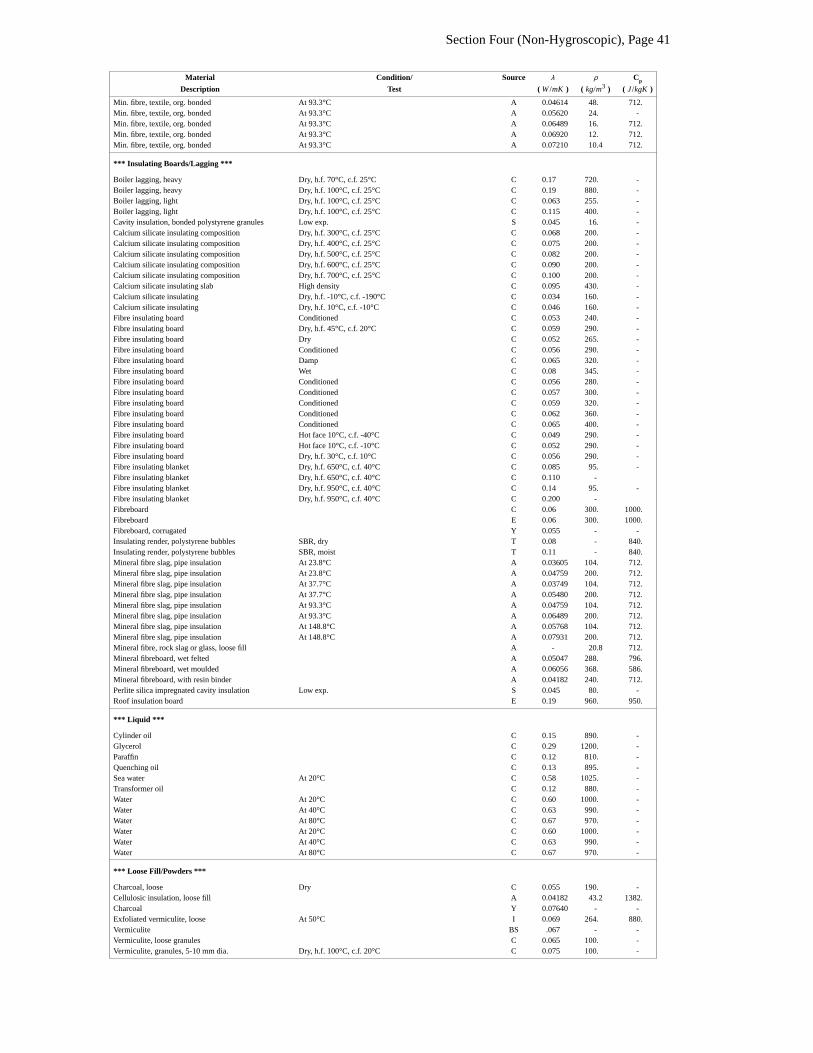
Section Four (Non-Hygroscopic), Page 41
Material Condition/ Source λ ρ Cp
Description Test ( W /mK ) ( kg/m3 ) ( J /kgK )
Min. fibre, textile, org. bonded At 93.3°C A 0.04614 48. 712.Min. fibre, textile, org. bonded At 93.3°C A 0.05620 24. -Min. fibre, textile, org. bonded At 93.3°C A 0.06489 16. 712.Min. fibre, textile, org. bonded At 93.3°C A 0.06920 12. 712.Min. fibre, textile, org. bonded At 93.3°C A 0.07210 10.4 712.
*** Insulating Boards/Lagging ***
Boiler lagging, heavy Dry, h.f. 70°C, c.f. 25°C C 0.17 720. -Boiler lagging, heavy Dry, h.f. 100°C, c.f. 25°C C 0.19 880. -Boiler lagging, light Dry, h.f. 100°C, c.f. 25°C C 0.063 255. -Boiler lagging, light Dry, h.f. 100°C, c.f. 25°C C 0.115 400. -Cavity insulation, bonded polystyrene granules Low exp. S 0.045 16. -Calcium silicate insulating composition Dry, h.f. 300°C, c.f. 25°C C 0.068 200. -Calcium silicate insulating composition Dry, h.f. 400°C, c.f. 25°C C 0.075 200. -Calcium silicate insulating composition Dry, h.f. 500°C, c.f. 25°C C 0.082 200. -Calcium silicate insulating composition Dry, h.f. 600°C, c.f. 25°C C 0.090 200. -Calcium silicate insulating composition Dry, h.f. 700°C, c.f. 25°C C 0.100 200. -Calcium silicate insulating slab High density C 0.095 430. -Calcium silicate insulating Dry, h.f. -10°C, c.f. -190°C C 0.034 160. -Calcium silicate insulating Dry, h.f. 10°C, c.f. -10°C C 0.046 160. -Fibre insulating board Conditioned C 0.053 240. -Fibre insulating board Dry, h.f. 45°C, c.f. 20°C C 0.059 290. -Fibre insulating board Dry C 0.052 265. -Fibre insulating board Conditioned C 0.056 290. -Fibre insulating board Damp C 0.065 320. -Fibre insulating board Wet C 0.08 345. -Fibre insulating board Conditioned C 0.056 280. -Fibre insulating board Conditioned C 0.057 300. -Fibre insulating board Conditioned C 0.059 320. -Fibre insulating board Conditioned C 0.062 360. -Fibre insulating board Conditioned C 0.065 400. -Fibre insulating board Hot face 10°C, c.f. -40°C C 0.049 290. -Fibre insulating board Hot face 10°C, c.f. -10°C C 0.052 290. -Fibre insulating board Dry, h.f. 30°C, c.f. 10°C C 0.056 290. -Fibre insulating blanket Dry, h.f. 650°C, c.f. 40°C C 0.085 95. -Fibre insulating blanket Dry, h.f. 650°C, c.f. 40°C C 0.110 -Fibre insulating blanket Dry, h.f. 950°C, c.f. 40°C C 0.14 95. -Fibre insulating blanket Dry, h.f. 950°C, c.f. 40°C C 0.200 -Fibreboard C 0.06 300. 1000.Fibreboard E 0.06 300. 1000.Fibreboard, corrugated Y 0.055 - -Insulating render, polystyrene bubbles SBR, dry T 0.08 - 840.Insulating render, polystyrene bubbles SBR, moist T 0.11 - 840.Mineral fibre slag, pipe insulation At 23.8°C A 0.03605 104. 712.Mineral fibre slag, pipe insulation At 23.8°C A 0.04759 200. 712.Mineral fibre slag, pipe insulation At 37.7°C A 0.03749 104. 712.Mineral fibre slag, pipe insulation At 37.7°C A 0.05480 200. 712.Mineral fibre slag, pipe insulation At 93.3°C A 0.04759 104. 712.Mineral fibre slag, pipe insulation At 93.3°C A 0.06489 200. 712.Mineral fibre slag, pipe insulation At 148.8°C A 0.05768 104. 712.Mineral fibre slag, pipe insulation At 148.8°C A 0.07931 200. 712.Mineral fibre, rock slag or glass, loose fill A - 20.8 712.Mineral fibreboard, wet felted A 0.05047 288. 796.Mineral fibreboard, wet moulded A 0.06056 368. 586.Mineral fibreboard, with resin binder A 0.04182 240. 712.Perlite silica impregnated cavity insulation Low exp. S 0.045 80. -Roof insulation board E 0.19 960. 950.
*** Liquid ***
Cylinder oil C 0.15 890. -Glycerol C 0.29 1200. -Paraffin C 0.12 810. -Quenching oil C 0.13 895. -Sea water At 20°C C 0.58 1025. -Transformer oil C 0.12 880. -Water At 20°C C 0.60 1000. -Water At 40°C C 0.63 990. -Water At 80°C C 0.67 970. -Water At 20°C C 0.60 1000. -Water At 40°C C 0.63 990. -Water At 80°C C 0.67 970. -
*** Loose Fill/Powders ***
Charcoal, loose Dry C 0.055 190. -Cellulosic insulation, loose fill A 0.04182 43.2 1382.Charcoal Y 0.07640 - -Exfoliated vermiculite, loose At 50°C I 0.069 264. 880.Vermiculite BS .067 - -Vermiculite, loose granules C 0.065 100. -Vermiculite, granules, 5-10 mm dia. Dry, h.f. 100°C, c.f. 20°C C 0.075 100. -
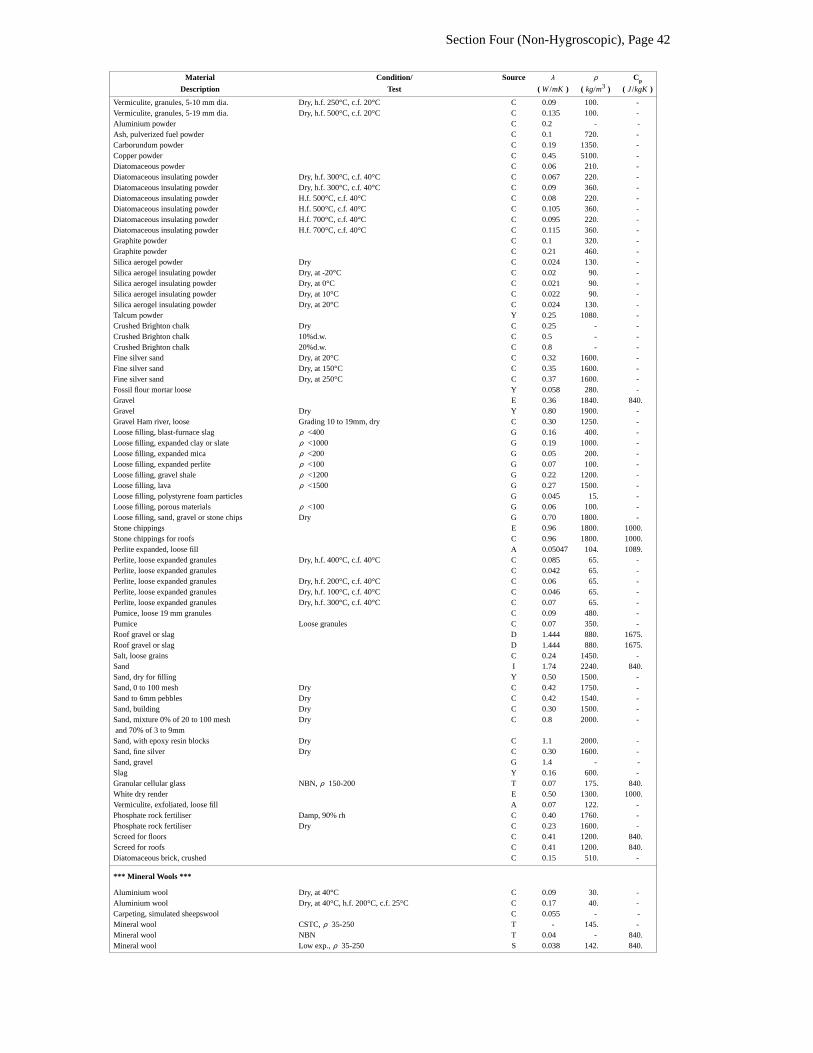
Section Four (Non-Hygroscopic), Page 42
Material Condition/ Source λ ρ Cp
Description Test ( W /mK ) ( kg/m3 ) ( J /kgK )
Vermiculite, granules, 5-10 mm dia. Dry, h.f. 250°C, c.f. 20°C C 0.09 100. -Vermiculite, granules, 5-19 mm dia. Dry, h.f. 500°C, c.f. 20°C C 0.135 100. -Aluminium powder C 0.2 - -Ash, pulverized fuel powder C 0.1 720. -Carborundum powder C 0.19 1350. -Copper powder C 0.45 5100. -Diatomaceous powder C 0.06 210. -Diatomaceous insulating powder Dry, h.f. 300°C, c.f. 40°C C 0.067 220. -Diatomaceous insulating powder Dry, h.f. 300°C, c.f. 40°C C 0.09 360. -Diatomaceous insulating powder H.f. 500°C, c.f. 40°C C 0.08 220. -Diatomaceous insulating powder H.f. 500°C, c.f. 40°C C 0.105 360. -Diatomaceous insulating powder H.f. 700°C, c.f. 40°C C 0.095 220. -Diatomaceous insulating powder H.f. 700°C, c.f. 40°C C 0.115 360. -Graphite powder C 0.1 320. -Graphite powder C 0.21 460. -Silica aerogel powder Dry C 0.024 130. -Silica aerogel insulating powder Dry, at -20°C C 0.02 90. -Silica aerogel insulating powder Dry, at 0°C C 0.021 90. -Silica aerogel insulating powder Dry, at 10°C C 0.022 90. -Silica aerogel insulating powder Dry, at 20°C C 0.024 130. -Talcum powder Y 0.25 1080. -Crushed Brighton chalk Dry C 0.25 - -Crushed Brighton chalk 10%d.w. C 0.5 - -Crushed Brighton chalk 20%d.w. C 0.8 - -Fine silver sand Dry, at 20°C C 0.32 1600. -Fine silver sand Dry, at 150°C C 0.35 1600. -Fine silver sand Dry, at 250°C C 0.37 1600. -Fossil flour mortar loose Y 0.058 280. -Gravel E 0.36 1840. 840.Gravel Dry Y 0.80 1900. -Gravel Ham river, loose Grading 10 to 19mm, dry C 0.30 1250. -Loose filling, blast-furnace slag ρ <400 G 0.16 400. -Loose filling, expanded clay or slate ρ <1000 G 0.19 1000. -Loose filling, expanded mica ρ <200 G 0.05 200. -Loose filling, expanded perlite ρ <100 G 0.07 100. -Loose filling, gravel shale ρ <1200 G 0.22 1200. -Loose filling, lava ρ <1500 G 0.27 1500. -Loose filling, polystyrene foam particles G 0.045 15. -Loose filling, porous materials ρ <100 G 0.06 100. -Loose filling, sand, gravel or stone chips Dry G 0.70 1800. -Stone chippings E 0.96 1800. 1000.Stone chippings for roofs C 0.96 1800. 1000.Perlite expanded, loose fill A 0.05047 104. 1089.Perlite, loose expanded granules Dry, h.f. 400°C, c.f. 40°C C 0.085 65. -Perlite, loose expanded granules C 0.042 65. -Perlite, loose expanded granules Dry, h.f. 200°C, c.f. 40°C C 0.06 65. -Perlite, loose expanded granules Dry, h.f. 100°C, c.f. 40°C C 0.046 65. -Perlite, loose expanded granules Dry, h.f. 300°C, c.f. 40°C C 0.07 65. -Pumice, loose 19 mm granules C 0.09 480. -Pumice Loose granules C 0.07 350. -Roof gravel or slag D 1.444 880. 1675.Roof gravel or slag D 1.444 880. 1675.Salt, loose grains C 0.24 1450. -Sand I 1.74 2240. 840.Sand, dry for filling Y 0.50 1500. -Sand, 0 to 100 mesh Dry C 0.42 1750. -Sand to 6mm pebbles Dry C 0.42 1540. -Sand, building Dry C 0.30 1500. -Sand, mixture 0% of 20 to 100 mesh Dry C 0.8 2000. -and 70% of 3 to 9mmSand, with epoxy resin blocks Dry C 1.1 2000. -Sand, fine silver Dry C 0.30 1600. -Sand, gravel G 1.4 - -Slag Y 0.16 600. -Granular cellular glass NBN, ρ 150-200 T 0.07 175. 840.White dry render E 0.50 1300. 1000.Vermiculite, exfoliated, loose fill A 0.07 122. -Phosphate rock fertiliser Damp, 90% rh C 0.40 1760. -Phosphate rock fertiliser Dry C 0.23 1600. -Screed for floors C 0.41 1200. 840.Screed for roofs C 0.41 1200. 840.Diatomaceous brick, crushed C 0.15 510. -
*** Mineral Wools ***
Aluminium wool Dry, at 40°C C 0.09 30. -Aluminium wool Dry, at 40°C, h.f. 200°C, c.f. 25°C C 0.17 40. -Carpeting, simulated sheepswool C 0.055 - -Mineral wool CSTC, ρ 35-250 T - 145. -Mineral wool NBN T 0.04 - 840.Mineral wool Low exp., ρ 35-250 S 0.038 142. 840.
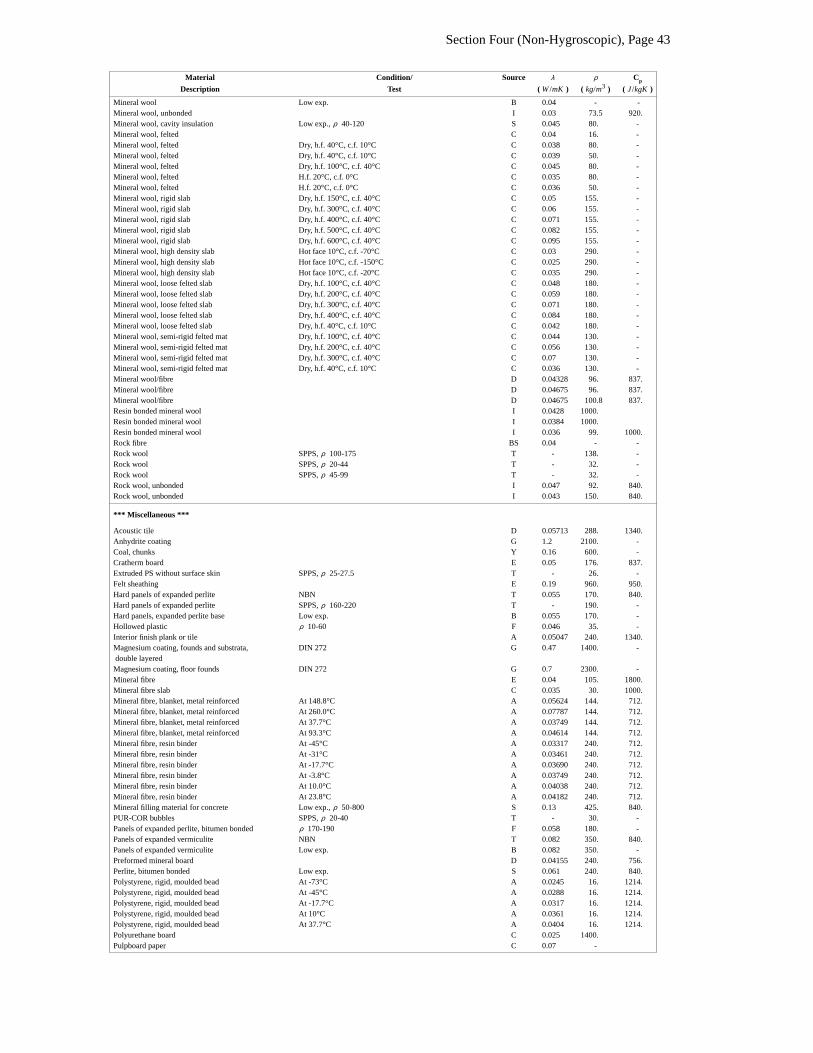
Section Four (Non-Hygroscopic), Page 43
Material Condition/ Source λ ρ Cp
Description Test ( W /mK ) ( kg/m3 ) ( J /kgK )
Mineral wool Low exp. B 0.04 - -Mineral wool, unbonded I 0.03 73.5 920.Mineral wool, cavity insulation Low exp., ρ 40-120 S 0.045 80. -Mineral wool, felted C 0.04 16. -Mineral wool, felted Dry, h.f. 40°C, c.f. 10°C C 0.038 80. -Mineral wool, felted Dry, h.f. 40°C, c.f. 10°C C 0.039 50. -Mineral wool, felted Dry, h.f. 100°C, c.f. 40°C C 0.045 80. -Mineral wool, felted H.f. 20°C, c.f. 0°C C 0.035 80. -Mineral wool, felted H.f. 20°C, c.f. 0°C C 0.036 50. -Mineral wool, rigid slab Dry, h.f. 150°C, c.f. 40°C C 0.05 155. -Mineral wool, rigid slab Dry, h.f. 300°C, c.f. 40°C C 0.06 155. -Mineral wool, rigid slab Dry, h.f. 400°C, c.f. 40°C C 0.071 155. -Mineral wool, rigid slab Dry, h.f. 500°C, c.f. 40°C C 0.082 155. -Mineral wool, rigid slab Dry, h.f. 600°C, c.f. 40°C C 0.095 155. -Mineral wool, high density slab Hot face 10°C, c.f. -70°C C 0.03 290. -Mineral wool, high density slab Hot face 10°C, c.f. -150°C C 0.025 290. -Mineral wool, high density slab Hot face 10°C, c.f. -20°C C 0.035 290. -Mineral wool, loose felted slab Dry, h.f. 100°C, c.f. 40°C C 0.048 180. -Mineral wool, loose felted slab Dry, h.f. 200°C, c.f. 40°C C 0.059 180. -Mineral wool, loose felted slab Dry, h.f. 300°C, c.f. 40°C C 0.071 180. -Mineral wool, loose felted slab Dry, h.f. 400°C, c.f. 40°C C 0.084 180. -Mineral wool, loose felted slab Dry, h.f. 40°C, c.f. 10°C C 0.042 180. -Mineral wool, semi-rigid felted mat Dry, h.f. 100°C, c.f. 40°C C 0.044 130. -Mineral wool, semi-rigid felted mat Dry, h.f. 200°C, c.f. 40°C C 0.056 130. -Mineral wool, semi-rigid felted mat Dry, h.f. 300°C, c.f. 40°C C 0.07 130. -Mineral wool, semi-rigid felted mat Dry, h.f. 40°C, c.f. 10°C C 0.036 130. -Mineral wool/fibre D 0.04328 96. 837.Mineral wool/fibre D 0.04675 96. 837.Mineral wool/fibre D 0.04675 100.8 837.Resin bonded mineral wool I 0.0428 1000.Resin bonded mineral wool I 0.0384 1000.Resin bonded mineral wool I 0.036 99. 1000.Rock fibre BS 0.04 - -Rock wool SPPS, ρ 100-175 T - 138. -Rock wool SPPS, ρ 20-44 T - 32. -Rock wool SPPS, ρ 45-99 T - 32. -Rock wool, unbonded I 0.047 92. 840.Rock wool, unbonded I 0.043 150. 840.
*** Miscellaneous ***
Acoustic tile D 0.05713 288. 1340.Anhydrite coating G 1.2 2100. -Coal, chunks Y 0.16 600. -Cratherm board E 0.05 176. 837.Extruded PS without surface skin SPPS, ρ 25-27.5 T - 26. -Felt sheathing E 0.19 960. 950.Hard panels of expanded perlite NBN T 0.055 170. 840.Hard panels of expanded perlite SPPS, ρ 160-220 T - 190. -Hard panels, expanded perlite base Low exp. B 0.055 170. -Hollowed plastic ρ 10-60 F 0.046 35. -Interior finish plank or tile A 0.05047 240. 1340.Magnesium coating, founds and substrata, DIN 272 G 0.47 1400. -double layeredMagnesium coating, floor founds DIN 272 G 0.7 2300. -Mineral fibre E 0.04 105. 1800.Mineral fibre slab C 0.035 30. 1000.Mineral fibre, blanket, metal reinforced At 148.8°C A 0.05624 144. 712.Mineral fibre, blanket, metal reinforced At 260.0°C A 0.07787 144. 712.Mineral fibre, blanket, metal reinforced At 37.7°C A 0.03749 144. 712.Mineral fibre, blanket, metal reinforced At 93.3°C A 0.04614 144. 712.Mineral fibre, resin binder At -45°C A 0.03317 240. 712.Mineral fibre, resin binder At -31°C A 0.03461 240. 712.Mineral fibre, resin binder At -17.7°C A 0.03690 240. 712.Mineral fibre, resin binder At -3.8°C A 0.03749 240. 712.Mineral fibre, resin binder At 10.0°C A 0.04038 240. 712.Mineral fibre, resin binder At 23.8°C A 0.04182 240. 712.Mineral filling material for concrete Low exp., ρ 50-800 S 0.13 425. 840.PUR-COR bubbles SPPS, ρ 20-40 T - 30. -Panels of expanded perlite, bitumen bonded ρ 170-190 F 0.058 180. -Panels of expanded vermiculite NBN T 0.082 350. 840.Panels of expanded vermiculite Low exp. B 0.082 350. -Preformed mineral board D 0.04155 240. 756.Perlite, bitumen bonded Low exp. S 0.061 240. 840.Polystyrene, rigid, moulded bead At -73°C A 0.0245 16. 1214.Polystyrene, rigid, moulded bead At -45°C A 0.0288 16. 1214.Polystyrene, rigid, moulded bead At -17.7°C A 0.0317 16. 1214.Polystyrene, rigid, moulded bead At 10°C A 0.0361 16. 1214.Polystyrene, rigid, moulded bead At 37.7°C A 0.0404 16. 1214.Polyurethane board C 0.025 1400.Pulpboard paper C 0.07 -
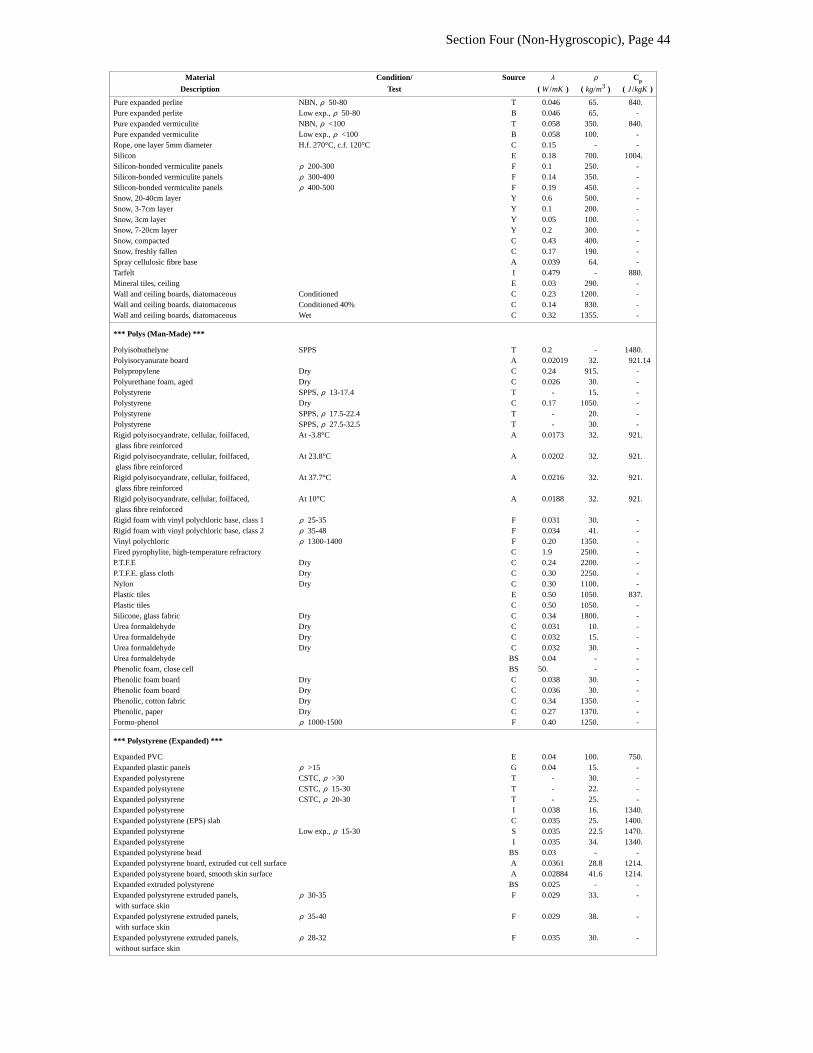
Section Four (Non-Hygroscopic), Page 44
Material Condition/ Source λ ρ Cp
Description Test ( W /mK ) ( kg/m3 ) ( J /kgK )
Pure expanded perlite NBN, ρ 50-80 T 0.046 65. 840.Pure expanded perlite Low exp., ρ 50-80 B 0.046 65. -Pure expanded vermiculite NBN, ρ <100 T 0.058 350. 840.Pure expanded vermiculite Low exp., ρ <100 B 0.058 100. -Rope, one layer 5mm diameter H.f. 270°C, c.f. 120°C C 0.15 - -Silicon E 0.18 700. 1004.Silicon-bonded vermiculite panels ρ 200-300 F 0.1 250. -Silicon-bonded vermiculite panels ρ 300-400 F 0.14 350. -Silicon-bonded vermiculite panels ρ 400-500 F 0.19 450. -Snow, 20-40cm layer Y 0.6 500. -Snow, 3-7cm layer Y 0.1 200. -Snow, 3cm layer Y 0.05 100. -Snow, 7-20cm layer Y 0.2 300. -Snow, compacted C 0.43 400. -Snow, freshly fallen C 0.17 190. -Spray cellulosic fibre base A 0.039 64. -Tarfelt I 0.479 - 880.Mineral tiles, ceiling E 0.03 290. -Wall and ceiling boards, diatomaceous Conditioned C 0.23 1200. -Wall and ceiling boards, diatomaceous Conditioned 40% C 0.14 830. -Wall and ceiling boards, diatomaceous Wet C 0.32 1355. -
*** Polys (Man-Made) ***
Polyisobuthelyne SPPS T 0.2 - 1480.Polyisocyanurate board A 0.02019 32. 921.14Polypropylene Dry C 0.24 915. -Polyurethane foam, aged Dry C 0.026 30. -Polystyrene SPPS, ρ 13-17.4 T - 15. -Polystyrene Dry C 0.17 1050. -Polystyrene SPPS, ρ 17.5-22.4 T - 20. -Polystyrene SPPS, ρ 27.5-32.5 T - 30. -Rigid polyisocyandrate, cellular, foilfaced, At -3.8°C A 0.0173 32. 921.glass fibre reinforcedRigid polyisocyandrate, cellular, foilfaced, At 23.8°C A 0.0202 32. 921.glass fibre reinforcedRigid polyisocyandrate, cellular, foilfaced, At 37.7°C A 0.0216 32. 921.glass fibre reinforcedRigid polyisocyandrate, cellular, foilfaced, At 10°C A 0.0188 32. 921.glass fibre reinforcedRigid foam with vinyl polychloric base, class 1 ρ 25-35 F 0.031 30. -Rigid foam with vinyl polychloric base, class 2 ρ 35-48 F 0.034 41. -Vinyl polychloric ρ 1300-1400 F 0.20 1350. -Fired pyrophylite, high-temperature refractory C 1.9 2500. -P.T.F.E Dry C 0.24 2200. -P.T.F.E. glass cloth Dry C 0.30 2250. -Nylon Dry C 0.30 1100. -Plastic tiles E 0.50 1050. 837.Plastic tiles C 0.50 1050. -Silicone, glass fabric Dry C 0.34 1800. -Urea formaldehyde Dry C 0.031 10. -Urea formaldehyde Dry C 0.032 15. -Urea formaldehyde Dry C 0.032 30. -Urea formaldehyde BS 0.04 - -Phenolic foam, close cell BS 50. - -Phenolic foam board Dry C 0.038 30. -Phenolic foam board Dry C 0.036 30. -Phenolic, cotton fabric Dry C 0.34 1350. -Phenolic, paper Dry C 0.27 1370. -Formo-phenol ρ 1000-1500 F 0.40 1250. -
*** Polystyrene (Expanded) ***
Expanded PVC E 0.04 100. 750.Expanded plastic panels ρ >15 G 0.04 15. -Expanded polystyrene CSTC, ρ >30 T - 30. -Expanded polystyrene CSTC, ρ 15-30 T - 22. -Expanded polystyrene CSTC, ρ 20-30 T - 25. -Expanded polystyrene I 0.038 16. 1340.Expanded polystyrene (EPS) slab C 0.035 25. 1400.Expanded polystyrene Low exp., ρ 15-30 S 0.035 22.5 1470.Expanded polystyrene I 0.035 34. 1340.Expanded polystyrene bead BS 0.03 - -Expanded polystyrene board, extruded cut cell surface A 0.0361 28.8 1214.Expanded polystyrene board, smooth skin surface A 0.02884 41.6 1214.Expanded extruded polystyrene BS 0.025 - -Expanded polystyrene extruded panels, ρ 30-35 F 0.029 33. -with surface skinExpanded polystyrene extruded panels, ρ 35-40 F 0.029 38. -with surface skinExpanded polystyrene extruded panels, ρ 28-32 F 0.035 30. -without surface skin

Section Four (Non-Hygroscopic), Page 45
Material Condition/ Source λ ρ Cp
Description Test ( W /mK ) ( kg/m3 ) ( J /kgK )
Expanded polystyrene milled under ρ 25-35 F 0.036 30. -constant humidity & driedExpanded polystyrene milled under ρ 11-16 F 0.042 14. -constant humidity & dried

Section Four (Non-Hygroscopic), Page 46
Material Condition/ Source λ ρ Cp
Description Test ( W /mK ) ( kg/m3 ) ( J /kgK )
Expanded polystyrene milled under ρ 16-20 F 0.038 18. -constant humidity & driedExpanded polystyrene, milled, grade 1 ρ 9-13 F 0.044 11. -Expanded polystyrene, milled, grade 2 ρ 13-16 F 0.042 14. -Expanded polystyrene, milled, grade 3 ρ 16-20 F 0.039 18. -Expanded polystyrene, milled, grade 4 ρ 20-25 F 0.039 22. -Expanded polystyrene, milled, grade 5 ρ 25-35 F 0.037 30. -Expanded polystyrene thermo-compressed ρ 12-15 F 0.041 14. -at constant humidityExpanded polystyrene thermo-compressed ρ 15-20 F 0.038 17. -at constant humidityExpanded polystyrene thermo-compressed ρ 20-25 F 0.036 23. -in constant humidityExpanded polystyrene thermo-compressed ρ 25-35 F 0.036 30. -in constant humidityExpanded polystyrene I 0.035 24. 1340.Extruded polystyrene with surface skin SPPS, ρ 30-35 T 0.034 32. -Extruded polystyrene with surface skin SPPS, ρ 40-45 T 0.032 42. -Extruded polyethylene NBN T 0.04 - 1470.Extruded polystyrene NBN, ρ >25 T 0.035 25. 1470.Extruded polystyrene Low exp., ρ 30-40 S 0.027 35. 1470.Polystyrene, expanded D 0.03463 28.8 1214.Polystyrene, expanded board Dry C 0.037 15. -Polystyrene, expanded board Dry, h.f. 10°C, c.f. -10°C C 0.033 15. -Polystyrene, expanded board Dry, h.f. 20°C, c.f. 0°C C 0.035 15. -Polystyrene, expanded board Dry, h.f. 45°C, c.f. 20°C C 0.039 15. -Polystyrene, expanded board Dry C 0.0345 - -Polystyrene, expanded board Dry, h.f. 10°C, c.f. -10°C C 0.031 25. -Polystyrene, expanded board Dry, h.f. 20°C, c.f. 0°C C 0.033 25. -Polystyrene, expanded board Dry, h.f. 45°C, c.f. 20°C C 0.037 25. -Polystyrene, expanded board Dry, h.f. 20°C, c.f. 0°C C 0.03 30. -
*** Polyurethane ***
Cellular polyurethane board A 0.02307 24. 1591.Polyurethane expanded D 0.02303 24. 1591.Polyurethane expanded in situ CSTC, ρ >37 T - 37. -Polyurethane foam, closed cell BS 0.029 - -Polyurethane, gas filled, rigid, new Dry, h.f. 20°C, c.f. 0°C C 0.021 30. -Polyurethane, gas filled, rigid, new Dry, h.f. 45°C, c.f. 20°C C 0.024 30. -Polyurethane, gas filled, rigid, new Dry, h.f. 10°C, c.f. -10°C C 0.02 30. -Polyurethane, gas filled, rigid, 1.5yrs Dry, h.f. 10°C, c.f. -10°C C 0.023 30. -Polyurethane, gas filled, rigid, 1.5yrs Dry, h.f. 20°C, c.f. 0°C C 0.025 30. -Polyurethane, gas filled, rigid, 1.5yrs Dry, h.f. 45°C, c.f. 20°C C 0.027 30. -Rigid polyurethane or polyisocyanurate ρ 30-40) F 0.029 35. -expanded foam panelsUnfaced polyurethene At -73°C G 0.0231 32. 1591.Unfaced polyurethene At -59°C G 0.0245 32. 1591.Unfaced polyurethene At -45°C G 0.026 32. 1591.Unfaced polyurethene At -31°C G 0.026 32. 1591.Unfaced polyurethene At -17.7°C G 0.026 32. 1591.Unfaced polyurethene At -3.8°C G 0.0245 32. 1591.Unfaced polyurethene At 10°C G 0.0231 32. 1591.Unfaced polyurethene At 23.8°C G 0.0231 32. 1591.Unfaced polyurethene At 37.7°C G 0.0245 32. 1591.

Section Four (Inorganic-Porous), Page 47
4.5 Inorganic-Porous
This category included masonry and related materials which are inorganic, porous and may containsignificant amounts of water due to hygroscopic absorption from the air or wetting by rain, which affectstheir hygrothermal properties and their thermal conductivity in particular.
Material Condition/ Source λ ρ Cp
Description Test ( W /mK ) ( kg/m3 ) ( J /kgK )
*** Asbestos-Related ***
Asbestos, 85% Magnesia Dry, h.f. 100°C, c.f. 25°C C 0.06 190. -Asbestos, 85% Magnesia h.f. 200°C, c.f. 25°C C 0.065 190. -Asbestos, 85% Magnesia h.f. 300°C, c.f. 25°C C 0.072 190. -Asbestos, 85% Magnesia h.f. 400°C, c.f. 25°C C 0.08 190. -Asbestos, 85% Magnesia h.f. 150°C, c.f. 25°C C 0.065 235. -Asbestos, 85% Magnesia Dry, h.f. 200°C, c.f. 25°C C 0.067 235. -Asbestos, 85% Magnesia Dry, h.f. 300°C, c.f. 25°C C 0.074 235. -Asbestos, 85% Magnesia h.f. 400°C, c.f. 25°C C 0.083 235. -Asbestos, 85% Magnesia h.f. 500°C, c.f. 25°C C 0.09 235. -Asbestos, lightweight slab C 0.05 70. -Asbestos, lightweight slab C 0.053 95. -Asbestos, slab Soaked C 0.2 135. -Asbestos, slab Wet C 0.15 135. -Asbestos Sprayed C 0.043 80. -Asbestos Sprayed C 0.046 130. -Asbestos Sprayed C 0.061 160. -Asbestos Sprayed C 0.075 240. -Asbestos, slab Dry C 0.05 135. -Asbestos and asphalt tiles Conditioned C 0.55 1900. -Asbestos P.V.C. tiles C 0.85 2000. -Asbestos/phenolic cloth Dry C 0.3 1300. -Asbestos/phenolic cloth C 0.50 1700. -Asbestos/phenolic flock Dry C 0.38 1600. -Asbestos/plastic insulation h.f. 100°C, c.f. 40°C C 0.12 400. -Asbestos/plastic insulation h.f. 100°C, c.f. 40°C C 0.075 275. -Asbestos/plastic insulation h.f. 200°C, c.f. 40°C C 0.08 275. -Asbestos/plastic insulation h.f. 300°C, c.f. 40°C C 0.13 400. -Asbestos/plastic insulation h.f. 400°C, c.f. 40°C C 0.095 275. -Asbestos/plastic insulation h.f. 400°C, c.f. 40°C) C 0.135 400. -Asbestos/plastic insulation h.f. 200°C, c.f. 40°C) C 0.125 400. -Asbestos/plastic insulation h.f. 300°C, c.f. 40°C) C 0.085 275. -Asbestos/plastic insulation h.f. 500°C, c.f. 40°C) C 0.105 275. -Asbestos/silicone mat Dry C 0.34 1600. -Asbestos, slab with high amosite content h.f. 500°C, c.f. 40°C C 0.11 320. -Asbestos, slab with high amosite content h.f. 400°C, c.f. 40°C C 0.075 145. -Asbestos, slab with high amosite content h.f. 500°C, c.f. 40°C C 0.083 145. -Asbestos, slab with high amosite content h.f. 100°C, c.f. 40°C C 0.08 320. -Asbestos, slab with high amosite content h.f. 200°C, c.f. 40°C C 0.085 320. -Asbestos, slab with high amosite content h.f. 300°C, c.f. 40°C C 0.09 320. -Asbestos, slab with high amosite content h.f. 400°C, c.f. 40°C C 0.097 320. -Asbestos, slab with high amosite content h.f. 100°C, c.f. 40°C C 0.055 145. -Asbestos, slab with high amosite content h.f. 200°C, c.f. 40°C C 0.06 145. -Asbestos, slab with high amosite content h.f. 300°C, c.f. 40°C C 0.068 145. -Asbestos laminated paper At 148.8°C A 0.0721 480. -Asbestos laminated paper At 260°C A 0.08652 480. -Asbestos laminated paper At 37.7°C A 0.05768 480. -Asbestos laminated paper At 93.3°C A 0.06489 480. -Asbestos, millboard C 0.11 720. -Asbestos, millboard C 0.19 1050. -Asbestos, paper, corrugated and Dry C 0.065 145. -aluminium foil bondedAsbestos, paper, corrugated and Dry C 0.087 190. -plain bondedAsbestos, paper, thin sheet Dry C 0.15 950. -Asbestos cement Y 0.50 1700. -Asbestos cement CSTC T - 800. -Asbestos cement CSTC T - 1750. -Asbestos cement ρ 1400-1800 F 0.65 1600. -Asbestos cement ρ 1800-2200 F 0.95 2000. -Asbestos cement Low exp., ρ 1600-1900 S 0.53 1750. 840.Asbestos cement Std exp., ρ 1600-1900 S 1.02 1750. 840.Asbestos cement, compressed slab Y 0.80 1900. -Asbestos cement building board A 0.5768 1920. 1005.Asbestos cement building board D 0.59732 1920. 837.Asbestos cement decking C 0.36 1500. 1050.Asbestos cement panels DIN 274 G 0.58 2000. -Asbestos cement sheet C 0.36 700. 1050.Asbestos sheet E 0.16 2500. 1050.Asbestos cement sheet E 0.36 700. 1050.Asbestos cement sheet Conditioned C 0.37 1520. -

Section Four (Inorganic-Porous), Page 48
Material Condition/ Source λ ρ Cp
Description Test ( W /mK ) ( kg/m3 ) ( J /kgK )
Asbestos cement sheet C 0.25 1360. -Asbestos cement sheet C 0.40 1600. -Asbestos cement sheet C 0.55 2000. -Asbestos cement sheet & substitutes BS 0.4 - -Asbestos insulation E 0.16 577. 840.Cellulose asbestos cement ρ 1000-1400 F 0.35 1200. -Cellulose asbestos cement ρ 1400-1800 F 0.46 1600. -Asbestos cement E 0.36 1500. 1000.Asbestos fibre At 50°C I 0.06 640. 840.Asbestos mill board At 50°C I 0.249 1397. 840.Asbestos cloth Dry C 0.11 450. -Asbestos cloth Dry C 0.17 560. -Asbestos felt Dry C 0.078 144. -Asbestos insulating board Conditioned C 0.11 720. -Asbestos insulating board Conditioned C 0.12 750. -Asbestos insulating board Conditioned C 0.14 800. -Asbestos insulating board Conditioned C 0.16 900. -Asbestos insulating board Wet C 0.21 845. -Asbestos vermiculite slabs C 0.095 320. -Asbestos vermiculite slabs C 0.115 400. -Asbestos vermiculite slabs Dry C 0.13 400. -Asbestos wallboard Conditioned C 0.16 900. -Asbestos wallboard C 0.25 1200. -Asbestos, hard setting composition Dry, h.f. 70°C, c.f. 25°C C 0.25 1200. -Asbestos Vermiculite slabs C 0.08 260. -
*** Brick ***
Brick, aerated S 0.30 1000. 840.Brick, aerated S 0.43 1350. 840.Brick, alumina, insulating Dry, h.f. 500°C, c.f. 40°C C 0.29 720. -Brick, alumina, insulating h.f. 750°C, c.f. 40°C C 0.31 720. -Brick, alumina, insulating h.f. 1000°C, c.f. 40°C C 0.34 720. -Brick, external Y 0.75 1800. -Brick, external Y 0.80 2000. -Brick, facing Y 1.12 2100. -Brick, internal Y 0.60 1800. -Brick, internal Y 0.70 2000. -Brick tile At 50°C I 0.798 1892. 880.Brick A 0.721 1920. 796.Brick D 0.72145 1920. 837.Brick A 1.2978 2080. -Brick D 1.31167 2080. 921.Brick, breeze block E 0.44 1500. 650.Brick, diatomaceous Dry, h.f. 500°C, c.f. 40°C C 0.125 480. -Brick, diatomaceous Dry, h.f. 750°C, c.f. 40°C C 0.13 480. -Brick, diatomaceous Dry, h.f. 900°C, c.f. 40°C C 0.135 480. -Brick, diatomaceous Dry, h.f. 500°C, c.f. 40°C C 0.14 560. -Brick, diatomaceous Dry, h.f. 750°C, c.f. 40°C C 0.145 560. -Brick, diatomaceous Dry, h.f. 900°C, c.f. 40°C C 0.15 560. -Brick, diatomaceous Dry, h.f. 500°C, c.f. 40°C C 0.18 720. -Brick, diatomaceous Dry, h.f. 750°C, c.f. 40°C C 0.20 720. -Brick, diatomaceous Dry, h.f. 900°C, c.f. 40°C C 0.21 720. -Brick, inner leaf E 0.62 1800. 840.Brick, outer leaf E 0.96 2000. 650.Brick, paviour E 0.96 2000. 840.Brick, silica, 95% SiO2 Dry, at 1000°C C 1.40 1900. -Brick, silica, 95% SiO2 Dry, at 500°C C 1.30 1900. -Brick, vermiculite insulating E 0.27 700. 840.Brick, vermiculite insulating Dry, h.f. 500°C, c.f. 40°C C 0.26 700. -Brick, vermiculite insulating Dry, h.f. 750°C, c.f. 40°C C 0.28 700. -Brick, vermiculite insulating Dry, h.f. 1000°C, c.f. 40°C C 0.29 700. -Brickwork, common or facing BS 0.67 1500. -Brickwork, engineering BS 1.25 2000. -Brickwork, sandlime BS .67 1500. -Brickwork, inner leaf C 0.62 1700. 800.Brickwork, outer leaf C 0.84 1700. 800.Brickwork, outer leaf Low exp. S 0.80 2100. 840.Brickwork, outer leaf Std exp. S 1.30 2100. 840.Brick, burnt At 50°C I 0.811 1820. 880.Fire brick Dry at 1000°C C 1.30 2000. -Fire brick Dry at 500°C C 1.00 2000. -Brick, fossil flour Y 0.09 400. -Brick, fossil flour Y 0.18 800. -Brick, light perforated DIN 105 G 0.36 700. -Brick, light perforated DIN 105 G 0.39 800. -Brick, light perforated DIN 105 G 0.42 900. -Brick, light perforated DIN 105 G 0.45 1000. -Brick, light perforated DIN 105, Type W1 G 0.30 700. -Brick, light perforated DIN 105, Type W1 G 0.33 800. -Brick, light perforated DIN 105, Type W1 G 0.36 900. -

Section Four (Inorganic-Porous), Page 49
Material Condition/ Source λ ρ Cp
Description Test ( W /mK ) ( kg/m3 ) ( J /kgK )
Brick, light perforated DIN 105, Type W1 G 0.39 1000. -Brick, mud At 50°C I 0.75 1731. 880.Brick, burned Low exp. S 0.65 1700. 840.Brick, burned Low exp. S 0.55 1500. 840.Brick, burned Low exp. S 0.45 1300. 840.Brick, burned Std exp. S 1.00 1700. 840.Brick, burned Std exp. S 0.85 1500. 840.Brick, burned Std exp. S 0.75 1300. 840.Brick, refractory, alumina Dry, h.f. 500°C, c.f. 40°C C 0.29 720. -Brick, refractory, alumina Dry, h.f. 750°C, c.f. 40°C C 0.31 720. -Brick, refractory, alumina Dry, h.f. 1000°C, c.f. 40°C C 0.34 720. -Brick, reinforced At 50°C I 1.10 1920. 840.Brick, solid or perforated lightwt Low exp., ρ 1100-1199 B 0.37 1150. -Brick, solid or perforated lightwt Low exp., ρ 1200-1299 B 0.42 1250. -Brick, solid or perforated lightwt Low exp., ρ 700-799 B 0.22 750. -Brick, solid or perforated lightwt Low exp., ρ 800-899 B 0.24 850. -Brick, solid or perforated lightwt Low exp., ρ 900-999 B 0.27 950. -Brick, solid or perforated lightwt Std exp., ρ 1000-1099 B 0.37 1050. -Brick, solid or perforated lightwt Std exp., ρ 1000-1099 B 0.47 1050. -Brick, solid or perforated lightwt Std exp., ρ 1100-1199 B 0.52 1150. -Brick, solid or perforated lightwt Std exp., ρ 1200-1299 B 0.58 1250. -Brick, solid or perforated lightwt Std exp., ρ 700-799 B 0.34 750. -Brick, solid or perforated lightwt Std exp., ρ 800-899 B 0.36 850. -Brick, solid or perforated lightwt Std exp., ρ 900-999 B 0.41 950. -Brick, solid or perforated mediumwt Low exp., ρ 1300-1399 B 0.45 1350. -Brick, solid or perforated mediumwt Low exp., ρ 1400-1499 B 0.49 1450. -Brick, solid or perforated mediumwt Low exp., ρ 1500-1599 B 0.54 1550. -Brick, solid or perforated mediumwt Std exp., ρ 1300-1399 B 0.63 1350. -Brick, solid or perforated mediumwt Std exp., ρ 1400-1499 B 0.69 1450. -Brick, solid or perforated mediumwt Std exp., ρ 1500-1599 B 0.75 1550. -Brick, well burned Low exp. S 0.68 1800. 840.Brick, well burned Std exp. S 1.10 1800. 840.
*** Cement, Plaster & Mortar ***
Cement and lime plastering Low exp. S 0.70 1600. 840.Cement and lime plastering Std exp. S 0.80 1600. 840.Cement plaster S 0.721 1762. 840.Cement plaster Low exp. S 0.93 1900. 840.Cement plaster Std exp. S 1.50 1900. 840.Gypsum E 0.42 1200. 837.Gypsum or plaster board D 0.16032 800. 837.Gypsum or plaster board D 0.16032 800. 837.Gypsum plaster S 0.512 1120. 960.Gypsum plaster C 0.38 1120. -Gypsum plaster C 0.46 1280. -Gypsum plaster board A 0.16727 800. 1088.Gypsum plaster board C 0.16 950. -Gypsum plaster board E 0.19 950. 840.Gypsum plaster board Low exp., ρ 800-1400 S 0.35 1100. 840.Gypsum plaster board Std exp., ρ 800-1400 S 0.65 1100. 840.Gypsum plastering Low exp. S 0.52 1300. 840.Gypsum plastering Std exp. S 0.80 1300. 840.Gypsum powder C 0.065 320. -Gypsum foamed plaster C 0.25 880. -Gypsum plasterboard C 0.16 950. -Gypsum plastering C 0.38 1100. -Gypsum plastering C 0.46 1300. -Insulating plaster G 0.20 600. -Insulating plaster, PS-granules as filling Low exp. S 0.095 - 840.Lightweight aggregate plaster D 0.23027 720. 837.36Limestone mortar NBN T 0.70 1600. 840.Limestone mortar NBN, moist T 1.20 1600. 840.Limestone mortar and limestone cement mortar G 0.87 1800. -Limestone plaster, anhydrite mortar, G 0.70 1400. -anhydrite limestone mortarNon-granular plaster for interior render ρ 750-1000 F 0.35 875. -Non-granular plaster, hardened and ultra hard ρ 1100-1300) F 0.50 1200. -Perlite plaster E 0.08 400. 837.Perlite cement, sprayed on Dry C 0.08 350. -Perlite cement, sprayed on Wet C 0.11 420. -Perlite plaster C 0.079 400. -Perlite plaster C 0.08 400. -Perlite plaster C 0.19 600. -Perlite plaster C 0.19 610. -Perlite plaster board C 0.18 800. -Perlite plaster board E 0.18 800. 837.Perlite plaster board Conditioned, 2% m.c. C 0.18 800. -Perlite plaster board Conditioned C 0.18 800. -Plaster BS 0.5 - -Plasterboard BS 0.17 - -
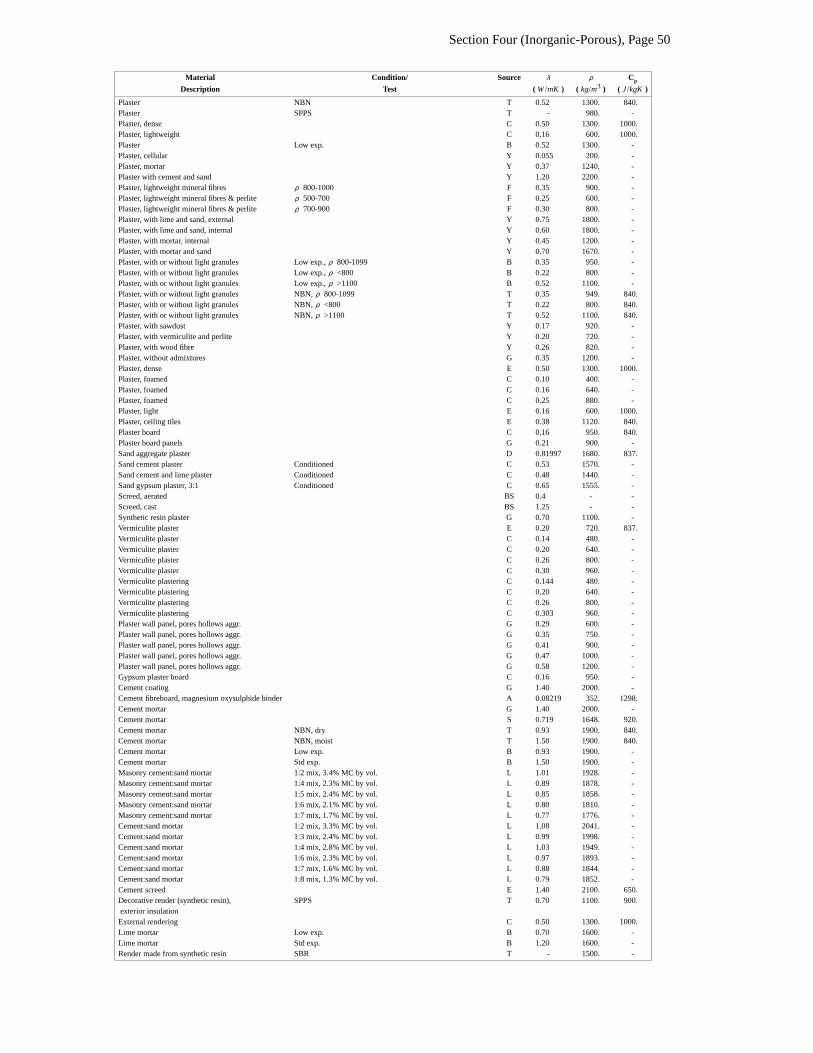
Section Four (Inorganic-Porous), Page 50
Material Condition/ Source λ ρ Cp
Description Test ( W /mK ) ( kg/m3 ) ( J /kgK )
Plaster NBN T 0.52 1300. 840.Plaster SPPS T - 980. -Plaster, dense C 0.50 1300. 1000.Plaster, lightweight C 0.16 600. 1000.Plaster Low exp. B 0.52 1300. -Plaster, cellular Y 0.055 200. -Plaster, mortar Y 0.37 1240. -Plaster with cement and sand Y 1.20 2200. -Plaster, lightweight mineral fibres ρ 800-1000 F 0.35 900. -Plaster, lightweight mineral fibres & perlite ρ 500-700 F 0.25 600. -Plaster, lightweight mineral fibres & perlite ρ 700-900 F 0.30 800. -Plaster, with lime and sand, external Y 0.75 1800. -Plaster, with lime and sand, internal Y 0.60 1800. -Plaster, with mortar, internal Y 0.45 1200. -Plaster, with mortar and sand Y 0.70 1670. -Plaster, with or without light granules Low exp., ρ 800-1099 B 0.35 950. -Plaster, with or without light granules Low exp., ρ <800 B 0.22 800. -Plaster, with or without light granules Low exp., ρ >1100 B 0.52 1100. -Plaster, with or without light granules NBN, ρ 800-1099 T 0.35 949. 840.Plaster, with or without light granules NBN, ρ <800 T 0.22 800. 840.Plaster, with or without light granules NBN, ρ >1100 T 0.52 1100. 840.Plaster, with sawdust Y 0.17 920. -Plaster, with vermiculite and perlite Y 0.20 720. -Plaster, with wood fibre Y 0.26 820. -Plaster, without admixtures G 0.35 1200. -Plaster, dense E 0.50 1300. 1000.Plaster, foamed C 0.10 400. -Plaster, foamed C 0.16 640. -Plaster, foamed C 0.25 880. -Plaster, light E 0.16 600. 1000.Plaster, ceiling tiles E 0.38 1120. 840.Plaster board C 0.16 950. 840.Plaster board panels G 0.21 900. -Sand aggregate plaster D 0.81997 1680. 837.Sand cement plaster Conditioned C 0.53 1570. -Sand cement and lime plaster Conditioned C 0.48 1440. -Sand gypsum plaster, 3:1 Conditioned C 0.65 1555. -Screed, aerated BS 0.4 - -Screed, cast BS 1.25 - -Synthetic resin plaster G 0.70 1100. -Vermiculite plaster E 0.20 720. 837.Vermiculite plaster C 0.14 480. -Vermiculite plaster C 0.20 640. -Vermiculite plaster C 0.26 800. -Vermiculite plaster C 0.30 960. -Vermiculite plastering C 0.144 480. -Vermiculite plastering C 0.20 640. -Vermiculite plastering C 0.26 800. -Vermiculite plastering C 0.303 960. -Plaster wall panel, pores hollows aggr. G 0.29 600. -Plaster wall panel, pores hollows aggr. G 0.35 750. -Plaster wall panel, pores hollows aggr. G 0.41 900. -Plaster wall panel, pores hollows aggr. G 0.47 1000. -Plaster wall panel, pores hollows aggr. G 0.58 1200. -Gypsum plaster board C 0.16 950. -Cement coating G 1.40 2000. -Cement fibreboard, magnesium oxysulphide binder A 0.08219 352. 1298.Cement mortar G 1.40 2000. -Cement mortar S 0.719 1648. 920.Cement mortar NBN, dry T 0.93 1900. 840.Cement mortar NBN, moist T 1.50 1900. 840.Cement mortar Low exp. B 0.93 1900. -Cement mortar Std exp. B 1.50 1900. -Masonry cement:sand mortar 1:2 mix, 3.4% MC by vol. L 1.01 1928. -Masonry cement:sand mortar 1:4 mix, 2.3% MC by vol. L 0.89 1878. -Masonry cement:sand mortar 1:5 mix, 2.4% MC by vol. L 0.85 1858. -Masonry cement:sand mortar 1:6 mix, 2.1% MC by vol. L 0.80 1810. -Masonry cement:sand mortar 1:7 mix, 1.7% MC by vol. L 0.77 1776. -Cement:sand mortar 1:2 mix, 3.3% MC by vol. L 1.08 2041. -Cement:sand mortar 1:3 mix, 2.4% MC by vol. L 0.99 1998. -Cement:sand mortar 1:4 mix, 2.8% MC by vol. L 1.03 1949. -Cement:sand mortar 1:6 mix, 2.3% MC by vol. L 0.97 1893. -Cement:sand mortar 1:7 mix, 1.6% MC by vol. L 0.88 1844. -Cement:sand mortar 1:8 mix, 1.3% MC by vol. L 0.79 1852. -Cement screed E 1.40 2100. 650.Decorative render (synthetic resin), SPPS T 0.70 1100. 900.exterior insulationExternal rendering C 0.50 1300. 1000.Lime mortar Low exp. B 0.70 1600. -Lime mortar Std exp. B 1.20 1600. -Render made from synthetic resin SBR T - 1500. -

Section Four (Inorganic-Porous), Page 51
Material Condition/ Source λ ρ Cp
Description Test ( W /mK ) ( kg/m3 ) ( J /kgK )
Rendering 1% m.c. E 1.13 1431. 1000.Rendering 8% m.c. E 0.79 1329. 1000.

Section Four (Inorganic-Porous), Page 52
Material Condition/ Source λ ρ Cp
Description Test ( W /mK ) ( kg/m3 ) ( J /kgK )
Cement D 0.72145 1856. 837.Cement panels, natural & mineral NBN, moist, ρ 1400-1900 T 0.50 1650. -fibre reinforcedCement panels, natural & mineral NBN, dry, ρ 1400-1900 T 0.35 1650. 840.fibre reinforcedCement, acid resisting, phenolic binder C 0.80 1700. -Cement, plaster, sand aggregate A 0.721 1856. 837.4Cement, heat conducting, graphite filled Dry, at 100°C C 17.00 1600. -Cement, heat conducting, graphite filled At 300°C C 15.00 1600. -Cement based panels of wood fibres SBR, ρ 350-750 T - 550. -Cement based panels of wood fibres SPPS, dry, ρ 300-400 T 0.08 350. 1890.Cement based panels of wood fibres SPPS, moist, ρ 300-400 T 0.12 350. 3040.Cement/ashes conglomerate Y 0.62 - -Cement/magnesia conglomerate Y 0.15 700. -Cement/rice husks Y 0.07 380. -Cement/sand in blocks, external Y 0.90 2200. -Cement/sand in blocks, internal Y 0.80 2200. -Masonry, cellular cemented blocks SPPS T 0.33 524. 2040.Panels, wood fibres bonded to cement CSTC, ρ 350-700 T - 525. -Panels, wood fibres bonded to cement NBN T 0.12 400. 1470.Panels, cement reinforced with Low exp., ρ 1400-1900 B 0.35 1650. -natural fibrePanels, cement reinforced with Std exp., ρ 1400-1900 B 0.50 1650. -natural fibrePerlite/cement conglomerate Y 0.195 650. -Perlite/cement conglomerate Y 0.079 415. -Perlite/cement conglomerate Y 0.092 500. -Perlite/cement conglomerate ρ 120-150 Y 0.038 135. -Pumice stone/cement conglomerate, ext. Y 0.45 1000. -Pumice stone/cement conglomerate, ext. Y 0.55 1200. -Pumice stone/cement conglomerate, ext. Y 0.35 800. -Pumice stone/cement conglomerate, int. Y 0.32 1000. -Pumice stone/cement conglomerate, int. Y 0.40 1200. -Pumice stone/cement conglomerate, int. Y 0.25 800. -Pumice stone/cement conglomerate, Y 0.15 650. -cellularRefractory aggregate aluminous cement, h.f. 400°C, c.f. 40°C C 0.45 1350. -4:1 by vol.Refractory aggregate aluminous cement, h.f. 600°C, c.f. 40°C C 0.47 1350. -4:1 by vol.Refractory aggregate aluminous cement, h.f. 800°C, c.f. 40°C C 0.49 1350. -4:1 by vol.Wood fibre and cement blocks Conditioned C 0.32 1550. -
*** Ceramics ***
Ceramic tiles CSTC, dry T 1.20 2000. 850.Ceramic tiles CSTC, moist T 1.30 2000. -Floor tiles SPPS, dry T 0.80 1700. 850.Hard floor tiles SPPS, moist T 1.10 1700. -
*** Clay Tiles & Blocks ***
Burnt clay tiles Conditioned C 0.85 1900. -Clay soil Y 0.80 1780. -Clay tile, hollow .00762m, 1 cell D 0.54105 1120. 837.Clay tile, hollow .01016m, 1 cell D 0.51923 1120. 837.Clay tile, hollow 01524m, 2 cells D 0.57134 1120. 837.Clay tile, hollow 02032m, 2 cells D 0.62329 1120. 837.Clay tile, hollow 02540m, 2 cells D 0.64908 1120. -Clay tile, hollow 03248m, 3 cells D 0.69254 1120. 837.Clay tile paver D 1.80337 1920. 837.Solid blocks, from expanded clay G 0.22 500. -Solid blocks, from expanded clay G 0.24 600. -Solid blocks, from expanded clay G 0.27 700. -Solid blocks, from expanded clay G 0.31 800. -Tiles, clay E 0.85 1900. 837.Well burnt clay tiles Low exp. S 1.20 2000. 840.Well burnt clay tiles Std exp. S 1.30 2000. 840.
*** Concrete ***
Conc., aerated Low exp., ρ 1000-1400 S 0.42 1200. 840.Conc., aerated Low exp., ρ 700-1000 S 0.29 850. 840.Conc., aerated roofing slab C 0.16 500. 840.Conc., aerated, cellular Low exp. S 0.50 1300. 840.Conc., aerated, cellular Low exp. S 0.35 1000. 840.Conc., aerated, cellular Low exp. S 0.23 700. 840.Conc., aerated, cellular Low exp. S 0.15 400. 840.Conc., aerated, cellular Std exp. S 1.20 1300. 840.Conc., aerated, cellular Std exp. S 0.70 1000. 840.Conc., calcareous compound ρ 1650-1900 F 1.15 1775. -
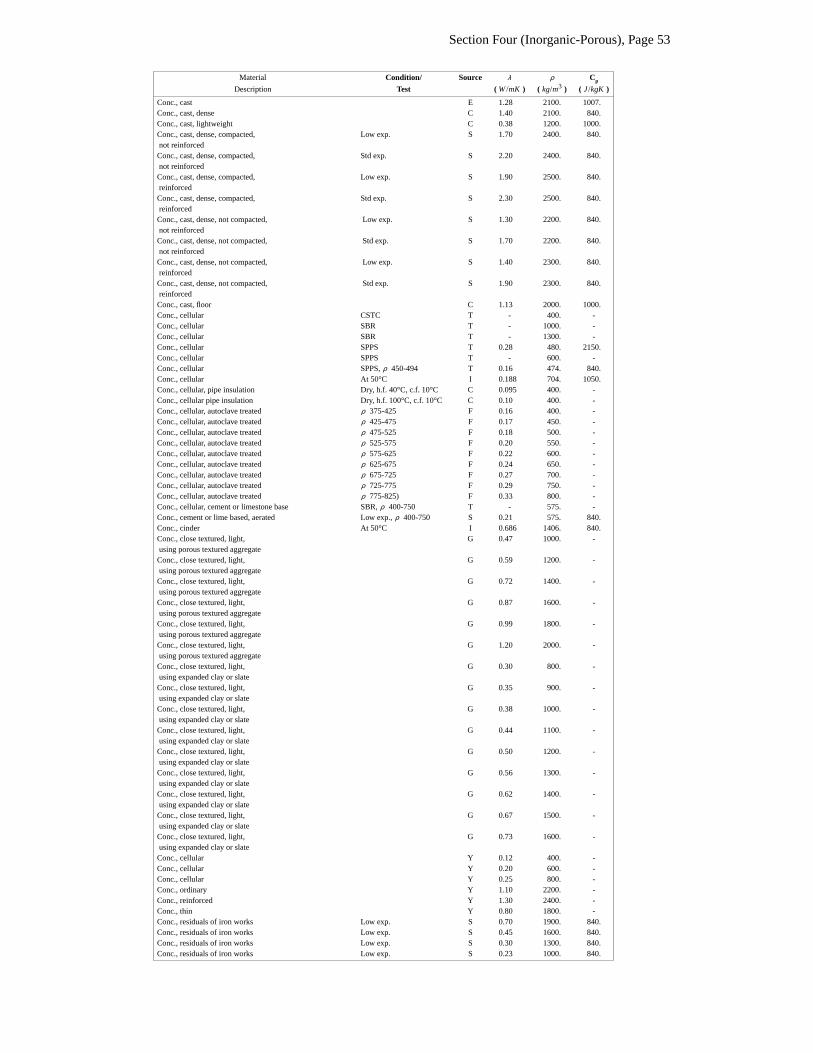
Section Four (Inorganic-Porous), Page 53
Material Condition/ Source λ ρ Cp
Description Test ( W /mK ) ( kg/m3 ) ( J /kgK )
Conc., cast E 1.28 2100. 1007.Conc., cast, dense C 1.40 2100. 840.Conc., cast, lightweight C 0.38 1200. 1000.Conc., cast, dense, compacted, Low exp. S 1.70 2400. 840.not reinforcedConc., cast, dense, compacted, Std exp. S 2.20 2400. 840.not reinforcedConc., cast, dense, compacted, Low exp. S 1.90 2500. 840.reinforcedConc., cast, dense, compacted, Std exp. S 2.30 2500. 840.reinforcedConc., cast, dense, not compacted, Low exp. S 1.30 2200. 840.not reinforcedConc., cast, dense, not compacted, Std exp. S 1.70 2200. 840.not reinforcedConc., cast, dense, not compacted, Low exp. S 1.40 2300. 840.reinforcedConc., cast, dense, not compacted, Std exp. S 1.90 2300. 840.reinforcedConc., cast, floor C 1.13 2000. 1000.Conc., cellular CSTC T - 400. -Conc., cellular SBR T - 1000. -Conc., cellular SBR T - 1300. -Conc., cellular SPPS T 0.28 480. 2150.Conc., cellular SPPS T - 600. -Conc., cellular SPPS, ρ 450-494 T 0.16 474. 840.Conc., cellular At 50°C I 0.188 704. 1050.Conc., cellular, pipe insulation Dry, h.f. 40°C, c.f. 10°C C 0.095 400. -Conc., cellular pipe insulation Dry, h.f. 100°C, c.f. 10°C C 0.10 400. -Conc., cellular, autoclave treated ρ 375-425 F 0.16 400. -Conc., cellular, autoclave treated ρ 425-475 F 0.17 450. -Conc., cellular, autoclave treated ρ 475-525 F 0.18 500. -Conc., cellular, autoclave treated ρ 525-575 F 0.20 550. -Conc., cellular, autoclave treated ρ 575-625 F 0.22 600. -Conc., cellular, autoclave treated ρ 625-675 F 0.24 650. -Conc., cellular, autoclave treated ρ 675-725 F 0.27 700. -Conc., cellular, autoclave treated ρ 725-775 F 0.29 750. -Conc., cellular, autoclave treated ρ 775-825) F 0.33 800. -Conc., cellular, cement or limestone base SBR, ρ 400-750 T - 575. -Conc., cement or lime based, aerated Low exp., ρ 400-750 S 0.21 575. 840.Conc., cinder At 50°C I 0.686 1406. 840.Conc., close textured, light, G 0.47 1000. -using porous textured aggregateConc., close textured, light, G 0.59 1200. -using porous textured aggregateConc., close textured, light, G 0.72 1400. -using porous textured aggregateConc., close textured, light, G 0.87 1600. -using porous textured aggregateConc., close textured, light, G 0.99 1800. -using porous textured aggregateConc., close textured, light, G 1.20 2000. -using porous textured aggregateConc., close textured, light, G 0.30 800. -using expanded clay or slateConc., close textured, light, G 0.35 900. -using expanded clay or slateConc., close textured, light, G 0.38 1000. -using expanded clay or slateConc., close textured, light, G 0.44 1100. -using expanded clay or slateConc., close textured, light, G 0.50 1200. -using expanded clay or slateConc., close textured, light, G 0.56 1300. -using expanded clay or slateConc., close textured, light, G 0.62 1400. -using expanded clay or slateConc., close textured, light, G 0.67 1500. -using expanded clay or slateConc., close textured, light, G 0.73 1600. -using expanded clay or slateConc., cellular Y 0.12 400. -Conc., cellular Y 0.20 600. -Conc., cellular Y 0.25 800. -Conc., ordinary Y 1.10 2200. -Conc., reinforced Y 1.30 2400. -Conc., thin Y 0.80 1800. -Conc., residuals of iron works Low exp. S 0.70 1900. 840.Conc., residuals of iron works Low exp. S 0.45 1600. 840.Conc., residuals of iron works Low exp. S 0.30 1300. 840.Conc., residuals of iron works Low exp. S 0.23 1000. 840.
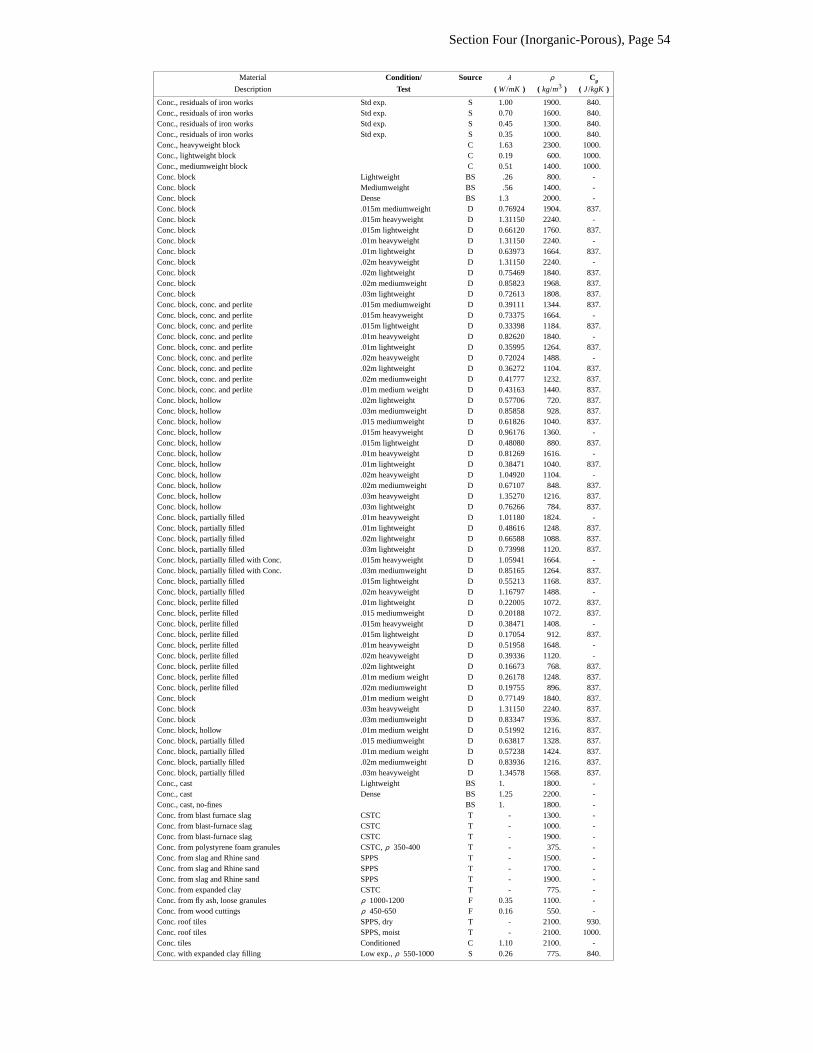
Section Four (Inorganic-Porous), Page 54
Material Condition/ Source λ ρ Cp
Description Test ( W /mK ) ( kg/m3 ) ( J /kgK )
Conc., residuals of iron works Std exp. S 1.00 1900. 840.Conc., residuals of iron works Std exp. S 0.70 1600. 840.Conc., residuals of iron works Std exp. S 0.45 1300. 840.Conc., residuals of iron works Std exp. S 0.35 1000. 840.Conc., heavyweight block C 1.63 2300. 1000.Conc., lightweight block C 0.19 600. 1000.Conc., mediumweight block C 0.51 1400. 1000.Conc. block Lightweight BS .26 800. -Conc. block Mediumweight BS .56 1400. -Conc. block Dense BS 1.3 2000. -Conc. block .015m mediumweight D 0.76924 1904. 837.Conc. block .015m heavyweight D 1.31150 2240. -Conc. block .015m lightweight D 0.66120 1760. 837.Conc. block .01m heavyweight D 1.31150 2240. -Conc. block .01m lightweight D 0.63973 1664. 837.Conc. block .02m heavyweight D 1.31150 2240. -Conc. block .02m lightweight D 0.75469 1840. 837.Conc. block .02m mediumweight D 0.85823 1968. 837.Conc. block .03m lightweight D 0.72613 1808. 837.Conc. block, conc. and perlite .015m mediumweight D 0.39111 1344. 837.Conc. block, conc. and perlite .015m heavyweight D 0.73375 1664. -Conc. block, conc. and perlite .015m lightweight D 0.33398 1184. 837.Conc. block, conc. and perlite .01m heavyweight D 0.82620 1840. -Conc. block, conc. and perlite .01m lightweight D 0.35995 1264. 837.Conc. block, conc. and perlite .02m heavyweight D 0.72024 1488. -Conc. block, conc. and perlite .02m lightweight D 0.36272 1104. 837.Conc. block, conc. and perlite .02m mediumweight D 0.41777 1232. 837.Conc. block, conc. and perlite .01m medium weight D 0.43163 1440. 837.Conc. block, hollow .02m lightweight D 0.57706 720. 837.Conc. block, hollow .03m mediumweight D 0.85858 928. 837.Conc. block, hollow .015 mediumweight D 0.61826 1040. 837.Conc. block, hollow .015m heavyweight D 0.96176 1360. -Conc. block, hollow .015m lightweight D 0.48080 880. 837.Conc. block, hollow .01m heavyweight D 0.81269 1616. -Conc. block, hollow .01m lightweight D 0.38471 1040. 837.Conc. block, hollow .02m heavyweight D 1.04920 1104. -Conc. block, hollow .02m mediumweight D 0.67107 848. 837.Conc. block, hollow .03m heavyweight D 1.35270 1216. 837.Conc. block, hollow .03m lightweight D 0.76266 784. 837.Conc. block, partially filled .01m heavyweight D 1.01180 1824. -Conc. block, partially filled .01m lightweight D 0.48616 1248. 837.Conc. block, partially filled .02m lightweight D 0.66588 1088. 837.Conc. block, partially filled .03m lightweight D 0.73998 1120. 837.Conc. block, partially filled with Conc. .015m heavyweight D 1.05941 1664. -Conc. block, partially filled with Conc. .03m mediumweight D 0.85165 1264. 837.Conc. block, partially filled .015m lightweight D 0.55213 1168. 837.Conc. block, partially filled .02m heavyweight D 1.16797 1488. -Conc. block, perlite filled .01m lightweight D 0.22005 1072. 837.Conc. block, perlite filled .015 mediumweight D 0.20188 1072. 837.Conc. block, perlite filled .015m heavyweight D 0.38471 1408. -Conc. block, perlite filled .015m lightweight D 0.17054 912. 837.Conc. block, perlite filled .01m heavyweight D 0.51958 1648. -Conc. block, perlite filled .02m heavyweight D 0.39336 1120. -Conc. block, perlite filled .02m lightweight D 0.16673 768. 837.Conc. block, perlite filled .01m medium weight D 0.26178 1248. 837.Conc. block, perlite filled .02m mediumweight D 0.19755 896. 837.Conc. block .01m medium weight D 0.77149 1840. 837.Conc. block .03m heavyweight D 1.31150 2240. 837.Conc. block .03m mediumweight D 0.83347 1936. 837.Conc. block, hollow .01m medium weight D 0.51992 1216. 837.Conc. block, partially filled .015 mediumweight D 0.63817 1328. 837.Conc. block, partially filled .01m medium weight D 0.57238 1424. 837.Conc. block, partially filled .02m mediumweight D 0.83936 1216. 837.Conc. block, partially filled .03m heavyweight D 1.34578 1568. 837.Conc., cast Lightweight BS 1. 1800. -Conc., cast Dense BS 1.25 2200. -Conc., cast, no-fines BS 1. 1800. -Conc. from blast furnace slag CSTC T - 1300. -Conc. from blast-furnace slag CSTC T - 1000. -Conc. from blast-furnace slag CSTC T - 1900. -Conc. from polystyrene foam granules CSTC, ρ 350-400 T - 375. -Conc. from slag and Rhine sand SPPS T - 1500. -Conc. from slag and Rhine sand SPPS T - 1700. -Conc. from slag and Rhine sand SPPS T - 1900. -Conc. from expanded clay CSTC T - 775. -Conc. from fly ash, loose granules ρ 1000-1200 F 0.35 1100. -Conc. from wood cuttings ρ 450-650 F 0.16 550. -Conc. roof tiles SPPS, dry T - 2100. 930.Conc. roof tiles SPPS, moist T - 2100. 1000.Conc. tiles Conditioned C 1.10 2100. -Conc. with expanded clay filling Low exp., ρ 550-1000 S 0.26 775. 840.

Section Four (Inorganic-Porous), Page 55
Material Condition/ Source λ ρ Cp
Description Test ( W /mK ) ( kg/m3 ) ( J /kgK )
Conc. with expanded clay filling Low exp., ρ 1000-1800 S 0.60 1400. 840.
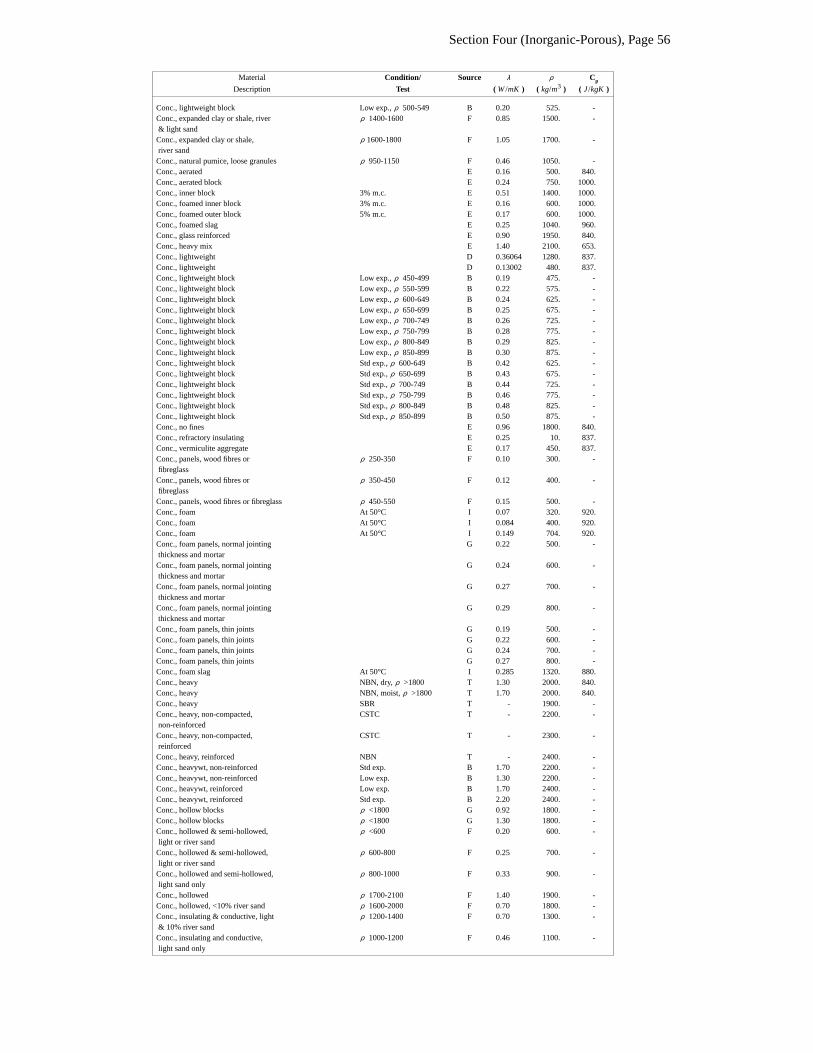
Section Four (Inorganic-Porous), Page 56
Material Condition/ Source λ ρ Cp
Description Test ( W /mK ) ( kg/m3 ) ( J /kgK )
Conc., lightweight block Low exp., ρ 500-549 B 0.20 525. -Conc., expanded clay or shale, river ρ 1400-1600 F 0.85 1500. -& light sandConc., expanded clay or shale, ρ 1600-1800 F 1.05 1700. -river sandConc., natural pumice, loose granules ρ 950-1150 F 0.46 1050. -Conc., aerated E 0.16 500. 840.Conc., aerated block E 0.24 750. 1000.Conc., inner block 3% m.c. E 0.51 1400. 1000.Conc., foamed inner block 3% m.c. E 0.16 600. 1000.Conc., foamed outer block 5% m.c. E 0.17 600. 1000.Conc., foamed slag E 0.25 1040. 960.Conc., glass reinforced E 0.90 1950. 840.Conc., heavy mix E 1.40 2100. 653.Conc., lightweight D 0.36064 1280. 837.Conc., lightweight D 0.13002 480. 837.Conc., lightweight block Low exp., ρ 450-499 B 0.19 475. -Conc., lightweight block Low exp., ρ 550-599 B 0.22 575. -Conc., lightweight block Low exp., ρ 600-649 B 0.24 625. -Conc., lightweight block Low exp., ρ 650-699 B 0.25 675. -Conc., lightweight block Low exp., ρ 700-749 B 0.26 725. -Conc., lightweight block Low exp., ρ 750-799 B 0.28 775. -Conc., lightweight block Low exp., ρ 800-849 B 0.29 825. -Conc., lightweight block Low exp., ρ 850-899 B 0.30 875. -Conc., lightweight block Std exp., ρ 600-649 B 0.42 625. -Conc., lightweight block Std exp., ρ 650-699 B 0.43 675. -Conc., lightweight block Std exp., ρ 700-749 B 0.44 725. -Conc., lightweight block Std exp., ρ 750-799 B 0.46 775. -Conc., lightweight block Std exp., ρ 800-849 B 0.48 825. -Conc., lightweight block Std exp., ρ 850-899 B 0.50 875. -Conc., no fines E 0.96 1800. 840.Conc., refractory insulating E 0.25 10. 837.Conc., vermiculite aggregate E 0.17 450. 837.Conc., panels, wood fibres or ρ 250-350 F 0.10 300. -fibreglassConc., panels, wood fibres or ρ 350-450 F 0.12 400. -fibreglassConc., panels, wood fibres or fibreglass ρ 450-550 F 0.15 500. -Conc., foam At 50°C I 0.07 320. 920.Conc., foam At 50°C I 0.084 400. 920.Conc., foam At 50°C I 0.149 704. 920.Conc., foam panels, normal jointing G 0.22 500. -thickness and mortarConc., foam panels, normal jointing G 0.24 600. -thickness and mortarConc., foam panels, normal jointing G 0.27 700. -thickness and mortarConc., foam panels, normal jointing G 0.29 800. -thickness and mortarConc., foam panels, thin joints G 0.19 500. -Conc., foam panels, thin joints G 0.22 600. -Conc., foam panels, thin joints G 0.24 700. -Conc., foam panels, thin joints G 0.27 800. -Conc., foam slag At 50°C I 0.285 1320. 880.Conc., heavy NBN, dry, ρ >1800 T 1.30 2000. 840.Conc., heavy NBN, moist, ρ >1800 T 1.70 2000. 840.Conc., heavy SBR T - 1900. -Conc., heavy, non-compacted, CSTC T - 2200. -non-reinforcedConc., heavy, non-compacted, CSTC T - 2300. -reinforcedConc., heavy, reinforced NBN T - 2400. -Conc., heavywt, non-reinforced Std exp. B 1.70 2200. -Conc., heavywt, non-reinforced Low exp. B 1.30 2200. -Conc., heavywt, reinforced Low exp. B 1.70 2400. -Conc., heavywt, reinforced Std exp. B 2.20 2400. -Conc., hollow blocks ρ <1800 G 0.92 1800. -Conc., hollow blocks ρ <1800 G 1.30 1800. -Conc., hollowed & semi-hollowed, ρ <600 F 0.20 600. -light or river sandConc., hollowed & semi-hollowed, ρ 600-800 F 0.25 700. -light or river sandConc., hollowed and semi-hollowed, ρ 800-1000 F 0.33 900. -light sand onlyConc., hollowed ρ 1700-2100 F 1.40 1900. -Conc., hollowed, <10% river sand ρ 1600-2000 F 0.70 1800. -Conc., insulating & conductive, light ρ 1200-1400 F 0.70 1300. -& 10% river sandConc., insulating and conductive, ρ 1000-1200 F 0.46 1100. -light sand only
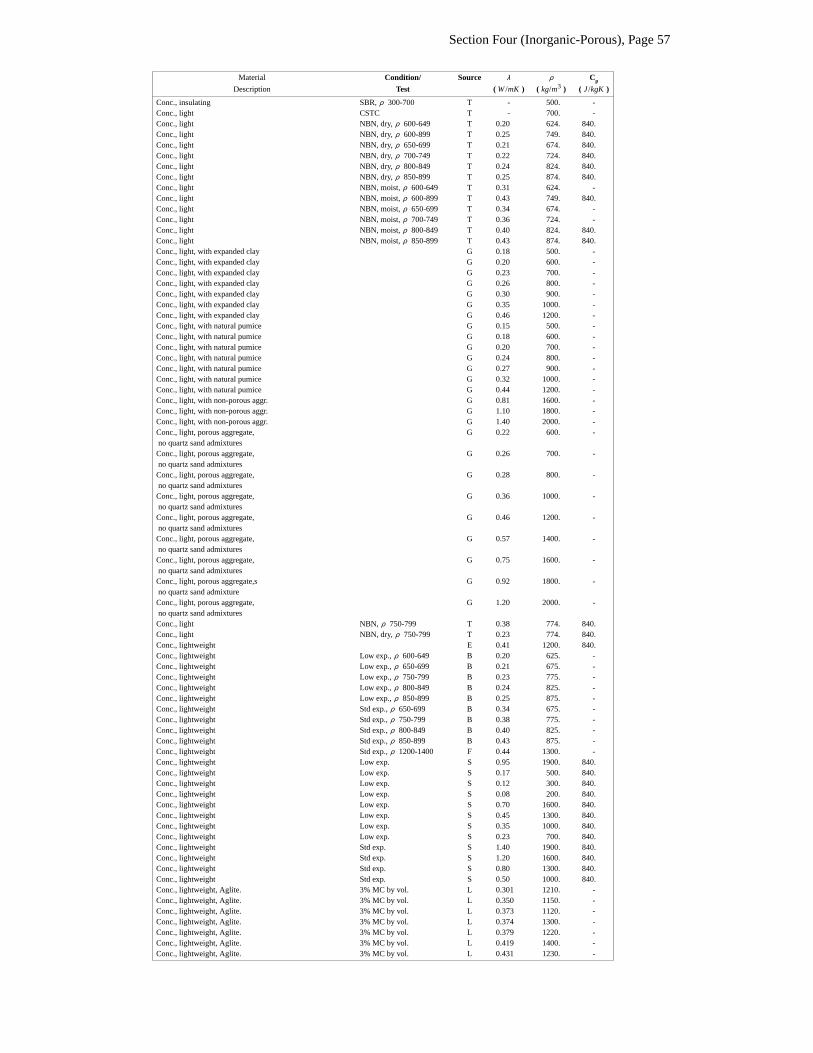
Section Four (Inorganic-Porous), Page 57
Material Condition/ Source λ ρ Cp
Description Test ( W /mK ) ( kg/m3 ) ( J /kgK )
Conc., insulating SBR, ρ 300-700 T - 500. -Conc., light CSTC T - 700. -Conc., light NBN, dry, ρ 600-649 T 0.20 624. 840.Conc., light NBN, dry, ρ 600-899 T 0.25 749. 840.Conc., light NBN, dry, ρ 650-699 T 0.21 674. 840.Conc., light NBN, dry, ρ 700-749 T 0.22 724. 840.Conc., light NBN, dry, ρ 800-849 T 0.24 824. 840.Conc., light NBN, dry, ρ 850-899 T 0.25 874. 840.Conc., light NBN, moist, ρ 600-649 T 0.31 624. -Conc., light NBN, moist, ρ 600-899 T 0.43 749. 840.Conc., light NBN, moist, ρ 650-699 T 0.34 674. -Conc., light NBN, moist, ρ 700-749 T 0.36 724. -Conc., light NBN, moist, ρ 800-849 T 0.40 824. 840.Conc., light NBN, moist, ρ 850-899 T 0.43 874. 840.Conc., light, with expanded clay G 0.18 500. -Conc., light, with expanded clay G 0.20 600. -Conc., light, with expanded clay G 0.23 700. -Conc., light, with expanded clay G 0.26 800. -Conc., light, with expanded clay G 0.30 900. -Conc., light, with expanded clay G 0.35 1000. -Conc., light, with expanded clay G 0.46 1200. -Conc., light, with natural pumice G 0.15 500. -Conc., light, with natural pumice G 0.18 600. -Conc., light, with natural pumice G 0.20 700. -Conc., light, with natural pumice G 0.24 800. -Conc., light, with natural pumice G 0.27 900. -Conc., light, with natural pumice G 0.32 1000. -Conc., light, with natural pumice G 0.44 1200. -Conc., light, with non-porous aggr. G 0.81 1600. -Conc., light, with non-porous aggr. G 1.10 1800. -Conc., light, with non-porous aggr. G 1.40 2000. -Conc., light, porous aggregate, G 0.22 600. -no quartz sand admixturesConc., light, porous aggregate, G 0.26 700. -no quartz sand admixturesConc., light, porous aggregate, G 0.28 800. -no quartz sand admixturesConc., light, porous aggregate, G 0.36 1000. -no quartz sand admixturesConc., light, porous aggregate, G 0.46 1200. -no quartz sand admixturesConc., light, porous aggregate, G 0.57 1400. -no quartz sand admixturesConc., light, porous aggregate, G 0.75 1600. -no quartz sand admixturesConc., light, porous aggregate,s G 0.92 1800. -no quartz sand admixtureConc., light, porous aggregate, G 1.20 2000. -no quartz sand admixturesConc., light NBN, ρ 750-799 T 0.38 774. 840.Conc., light NBN, dry, ρ 750-799 T 0.23 774. 840.Conc., lightweight E 0.41 1200. 840.Conc., lightweight Low exp., ρ 600-649 B 0.20 625. -Conc., lightweight Low exp., ρ 650-699 B 0.21 675. -Conc., lightweight Low exp., ρ 750-799 B 0.23 775. -Conc., lightweight Low exp., ρ 800-849 B 0.24 825. -Conc., lightweight Low exp., ρ 850-899 B 0.25 875. -Conc., lightweight Std exp., ρ 650-699 B 0.34 675. -Conc., lightweight Std exp., ρ 750-799 B 0.38 775. -Conc., lightweight Std exp., ρ 800-849 B 0.40 825. -Conc., lightweight Std exp., ρ 850-899 B 0.43 875. -Conc., lightweight Std exp., ρ 1200-1400 F 0.44 1300. -Conc., lightweight Low exp. S 0.95 1900. 840.Conc., lightweight Low exp. S 0.17 500. 840.Conc., lightweight Low exp. S 0.12 300. 840.Conc., lightweight Low exp. S 0.08 200. 840.Conc., lightweight Low exp. S 0.70 1600. 840.Conc., lightweight Low exp. S 0.45 1300. 840.Conc., lightweight Low exp. S 0.35 1000. 840.Conc., lightweight Low exp. S 0.23 700. 840.Conc., lightweight Std exp. S 1.40 1900. 840.Conc., lightweight Std exp. S 1.20 1600. 840.Conc., lightweight Std exp. S 0.80 1300. 840.Conc., lightweight Std exp. S 0.50 1000. 840.Conc., lightweight, Aglite. 3% MC by vol. L 0.301 1210. -Conc., lightweight, Aglite. 3% MC by vol. L 0.350 1150. -Conc., lightweight, Aglite. 3% MC by vol. L 0.373 1120. -Conc., lightweight, Aglite. 3% MC by vol. L 0.374 1300. -Conc., lightweight, Aglite. 3% MC by vol. L 0.379 1220. -Conc., lightweight, Aglite. 3% MC by vol. L 0.419 1400. -Conc., lightweight, Aglite. 3% MC by vol. L 0.431 1230. -
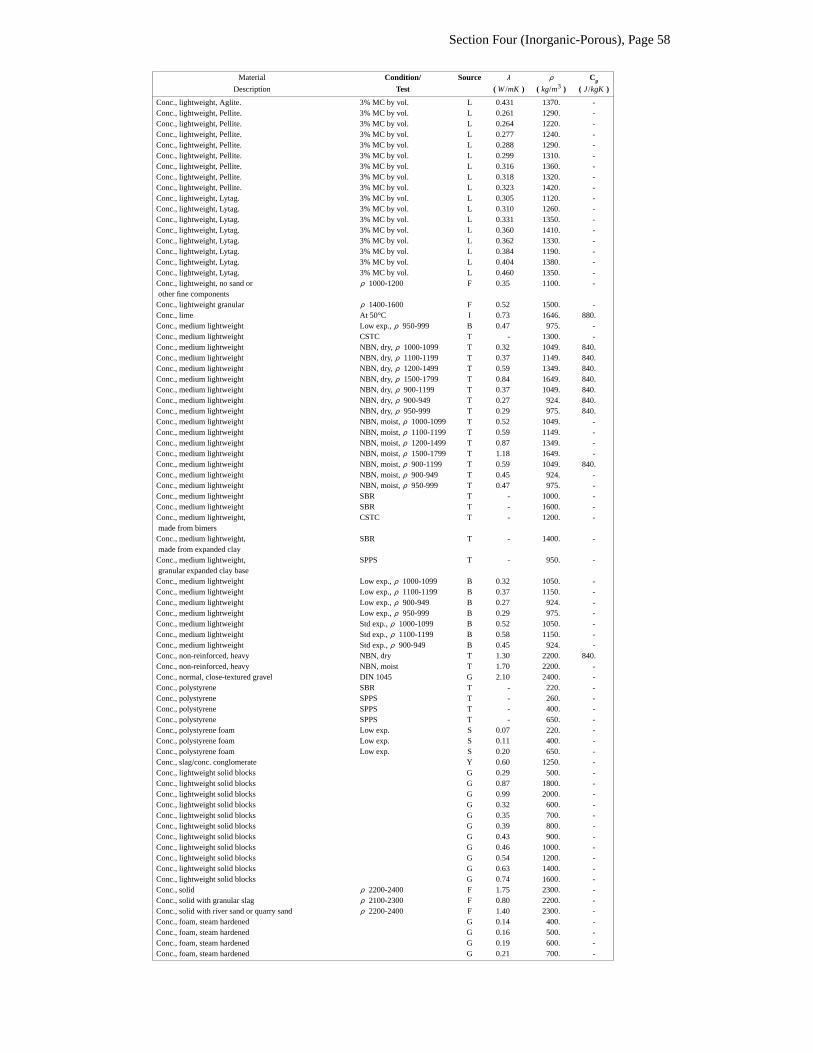
Section Four (Inorganic-Porous), Page 58
Material Condition/ Source λ ρ Cp
Description Test ( W /mK ) ( kg/m3 ) ( J /kgK )
Conc., lightweight, Aglite. 3% MC by vol. L 0.431 1370. -Conc., lightweight, Pellite. 3% MC by vol. L 0.261 1290. -Conc., lightweight, Pellite. 3% MC by vol. L 0.264 1220. -Conc., lightweight, Pellite. 3% MC by vol. L 0.277 1240. -Conc., lightweight, Pellite. 3% MC by vol. L 0.288 1290. -Conc., lightweight, Pellite. 3% MC by vol. L 0.299 1310. -Conc., lightweight, Pellite. 3% MC by vol. L 0.316 1360. -Conc., lightweight, Pellite. 3% MC by vol. L 0.318 1320. -Conc., lightweight, Pellite. 3% MC by vol. L 0.323 1420. -Conc., lightweight, Lytag. 3% MC by vol. L 0.305 1120. -Conc., lightweight, Lytag. 3% MC by vol. L 0.310 1260. -Conc., lightweight, Lytag. 3% MC by vol. L 0.331 1350. -Conc., lightweight, Lytag. 3% MC by vol. L 0.360 1410. -Conc., lightweight, Lytag. 3% MC by vol. L 0.362 1330. -Conc., lightweight, Lytag. 3% MC by vol. L 0.384 1190. -Conc., lightweight, Lytag. 3% MC by vol. L 0.404 1380. -Conc., lightweight, Lytag. 3% MC by vol. L 0.460 1350. -Conc., lightweight, no sand or ρ 1000-1200 F 0.35 1100. -other fine componentsConc., lightweight granular ρ 1400-1600 F 0.52 1500. -Conc., lime At 50°C I 0.73 1646. 880.Conc., medium lightweight Low exp., ρ 950-999 B 0.47 975. -Conc., medium lightweight CSTC T - 1300. -Conc., medium lightweight NBN, dry, ρ 1000-1099 T 0.32 1049. 840.Conc., medium lightweight NBN, dry, ρ 1100-1199 T 0.37 1149. 840.Conc., medium lightweight NBN, dry, ρ 1200-1499 T 0.59 1349. 840.Conc., medium lightweight NBN, dry, ρ 1500-1799 T 0.84 1649. 840.Conc., medium lightweight NBN, dry, ρ 900-1199 T 0.37 1049. 840.Conc., medium lightweight NBN, dry, ρ 900-949 T 0.27 924. 840.Conc., medium lightweight NBN, dry, ρ 950-999 T 0.29 975. 840.Conc., medium lightweight NBN, moist, ρ 1000-1099 T 0.52 1049. -Conc., medium lightweight NBN, moist, ρ 1100-1199 T 0.59 1149. -Conc., medium lightweight NBN, moist, ρ 1200-1499 T 0.87 1349. -Conc., medium lightweight NBN, moist, ρ 1500-1799 T 1.18 1649. -Conc., medium lightweight NBN, moist, ρ 900-1199 T 0.59 1049. 840.Conc., medium lightweight NBN, moist, ρ 900-949 T 0.45 924. -Conc., medium lightweight NBN, moist, ρ 950-999 T 0.47 975. -Conc., medium lightweight SBR T - 1000. -Conc., medium lightweight SBR T - 1600. -Conc., medium lightweight, CSTC T - 1200. -made from bimersConc., medium lightweight, SBR T - 1400. -made from expanded clayConc., medium lightweight, SPPS T - 950. -granular expanded clay baseConc., medium lightweight Low exp., ρ 1000-1099 B 0.32 1050. -Conc., medium lightweight Low exp., ρ 1100-1199 B 0.37 1150. -Conc., medium lightweight Low exp., ρ 900-949 B 0.27 924. -Conc., medium lightweight Low exp., ρ 950-999 B 0.29 975. -Conc., medium lightweight Std exp., ρ 1000-1099 B 0.52 1050. -Conc., medium lightweight Std exp., ρ 1100-1199 B 0.58 1150. -Conc., medium lightweight Std exp., ρ 900-949 B 0.45 924. -Conc., non-reinforced, heavy NBN, dry T 1.30 2200. 840.Conc., non-reinforced, heavy NBN, moist T 1.70 2200. -Conc., normal, close-textured gravel DIN 1045 G 2.10 2400. -Conc., polystyrene SBR T - 220. -Conc., polystyrene SPPS T - 260. -Conc., polystyrene SPPS T - 400. -Conc., polystyrene SPPS T - 650. -Conc., polystyrene foam Low exp. S 0.07 220. -Conc., polystyrene foam Low exp. S 0.11 400. -Conc., polystyrene foam Low exp. S 0.20 650. -Conc., slag/conc. conglomerate Y 0.60 1250. -Conc., lightweight solid blocks G 0.29 500. -Conc., lightweight solid blocks G 0.87 1800. -Conc., lightweight solid blocks G 0.99 2000. -Conc., lightweight solid blocks G 0.32 600. -Conc., lightweight solid blocks G 0.35 700. -Conc., lightweight solid blocks G 0.39 800. -Conc., lightweight solid blocks G 0.43 900. -Conc., lightweight solid blocks G 0.46 1000. -Conc., lightweight solid blocks G 0.54 1200. -Conc., lightweight solid blocks G 0.63 1400. -Conc., lightweight solid blocks G 0.74 1600. -Conc., solid ρ 2200-2400 F 1.75 2300. -Conc., solid with granular slag ρ 2100-2300 F 0.80 2200. -Conc., solid with river sand or quarry sand ρ 2200-2400 F 1.40 2300. -Conc., foam, steam hardened G 0.14 400. -Conc., foam, steam hardened G 0.16 500. -Conc., foam, steam hardened G 0.19 600. -Conc., foam, steam hardened G 0.21 700. -

Section Four (Inorganic-Porous), Page 59
Material Condition/ Source λ ρ Cp
Description Test ( W /mK ) ( kg/m3 ) ( J /kgK )
Conc., foam, steam hardened G 0.23 800. -Conc. tiles E 1.10 2100. 837.Conc., very light CSTC T - 200. -Conc., very light CSTC T - 500. -Conc., very light CSTC T - 300. -Conc., very light NBN, ρ 350-399 T 0.14 374. 840.Conc., very light NBN, ρ 400-449 T 0.15 424. 840.Conc., very light NBN, ρ 450-499 T 0.16 474. 840.Conc., very light NBN, ρ 500-549 T 0.17 524. 840.Conc., very light NBN, ρ 500-599 T 0.18 574. 840.Conc., very light NBN, ρ <350 T 0.12 350. 840.Conc., very light NBN, ρ <599 T 0.18 597. 840.Conc., very light SBR T - 200. -Conc., very light Low exp., ρ 350-399 B 0.14 375. -Conc., very light Low exp., ρ 400-449 B 0.15 425. -Conc., very light Low exp., ρ 450-499 B 0.16 475. -Conc., very light Low exp., ρ 500-549 B 0.17 525. -Conc., very light Low exp., ρ 550-599 B 0.18 575. -Conc., very light Low exp., ρ <350 B 0.12 350. -Conc. wall panels, light G 0.29 800. -Conc. wall panels, light G 0.32 900. -Conc. wall panels, light G 0.37 1000. -Conc. wall panels, light G 0.47 1200. -Conc. wall panels, light G 0.58 1400. -Conc., lightweight Low exp., ρ 700-749 B 0.22 725. -Conc., lightweight Std exp., ρ 700-749 B 0.36 725. -Conc., light mix E 0.38 1200. 653.Conc. conglomerate in granules SPPS T - 2100. -Conc., dense At 50°C I 1.74 2410. 880.Conc., dense 1.9% MC by vol. L 0.593 1551. -Conc., dense 3.6% MC by vol. L 0.810 1818. -Conc., dense 1.8% MC by vol. L 1.379 1899. -Conc., dense 3.0% MC by vol. L 1.770 2207. -Conc., dense 2.7% MC by vol. L 2.532 2236. -Conc., dense 4.8% MC by vol. L 3.207 2341. -
*** Masonry ***
Masonry, blast furnace slag G 0.47 1000. -Masonry, blast furnace slag G 0.52 1200. -Masonry, blast furnace slag G 0.58 1400. -Masonry, blast furnace slag G 0.64 1600. -Masonry, blast furnace slag G 0.70 1800. -Masonry, blast furnace slag G 0.76 2000. -Masonry, calcareous sand stones G 0.50 1000. -Masonry, calcareous sand stones G 0.56 1200. -Masonry, calcareous sand stones G 0.70 1400. -Masonry, calcareous sand stones G 0.79 1600. -Masonry, calcareous sand stones G 0.99 1800. -Masonry, calcareous sand stones G 1.10 2000. -Masonry, calcareous sand stones G 1.30 2200. -Masonry, cellular bonded conc. SPPS, ρ 500-549 T 0.30 524. 2040.Masonry, cellular bonded conc. SPPS, ρ 600-649 T - 624. 1850.Masonry, cellular cemented conc. SPPS, ρ 650-699 T - 674. 1770.Masonry, foam conc. blocks G 0.22 500. -Masonry, foam conc. blocks G 0.24 600. -Masonry, foam conc. blocks G 0.27 700. -Masonry, foam conc. blocks G 0.29 800. -Masonry, hollowed engineering brick G 0.81 1800. -Masonry, light blocks NBN, dry, ρ 600-649 T 0.24 624. 840.Masonry, light blocks NBN, dry, ρ 600-899 T 0.30 749. 840.Masonry, light blocks NBN, dry, ρ 650-699 T 0.25 674. 840.Masonry, light blocks NBN, dry, ρ 700-749 T 0.26 724. 840.Masonry, light blocks NBN, dry, ρ 750-799 T 0.28 774. 840.Masonry, light blocks NBN, dry, ρ 800-849 T 0.29 824. 840.Masonry, light blocks NBN, dry, ρ 850-899 T 0.30 874. 840.Masonry, light blocks NBN, moist, ρ 600-649 T 0.42 624. -Masonry, light blocks NBN, moist, ρ 600-899 T 0.50 749. -Masonry, light blocks NBN, moist, ρ 650-699 T 0.43 674. -Masonry, light blocks NBN, moist, ρ 700-749 T 0.44 724. -Masonry, light blocks NBN, moist, ρ 750-799 T 0.46 774. -Masonry, light blocks NBN, moist, ρ 800-849 T 0.48 824. -Masonry, light blocks NBN, moist, ρ 850-899 T 0.50 874. -Masonry, light conc. air bricks G 0.35 600. -Masonry, light conc. air bricks G 0.40 700. -Masonry, light conc. air bricks G 0.47 800. -Masonry, light conc. air bricks G 0.56 900. -Masonry, light conc. air bricks G 0.65 1000. -Masonry, light conc. air bricks G 0.77 1200. -Masonry, light conc. air bricks G 0.91 1400. -Masonry, light conc. air bricks G 1.00 1600. -

Section Four (Inorganic-Porous), Page 60
Material Condition/ Source λ ρ Cp
Description Test ( W /mK ) ( kg/m3 ) ( J /kgK )
Masonry, light conc. hollow blocks G 0.29 500. -Masonry, light conc. hollow blocks G 0.29 500. -Masonry, light conc. hollow blocks G 0.32 600. -Masonry, light conc. hollow blocks G 0.34 600. -Masonry, light conc. hollow blocks G 0.35 700. -Masonry, light conc. hollow blocks G 0.39 700. -Masonry, light conc. hollow blocks G 0.39 800. -Masonry, light conc. hollow blocks G 0.46 800. -Masonry, light conc. hollow blocks G 0.44 900. -Masonry, light conc. hollow blocks G 0.55 900. -Masonry, light conc. hollow blocks G 0.49 1000. -Masonry, light conc. hollow blocks G 0.64 1000. -Masonry, light conc. hollow blocks G 0.76 1200. -Masonry, light conc. hollow blocks G 0.60 1200. -Masonry, light conc. hollow blocks G 0.73 1400. -Masonry, light conc. hollow blocks G 0.90 1400. -Masonry, mediumweight blocks NBN, dry, ρ 1000-1099 T 0.35 1049. 840.Masonry, mediumweight blocks NBN, dry, ρ 1100-1199 T 0.40 1149. 840.Masonry, mediumweight blocks NBN, dry, ρ 900-1199 T 0.40 1049. 840.Masonry, mediumweight blocks NBN, dry, ρ 900-949 T 0.31 924. 840.Masonry, mediumweight blocks NBN, dry, ρ 950-999 T 0.32 974. 840.Masonry, mediumweight blocks NBN, moist, ρ 1000-1099 T 0.58 1049. -Masonry, mediumweight blocks NBN, moist, ρ 1100-1199 T 0.62 1149. -Masonry, mediumweight blocks NBN, moist, ρ 90-1199 T 0.62 1049. -Masonry, mediumweight blocks NBN, moist, ρ 900-949 T 0.52 924. -Masonry, mediumweight blocks NBN, moist, ρ 950-999 T 0.55 974. -Masonry, plaster blocks SPPS T 0.35 - 860.Masonry, quarrystones, calcareous, NBN, dry T 1.40 2200. 840.semi-firmMasonry, quarrystones, calcareous, NBN, moist T 1.69 2200. -semi-firmMasonry, semi-heavy blocks CSTC, ρ >1401 T - 1401. -Masonry, semi-heavy blocks NBN T - 1400. -Masonry, semi-heavy blocks NBN, dry, ρ 1200-1449 T 0.60 1349. 840.Masonry, semi-heavy blocks NBN, dry, ρ 1500-1799 T 0.85 1649. 840.Masonry, semi-heavy blocks NBN, dry, ρ >1800 T 1.30 1800. 840.Masonry, semi-heavy blocks NBN, moist, ρ 1200-1449 T 0.90 1349. -Masonry, semi-heavy blocks NBN, moist, ρ >1800 T 1.70 1800. -Masonry, semi-heavy blocks moist, ρ 1500-1799 T 1.20 1649. -Masonry, silico-chalk bricks CSTC, ρ <1400 T - 1400. -Masonry, silico-chalk bricks CSTC, ρ >1400 T - 1400. -Masonry, silico-chalk bricks SBR, ρ >1400 T - 2000. -Masonry, solid engineering brick G 0.96 2000. -Masonry, solid engineering & hollowed brick G 0.50 1200. -Masonry, solid engineering & hollowed brick G 0.58 1400. -Masonry, solid engineering & hollowed brick G 0.68 1600. -Masonry, solid engineering & hollowed brick G 0.81 1800. -Masonry, solid engineering & hollowed brick G 0.96 2000. -Masonry, very light blocks CSTC, ρ 500-800 T - 650. -Masonry, very light blocks NBN, ρ 450-499 T 0.19 474. 840.Masonry, very light blocks NBN, ρ 500-549 T 0.20 524. 840.Masonry, very light blocks NBN, ρ 550-599 T 0.22 574. 840.Masonry, very light blocks NBN, ρ <599 T 0.22 599. 840.Masonry, heavy Low exp., ρ 1900-1999 B 0.79 1950. -Masonry, heavy Low exp., ρ 2000-2099 B 0.90 2050. -Masonry, heavy Std exp., ρ 1700-1799 B 0.87 1750. -Masonry, heavy Std exp., ρ 1900-1999 B 1.00 1950. -Masonry, heavy Std exp., ρ 2000-2099 B 1.10 2050. -Masonry, heavy Low exp., ρ 1600-1699 B 0.60 1650. -Masonry, heavy Low exp., ρ 1700-1799 B 0.66 1750. -Masonry, heavy Low exp., ρ 1800-1899 B 0.73 1850. -Masonry, heavy Std exp., ρ 1600-1699 B 0.81 1650. -Masonry, heavy Std exp., ρ 1800-1899 B 0.94 1850. -Masonry, mediumweight blocks Low exp., ρ 1000-1099 B 0.35 1050. -Masonry, mediumweight blocks Low exp., ρ 1100-1199 B 0.40 1150. -Masonry, mediumweight blocks Low exp., ρ 950-999 B 0.32 975. -Masonry, mediumweight blocks Low exp., ρ 900-949 B 0.31 925. -Masonry, mediumweight blocks Std exp., ρ 1000-1099 B 0.58 1050. -Masonry, mediumweight blocks Std exp., ρ 1100-1199 B 0.62 1150. -Masonry, mediumweight blocks Std exp., ρ 900-949 B 0.52 925. -Masonry, mediumweight blocks Std exp., ρ 950-999 B 0.55 975. -Masonry, semi-heavy blocks Low exp., ρ >1200 B 1.30 1200. -Masonry, semi-heavy blocks Std exp., ρ >1200 B 1.70 1200. -Masonry, mediumweight CSTC T - 1300. -Masonry, mediumweight CSTC T - 1500. -Masonry, mediumweight NBN, dry, ρ 1000-1099 T 0.32 1049. 840.Masonry, mediumweight NBN, dry, ρ 1000-1599 T 0.54 1299. 840.Masonry, mediumweight NBN, dry, ρ 1100-1199 T 0.37 1149. 840.Masonry, mediumweight NBN, dry, ρ 1200-1299 T 0.42 1249. 840.Masonry, mediumweight NBN, dry, ρ 1300-1399 T 0.45 1349. 840.Masonry, mediumweight NBN, dry, ρ 1400-1499 T 0.49 1449. 840.

Section Four (Inorganic-Porous), Page 61
Material Condition/ Source λ ρ Cp
Description Test ( W /mK ) ( kg/m3 ) ( J /kgK )
Masonry, mediumweight NBN, dry, ρ 1500-1599 T 0.54 1549. 840.Masonry, mediumweight NBN, moist, ρ 1000-1099 T 0.47 1049. -Masonry, mediumweight NBN, moist, ρ 1000-1599 T 0.75 1299. -Masonry, mediumweight NBN, moist, ρ 1100-1199 T 0.52 1149. -Masonry, mediumweight NBN, moist, ρ 1300-1399 T 0.63 1349. -Masonry, mediumweight NBN, moist, ρ 1400-1499 T 0.69 1449. -Masonry, mediumweight NBN, moist, ρ 1500-1599 T 0.75 1549. -Masonry, heavyweight CSTC T - 2100. -Masonry, heavyweight NBN, ρ 1700-1900 T - 1800. -Masonry, heavyweight NBN, dry, ρ 1600-2099 T 0.90 1849. 840.Masonry, heavyweight NBN, dry, ρ 1600-1699 T 0.60 1649. -Masonry, heavyweight NBN, dry, ρ 1700-1799 T 0.66 1749. -Masonry, heavyweight NBN, dry, ρ 1800-1899 T 0.73 1849. 840.Masonry, heavyweight NBN, dry, ρ 1900-1999 T 0.79 1949. 840.Masonry, heavyweight NBN, dry, ρ 2000-2099 T 0.90 2049. 840.Masonry, heavyweight NBN, moist, ρ 1600-1699 T 0.81 1649. 840.Masonry, heavyweight NBN, moist, ρ 1600-2099 T 1.10 1849. -Masonry, heavyweight NBN, moist, ρ 1700-1799 T 0.87 1749. -Masonry, heavyweight NBN, moist, ρ 1800-1899 T 0.94 1849. -Masonry, heavyweight NBN, moist, ρ 1900-1999 T 1.00 1949. -Masonry, heavyweight NBN, moist, ρ 2000-2099 T 1.10 2049. -Masonry, heavyweight SBR T - 1700. -Masonry, lightweight NBN, moist, ρ 1200-1299 T 0.58 1249. -Masonry, lightweight CSTC, ρ 700-1000 T - 850. -Masonry, lightweight CSTC, moist, ρ 700-1000 T 0.34 749. -Masonry, lightweight NBN, dry, ρ 700-799 T 0.22 749. 840.Masonry, lightweight NBN, dry, ρ 700-999 T 0.27 849. 840.Masonry, lightweight NBN, dry, ρ 800-899 T 0.24 849. 840.Masonry, lightweight NBN, dry, ρ 900-999 T 0.27 949. 840.Masonry, lightweight NBN, moist, ρ 700-999 T 0.41 849. -Masonry, lightweight NBN, moist, ρ 800-899 T 0.36 849. -Masonry, lightweight NBN, moist, ρ 900-999 T 0.41 949. -Masonry, lightweight SPPS T 0.20 500. -Masonry, lightweight SPPS T 0.22 600. -
*** Miscellaneous ***
Asbestos, fibre Y 0.055 57. -Asbestos, millboard Y 0.17 970. -Asbestos, sprayed Y 0.032 160. -Calcium silicate brick Low exp. S 1.00 2000. 840.Calcium silicate brick Std exp. S 1.50 2000. 840.Coal, pulverized powder Conditioned C 0.065 575. -Composition flooring Conditioned C 0.44 1600. -Composition flooring Soaked C 0.85 1890. -Composition flooring, hard Dry C 0.65 2100. -Composition flooring, hard Wet C 0.80 2200. -Composition flooring Wet C 0.58 1730. -Diatomaceous refractory aggregate Dry, h.f. 300°C, c.f. 40°C C 0.25 1050. -Diatomaceous refractory aggregate Dry, h.f. 500°C, c.f. 40°C C 0.26 1050. -Diatomaceous refractory aggregate Dry, h.f. 800°C, c.f. 40°C C 0.27 1050. -Dried aggregate D 1.31167 2240. 837.36Floor bricks, ceramic tiles Low exp. S 0.80 1700. 840.Floor bricks, ceramic tiles Std exp. S 1.10 1700. 840.Gatch, aerated and baked C 0.22 650. -Granolithic E 0.87 2085. 837.Granolithic, aerated and baked C 0.865 2085. -Gypsum plaster, perlite aggregate A 0.2163 720. 1339.84Gypsum plaster, sand aggregate A 0.80752 1680. 837.4Lime stone At 50°C I 1.80 2420. 840.Magnesia with 15% asbestos Y 0.06 300. -Magnesia based panels SPPS, dry, ρ 400-500 T 0.10 450. -Magnesia based panels SPPS, moist, ρ 400-500 T 0.12 450. -Mosaic Y 1.200 - -Mud phuska At 50°C I 0.51900 1622. 880.Paving stones At 50°C G 1.00 2000. -Pumice stone, natural Y 0.20 390. -Quarrystone, semi-firm, calcareous Low exp. B 1.40 - -R.C.C. At 50°C I 1.58 2288. 880.Render and jointing mortars F 1.15 1950. -Roof tiling or slating BS 0.83 - -Sand, gravel or stone aggregate, not dried A 1.73040 2240. -Sand, gravel or stone aggregate, oven dried A 1.29780 2240. 921.140,Sandstone components Low exp. B 1.20 2000. -Sandstone components Std exp. B 1.30 2000. -Siporex E 0.12 550. 1004.Slate At 50°C I 1.72 2750. 840.Terracotta ρ 1800-1900 F 1.15 2000. -Terracotta tiles Low exp. B 0.81 1700. -Terracotta tiles Std exp. B 1.00 1700. -Terrazo Conditioned C 1.59 2435. -

Section Four (Inorganic-Porous), Page 62
Material Condition/ Source λ ρ Cp
Description Test ( W /mK ) ( kg/m3 ) ( J /kgK )
Thermalite E 0.19 753. 837.Tile and lay-in panel building board A 0.05768 288. 586.180,Tile bedding E 1.40 2100. 650.Tiles, hanging C 0.84 1900. 800.

Section Four (Inorganic-Porous), Page 63
Material Condition/ Source λ ρ Cp
Description Test ( W /mK ) ( kg/m3 ) ( J /kgK )
Tufa Y 0.54 1550. -Tufa Y 1.44 2270. 99.Undried aggregate D 1.80355 2240. 837.360,
*** Pumice Related ***
Solid blocks, made from pumice G 0.20 500. -Solid blocks, made from pumice G 0.22 600. -Solid blocks, made from pumice G 0.25 700. -Solid blocks, made from pumice G 0.28 800. -
*** Roofing ***
Artificial slate SPPS, dry T - - 1010.Artificial slate SPPS, moist T - - 1200.Built up roofing D 0.16257 1120. 1465.Roof tile C 0.84 1900. 800.Roof tiles SPPS, dry, ρ 1800-2000 T - 1900. 850.Roof tiles SPPS, moist, ρ 1800-2000 T - 1900. 1010.Terracotta roof tiles CSTC T - 1600. -Terracotta tiles NBN T 81. 1700. 840.
*** Soil ***
Alluvial clay, 40% sands I 1.211 1958. 840.Black cotton clay, Indore I 0.606 1683. 880.Black cotton clay, Madras I 0.735 1899. 880.Blocks of compacted earth ρ 1700-1900 F 1.05 1800. -Bonded soils G 2.10 - -Clay soil C 1.50 - -Clay soil, loaded 100kPa 14% d.w. C 1.20 1550. -Clay soil, loaded 5kPa 14% d.w. C 0.70 1280. -Clay soil, loosely packed 14% d.w. C 0.38 1200. -Clay soil, depth 1.5m 11% d.w. C 1.10 - -Clay soil, depth 3 m 11% d.w. C 1.10 - -Clay soil, depth 6 m 11% d.w. C 1.15 - -Clay soil, depth 8 m 11% d.w. C 1.25 - -Diatomaceous Kieselguhr 9% m.c. C 0.09 480. -or infusorial earthEarth, common E 1.28 1460. 879.Earth, gravel based E 0.52 2050. 184.Earth, infusorial 9% m.c. E 0.09 480. 180.Loam Wet C 1.20 - -Loam over sand & gravel, 1m deep C 1.27 - -Mud 10% d.w. C 0.72 1920. -Mud 150% d.w. C 0.79 1315. -Mud 20% d.w. C 1.44 2115. -Mud 40% d.w. C 1.15 1920. -Mud 5% d.w. C 0.43 1840. -Mud 80% d.w. C 0.94 1570. -Sandy loam 5% d.w. C 0.55 - -Sandy loam 10% d.w. C 0.85 - -Sandy loam 15% d.w. C 1.20 - -Silt, firm 40% d.w. C 1.15 1920. -Silt, hard 10% d.w. C 0.72 1920. -Silt, soft 80% d.w. C 0.94 1570. -Silt, stiff 20% d.w. C 1.44 2115. -Silt, very hard 5% d.w. C 0.43 1840. -Silt, very soft 150% d.w. C 0.79 1315. -Soil, damp Y 1.50 - -Soil, sandy Y 0.70 - -Soil Wet Y 2.00 - -Soil, crushed Brighton chalk Dry C 0.25 - -Soil, crushed Brighton chalk 10% d.w. C 0.50 - -Soil, crushed Brighton chalk 20% d.w. C 0.80 - -Soil, Liverpool clay, very damp 17% d.w. C 1.70 2100. -Soil, London clay 25% d.w., Wet C 1.40 1900. -
*** Stone ***
Basalt S 3.5 3000. 840.Basalt SPPS, ρ 2800-3000 T - 2900. 840.Basalt ρ 2800-3000 F 3.5 2900. -Basalt NBN, ρ 2750-3000 T 3.49 2875. 840.Calcareous white marble Low exp. B 2.91 2750. -Calcareous white marble Std exp. B 3.49 2750. -Calcareous white, semi-firm Std exp. B 1.69 2200. -Calcareous white, firm Low exp. B 1.74 2350. -Calcareous white, firm Std exp. B 2.09 2350. -Calcareous white, hard Low exp. B 2.21 2550. -Calcareous white, hard Std exp. B 2.68 2550. -Calcareous white, semi-firm Low exp. B 1.40 2200. -Cold stone marble ρ >2590 F 2.90 2590. -

Section Four (Inorganic-Porous), Page 64
Material Condition/ Source λ ρ Cp
Description Test ( W /mK ) ( kg/m3 ) ( J /kgK )
Crystalline metamorphic rock G 3.50 2800. -(Granite, Basalt, Marble)Firm stone ρ 2160-2340 F 1.70 2250. -Flint ρ 2600-2800 F 3.50 2700. -Gneiss NBN, ρ 2750-3000 T 3.49 2875. 840.Granite S 3.50 3000. 840.Granite NBN, ρ 2750-3000 T 3.49 2875. 840.Granite SPPS, ρ 2500-3000 T - 2750. 840.Granite ρ 2500-3000 F 3.50 2750. -Granite C 2.5 - -Granite C 2.9 2650. -Granite At 25°C C 2.30 2600. -Granite At -100°C C 2.4 2600. -Granite, bluestone Std exp. B 3.49 2700. -Granite ,bluestone Low exp. B 2.91 2700. -Graphite achreson, solid Dry. at 50°C C 140.00 1600. -Graphite achreson, solid At 25°C C 115.00 1600. -Graphite, reactor grade Dry at 50°C C 70. - -Graphite, reactor grade At 250°C C 65. - -Hard stone NBN, ρ 2750-3000 T 3.49 2875. 840.Hard stone ρ 2350-2580 F 2.2 2465. -Hard granite, gneiss, basalt, porphyry ρ 2750-3000 B 3.49 2875. -Hardstone Low exp. S 2.30 2750. 840.Hardstone Std exp. S 2.90 2750. 840.Lava ρ 2100-2400 F 2.90 2250. -Lime stone Dry C 1.5 2180. -Limestone E 1.5 2180. 720.Limestone Low exp. S 2.30 2750. 840.Limestone Std exp. S 2.90 2750. 840.Marble Low exp. S 2.3 2750. 840.Marble Std exp. S 2.9 2750. 840.Marble Dry C 2.00 2500. -Marble C 2.50 2700. -Petit granit (blue stone) NBN, dry T 2.91 2700. 840.Petit granit (blue stone) NBN, moist T 3.49 2700. 840.Petit granit (blue stone) SPPS T - 2750. 840.Porphyry NBN, ρ 2750-3000 T 3.49 2875. 840.Porphyry SPPS, ρ 2400-2600 T - 2500. 840.Porphyry ρ 2400-2600 F 2.90 2500. -Quartz Dry at 40°C C 1.4 2190. -Quartz Dry at 250°C C 1.5 2190. -Red granite E 2.9 2650. 900.Natural slate SPPS T - - 840.Sandstone C 1.3 2000. -Sandstone E 1.83 2200. 712.Sandstone CSTC, ρ 2000-3000 T - 2500. -Sandstone SBR, ρ 2000-2300 T 3. 2150. 840.Sandstone SPPS, ρ 2000-2300 T 1.3 2150. 840.Sandstone Low exp., ρ 2000-2300 S 3. 2150. 840.Sandstone Std exp., ρ 2000-2300 S 5. 2150. 840.Sandstone tiles NBN, dry T 1.2 2000. 840.Sandstone tiles NBN, moist T 1.3 2000. -Sedimentary rock G 2.3 2600. -(Sandstone, Shell, Limestone)Semi-firm stone ρ 1840-2150 F 1.4 1495. -Slate D 1.44394 1600. 1465.Slate E 2. 2700. 753.Slate E 2. 2700. 753.Slate F 2.1 2700. -Slate shale SPPS, ρ <2700 T 2.1 2700. 840.Slate C 1.9 2700. -Slate C 2. 2700. -Soft stone no.2 ρ 1470-1640 F 0.95 1555. -Soft stone no.3 ρ 1650-1840 F 1.05 1745. -Solid stone, made from light conc. G 0.32 500. -Solid stone, made from light conc. G 0.34 600. -Solid stone, made from light conc. G 0.37 700. -Solid stone, made from light conc. G 0.40 800. -Solid stone, made from light conc. G 0.43 900. -Solid stone, made from light conc. G 0.46 1000. -Solid stone, made from light conc. G 0.54 1200. -Solid stone, made from light conc. G 0.63 1400. -Solid stone, made from light conc. G 0.74 1600. -Solid stone, made from light conc. G 0.87 1800. -Solid stone, made from light conc. G 0.99 2000. -Stone D 1.80337 2240. 837.Stonework (Granite, Slate, Marble) BS 2. - -Stonework (Limestone, Sandstone) BS 2. - -White calcareous stone, firm NBN, moist T 2.09 2350. 840.White calcareous stone, firm SPPS, ρ 2160-2349 T - 2254. -

Section Four (Inorganic-Porous), Page 65
Material Condition/ Source λ ρ Cp
Description Test ( W /mK ) ( kg/m3 ) ( J /kgK )
White calcareous stone, firm SPPS, dry T 1.74 2350. 840.White calcareous stone, hard NBN, dry T 2.21 2550. 840.White calcareous stone, hard NBN, moist T 2.68 2550. 840.White calcareous stone, marble NBN, dry T 2.91 2750. 840.White calcareous stone, marble NBN, moist T 3.49 2750. 840.White calcareous stone, marble SPPS, ρ <2600 T - 2600. 840.White calcareous stone, semi-firm NBN, dry T 1.4 2200. 840.White calcareous stone, semi-firm NBN, moist T 1.69 2200. 840.White calcareous stone, soft SPPS, ρ 1650-1839 T 1.1 1744. -White calcareous stone, soft tufa CSTC, ρ 1000-1500 T - 1300. -White calcareous stone, soft tufa SBR, dry, ρ 1100-1500 T 0.35 1300. 840.White calcareous stone, soft tufa SBR, moist, ρ 1100-1500 T 0.50 1300. -White calcareous stone, soft tufa SPPS, ρ 1100-1500 T 0.35 1300. 860.White calcareous stone, soft tufa SPPS, moist, ρ 1100-1500 T 0.50 1300. 1260.White marble E 2. 2500. 880.Valcanised porous natural stone G 0.55 1600. -Stoneware Conditioned C 1.4 2150. -
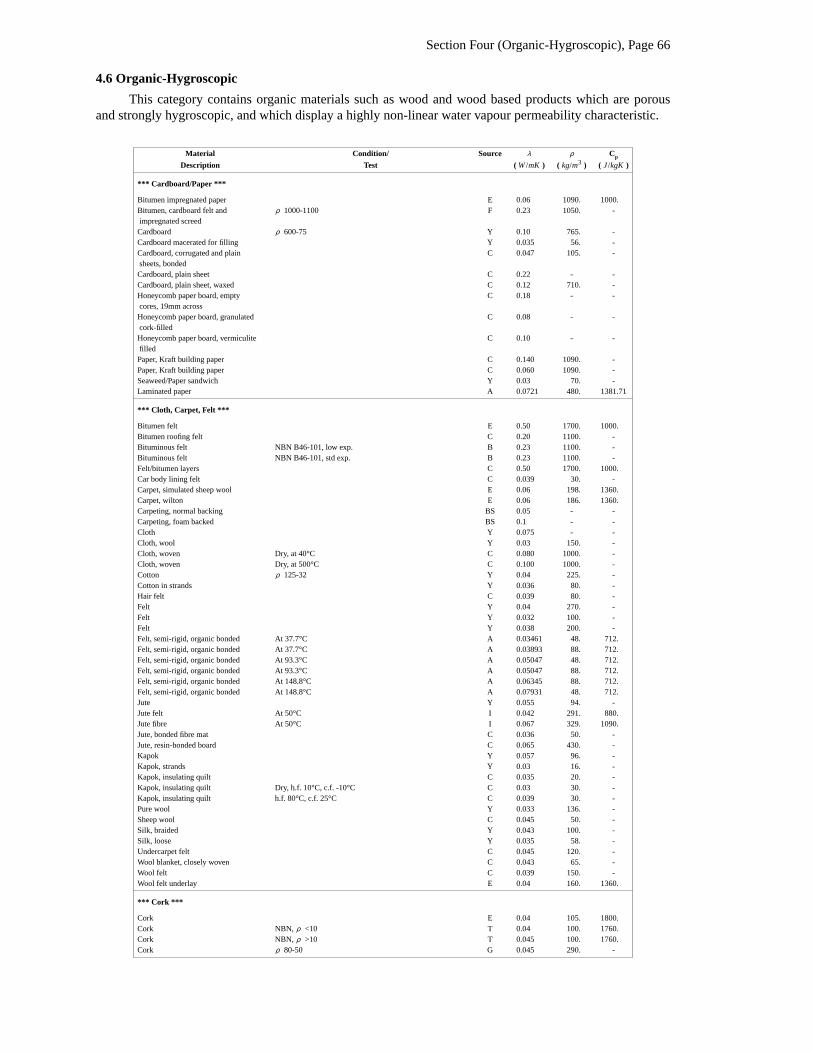
Section Four (Organic-Hygroscopic), Page 66
4.6 Organic-Hygroscopic
This category contains organic materials such as wood and wood based products which are porousand strongly hygroscopic, and which display a highly non-linear water vapour permeability characteristic.
Material Condition/ Source λ ρ Cp
Description Test ( W /mK ) ( kg/m3 ) ( J /kgK )
*** Cardboard/Paper ***
Bitumen impregnated paper E 0.06 1090. 1000.Bitumen, cardboard felt and ρ 1000-1100 F 0.23 1050. -impregnated screedCardboard ρ 600-75 Y 0.10 765. -Cardboard macerated for filling Y 0.035 56. -Cardboard, corrugated and plain C 0.047 105. -sheets, bondedCardboard, plain sheet C 0.22 - -Cardboard, plain sheet, waxed C 0.12 710. -Honeycomb paper board, empty C 0.18 - -cores, 19mm acrossHoneycomb paper board, granulated C 0.08 - -cork-filledHoneycomb paper board, vermiculite C 0.10 - -filledPaper, Kraft building paper C 0.140 1090. -Paper, Kraft building paper C 0.060 1090. -Seaweed/Paper sandwich Y 0.03 70. -Laminated paper A 0.0721 480. 1381.71
*** Cloth, Carpet, Felt ***
Bitumen felt E 0.50 1700. 1000.Bitumen roofing felt C 0.20 1100. -Bituminous felt NBN B46-101, low exp. B 0.23 1100. -Bituminous felt NBN B46-101, std exp. B 0.23 1100. -Felt/bitumen layers C 0.50 1700. 1000.Car body lining felt C 0.039 30. -Carpet, simulated sheep wool E 0.06 198. 1360.Carpet, wilton E 0.06 186. 1360.Carpeting, normal backing BS 0.05 - -Carpeting, foam backed BS 0.1 - -Cloth Y 0.075 - -Cloth, wool Y 0.03 150. -Cloth, woven Dry, at 40°C C 0.080 1000. -Cloth, woven Dry, at 500°C C 0.100 1000. -Cotton ρ 125-32 Y 0.04 225. -Cotton in strands Y 0.036 80. -Hair felt C 0.039 80. -Felt Y 0.04 270. -Felt Y 0.032 100. -Felt Y 0.038 200. -Felt, semi-rigid, organic bonded At 37.7°C A 0.03461 48. 712.Felt, semi-rigid, organic bonded At 37.7°C A 0.03893 88. 712.Felt, semi-rigid, organic bonded At 93.3°C A 0.05047 48. 712.Felt, semi-rigid, organic bonded At 93.3°C A 0.05047 88. 712.Felt, semi-rigid, organic bonded At 148.8°C A 0.06345 88. 712.Felt, semi-rigid, organic bonded At 148.8°C A 0.07931 48. 712.Jute Y 0.055 94. -Jute felt At 50°C I 0.042 291. 880.Jute fibre At 50°C I 0.067 329. 1090.Jute, bonded fibre mat C 0.036 50. -Jute, resin-bonded board C 0.065 430. -Kapok Y 0.057 96. -Kapok, strands Y 0.03 16. -Kapok, insulating quilt C 0.035 20. -Kapok, insulating quilt Dry, h.f. 10°C, c.f. -10°C C 0.03 30. -Kapok, insulating quilt h.f. 80°C, c.f. 25°C C 0.039 30. -Pure wool Y 0.033 136. -Sheep wool C 0.045 50. -Silk, braided Y 0.043 100. -Silk, loose Y 0.035 58. -Undercarpet felt C 0.045 120. -Wool blanket, closely woven C 0.043 65. -Wool felt C 0.039 150. -Wool felt underlay E 0.04 160. 1360.
*** Cork ***
Cork E 0.04 105. 1800.Cork NBN, ρ <10 T 0.04 100. 1760.Cork NBN, ρ >10 T 0.045 100. 1760.Cork ρ 80-50 G 0.045 290. -

Section Four (Organic-Hygroscopic), Page 67
Material Condition/ Source λ ρ Cp
Description Test ( W /mK ) ( kg/m3 ) ( J /kgK )
Cork Low exp., ρ <10 B 0.04 100. -Cork Low exp., ρ >10 B 0.045 100. -Cork board E 0.04 160. 1888.Cork gasket C 0.06 480. -Cork linoleum C 0.07 510. -Cork linoleum Y 0.07 535. -Cork linoleum SPPS T 0.08 700. -Cork slab I 0.043 164. 960.Cork slab I 0.044 192. 960.Cork slab I 0.055 304. 960.Cork slab, baked Dry C 0.04 130. -Cork slab, baked High density C 0.046 200. -Cork slab, baked High density C 0.05 265. -Cork slab, ice-logged Saturated, h.f. -5°C, c.f. -70°C C 0.08 325. -Cork slab, raw Damp C 0.05 160. -Cork slab, raw Damp, high density C 0.08 465. -Cork slab, soaked in water Saturated C 0.085 325. -Cork slab, soaked in water and drained Wet C 0.054 195. -Cork tiles E 0.08 530. 1800.Cork tiles Conditioned C 0.085 530. -Compressed cork F 0.1 500. -Cork G 0.05 - -Cork G 0.055 - -Cork, Floor tiles Conditioned, 40% rh C 0.085 540. -Loose filling from expanded cork chips ρ <60 G 0.13 600. -Cork, loose baked granules Damp C 0.039 100. -Cork, loose baked granules Dry, h.f. 80°C, c.f. 25dg.C C 0.045 100. -Cork, loose raw granules Damp C 0.046 115. -Cork, loose raw granules Dry, h.f. 80°C, c.f. 25°C C 0.052 115. -Cork, with bitumen or asphalt binder C 0.055 240. -Cork, with bitumen or asphalt binder C 0.145 640. -Cork, with bitumen or asphalt binder C 0.290 1040. -Cork, with cement binder C 0.073 280. -Cork, with cement binder C 0.10 400. -Cork, with resin binder Conditioned, 40% rh C 0.05 250. -Cork, with rubber latex binder C 0.062 320. -Cork, with rubber latex binder C 0.08 480. -Cork/oak, expanded in layers Y 0.03 100. -Cork/oak, expanded in layers Y 0.05 150. -Cork/oak in granules Y 0.03 130. -Cork/oak in sheets Y 0.04 250. -Cork/oak in sheets ρ 104-13 Y 0.03 117. -Corkboard Dry, h.f. 65°C, c.f. 15°C C 0.043 130. -Corkboard Dry, h.f. 90°C, c.f. 15°C C 0.046 130. -Corkboard h.f. 15°C, c.f. -20°C C 0.038 130. -Corkboard h.f. 15°C, c.f. 0°C C 0.039 130. -Corkboard h.f. 15°C, c.f. -70°C C 0.033 130. -Corkboard C 0.039 110. -Corkboard C 0.04 130. -Corkboard C 0.042 145. -Corkboard C 0.045 160. -Expanded and impregnated cork Low exp., ρ 100-20 S 0.043 150. 1760.Expanded cork CSTC, ρ 100-200 T - 100. -Expanded cork SBR, ρ 100-200 T - 150. -Expanded cork Low exp., ρ 100-200 S 0.044 150. 1760.Expanded cork bonded with pitch ρ 100-150 F 0.043 125. -or synthetic resinsExpanded cork bonded with pitch ρ 150-250 F 0.048 200. -or synthetic resinsExpanded cork, bituminous binding SPPS, ρ 100-20 T - 150. -Pure expanded cork ρ 100-15 F 0.043 125. -
*** Grasses/Straws ***
Compressed straw ρ 300-40 F 0.12 350. -Eel grass, insulating blanket C 0.043 145. -Eel grass, insulating blanket C 0.049 215. -Eel grass, insulating blanket C 0.039 80. -Papyrus, building board C 0.085 480. -Papyrus, insulating board C 0.055 255. -Reed made into slabs Y 0.05 250. -Straw, compressed Y 0.05 175. -Straw, loose fibres Y 0.047 140. -Straw board At 50°C I 0.057 310. 1300.Straw fibre board or straw slabs Low exp., ρ 200-40 S 0.10 300. 2100.Straw slabs, compressed Conditioned C 0.085 260. -Straw slabs, compressed C 0.098 330. -Straw slabs, compressed C 0.11 350. -Straw thatch E 0.07 240. 180.Thatch, reed C 0.09 270. -Thatch, straw C 0.07 240. -
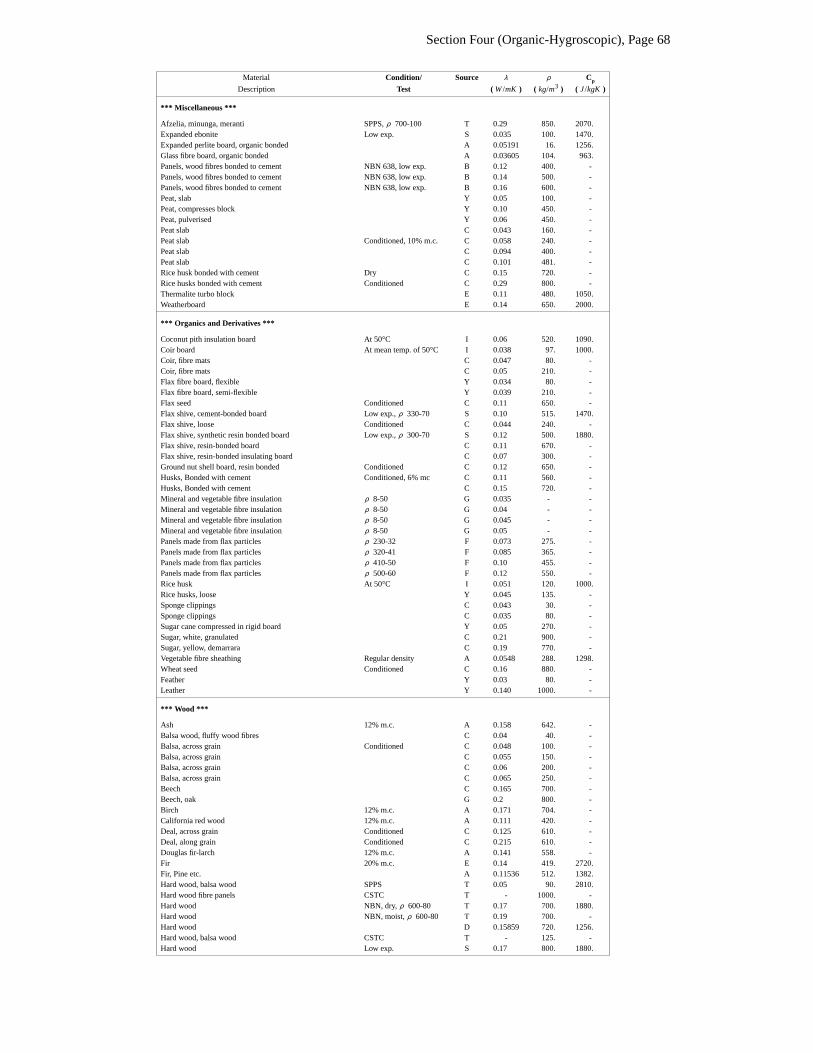
Section Four (Organic-Hygroscopic), Page 68
Material Condition/ Source λ ρ Cp
Description Test ( W /mK ) ( kg/m3 ) ( J /kgK )
*** Miscellaneous ***
Afzelia, minunga, meranti SPPS, ρ 700-100 T 0.29 850. 2070.Expanded ebonite Low exp. S 0.035 100. 1470.Expanded perlite board, organic bonded A 0.05191 16. 1256.Glass fibre board, organic bonded A 0.03605 104. 963.Panels, wood fibres bonded to cement NBN 638, low exp. B 0.12 400. -Panels, wood fibres bonded to cement NBN 638, low exp. B 0.14 500. -Panels, wood fibres bonded to cement NBN 638, low exp. B 0.16 600. -Peat, slab Y 0.05 100. -Peat, compresses block Y 0.10 450. -Peat, pulverised Y 0.06 450. -Peat slab C 0.043 160. -Peat slab Conditioned, 10% m.c. C 0.058 240. -Peat slab C 0.094 400. -Peat slab C 0.101 481. -Rice husk bonded with cement Dry C 0.15 720. -Rice husks bonded with cement Conditioned C 0.29 800. -Thermalite turbo block E 0.11 480. 1050.Weatherboard E 0.14 650. 2000.
*** Organics and Derivatives ***
Coconut pith insulation board At 50°C I 0.06 520. 1090.Coir board At mean temp. of 50°C I 0.038 97. 1000.Coir, fibre mats C 0.047 80. -Coir, fibre mats C 0.05 210. -Flax fibre board, flexible Y 0.034 80. -Flax fibre board, semi-flexible Y 0.039 210. -Flax seed Conditioned C 0.11 650. -Flax shive, cement-bonded board Low exp., ρ 330-70 S 0.10 515. 1470.Flax shive, loose Conditioned C 0.044 240. -Flax shive, synthetic resin bonded board Low exp., ρ 300-70 S 0.12 500. 1880.Flax shive, resin-bonded board C 0.11 670. -Flax shive, resin-bonded insulating board C 0.07 300. -Ground nut shell board, resin bonded Conditioned C 0.12 650. -Husks, Bonded with cement Conditioned, 6% mc C 0.11 560. -Husks, Bonded with cement C 0.15 720. -Mineral and vegetable fibre insulation ρ 8-50 G 0.035 - -Mineral and vegetable fibre insulation ρ 8-50 G 0.04 - -Mineral and vegetable fibre insulation ρ 8-50 G 0.045 - -Mineral and vegetable fibre insulation ρ 8-50 G 0.05 - -Panels made from flax particles ρ 230-32 F 0.073 275. -Panels made from flax particles ρ 320-41 F 0.085 365. -Panels made from flax particles ρ 410-50 F 0.10 455. -Panels made from flax particles ρ 500-60 F 0.12 550. -Rice husk At 50°C I 0.051 120. 1000.Rice husks, loose Y 0.045 135. -Sponge clippings C 0.043 30. -Sponge clippings C 0.035 80. -Sugar cane compressed in rigid board Y 0.05 270. -Sugar, white, granulated C 0.21 900. -Sugar, yellow, demarrara C 0.19 770. -Ve getable fibre sheathing Regular density A 0.0548 288. 1298.Wheat seed Conditioned C 0.16 880. -Feather Y 0.03 80. -Leather Y 0.140 1000. -
*** Wood ***
Ash 12% m.c. A 0.158 642. -Balsa wood, fluffy wood fibres C 0.04 40. -Balsa, across grain Conditioned C 0.048 100. -Balsa, across grain C 0.055 150. -Balsa, across grain C 0.06 200. -Balsa, across grain C 0.065 250. -Beech C 0.165 700. -Beech, oak G 0.2 800. -Birch 12% m.c. A 0.171 704. -California red wood 12% m.c. A 0.111 420. -Deal, across grain Conditioned C 0.125 610. -Deal, along grain Conditioned C 0.215 610. -Douglas fir-larch 12% m.c. A 0.141 558. -Fir 20% m.c. E 0.14 419. 2720.Fir, Pine etc. A 0.11536 512. 1382.Hard wood, balsa wood SPPS T 0.05 90. 2810.Hard wood fibre panels CSTC T - 1000. -Hard wood NBN, dry, ρ 600-80 T 0.17 700. 1880.Hard wood NBN, moist, ρ 600-80 T 0.19 700. -Hard wood D 0.15859 720. 1256.Hard wood, balsa wood CSTC T - 125. -Hard wood Low exp. S 0.17 800. 1880.
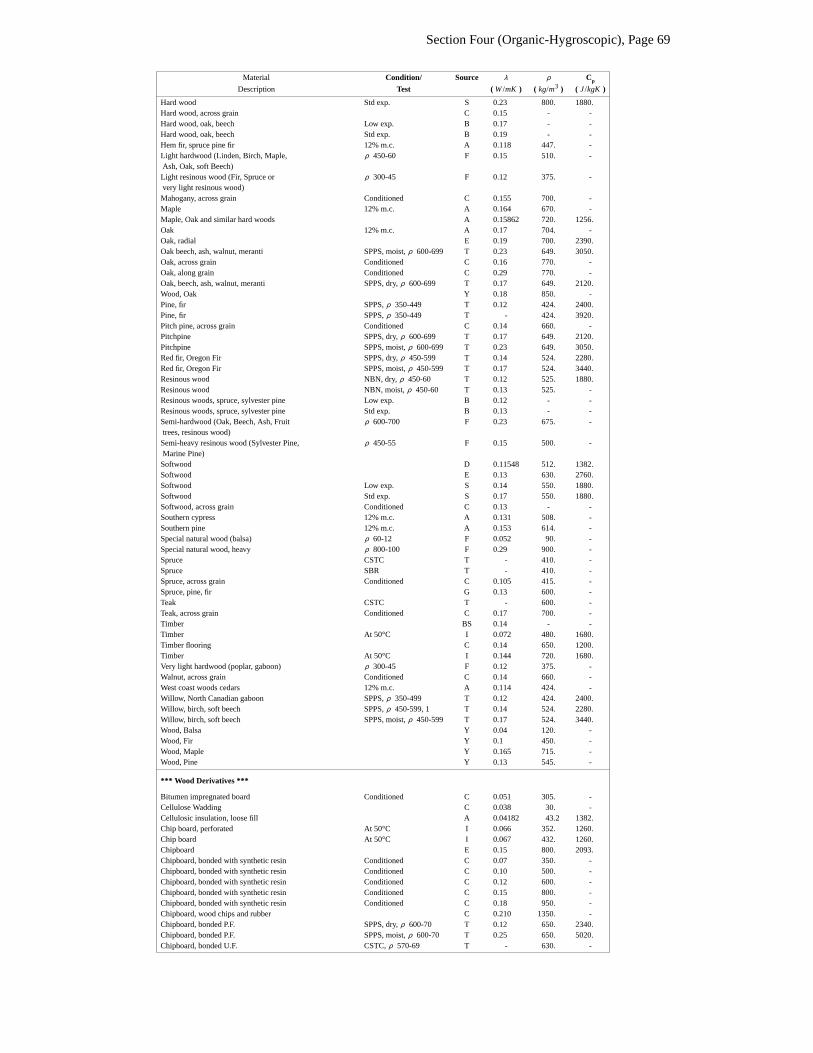
Section Four (Organic-Hygroscopic), Page 69
Material Condition/ Source λ ρ Cp
Description Test ( W /mK ) ( kg/m3 ) ( J /kgK )
Hard wood Std exp. S 0.23 800. 1880.Hard wood, across grain C 0.15 - -Hard wood, oak, beech Low exp. B 0.17 - -Hard wood, oak, beech Std exp. B 0.19 - -Hem fir, spruce pine fir 12% m.c. A 0.118 447. -Light hardwood (Linden, Birch, Maple, ρ 450-60 F 0.15 510. -Ash, Oak, soft Beech)Light resinous wood (Fir, Spruce or ρ 300-45 F 0.12 375. -very light resinous wood)Mahogany, across grain Conditioned C 0.155 700. -Maple 12% m.c. A 0.164 670. -Maple, Oak and similar hard woods A 0.15862 720. 1256.Oak 12% m.c. A 0.17 704. -Oak, radial E 0.19 700. 2390.Oak beech, ash, walnut, meranti SPPS, moist, ρ 600-699 T 0.23 649. 3050.Oak, across grain Conditioned C 0.16 770. -Oak, along grain Conditioned C 0.29 770. -Oak, beech, ash, walnut, meranti SPPS, dry, ρ 600-699 T 0.17 649. 2120.Wood, Oak Y 0.18 850. -Pine, fir SPPS, ρ 350-449 T 0.12 424. 2400.Pine, fir SPPS, ρ 350-449 T - 424. 3920.Pitch pine, across grain Conditioned C 0.14 660. -Pitchpine SPPS, dry, ρ 600-699 T 0.17 649. 2120.Pitchpine SPPS, moist, ρ 600-699 T 0.23 649. 3050.Red fir, Oregon Fir SPPS, dry, ρ 450-599 T 0.14 524. 2280.Red fir, Oregon Fir SPPS, moist, ρ 450-599 T 0.17 524. 3440.Resinous wood NBN, dry, ρ 450-60 T 0.12 525. 1880.Resinous wood NBN, moist, ρ 450-60 T 0.13 525. -Resinous woods, spruce, sylvester pine Low exp. B 0.12 - -Resinous woods, spruce, sylvester pine Std exp. B 0.13 - -Semi-hardwood (Oak, Beech, Ash, Fruit ρ 600-700 F 0.23 675. -trees, resinous wood)Semi-heavy resinous wood (Sylvester Pine, ρ 450-55 F 0.15 500. -Marine Pine)Softwood D 0.11548 512. 1382.Softwood E 0.13 630. 2760.Softwood Low exp. S 0.14 550. 1880.Softwood Std exp. S 0.17 550. 1880.Softwood, across grain Conditioned C 0.13 - -Southern cypress 12% m.c. A 0.131 508. -Southern pine 12% m.c. A 0.153 614. -Special natural wood (balsa) ρ 60-12 F 0.052 90. -Special natural wood, heavy ρ 800-100 F 0.29 900. -Spruce CSTC T - 410. -Spruce SBR T - 410. -Spruce, across grain Conditioned C 0.105 415. -Spruce, pine, fir G 0.13 600. -Teak CSTC T - 600. -Teak, across grain Conditioned C 0.17 700. -Timber BS 0.14 - -Timber At 50°C I 0.072 480. 1680.Timber flooring C 0.14 650. 1200.Timber At 50°C I 0.144 720. 1680.Very light hardwood (poplar, gaboon) ρ 300-45 F 0.12 375. -Walnut, across grain Conditioned C 0.14 660. -West coast woods cedars 12% m.c. A 0.114 424. -Willow, North Canadian gaboon SPPS, ρ 350-499 T 0.12 424. 2400.Willow, birch, soft beech SPPS, ρ 450-599, 1 T 0.14 524. 2280.Willow, birch, soft beech SPPS, moist, ρ 450-599 T 0.17 524. 3440.Wood, Balsa Y 0.04 120. -Wood, Fir Y 0.1 450. -Wood, Maple Y 0.165 715. -Wood, Pine Y 0.13 545. -
*** Wood Derivatives ***
Bitumen impregnated board Conditioned C 0.051 305. -Cellulose Wadding C 0.038 30. -Cellulosic insulation, loose fill A 0.04182 43.2 1382.Chip board, perforated At 50°C I 0.066 352. 1260.Chip board At 50°C I 0.067 432. 1260.Chipboard E 0.15 800. 2093.Chipboard, bonded with synthetic resin Conditioned C 0.07 350. -Chipboard, bonded with synthetic resin Conditioned C 0.10 500. -Chipboard, bonded with synthetic resin Conditioned C 0.12 600. -Chipboard, bonded with synthetic resin Conditioned C 0.15 800. -Chipboard, bonded with synthetic resin Conditioned C 0.18 950. -Chipboard, wood chips and rubber C 0.210 1350. -Chipboard, bonded P.F. SPPS, dry, ρ 600-70 T 0.12 650. 2340.Chipboard, bonded P.F. SPPS, moist, ρ 600-70 T 0.25 650. 5020.Chipboard, bonded U.F. CSTC, ρ 570-69 T - 630. -
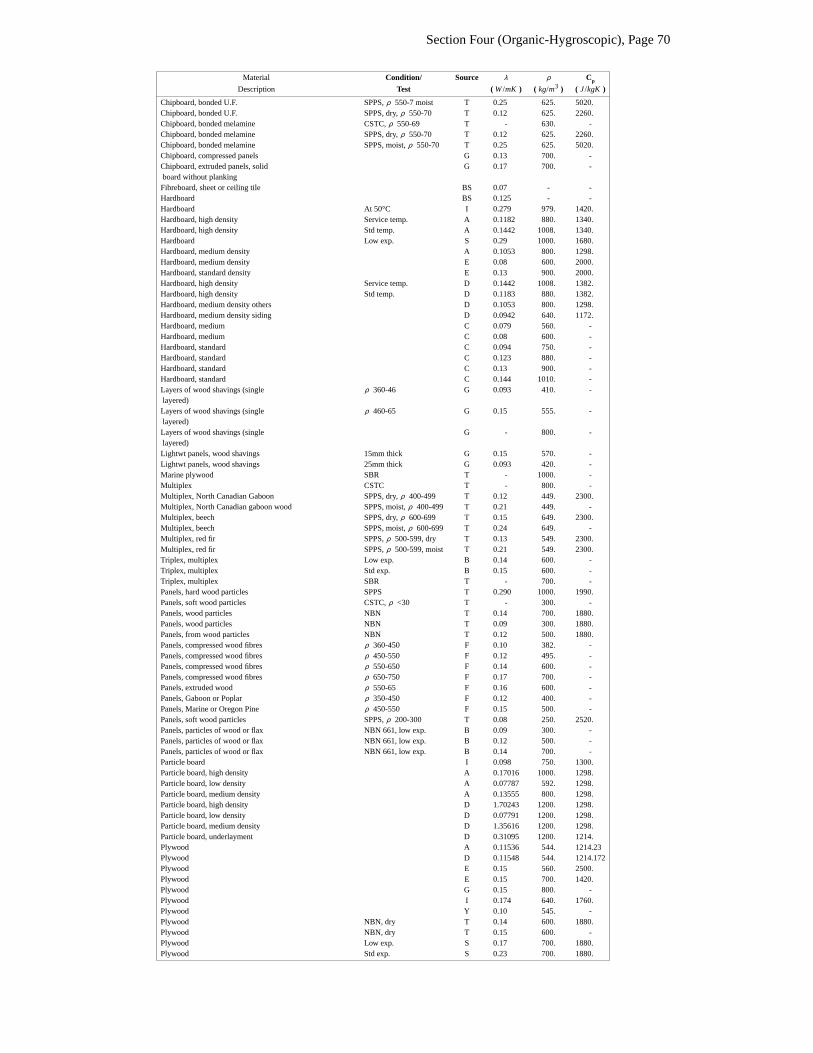
Section Four (Organic-Hygroscopic), Page 70
Material Condition/ Source λ ρ Cp
Description Test ( W /mK ) ( kg/m3 ) ( J /kgK )
Chipboard, bonded U.F. SPPS, ρ 550-7 moist T 0.25 625. 5020.Chipboard, bonded U.F. SPPS, dry, ρ 550-70 T 0.12 625. 2260.Chipboard, bonded melamine CSTC, ρ 550-69 T - 630. -Chipboard, bonded melamine SPPS, dry, ρ 550-70 T 0.12 625. 2260.Chipboard, bonded melamine SPPS, moist, ρ 550-70 T 0.25 625. 5020.Chipboard, compressed panels G 0.13 700. -Chipboard, extruded panels, solid G 0.17 700. -board without plankingFibreboard, sheet or ceiling tile BS 0.07 - -Hardboard BS 0.125 - -Hardboard At 50°C I 0.279 979. 1420.Hardboard, high density Service temp. A 0.1182 880. 1340.Hardboard, high density Std temp. A 0.1442 1008. 1340.Hardboard Low exp. S 0.29 1000. 1680.Hardboard, medium density A 0.1053 800. 1298.Hardboard, medium density E 0.08 600. 2000.Hardboard, standard density E 0.13 900. 2000.Hardboard, high density Service temp. D 0.1442 1008. 1382.Hardboard, high density Std temp. D 0.1183 880. 1382.Hardboard, medium density others D 0.1053 800. 1298.Hardboard, medium density siding D 0.0942 640. 1172.Hardboard, medium C 0.079 560. -Hardboard, medium C 0.08 600. -Hardboard, standard C 0.094 750. -Hardboard, standard C 0.123 880. -Hardboard, standard C 0.13 900. -Hardboard, standard C 0.144 1010. -Layers of wood shavings (single ρ 360-46 G 0.093 410. -layered)Layers of wood shavings (single ρ 460-65 G 0.15 555. -layered)Layers of wood shavings (single G - 800. -layered)Lightwt panels, wood shavings 15mm thick G 0.15 570. -Lightwt panels, wood shavings 25mm thick G 0.093 420. -Marine plywood SBR T - 1000. -Multiplex CSTC T - 800. -Multiplex, North Canadian Gaboon SPPS, dry, ρ 400-499 T 0.12 449. 2300.Multiplex, North Canadian gaboon wood SPPS, moist, ρ 400-499 T 0.21 449. -Multiplex, beech SPPS, dry, ρ 600-699 T 0.15 649. 2300.Multiplex, beech SPPS, moist, ρ 600-699 T 0.24 649. -Multiplex, red fir SPPS, ρ 500-599, dry T 0.13 549. 2300.Multiplex, red fir SPPS, ρ 500-599, moist T 0.21 549. 2300.Triplex, multiplex Low exp. B 0.14 600. -Triplex, multiplex Std exp. B 0.15 600. -Triplex, multiplex SBR T - 700. -Panels, hard wood particles SPPS T 0.290 1000. 1990.Panels, soft wood particles CSTC, ρ <30 T - 300. -Panels, wood particles NBN T 0.14 700. 1880.Panels, wood particles NBN T 0.09 300. 1880.Panels, from wood particles NBN T 0.12 500. 1880.Panels, compressed wood fibres ρ 360-450 F 0.10 382. -Panels, compressed wood fibres ρ 450-550 F 0.12 495. -Panels, compressed wood fibres ρ 550-650 F 0.14 600. -Panels, compressed wood fibres ρ 650-750 F 0.17 700. -Panels, extruded wood ρ 550-65 F 0.16 600. -Panels, Gaboon or Poplar ρ 350-450 F 0.12 400. -Panels, Marine or Oregon Pine ρ 450-550 F 0.15 500. -Panels, soft wood particles SPPS, ρ 200-300 T 0.08 250. 2520.Panels, particles of wood or flax NBN 661, low exp. B 0.09 300. -Panels, particles of wood or flax NBN 661, low exp. B 0.12 500. -Panels, particles of wood or flax NBN 661, low exp. B 0.14 700. -Particle board I 0.098 750. 1300.Particle board, high density A 0.17016 1000. 1298.Particle board, low density A 0.07787 592. 1298.Particle board, medium density A 0.13555 800. 1298.Particle board, high density D 1.70243 1200. 1298.Particle board, low density D 0.07791 1200. 1298.Particle board, medium density D 1.35616 1200. 1298.Particle board, underlayment D 0.31095 1200. 1214.Plywood A 0.11536 544. 1214.23Plywood D 0.11548 544. 1214.172Plywood E 0.15 560. 2500.Plywood E 0.15 700. 1420.Plywood G 0.15 800. -Plywood I 0.174 640. 1760.Plywood Y 0.10 545. -Plywood NBN, dry T 0.14 600. 1880.Plywood NBN, dry T 0.15 600. -Plywood Low exp. S 0.17 700. 1880.Plywood Std exp. S 0.23 700. 1880.

Section Four (Organic-Hygroscopic), Page 71
Material Condition/ Source λ ρ Cp
Description Test ( W /mK ) ( kg/m3 ) ( J /kgK )
Plywood, across grain Conditioned C 0.14 530. -Plywood, across grain, fireproofed Conditioned C 0.15 560. -Plywood sheathing BS 0.14 - -Plywood decking BS 0.14 - -Sawdust At 50°C I 0.051 188. 1000.Sawdust or shavings A 0.06489 184. 1381.71Sawdust, loose Conditioned C 0.08 145. -Sawdust, slabs, bonded with glue Conditioned C 0.10 550. -Sawdust, slabs, lightly bonded Conditioned C 0.05 160. -Soft board At 50°C I 0.047 249. 1300.Soft board At 50°C I 0.066 320. 1300.Softboard E 0.56 350. 1000.Softboard Low exp. S 0.08 275. 2100.Wall board At 50°C I 0.047 262. 1260.Wood, for filling Y 0.05 190. -Wood blocks flooring C 0.14 650. 1200.Wood chip board Low exp. S 0.10 450. 1880.Wood chip board Low exp. S 0.15 600. 1880.Wood chip board Low exp. S 0.290 1000. 1880.Wood chip cement-bonded board Low exp., ρ 350-70 S 0.15 525. 1470.Wood chippings Y 0.14 500. -Wood fibre, soft wood, loose fill A 0.04326 44.8 1382.Wood fibre Y 0.175 1000. -Wood fibre panels, hard wood fibres G 0.170 1000. -Wood fibre panels, porous wood G 0.045 200. -fibres and bituminised woodWood fibre panels made from porous wood G 0.056 300. -fibres and bituminised woodWood fibre, hard & ultra-hard panels ρ 850-100 F 0.20 925. -Wood fibre/cement conglomerate Y 0.068 400. -Wood fibre, soft insulation panels ρ 200-25 F 0.058 225. -Wood fibre, soft asphalt covered ρ 250-30 F 0.065 275. -Wood fibres compressed Y 0.055 320. 99.Wood shingle D 0.11548 512. 1256.Wood waste board, bonded with C 0.09 500. -bitumen & cementWood wool board, bonded with cement At 50°C I 0.081 398. 1130.Wood wool board, bonded with cement At 50°C I 0.108 674. 1130.Wood wool building slabs Wet C 0.13 480. -Wood wool building slabs Wet C 0.2 860. -Wood wool building slabs Conditioned C 0.08 400. -Wood wool building slabs Conditioned C 0.10 500. -Wood wool building slabs Conditioned C 0.11 600. -Wood wool building slabs Conditioned C 0.12 700. -Wood wool building slabs Conditioned C 0.13 750. -Wood wool building slabs C 0.13 800. -Wood wool roof slab C 0.10 500. 1000.Wood wool slab BS 0.1 - -Wood wool xylolite cement slab Low exp., ρ 400-50 S 0.11 450. 1470.Wood wool, fluffy C 0.04 40. -Wood, block E 0.16 800. 2093.Wood, flooring E 0.14 600. 1210.Woodwool E 0.1 500. 1000.
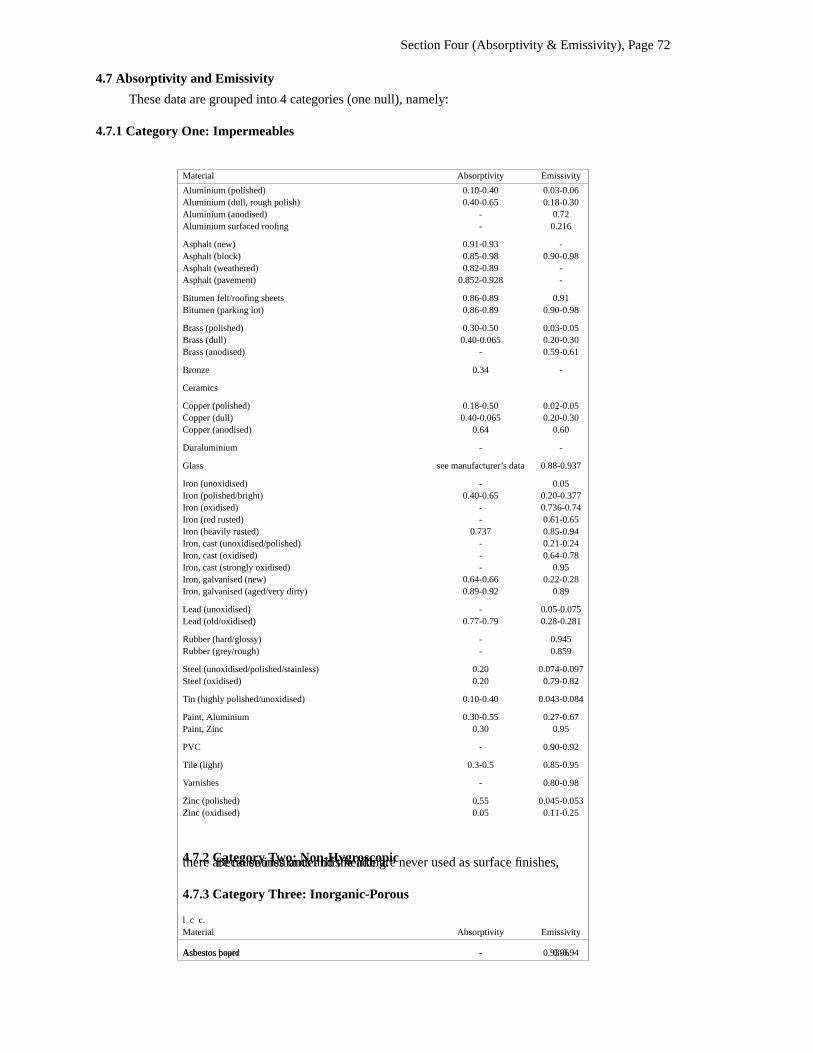
Section Four (Absorptivity & Emissivity), Page 72
4.7 Absorptivity and Emissivity
These data are grouped into 4 categories (one null), namely:
4.7.1 Category One: Impermeables
Material Absorptivity Emissivity
Aluminium (polished) 0.10-0.40 0.03-0.06Aluminium (dull, rough polish) 0.40-0.65 0.18-0.30Aluminium (anodised) - 0.72Aluminium surfaced roofing - 0.216
Asphalt (new) 0.91-0.93 -Asphalt (block) 0.85-0.98 0.90-0.98Asphalt (weathered) 0.82-0.89 -Asphalt (pavement) 0.852-0.928 -
Bitumen felt/roofing sheets 0.86-0.89 0.91Bitumen (parking lot) 0.86-0.89 0.90-0.98
Brass (polished) 0.30-0.50 0.03-0.05Brass (dull) 0.40-0.065 0.20-0.30Brass (anodised) - 0.59-0.61
Bronze 0.34 -
Ceramics
Copper (polished) 0.18-0.50 0.02-0.05Copper (dull) 0.40-0.065 0.20-0.30Copper (anodised) 0.64 0.60
Duraluminium - -
Glass see manufacturer’s data 0.88-0.937
Iron (unoxidised) - 0.05Iron (polished/bright) 0.40-0.65 0.20-0.377Iron (oxidised) - 0.736-0.74Iron (red rusted) - 0.61-0.65Iron (heavily rusted) 0.737 0.85-0.94Iron, cast (unoxidised/polished) - 0.21-0.24Iron, cast (oxidised) - 0.64-0.78Iron, cast (strongly oxidised) - 0.95Iron, galvanised (new) 0.64-0.66 0.22-0.28Iron, galvanised (aged/very dirty) 0.89-0.92 0.89
Lead (unoxidised) - 0.05-0.075Lead (old/oxidised) 0.77-0.79 0.28-0.281
Rubber (hard/glossy) - 0.945Rubber (grey/rough) - 0.859
Steel (unoxidised/polished/stainless) 0.20 0.074-0.097Steel (oxidised) 0.20 0.79-0.82
Tin (highly polished/unoxidised) 0.10-0.40 0.043-0.084
Paint, Aluminium 0.30-0.55 0.27-0.67Paint, Zinc 0.30 0.95
PVC - 0.90-0.92
Tile (light) 0.3-0.5 0.85-0.95
Varnishes - 0.80-0.98
Zinc (polished) 0.55 0.045-0.053Zinc (oxidised) 0.05 0.11-0.25
4.7.2 Category Two: Non-HygroscopicBecause insulants and the like are never used as surface finishes,there are no entries under this heading.
4.7.3 Category Three: Inorganic-Porous
l c c.Material Absorptivity Emissivity
Asbestos board - 0.96Asbestos paper - 0.93-0.94
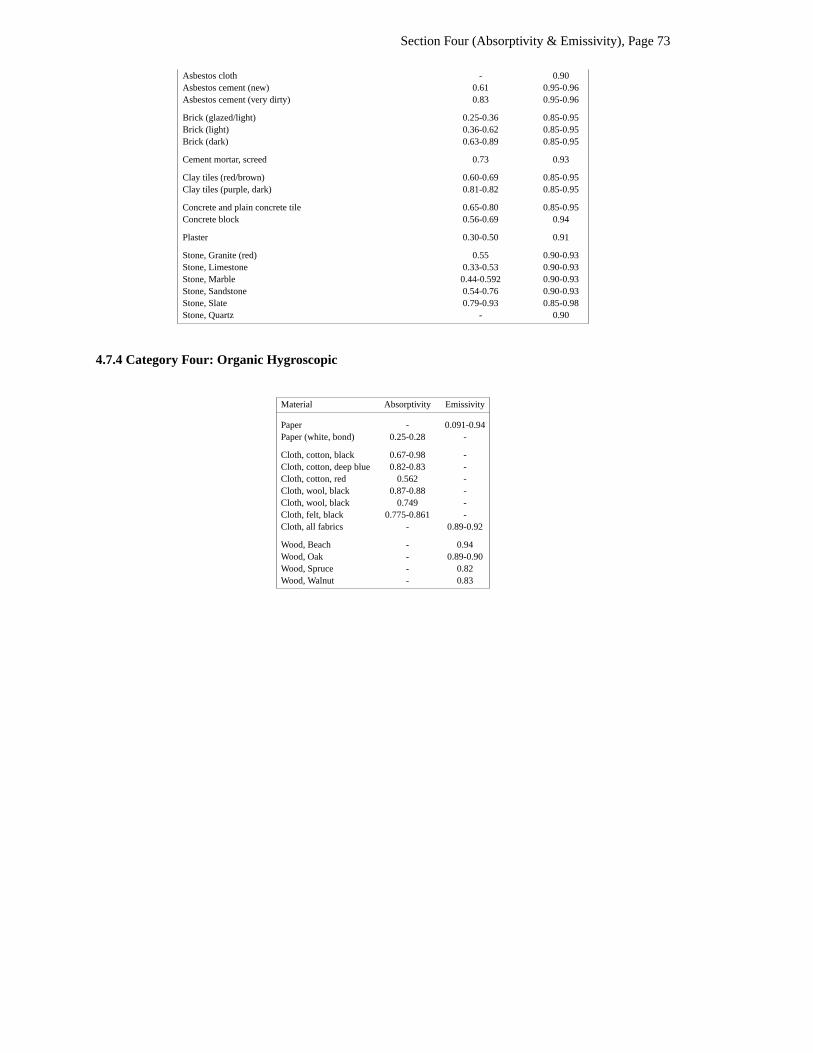
Section Four (Absorptivity & Emissivity), Page 73
Asbestos cloth - 0.90Asbestos cement (new) 0.61 0.95-0.96Asbestos cement (very dirty) 0.83 0.95-0.96
Brick (glazed/light) 0.25-0.36 0.85-0.95Brick (light) 0.36-0.62 0.85-0.95Brick (dark) 0.63-0.89 0.85-0.95
Cement mortar, screed 0.73 0.93
Clay tiles (red/brown) 0.60-0.69 0.85-0.95Clay tiles (purple, dark) 0.81-0.82 0.85-0.95
Concrete and plain concrete tile 0.65-0.80 0.85-0.95Concrete block 0.56-0.69 0.94
Plaster 0.30-0.50 0.91
Stone, Granite (red) 0.55 0.90-0.93Stone, Limestone 0.33-0.53 0.90-0.93Stone, Marble 0.44-0.592 0.90-0.93Stone, Sandstone 0.54-0.76 0.90-0.93Stone, Slate 0.79-0.93 0.85-0.98Stone, Quartz - 0.90
4.7.4 Category Four: Organic Hygroscopic
Material Absorptivity Emissivity
Paper - 0.091-0.94Paper (white, bond) 0.25-0.28 -
Cloth, cotton, black 0.67-0.98 -Cloth, cotton, deep blue 0.82-0.83 -Cloth, cotton, red 0.562 -Cloth, wool, black 0.87-0.88 -Cloth, wool, black 0.749 -Cloth, felt, black 0.775-0.861 -Cloth, all fabrics - 0.89-0.92
Wood, Beach - 0.94Wood, Oak - 0.89-0.90Wood, Spruce - 0.82Wood, Walnut - 0.83
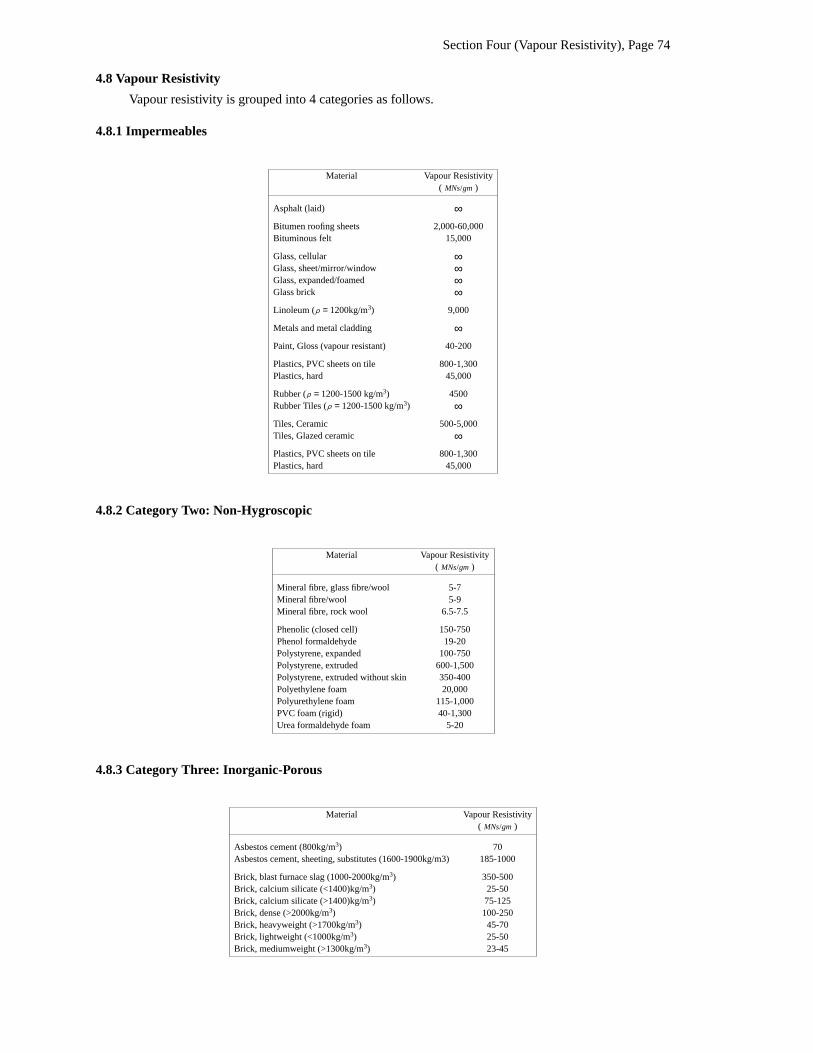
Section Four (Vapour Resistivity), Page 74
4.8 Vapour Resistivity
Vapour resistivity is grouped into 4 categories as follows.
4.8.1 Impermeables
Material Vapour Resistivity( MNs/gm )
Asphalt (laid) ∞Bitumen roofing sheets 2,000-60,000Bituminous felt 15,000
Glass, cellular ∞Glass, sheet/mirror/window ∞Glass, expanded/foamed ∞Glass brick ∞Linoleum (ρ = 1200kg/m3) 9,000
Metals and metal cladding ∞Paint, Gloss (vapour resistant) 40-200
Plastics, PVC sheets on tile 800-1,300Plastics, hard 45,000
Rubber (ρ = 1200-1500 kg/m3) 4500Rubber Tiles (ρ = 1200-1500 kg/m3) ∞Tiles, Ceramic 500-5,000Tiles, Glazed ceramic ∞Plastics, PVC sheets on tile 800-1,300Plastics, hard 45,000
4.8.2 Category Two: Non-Hygroscopic
Material Vapour Resistivity( MNs/gm )
Mineral fibre, glass fibre/wool 5-7Mineral fibre/wool 5-9Mineral fibre, rock wool 6.5-7.5
Phenolic (closed cell) 150-750Phenol formaldehyde 19-20Polystyrene, expanded 100-750Polystyrene, extruded 600-1,500Polystyrene, extruded without skin 350-400Polyethylene foam 20,000Polyurethylene foam 115-1,000PVC foam (rigid) 40-1,300Urea formaldehyde foam 5-20
4.8.3 Category Three: Inorganic-Porous
Material Vapour Resistivity( MNs/gm )
Asbestos cement (800kg/m3) 70Asbestos cement, sheeting, substitutes (1600-1900kg/m3) 185-1000
Brick, blast furnace slag (1000-2000kg/m3) 350-500Brick, calcium silicate (<1400)kg/m3) 25-50Brick, calcium silicate (>1400)kg/m3) 75-125Brick, dense (>2000kg/m3) 100-250Brick, heavyweight (>1700kg/m3) 45-70Brick, lightweight (<1000kg/m3) 25-50Brick, mediumweight (>1300kg/m3) 23-45
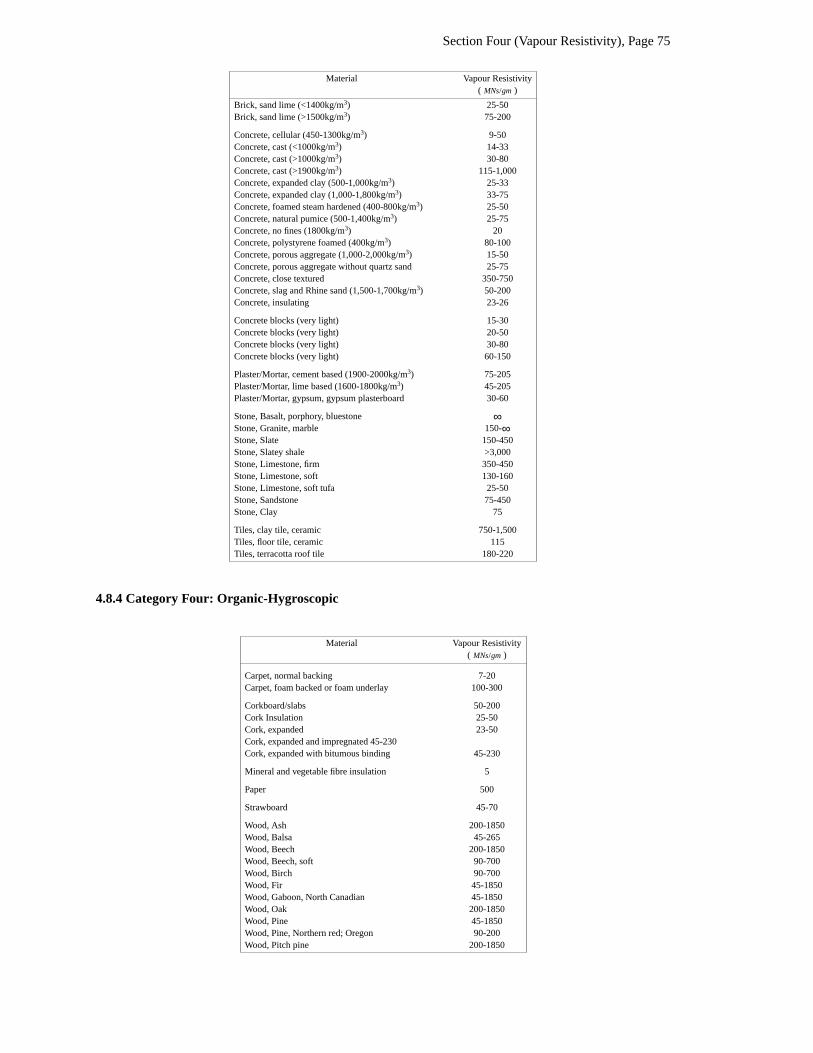
Section Four (Vapour Resistivity), Page 75
Material Vapour Resistivity( MNs/gm )
Brick, sand lime (<1400kg/m3) 25-50Brick, sand lime (>1500kg/m3) 75-200
Concrete, cellular (450-1300kg/m3) 9-50Concrete, cast (<1000kg/m3) 14-33Concrete, cast (>1000kg/m3) 30-80Concrete, cast (>1900kg/m3) 115-1,000Concrete, expanded clay (500-1,000kg/m3) 25-33Concrete, expanded clay (1,000-1,800kg/m3) 33-75Concrete, foamed steam hardened (400-800kg/m3) 25-50Concrete, natural pumice (500-1,400kg/m3) 25-75Concrete, no fines (1800kg/m3) 20Concrete, polystyrene foamed (400kg/m3) 80-100Concrete, porous aggregate (1,000-2,000kg/m3) 15-50Concrete, porous aggregate without quartz sand 25-75Concrete, close textured 350-750Concrete, slag and Rhine sand (1,500-1,700kg/m3) 50-200Concrete, insulating 23-26
Concrete blocks (very light) 15-30Concrete blocks (very light) 20-50Concrete blocks (very light) 30-80Concrete blocks (very light) 60-150
Plaster/Mortar, cement based (1900-2000kg/m3) 75-205Plaster/Mortar, lime based (1600-1800kg/m3) 45-205Plaster/Mortar, gypsum, gypsum plasterboard 30-60
Stone, Basalt, porphory, bluestone ∞Stone, Granite, marble 150-∞Stone, Slate 150-450Stone, Slatey shale >3,000Stone, Limestone, firm 350-450Stone, Limestone, soft 130-160Stone, Limestone, soft tufa 25-50Stone, Sandstone 75-450Stone, Clay 75
Tiles, clay tile, ceramic 750-1,500Tiles, floor tile, ceramic 115Tiles, terracotta roof tile 180-220
4.8.4 Category Four: Organic-Hygroscopic
Material Vapour Resistivity( MNs/gm )
Carpet, normal backing 7-20Carpet, foam backed or foam underlay 100-300
Corkboard/slabs 50-200Cork Insulation 25-50Cork, expanded 23-50Cork, expanded and impregnated 45-230Cork, expanded with bitumous binding 45-230
Mineral and vegetable fibre insulation 5
Paper 500
Strawboard 45-70
Wood, Ash 200-1850Wood, Balsa 45-265Wood, Beech 200-1850Wood, Beech, soft 90-700Wood, Birch 90-700Wood, Fir 45-1850Wood, Gaboon, North Canadian 45-1850Wood, Oak 200-1850Wood, Pine 45-1850Wood, Pine, Northern red; Oregon 90-200Wood, Pitch pine 200-1850
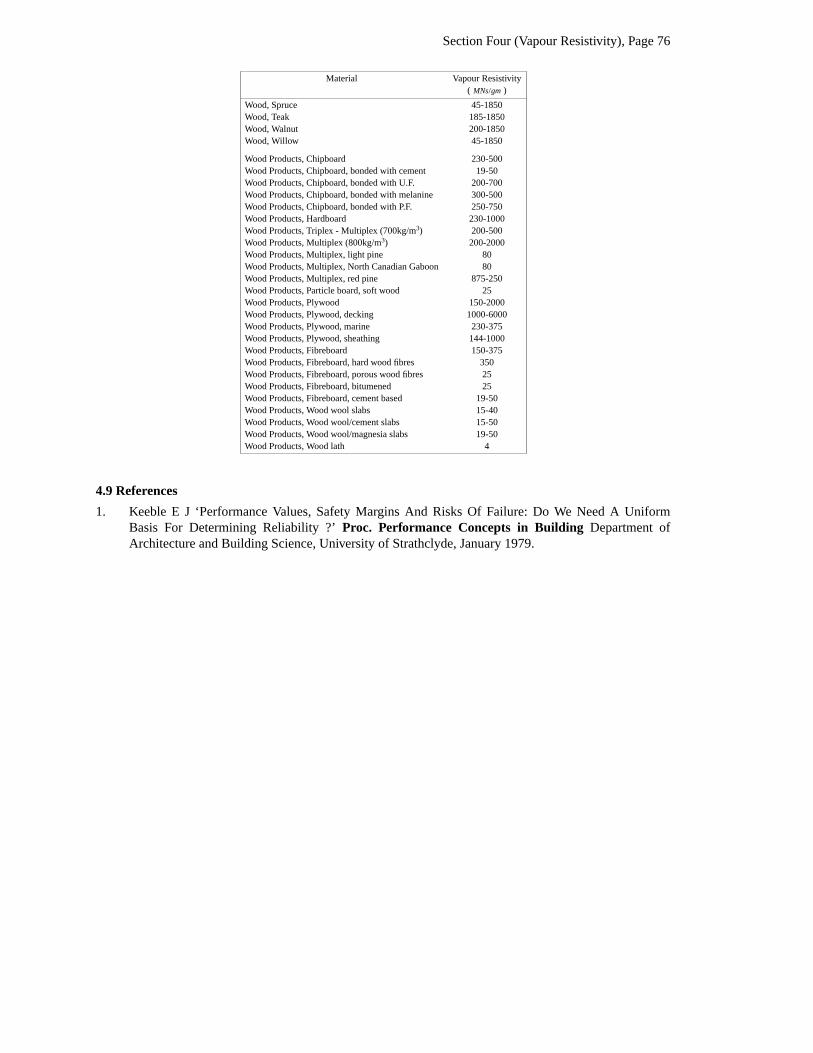
Section Four (Vapour Resistivity), Page 76
Material Vapour Resistivity( MNs/gm )
Wood, Spruce 45-1850Wood, Teak 185-1850Wood, Walnut 200-1850Wood, Willow 45-1850
Wood Products, Chipboard 230-500Wood Products, Chipboard, bonded with cement 19-50Wood Products, Chipboard, bonded with U.F. 200-700Wood Products, Chipboard, bonded with melanine 300-500Wood Products, Chipboard, bonded with P.F. 250-750Wood Products, Hardboard 230-1000Wood Products, Triplex - Multiplex (700kg/m3) 200-500Wood Products, Multiplex (800kg/m3) 200-2000Wood Products, Multiplex, light pine 80Wood Products, Multiplex, North Canadian Gaboon 80Wood Products, Multiplex, red pine 875-250Wood Products, Particle board, soft wood 25Wood Products, Plywood 150-2000Wood Products, Plywood, decking 1000-6000Wood Products, Plywood, marine 230-375Wood Products, Plywood, sheathing 144-1000Wood Products, Fibreboard 150-375Wood Products, Fibreboard, hard wood fibres 350Wood Products, Fibreboard, porous wood fibres 25Wood Products, Fibreboard, bitumened 25Wood Products, Fibreboard, cement based 19-50Wood Products, Wood wool slabs 15-40Wood Products, Wood wool/cement slabs 15-50Wood Products, Wood wool/magnesia slabs 19-50Wood Products, Wood lath 4
4.9 References
1. Keeble E J ‘Performance Values, Safety Margins And Risks Of Failure: Do We Need A UniformBasis For Determining Reliability ?’ Proc. Performance Concepts in Building Department ofArchitecture and Building Science, University of Strathclyde, January 1979.
Section Five, Page 77
Section Five: Recommendations for the Future
5.1 Review of Data-sets
The following observations can be made on the structure and contents of the data-sets described inSection Three.
• At present there is no consensus on the manner in which materials are grouped for presentation ofdata to designers. What is needed is a common system such as the CIB Master list of materials [1]which integrates thermal properties within a broad material classification system.
• The range of properties for which values are quoted is generally restricted. Commonly, the propertiesare thermal conductivity, density and vapour resistivity as required for simple steady state heat lossand condensation calculations.
• The sources of much of the data are not identified, and little information is given on the underlyingexperimental conditions. As a consequence data merging is an uncertain process because it is oftenimpossible to ensure compatibility between different entries.
• It is suspected that much of the agreement that does exist between the different data-sets can beattributed to a high degree of historical ‘borrowing’ one from the other. This in turn may lead, erro-neously, to an optimistic assessment of the inherent uncertainty.
• Many values are quoted without any statement as to whether they correspond to single or multiplemeasurements. A random inspection of several referenced works would suggest that values are usu-ally derived from the work of a single researcher on the basis of a small sample size.
• Many of the data values are derived from work carried out with non-standard apparatus and from adate which precedes modern standards of equipment and operation.
• No guidance is given on the variation in properties such as density and internal structure inherent inthe production of many building materials.
• There is no agreement on the procedure for the determination of the thermal conductivity of materialsin the moist state.
• There is tacit agreement that the uncertainty within the data is use-context dependent. The variouscalculation methods proposed are clearly expected to yield no more than ball-park estimates of realconditions (as opposed to meeting some abstract standard).
5.2 Review of Bulk Properties
For any material, density, moisture content and internal structure are the major determinants of itsthermal and hygroscopic behaviour. In some cases, the effects of temperature and ageing can also be signif-icant. This section considers how and where these properties and environmental conditions give rise touncertainties. It then suggests a mechanism for the management of this uncertainty.
Thermal Conductivity
It is well known that thermal conductivity is correlated with material density. For example Jakob [2]has established a relationship between average thermal conductivity and density for completely dry build-ing materials. This relationship was later confirmed by work undertaken at the UK Building ResearchEstablishment [3].
With respect to accuracy, Jakob suggested that individual values might deviate by up to ±15%. Healso suggested that the internal structure of a material affected the thermal conductivity, according towhether it was amorphous or crystalline. This relationship, between the thermal conductivity of dry materi-als (including insulating materials) and their density, was also examined by Billington [4]. Although themagnitude of the deviations is not explicitly discussed, it is implied that deviations of 50% or more notuncommon. Billington also draws attention to the influence of internal structure on thermal conductivity,particularly in the case of concretes, but concludes that the conductivity depended on whether the materialwas cellular or granular in structure rather than amorphous or crystalline. A deliberate application of con-trol of internal structure has shown that, in the case of concrete, the thermal conductivity can differ by up to30% for a given density [5].
For fibrous and cellular insulations, the apparent thermal conductivity is a function of density andfibre or cell size. In general, a specific combination produces minimum thermal conductivity.
Section Five, Page 78
Concrete and masonry present a particular problem in that the variable nature of the constituents hasa strong influence on the thermal conductivity. Sev eral reports give correlations of conductivity with den-sity for concrete [6, 7, 8] and for masonry [9, 10, 11]. It can be concluded that the prediction of the thermalconductivity of these materials from these correlations is quite approximate, particularly in the case ofmasonry.
Quite apart from trying to produce predictive algorithms, the inherent scatter in the relationshipbetween thermal conductivity and density has important consequences for the retrieval of values from adatabase. Once a material is located, density is invariably the key parameter in locating the correct value ofthermal conductivity. The essential problem is that the location on the thermal conductivity curve of thetest sample or samples that gav e rise to the value held is generally unknown, as is that of the material to beused on site. In the worst scenario, the value held may be derived from material with a high positive devia-tion while the material to be used on site has a high negative deviation. In practice the density assumed forthermal conductivity database retrieval will commonly be a nominal one supplied by the manufacturer. Anerror will arise if this deviates significantly from the actual density of the product as supplied and installed.A study of the properties of lightweight concrete blocks carried out by BRE Scottish Laboratory found sub-stantial deviations between the density quoted by manufacturers and the actual mean density of the blocksamples as measured [12]. Out of seven cases where comparisons could be made, four showed differencesof around 20% between the actual mean density and the quoted density. In addition, the actual spread ofdensities about the mean was, in most cases, substantial. The remedy for these problems lie in quality con-trol procedures which can guarantee the delivery of materials to within a known density tolerance. Untilthis is achieved, the error introduced will be an unknown quantity.
The thermal conductivity of a material is also strongly affected by the presence of moisture. Jakobproposed that the thermal conductivity of a mineral building material containing a known percent of mois-ture by volume could be obtained by multiplying the thermal conductivity in the dry state by a correctionfactor which depended only on the moisture content by volume. This method of correction has been widelyused and applied to masonry materials [2]. Some time later, thermal conductivity measurements on moistmaterials, by Jespersen [13], showed that the behaviour of different materials was not well represented by asingle characteristic. He found that both the magnitude of the initial rise at low moisture content and themoisture content at which the relationship between thermal conductivity and moisture content becomes lin-ear are significantly different for different groups of materials. He also noted that, in general, there is an ini-tial region, corresponding to the transition from dry to the point of hygroscopic equilibrium under normalinternal environmental conditions, where the thermal conductivity is little affected by increasing moisturecontent. As a result, he concluded that the equilibrium hygroscopic moisture content under such conditions- literally defined as ‘laboratory dry’ - has little effect on the thermal conductivity of materials.
In considering the rates of change of thermal conductivity with moisture content, Jespersen foundthat he was able to distinguish three kinds of behaviour associated with different material types. These weretimber products, inorganic lightweight insulating materials and masonry. At one extreme, the organic mate-rials proved to be little affected by moisture content, the relationship between the thermal conductivity andmoisture content being approximately linear throughout with no rapid increase in thermal conductivityobserved at low moisture contents. Consequently, the use of a single value of conductivity for such materi-als (when determined at the in-use moisture content) should be of adequate accuracy. At the other extreme,the mineral fibre insulating materials showed a violent increase in thermal conductivity with only smallincreases in moisture content, and thereafter assumed a linear relationship. Fortunately, such materials con-tain very small amounts of hygroscopic moisture under normal ‘air dry’ conditions, so that the value ofthermal conductivity determined for the dry state, or an appropriately conditioned one, should yield thesame value. However, should it be suspected that such materials may be exposed to conditions whichmight involve, for example, condensation or wetting, then the use of such thermal conductivity valueswould be extremely inaccurate. The range of behaviour of masonry materials was found to lie in a ratherbroadly defined zone located between the two extremes. Since the types of masonry tested were not fullyrepresentative, especially of concretes, the extent and shape of the zone is conjectural. Given the underly-ing physical processes, it is probable that a subdivision into cellular and granular materials would be useful.
Since masonry materials are usually subject to conditions involving significant moisture content, it isnot surprising that there have been numerous attempts to define their behaviour [2, 4, 8, 13, 14, 15, 16].There is evidence that the relationship between thermal conductivity and moisture content can be repre-sented by linear expressions in terms of moisture content by volume or by weight. In order to compare

Section Five, Page 79
published results, it is useful to express them as the percentage change in thermal conductivity per one per-cent change in moisture content by volume or by weight. It is also useful to adopt the convention of mois-ture correction factors such that the thermal conductivity, λ , at some percentage moisture content, m, isrelated to that at a reference moisture content, mr :
λ /λ r = (1 + Cm)/(1 + Cmr )
from which it follows that
λ − λ r /λ r (m − mr ) = C/(1 + Cmr )
where C, a constant, is independent of m for linear relationships. Thus the percentage change in λ per 1%change in m is determined not only by C but also by the choice of mr . Jespersen found significant linearbehaviour for all masonry materials between 2% and 10% moisture content by volume [13]. Above a refer-ence moisture content of 2%, the upper and lower bounds of his curves for the percent change in λ with myield a rate of 6% to 7%.
For lightweight concrete, Jespersen’s regression equation for λ versus m can be rearranged to yield Cby dividing his coefficient ‘a’ by a reference thermal conductivity consisting of the air-dry conductivity plusa diffusion conductivity. By using his quoted data and working in the units he used, a reasonable mean forthe air-dry conductivity is 0.9 BtU in/ ft2hF (0.13 W /mK ). The value of ‘a’ does not vary much, and themean value is 0.056. The mean value of the reference conductivity is close to unity so that an estimate of Cis 0.06. These results may be compared with the linear change in λ per 1% change in m by volume ofabout 6% given by the moisture correction factors in DIN 52612 [14]. By comparison, analysis of the non-linear Jakob correction factors for m in the range 2.5% to 10% by volume yields mean interval rates of 10%falling to 7%.
This suggests that the Jakob corrections are atypical, particularly at low moisture contents. However,Arnold examined the validity of the correction proposed by Jakob [9]. A curve of the thermal conductivityof masonry materials corrected to 1% moisture content against dry density was produced from publishedresults. The fit was concluded to be satisfactory. If the Jakob corrections were correct, the resulting curveshould have reduced, after removing the dependence on moisture content, to the same form as the dry ther-mal conductivity versus density curve with the same associated scatter. While only passing reference wasmade to the scatter of the results, others have examined it in some detail [17]. Whereas a maximum devia-tion for this type of curve of ±15% could be expected [2], the average spread was 15%, with individualdeviations of over 40%, and particularly poor agreement below 2% moisture content by volume [17]. Thisis in accord with present findings. A linear change in λ per 1% change in moisture content by weight hasbeen given as 4% for lightweight concrete [15] and 6% for bricks [4]. For the former material, relation-ships have been quoted giving C as 0.06 [8] or about 0.05 [16]. The respective rates of change are 3%-6%and 4%-6% over the range of validity of the latter relationship in moisture content and density. Minimummoisture contents quoted for linear behaviour have been 1% by volume [16] and 1.5% by weight [15].Dependence quoted in terms of moisture content by weight implies a dependence on density when quotedin terms of volume since, with increasing density, the same change in moisture content causes less changein thermal conductivity. This agrees with the finding of Jespersen that lightweight materials had the greatestoverall sensitivity to changes in moisture content (by volume).
In general, the corrections proposed in DIN 52612 seem more appropriate than those proposed byJakob, particularly if referenced to a moisture content of not less than 1% to 2% by volume. For relation-ships expressed in terms of moisture content by weight, there is considerable agreement that the factor Clies in the range 0.04 to 0.06 when referenced to a minimum moisture content of 1.5% by weight or 1% byvolume. The inherent scatter in results due to experimental error and, just as importantly, to differences ininternal composition between samples which cannot be eliminated by density dependency, means any questfor further accuracy is questionable. The relationship for lightweight concrete given by Valore seems credi-ble in current circumstances [8]. The question of which moisture contents actually exist in practice is avexed one. The standard moisture contents quoted for design purposes in Section A3 of the CIBSE Guidecover the range 1% to 5% moisture content by volume [18]. By contrast, Jakob gives the range as 5% forinner walls and 10% for outer walls, and draws attention to the possibility of great deviations [2]. Thechoice of the standard moisture contents for the UK is admitted to be based on sparse evidence[9]. Even so,the data show considerable spread. It follows that the uncertainty in specifying the moisture content in areal situation could be a major source of error in predicting thermal conductivity. In fact, such errors could
Section Five, Page 80
match or exceed the kind of errors noted in connection with the use of the Jakob corrections [16].
In general, the thermal conductivity of dry materials increases with temperature. The changes aresmall at normal temperatures and are usually neglected. Possible exceptions are the fibrous and porousinsulation materials where the apparent conductivity may vary significantly in extreme environmental con-ditions [19]. The presence of moisture increases the effect of temperature on the thermal conductivity ofinorganic materials. This is particularly acute for lightweight inorganic insulating materials, but for anymaterial with a moisture corrected thermal conductivity of less than 0.5 W /mK , the effect of temperaturewill have doubled or more [13].
Thickness also has an effect on the apparent conductivity of low density fibrous and cellular insula-tions due to radiative heat transfer. The effect is relatively small over thicknesses of 25mm to 150mm [20].Measurements at the Electricity Council Research Centre have found no evidence of a thickness effect inmineral fibre quilt of thickness 90mm to 360mm [21]. The evidence suggests little error will result inneglecting the effect of thickness. Finally, ageing can be identified as a significant cause of increase in ther-mal conductivity for foamed insulations blown with gas of a thermal conductivity below that of air. In time,the gas diffuses away and the thermal conductivity increases. Hence, only the value of the aged insulationshould be used.
Specific Heat Capacity
The seemingly straightforward definition of specific heat capacity as the amount of heat energyrequired to be added or removed to change unit mass of a material by unit temperature belies the difficultyof measuring such a value. The difficulty of obtaining reliable values for different materials, and theabsence of a predictive method, has been noted elsewhere [6]. One of the difficulties of measurement, par-ticularly for materials of low conductivity, is that it is difficult to input or extract heat quickly, making thedesign of accurate practical experimental apparatus difficult. Perhaps partly because of such difficulties,very few laboratories which responded to the project questionnaire measured this quantity. Test techniquesidentified included a relatively conventional absolute calometric method [22] and an indirect dynamic testmethod based on Fourier’s equation and computer regression analysis of test results [23]. Both are in-house methods.
Because of the high specific heat capacity of water, the effect of moisture content on the specific heatof a material is significant and must be taken into account. In principle, the overall specific heat capacity ofa material is simply the linear addition of that of the dry material to that due to the amount of water presentin the material. In practice, this means a knowledge of the in-use moisture content. While calculations canbe based on standard design values, their relevance to real site values are doubtful. The absence of a practi-cal, non-destructive test method for determining on-site moisture contents means inherent uncertainty incalculating values of specific heat capacity for moisture containing materials. This uncertainty is com-pounded when it is realised that it is, in fact, the volumetric heat capacity (that is the product of density andspecific heat capacity) which is important in determining thermal capacity. Hence, the uncertainty in den-sity, as discussed above, is added to the uncertainty in specific heat capacity for volumetric heat capacity.
A further source of error may arise from the fact that, in practice, conditions are dynamic. In general,materials will be subject internally to both temperature and moisture gradients that do not correspond toequilibrium distributions. Hence, both the thermal resistivity and capacity will vary from point to pointwithin the material. Finally, it is also the case that the specific heat capacity is a function of temperature.However, giv en the relatively small range of temperature involved in calculating the hygrothermal perfor-mance of buildings, the error associated with adopting a single figure value will be insignificant comparedto the scale of error from other causes.
Water Vapour Transmission
The behaviour of a material where gaseous diffusion is the vapour transport mechanism is relativelysimple. Where a material can absorb water, the diffusion process can be complemented by other forms oftransport which are capable of causing a considerable increase in the permeability of the material [24].Consequently there is a fundamental distinction to be made between hygroscopic and non-hygroscopicmaterials. Fortunately, there is an approach to measuring vapour permeability which can identify and evalu-ate these differences in behaviour [25]. This method has been applied to measurements of vapour perme-ability on ‘Gyproc’ plasterboard (non-hygroscopic) and plywood (strongly hygroscopic) [26]. The resultsobtained typify the differences in behaviour between hygroscopic and non-hygroscopic materials.
Section Five, Page 81
In the latter case, the vapour permeability is little affected by relative humidity, and is adequately rep-resented by a single value. There is the possibility of a slight increase with increasing humidity. Wheremore than one value is quoted, a rational way to limit variation and represent real conditions would be toselect the value obtained under the highest conditions of humidity where this can be identified.
The behaviour of hygroscopic materials falls into two distinct regions. At low humidities wheregaseous diffusion dominates, the behaviour is like that of non-hygroscopic materials. However, above 60%RH the behaviour becomes non-linear, with vapour permeability showing rapid changes with small changesin humidity. In the tests referred to above, the permeability of plywood at 95% RH was found to haveincreased twenty-fold over the low humidity value. The behaviour at high humidities might be even morecomplicated. A high moisture content causes plywood to undergo dimensional changes and swell. Conse-quently the pore sizes can increase and reduce the hygroscopic effects [27]. A limiting effect on theincrease in the permeability of wood based materials could operate at very high humidities. Current quoteddata on water vapour transmission properties are based on measurements at one or, at most, two values ofhumidity. While this is reasonable for non-hygroscopic materials, it can be seen to be an entirely inadequatedescription of the behaviour of hygroscopic materials above the transition point. One result is that there is awide variation in values quoted for hygroscopic materials, since they are extremely sensitive to relativelysmall changes in test conditions, as between different national standards for example. A survey of quotedvalues for plywood revealed the highest value to be some forty times the smallest [26].
The best that can be done at present is to represent the vapour transmission data for hygroscopicmaterials as a range, so that they at least convey some idea of the magnitude of the changes to be expectedat humidities beyond 60% relative humidity. This is obviously important in the context of choosing valuesfor condensation risk assessment. Clearly, the vapour permeability of non-hygroscopic materials can bedefined with much greater certainty than for hygroscopic materials. It would therefore make sense to distin-guish such materials from each other. Unfortunately, current data are not of a form to allow such a distinc-tion to be made reliably for all the degrees of hygroscopic behaviour displayed by building materials.
It is, however, possible to attempt a breakdown of materials into groups according to the certaintywith which their vapour permeability can be established. Clearly timber based products (organic and veryhygroscopic) are the least certain. Equally clearly, there are materials such as metal and glass which areimpermeable and have effectively zero permeability. Between these two extremes are the inorganic materi-als which are permeable. These can again be broken down into two groups. On the one hand there are non-hygroscopic inorganic materials such as mineral fibre insulations which behave in a simple manner. On theother hand there are masonry materials which are inorganic but display weak to strong hygroscopicbehaviour.
It is interesting to find that, impermeables apart, these groupings correspond closely to those used byJespersen to distinguish the behaviour of moist materials in terms of thermal conductivity. Masonry materi-als occupied a broad zone, timber displayed the least variation and lightweight non-hygroscopic inorganicsthe most.
With regard to the dependence of vapour permeability on temperature, it is only of significance in thecase of the least permeable membranes [25]. Such membranes would naturally fall under the impermeablegrouping adding further to its significance in terms of defining behaviour.
Surface Properties: Opaque Materials
Radiative heat transfer properties are conveniently considered together and, indeed, are now com-monly tabulated together. Unlike the bulk properties considered above, such surface properties can be deter-mined with considerable accuracy. The properties are wav elength and therefore source temperature depen-dent. For opaque bodies, although emissivity and absorptivity are equal to each other at the samewavelength, the difference in the spectra of radiation at normal environmental temperatures and solar tem-peratures results in significantly different values. It is usually considered sufficiently accurate to quote a sin-gle value for the relatively small range covered by normal environmental temperatures.
In practice, one possible source of inaccuracy is to use values of laboratory tested materials that com-pare to a pristine surface state as opposed to the in-use surface state after a material has been subject to age-ing through such agencies as weathering, chemical attack, and dirt accumulation. Where possible, valuesappropriate to an in-use condition should be quoted.
Values of emissivity quoted are commonly for the total normal emissivity. The actual power emitteddepends on the hemispherical emissivity, which may differ. For nonconductors, the hemispherical

Section Five, Page 82
emissivity may be lower by up to 7%, and for highly polished metallic surfaces, it may be greater by up to30% [28]. The hemispherical emissivities can be calculated by multiplying the total normal emissivities by1.2 for bright metal surfaces, by 0.98 for nonconducting rough surfaces and 0.95 for non-conductingsmooth surfaces [29]. It can be seen that the least error will occur with normal building surfaces. A casualinspection of the values quoted by various sources suggests excellent agreement. Closer inspection revealsthe extent of the borrowing that underlies this commonality. As an example, a recent compilation of solarabsorptivities and emissivities by Penwarden at BRE borrows extensively from an earlier review carried outat the CSIRO and published in 1951 [30]. In turn, many of the solar absorptivity values quoted in this ear-lier review can be traced back to the work carried out at BRE (BRS as it was then) and published in 1935[31]. In a similar way, many emissivities can be found in a 1941 publication [32].
The listing by Penwarden includes additional new values and represents the most up to date amend-ment of the historical data on solar absorptivities and emissivities to hand [33]. It has therefore beenadopted as the core data for present purposes.
Section Five, Page 83
Surface Properties: Transparent Materials
Transparent materials have the property of transmission in addition to those of reflection and absorp-tion. As the sum of the three properties must equal unity, it is only necessary to measure two of them.
It is universal practice to refer to glazing manufacturers for data on the solar optical properties of thevarious forms of sheet glass used in window systems. Unlike many building materials, both the quality con-trol of glass and the precision with which the manufacturers determine their product properties is high. Thegeneral way of treating the data is to provide values of the properties including, perhaps, total transmittanceat normal incidence. The behaviour at other angles of incidence is supplied in a graphical form showing thefractional change in properties as a function of the angle of incidence. The value of any property at otherthan normal incidence can then be estimated with good accuracy by adjusting its value at normal incidenceby the appropriate fractional change indicated by the graph. In the case of coated versions of glasses, thebehaviour at oblique angles of incidence above 30 degrees is not so well approximated by the characteris-tics of the non-coated glass, although even then the error is only around ±3% [34]. If better accuracy isrequired, then separate graphical corrections will be needed for coated versions of glasses. Transparentplastic materials are used in a number of speciality glazing applications. Appropriate data on their proper-ties are obtained from the manufacturers as for glass.
5.3 Review of Test Methods
This section provides an review of the test methods underlying thermal conductivity, water vapourtransmission, longwav e emissivity and solar optical properties.
Thermal Conductivity
Quoted data are derived from measurements carried out by either the hot-plate or heat flow metertechniques. Both are steady state methods and primarily designed for measurements in the dry state. Assuch, the design and behaviour of equipment has received considerable attention [35]. Tests using the hot-plate method make absolute measurements of the conductivity for 1-dimensional (longitudinal) heat flow. Itis possible to achieve an accuracy of ±3%, although in practice this is very dependent on the operation ofthe apparatus and the skill of the operator. Recently, schemes such as that operated by NAMAS, have beenintroduced to remedy this, by rationalising operation and inspection of equipment [36]. Measurementsmade prior to such schemes may be subject to larger errors. Even so the assumption of an accuracy towithin 5% for later measurements may be misplaced. Inspecting agencies have some discretion on uncer-tainty, and in particular cases the error for some materials may be around 20% rather than 5% [37].
The heat flow meter technique is a relative technique which requires the use of calibration samplesmeasured by the hot plate method. As such, the error associated with measurements carried out using thistechnique are about twice that of the hot plate, that is the error in the hot plate calibration sample measure-ment plus the heat flow meter error. It is, however, simpler to use and less dependent on operator error.Success in use depends on the existence of a well defined set of calibration samples.
The behaviour of both sets of apparatus has received considerable analysis and improvement, includ-ing the development of standard samples for heat flow meter calibration [38]. Nevertheless, what is appar-ent by its omission is any reference to the measurement of moist samples. Indeed, the recent ISO draft stan-dards on hot plate and heat flow metering simply refer to the matter as complex and consider only measure-ments in the dry state [39, 40]. In principle this is correct, because neither form of apparatus is suited to themeasurement of moist materials. However, since such measurements for masonry materials are of particularpractical importance, the problems are worth considering in detail.
The essence of the problem is that the application of a temperature difference to a moist specimenresults in a moisture gradient, causing moisture to migrate from the higher temperature. This affects thespot conductivity through the specimen and hence the temperature distribution. It has been observed thatthe spot thermal conductivity decreases more rapidly in the warmer (drier) region than it increases in thecolder (moister) region [41]. At constant applied temperature difference, the same sample will have differ-ent moisture gradients for different moisture contents while, at constant moisture content, the same samplewill have different moisture gradients for different applied temperatures. In addition, as the moisture con-tent increases, condensate will appear at the cold side of the specimen [17]. This suggests that the measuredconductivity will increasingly fall below the conductivity for a linear moisture distribution, as the moisturecontent increases.
Section Five, Page 84
In the absence of a knowledge of the moisture gradient, quoting applied temperatures at constantmoisture content does not uniquely define the measurement. As such, measurements become particularfunctions of:
temperaturemoisture contentsample thicknesssample orientation: up- or down-ward heat flowlength of measurement period.
The present situation is unsatisfactory and is unlikely to be resolved in terms of current test methodswhich are specifically designed for measurement in the dry state. A method of measurement involving amuch lower applied temperature difference than is required by either the hot-plate or heat flow meter meth-ods would help reduce the problem of moisture migration. One possibility that deserves investigation is thethin-heater thermal conductivity apparatus. In describing recent developments with this apparatus, Hagerhas drawn specific attention to the potential of this method in minimising water vapour migration, becauseof the low temperature difference involved [42].
Water Vapour Transmission
There is a need to modify existing wet- and dry-cup techniques to determine at least five points onthe vapour permeability versus relative humidity curve so that differential permeability curves can be gener-ated. This is required not only for known hygroscopic materials, but to identify all the materials that are sig-nificantly hygroscopic. In the longer term, more realistic results would be obtained if tests could be carriedout for simultaneous vapour pressure and temperature differences, rather than isothermally as at present.
Moisture Content
There is an urgent need to establish the true distribution of moisture content in building materials indifferent regions for statistically significant samples. The UK is a particular case in point. Destructive test-ing in the form of drilling out core samples and weighing them would not be acceptable to many buildingowners and would take a long time. A review of alternative methods was not very optimistic, except in pro-moting a capacitance measuring technique [36].
Longwave Emissivity and Solar Optical Properties
The techniques of pyrometry and photometry are well established and supported by well developedinstrumentation (both total and spectral). However, there is a lack of Standards relating to the measurementof such properties, particularly in relation to in-use building surfaces.
5.4 Review of Classifications
There is little agreement between the data-sets in terms of the classification of the data. One interest-ing possibility for the future would be to adopt the approach recommended by Eldridge [1]. To quote thepreface
“This listing of the properties of building materials puts into effect the recommendations of the CIBthat such properties should be presented in a systematic manner according to an internationallyagreed standard method. The result is a uniquely practical volume dealing with the important materi-als in a clear, concise and easily understood manner.”
5.5 The Data-Sets Compared
In essence the CIBSE and ASHRAE data-sets define the extremities of a spectrum within which theother collections can be placed. For example the Belgian and French collections, like CIBSE, attempt tocompensate for moisture, while the Indian collection, like ASHRAE, contains properties only for the drystate. It is interesting therefore to compare the CIBSE and ASHRAE collections.

Section Five, Page 85
ASHRAE CIBSE
Differentiates between homoge-neous and non-homogeneous mate-rials (conductance for stated thick-ness).
No differentiation, conductancedetermined from component partconductivities and air space resis-tances.
Quotes dry state values which arenot representative of materials inuse.
Compensates for moisture so thatvalues are representative of materi-als in use.
Source of data well documented. Source not well documented.
Known test procedures: ASTMC-518 (guarded hot plate) orASTM C-177 (heat flow metermethod).
Test procedures largely unknown(guess: pre-standard guarded hotplate). BS 874 for new entries.
For non-homogeneous materialsASTM C-236 (guarded hot box) orASTM C-976 (calibrated hot box)recommended.
Calculation recommended.
Data intended for computation ofsteady state U-values.
Data more useful for dynamic mod-elling.
5.6 Summary Specification of an Electronic Database
Given the complexity of the Section Four data-sets, and the fact that the use of the data is context-dependent, it is recommended that the data-sets be installed within a relational database and containedwithin an expert system framework. This will allow future management of the data and ensure that thematerial properties are used in the correct context. The following summary specification is offered.
• Logical records should relate to a given material and be comprised of any number of physical recordscorresponding to the different thermo-physical parameter sets associated with the different test condi-tions and use contexts. A physical record would comprise the material descriptor, the thermo-physi-cal properties of interest, a source identifier and the context definition.
• The structure should facilitate future growth, both in the number of logical/physical records, and inthe associated attribute data.
• The database should have efficient data access and retrieval mechanisms including the ability toreport, graphically and textually, any sub-set selected by type, identifier, property range and so on.For example:
list all metals and their propertieslist all inorganic materials with a density x ≤ ρ ≤ yidentify all organic materials associated with CIBSE.
• The database should permit the later addition of other material attributes, such as cost, and/or be ableto operate in conjunction with other databases holding such data.
• Multi-user access and networking capabilities should be in-built in order to facilitate future CABDintegration.
• A rollback facility should be incorporated to prevent data loss or corruption.
• Data transfer options should be included, allowing, for example, import/export of informationto/from ASCII and other formats.
• The database should have a user friendly interface (probably forms driven). This interface should beprogrammable to allow the invocation of external programs (such as statistical software).
• The database should be contained within an expert system framework to ensure that data areextracted against the ‘correct’ use context.
Section Five, Page 86
5.7 References
1. Eldridge H J ‘Properties of Building Materials’ Medical and Technical Publishing Co. Ltd Lan-caster, UK, 1974.
2. Jakob M Heat Transfer, Part 1 Chapman and Hall, London, 1949.
3. Ball E F ‘Measurements of thermal conductivity of building materials’ JIHVE 36 pp51-6, May1968.
4. Billington N S Thermal Properties of Buildings Cleaver-Hume Press Ltd, London, 1952.
5. Simpson A and Stuckes A D ‘Thermal conductivity of vermiculite concrete: effect of inclusionshape’ Building Serv. Eng. Res. & Technology 8, 1-4, 1987.
6. Page J Private Communication 1989
7. Tye R P and Spinney S C ‘Thermal conductivity of concrete: measurement problems and effect ofmoisture’ Report Dynatech R/D Company, Cambridge, MA, USA, 1976.
8. Valore R C ‘Calculation of U-values of hollow concrete masonry’ Concrete International AmericanConcrete Institute, 2(2), pp40-63, 1980.
9. Arnold P J ‘Thermal conductivity of masonry materials’ BRS Current Paper CP 1/70 1970.
10. Van Geem M G and Fiorato A E ‘Thermal properties of masonry materials for passive solar design -a state-of-the-art review’ DOE/CE/30739 Construction Technology Laboratories, Skokie, IL, USA,1983.
11. Evans D ‘Assessment of the physical and thermal properties of masonry products’ORNL/Sub/22020/1 Steven Winter Associates, New York, NY, 1988.
12. Unpublished Report, BRE Scottish Laboratory, Glasgow, Scotland, 1975.
13. Jespersen H B ‘Thermal Conductivity of moist materials and its measurement’ JIHVE 21, pp157-74,August 1953.
14. DIN 52612 ‘Thermal conductivity for building applications’ Beuth Verlag GmbH, Berlin, 1969.
15. Loudon A G ‘The effect of moisture on thermal conductivity’ Autoclaved Aerated Concrete, Mois-ture and Properties pp131-41, Elsevier Scientific Publishing, Amsterdam, 1983.
16. Stuckes A D and Simpson A ‘Moisture factors and the thermal conductivity of aerated concrete’Building Serv. Eng. Res. & Technol 7(2), pp73-7, 1986.
17. Stuckes A D and Simpson A ‘The effect of moisture on the thermal conductivity of aerated concrete’Building Serv. eng. Res. & Technol 6(2), pp49-53, 1985.
18. CIBSE Guide, Section A3 ‘Thermal Properties of Building Structures’, CIBSE, London, 1980.
19. Anon ‘An Assessment of Thermal Insulation Materials and Systems for Building Applications’Brookhaven National Laboratory/Dynatech R/D Company, BNL-50862, Report for US Dept. ofEnergy under contract EY-76-C-02-0016 Washington DC, June 1978.
20. ASHRAE Handbook of Fundamentals, SI edition ‘Thermal Insulation and Water Vapor Retarders’Chapter 20, 1985.
21. Siviour J B ‘Thermal performance of mineral fibre insulation’ Technical note, Building Serv. Eng.Res. and Technol. 6(2), pp91-2, 1985.
22. Skeet N A Personal Communication, Electrical and Thermal Section, Fulmer Yarsley Ltd, Redhill,Surrey, England, 1989.
23. Hens H ‘Kataloog van hygrothermische eigenschappen van bouwen isolatiematerialen’ TechnicalReport 1. Laboratory for building Physics, Catholic University of Louvain, 1984.
24. Starov V M and Churaev N V ‘Mechanisms of the vapour permeability of porous bodies’ Inzhen-erno-Fizicheskii Zhurnal 29(6), pp506-11, 1975.
25. ASHRAE Handbook of Fundamentals, SI edition ‘Moisture in Building Construction’ Chapter 21,1985.
26. MacLean R C and Galbraith G H ‘Interstitial condensation: applicability of conventional vapour per-meability values’ Building Serv. Eng. Res. & Technol. 9(1), pp29-34, 1988.
Section Five, Page 87
27. McIntyre I S Personal Communication, Seminar, BRE, Watford, UK, 22 March 1989.
28. ASHRAE Handbook of Fundamentals, SI edition ‘Heat Transfer’ Chapter 3, 1985.
29. CIBSE Guide, Section C3 ‘Heat Transfer’, CIBSE, London, 1976.
30. Holden T S and Greenland J J ‘The coefficients of solar absorptivity and low temperature emissivityof various materials - a review of the literature’ Report R.6 Division of Building Research, CSIRO,Melbourne, Australia, 1951.
31. Beckett H E ‘The Exclusion of Solar Heat’ JIHVE 3(5), pp84-8, 1935.
32. Perry J H (Editor) Chemical Engineers Handbook (2nd Edition) McGraw-Hill Book Co., NewYork, NY, USA, 1941.
33. Penwarden A Unpublished report, BRE, Watford, England, January 1989.
34. Guy A Personal communication, Pilkington R&D Laboratories, St Helens, Merseyside, UK, 1989.
35. Shirtcliffe C J and Tye R P (Eds) ‘Guarded Hot Plate and Heat Flow Meter Methodology’ ASTMSpecial Technical Publication 879 pp140-53, American Society for Testing and Materials, Philadel-phia, USA, 1985.
36. NAMAS document M1 ‘Introducing NAMAS’ National Physical Laboratory, Teddington, Middle-sex, 1985.
37. NAMAS Calibration No.0107 Thermal Conductivity Laboratory, Fulmer Yarsley Ltd, Redhill, Sur-rey, UK, September 1988.
38. Bomberg M and Solvason K R ‘Discussion of Heat flow Meter Apparatus and Transfer StandardsUsed for Error Analysis’ ASTM Publication 879: Guarded Hot Plate & Heat Flow MeterMethodology pp140-53, American Society for Testing and Materials, Philadelphia, USA, 1985.
39. Draft International Standard ISO/DIS 8301 ‘Thermal insulation, determination of steady-statespecific thermal resistance and related properties - heat flow meter method’ 1987.
40. Draft International Standard ISO/DIS 8302 ‘Thermal insulation, determination of steady-state realresistance and related properties - guarded hot plate apparatus’ 1987.
41. Woodside W and Cliffe J B ‘Conductivities of Ottawa sand determined by guarded hot plate appara-tus’ Soil Science 87, 75, 1959.
42. Hager N E ‘Recent Developments with the Thin-Heater Thermal Conductivity Apparatus’ ASTMPublication 879, Guarded Hot Plate & Heat Flow Meter Methodology pp180-90, American Soci-ety for Testing and Materials, Philadelphia, USA, 1985.