break-even aim: to produce a break-even graph objectives: recap fixed and variable costs draw up a...
TRANSCRIPT
break-even
Aim: To produce a break-even graph
Objectives:•Recap fixed and variable costs•Draw up a break-even chart•Analyse and interpret a break-even chart
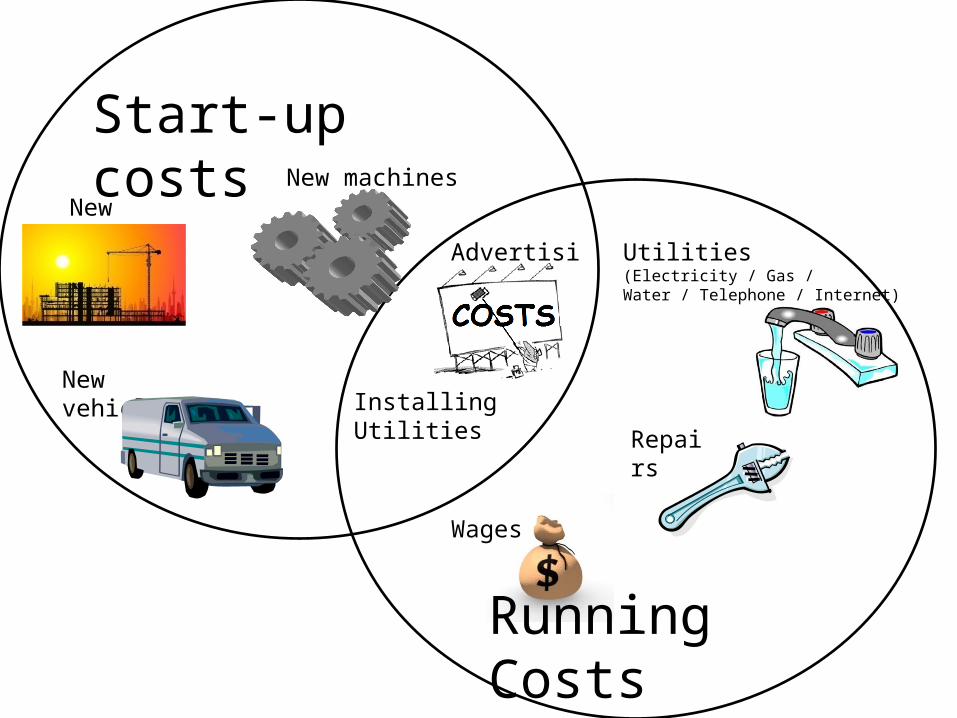
Start-up costs
Running Costs
New buildingNew machines
Advertising
New vehicles
Utilities (Electricity / Gas / Water / Telephone / Internet)
Repairs
Wages
Installing Utilities
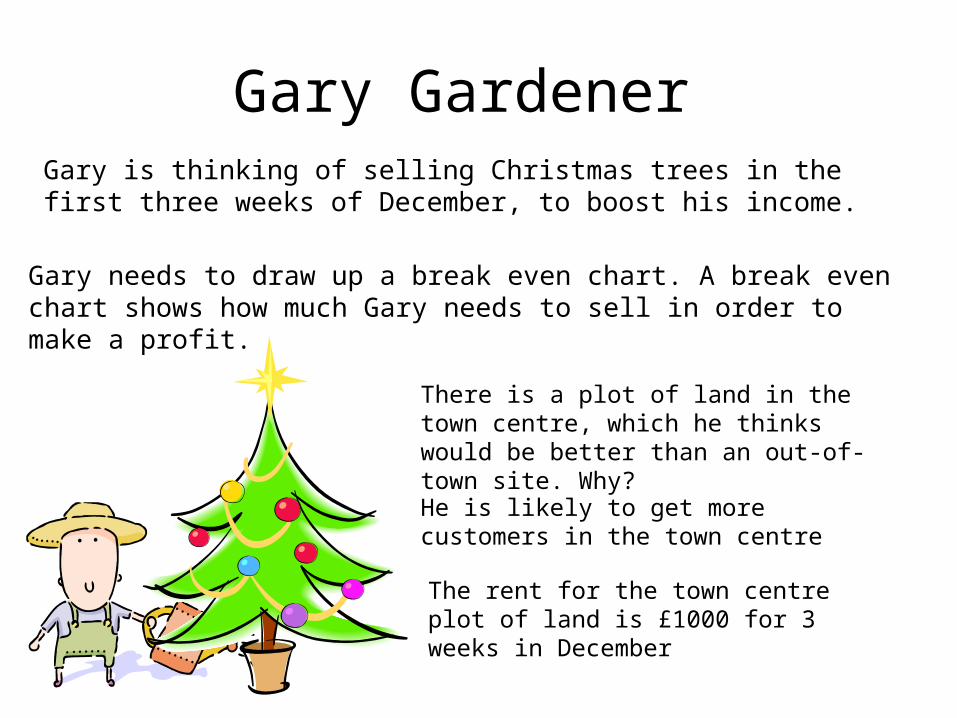
Gary Gardener
Gary needs to draw up a break even chart. A break even chart shows how much Gary needs to sell in order to make a profit.
Gary is thinking of selling Christmas trees in the first three weeks of December, to boost his income.
There is a plot of land in the town centre, which he thinks would be better than an out-of-town site. Why?
He is likely to get more customers in the town centre
The rent for the town centre plot of land is £1000 for 3 weeks in December
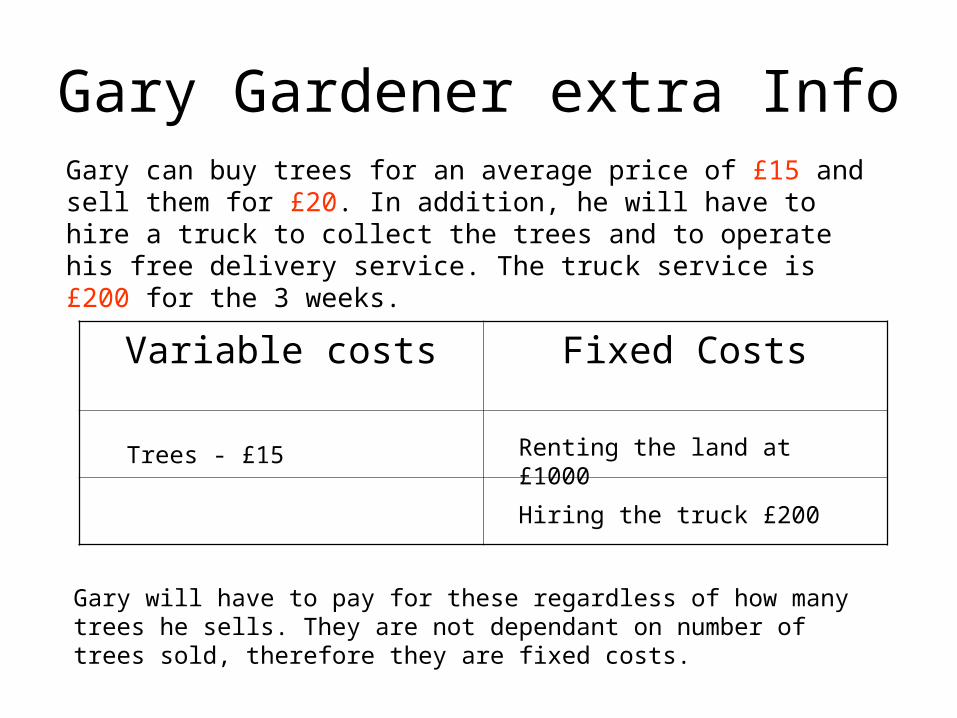
Gary Gardener extra InfoGary can buy trees for an average price of £15 and sell them for £20. In addition, he will have to hire a truck to collect the trees and to operate his free delivery service. The truck service is £200 for the 3 weeks.
Variable costs Fixed Costs
Trees - £15 Renting the land at £1000
Hiring the truck £200
Gary will have to pay for these regardless of how many trees he sells. They are not dependant on number of trees sold, therefore they are fixed costs.
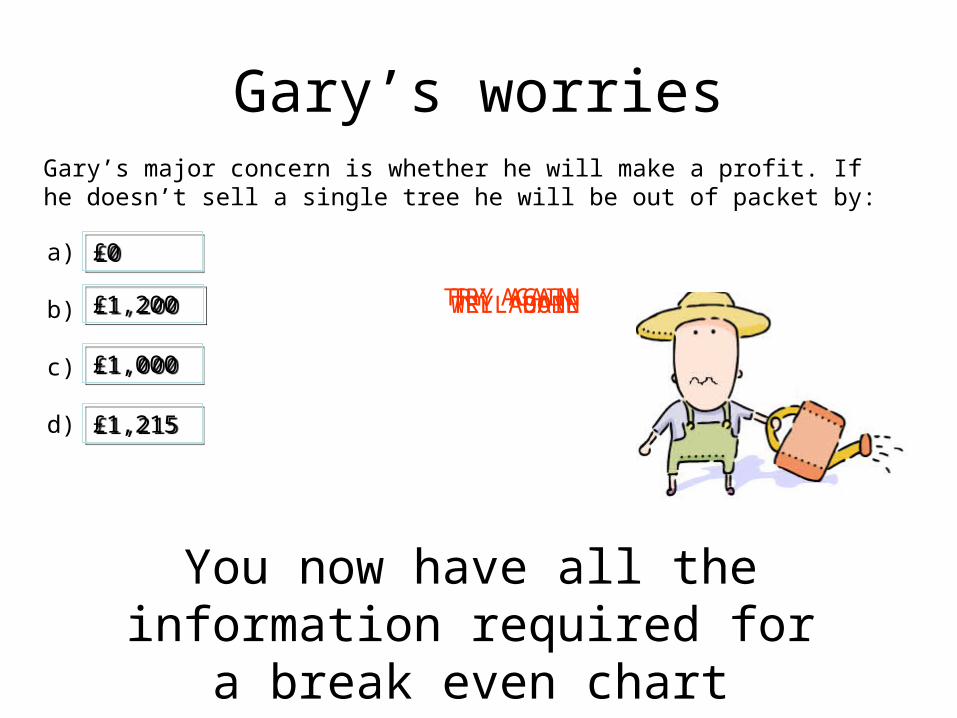
Gary’s worriesGary’s major concern is whether he will make a profit. If he doesn’t sell a single tree he will be out of packet by:
£1,200£1,200
£1,215£1,215
£1,000£1,000
£0£0
TRY AGAINTRY AGAINTRY AGAINWELL DONE
You now have all the information required for a
break even chart
a)
b)
c)
d)
10,000
8,000
6,000
4,000
2,000
0
Cost
s/re
venu
es
(£)
0 100 200 300 400 500
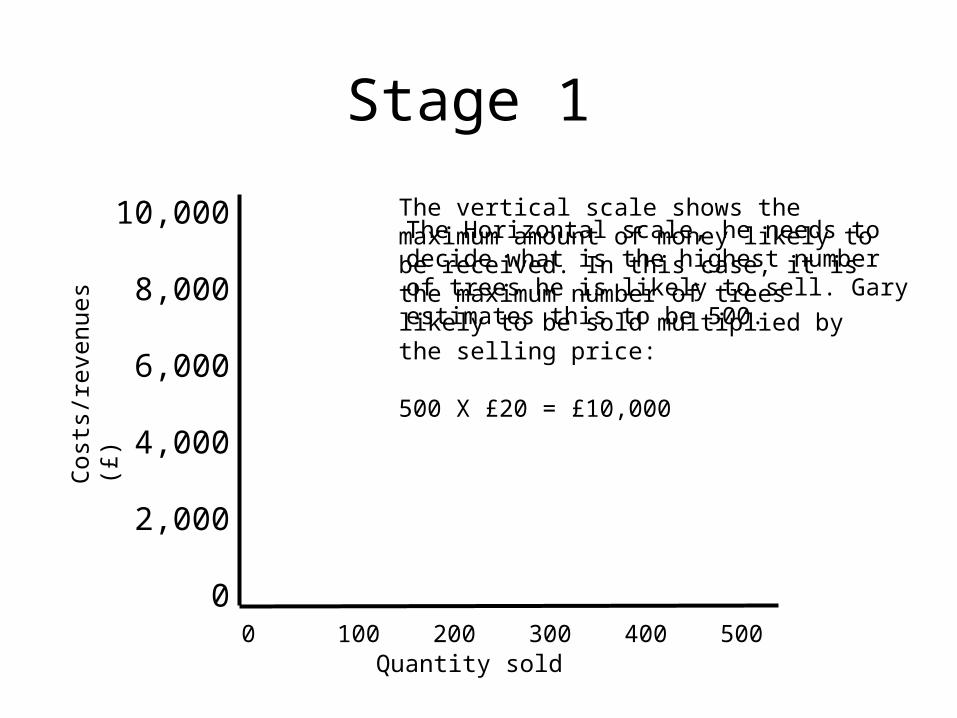
Stage 1
The Horizontal scale, he needs to decide what is the highest number of trees he is likely to sell. Gary estimates this to be 500.
The vertical scale shows the maximum amount of money likely to be received. In this case, it is the maximum number of trees likely to be sold multiplied by the selling price:
500 X £20 = £10,000
Quantity sold
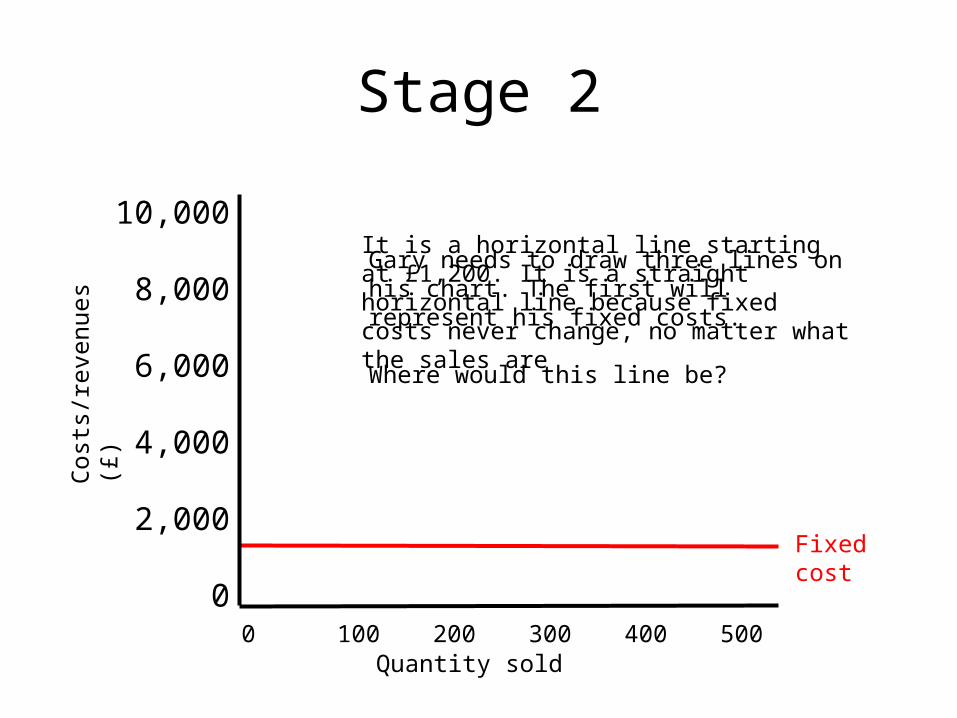
Stage 2
Gary needs to draw three lines on his chart. The first will represent his fixed costs.
Where would this line be?
It is a horizontal line starting at £1,200. It is a straight horizontal line because fixed costs never change, no matter what the sales are
10,000
8,000
6,000
4,000
2,000
0
Cost
s/re
venu
es
(£)
0 100 200 300 400 500Quantity sold
Fixed cost
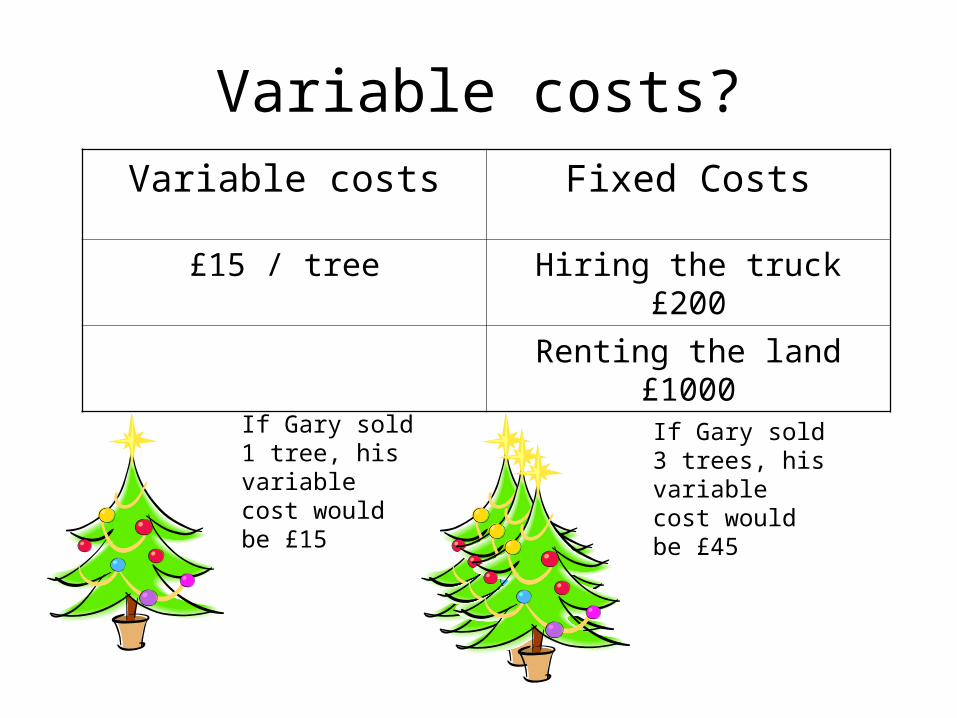
Variable costs?Variable costs Fixed Costs
£15 / tree Hiring the truck £200
Renting the land £1000
If Gary sold 1 tree, his variable cost would be £15
If Gary sold 3 trees, his variable cost would be £45
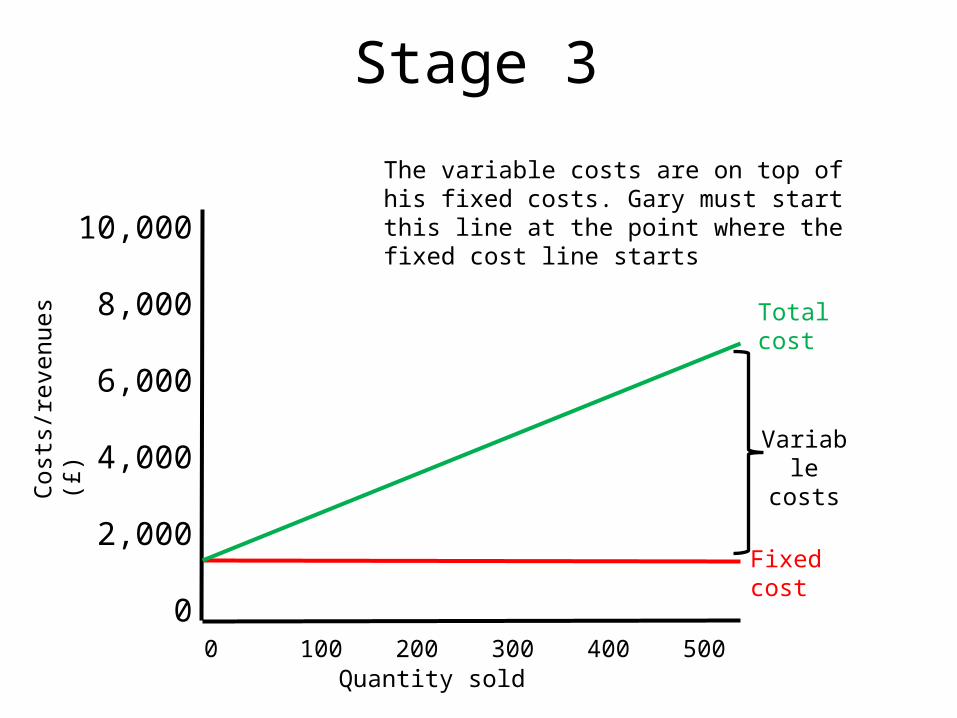
Stage 3
10,000
8,000
6,000
4,000
2,000
0
Cost
s/re
venu
es
(£)
0 100 200 300 400 500Quantity sold
The variable costs are on top of his fixed costs. Gary must start this line at the point where the fixed cost line starts
Fixed cost
Total cost
Variable costs
Stage 4
10,000
8,000
6,000
4,000
2,000
0
Cost
s/re
venu
es
(£)
0 100 200 300 400 500Quantity sold
Fixed cost
Total cost
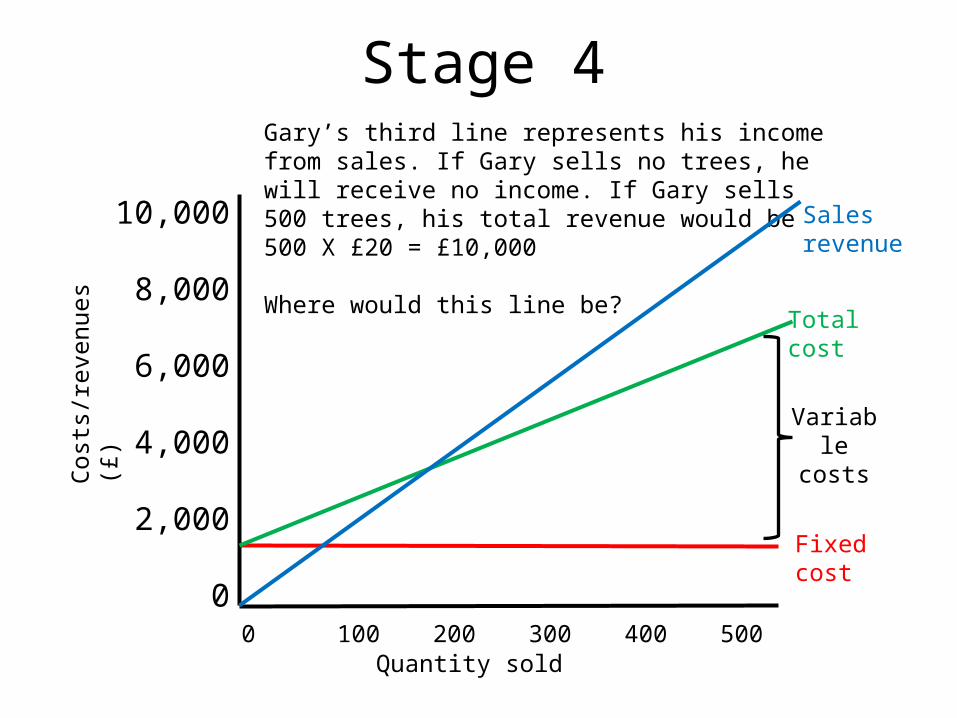
Gary’s third line represents his income from sales. If Gary sells no trees, he will receive no income. If Gary sells 500 trees, his total revenue would be 500 X £20 = £10,000
Where would this line be?
Sales revenue
Variable costs
Stage 4
10,000
8,000
6,000
4,000
2,000
0
Cost
s/re
venu
es
(£)
0 100 200 300 400 500Quantity sold
Fixed cost
Total cost
Sales revenue
Variable costs
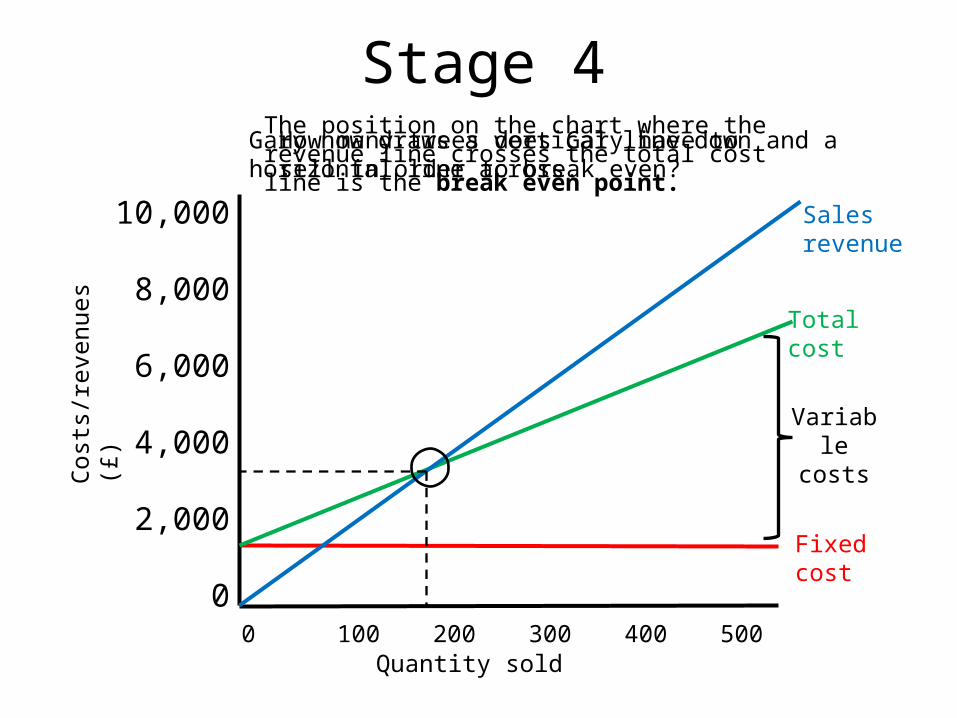
The position on the chart where the revenue line crosses the total cost line is the break even point.
Gary now draws a vertical line down and a horizontal line across.
How many trees does Gary have to sell in order to break even?
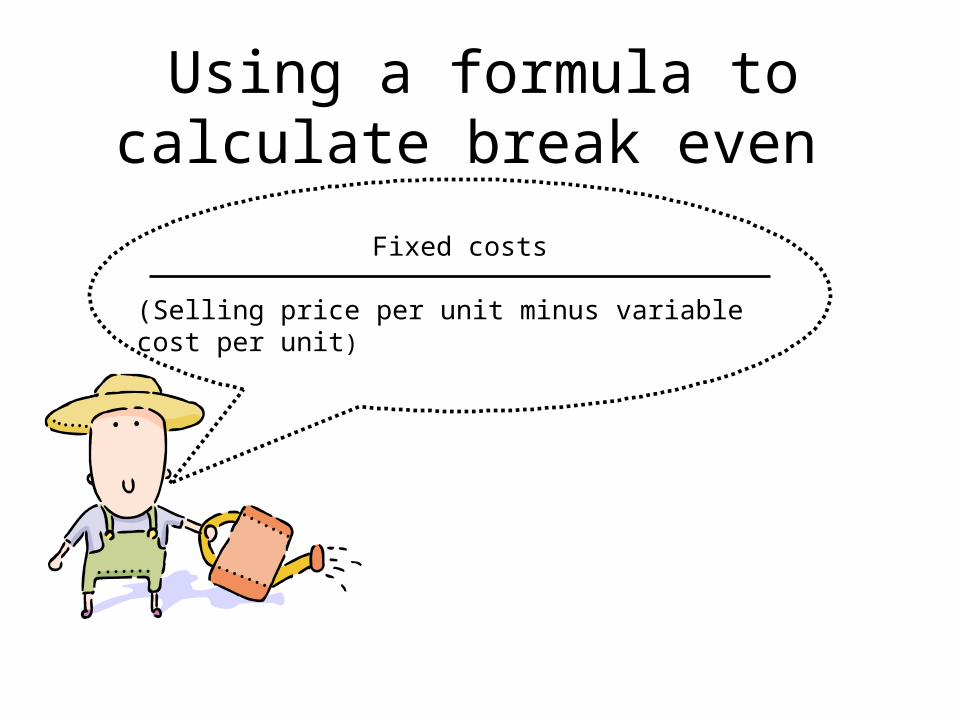
Using a formula to calculate break even
Fixed costs
(Selling price per unit minus variable cost per unit)
What have we learnt?•What a break even chart shows
•What costs are associated with a break even chart
•How to make a break even chart
•Analysing and interpreting a break even chart
•And......................
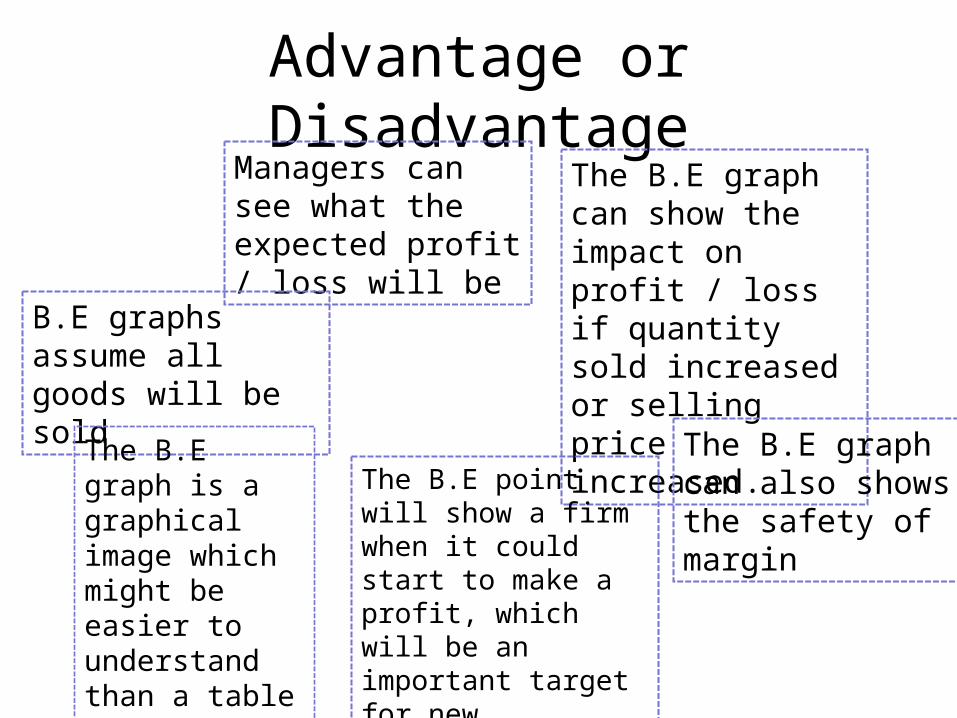
Advantage or DisadvantageManagers can see what the expected profit / loss will be
The B.E graph can show the impact on profit / loss if quantity sold increased or selling price increased.
The B.E graph can also shows the safety of margin
B.E graphs assume all goods will be sold
The B.E point will show a firm when it could start to make a profit, which will be an important target for new businesses
The B.E graph is a graphical image which might be easier to understand than a table of figures.
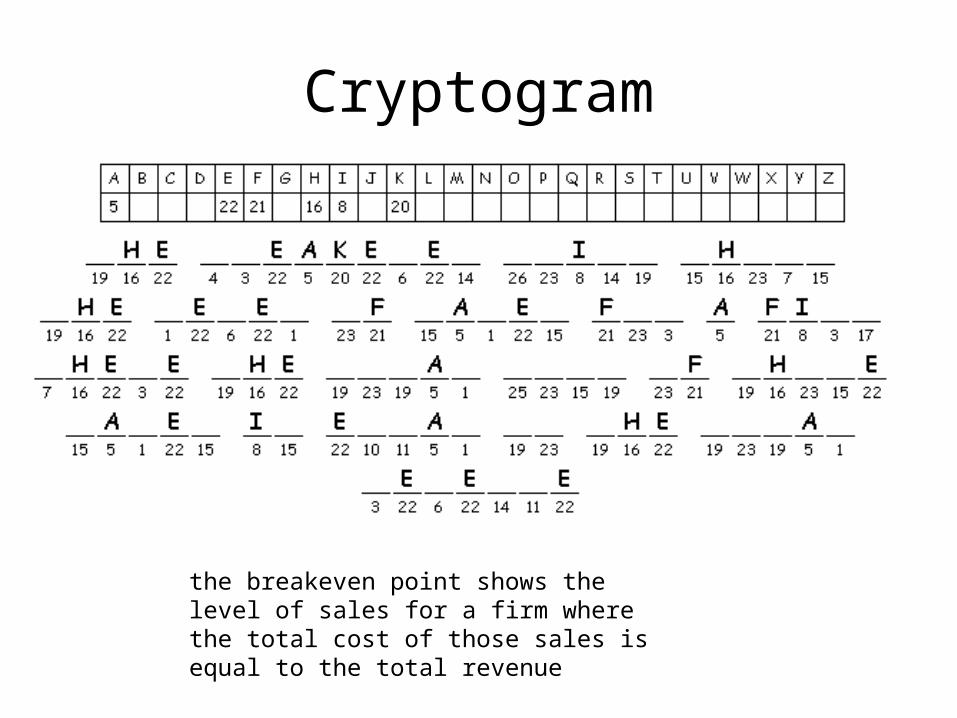
Cryptogram
the breakeven point shows the level of sales for a firm where the total cost of those sales is equal to the total revenue

Internet games
• http://www.businessstudiesonline.co.uk/live/index.php?option=com_content&view=article&id=35&Itemid=23
Activity 6.4 pg 95

Exam Q