breast cancer prevention graham colditz, md, drph niess-gain professor, dept. of surgery washington...
TRANSCRIPT
Breast cancer prevention
Graham Colditz, MD, DrPHNiess-Gain Professor, Dept. of Surgery
Washington University School of Medicine,ACS Clinical Research Professor, and
Associate Director, Prevention and Control

Long history of studying causesLong history of studying causes
1850’s family history1920’s reproductive risk factors
– Lane-Claypon, 1926 case-control study1950’s menopause1970 – onwards oral contracpetives,
postmenopausal hormones, diet, physical activity, obesity, endogenous hormones, SERMs

Do we know causes of breast Do we know causes of breast cancer?cancer?
How do we frame this question?Individual cases?At the population level?Does epidemiology guide prevention for
individual women or inform population strategies?

PreventionPrevention
Prevention today refers mainly to lowering the risk of disease.
Risk of most chronic diseases can't be totally eliminated, it can still be significantly reduced.
If everyone in the US led a healthy lifestyle, 80% of the cases of heart disease and diabetes could be avoided, as could 70% the cases of stroke and over 50% of cancer.

RiskRisk
Risk is a person's chance of getting a disease over a certain period of time.
There are many different ways to present risk.

Can we prevent breast CA?Can we prevent breast CA?
YES
International variationMigrationCommon claim we do not know causes
“ much of breast cancer epidemiology is not explained by known risk factors”

Breast Cancer Average Annual Breast Cancer Average Annual Incidence per 100,000 by age, 1982Incidence per 100,000 by age, 1982
1
10
100
1000
San Francisco
Japan
China
Age (years/female)

Seow A, et al Int J Epi 1996
1930 1990

Singapore breast cancer incidence by age and birth cohort
Seow 1996
1908
1948

GoalsGoalsReview risk factors in context of natural
history/biology of the breast,
- focus on reproductive factors
- contribution of postmenopausal hormones Potential for prevention
- SERMS (Selective Estrogen Receptor Modulators)
- diet, activity, weight loss (or control), breast feeding
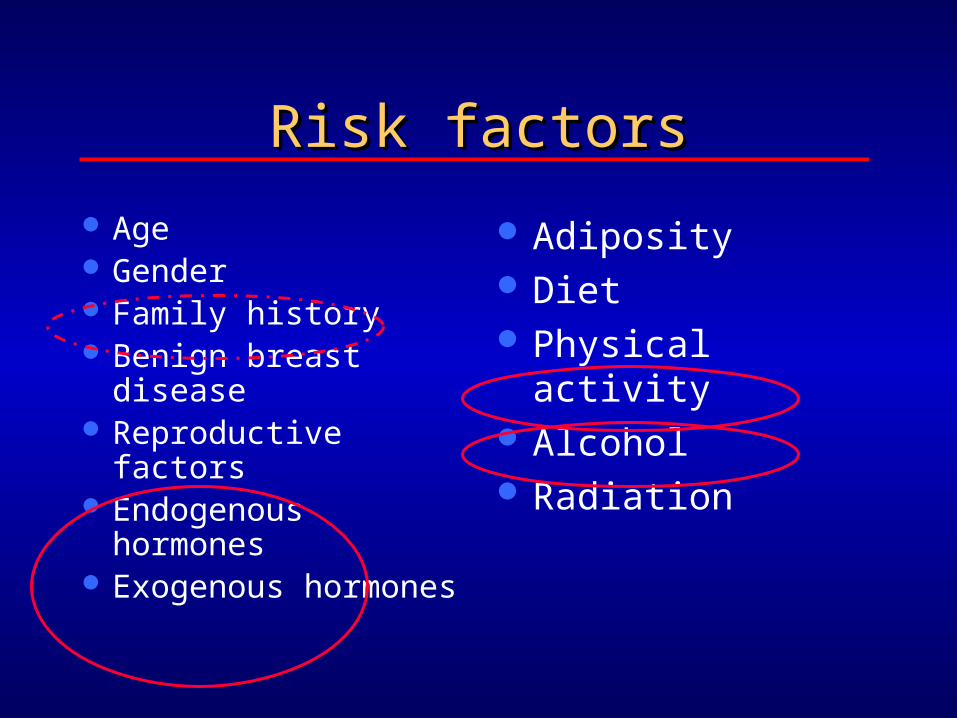
Risk factorsRisk factors
Age Gender Family history Benign breast
disease Reproductive factors Endogenous
hormones Exogenous hormones
Adiposity Diet Physical activity Alcohol Radiation

Models of disease incidenceModels of disease incidence
Can summarize risk factors and take account of temporal relations between risk factors and disease
Temporal relations often ignored in standard risk estimation and interpretation
Offers one approach to summarizing a range of etiologic pathways
- predict population or individual risk

Pike modelPike model
Factors associated with reduced risk of breast cancer were considered to lower the rate of breast tissue aging– Pike et. al., Nature 1983;303:767-70
We translated this to mean the rate of cell division and accumulation of molecular damage on the pathway to breast cancer

One Birth ModelOne Birth ModelR
ate
of t
issu
e ag
ing
Rat
e of
tis
sue
agin
g
Rosner, Colditz, Willett, Am J Epidemiology 1994;139:824
Menarche First birth Menopause Age

Extensions to modelingExtensions to modeling
Includes time from birth to menarche Allows the impact to the first birth to vary with
age at first birth Fits log incidence (Poisson regression) model
giving terms that are interpretable Contrast contribution of risk factors for
receptor positive and negative breast cancer

Multiple Birth ModelMultiple Birth Model
Rosner, Colditz, Willett, Am J Epidemiology 1994;139:826
Rat
e of
tis
sue
agin
g R
ate
of t
issu
e ag
ing

Application of models to NHSApplication of models to NHS
Observed that spacing of births was significantly related to reduced risk of breast cancer – the closer the births the lower the subsequent risk
A transient increase in risk was observed with first birth, but not subsequent births
Risk prediction and stratification now more accurate than Gail and other models
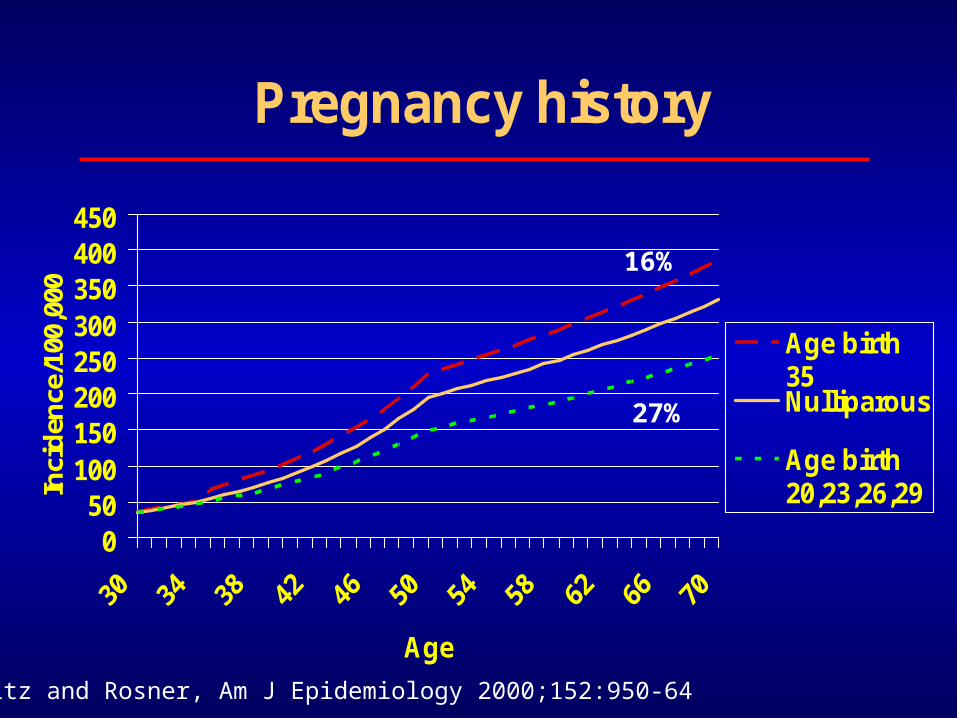
Pregnancy history
050
100150200250300350400450
Age
Inci
den
ce/1
00,0
00
Age birth35Nulliparous
Age birth20,23,26,29
Colditz and Rosner, Am J Epidemiology 2000;152:950-64
16%
27%

Age at menarcheAge at menarche
Later age - lower riskAge 15 vs age 11 gives 30% lower risk
to age 70Lack of physical activity associated with
earlier menarcheDiet may play a role as might fewer
childhood infections

Norway
Finland
Sweden

Impact of Menarche on Hormone Impact of Menarche on Hormone levelslevels
Singapore dataBreast cancer rates doubled144 post menopausal womenLate menarche (after 17) 24% lower
estradiol (circulating female hormone) than women with menarche before 17
Wu et al CEBP 2002

Age at menopause
0
50
100
150
200
250
300
350
400
30 35 40 45 50 55 60 65 70
Age
Inci
den
ce/1
00,0
00
Menopauseage 45
Menopauseage 55
Colditz and Rosner, Am J Epidemiology 2000;152:950-64
44%

MenopauseMenopause
Early menopause reduces riskHigh circulating hormones levels after
menopause increase risk, as does use of postmenopausal hormones
Anti-estrogens may have a role– who is target population– how are they identified, counseled, etc.– balance risks vs. benefits
Hormonal exposure after Hormonal exposure after menopausemenopause
Obesity is related to poor survivalTamoxifen reduces mortality among
women with breast cancerTamoxifen and Raloxifene reduce risk
of breast cancer in randomized controlled trials of breast cancer prevention

Risk of breast cancer by plasma estradiol levels: By tumor receptor status
0
1
2
3
4
5
6
1 2 3 4 1 2 3 4 1 2 3 4
ER+/PR+ ER-/PR- ER+/PR-
P for heterogeneity = < 0.001
Missmer et al, 2004 (case n = 152 ER+/PR+, 38 ER-/PR+, 33 ER-/PR-)

Body Mass Index and estrone Body Mass Index and estrone sulfatesulfate
0
50
100
150
200
250
<21 21-22.9 23-24.9 25-28.9 30+
Estrone sulfate
Hankinson et a, JNCI 1995;87:1297-1302l

Weight and weight gainWeight and weight gain
Adult weight gain increases risk of breast cancer
Relation seen most clearly among postmenopausal women who never have used hormones
20 kg gain from age 18 associated with doubling in risk of breast cancer vs. stable weight

Eliassen JAMA 2006

Schairer et alSchairer et al
BCDDP cohort followed 46,355 postmenopausal women
2082 cases of breast cancerRelative risk increased 0.01 (0.0002-
0.03) per year of use for estrogen aloneRR increased 0.08 (0.02-0.16) for E & PIncrease in RR stronger among women
with BMI < 24.4 kg/m2
JAMA 2000

Ross et al.Ross et al.
1879 postmenopausal cases and 1637 controls in LA county
Estrogen alone associated with RR 1.06 (0.97-1.15) for 5 years of use
E & P gave RR = 1.24 (1.07-1.45) per 5 years of use
Among E & P sequential therapy gave higher risk than continuous therapy
JNCI 2000

Women’s Health Initiative DesignWomen’s Health Initiative Design
A randomized controlled primary prevention trial
Planned duration 8.5 years16,608 postmenopausal women 50 – 79
years of age with intact uterus at baseline were recruited by 40 clinical centers in 1993-1998

InterventionIntervention
Conjugated equine estrogen 0.625 mg/d, plus medroxyprogesterone acetate, 2.5 mg/d, in 1 tablet (n=8506)
Placebo (n=8102)

Results at termination of trialResults at termination of trial
Mean duration of follow-up 5.2 years 290 cases of breast cancer Risk increased with duration of use (sig. trend
over time) Overall RR vs placebo = 1.26 (1.00-1.59) But, substantial noncompliance will bias results
to null:– 42% E&P and 38% placebo stopped study medication– RR in compliers = 1.49, p<0.001

International Agency for research on International Agency for research on Cancer (IARC)Cancer (IARC)
Classify agents as carcinogens after rigorous review of evidence, laboratory, animal, and human studies
Vol. 91 classifies combination estrogen plus progestin as carcinogenic to humans

Large drop in breast cancerLarge drop in breast cancer
US SEER (national tumor registry program) California state New Zealand Germany
US drop in prescribing Contribution of a decrease in screening has
been debated and ruled out as a cause for drop

Dispensed outpatient PMH Dispensed outpatient PMH prescriptionsprescriptions
Wysowski et al 200534.5M ’92 to high of 87.5M 2000

Clarke et al, CaliforniaClarke et al, California
Kaiser data on prescribing– 68% drop in E&P prescribing following release of WHI
results
10% drop in breast cancer incidence
For US women 50 to 69 (26 million women), this is 8,200 fewer cases of breast cancer, each year
J Clin Oncology Nov 2006

Further SEER analysisFurther SEER analysis
Jemal et al used state of art analysis (joint point analysis) to evaluate trends in breast cancer over time
1975 to 2003 – 394,891 invasive cancers Decrease in breast cancer largely confined to
ER+ tumors in the 2003 downturn Trend down strongest in women 55 to 64 In situ rates stable from 2000 to 2003 Rules out substantial screening impact
Jemal Breast Cancer Res May 2007
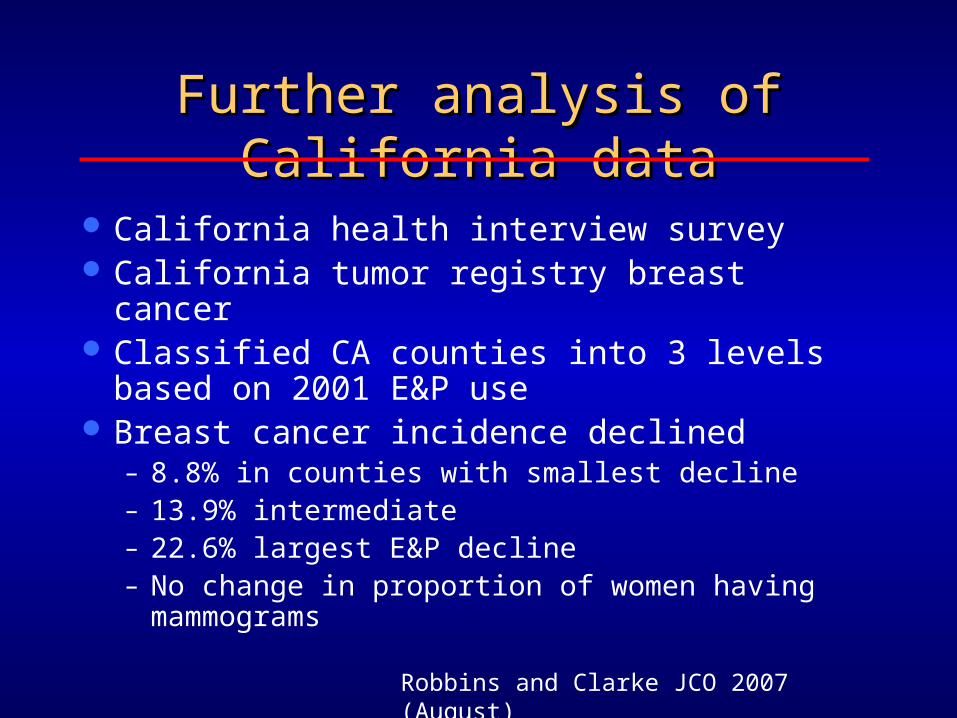
Further analysis of California dataFurther analysis of California data
California health interview survey California tumor registry breast cancer Classified CA counties into 3 levels based on
2001 E&P use Breast cancer incidence declined
– 8.8% in counties with smallest decline– 13.9% intermediate– 22.6% largest E&P decline– No change in proportion of women having
mammograms
Robbins and Clarke JCO 2007 (August)

Risk accumulationRisk accumulation
Overall evidence points to accumulation of risk through the life course
SERMs may offer some potential to inhibit final stages of progression to cancer - prevention greatest among those with high estrogen levels
Lifestyle contributes to cumulative riskNo one intervention for prevention

Physical activityPhysical activity
Evidence from more than 30 studiesTypical reduction in risk with 4 hours
per week = 20% decrease in riskEvidence present for pre and post-
menopausal women– Barriers to physical activity include
neighborhood safety, time and family responsibilities, social pressures

Cumulative rates of invasive and noninvasive Cumulative rates of invasive and noninvasive breast cancers occurring in participants breast cancers occurring in participants
receiving placebo or tamoxifen. The P value receiving placebo or tamoxifen. The P value are two-sidedare two-sided
Fisher et al, 1998; 90:1371-88Fisher et al, 1998; 90:1371-88

JAMA 1999, JNCI 2004


PreventabilityPreventability
International variation in ratesVariation in reproductive characteristicsGrowth and obesityPrimary prevention randomized trials

Social strategy to prevent breast Social strategy to prevent breast cancercancer
Provider– counseling on diet, activity, weight gain/loss– identify “higher risk” for preventive interventions
Balance risks and benefits
Regulation – facilitate lactation, physical activity, ?diet
Community– lactation, physical activity, access to care

Goals for PreventionGoals for Prevention
Reduce exposure to hormones after menopause– Avoid postmenopausal hormones– Weight loss– Anti estrogens for those at high enough
riskPromote increase in physical activityManage alcohol intake

No significant difference in No significant difference in adverse eventsadverse events
Placebo Raloxifene
Deaths 2.3% 1.7%
Thromboembolic disease
1.01% 1.72%
Endometrial cancer
0.39% 0.32%
Endometrial hyperplasia
0.29% 0.37%

Risk vs. benefit: who should get a Risk vs. benefit: who should get a SERMSERM
35.6M women 50 to 79 134,000 incident cases/yr Raloxifene would prevent 80,872 cases/yr Raloxifene would cause 67,649
thromboembolic events – Based on 19/10,000 per year treated
For benefit (reduced breast cancer) to exceed harm (thromboembolic events) incidence must be greater than 380/100,000

Age and risk decile for Age and risk decile for benefits to exceed risksbenefits to exceed risks
Age D4 D6 D8 D9 D10
50-4 185 233 302 357 504
55-9 246 309 401 474 668
60-4 278 349 453 536 756
65-9 339 425 552 654 921
Incidence per 100,000 women per year
50 to 64 year old population 5.1M eligible, 25%<65
Incidence based on Rosner/Colditz model

Incidence, Number Needed to Incidence, Number Needed to Treat (for 5 years) to prevent Treat (for 5 years) to prevent
1 cases (top decile)1 cases (top decile)Age Incidence NNT
50-4 504 79
55-9 668 60
60-4 756 53
65-9 921 43
Incidence per 100,000/yr.Assumes 50% reduction in Breast CA risk
Chen W, Rosner B, Colditz G. Cancer 2007

Next steps to prevention of Next steps to prevention of breast cancerbreast cancer
Refine assessment of risk– Stratify and provide appropriate counseling
Balance risk and benefits– Provide tools to aid weighing risks and benefits for
women
Implement population strategies to change behavior of providers, community, and even regulations to reinforce behavior changes (e.g., physical activity, weight control)
