breathing air quality, - department of environmental and
TRANSCRIPT
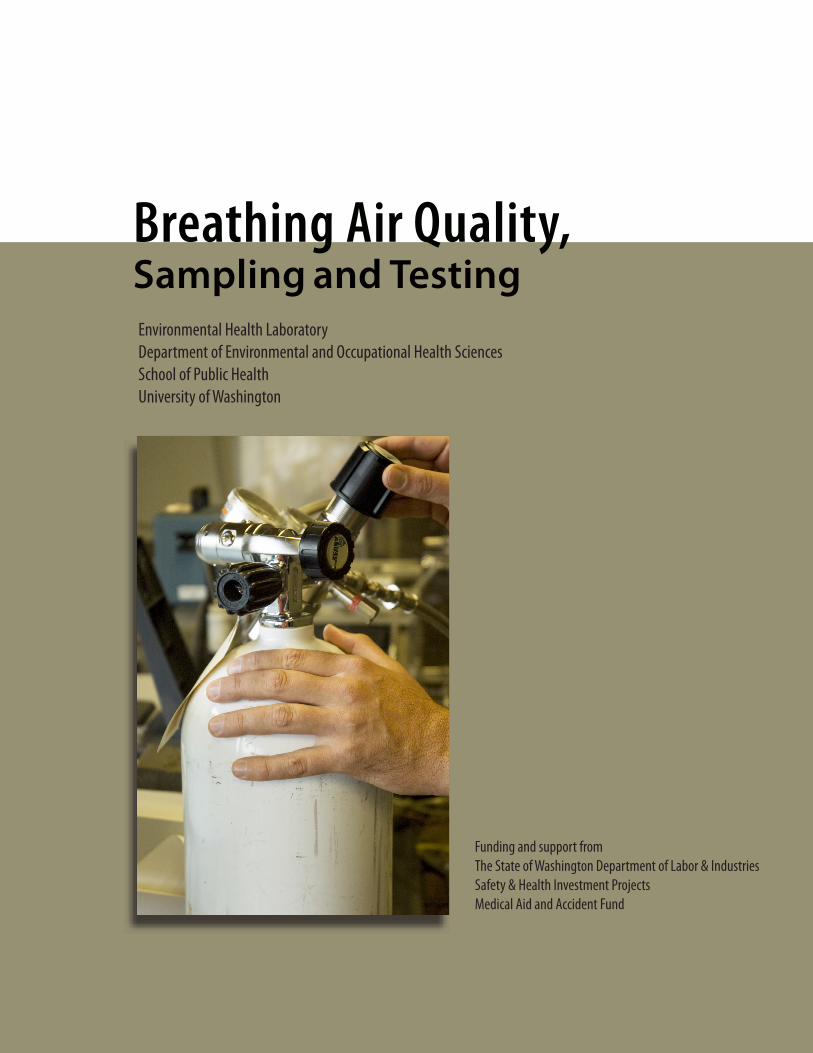
Breathing Air Quality,Sampling and Testing
Funding and support fromThe State of Washington Department of Labor & IndustriesSafety & Health Investment ProjectsMedical Aid and Accident Fund
Environmental Health LaboratoryDepartment of Environmental and Occupational Health SciencesSchool of Public HealthUniversity of Washington
1
Environmental Health Laboratory
Department of Environmental and Occupational Health Sciences
School of Public Health
University of Washington
Funding and support from
The State of Washington
Department of Labor & Industries
Safety & Health Investment Projects
Medical Aid and Accident Funds
Breathing Air Quality, Sampling, and Testing
2
University of Washington Environmental Health Laboratory
Table of ContentsOverview ...............................................................................1
Background ...........................................................................2
Regulated Components of Breathing Air ...............................4
Performance of Breathing Air Testing Kits ............................6
Laboratory Accreditation .....................................................14
Guidance Summary .............................................................15
References ...........................................................................16
List of TablesTable 1. Breathing Air Quality Specifications ........................3
Table 2. Typical Failure Rates for Air Quality Tests ................3
Table 3. Description of Kits Tested ........................................6
Table 4. Observations on Safety and Durability .....................7
Table 5. Tester’s Opinions on Kits .........................................7
Breathing Air Quality, Sampling, and Testing
1
OverviewIn response to queries on alternatives to high-pressure sampling of breathing
air and lack of independent information on the accuracy, functionality,
durability, and safety of commercially available breathing air quality assess-
ment kits, the Environmental Health Laboratory (EHL) at the University
of Washington evaluated six representative breathing air sampling kits.
Kits were tested in the laboratory and by personnel at three fire departments
and one commercial diving company.
2
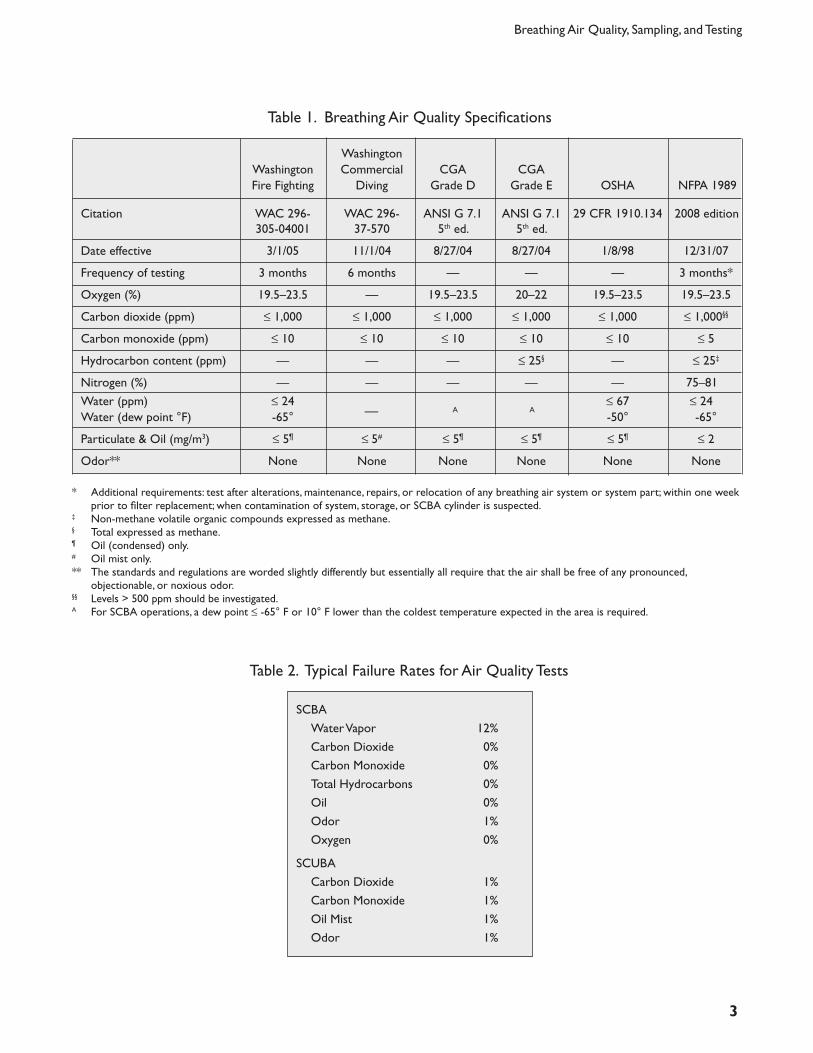
was typically described as stale. One percent of diving samples failed due to a pronounced odor. The odors were musty, vegetable, rubber, exhaust, and moldy. Thirty-three percent of the SCUBA samples had a slight odor. Air from compressors operating in marine or outdoor environments appears to have more odors than air from a dry, indoor fire department setting.
Why is water a problem in collecting a SCBA breathing air sample?Water is a “sticky” molecule and easily forms an invisible molecular film on surfaces. The absence of visible water does not mean the surface is dry enough to avoid contamination of a dry air sample. Thus, sample containers and fill lines must be thoroughly purged prior to sampling, regardless of appearance. Water has an affinity for surfaces unless they have been specially treated to make them water-repellent. More water is retained on rougher surfaces.
Sample container leaks are another possible source of water contamination. Given that room air contains around 30,000 ppm (3%) water, a small leak will alter a dry air sample with a water concentration of 10–30 ppm. Samples at low pressure are more affected by water contamination problems because at high pressures any water contamination from the container surface is in essence diluted.
BackgroundStatutes and codes for breathing air quality parameters are shown in Table 1. In Washington state, regulated components for commercial diving breathing air are listed in Washington Administrative Code (WAC) 296-37-570(2)(C), while those for firefighting breathing air are given in WAC 296-305-04001(21); some fire agencies choose to follow specifications in the more restrictive self-contained breathing apparatus (SCBA) Breathing Air Quality Specification in the National Fire Protection Code (NFPA).
Typical Problems in Breathing AirWhen the regulatory level of water in fire-fighting (SCBA) breathing air was lowered to 24 ppm in 1997, the number of breathing air quality failures due to excessive water vapor increased. Excessive water vapor continued to be the most frequent cause of failed testing for SCBA air (Table 2).
Combustion gases, carbon dioxide and carbon monoxide, each had a failure rate of 1% in self-contained underwater breathing apparatus (SCUBA) breathing air samples. Exhaust from nearby engines is likely the cause. Oxygen in submitted samples has only failed when elevated levels are present due to oxygen enrichment (Nitrox).
One percent of SCBA air samples tested failed due to a pronounced odor. Ten percent had a slight odor, which
Breathing Air Quality, Sampling, and Testing
3
Table 1. Breathing Air Quality Specifications
* Additional requirements: test after alterations, maintenance, repairs, or relocation of any breathing air system or system part; within one week prior to filter replacement; when contamination of system, storage, or SCBA cylinder is suspected.
‡ Non-methane volatile organic compounds expressed as methane.§ Total expressed as methane.¶ Oil (condensed) only. # Oil mist only.** The standards and regulations are worded slightly differently but essentially all require that the air shall be free of any pronounced,
objectionable, or noxious odor.§§ Levels > 500 ppm should be investigated.A For SCBA operations, a dew point ≤ -65° F or 10° F lower than the coldest temperature expected in the area is required.
Washington Washington Commercial CGA CGA Fire Fighting Diving Grade D Grade E OSHA NFPA 1989
Citation WAC 296- WAC 296- ANSI G 7.1 ANSI G 7.1 29 CFR 1910.134 2008 edition 305-04001 37-570 5th ed. 5th ed.
Date effective 3/1/05 11/1/04 8/27/04 8/27/04 1/8/98 12/31/07
Frequency of testing 3 months 6 months — — — 3 months*
Oxygen (%) 19.5–23.5 — 19.5–23.5 20–22 19.5–23.5 19.5–23.5
Carbon dioxide (ppm) ≤ 1,000 ≤ 1,000 ≤ 1,000 ≤ 1,000 ≤ 1,000 ≤ 1,000§§
Carbon monoxide (ppm) ≤ 10 ≤ 10 ≤ 10 ≤ 10 ≤ 10 ≤ 5
Hydrocarbon content (ppm) — — — ≤ 25§ — ≤ 25‡
Nitrogen (%) — — — — — 75–81
Water (ppm) ≤ 24 ≤ 67 ≤ 24Water (dew point °F) -65° -50° -65°
Particulate & Oil (mg/m3) ≤ 5¶ ≤ 5# ≤ 5¶ ≤ 5¶ ≤ 5¶ ≤ 2
Odor** None None None None None None
— A A
Table 2. Typical Failure Rates for Air Quality Tests
SCBA
Water Vapor 12%
Carbon Dioxide 0%
Carbon Monoxide 0%
Total Hydrocarbons 0%
Oil 0%
Odor 1%
Oxygen 0%
SCUBA
Carbon Dioxide 1%
Carbon Monoxide 1%
Oil Mist 1%
Odor 1%
University of Washington Environmental Health Laboratory
4
Oxygen (O2) is an odorless, colorless gas, essential for life, with an atmospheric concentration of 21% by volume. OSHA and NIOSH define an oxygen- deficient atmosphere as any atmosphere containing oxygen at a concentration below 19.5% at sea level, which includes a safety factor.1 At concentrations below 16%, decreased mental effectiveness, visual acuity, and muscular coordination occur. Below 10%, loss of consciousness may occur; below 6%, death results. Individuals exposed to low concentrations of oxygen are often unaware of the growing danger because only mild perceptional changes are initially experienced.
Oxygen toxicity may result from exposure to elevated concentrations of oxygen (> 50%) at normal pressures; delayed symptoms begin with inflammation of the upper airways and can progress to acute respira-tory distress syndrome.2 Hyperbaric oxygen exposure can lead to central nervous system toxicity in divers; symptoms can include visual disturbance, ear problems, dizziness, confusion, nausea, and seizures. Safety procedures have been developed for divers using high percentages of oxygen or hyperbaric oxygen.3, 4
There is also an increased danger of ignition and combustion at oxygen concentrations higher than atmospheric. Equipment for elevated oxygen levels must be rated for oxygen service and cleaned prior to initial use to remove combustible contamination.5, 6, 7 An air compressor may leave hydrocarbon residues, such as oil or grease, on internal components. Fire or explosion can occur if an elevated oxygen atmosphere, especially pressurized oxygen, comes in contact with these residues.8 Thus, oxygen service is not compatible with standard compressed air systems.
Carbon dioxide (CO2) is an odorless, tasteless gas produced by combustion and metabolism in cells. Atmospheric concentration is approximately 390 ppm. CO2 is a simple asphyxiant, with an OSHA permissible exposure limit of 5,000 ppm. Drowsiness may occur at 10,000 ppm; symptoms can progress to headaches, dizziness, restlessness, lack of sensation, labored
Regulated Components of Breathing Airbreathing, discomfort, increased heart rate, and even coma and death as the concentration increases.
In diving operations, CO2 retention (hypercapnia) is generally caused by excessive carbon dioxide in the breathing supply or inadequate lung ventilation in relation to exercise levels.9 Symptoms are listed above.
Carbon monoxide (CO) is a colorless, odorless, taste-less, and highly toxic gas produced by incomplete combustion of carbon or fuels. Normal atmospheric levels are around 0.1 ppm but will likely be higher in locations with combustion sources.
CO combines with hemoglobin in blood to form carboxyhemoglobin, which does not bind oxygen and thus diminishes the body’s ability to deliver oxygen to tissues. Symptoms include headache, nausea, vomiting, dizziness, fatigue, weakness, confusion, disorientation, visual disturbance, fainting, and seizures. Short duration exposure can lead to permanent neurological damage and death. Cardiac dysfunction, including arrhythmias, has often been reported in carbon monoxide poisoning.10
The OSHA permissible exposure limit to CO is 50 ppm, averaged over an eight-hour period. NFPA reduced its breathing air specification for carbon monoxide from 10 to 5 ppm in 2008. Carboxyhemoglobin will rise to 3.5% in individuals doing heavy work while breathing air with 5 ppm carbon monoxide. The American Conference of Governmental Industrial Hygienists (ACGIH) feels that this level of carboxyhemoglobin reflects a CO concentration to which nearly all workers may be repeatedly exposed without adverse health effects.
Hydrocarbon content is a catch-all term for volatile organic chemicals present in breathing air. (Methane, the simplest volatile organic compound, is the principal component of natural gas and is excluded in the NFPA definition of hydrocarbon content. Its concentration in the atmosphere is approximately 1–2 ppm.) The presence of volatile organic compounds indicates that something is wrong with breathing air production or storage. Besides being potentially toxic and flammable, the compounds can also deteriorate breathing air gear.
Breathing Air Quality, Sampling, and Testing
5
Nitrogen (N2) is an odorless, colorless, tasteless gas that makes up most of the earth’s atmosphere (78%). It is inert, nonflammable, and non-toxic. If the oxygen content of breathing air were reduced below 19.5%, say by blending in nitrogen, nitrogen would be consid-ered an asphyxiant. NFPA does not explain the reason for an acceptability range for nitrogen concentration. If breathing air is generated through compression of the atmosphere, oxygen and nitrogen ratios do not change.
Water (H2O) vapor saturation in the air changes with temperature; less water can be held in the air as the temperature decreases. The formation of dew or fog is an example of this phenomenon. The dew point is the temperature to which humid air must be cooled for water vapor to condense into water. A dew point temperature can also be expressed as a water vapor concentration; for SCBA breathing air, this is regulated at the ppm level.
While water vapor and liquid water are not directly harmful to users of breathing air, excessive amounts can cause hazards. Moisture can corrode breathing air systems and reduce the efficacy of gas purifiers. A greater hazard is ice blockage of regulators in cold temperature conditions, whether on land or during extreme cold
water diving. As gas expands from the breathing air tank, it cools. If the dew point is reached, moisture will condense and then freeze if the surrounding temperature is low, thus blocking the air supply.
Oil Mist is a generic term for an aerosol of oil such as that produced by a leaking compressor or contaminated fill line. Oil mist has an odor similar to burned lubricat-ing oil, with an odor threshold of 1 ppm. Oil mist is not a natural component of the atmosphere and is not formed by evaporation.
Chemical pneumonia, with initial symptoms of shortness of breath, decreased exercise tolerance, and respiratory distress, is a serious toxic response to inhaled oil mist and may continue to worsen after removal from exposure. Other effects include eye and skin irritation. The Occupational Safety and Health Administration (OSHA) permissible exposure limit is 5 mg/m3.
Particulate refers to any matter with size characteristics that allow collection by a filter during air testing. This would include oil mist. NFPA specifies that the filter re-tain particulate 0.3 micron and higher in size. Particles of 10 microns (0.0004") can penetrate deep into the lungs. Particulate may cause irritation of eyes, skin, throat, and upper respiratory system.
University of Washington Environmental Health Laboratory
6
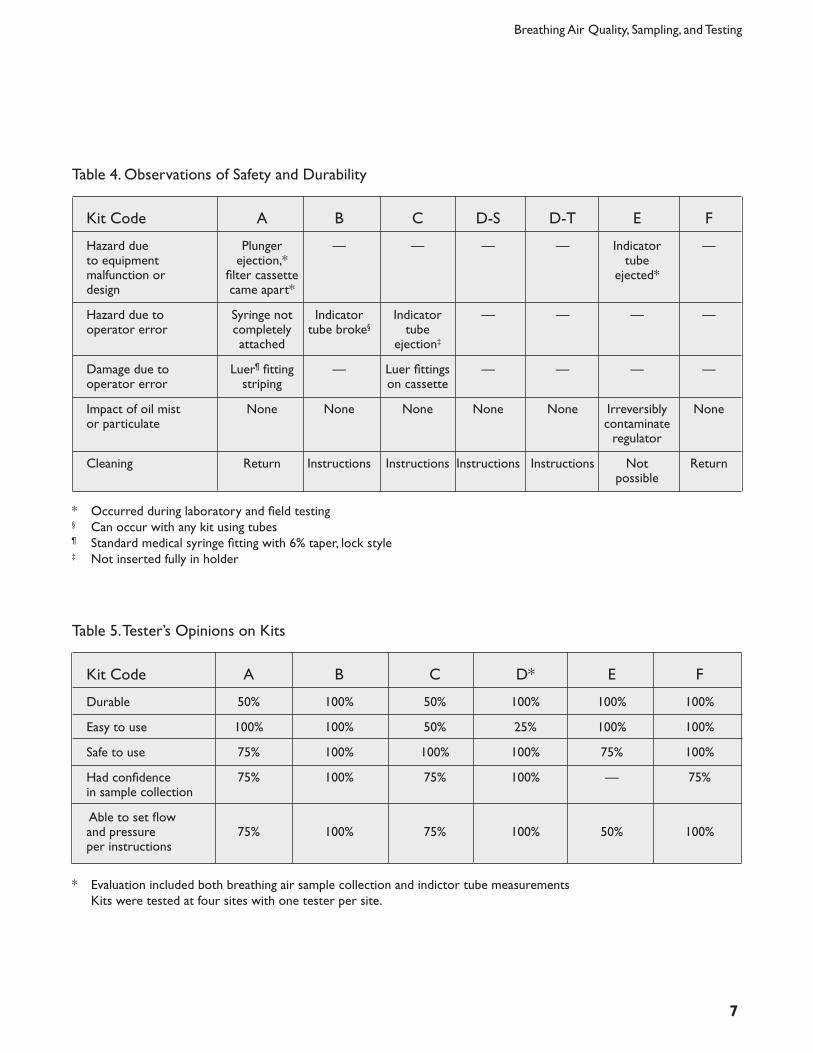
Evaluation of usabilityPotential hazards encountered during use in the labora-tory and at the compressor sites are presented in Table 4. Predictions on durability and operability after exposure to oil mist and particulate are also presented in Table 4.
Each kit was field tested by personnel at three fire departments and one commercial diving company. The most significant parameters evaluated are presented in Table 5.
Evaluation of sample collectionThe ability of the kits to collect uncompromised samples was evaluated, with the reference for comparison being a high pressure sample collected in a SCUBA bottle at the dive facility or SCBA bottles at fire departments. Samples were collected following kit instructions.
Carbon monoxide was not detected at any site, either in samples collected by kits or in the reference samples. Carbon dioxide and methane concentrations in kit
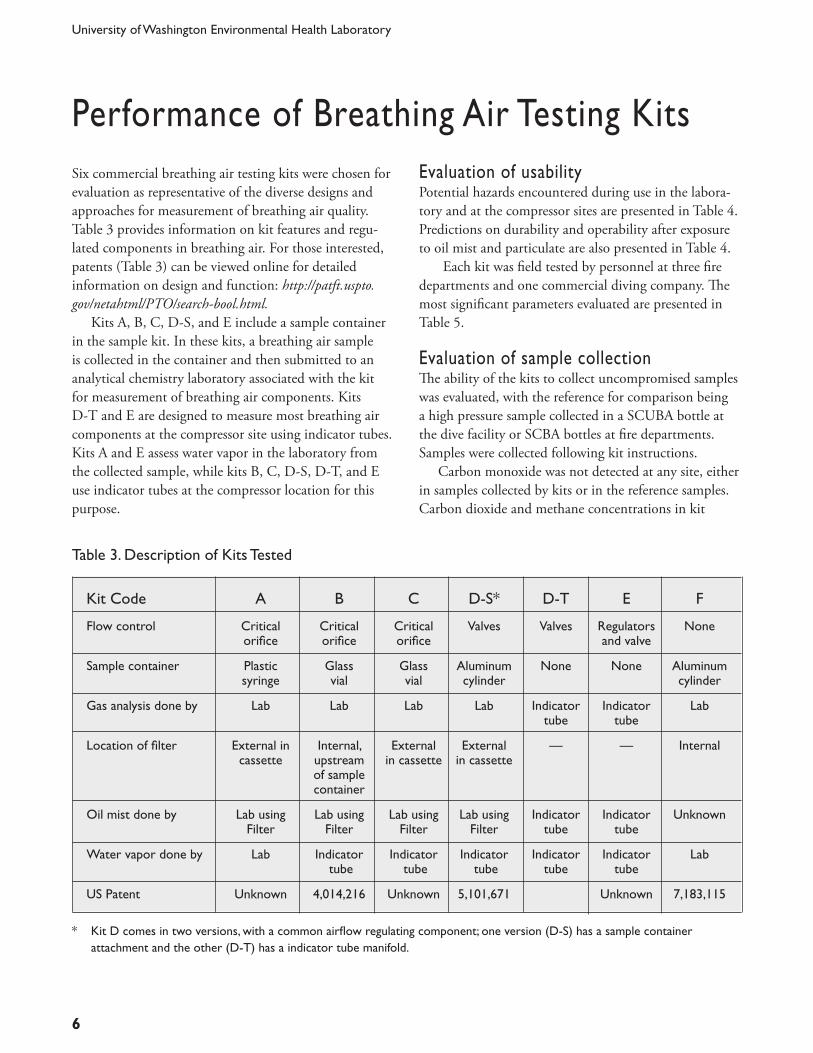
Six commercial breathing air testing kits were chosen for evaluation as representative of the diverse designs and approaches for measurement of breathing air quality. Table 3 provides information on kit features and regu-lated components in breathing air. For those interested, patents (Table 3) can be viewed online for detailed information on design and function: http://patft.uspto.gov/netahtml/PTO/search-bool.html.
Kits A, B, C, D-S, and E include a sample container in the sample kit. In these kits, a breathing air sample is collected in the container and then submitted to an analytical chemistry laboratory associated with the kit for measurement of breathing air components. Kits D-T and E are designed to measure most breathing air components at the compressor site using indicator tubes. Kits A and E assess water vapor in the laboratory from the collected sample, while kits B, C, D-S, D-T, and E use indicator tubes at the compressor location for this purpose.
Performance of Breathing Air Testing Kits
Table 3. Description of Kits Tested
Kit Code A B C D-S* D-T E F
Flow control Critical Critical Critical Valves Valves Regulators None orifice orifice orifice and valve
Sample container Plastic Glass Glass Aluminum None None Aluminum syringe vial vial cylinder cylinder
Gas analysis done by Lab Lab Lab Lab Indicator Indicator Lab tube tube
Location of filter External in Internal, External External — — Internal cassette upstream in cassette in cassette of sample container
Oil mist done by Lab using Lab using Lab using Lab using Indicator Indicator Unknown Filter Filter Filter Filter tube tube
Water vapor done by Lab Indicator Indicator Indicator Indicator Indicator Lab tube tube tube tube tube
US Patent Unknown 4,014,216 Unknown 5,101,671 Unknown 7,183,115
* Kit D comes in two versions, with a common airflow regulating component; one version (D-S) has a sample container attachment and the other (D-T) has a indicator tube manifold.
Breathing Air Quality, Sampling, and Testing
7
Table 4. Observations of Safety and Durability
Kit Code A B C D-S D-T E F
Hazard due Plunger — — — — Indicator — to equipment ejection,* tube malfunction or filter cassette ejected* design came apart*
Hazard due to Syringe not Indicator Indicator — — — — operator error completely tube broke§ tube attached ejection‡
Damage due to Luer¶ fitting — Luer fittings — — — — operator error striping on cassette
Impact of oil mist None None None None None Irreversibly None or particulate contaminate regulator
Cleaning Return Instructions Instructions Instructions Instructions Not Return possible
* Occurred during laboratory and field testing§ Can occur with any kit using tubes¶ Standard medical syringe fitting with 6% taper, lock style‡ Not inserted fully in holder
Table 5. Tester’s Opinions on Kits
Kit Code A B C D* E F
Durable 50% 100% 50% 100% 100% 100%
Easy to use 100% 100% 50% 25% 100% 100%
Safe to use 75% 100% 100% 100% 75% 100%
Had confidence 75% 100% 75% 100% — 75% in sample collection
Able to set flow and pressure 75% 100% 75% 100% 50% 100% per instructions
* Evaluation included both breathing air sample collection and indictor tube measurements Kits were tested at four sites with one tester per site.
University of Washington Environmental Health Laboratory
8
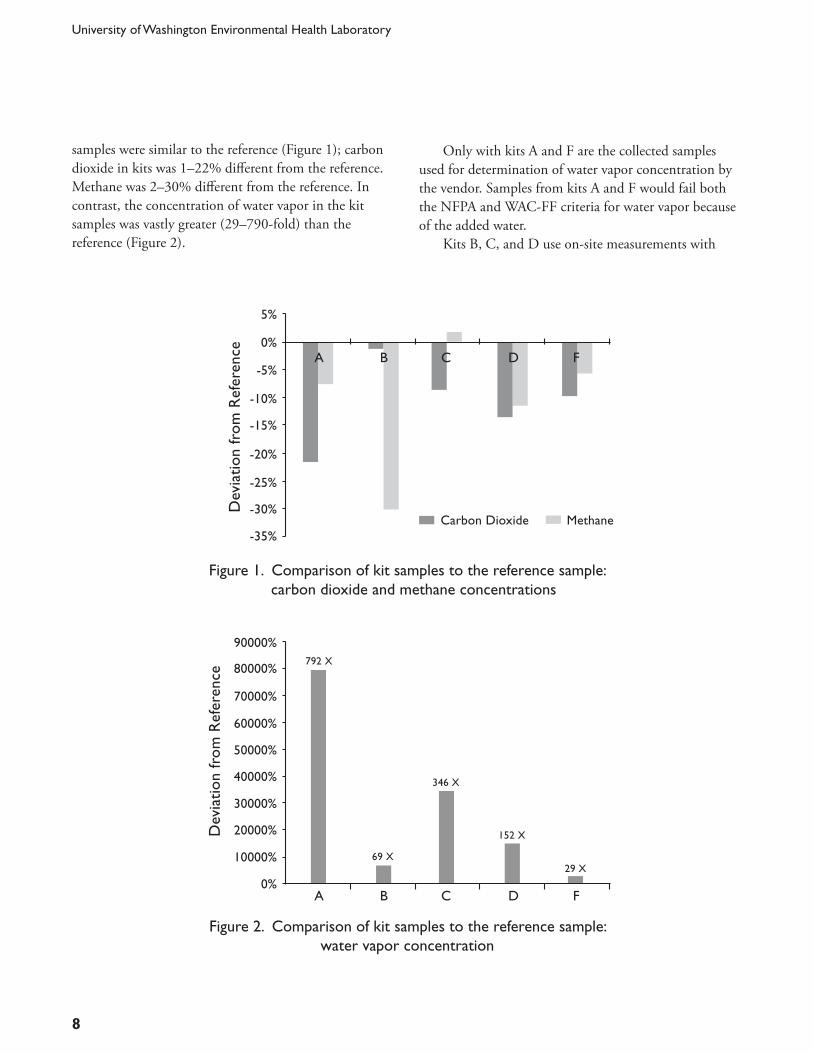
samples were similar to the reference (Figure 1); carbon dioxide in kits was 1–22% different from the reference. Methane was 2–30% different from the reference. In contrast, the concentration of water vapor in the kit samples was vastly greater (29–790-fold) than the reference (Figure 2).
Only with kits A and F are the collected samples used for determination of water vapor concentration by the vendor. Samples from kits A and F would fail both the NFPA and WAC-FF criteria for water vapor because of the added water.
Kits B, C, and D use on-site measurements with
Figure 1. Comparison of kit samples to the reference sample: carbon dioxide and methane concentrations
Dev
iati
on fr
om R
efer
ence
-15%
-30%
-20%
-25%
-35%Carbon Dioxide Methane
0%
5%
-5%
-10%
A B C D F
Figure 2. Comparison of kit samples to the reference sample: water vapor concentration
Dev
iati
on fr
om R
efer
ence
50000%
20000%
40000%
30000%
10000%
80000%
90000%
70000%
60000%
A B C D F0%
792 X
69 X
346 X
152 X
29 X
Breathing Air Quality, Sampling, and Testing
9
indicator tubes for water vapor, and their vendors do not claim that the kits can successfully collect an air sample for water vapor—nor do they offer this analysis. We examined these kits to gather data on suitability of materials and approaches for collection of air samples for water vapor analysis. Analysis of air samples from all kits with containers supports the assertion that low pressure sampling for water vapor is problematic regardless of the container material.
Comparison of laboratory testing resultsFor those kits designed to collect breathing air samples for laboratory analysis, different gas mixtures of know composition were sampled according to vendors’ instruc-tions and then submitted to the laboratory associated with the kit. Samples were submitted blind, with coded identities so that the contents were not distinguishable by the laboratories before analysis. Samples were submit-ted for testing to NFPA or Compressed Gas Association (CGA) E standards.
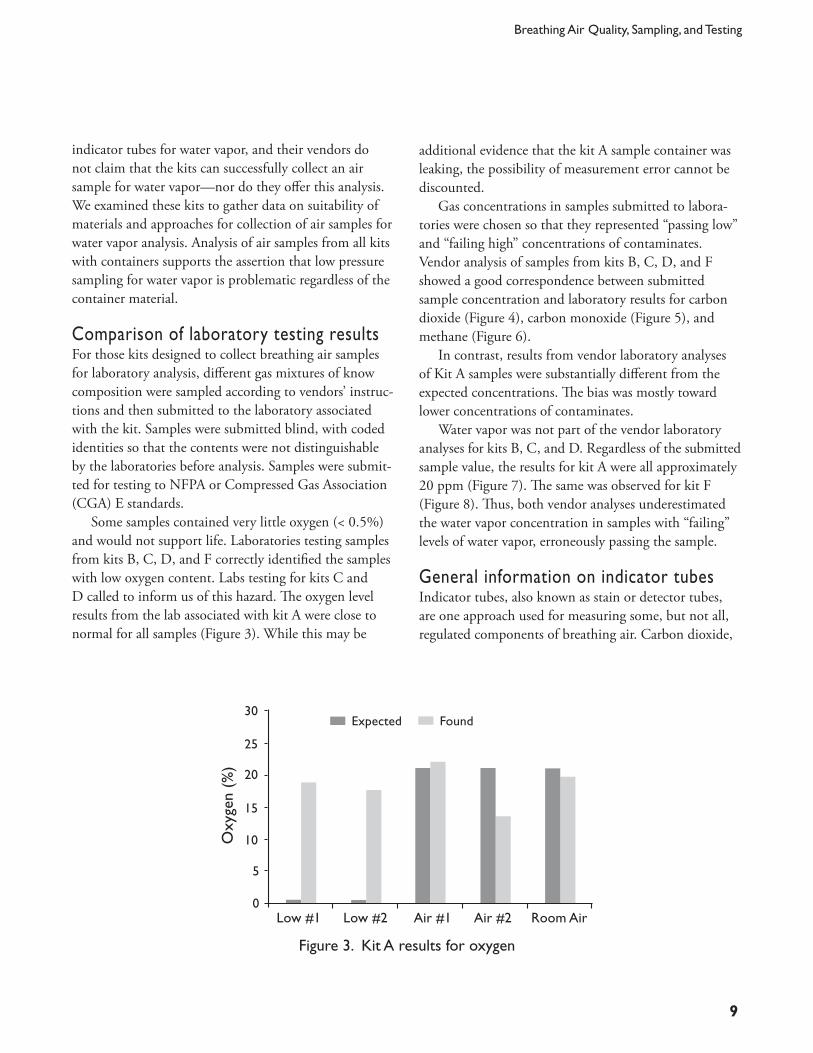
Some samples contained very little oxygen (< 0.5%) and would not support life. Laboratories testing samples from kits B, C, D, and F correctly identified the samples with low oxygen content. Labs testing for kits C and D called to inform us of this hazard. The oxygen level results from the lab associated with kit A were close to normal for all samples (Figure 3). While this may be
additional evidence that the kit A sample container was leaking, the possibility of measurement error cannot be discounted.
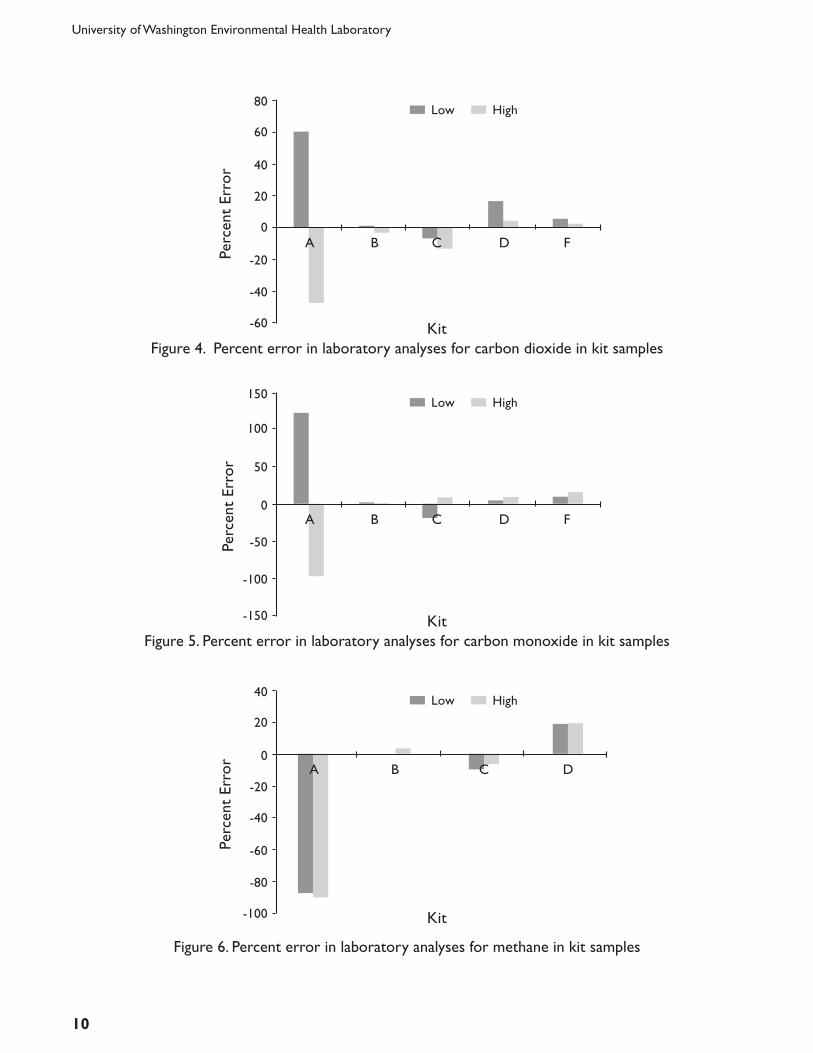
Gas concentrations in samples submitted to labora-tories were chosen so that they represented “passing low” and “failing high” concentrations of contaminates. Vendor analysis of samples from kits B, C, D, and F showed a good correspondence between submitted sample concentration and laboratory results for carbon dioxide (Figure 4), carbon monoxide (Figure 5), and methane (Figure 6).
In contrast, results from vendor laboratory analyses of Kit A samples were substantially different from the expected concentrations. The bias was mostly toward lower concentrations of contaminates.
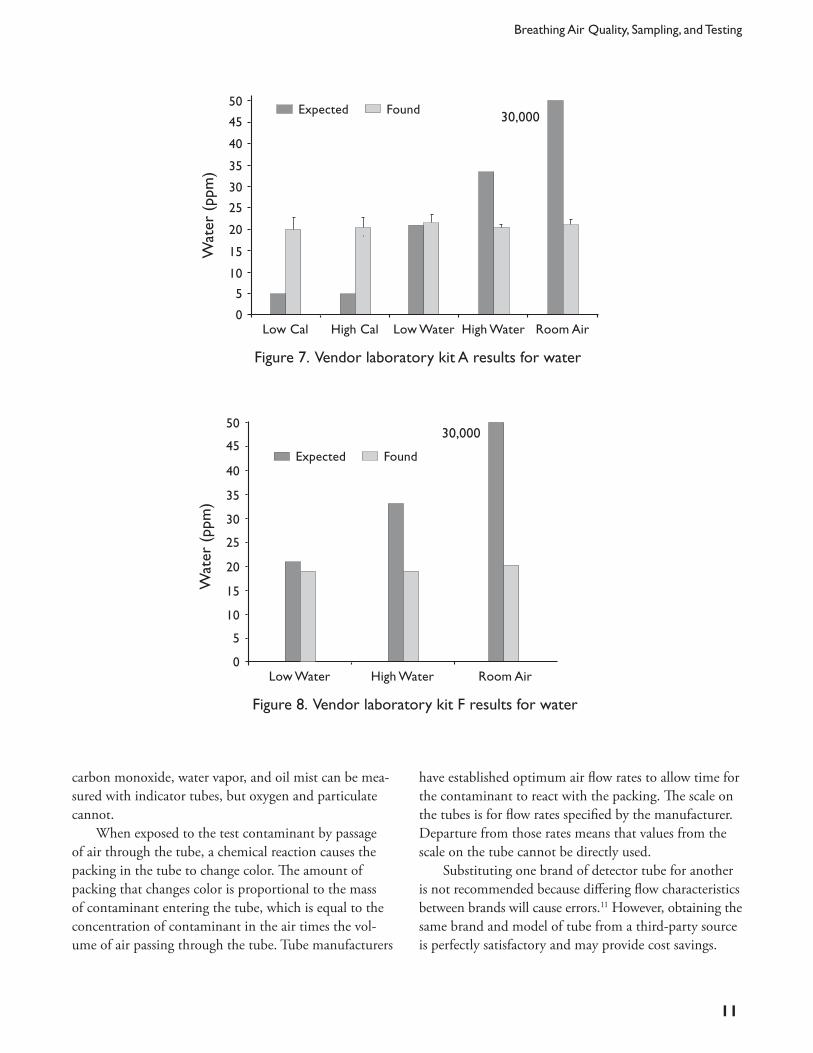
Water vapor was not part of the vendor laboratory analyses for kits B, C, and D. Regardless of the submitted sample value, the results for kit A were all approximately 20 ppm (Figure 7). The same was observed for kit F (Figure 8). Thus, both vendor analyses underestimated the water vapor concentration in samples with “failing” levels of water vapor, erroneously passing the sample.
General information on indicator tubesIndicator tubes, also known as stain or detector tubes, are one approach used for measuring some, but not all, regulated components of breathing air. Carbon dioxide,
Figure 3. Kit A results for oxygen
Oxy
gen
(%)
25
10
20
15
5
30
Low #1 Low #2 Air #10
Expected Found
Air #2 Room Air
University of Washington Environmental Health Laboratory
10
A B C D F
Figure 4. Percent error in laboratory analyses for carbon dioxide in kit samples
Perc
ent
Erro
r0
-40
-20
-60
Low High
60
80
40
20
Kit
Figure 5. Percent error in laboratory analyses for carbon monoxide in kit samples
A B C D F
Perc
ent
Erro
r
0
-100
-50
-150
Low High
100
150
50
Kit
Figure 6. Percent error in laboratory analyses for methane in kit samples
A B C D
Perc
ent
Erro
r
-40
-80
-60
-100
Low High
20
40
0
-20
Kit
Breathing Air Quality, Sampling, and Testing
11
carbon monoxide, water vapor, and oil mist can be mea-sured with indicator tubes, but oxygen and particulate cannot.
When exposed to the test contaminant by passage of air through the tube, a chemical reaction causes the packing in the tube to change color. The amount of packing that changes color is proportional to the mass of contaminant entering the tube, which is equal to the concentration of contaminant in the air times the vol-ume of air passing through the tube. Tube manufacturers
have established optimum air flow rates to allow time for the contaminant to react with the packing. The scale on the tubes is for flow rates specified by the manufacturer. Departure from those rates means that values from the scale on the tube cannot be directly used.
Substituting one brand of detector tube for another is not recommended because differing flow characteristics between brands will cause errors.11 However, obtaining the same brand and model of tube from a third-party source is perfectly satisfactory and may provide cost savings.
Figure 7. Vendor laboratory kit A results for water
25W
ater
(pp
m)
0
10
20
15
5
Low Cal
Expected Found
High Cal Low Water High Water Room Air
45
50
40
35
Figure 8. Vendor laboratory kit F results for water
25
Wat
er (
ppm
)
30
0
10
20
15
5
Low Water
Expected Found
High Water Room Air
45
50
40
35
30,000
30,000
30
University of Washington Environmental Health Laboratory
12
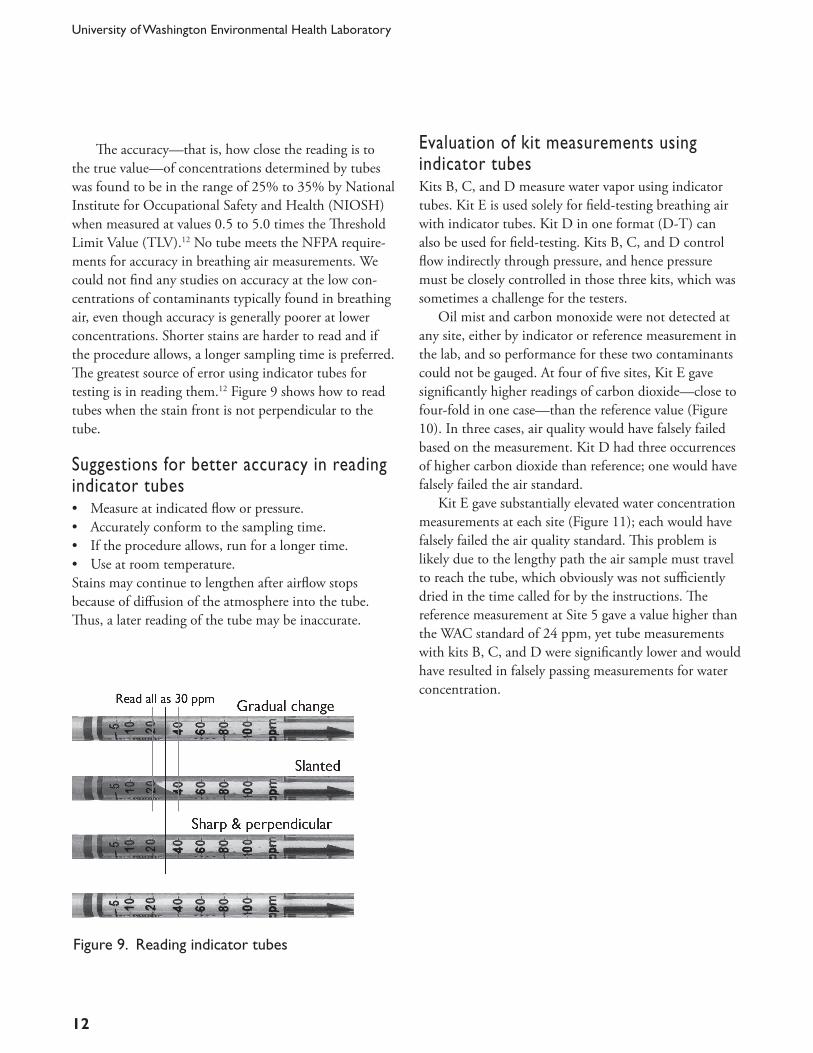
The accuracy—that is, how close the reading is to the true value—of concentrations determined by tubes was found to be in the range of 25% to 35% by National Institute for Occupational Safety and Health (NIOSH) when measured at values 0.5 to 5.0 times the Threshold Limit Value (TLV).12 No tube meets the NFPA require-ments for accuracy in breathing air measurements. We could not find any studies on accuracy at the low con-centrations of contaminants typically found in breathing air, even though accuracy is generally poorer at lower concentrations. Shorter stains are harder to read and if the procedure allows, a longer sampling time is preferred. The greatest source of error using indicator tubes for testing is in reading them.12 Figure 9 shows how to read tubes when the stain front is not perpendicular to the tube.
Suggestions for better accuracy in reading indicator tubes• Measureatindicatedfloworpressure.• Accuratelyconformtothesamplingtime. • Iftheprocedureallows,runforalongertime. • Useatroomtemperature.Stains may continue to lengthen after airflow stops because of diffusion of the atmosphere into the tube. Thus, a later reading of the tube may be inaccurate.
Evaluation of kit measurements using indicator tubesKits B, C, and D measure water vapor using indicator tubes. Kit E is used solely for field-testing breathing air with indicator tubes. Kit D in one format (D-T) can also be used for field-testing. Kits B, C, and D control flow indirectly through pressure, and hence pressure must be closely controlled in those three kits, which was sometimes a challenge for the testers.
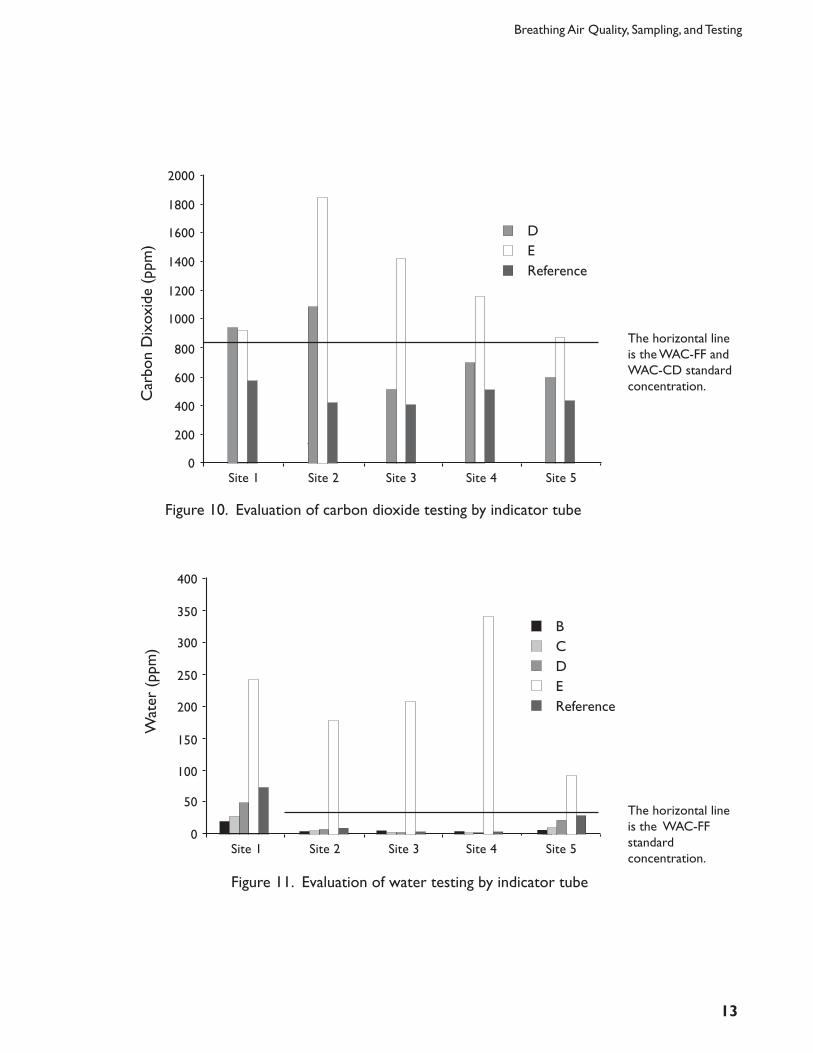
Oil mist and carbon monoxide were not detected at any site, either by indicator or reference measurement in the lab, and so performance for these two contaminants could not be gauged. At four of five sites, Kit E gave significantly higher readings of carbon dioxide—close to four-fold in one case—than the reference value (Figure 10). In three cases, air quality would have falsely failed based on the measurement. Kit D had three occurrences of higher carbon dioxide than reference; one would have falsely failed the air standard.
Kit E gave substantially elevated water concentration measurements at each site (Figure 11); each would have falsely failed the air quality standard. This problem is likely due to the lengthy path the air sample must travel to reach the tube, which obviously was not sufficiently dried in the time called for by the instructions. The reference measurement at Site 5 gave a value higher than the WAC standard of 24 ppm, yet tube measurements with kits B, C, and D were significantly lower and would have resulted in falsely passing measurements for water concentration.
Figure 9. Reading indicator tubes
Breathing Air Quality, Sampling, and Testing
13
Figure 11. Evaluation of water testing by indicator tube
Figure 10. Evaluation of carbon dioxide testing by indicator tube
The horizontal line is the WAC-FF and WAC-CD standard concentration.
Car
bon
Dix
oxid
e (p
pm)
2000
1400
1200
0
400
Site 1
200
Site 2 Site 3 Site 4 Site 5
D EReference
1800
1600
800
600
1000
The horizontal line is the WAC-FF standard concentration.
Wat
er (
ppm
) 300
250
200
0
150
100
Site 1
50
Site 2 Site 3 Site 4 Site 5
B C D E Reference
400
350
University of Washington Environmental Health Laboratory
14
You can greatly increase the likelihood of accurate results by using a laboratory that is specifically accredited for the analysis being performed. In the accreditation process, inspectors from an accreditation organization evalu-ate the laboratory for competence using the following criteria:13
• Technicalcompetencyofstaff• Validityandappropriatenessofthemethods• Traceabilityofchemicalstandards• Appropriateapplicationofmeasurementuncertainty• Suitability,calibration,andmaintenanceoftest
equipment • Testingenvironment• Sampling,handling,andtransportationoftestitems• Qualityassuranceoftests
Advantages in using an accredited laboratory include:
• Minimizingtheriskofunknowinglyusingbadairfrom false passes
• Avoidinglosttimeandmoneyduetofalsefailures• Havingproperdocumentationforsiteinspections• ComplyingwithNFPAguidelines,whichrequire
the use of a lab accredited to ISO/IEC 17025 standards.
One important method of evaluating technical competency is proficiency testing of independently created samples at regular intervals. The Compressed Air Proficiency Testing (CAPT) program specifically evaluates a lab’s proficiency in testing breathing air samples and to our knowledge is the only program in the United States to do so. The CAPT program is administered by volunteer labs and is endorsed by the American Industrial Hygiene Assocation (AIHA). Details on the program can be found on the AIHA website.14 A lab does not have to be accredited to participate in the CAPT program.
The main standard used by testing and calibration laboratories is ISO/IEC 17025, which incorporates the ISO 9001 quality management system. Accreditation bodies that use these standards check the laboratory for conformity to the standards. Accredited laboratories usually issue test reports bearing a symbol or endorse-ment indicating their accreditation. You should also check with the laboratory on specific tests or measure-ments for which they have accreditation.
Laboratory Accreditation
Breathing Air Quality, Sampling, and Testing
15
Selection of laboratories and kits• UsealabaccreditedthroughISO/IEC17025
standardization.• Usealabcertifiedforanalyticalmethodsemployed
in their breathing air analyses.• Usealabwithdemonstratedproficiencyinthe
CAPT program.• Avoidkitsbasedonasyringesamplingsystem.• Avoidkitsthathaveapressureregulatorasa
component; pressure gauges are acceptable.
Collection and measurement of breathing air samples for water• Tryfurtherpurgingoffilllinesandsamplerwhen
water is out of specification.• Notethatlaboratoryanalysisofhigh-pressure
samples is superior to any indicator tube measurement.
• Notethattheuseofindicatortubesisacceptable for regulatory (OSHA and Division of Occupational Safety and Health [DOSH]) purposes but does not meet NFPA requirements for accuracy or sensitivity.
• Wecannotrecommendanylowpressure(<500psi)sample container for use with water vapor measure-ments.
Indicator tube measurements• Followtimeandflowrequirementsexactly.• Usealongerdurationfortubeexposureifthisis
an option.• Followinstructionsonreadingthestainontubes.• Notethatyour reading of the tube determines the
concentration, not the laboratory’s.
Recurrent problems for breathing air• Firefighting:water• Diving:carbonmonoxideandodor
Prevention of problems• SeeguidanceinWAC296-842-20010.• SeeguidanceinWAC296-842-20015.• Changepurifiersaccordingtomanufacturer
schedule.
• Useashorterreplacementcycleforpurifierswhenpre-maintenance samples (a NFPA requirement) regularly fail or when the air source is impure and the contamination is not due to compressor malfunction.
• Positionexhaustawayfromordownwindof compressor intake and fill point.
• Consideroil-lesscompressorswhenreplacing equipment.
• Monitoroillevelandcompressortemperature; overheating can form carbon monoxide.
• Maintaincalibrationoncarbonmonoxidealarm as required.15
• Keepfilllinesclean;dirtylinesareasourceof particulate and oil.
• Keepcompressorsclean.• Don’toverfilloilcompressors.
Troubleshooting suggestionsOil mist• Keepfilllinesclean;dirtylinesareasourceof
particulate and oil.• Repairoilleaks.• Replaceandmaintainoilseparationelementand
filters as scheduled by manufacturer.
High CO and CO2 levels
• Isolateintakeorsamplepointfromcombustionsource.
• Replacefailedpurifiers.
High CO levels• Checkforoverheatingofcompressor.• Replacefailedpurifiers.• Checkoillevel(levelsthataretoohighortoo
low cause problems).
High water vapor levels• Increasepurgetimeoffilllines.• Increasepurgetimeofsamplecontainerorkit.• Checkcondensatetraps.• Replacefailedorundersizedcompressedair
dryer.
Guidance Summary
University of Washington Environmental Health Laboratory
16
1. NIOSH Respirator Selection Logic 2004, NIOSH Publica-tion No. 2005-100, Chapter V, Additional Information on Hazards and Exposures. Available at http://www.cdc.gov/niosh/docs/2005-100/chapter5.html#chapt5sub1.
2. Clark JM, Lambertsen CJ. Pulmonary oxygen toxicity: a review. Pharmacological Reviews. 1971;23(2):37–133.
3. Lang MA (ed.). (2001). DAN Nitrox workshop proceed-ings. Durham, NC: Divers Alert Network. http://si-pddr.si.edu/dspace/handle/10088/2721.
4. PADI Enriched Air Diver Course. http://www.padi.com/scubal.
5. NAVSEA. (2005). Cleaning And Gas Analysis For Diving Applications Handbook. NAVSEA Technical Manual SS521-AK-HBK-010. Available at http://www.scribd.com/doc/7421367/NAVSEA-SS521AKHBKO10.
6. 49 CFR173.302(b); 29 CFR1910.134(i)(3).
7. CGA Pamphlet 4.4. Cleaning Equipment for Oxygen Service. 09/22/09. Available at http://www.asiaiga.org/docs/AIGA%20012_04_Cleaning%20of%20Equipment%20for%20Ocyge%20Service.pdf.
8. WAC 296-842-20010
9. U.S. Navy Diving Manual, Naval Sea Systems Command, SS521-AG-PRO-010, Revision 6, 4/2008.
10. Gandini C, Castoldi AF, Candura SM, Locatelli C, Butera R, Priori S, Manzo L. Carbon monoxide cardiotoxicity. Journal of Toxicology-Clinical Toxicology. 2001;39(1):35–44.
11. Colen FH. A Study of the Interchangeability of Gas Detector Tubes and Pumps. American Industrial Hygiene Association Journal. 1974;35:11, 686– 694 .
12. Harper M. Performance Evaluation of On-Site Colori-metric Air Sampling Techniques. Applied Occupational and Environmental Hygiene. 2001;16(12):1092–1096.
13. Why Use An Accredited Laboratory? ILAC 2001. PDF available at www.ilac.org/documents/Bro_english/Why_use_an_acc_lab.pdf.
14. PDF available at admin.aihaaccreditedlabs.org/PolicyMod-ules/Documents/AppendixE_CAPT%20Protocol_R5(AE)_Final_2007_01_02.pdf .
15. WAC 296-37-570; 29 CFR 1910.134(i)(7)
References
School of Public Health
ENVIRONMENTAL AND OCCUPATIONAL HEALTH SCIENCESUNIVERSITY of WASHINGTON
Environmental Health Laboratory1959 NE Paci!c StreetBox 357234Seattle, WA 98195Ph: (206) 543-4253 Fax: (206) 543-9616email: [email protected]