brian vinci-presentation-of-an-economic-model-comparing-open-net-and-land-based-aquaculture1
TRANSCRIPT

1
Brian Vinci, Steven Summerfelt The Conservation Fund Freshwater Institute USA Trond W. Rosten, Kristian Henriksen, Erik Skontorp Hognes SINTEF Fisheries and Aquaculture Norway
Basic Economics of Land-Based Water Recirculating Aquaculture Systems

• Basic Economic Elements of Land-Based RAS • Capital Expense (CAPEX) • Operating Expense (OPEX) • Working Capital
• Comparison of Land-Based RAS and Net-Pen Salmon Production Models • Capital Expense • Biological Production Model • Production Cost • Cash Flow • Net Present Value
2
Outline

3
Capital Expenses for Land-Based RAS (CAPEX)
• Land • Rearing Tanks • Buildings • RAS Equipment Package • Water Supply System • Feeding System • Backup Generator System • Monitoring and Control System • Effluent Treatment/Solids Management • Processing Facility

4
Operating Expenses for Land-Based RAS (OPEX)
$1.96 49%
$0.33 8%
$0.16 4%
$0.48 12%
$0.15 4%
$0.11 3%
$0.59 15%
$0.12 3%
$0.09 2%
Feed
Electric
Oxygen
Labor
Management
Processing
Depr & Maint
Eggs
BicarbUS $ per kg salmon produced (HOG)

5
Working Capital Requirement
• The business requires enough upfront cash reserve to cover the expenses throughout the initial production cycle until the first harvest generates sales revenue • Atlantic Salmon – 24 months • Rainbow Trout/Steelhead – 12 months • Tilapia – 6 months
6
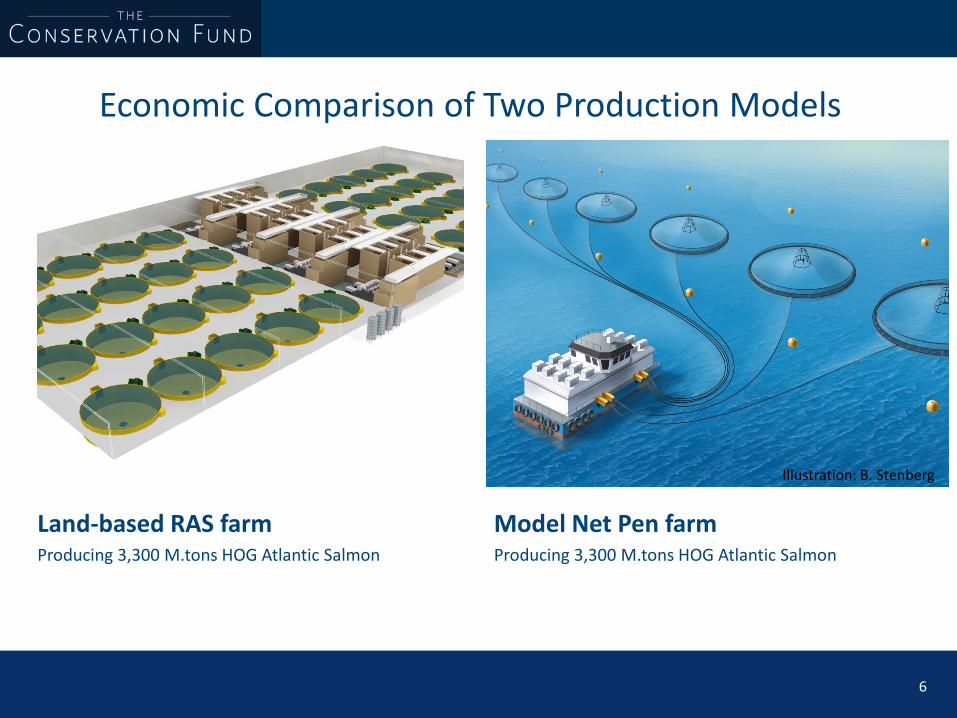
Land-based RAS farm Producing 3,300 M.tons HOG Atlantic Salmon
Model Net Pen farm Producing 3,300 M.tons HOG Atlantic Salmon
Illustration: B. Stenberg
Economic Comparison of Two Production Models

Model Land-based RAS farm (32 million US $ ) One production site
Invested equipment: • 40,000 m3 of rearing tank volume • 25,500 m2 of building area • 2,500 m2 processing facility • 885 m3/min of pumped RAS flow
• Pumps and Piping • Screen filters • Biofilters • Gas Conditioning Filters
• 1.08 – 1.26 kg feed per m3 supply water • Feeding Systems • Backup Generators
Investments in total: 32 M US $ - approximately 192 MNOK Maintenance and reinvestments set equal to the depreciations
7
Capital Expense
Model Net Pen farm (12.3 million US $): Two production sites, each with six net pen cages. • ≈587,000 m3 net-volume • 120,000 m2 area footprint visible at sea
• ≈179,000 m2 area footprint incl. no thoroughfare zone • ≈463,000 m2 area footprint incl. no fishing zone
Invested equipment: • 3 licences • 12 Floating rings (157m Ø) • 24 nets (25 m deep) • 2 mooring systems • 2 boats • 2 feed barges (150 Mtons) • 12 camera systems • 12 feed distributors • 12 power systems Investments in total: 72.9 MNOK – approximately 12.3 M US $ Maintenance and reinvestments set equal to the depreciations

Model Land-based RAS farm • One production site for all life-stages • Four cohorts per year
• Growth based on thermal growth coefficients from Freshwater
Institute growout trials, adjusted down by 10%: • 1.1 for Fry • 1.25 for Smolt • 1.8 for Pre-growout • 2.2 for Growout
• Mortality per generation 16%
• Feed conversion ratios:
• 0.75 for Fry • 0.90 for Smolt • 1.0 for Pre-Growout • 1.1 for Growout
• Overall Feed to Whole Fish Produced (kg/kg): 1.09
8
Biological Production
Model Net Pen farm: • 2 production sites & 3 licences of 780 M.tons of maximum
total biomass at sea. • Two transfers of smolts to sea annually, to one site
– S1 at 1st of April, 100 grams, 520' smolts in three cages
– S0 at 1st of August, 75 grams, 520' smolts in three cages
• Growth based on the Skretting table, Specific Growth Rate
(SGR), adjusted down by 12 %. • Mortality per generation approximately 16.1 % (average in
Mid-Norway in 2011) (Norwegian Food Safety Authority 2011).
• Economic feed conversion ratio: 1.27 (average in Norway over
the last ten years) (Directorate of Fisheries 2013).

Model Land-based RAS farm • Rearing Density
• 80 kg/m3 maximum • Harvesting:
– Time from first feeding to first harvest: 21 months – Harvest every week of the year
– Each cohort harvested over 13 weeks – One grisle harvest at ~1.2 kg for 50% of males
– Harvest in total: 3,947 M.tons LWE; 3,300 M.tons HOG (5 % purge loss / 12 % HOG loss)
– Initial harvest weight (whole fish): 4.5 kg – Average harvest weight (whole fish): 5.1 kg
• No downtime in the bioplan
9
Biological Production
Model Net Pen farm: • Rearing Density
• 25 kg/m3 maximum • Harvesting:
– Time from first feeding to first harvest: 24–31 months – Time at sea before first harvest: 16 months – Harvest 8 months of the year
– Harvest S1 from July to October – Harvest S0 from November to February
– Harvest in total: 3,975 M.tons LWE; 3,299 M.tons HOG (5 % purge loss /12 % HOG loss)
– Average harvest weight (whole fish) : 4.5 kg
• Two months of fallowing between production cycles

10
0
500,000
1,000,000
1,500,000
2,000,000
2,500,000
jan apr jul okt jan apr jul okt jan apr jul okt jan apr jul okt
2013 2014 2015 2016
Biom
ass i
n kg
Year - Month
Model Net Pen farm Model Land-based RAS farm
-
500,000
1,000,000
1,500,000
2,000,000
2,500,000
Jan-
13
Apr-
13
Jul-1
3
Oct
-13
Jan-
14
Apr-
14
Jul-1
4
Oct
-14
Jan-
15
Apr-
15
Jul-1
5
Oct
-15
Jan-
16
Apr-
16
Jul-1
6
Oct
-16
Biom
ass i
n kg
Month - Year
Biomass

11
Feeding
0
100,000
200,000
300,000
400,000
500,000
600,000
700,000
jan apr jul okt jan apr jul okt jan apr jul okt jan apr jul okt
2013 2014 2015 2016
Feed
dem
and
in k
g
Year - Month
Model Net Pen farm Model Land-based RAS farm
0
100,000
200,000
300,000
400,000
500,000
600,000
700,000
Jan-
13
Apr-
13
Jul-1
3
Oct
-13
Jan-
14
Apr-
14
Jul-1
4
Oct
-14
Jan-
15
Apr-
15
Jul-1
5
Oct
-15
Jan-
16
Apr-
16
Jul-1
6
Oct
-16
Feed
Dem
and
in k
g
Month - Year

12
Harvest
0
200
400
600
800
1,000
1,200
1,400
jan apr jul okt jan apr jul okt jan apr jul okt jan apr jul okt
2013 2014 2015 2016
Harv
est o
f sal
mon
i M
.tons
Year - Month
Model Net Pen farm Model Land-based RAS farm
-
200
400
600
800
1,000
1,200
1,400
Jan-
13
Apr-
13
Jul-1
3
Oct
-13
Jan-
14
Apr-
14
Jul-1
4
Oct
-14
Jan-
15
Apr-
15
Jul-1
5
Oct
-15
Jan-
16
Apr-
16
Jul-1
6
Oct
-16
Harv
est i
n m
etric
tonn
es
Month - Year

13
Production Cost (at steady state), USD/HOG
Model Net pen farm Total estimated production cost per kilo HOG: 4.24 US $
Model Land-based RAS farm Total estimated production cost per kilo HOG: 3.98 US $
– Uses 0.05 US $ / kWh; Comparative Norway is 0.17 US $ / kWh
$2.22 52%
$ 0,48 11%
$ 0,03 1%
$0,22 5%
$0,15 4%
$0,42 10%
$0,34 8%
$0,38 9%
Feed cost
Smolt cost
Insurance cost
Salary
Well boat cost
Other operating cost
Depreciations
Cost of primaryprocessing
$1.96 49%
$0.33 8%
$0.16 4%
$0.48 12%
$0.15 4%
$0.11 3%
$0.59 15%
$0.12 3%
$0.09 2%
Feed
Electric
Oxygen
Labor
Management
Processing
Depr & Maint
Eggs
Bicarb

• Not a optimal utilization of three licences! • It's possible to harvest as much as 1,600 – 1,700 M.tons per licence (~2 x Model)
• Requires a more large-scale operation
• Average EFCR used in the calculation is high: 1.27 • It's possible to achieve an EFCR more closely to 1.00
• Top 25 % EFCR in Norway over the last ten years is 1.14 • Top 10 % EFCR in Norway over the last ten years is 1.04
• Average mortality at 16.1 % is high
• Some sites in Norway are now achieving only 2 – 4 % mortality • Then on the other side, some sites have mortality at over 30 % - mostly due to
disease.
14
Comments: EFCR, mortality & utilization: Model Net Pen Farm

• EFCR: 1.14 • Mortality: 8 % per generation
• Gives a production cost of 4 US $/kg HOG
(Compared to 4.24 US $/kg) • Reduction in feed cost • Reduction in smolt cost
• Model Net Pen Yield per smolt: 3.44 kg
• Model Net Pen Base Case: 3.17 kg • Model RAS Yield Per Smolt: 3.97 kg HOG
15
Use of "best-practice" inputs
$2,03 51%
$0,44 11%
$0,3 1% $0,22
6%
$0,15 4%
$0,42 11% $0,33
8%
$0,38 10%
Feed cost
Smolt cost
Insurance cost
Salary
Well boat cost
Other operatingcostDepreciations
Cost of primaryprocessing
4 US$/Kg

• Initial test marketing in the Vancouver area and in the Washington DC area indicated that product sold at premium pricing (30% or more). • Basis of premium was different in different markets – sustainable (BC) and local
(DC) • Land-based RAS produced salmon is a premium product that is being sold into an
incremental market that currently doesn’t buy net pen salmon (Kuterra data). • Most major retailers have sustainable seafood purchasing policies that land-based
RAS produced salmon will be able to meet.
16
Market and Price

Model Land-based RAS farm – w/o Premium Price: Investments: • Investments in total: 32 M US $ Income: • Price per kilo 34 NOK or 5.66 US $
• Total estimated income: 18.68 M US $ Costs: • Production cost excluding financial cost: 3.98 US $ / kg • Total production costs (ex. finance): ≈ 13.13 M US $ Earnings before Interest and Taxes (EBIT): 5.55 M US $
17
Quick Estimation of Profitability – Base Case
Model Net Pen farm – Conservative Performance: Investments: • Investments in total: 12.3 M US $ Income: • Fish Pool forward prices
• 2014: 35.85 NOK/kilo • 2015: 33.88 NOK/kilo (Jan - Aug)
• Estimated price pr kilo: 34 NOK ≈ 5,66 US $
• Total estimated income: 18.67 M US $ Costs: • Production cost excluding financial cost: 4.24 US $ / kg • Total production costs (ex. finance): ≈13.99 M US $ Earnings before Interest and Taxes (EBIT): 4.68 M US $

Model Land-based RAS farm – Premium Price: Investments: • Investments in total: 32 M US $ Income: • Possibility for a 30% price premium
• Price per kilo (5.66 * 1.3) ≈ 7.36 US $
• Total estimated income: 24.29 M US $ Costs: • Production cost excluding financial cost: 3.98 US $/kg • Total production costs (ex. finance): ≈ 13.13 M US $ Earnings before Interest and Taxes (EBIT): 11.16 M US $
18
Quick Estimation of Profitability – Best Case
Model Net Pen farm – High Performance: Investments: • Investments in total: 12.3 M US $ Income: • Fish Pool forward prices
• 2014: 35.85 NOK/kilo • 2015: 33.88 NOK/kilo (Jan - Aug)
• Estimated price per kilo: 34 NOK ≈ 5.66 US $
• Total estimated income: 18.67 M US $ Costs: • Production cost excluding financial cost: 4.00 US $/kg • Total production costs (ex. finance): ≈ 13.20 M US $ Earnings before Interest and Taxes (EBIT): 5.47 M US $

Model Land-based RAS farm • Salary: ≈ 1,575,000 US $ / year • Electricity: ≈ 21.5 mWh
• Cost per kWh: 0.05 US $ • Oxygen: ≈ 3,000 M.tons
• Cost per kilo: 0.2 US $ • Bicarb: ≈ 862 M.tons.
• Cost per kilo: 0.35 US $ • Feed: 1.50 US $ per kilo • Eggs: ≈ 1.2 million
• Cost: 0.30 US $ each • Management: 500,000 US $ / year • Primary processing:
• Salary: 375,000 US $ / year • 10 persons • Other cost included in the total calculation
• Price per kilo HOG: 5.45 – 8.77 US $
19
Cash Flow Assumptions
Model Net Pen farm • Salary: ≈ 750,000 US $ / year • Primary processing ≈ 0.38 US $ / kilo HOG • Well boat 0.92 US $ / kilo HOG (includes smolt and
slaughter transport) • Insurance premium ≈ 0.8 % of the value of the biomass • Feed: 1.48 US $ per kilo • Smolts: Conservative performance 1030'/year
High performance: 960'/year Cost: ≈ 1.53 US $ each
• Other production cost (Ex. Electricity, de-liceing etc.) ≈ 0.43 US $ / kilo HOG
• Price per kilo HOG: 5.45 – 6.75 US $
• Licences not depreciated and is sold after 10 years
Both: 2 % inflation first 6 years; 3 % inflation four last years Value of equipment/buildings etc. set to 0 after ten years

20
$-35,000
$-30,000
$-25,000
$-20,000
$-15,000
$-10,000
$-5,000
$-
$5,000
$10,000
$15,000
$20,000
Year 0 Year 1 Year 2 Year 3 Year 4 Year 5 Year 6 Year 7 Year 8 Year 9 Year 10
Cash
flow
(in
1000
$)
Model Land-based RAS fish farm Model Land-based RAS fish farm with premium price
Model Net Pen farm - Conservative performance Model Net Pen farm - High performance
Ten Year Cash Flow

• Rate of return calculated to 8.91 %. (6 % loan interest, 28 % tax, 27.23 % required return on equity before tax, 30/70 private equity/loan)
21
Net Present Value Analysis
Risk free return 3.23 %
Commercial risk 10 %
Financial risk 10 %
Liquidity premium 4 %
Required rate of return before tax 27.23 %
Tax (28%) 7.63 %
Estimated required rate of return on equity 19.61 %
Estimated required rate of return on total capital 8.91 %

Model Land-based RAS farm: • NPV: -16 M US $ • NPV & NO Required Rate of Return: 1,810,000 US $
Model Land-based RAS farm with premium price • NPV: 13.33 M US $ • NPV at 0, at a required rate of return of: ≈ 14.35 % Model Net Pen farm - Conservative performance • NPV: 7 M US $ • NPV at 0, at a required rate of return of: ≈ 15.07 %
Model Net Pen farm - High performance • NPV: 11.39 M US $ • NPV at 0, at a required rate of return of: ≈ 18.67 %
22
Net present value at 8.91 % required rate of return
NPV is for 10 years

Model Land-based RAS farm: • NPV: -16 M US $ • NPV & NO Required Rate of Return: 1,810,000 US $
Model Land-based RAS farm - Premium Price • NPV: 13.33 M US $ • NPV at 0, at a required rate of return of: ≈ 14.35 % Model Net Pen farm - Conservative Performance • NPV: 7 M US $ • NPV at 0, at a required rate of return of: ≈ 15.07 %
Model Net Pen farm - High performance • NPV: 11.39 M US $ • NPV at 0, at a required rate of return of: ≈ 18.67 %
23
Net present value at 8.91 % required rate of return
NPV is for 10 years

• Production: Model Land-based RAS farm has a more consistent production than the Model Net Pen farm
• CAPEX: Model Land-based RAS farm capital cost is greater per unit of annual production than Model Net Pen capital cost per unit of annual production
• OPEX: Model Land-based RAS farm operating cost is slightly lower than Model Net Pen farm operating cost (within this analysis)
• NPV: Model Land-based RAS farm and Model Net Pen farm have similar net present value for the expected case
24
Brief Conclusions