brian wylie jülich supercomputing centre
TRANSCRIPT

VIRTUAL INSTITUTE – HIGH PRODUCTIVITY SUPERCOMPUTING
Analysis report examination with Cube
Brian Wylie
Jülich Supercomputing Centre
VIRTUAL INSTITUTE – HIGH PRODUCTIVITY SUPERCOMPUTING
Cube
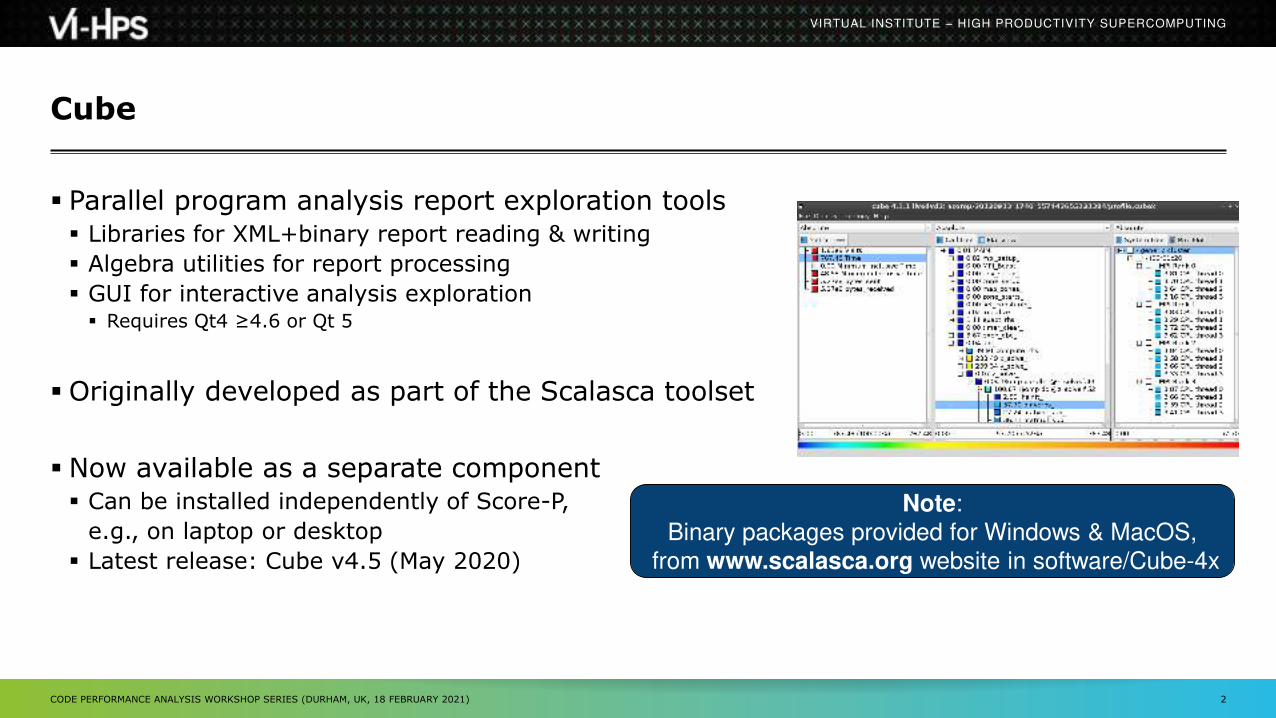
Parallel program analysis report exploration tools Libraries for XML+binary report reading & writing
Algebra utilities for report processing
GUI for interactive analysis exploration Requires Qt4 ≥4.6 or Qt 5
Originally developed as part of the Scalasca toolset
Now available as a separate component Can be installed independently of Score-P,
e.g., on laptop or desktop
Latest release: Cube v4.5 (May 2020)
2CODE PERFORMANCE ANALYSIS WORKSHOP SERIES (DURHAM, UK, 18 FEBRUARY 2021)
Note:
Binary packages provided for Windows & MacOS,
from www.scalasca.org website in software/Cube-4x

VIRTUAL INSTITUTE – HIGH PRODUCTIVITY SUPERCOMPUTING
Cube GUI (COSMA/DINE)
Run remote (often convenient) start X server (e.g., Xming) locally
connect to COSMA with X forwarding enabled -Y may be faster but is insecure!
load cube module and start cube remotely
Alternatively, install X2go client locally
and configure for COSMA as directed: https://www.dur.ac.uk/icc/cosma/support/vnc/
3CODE PERFORMANCE ANALYSIS WORKSHOP SERIES (DURHAM, UK, 18 FEBRUARY 2021)
Install & run local install Cube GUI locally on desktop
binary packages available for MacOS & Windows
and externally provided by OpenHPC and various
Linux distributions
source package available for Linux, requires Qt
configure/build/install manually or use your
favourite framework (e.g. Spack or EasyBuild)
copy .cubex file (or entire scorep directory)
to desktop from remote system
OR locally mount remote filesystem
start cube locally
desk$ ssh –X cosmaWelcome to COSMA…cosma$ module load cubecosma$ cube ./scorep_sum/profile.cubex
desk$ mkdir $HOME/mntdesk$ sshfs [user@]remote.sys:[dir] $HOME/mntdesk$ cd $HOME/mntdesk$ cube ./scorep_sum/profile.cubex
https://www.scalasca.org/scalasca/software/cube-4.x/download.htmlmailto: [email protected]

VIRTUAL INSTITUTE – HIGH PRODUCTIVITY SUPERCOMPUTING
Call
path
Pro
pert
y
Location
Analysis presentation and exploration
Representation of values (severity matrix)
on three hierarchical axes Performance property (metric)
Call path (program location)
System location (process/thread)
Three coupled tree browsers
Cube displays severities As value: for precise comparison
As colour: for easy identification of hotspots
Inclusive value when closed & exclusive value when expanded
Customizable via display modes
4CODE PERFORMANCE ANALYSIS WORKSHOP SERIES (DURHAM, UK, 18 FEBRUARY 2021)

VIRTUAL INSTITUTE – HIGH PRODUCTIVITY SUPERCOMPUTING
How is it
distributed across
the processes/threads?
What kind of
performance
metric?
Where is it in the
source code?
In what context?
Analysis presentation
5CODE PERFORMANCE ANALYSIS WORKSHOP SERIES (DURHAM, UK, 18 FEBRUARY 2021)

VIRTUAL INSTITUTE – HIGH PRODUCTIVITY SUPERCOMPUTING
Inclusive Exclusive
int foo() {int a;a = 1 + 1;
bar();
a = a + 1;return a;
}
Inclusive vs. exclusive values
Inclusive Information of all sub-elements aggregated into single value
Exclusive Information cannot be subdivided further
6CODE PERFORMANCE ANALYSIS WORKSHOP SERIES (DURHAM, UK, 18 FEBRUARY 2021)

VIRTUAL INSTITUTE – HIGH PRODUCTIVITY SUPERCOMPUTING
Score-P analysis report exploration (opening view)
7CODE PERFORMANCE ANALYSIS WORKSHOP SERIES (DURHAM, UK, 18 FEBRUARY 2021)

VIRTUAL INSTITUTE – HIGH PRODUCTIVITY SUPERCOMPUTING
Metric selection
8
Selecting the “Time” metric shows total execution time
CODE PERFORMANCE ANALYSIS WORKSHOP SERIES (DURHAM, UK, 18 FEBRUARY 2021)

VIRTUAL INSTITUTE – HIGH PRODUCTIVITY SUPERCOMPUTING
Distribution
of selected metric
for call path
by process/thread
Expanding the system tree
9CODE PERFORMANCE ANALYSIS WORKSHOP SERIES (DURHAM, UK, 18 FEBRUARY 2021)

VIRTUAL INSTITUTE – HIGH PRODUCTIVITY SUPERCOMPUTING
Distribution of selected
metric across the call tree
Collapsed: inclusive value
Expanded: exclusive value
Expanding the call tree
10CODE PERFORMANCE ANALYSIS WORKSHOP SERIES (DURHAM, UK, 18 FEBRUARY 2021)

VIRTUAL INSTITUTE – HIGH PRODUCTIVITY SUPERCOMPUTING
Selection updates
metric values shown
in columns to the right
Selecting a call path
11CODE PERFORMANCE ANALYSIS WORKSHOP SERIES (DURHAM, UK, 18 FEBRUARY 2021)

VIRTUAL INSTITUTE – HIGH PRODUCTIVITY SUPERCOMPUTING
Right-click opens
context menu
Source-code view via context menu
12CODE PERFORMANCE ANALYSIS WORKSHOP SERIES (DURHAM, UK, 18 FEBRUARY 2021)
VIRTUAL INSTITUTE – HIGH PRODUCTIVITY SUPERCOMPUTING
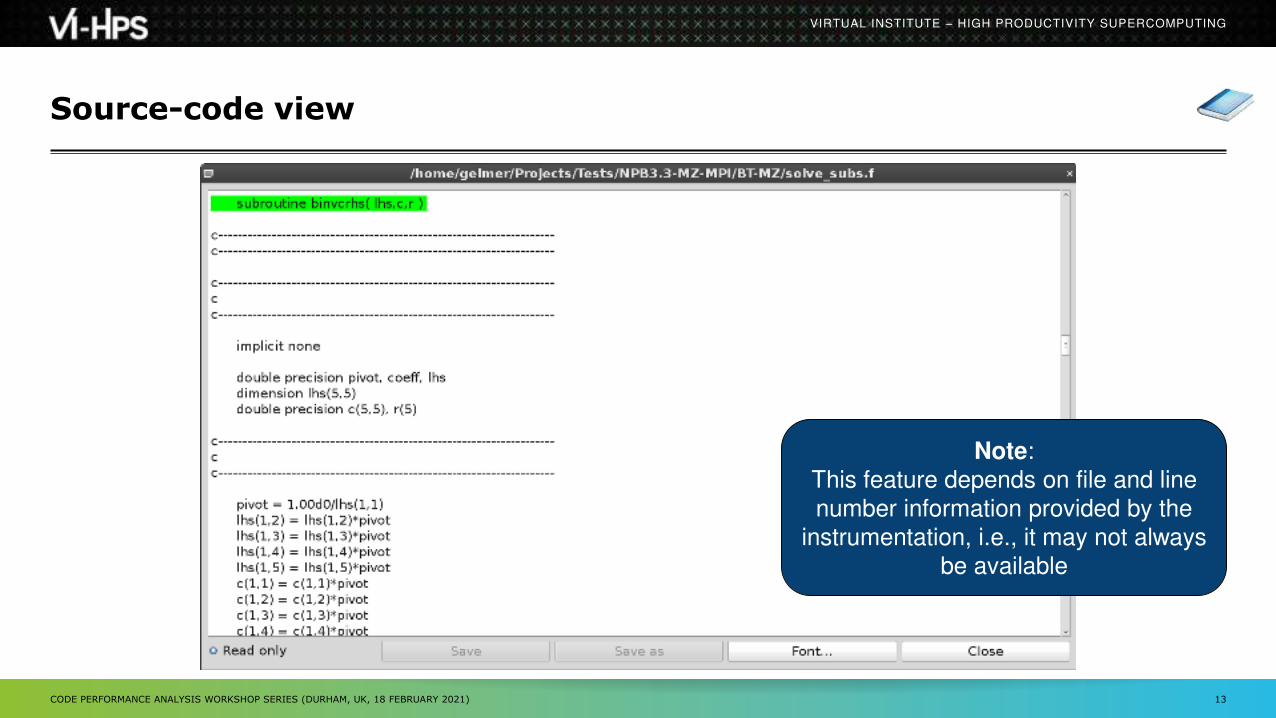
Source-code view
13
Note:
This feature depends on file and line
number information provided by the
instrumentation, i.e., it may not always
be available
CODE PERFORMANCE ANALYSIS WORKSHOP SERIES (DURHAM, UK, 18 FEBRUARY 2021)

VIRTUAL INSTITUTE – HIGH PRODUCTIVITY SUPERCOMPUTING
Select flat view tab,
expand all nodes,
and sort by exclusive value
Flat profile view
14CODE PERFORMANCE ANALYSIS WORKSHOP SERIES (DURHAM, UK, 18 FEBRUARY 2021)

VIRTUAL INSTITUTE – HIGH PRODUCTIVITY SUPERCOMPUTING
Box plot shows distribution
across the system; with
min/max/avg/median/quartiles
Box plot view
15CODE PERFORMANCE ANALYSIS WORKSHOP SERIES (DURHAM, UK, 18 FEBRUARY 2021)

VIRTUAL INSTITUTE – HIGH PRODUCTIVITY SUPERCOMPUTING
Data can be shown in
various percentage
modes
Alternative display modes
16CODE PERFORMANCE ANALYSIS WORKSHOP SERIES (DURHAM, UK, 18 FEBRUARY 2021)

VIRTUAL INSTITUTE – HIGH PRODUCTIVITY SUPERCOMPUTING
Important display modes
Absolute Absolute value shown in seconds/bytes/counts
Selection percent Value shown as percentage w.r.t. the selected node
“on the left” (metric/call path)
Peer percent (system tree only) Value shown as percentage relative to the maximum peer value
17CODE PERFORMANCE ANALYSIS WORKSHOP SERIES (DURHAM, UK, 18 FEBRUARY 2021)

VIRTUAL INSTITUTE – HIGH PRODUCTIVITY SUPERCOMPUTING
Select multiple nodes
with Ctrl-click
Multiple selection
18CODE PERFORMANCE ANALYSIS WORKSHOP SERIES (DURHAM, UK, 18 FEBRUARY 2021)
VIRTUAL INSTITUTE – HIGH PRODUCTIVITY SUPERCOMPUTING
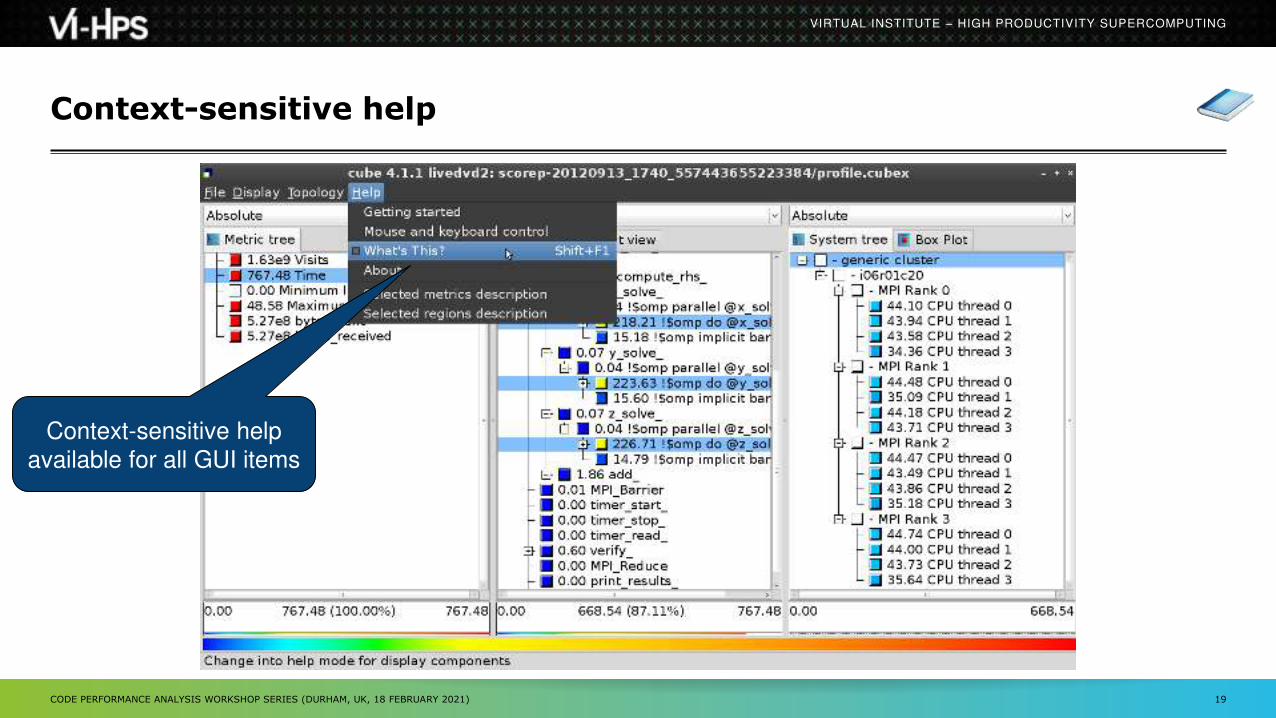
Context-sensitive help
available for all GUI items
Context-sensitive help
19CODE PERFORMANCE ANALYSIS WORKSHOP SERIES (DURHAM, UK, 18 FEBRUARY 2021)

VIRTUAL INSTITUTE – HIGH PRODUCTIVITY SUPERCOMPUTING
Derived metrics
Derived metrics are defined using CubePL expressions, e.g.:
metric::time(i)/metric::visits(e)
Values of derived metrics are not stored, but calculated on-the-fly
Types of derived metrics: Prederived: evaluation of the CubePL expression is performed before aggregation
Postderived: evaluation of the CubePL expression is performed after aggregation
Examples: “Average execution time”: Postderived metric with expression
metric::time(i)/metric::visits(e)
“Number of FLOP per second”: Postderived metric with expression
metric::FLOP()/metric::time()
20CODE PERFORMANCE ANALYSIS WORKSHOP SERIES (DURHAM, UK, 18 FEBRUARY 2021)

VIRTUAL INSTITUTE – HIGH PRODUCTIVITY SUPERCOMPUTING
Parameters of the
derived metric
CubePL expression
Collection of derived
metrics
Derived metrics in Cube GUI
21CODE PERFORMANCE ANALYSIS WORKSHOP SERIES (DURHAM, UK, 18 FEBRUARY 2021)

VIRTUAL INSTITUTE – HIGH PRODUCTIVITY SUPERCOMPUTING
Example: FLOPS based on PAPI_FP_OPS and time
22CODE PERFORMANCE ANALYSIS WORKSHOP SERIES (DURHAM, UK, 18 FEBRUARY 2021)
VIRTUAL INSTITUTE – HIGH PRODUCTIVITY SUPERCOMPUTING
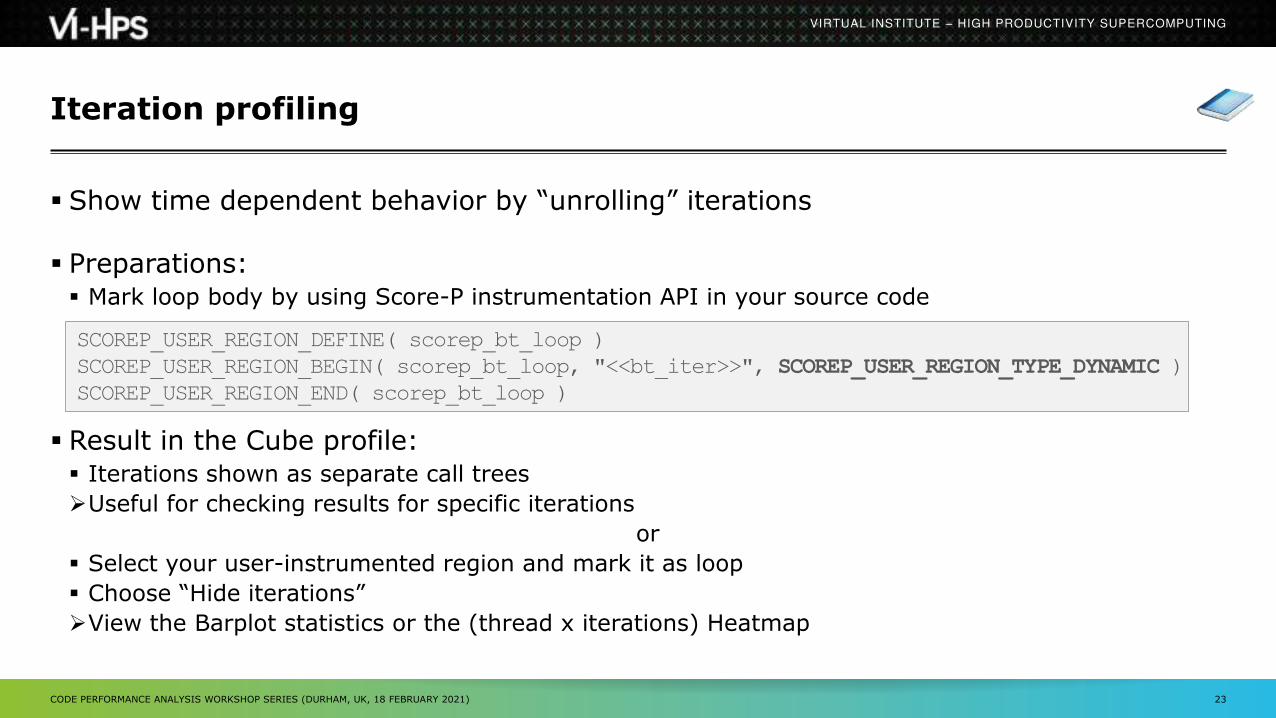
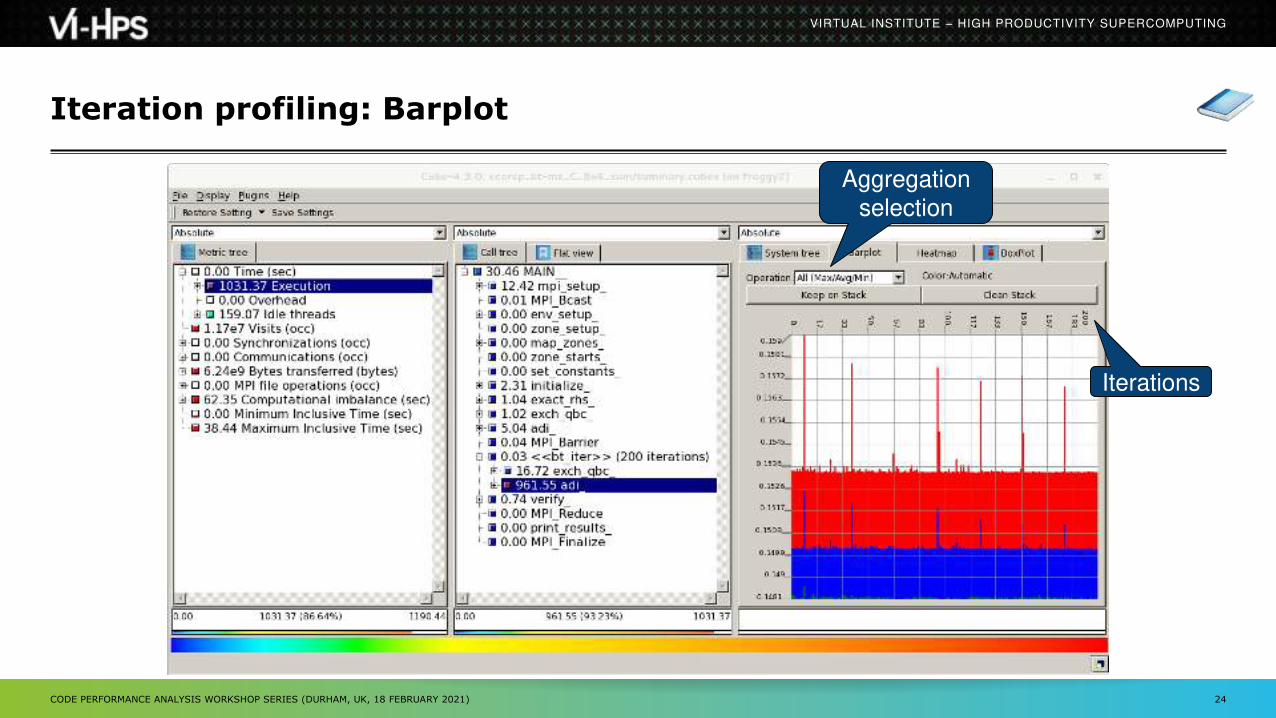
Iteration profiling
Show time dependent behavior by “unrolling” iterations
Preparations: Mark loop body by using Score-P instrumentation API in your source code
Result in the Cube profile: Iterations shown as separate call trees
Useful for checking results for specific iterations
or
Select your user-instrumented region and mark it as loop
Choose “Hide iterations”View the Barplot statistics or the (thread x iterations) Heatmap
23
SCOREP_USER_REGION_DEFINE( scorep_bt_loop )SCOREP_USER_REGION_BEGIN( scorep_bt_loop, "<<bt_iter>>", SCOREP_USER_REGION_TYPE_DYNAMIC )SCOREP_USER_REGION_END( scorep_bt_loop )
CODE PERFORMANCE ANALYSIS WORKSHOP SERIES (DURHAM, UK, 18 FEBRUARY 2021)
VIRTUAL INSTITUTE – HIGH PRODUCTIVITY SUPERCOMPUTING
Iteration profiling: Barplot
24
Aggregation
selection
Iterations
CODE PERFORMANCE ANALYSIS WORKSHOP SERIES (DURHAM, UK, 18 FEBRUARY 2021)

VIRTUAL INSTITUTE – HIGH PRODUCTIVITY SUPERCOMPUTING
Iteration profiling: Heatmap
25
Iterations
Threads
CODE PERFORMANCE ANALYSIS WORKSHOP SERIES (DURHAM, UK, 18 FEBRUARY 2021)

VIRTUAL INSTITUTE – HIGH PRODUCTIVITY SUPERCOMPUTING
Extracting solver sub-tree from analysis report
Calculating difference of two reports
Additional utilities for merging, calculating mean, etc.
Default output of cube_utility is a new report utility.cubex
Further utilities for report scoring & statistics
Run utility with `-h’ (or no arguments) for brief usage info
% cube_cut -r '<<ITERATION>>' scorep_bt-mz_C_8x6_sum/profile.cubexWriting cut.cubex... done.
% cube_diff scorep_bt-mz_C_8x6_sum/profile.cubex cut.cubexWriting diff.cubex... done.
CUBE algebra utilities
26CODE PERFORMANCE ANALYSIS WORKSHOP SERIES (DURHAM, UK, 18 FEBRUARY 2021)
module load cube

VIRTUAL INSTITUTE – HIGH PRODUCTIVITY SUPERCOMPUTING
Square sneak preview
Scalasca provides square to facilitate analysis report exploration square = scalasca –examine [OPTIONS] ( ./scorep_expt_sum | ./profile.cubex )
Processes intermediate .cubex files produced by Score-P and Scout profile.cubex -> summary.cubex
scout.cubex -> trace.cubex
and (optionally) starts CUBE GUI with the post-processed file containing additional derived metrics and metric hierarchies
27CODE PERFORMANCE ANALYSIS WORKSHOP SERIES (DURHAM, UK, 18 FEBRUARY 2021)
module load cube scorepmodule load scalasca

VIRTUAL INSTITUTE – HIGH PRODUCTIVITY SUPERCOMPUTING
Cube: Further information
Parallel program analysis report exploration tools Libraries for Cube report reading & writing
Algebra utilities for report processing
GUI for interactive analysis exploration
Available under 3-clause BSD open-source license
Documentation & sources: http://www.scalasca.org
User guide also part of installation: <prefix>/share/doc/CubeGuide.pdf
Contact: mailto: [email protected]
28CODE PERFORMANCE ANALYSIS WORKSHOP SERIES (DURHAM, UK, 18 FEBRUARY 2021)
VIRTUAL INSTITUTE – HIGH PRODUCTIVITY SUPERCOMPUTING
Score-P/CUBE case study HemeLB

VIRTUAL INSTITUTE – HIGH PRODUCTIVITY SUPERCOMPUTING
HemeLB (SuperMUC-NG: no GPUs)
3D macroscopic blood flow in human arterial system developed by UC London (UK) lattice-Boltzmann method tracking fluid particles on a lattice grid with complex boundary conditions
exascale flagship application of EU H2020 HPC Centre of Excellence for Computational Biomedicine
HemeLB open-source code and test case: www.hemelb.org C++ parallelized with MPI [+ CUDA unused]
Intel Studio 2019u4 compiler and MPI library (v19.0.4.243)
configured with 2 ‘reader’ processes (intermediate MPI file writing disabled) MPI-3 shared-memory model employed within compute nodes
to reduce memory requirements when distributing lattice blocks from reader processes
Focus of analysis 5,000 time-step (500µs) simulation of cerebrovascular “circle of Willis” geometry 6.4µm lattice resolution (21.15 GiB): 10,154,448,502 lattice sites
Executed on SuperMUC-NG Lenovo ThinkSystem SD650 (LRZ): 2x 24-core Intel Xeon Platinum 8174 (‘Skylake’) @ 3.1GHz 48 MPI processes/node, 6452 (of 6480) compute nodes: 309,696 MPI processes
190x speed-up from 864 cores: 80% scaling efficiency to over 100,000 cores⇒ Identification & quantification of impact of load balance and its variation
CODE PERFORMANCE ANALYSIS WORKSHOP SERIES (DURHAM, UK, 18 FEBRUARY 2021) 30

VIRTUAL INSTITUTE – HIGH PRODUCTIVITY SUPERCOMPUTING
HemeLB@SNG strong scaling of FOA RunSimulation
CODE PERFORMANCE ANALYSIS WORKSHOP SERIES (DURHAM, UK, 18 FEBRUARY 2021) 31
[Execution of 9,216 processes on 192 compute nodes not possible due to insufficient compute nodes with adequate memory in ‘fat’ partition (768 GiB vs. regular 96 GiB node memory]
VIRTUAL INSTITUTE – HIGH PRODUCTIVITY SUPERCOMPUTING
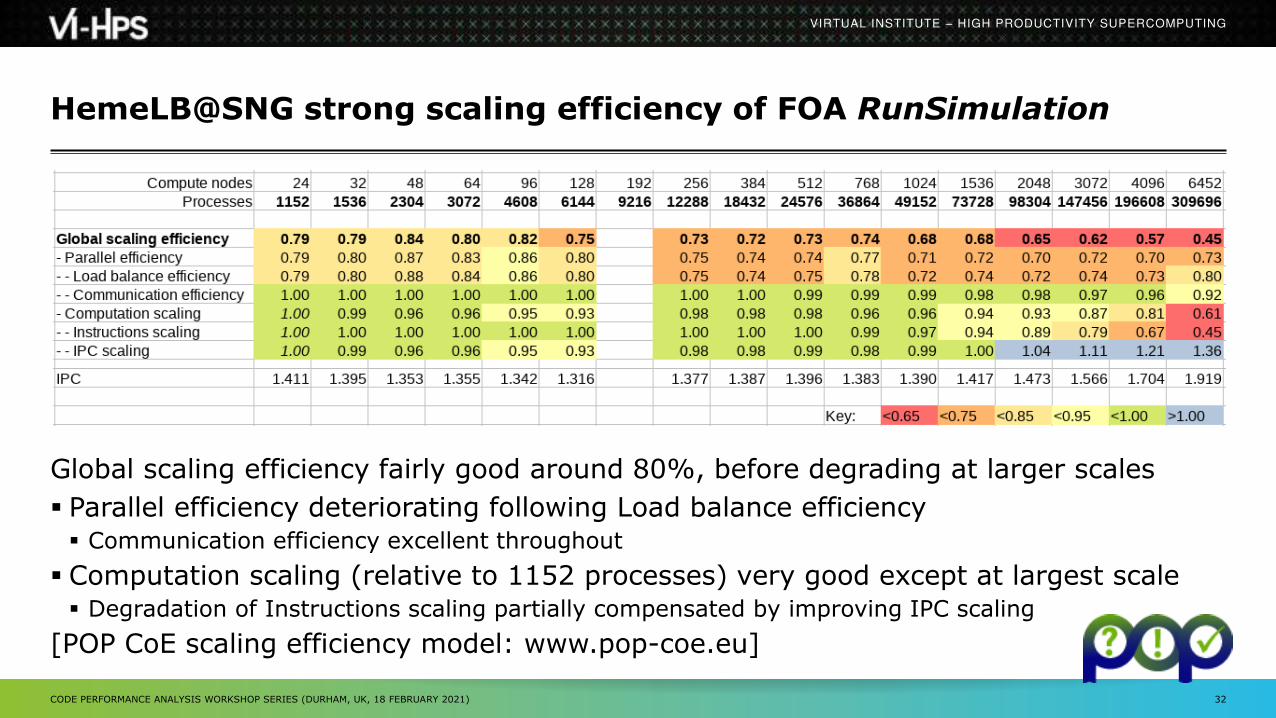
HemeLB@SNG strong scaling efficiency of FOA RunSimulation
Global scaling efficiency fairly good around 80%, before degrading at larger scales
Parallel efficiency deteriorating following Load balance efficiency Communication efficiency excellent throughout
Computation scaling (relative to 1152 processes) very good except at largest scale Degradation of Instructions scaling partially compensated by improving IPC scaling
[POP CoE scaling efficiency model: www.pop-coe.eu]
CODE PERFORMANCE ANALYSIS WORKSHOP SERIES (DURHAM, UK, 18 FEBRUARY 2021) 32

VIRTUAL INSTITUTE – HIGH PRODUCTIVITY SUPERCOMPUTING
Initial tree presentation: Time of MPI_Gather per MPI process
CODE PERFORMANCE ANALYSIS WORKSHOP SERIES (DURHAM, UK, 18 FEBRUARY 2021) 34

VIRTUAL INSTITUTE – HIGH PRODUCTIVITY SUPERCOMPUTING
Topological presentation: STALLS_MEM_ANY for HandleActors
CODE PERFORMANCE ANALYSIS WORKSHOP SERIES (DURHAM, UK, 18 FEBRUARY 2021) 35

VIRTUAL INSTITUTE – HIGH PRODUCTIVITY SUPERCOMPUTING
Advisor: POP efficiency assessment for RunSimulation
CODE PERFORMANCE ANALYSIS WORKSHOP SERIES (DURHAM, UK, 18 FEBRUARY 2021) 36

VIRTUAL INSTITUTE – HIGH PRODUCTIVITY SUPERCOMPUTING
HemeLB_GPU (JUWELS-Volta)
3D macroscopic blood flow in human arterial system developed by UC London (UK) lattice-Boltzmann method tracking fluid particles on a lattice grid with complex boundary conditions
exascale flagship application of EU H2020 HPC Centre of Excellence for Computational Biomedicine
HemeLB open-source code and test case: www.hemelb.org C++ parallelized with MPI + CUDA (in development)
GCC/8.3.0 compiler, CUDA/10.1.105 and ParaStationMPI/5.4 library
configured with 2 ‘reader’ processes and intermediate MPI file writing rank 0 ‘monitor’ process doesn’t participate in simulation
Focus of analysis 2,000 time-step (each 100µs) simulation of CBM2019_Arteries_patched geometry 1.78 GiB: 66,401,494 lattice sites, 1+38 iolets
Executed on JUWELS-Volta (@JSC): 2x 20-core Intel Xeon Platinum 8168 (‘Skylake’) CPUs + 4 Nvidia V100 ‘Volta’ GPUs 4* MPI processes/node (one per GPU), 32 (of 56) compute nodes: 129 MPI processes⇒ Identification & quantification of impact of load balance and its variation
CODE PERFORMANCE ANALYSIS WORKSHOP SERIES (DURHAM, UK, 18 FEBRUARY 2021) 37

VIRTUAL INSTITUTE – HIGH PRODUCTIVITY SUPERCOMPUTING
Tree: Time for asynch. CUDA kernels on separate CUDA streams
CODE PERFORMANCE ANALYSIS WORKSHOP SERIES (DURHAM, UK, 18 FEBRUARY 2021) 38

VIRTUAL INSTITUTE – HIGH PRODUCTIVITY SUPERCOMPUTING
Topo: Time for asynch. CUDA kernels on separate CUDA streams
CODE PERFORMANCE ANALYSIS WORKSHOP SERIES (DURHAM, UK, 18 FEBRUARY 2021) 39

VIRTUAL INSTITUTE – HIGH PRODUCTIVITY SUPERCOMPUTING
Topo: Time for MPI file writing on CPU varies per MPI process
CODE PERFORMANCE ANALYSIS WORKSHOP SERIES (DURHAM, UK, 18 FEBRUARY 2021) 40

VIRTUAL INSTITUTE – HIGH PRODUCTIVITY SUPERCOMPUTING
Topo: Time for CUDA asynchronous memory copies is imbalanced
CODE PERFORMANCE ANALYSIS WORKSHOP SERIES (DURHAM, UK, 18 FEBRUARY 2021) 41
VIRTUAL INSTITUTE – HIGH PRODUCTIVITY SUPERCOMPUTING
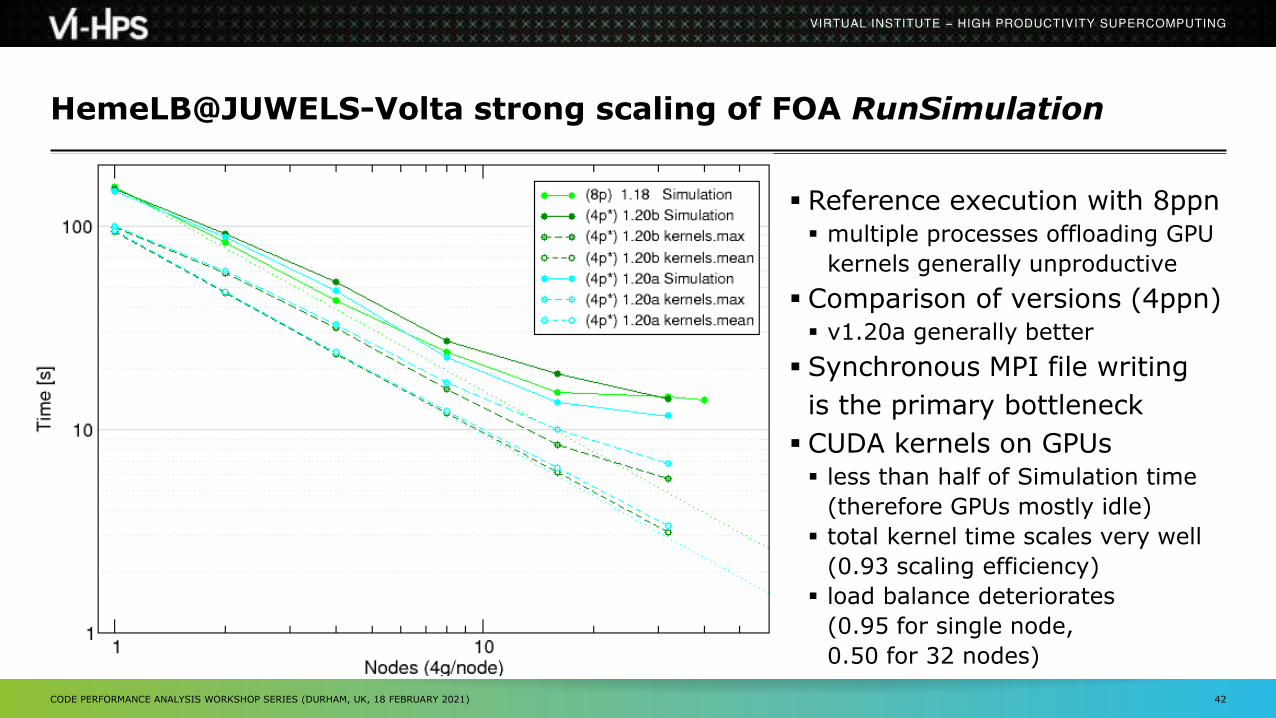
HemeLB@JUWELS-Volta strong scaling of FOA RunSimulation
CODE PERFORMANCE ANALYSIS WORKSHOP SERIES (DURHAM, UK, 18 FEBRUARY 2021) 42
Reference execution with 8ppn multiple processes offloading GPU
kernels generally unproductive
Comparison of versions (4ppn) v1.20a generally better
Synchronous MPI file writing
is the primary bottleneck
CUDA kernels on GPUs less than half of Simulation time
(therefore GPUs mostly idle)
total kernel time scales very well
(0.93 scaling efficiency)
load balance deteriorates
(0.95 for single node,
0.50 for 32 nodes)

VIRTUAL INSTITUTE – HIGH PRODUCTIVITY SUPERCOMPUTING
HemeLB@JUWELS/Volta strong scaling efficiency of RunSimulation
Only considering GPUs (ignoring all CPU cores, 90% of which are completely unused)
Single (quad-GPU) node already suffers significant communication inefficiency includes MPI file writing, but doesn’t degrade much as additional nodes are included
Load balance of GPUs deteriorates progressively
GPU computation scaling remains reasonably good
[POP CoE scaling efficiency model: www.pop-coe.eu]
CODE PERFORMANCE ANALYSIS WORKSHOP SERIES (DURHAM, UK, 18 FEBRUARY 2021) 43

VIRTUAL INSTITUTE – HIGH PRODUCTIVITY SUPERCOMPUTING
HemeLB@JUWELS-Volta strong scaling of FOA RunSimulation
CODE PERFORMANCE ANALYSIS WORKSHOP SERIES (DURHAM, UK, 18 FEBRUARY 2021) 44
CPU+GPU time breakdown
CUDA kernels on GPUs less than half of Simulation time
(therefore GPUs mostly idle)
total kernel time scales very well
(0.87 scaling efficiency)
MPI processes on CPUs computation time decreases
CUDA synchronization time fairly
constant, but time for memory
management increases somewhat
MPI communication time
dominates, with much more time
for file writing with 16+ nodes