bridging mathematics and science 6th to 8th grade
TRANSCRIPT

Bridging Mathematics and Science
6th to 8th grade Mathematics and ScienceActivities
55th West Virginia Council of Teachers ofMathematics Meeting
March 21, 2003Flatwoods, WV
Work byDr. Anthony S. Pyzdrowski and Dr. Laura Pyzdrowski
California University of Pennsylvania, and West Virginia [email protected], [email protected]
www.pyzdrowski.ws
Mrs. Patricia NeelSt. John Evangelist School
Uniontown, PA [email protected]
ii
ContentsNote to Users . . . . . . . . . . . . . . . . . . . . . . . . . . . . . . . . . . . . . . . . . . . . . . . . . . . . . . . . . . . . . . 1
Unit Outline . . . . . . . . . . . . . . . . . . . . . . . . . . . . . . . . . . . . . . . . . . . . . . . . . . . . . . . . . . . . . . . . 1
Assessment . . . . . . . . . . . . . . . . . . . . . . . . . . . . . . . . . . . . . . . . . . . . . . . . . . . . . . . . . . . . . . . . 2
Web Sites . . . . . . . . . . . . . . . . . . . . . . . . . . . . . . . . . . . . . . . . . . . . . . . . . . . . . . . . . . . . . . . . . 2
Day 1: Structure of Bridges . . . . . . . . . . . . . . . . . . . . . . . . . . . . . . . . . . . . . . . . . . . . . . . . . . . . 3Girder Bridges . . . . . . . . . . . . . . . . . . . . . . . . . . . . . . . . . . . . . . . . . . . . . . . . . . . . . . . . 3Truss Bridges . . . . . . . . . . . . . . . . . . . . . . . . . . . . . . . . . . . . . . . . . . . . . . . . . . . . . . . . . 3Arch Bridges . . . . . . . . . . . . . . . . . . . . . . . . . . . . . . . . . . . . . . . . . . . . . . . . . . . . . . . . . 3Cantilever Bridges . . . . . . . . . . . . . . . . . . . . . . . . . . . . . . . . . . . . . . . . . . . . . . . . . . . . . 4Suspension Bridges . . . . . . . . . . . . . . . . . . . . . . . . . . . . . . . . . . . . . . . . . . . . . . . . . . . . 4Cable-Stayed Bridges . . . . . . . . . . . . . . . . . . . . . . . . . . . . . . . . . . . . . . . . . . . . . . . . . . . 4Vocabulary Words . . . . . . . . . . . . . . . . . . . . . . . . . . . . . . . . . . . . . . . . . . . . . . . . . . . . . 4
Day 2: Structure of Bridges . . . . . . . . . . . . . . . . . . . . . . . . . . . . . . . . . . . . . . . . . . . . . . . . . . . 6
Day 4: Suspension and Cable-Stayed Bridges . . . . . . . . . . . . . . . . . . . . . . . . . . . . . . . . . . . . . . 7Suspension Bridges . . . . . . . . . . . . . . . . . . . . . . . . . . . . . . . . . . . . . . . . . . . . . . . . . . . . 7Cable-Stayed Bridges . . . . . . . . . . . . . . . . . . . . . . . . . . . . . . . . . . . . . . . . . . . . . . . . . . . 7
Day 5: Beams and Trusses . . . . . . . . . . . . . . . . . . . . . . . . . . . . . . . . . . . . . . . . . . . . . . . . . . . . . 8Deflection of a Cantilevered Beam Activity . . . . . . . . . . . . . . . . . . . . . . . . . . . . . . . . . . 8
Deflection of a Cantilevered Beam Data Table . . . . . . . . . . . . . . . . . . . . . . . . . 10Teachers Notes . . . . . . . . . . . . . . . . . . . . . . . . . . . . . . . . . . . . . . . . . . . . . . . . . 11
Day 6 : Deflection of a Cantilevered Beam Activity Wrap-up/extension . . . . . . . . . . . . . . . . . . 12Sample Results . . . . . . . . . . . . . . . . . . . . . . . . . . . . . . . . . . . . . . . . . . . . . . . . . . . . . . . 12
Day 9: Distribution of the Load in the Supports of a Beam Bridge . . . . . . . . . . . . . . . . . . . . . . 14Activity on the Distribution of the Load . . . . . . . . . . . . . . . . . . . . . . . . . . . . . . . . . . . . 14
About this Activity . . . . . . . . . . . . . . . . . . . . . . . . . . . . . . . . . . . . . . . . . . . . . . 14Data Collection . . . . . . . . . . . . . . . . . . . . . . . . . . . . . . . . . . . . . . . . . . . . . . . . 14Distribution of the Load Data Table . . . . . . . . . . . . . . . . . . . . . . . . . . . . . . . . . 15Assignment . . . . . . . . . . . . . . . . . . . . . . . . . . . . . . . . . . . . . . . . . . . . . . . . . . . . 16Use graphing paper to make a complete graph. . . . . . . . . . . . . . . . . . . . . . . . . . 16
Day 10: Distribution of the Load in the Supports of a Beam Bridge . . . . . . . . . . . . . . . . . . . . . 18Use a graphing Calculator to Graph your data. . . . . . . . . . . . . . . . . . . . . . . . . . . . . . . . 18Extension Exercise . . . . . . . . . . . . . . . . . . . . . . . . . . . . . . . . . . . . . . . . . . . . . . . . . . . . 21Distribution of the Suspended Load Data Table . . . . . . . . . . . . . . . . . . . . . . . . . . . . . . 21Questions to Think About . . . . . . . . . . . . . . . . . . . . . . . . . . . . . . . . . . . . . . . . . . . . . . 22

iii
Day 11 : Distribution of the Load Activity Wrap-up . . . . . . . . . . . . . . . . . . . . . . . . . . . . . . . . . 23Sample Results . . . . . . . . . . . . . . . . . . . . . . . . . . . . . . . . . . . . . . . . . . . . . . . . . . . . . . . 23
Day 12: Student Truss Bridges . . . . . . . . . . . . . . . . . . . . . . . . . . . . . . . . . . . . . . . . . . . . . . . . 25
Day 13: Deflection of a Bridge . . . . . . . . . . . . . . . . . . . . . . . . . . . . . . . . . . . . . . . . . . . . . . . . 26About this Activity . . . . . . . . . . . . . . . . . . . . . . . . . . . . . . . . . . . . . . . . . . . . . . . . . . . . 26Data Collection . . . . . . . . . . . . . . . . . . . . . . . . . . . . . . . . . . . . . . . . . . . . . . . . . . . . . . 26Deflection of a Beam Bridge Data Table . . . . . . . . . . . . . . . . . . . . . . . . . . . . . . . . . . . 27Deflection of a Truss Bridge Data Table . . . . . . . . . . . . . . . . . . . . . . . . . . . . . . . . . . . . 27Deflection of an Inverted Truss Bridge Data Table . . . . . . . . . . . . . . . . . . . . . . . . . . . . 28Use a graphing Calculator to Graph your data. . . . . . . . . . . . . . . . . . . . . . . . . . . . . . . . 29
Day 14 : Deflection of a Bridge Wrap-up . . . . . . . . . . . . . . . . . . . . . . . . . . . . . . . . . . . . . . . . . 33Sample Results . . . . . . . . . . . . . . . . . . . . . . . . . . . . . . . . . . . . . . . . . . . . . . . . . . . . . . . 33
Day 15: Unit Test . . . . . . . . . . . . . . . . . . . . . . . . . . . . . . . . . . . . . . . . . . . . . . . . . . . . . . . . . . 36
Day 16: Test Rubric . . . . . . . . . . . . . . . . . . . . . . . . . . . . . . . . . . . . . . . . . . . . . . . . . . . . . . . . 40
Proposed Academic Standards for Science, Technology and Mathematics Grade 7 . . . . . . . . . 41
Resources . . . . . . . . . . . . . . . . . . . . . . . . . . . . . . . . . . . . . . . . . . . . . . . . . . . . . . . . . . . . . . . . 43

1
Note to Users
The activities in this handout were developed to be used in the unit on bridges which is outlinedbelow. Only those activities which were developed by the authors are included in this handout. Other activities used in the unit can be found by referring to the resources at the end of thehandout.
Unit Outline
Pre-assignment – Students will do research by collecting pictures and information on atleast three types of bridges.
Day 1:* Introduction to Bridges – Short lecture and picture presentation about bridges. Lecture will include new vocabulary words. Students will assist in classifying thesix main types of bridges. Students will be given a list of websites to be usedduring the unit.
Day 2:* Students will be asked to read about and discuss the structure of bridges and inparticular discuss the Tacoma Narrows Bridge, a structure that failed.
Day 3: Student Activity: Students will construct a model bridge and explore how theconstruction affects safety and efficiency of materials.
Day 4:* Activity recap and short lecture about Suspension and Cable-Stayed Bridges andthree kinds of Forces – Tensile, Compressive and Shear Force.
Day 5:* Short lecture on beams and trusses. Group Hands-on-activity introducing theconcept of deflection. Students will set up the apparatus, collect and record dataduring class. As an assignment, students will make a graph. They will model thedata in a table, then on a graph.
Day 6:* Activity wrap-up. Students will discuss the mathematics (linear relationship)between defection and force.
Day 7: Short lecture on strength of materials. Student activity to test for strong shapes,and lamination. Students will set up the apparatus, collect and record data duringclass. As an assignment, students will make a graph by plotting their results.
Day 8: Activity wrap-up. Students will discuss the mathematics involving the laminationactivity.
Day 9:* Activity on the distribution of the load in the supports of a beam bridge. Studentswill set up the apparatus, collect and record data during class. As an assignment,students will make a graph by plotting their results.

2
Day 10:* Students will use the graphing calculator to graph and analyze their data. Studentswill perform an extension exercise.
Day 11:* Activity wrap-up. Students will discuss the mathematics involved in the Beamactivity.
Day 12:* Students will construct a Truss Bridge.
Day 13:* Activity on the deflection of a beam and truss bridges. Students will set up theapparatus, collect and record data during class. As an assignment, students willmake a graph by plotting their results.
Day 14:* Activity wrap-up. Students will discuss the mathematics involved in the TrussBridge. Unit Review.
Day 15:* Unit Test.
Day 16:* Test Rubric.
*Note: Activities developed by the authors and included in this handout.
Assessment
Students’ understanding of Unit objectives will be assessed by :
Homework assignmentsIn-class group activitiesDemonstration of student constructed Bridge ModelEnd of Unit Activity ProjectsUnit Test
Web Sites
Information on bridges:
http://library.thinkquest.orghttp://www.iit.edu/~hsbridge/http://www.howstuffworks.com/http://bridgepros.com/learning_center/http://www.pbs.org/wgbh/nova/bridge/

3
Day 1: Structure of Bridges
Bridges span history and have been built, burned, defended, crossed and celebrated bykings, queens and athletes, as well as by those who commute to work each day. People have beenfascinated with bridges and their power to bring together what had been separate. Their manysizes and silhouettes reflect the unfolding of mankind’s knowledge of technology.
Bridge is a structure used by people and vehicles to cross areas that are obstacles to travel. Engineers have built over lakes, rivers, canyons, busy highways and railroad tracks. Withoutbridges, people would need boats to cross waterways.
Bridges range in length from a few feet or meters to several miles or kilometers. Bridgesmust be strong enough to support their own weight as well as the weight of the people andvehicles that use them. They also must resist natural occurrences, including earthquakes, strongwinds, and change in temperature. Most modern bridges have a concrete roadway. The roadwayis the part of a bridge on which people and vehicles travel.
Most bridges are held up by at least two supports set in the ground. The distance betweentwo adjacent supports is called a SPAN of a bridge. The supports at each end of the bridge arecalled ABUTMENTS, and the supports that stand between the abutments are called PIERS. Thetotal length of the bridge is the distance between the abutments. Most short bridges aresupported only by abutments and are known as SINGLE-SPAN BRIDGES. Most long bridgesare multi-span bridges. The MAIN-SPAN is the longest span of a multi-span bridge.
The six main kinds of bridges are: (1) girder bridges, (2) truss bridges, (3) arch bridges,(4) cantilever bridges, (5) suspension bridges, and (6) cable-stayed bridges.
Girder Bridges, which include many highway bridges, aremade of beams called girders whose ends simply rest on piers orabutments. The span length of girder bridges ranges up to 1,000feet (300 meters)
Truss Bridges are supported by frameworks calledTRUSSES. The parts of the trusses are arranged in the form oftriangles. Such bridges are built over canyons, rivers, and otherareas. A truss bridge may have a main span that extends morethan 1,000 feet (300 meters). The simplest truss consists of threeparts fastened together at their ends to form a triangle.
Arch Bridges are structures in which each span forms an arch. The spans range up to about 1,700 feet (518 meters) long. Thearch bridge is one of the oldest types of bridges. Early archbridges consisted of large stone blocks wedged together to forman arch.

4
Photo by Steven Richmanhttp://www.richmangalleries.com
Photo by Steven Richmanhttp://www.richmangalleries.com
Cantilever Bridges consist of two independent beams calledCANTILEVERS that extend from opposite banks of a waterway. The two cantilevers are joined together above the middle of thewaterway by a beam, girder, or truss. Cantilever bridges mayhave spans as along as about 1,800 feet (549 meters). Manycantilever bridges have truss frameworks.
Suspension Bridges are perhaps the most impressive type ofbridge because of their long main span and especially attractiveappearance. These bridges have a roadway that hangs from steelcables that are supported by two high towers. Most suspensionbridges have a main span more than 1,000 feet (300 meters) long. Some have a main span longer than 4,000 feet (1,200 meters).
Cable-Stayed Bridges are different from suspension bridges, theircables are more taut than the flexible cables of suspension bridges. They offer greater stiffness over that of suspension bridges. Cable-stayed bridges are economical for medium spanapplications in the 500 feet (150 meters) to 3,000 feet (900meters) range.
Vocabulary Words
Bridge A structure spanning and providing passage over a waterway, railroad, orother obstacle.
Span The extent or measure of space between two points or extremities, as of abridge
Abutments A structure that supports the end of a bridge; a structure that anchors thecables of a suspension bridge; that part of a structure that bears the weightor pressure of an arch.
Piers A supporting structure at the junction of connecting spans of a bridge.
Single-span bridges Short bridges supported only by abutments.
Multi-span bridges Long bridges with a main-span.
Main span Longest span of a multi-span bridge.
Girder bridges Horizontal beams used as a main support for the structure.
Truss Bridges Supported by frameworks called trusses.
Arch Bridges Structures in which each span forms an arch.

5
Cantilever bridges Bridges formed by two projecting beams or trusses that are joined in thecenter by a connecting member.
Suspension bridges Bridges having the roadway suspended from cables that are usuallysupported by towers.
Cable-Stayed bridges Bridges having the roadway suspended from taught cables that are usuallysupported by towers.

6
Day 2: Structure of Bridges
All structures, whether natural or artificial, must be designed to withstand potentiallydestructive forces. Valuable information about designing structures can be learned from studyingthose structures that have failed and those that have survived.
The Tacoma Narrows Bridge collapsed on November 7, 1940. It spanned 853 metersacross Puget Sound, thirty miles south of Seattle. It had been open only four months. When itopened, the bridge’s deck undulated so much, harmless, it was thought, that thrill seekers soughtit out to experience the roller coaster like ride across. Many people went miles out of their wayto avoid “Galloping Gertie” as the bridge was nicknamed. The Tacoma Narrows span with aroadway, at thirty-nine feet (12 meters), was exceptionally narrow. It was supported by shallowplate girders instead of traditional deep, stiffening trusses was economical and elegant. Thebridge had been designed to withstand winds of 195 km/h, but was destroyed by a wind of only65.6km/h.
The wind caused the deck of the bridge to move up and down in a wavelike motion. Thedistance between the crest and trough of these “waves” eventually reached 9m. After severalhours, the deck began to twist back and forth until some of the suspending cables snapped,plunging part of the bridge into the water. No lives were lost since the bridge was closed after itstarted to sway.
The bridge failed because the design did not provide a structurally stiff frame to resistmoderate winds.
The bridge was well constructed. The design was largely at fault.
The materials were not inferior, but they were too light. At the time, it was believed byengineers that the structure of an expansion bridge should be kept light so that the size of thecables could be minimized.
Wind and the oscillations of the deck of the bridge were the main factors in causing thebridge to collapse.
The main change brought about by this failure was to design a stiffer and heavier deck thatis resistant to twisting and to lateral deflection.
The new Tacoma Bridge is built with a warren girder to keep it stable.
Students will discuss the structure of bridges from the collection of pictures they have andalso discuss the possibilities of any structure that could collapse and give the specific reasons.
Student assignment: Write six sentences about one of the bridges they have found andgive the structure of the bridge and why they chose that particular bridge.

7
Day 4: Suspension and Cable-Stayed Bridges
Suspension Bridges
A suspension bridge is characterized by a cable or series of cables that carry thedownward forces to the supports and then down to the ground.
The majestic Golden Gate Bridge is synonymous not only with the San Francisco Bay areabut with large-scale suspension bridges. It has a total length of 8,981 feet (2737 meters).
The main support members are parallel cables strung overtowers that run the length of the bridge and are anchored at eitherend. The deck is supported by suspenders that are hung from themain cables. The weight of the bridge is supported by the cables,which are in tension, a pull withstood by their anchorage, and thetowers, which are in compression.
Cable-stayed Bridges
A typical cable-stayed bridge is similar to a suspension in that it is constructed from acontinuous girder which is supported by cables. With the cable-stayed bridge however, there areone or two towers erected above piers in the middle of the span instead of a tower at each end ofthe span.. From these piers, cables are attached diagonally to the girder to provide additionalsupport. The tops of the towers act as the anchor. The weight of the bridge is supported by thecables, which are in tension, a pull withstood by their anchorage at the top of the each tower, andthe towers, which are in compression.
Cables for suspension bridges and cable-stayed bridges are made up of strands consistingof thousands of fine wires that have a much higher tensile strength than thicker rods of the sameoverall cross sections.
There are three types of forces that act on bridges:Tensile – causes a material to stretch or pull apart.Compressive – causes material to become more compact and pressed together.Shear – causes bending or twisting in a material.

8
Day 5: Beams and Trusses
Beams are used to span the space between two points. They are used to hold up loads. Beams may be made in different shapes. For the same amount of material, an I-beam has greaterrigidity and strength than does a simple beam. A girder beam bridge is essentially a trussed beam. The beam rests on supports that carry the downward forces to the ground. The crossed membersof the girder provide strength against shear forces.
Girder bridges, which include many highway bridges, are made of beams called girderswhose ends simply rest on piers or abutments. The span length of a girder bridge ranges up toabout 1,000 feet(300 meters).
Truss bridges are supported by frameworks called trusses. The parts of the trusses arearranged in the form of triangles. Such bridges are built over canyons, rivers, and other areas. Atruss bridge may have a main span that extends more than 1,000 feet (300 meters). The simplesttruss consists of three parts fastened together at their ends to form a triangle.
A cantilever is a simple beam that is fixed at one end. Cantilever bridges consists of twoindependent beams called cantilevers that extend from opposite banks of a highway. The twocantilevers are joined together above the middle of the waterway by a beam, girder or truss.Cantilever bridges may have spans as long as about 1,800 feet (549 meters). Many cantileverbridges have truss frameworks.
Deflection of a Cantilevered Beam Activity
Deflection – the amount that a material bends when a force is applied to it.
Materials:Thin, narrow, and long piece of wood (like a meter stick)Meter stick for measuringClamps or books (to fasten the wood to the end of a desk)Set of standard massesStringScissors
Procedure:1. Prepare the data table.2. Place a meter stick on the desk.3. Position the meter stick so that at least 50 cm. of the stick hangs over the edge of
the desk. (Each team may select a different overhang)4. Using a clamp, secure the meter stick to the desk.5. Record the mass of 0 as the first mass into the table.6. Measure the height of the free end of the meter stick above the floor, using either
the top or the bottom of the stick.

9
7. Record this measurement into the column height of the end without a mass.8. Record this measurement into the table as the first height of end with mass (mass
of 0.)9. Add a mass to the free end of the meter stick using a string.10. Record the mass into the table as the next mass.11. Measure the height of the weighted end of the meter stick using same the reference
as in step 6 (top or bottom.)
12. Record this measurement into the table as the next height of end with mass.13. Fill in the deflection entry by subtracting the height of end with mass entry from
the height of end without mass entry.14. Repeat steps 9 through 13 for several masses.

10
Deflection Data Table
Names:
Date:
Overhang: cm.
mass (g). deflection (cm.) height of end withoutmass (cm.)
height of end withmass (cm.)

11
Teacher Notes
Assignment:
Students will graph the results – the vertical axis represents deflection and the horizontalaxis represents force (weight).
Students will discuss the pattern of the points in the graph. They should recognize thatthe points form a linear pattern:
Using a straight edge, students will draw a “fit” line through these points.
Class results from different overhang amounts will be compared and discussed.
Students should conclude that although all graphs had linear patterns, the slopes of the“fit” lines were different when the overhangs were different. Students should concludethat for the same mass, the deflection is less when the overhang is less; therefore, the slopeof the “fit” line decreases as the overhang decreases.
Conclusion:
Students’ graphs should show that deflection is proportional to the applied force. Theamount of deflection is the same for each equal increment of force that is applied.

12
Deflection of a Cantilevered Beam Activity 80 cm. Overhang
0.0
5.0
10.0
15.0
20.0
0.0 100.0 200.0 300.0 400.0 500.0 600.0 700.0 800.0
mass (g.)
Def
lect
ion
(cm
.)Day 6 : Deflection of a Cantilevered Beam Activity Wrap-Up/Extension
If the length of the wood over the edge of the desk was shorter, what difference in resultswould you expect? Test your prediction by repeating the experiment – clamping the piece ofwood at a different position. Plot the new data on the same graph.
Sample Results:
80 cm. Overhangmass (g.) deflection
(cm.)height ofend withoutmass (cm.)
height ofend withmass (cm.)
0.0 0.0 88.5 88.5125.0 2.5 88.5 86.0250.0 5.0 88.5 83.5375.0 7.0 88.5 81.5500.0 10.5 88.5 78.0625.0 13.0 88.5 75.5750.0 15.5 88.5 73.0
13
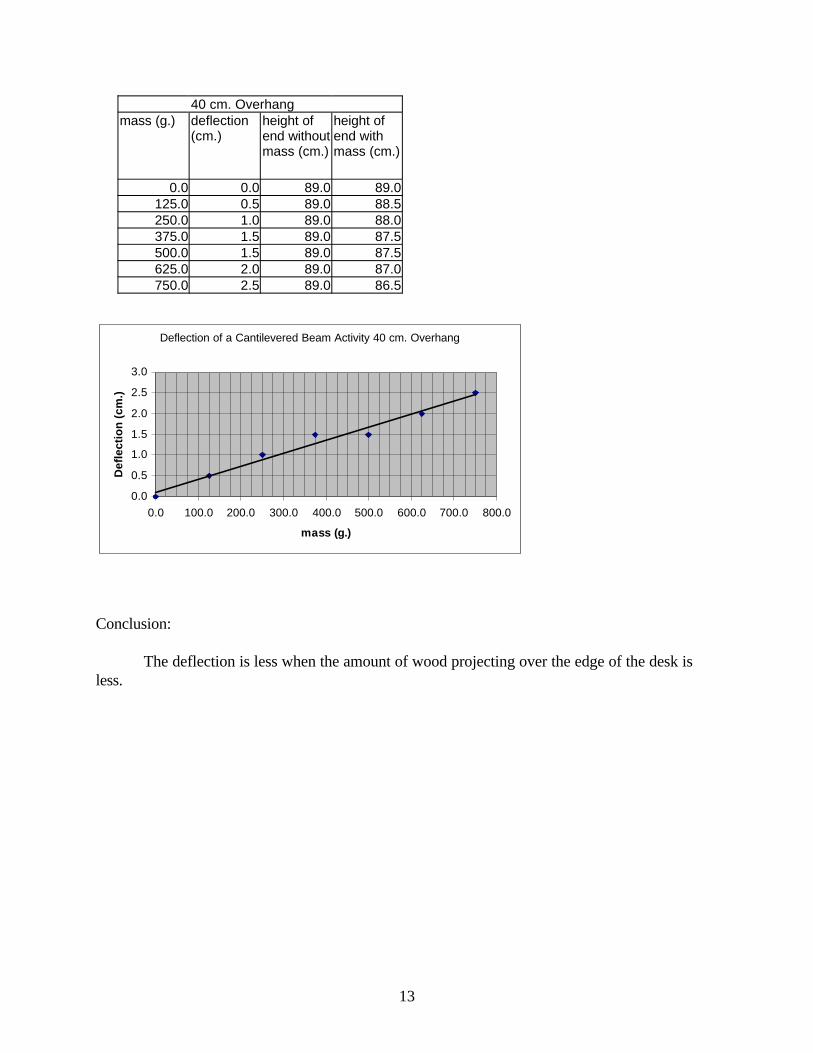
Deflection of a Cantilevered Beam Activity 40 cm. Overhang
0.0
0.5
1.0
1.5
2.0
2.5
3.0
0.0 100.0 200.0 300.0 400.0 500.0 600.0 700.0 800.0
mass (g.)
Def
lect
ion
(cm
.)40 cm. Overhang
mass (g.) deflection(cm.)
height ofend withoutmass (cm.)
height ofend withmass (cm.)
0.0 0.0 89.0 89.0125.0 0.5 89.0 88.5250.0 1.0 89.0 88.0375.0 1.5 89.0 87.5500.0 1.5 89.0 87.5625.0 2.0 89.0 87.0750.0 2.5 89.0 86.5
Conclusion:
The deflection is less when the amount of wood projecting over the edge of the desk isless.
14
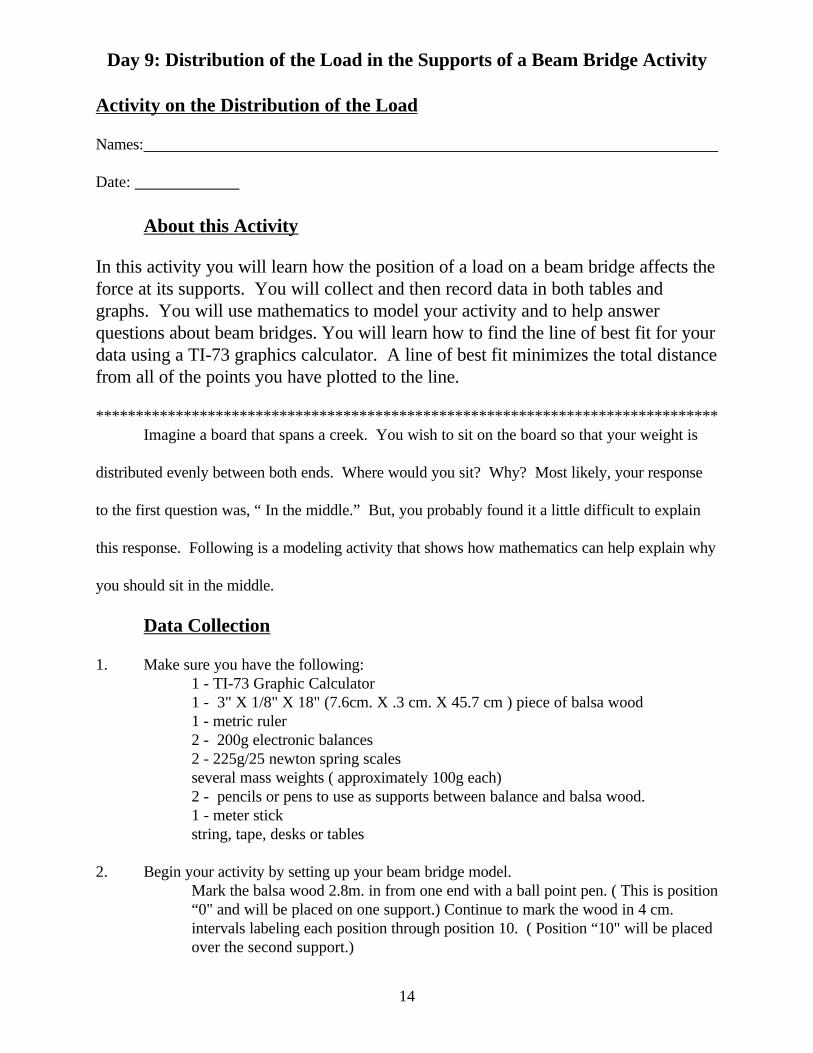
Day 9: Distribution of the Load in the Supports of a Beam Bridge Activity
Activity on the Distribution of the Load
Names:
Date:
About this Activity
In this activity you will learn how the position of a load on a beam bridge affects theforce at its supports. You will collect and then record data in both tables andgraphs. You will use mathematics to model your activity and to help answerquestions about beam bridges. You will learn how to find the line of best fit for yourdata using a TI-73 graphics calculator. A line of best fit minimizes the total distancefrom all of the points you have plotted to the line.
******************************************************************************Imagine a board that spans a creek. You wish to sit on the board so that your weight is
distributed evenly between both ends. Where would you sit? Why? Most likely, your response
to the first question was, “ In the middle.” But, you probably found it a little difficult to explain
this response. Following is a modeling activity that shows how mathematics can help explain why
you should sit in the middle.
Data Collection
1. Make sure you have the following:1 - TI-73 Graphic Calculator1 - 3" X 1/8" X 18" (7.6cm. X .3 cm. X 45.7 cm ) piece of balsa wood1 - metric ruler2 - 200g electronic balances2 - 225g/25 newton spring scalesseveral mass weights ( approximately 100g each)2 - pencils or pens to use as supports between balance and balsa wood.1 - meter stickstring, tape, desks or tables
2. Begin your activity by setting up your beam bridge model.Mark the balsa wood 2.8m. in from one end with a ball point pen. ( This is position“0" and will be placed on one support.) Continue to mark the wood in 4 cm.intervals labeling each position through position 10. ( Position “10" will be placedover the second support.)
15
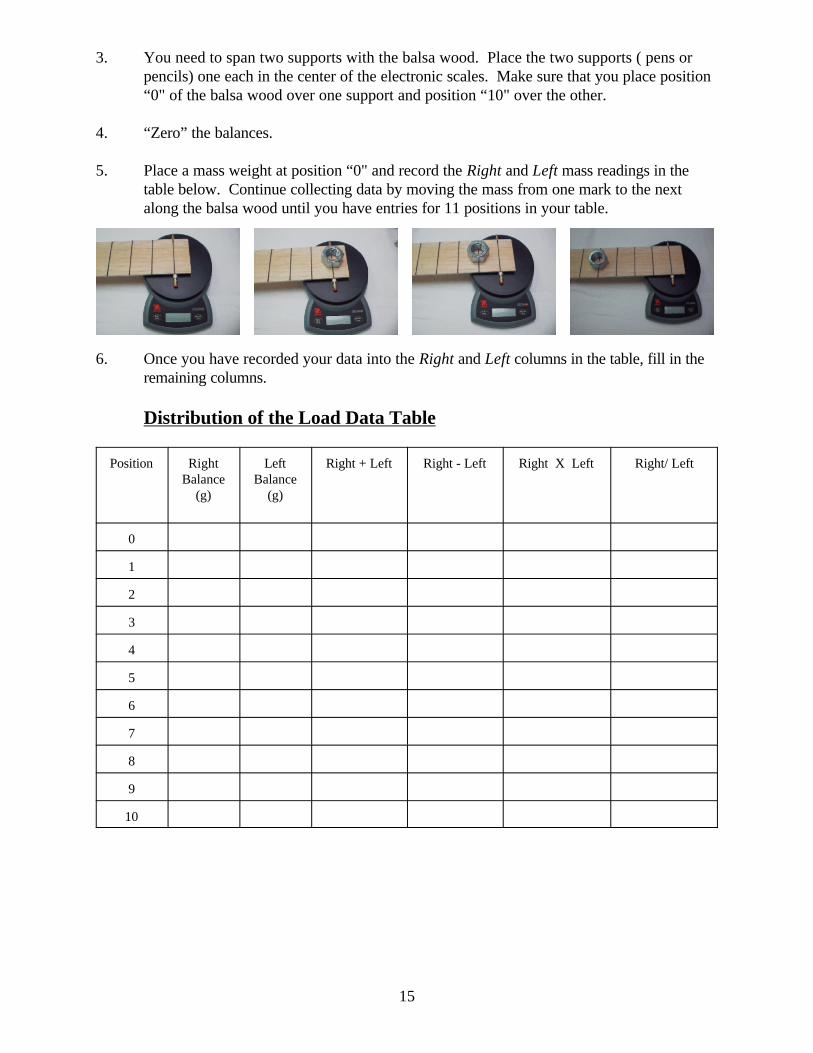
3. You need to span two supports with the balsa wood. Place the two supports ( pens orpencils) one each in the center of the electronic scales. Make sure that you place position“0" of the balsa wood over one support and position “10" over the other.
4. “Zero” the balances.
5. Place a mass weight at position “0" and record the Right and Left mass readings in thetable below. Continue collecting data by moving the mass from one mark to the nextalong the balsa wood until you have entries for 11 positions in your table.
6. Once you have recorded your data into the Right and Left columns in the table, fill in theremaining columns.
Distribution of the Load Data Table
Position RightBalance
(g)
LeftBalance
(g)
Right + Left Right - Left Right X Left Right/ Left
0
1
2
3
4
5
6
7
8
9
10

16
Assignment
Once the table is completed answer the following:
1. There should be a pattern between the numerical entries in the Right Balance and LeftBalance Columns, What is it?
2. What does this pattern allow you to conclude about the force and load on beam bridges?
3. Which other columns seem to generate interesting patterns?
4. What do you think these patterns are telling you about the load and force on beambridges?
5. How can you use your table to predict the location where the load is distributed evenlybetween both supports?
Use graphing paper to make a complete graph Let Right Balance (g) be the independent value or x-axis heading, and let Left Balance (g) be thedependent value or y - axis heading. You will receive points for labeling the axes with theappropriate headings (not x and y). You should give your graph a title. Make sure that you labelenough information so that the scale(s) that you use on the axes is/are evident.
Once you have constructed the graph, answer the following:
1. What type of curve relates the Right Balance reading to the Left Balance Reading? Choose a “fit curve”: Line Parabola Circle
Try to pencil in a “fit curve” onto your graph based on your selection above. Your “fit curve”should be as close to as many of your points as possible. ( It probably won’t go through all ofyour points.)
Choose any two pairs of Right and Left Balance data from your table and fill the information forthe two related points here:
( , ) ( , )
Remember that given any two points on a line that is not vertical, you can calculate the slope ofthe line by calculating the difference of the “y” values over the difference of the “x” values. Youcan use these two points to approximate the slope of your line.
2. Calculate the slope of your line here:

17
Remember that the y-intercept of a graph occurs when the x coordinate is zero.
3. What is your y- intercept?
4. At which position was the mass weight when you collected data that was close to the y -intercept?
5. At which position was the mass weight when you collected data that was close to the x-intercept?

18
Day 10: Distribution of the Load in the Supports of a Beam Bridge Activity
Use a graphics calculator to graph your data
1. Turn on your graphics calculator.
To Enter your Data from a Table:
2. Select .LIST
3. Use the arrow keys to highlight L1 and select .Clear Enter
4. Use the arrow keys to highlight L2 and select .Clear Enter
5. Move to the first cell under L1 and enter your right scale values.
6. Select the right arrow key to move to L2, and enter your related left scale values.
Press when done.2nd QUIT
To Turn on a Plot:
7. Select and use the arrow keys to highlight 1.2nd PLOT
8. Select . ENTER
9. Using the arrow keys and the key, make sure that Plot 1 is turnedENTER
On, and choose to make a Scatter Plot. By default, Xlist is L1 and Ylist is L2. Choose any Mark type that you wish.
10. Select and make sure all other plots are turned off ( use2nd PLOT
steps 8 and 9 above if necessary.) Press when done.2nd QUIT
To See a Plot:
11. Press and use and the arrow keys to clear old equations.Y= CLEAR
12. Press and the select 7 to see all of the points from yourGRAPH ZOOM
table.

19
To Make a Manual Fit Line:
13. Select CALC and select 3 for Manual-Fit .2nd STAT
14. Move the cursor to the upper left to begin your fit line and select toENTER
tie down a point on the line.
15. Using the arrow keys continue the line segment and then select to tieENTER
down the second point, your manual-fit line is drawn.
16. What is the equation of the line of manual-fit? y = (as itappears on your calculator screen.)
17. You may move the arrow keys to move the line until you select . Enter
To Make a Fit Line Using a Linear Regression:
18. Select CALC and select 5 for a Linear Regression.2nd STAT
19. Select select 2, 1, to place your fit equation2nd VARS ENTER
into the Y1 equation.
20. a = b =
21. Select Y=
22. What is the equation of the line of best fit? Y1 = (as itappears on your calculator screen.)
23. What is the y-intercept of the line of best fit?This number should be close to representing something you used when measuring. What is it?
24. What is the slope of the line of best fit?
25. What does x represent in this problem?
26. Which number values make sense for x and why?
27. What does y represent in this problem?
28. Which number values make sense for y and why?

20
30. Select GRAPH
To Zoom In:
31. Press then select 2ZOOM
Describe how the calculator graph compares with your hand drawn graph for this activity anddescribe how are the two graphs different?
Now once again, imagine a board that spans a creek. You wish to sit on the board so that yourweight is distributed evenly between both ends. Where would you sit? Why?

21
Extension Exercise
1. Begin your activity by setting up your beam bridge model.Using the balsa wood from the previous activity, you need to span two springscales hung from a meter stick. Use string and tape to support the balsa woodfrom the scales. One string supports should be placed at position “0" of the balsawood the support at position “10".
2. “Zero” the scales.
3. Place your mass weight at position “0" and record the Right and Left mass readings in thetable below. Continue collecting data by moving the mass from one mark to the nextalong the balsa wood until you have entries for 11 positions in your table.
4. Once you have recorded your data into the Right and Left columns in the table, fill in theremaining columns
Distribution of the Suspended Load Data Table
Position RightScale(g)
LeftScale
(g)
Right + Left Right - Left
0
1
2
3
4
5
6
7
8
9
10
What generalization can you make about force distribution and supports whetherattached above or below a beam bridge?

22
Questions to Think About
You and a friend each hold the end of a pole. On the pole is a pail of sand.
1. Where would you place the pail so that you support less of the load?
2. If the pail is “stuck” in the center of the pole, what could you do to support more of theload?
3. The force exerted by the box on the beam bridge is 15 N.
What is the force supported by end support A ?
What is the force supported by end support B ?
4. The force exerted by the box on the beam bridge is 8 N.
The force supported by end support A is 2 N.
What is the distance X ?
What is the force supported by end support B ?

23
Distribution of the Load Activity (scales)
0.020.040.060.080.0
100.0120.0140.0
0.0 20.0 40.0 60.0 80.0 100.0 120.0 140.0
Right Scale (g.)
Lef
t S
cale
(g
.)
Day 11 : Distribution of the Load Activity Wrap-up
Sample Results:
Beam Activity (scales)RightScale (g.)
Left Scale(g.)
Positionfrom rightend (cm.)
124.7 0.6 0.0113.5 11.7 4.0101.8 23.5 8.090.8 34.5 12.079.0 46.2 16.068.1 57.4 20.056.8 68.7 24.044.8 80.4 28.034.3 91.0 32.022.5 103.0 36.010.3 115.2 40.00.2 125.1 44.0

24
Distribution of the Load Activity (spring scales)
0.0
20.0
40.0
60.0
80.0
100.0
120.0
140.0
0.0 20.0 40.0 60.0 80.0 100.0 120.0 140.0 160.0
Right Scale (g.)
Lef
t S
cale
(g
.)
Beam Activity (spring scales)RightScale (g.)
Left Scale(g.)
Positionfrom rightend (cm.)
145.0 0.0 0.0130.0 5.0 4.0120.0 15.0 8.0110.0 30.0 12.095.0 40.0 16.080.0 60.0 20.070.0 55.0 24.055.0 60.0 28.040.0 85.0 32.030.0 100.0 36.015.0 110.0 40.00.0 115.0 44.0

25
Day 12: Student Truss Bridges
Students will work with a partner and construct a truss bridge.
Students will be given a Ziploc bag with the following contents:30 popsicle sticks (hole drilled at each end)9 lollipop sticks – 4 in.9 straws – 3 in. length9 rubber bands1 3" X 1/8" X 18" (7.6cm. X .3 cm. X 45.7 cm ) piece of balsa wood
Students will see a completed truss bridge and construct one like the model.
When the bridges are completed, students will compare the models.

26
Day 13: Deflection of a Bridge Activity
Names:
Date:
About this Activity
In this activity, you will learn how the addition of a truss structure affects thedeflection. You will also explore trusses that are attached above and below a beambridge. You will collect and then record data in tables in order help answerquestions about truss bridges
******************************************************************************Data Collection
1. Make sure you have the following:1 - Truss Bridge Model from the Truss Bridge Activity1 - Metric RulerSeveral Mass Weights ( approximately 100g each)2 - Pencils or Pens to use as supports between support and balsa wood.2 - Wooden Block Supports
2. Begin your activity by using only the beam bridge model portion of the truss bridge.
3. You need to span two block supports with the balsa wood. Make sure that you placeposition “0" of the balsa wood over one support and position “10" over the other.
4. Place a mass weight in the center of the beam bridge and record the mass, height withoutthe mass, and deflection in the table below. Continue collecting data by adding enoughmass until you have entries for 6 positions in your table.

27
Deflection of a Beam Bridge Data Table
No Truss
Mass(g)
Heightw/o mass
(cm.)
Heightwith mass
(cm.)
Deflection(cm.)
0
5. Repeat the data collection for the truss bridge. Use the same mass entries as those in thefirst table.
Deflection of a Truss Bridge Data Table
Truss
Mass(g)
Heightw/o mass
(cm.)
Heightwith mass
(cm.)
Deflection(cm.)
0

28
6. Repeat the data collection for the inverted truss bridge. Use the same mass entries asthose in the first table.
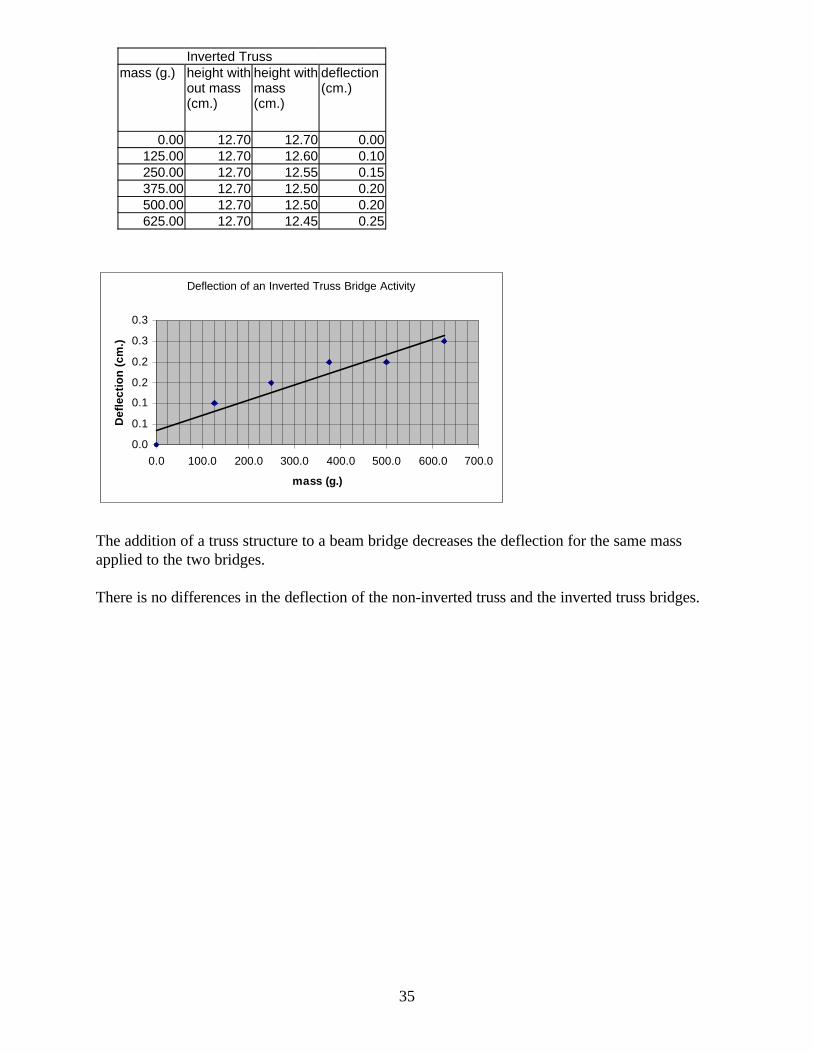
Deflection of an Inverted Truss Bridge Data Table
Inverted Truss
Mass(g)
Heightw/o mass
(cm.)
Heightwith mass
(cm.)
Deflection(cm.)
0
7. Explain how a truss structure affects the deflection of a bridge.
8. Does there seem to be a difference in the deflection between the non-inverted and invertedtruss bridge?

29
Use a graphics calculator to graph your data
1. Turn on your graphics calculator, Select arrow down to Float and use theMODE
right arrow to highlight 5 and . Press when done.ENTER 2nd QUIT
To Enter your Data from a Table:
2. Select .LIST
3. Use the arrow keys to highlight L1 and select .Clear Enter
4. Use the arrow keys to highlight L2 and select .Clear Enter
5. Move to the first cell under L1 and enter your mass data.
6. Select the right arrow key to move to L2, and enter your data for deflection of a
beam bridge . Press when done.2nd QUIT
To Turn on a Plot:
7. Select and use the arrow keys to highlight 1.2nd PLOT
8. Select . ENTER
9. Using the arrow keys and the key, make sure that Plot 1 is turnedENTER
On, and choose to make a Scatter Plot. By default, Xlist is L1 and Ylist is L2. Choose any Mark type that you wish.
10. Select and make sure all other plots are turned off ( use2nd PLOT
steps 8 and 9 above if necessary.) Press when done.2nd QUIT
To See a Plot:
11. Press and use and the arrow keys to clear old equations.Y= CLEAR

30
12. Press and the select 7 to see all of the points from yourGRAPH ZOOM
table.
To Make a Manual Fit Line:
13. Select CALC and select 3 for Manual-Fit .2nd STAT
14. Move the cursor to the upper right to begin your fit line and select toENTER
tie down a point on the line.
15. Using the arrow keys continue the line segment and then select to tieENTER
down the second point, your manual-fit line is drawn.
16. What is the equation of the line of manual-fit? y = (as itappears on your calculator screen.)
17. You may move the arrow keys to move the line until you select . Enter
To Make a Fit Line Using a Linear Regression:
18. Select CALC and select 5 for a Linear Regression.2nd STAT
19. Select select 2, 1, to place your fit equation2nd VARS ENTER
into the Y1 equation.
20. a = b =
21. Select Y=
22. What is the equation of the line of best fit? Y1 = (as itappears on your calculator screen.)
23. What is the y-intercept of the line of best fit?
24. What is the slope of the line of best fit?
25. What does x represent in this problem?
26. Which number values make sense for x and why?

31
27. What does y represent in this problem?
28. Which number values make sense for y and why?
30. Select GRAPH
Repeat the process for the truss bridge data using Lists 1 and 3 for StatPlot2 and the invertedtruss bridge data using lists 1 and 4 and StatPlot 3. ( You may skip the manual fit for these twosets of data.)
To Enter your Truss and Inverted Truss Data from a Table:
2. Select .LIST
3. Use the arrow keys to highlight L3 and enter your deflection data for Trussbridge.
4. Use the arrow keys to highlight L4 and enter your deflection data for InvertedTruss bridge
5. Press when done.2nd QUIT
To Turn on a Plot:
7. Select and use the arrow keys to highlight 2.2nd PLOT
8. Select . ENTER
9. Using the arrow keys and the key, make sure that Plot 2 is turnedENTER
On, and choose to make a Scatter Plot. By default, Xlist is L1.
10. Arrow down to Ylist. Select 3 to use List 3. 2nd Stat ENTER
Use any Mark type that you wish.
7. Select and use the arrow keys to highlight 3.2nd PLOT
8. Select . ENTER
9. Using the arrow keys and the key, make sure that Plot 3 is turnedENTER
On, and choose to make a Scatter Plot. By default, Xlist is L1.

32
A)
B)
10. Arrow down to Ylist Select 4 to use List 4. 2nd Stat ENTER
Use any Mark type that you wish.
10. Select 2nd PLOT
11. Select GRAPH
12. If you look carefully, you should see three scatter plots in your viewing window. Use them to answer the following:A) If the mass is constant, is there a significant difference in deflection between atruss that is above or one that is below the beam bridge? Explain.B)How does the use of a truss affect the deflection of a beam bridge? Explain.

33
Deflection of a Beam Bridge Activity
0.0
0.5
1.0
1.5
2.0
2.5
3.0
0.0 100.0 200.0 300.0 400.0 500.0 600.0 700.0
mass (g.)
Def
lect
ion
(cm
.)
Day 14 : Deflection of a Bridge Wrap-up
Sample Results:
No Truss
mass (g.) height without mass(cm.)
height withmass(cm.)
deflection(cm.)
0.00 6.00 6.00 0.00125.00 6.00 5.50 0.50250.00 6.00 5.00 1.00375.00 6.00 4.60 1.40500.00 6.00 3.80 2.20625.00 6.00 3.40 2.60

34
Deflection of a Truss Bridge Activity
0.0
0.1
0.2
0.3
0.4
0.5
0.0 100.0 200.0 300.0 400.0 500.0 600.0 700.0
mass (g.)
Def
lect
ion
(cm
.)
Trussmass (g.) height with
out mass(cm.)
height withmass(cm.)
deflection(cm.)
0.00 12.50 12.50 0.00125.00 12.50 12.40 0.10250.00 12.50 12.30 0.20375.00 12.50 12.20 0.30500.00 12.50 12.15 0.35625.00 12.50 12.10 0.40
35
Deflection of an Inverted Truss Bridge Activity
0.0
0.1
0.1
0.2
0.2
0.3
0.3
0.0 100.0 200.0 300.0 400.0 500.0 600.0 700.0
mass (g.)
Def
lect
ion
(cm
.)
Inverted Trussmass (g.) height with
out mass(cm.)
height withmass(cm.)
deflection(cm.)
0.00 12.70 12.70 0.00125.00 12.70 12.60 0.10250.00 12.70 12.55 0.15375.00 12.70 12.50 0.20500.00 12.70 12.50 0.20625.00 12.70 12.45 0.25
The addition of a truss structure to a beam bridge decreases the deflection for the same massapplied to the two bridges.
There is no differences in the deflection of the non-inverted truss and the inverted truss bridges.

36
Day 15: Unit Test
BRIDGES
NAME ___________________________________ Date ____________
1. Choose and define 5 words from the list: bridge, span, pier, cantilever, suspension, truss,arch.
a. _____________________________________________________
b. _____________________________________________________
c. _____________________________________________________
d. _____________________________________________________
e. _____________________________________________________
2. Write a sentence that explains the effect each of these forces has on an object.
a. tension ______________________________________________
b. compression __________________________________________
c. shearing _____________________________________________
3. Name the 5 types of bridges, give a description of each and sketch each type.
a. ___________________________________________________
b. ____________________________________________________
c. ____________________________________________________
d. ____________________________________________________
e. ____________________________________________________
SKETCHES:

37
4. Use the terms: collapse, shear force, and structure in a sentence or two about the TacomaNarrows Bridge. Why did it fail?
5. Why is an arch stronger than a simple beam? Explain.
6. Why is an I-beam stronger than a simple beam? Explain.
7. What did you learn from the unit on bridges? What activity did you enjoy doing the most andwhy?

38
8. The force exerted by the box on the beam bridge is 12 N.
What is the force supported by end support A ?
What is the force supported by end support B ?
9. The force supported by end support B is 10 N.
What is the force exerted by the box on the beam bridge ?
What is the force supported by end support A ?

39
Bonus. The force supported by end support A is 10 N.
The force supported by end support B is 25 N.
The total length of the beam bridge is 700 cm.
What is the distance of X1 ?
What is the distance of X1 ?

40
Day 16: Test Rubric
Unit on Bridges – Grade 7
LEVEL A- This response offers clear and convincing evidence of a clear knowledge of bridges related to tasks.
Characteristics:
- All activities are completed and correct. - Assigned homework is completed.- Charts, graphs, mathematical concepts are understood.- Knowledge of the subject is shown through class discussion/participation.
LEVEL B – This response offers evidence of substantial knowledge of bridges related to tasks.
Characteristics:
- All activities are completed and correct.- Assigned homework is completed.- Charts, graphs are completed, mathematical concepts not understood completely.- Knowledge of the subject is not shown through class discussion/participation.
LEVEL C - This response offers limited and inconsistent evidence of knowledge of bridgesrelated to the tasks.
Characteristics:
- Some activities are completed and correct.- Assigned homework is complete.- Charts, graphs are partially completed, mathematical concepts are not understood.- Knowledge of the subject is not shown through class discussion/participation.
LEVEL D - This response offers little or no evidence of knowledge of bridges related to thetasks.
Characteristics:
- Student does not complete the activities.- Homework is incomplete.- Charts, graphs are incomplete, very little knowledge on the mathematical concepts.- Student has some knowledge on bridges, does not participate in class discussion.

41
Proposed Academic Standards for Science, Technology and MathematicsGrade 7
3.1 Unifying ThemesB. Describe the use of models as an application of scientific or technological
concepts.- Identify and describe different types of models and their functions.- Apply models to predict specific results and observations.- Design a model that illustrates its function.
C. Identify patterns as repeated processes or recurring elements in science andtechnology.- Identify different forms of patterns and use them to group and classify
specific objects.- Identify repeating structure patterns.- Identify and describe patterns that occur in physical systems (construction).
D. Explain scale as a way of relating concepts and ideas to one another by somemeasure- Apply various applications of size and dimensions of scale to scientific,
mathematical, and technological applications.
3.2 Inquiry and DesignA. Explain and apply scientific and technological knowledge.
- Answer “What if” questions based on observation, inference or priorknowledge or experience.
B. Apply process knowledge to make and interpret observations.- Measure materials using a variety of scales.- Describe relationships by making inferences and predictions.- Interpret data, formulate models, design models, and produce solutions.
E. Know and use the technological design process to solve problems.- Define different types of problems.- Define all aspects of the problems.- Propose the best solution.- Design and propose alternative methods to achieve solutions.- Apply a solution.
3.6 Technology EducationC. Explain physical technologies of structural design, analysis and engineering,
structural production, and design.- Use knowledge of material effectiveness to solve specific construction
problems (e.g., steel vs. wood bridges).- Evaluate a construction activity by specifying task analyses and necessary
resources.
3.7 Technological DevicesA. Describe techniques to answer questions and solve problems.

42
- Identify use of materials, energy and time that meet specific design criteria.
2.3 Measurement and EstimationD. Estimate, use and describe measures of weight, mass .E. Create and use scale models.
2.4 Mathematical Problem Solving and CommunicationB. Verify and interpret results using numerical tables and equations, charts, graphs
and diagrams.C. Justify strategies and defend approaches used and conclusions reached.
2.8 Algebra and FunctionsG. Represent relationships with tables or graphs in the coordinate plane.H. Locate and identify points on a coordinate system. Graph a linear function from a
table or chart.I. Generate functions from tables of data and relate data to corresponding graphs and
functions.

43
Resources
Scienceplus Technology and Society. (1993). Orlando, FL: Holt, Rinehart and Winston andHarcourt Brace Jovanovich.
World Book Millennium 2000 CD
Irene O'Brian Fund