brief review of lecture 1 understanding science, oceanography, physical oceanography descriptive or...
TRANSCRIPT

Brief Review of Lecture 1
Understanding Science, Oceanography, Physical Oceanography
Descriptive or Dynamical Approaches
Eulerian or Lagrangian techniques
History of oceanography
Oceans and ocean basins – oceans are not simply drowned low lying areas on the earth’s crust!

What physical properties do we observe?
• Temperature• Salinity• Depth• Sea Surface Height• Sound• Light• Current Velocity• And many others……waves, met data,
etc.

Considerations for Observation
• Cost
• Ease of measurement
• Time taken – ocean is dynamic!
• Precision – repeat observation without deviation
• Accuracy – in addition, should be consistent with a reference standard

Temperature
• Measure of the heat content of a body (SI unit: Celsius)
• Temperature of ocean can change if heat is lost or gained in situ heat is advected • Source of heat: mainly the sun (surface) geo-thermal (bottom) • Difference between heating of ocean and
atmosphere• Ocean body NOT uniform in temperature

Temperature structure with depth
• Warmer at top, cooler with depth• Thermocline – region of rapid
change of temperature;
permanent
seasonal
diurnal• Higher temperature, lower density

Global range of ocean temperature
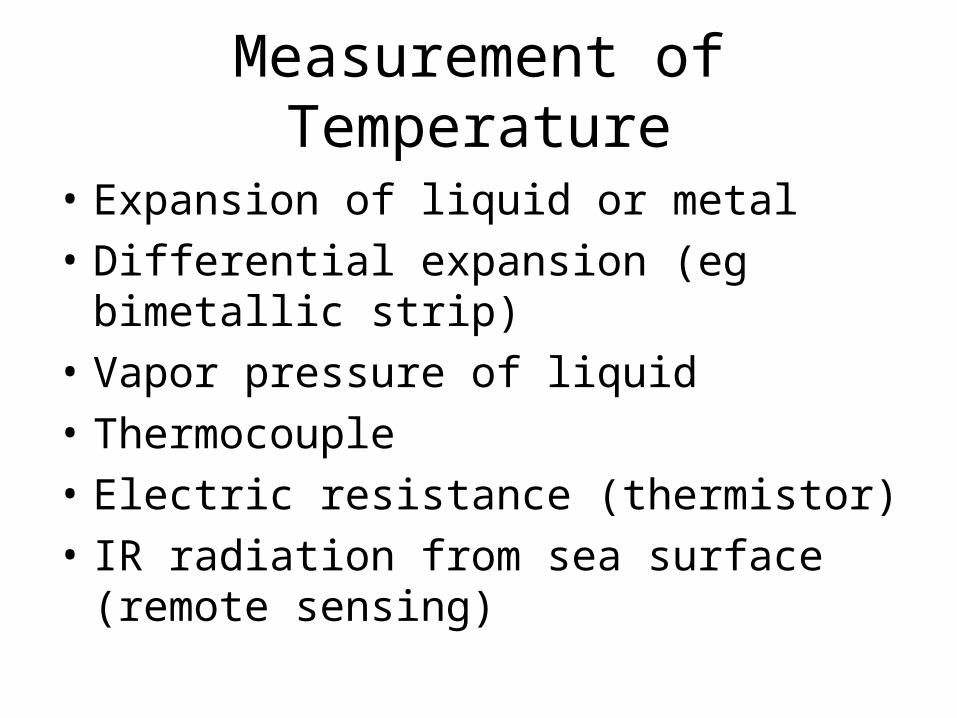
Measurement of Temperature
• Expansion of liquid or metal
• Differential expansion (eg bimetallic strip)
• Vapor pressure of liquid
• Thermocouple
• Electric resistance (thermistor)
• IR radiation from sea surface (remote sensing)

Reversing thermometer
• Temperature affected by pressure.
• Reversing thermometers allow flow of mercury in one direction only through special capillary tube– thus when flipped, they retain in-situ temperature.
• Accuracy: ± 0.02°CNansen bottle (1910)

Thermistors
• At first-order approximation, resistance is linearly proportional to temperature.
• ΔR = k ΔT
where
ΔR = change in resistance
ΔT = change in temperature
k = first-order temperature coefficient of resistance
Accuracy = ±0.1°C
Niskin bottle (1966)

Mechanical Bathythermograph
• Liquid in metal thermometer (toluene in copper)
• Many limitations (max depth 300 m, hysteresis and creep, can be deployed at low ship speed only)
• Accuracy < 0.06°C
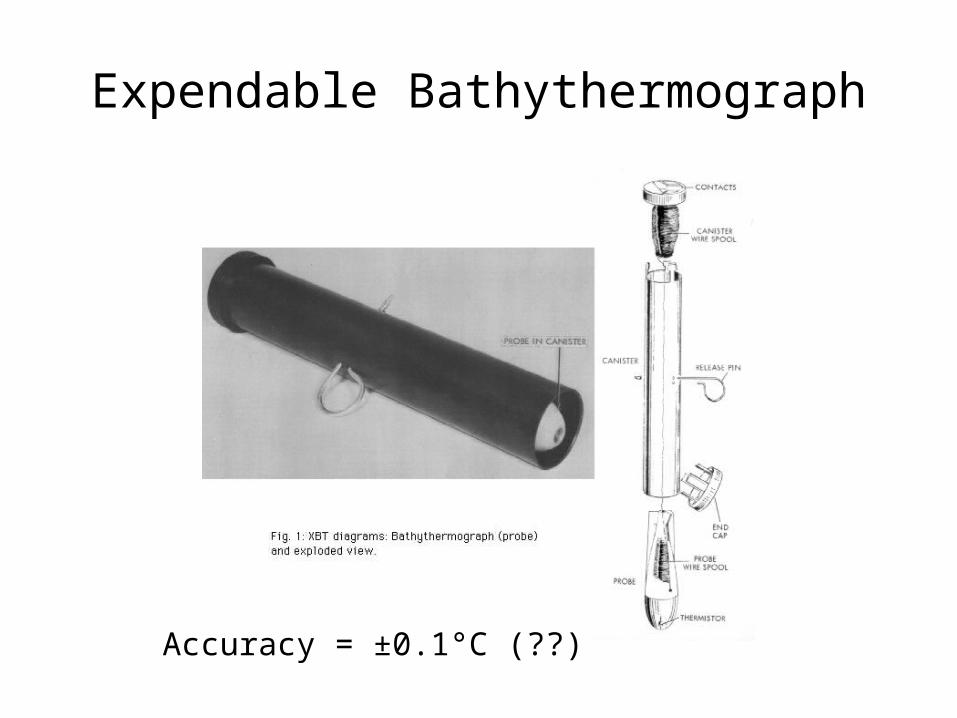
Expendable Bathythermograph
Accuracy = ±0.1°C (??)

IR derived SST – Aug 28, 2006

Salinity
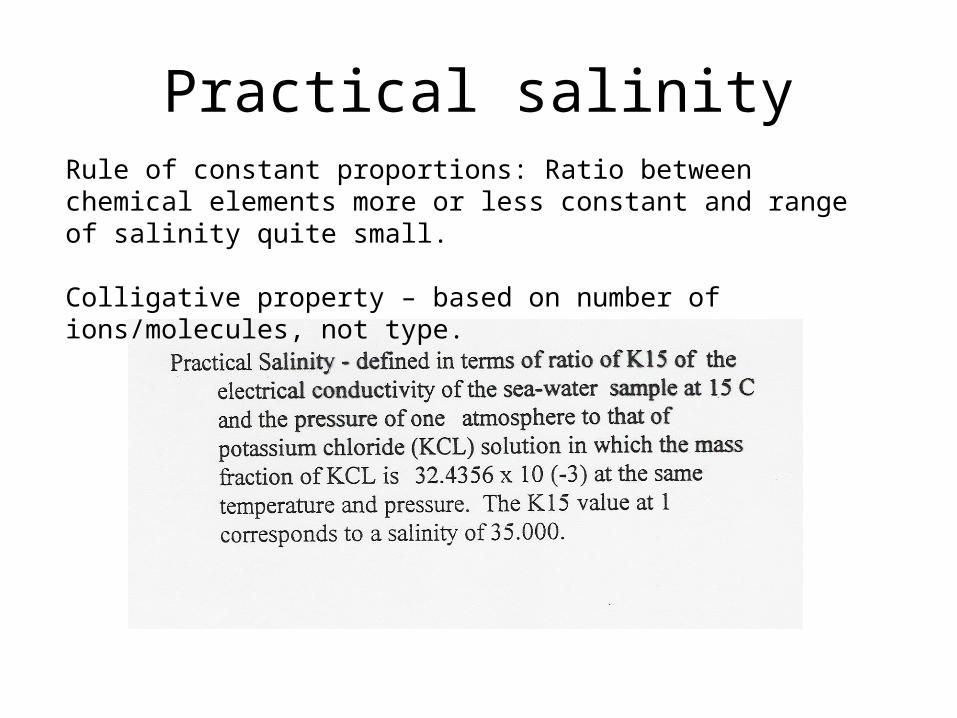
Practical salinityRule of constant proportions: Ratio between chemical elements more or less constant and range of salinity quite small.
Colligative property – based on number of ions/molecules, not type.

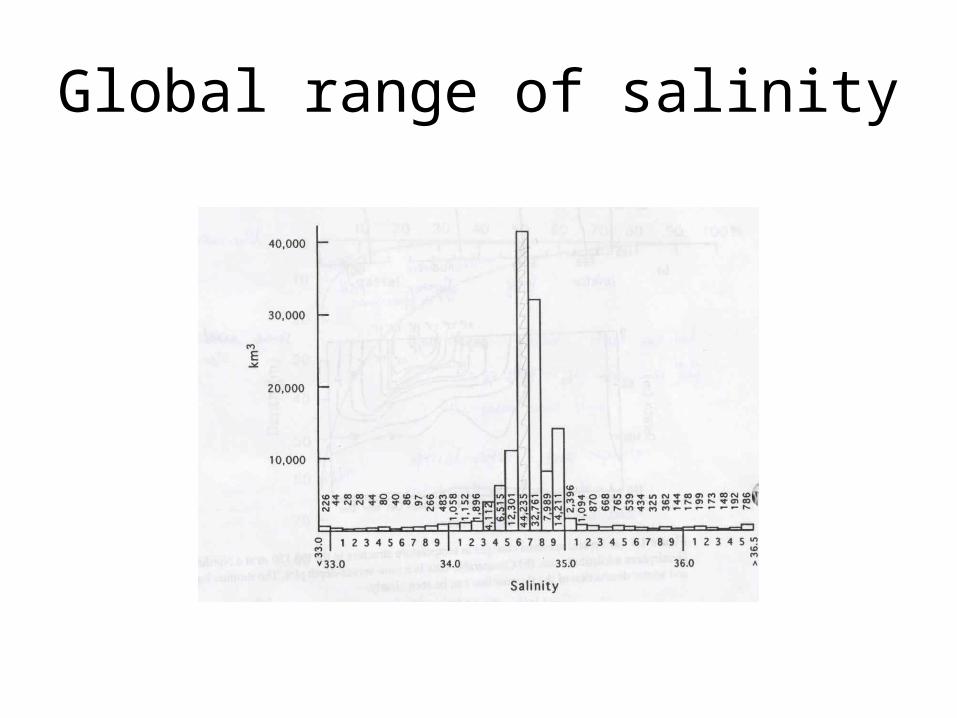
Range of salinity
• 75% of ocean water between 34.5 and 35
• Lowest in coastal waters
• High in enclosed seas and evaporative basins
• Pacific salinity much lower than Atlantic – important repercussions for circulation and climate!
• Higher the salinity, higher the density
Global range of salinity

Conductivity-Temperature-Depth sensor
• T accuracy: ±0.001°C• C accuracy: 0.0003 S/m
~ 0.0024 on PSS
• Response time: Time required for instrument to respond to temperature of a new environment.

TAO/TRITON (formerly TOGA/TAO)
• Real-time data from 70 moored ocean buoys for improved detection, understanding and prediction of El Niño and La Niña.
• Uses ARGOS satellite system• Supported by USA, Japan and France

TAO/TRITON hardware

ARGO Program
• Up to 3000 floats in upper 2000 m of ocean
• International collaboration of about 23 countries
• Used with Jason satellite

ARGO status

ARGO float

ARGO simple cycle

Current Velocity
• Current meters • Acoustic Doppler Current Profiler

ADCP Based on concept of Doppler shift of
frequency when relative positions of source and receiver change
)cos()(2 AFF CV
sd Fd : Doppler shifted frequencyFs : Frequency of sound when everything is fixedV : Relative velocity between sound and receiverC : Speed of sound in mediumA : angle between acoustic beam and water velocity
The greater the angle of the transducer heads with the vertical, the more surface data is lost

Depth/Pressure
• Rope/line over a meter wheel
• Pressure gauge - pressure proportional to depth (hydrostatic balance) – correction for inverse barometric effect (eg. Tide gauge) [1 dB ~ 1 m]
• Echo sounding – time taken for acoustic signal to make trip to sea-floor and back is proportional to distance traveled.

Something to think about…
• Ocean varies on different temporal and spatial scales
• Our ability to understand these variations only as good as our instrumentation
• What processes we resolve depend on our sampling plan (duration, frequency, extent, ….)
• What drives ocean variability?• How does the ocean respond to such forcing?