briefing booklet additional financials - home | naspers briefing booklet –additional ... • fx...
TRANSCRIPT

Briefing Booklet – additional financialsFor the year ended 31 March 2016
Important information
2
This presentation contains forward-looking statements as defined in the United States Private Securities Litigation Reform Act of 1995. Words such as “believe”, “anticipate”, “intend”, “seek”, “will”, “plan”, “could”, “may”, “endeavour” and similar expressions are intended to identify such forward-looking statements, but are not the exclusive means of identifying such statements.
While these forward-looking statements represent our judgments and future expectations, a number of risks, uncertainties and other important factors could cause actual developments and results to differ materially from our expectations. These include key factors that could adversely affect our businesses and financial performance.
We are not under any obligation to (and expressly disclaim any such obligation to) update or alter our forward-looking statements whether as a result of new information, future events or otherwise. Investors are cautioned not to place undue reliance on any forward-looking statements contained herein.

FINANCIALS

Synopsis of financials
4
• Results in functional currencies were translated into US$ for reporting purposes.
• Weakness in emerging-market currencies means performance was dampened by the translation impact.
• Growth in local currencies quoted in brackets.
• All amounts quoted on an economic-interest basis unless otherwise stated.

Revenue growth driven by Tencent and ecommerce
5
• 6% revenue growth, growth 22% if measured in local currencies.
• Tencent revenues up 36% YoY on the back of advertising and mobile growth.
• Internet now accounts for 68% of revenues (61% in FY15).
• Video entertainment revenues up 10%, but down 11% YoY once forex impact is included.

Diversified business mix
6
• 77% of revenues now earned offshore, compared to only 28% in 2005.
• SA accounts for only 23% of revenue (FY15 28%).
• Annuity income (i.e. subscription revenues, IVAS and gaming) represent more than 50% of revenue base.
• Cyclical advertising revenue is only 11% of total revenue.
• Diversity of revenue streams reduce the risk of exposure to any one territory or business model.

Development spend flat on an economic interest basis
7
• Economic interest development spend impacted by:
‐ US$119m organic increase in spend by our etail associates.
‐ US$193m investment in new initiatives (letgo, Showmax, Indian hotels and Naspers ventures).
‐ US$59m saving in classifieds (OLX).
‐ US$143m reduction in nominal DTT spend.
• Spend by established businesses declined 21% .

Consolidated development spend
8
• Consolidated development spend was impacted by:
‐ US$38m increase in spend by B2C ecommerce.
‐ US$12m higher spend in payments
‐ US$26m step-up in spend by ventures.
‐ US$97m lower spend in video entertainment.
• Impact of currency translation decreased spend by 13%.

Ecommerce: economic interest development spend
9

Ecommerce: consolidated development spend
10

Trading profit on an economic interest basis
11
• Trading profit increased 18% (38%), driven by expansion of 39% (43%) in the group’s share of Tencent’s trading profit.
• Lower losses in classifieds and DTT, combined with ibibo’s air-travel business turning profitable and a reduction in PayU’s PSP losses as it scales, also contributed.

Ecommerce continues to gain traction
12
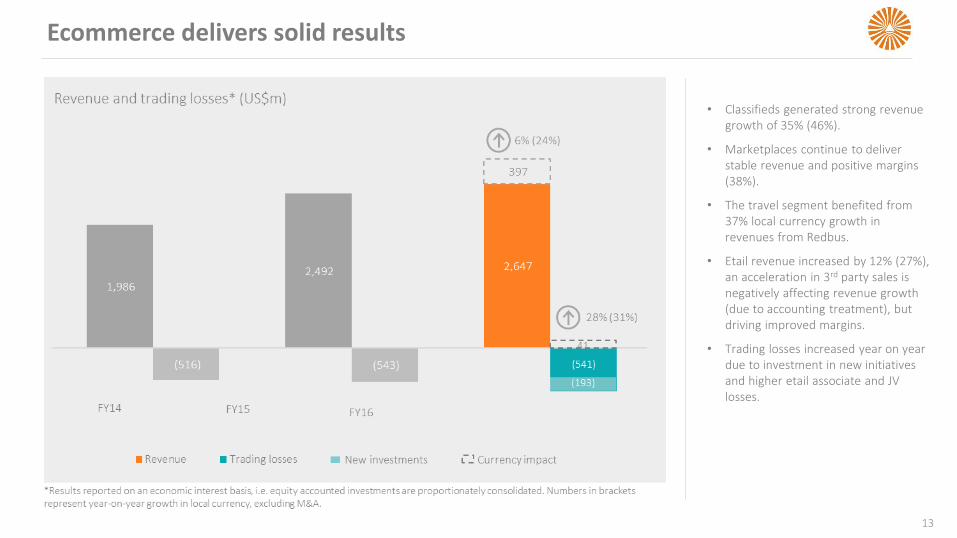
Ecommerce delivers solid results
13
• Classifieds generated strong revenue growth of 35% (46%).
• Marketplaces continue to deliver stable revenue and positive margins (38%).
• The travel segment benefited from 37% local currency growth in revenues from Redbus.
• Etail revenue increased by 12% (27%), an acceleration in 3rd party sales is negatively affecting revenue growth (due to accounting treatment), but driving improved margins.
• Trading losses increased year on year due to investment in new initiatives and higher etail associate and JV losses.

Profitable ecommerce businesses gaining momentum
14
• A 40% increase in number of profitable ecommerce businesses from 15 in FY15 to 21
• In local currency, the profitable business delivered 18% revenue growth and a 48% increase in trading profit. Trading margins are a healthy 37%, up from the 28% in the prior year.

VE financials reflective of challenging macro environment
15
• As customers are billed in local currencies, the rapid devaluation of many African currencies resulted in lower US$ revenues.
• With ~60% of total costs denominated in US$, it resulted in the trading margin contracting from 19.1% to 17.9%.
• Lower DTT spending drove development spend down, whilst the completion of the new head office resulted in a reduction in capex.
• FX translation resulted in lower US$ programming costs, but local content spend increased 12% YoY.

Avito a transformational M&A transaction
16
• $1.2bn deal to take control of Avito in Russia was funded from the capital raise in Dec 2015.
• Avito is delivering ahead of expectations.
• Etail investments included funding rounds of Souq, Konga and Takealot.
• Other M&A include investments by Naspers Ventures.

17
Summarised income statement
• Finance costs impacted by:
• US$49m increase in net foreign exchange losses.
• US$25m increase in interest expense due to US$1.2bn bond issues in July 2015.
• Equity accounted earnings due to net gains from remeasurements relate to gains and losses on disposals of investments as well as deemed disposal gains in Tencent and Mail.ru.
• Impairments were driven by:
‐ US$140m impairment of Buscape (1HFY16).
‐ US$53m impairment of Konga.
‐ US$29m on waiving pref share debt owed by Welkom Yizani (BEE).
‐ US$88m fair-value write-down of Netretail.

Equity accounted results
18

Contribution by associated and joint ventures
19

Net finance costs
20

Core headline earnings trend
21

Core headline earnings drivers
22

Core headline earnings reconciliation
23

Balance sheet strong following equity raise
24
• Following the US$2.5bn capital raising in Dec 2015, net gearing dropped to 12%.
• Our US$2.5bn RCF remained unutilised.

Current assets and liabilities
25

Free cash flow affected by weaker results from VE outside SA
26
• Lower operating profit due to reduced contribution from video entertainment.
• Capex saving due to completion of new VE headoffice in Randburg and lower spend on DTT transmission equipment due to completion of rollout.
• A US$50m increase in dividends from Tencent contributed positively.
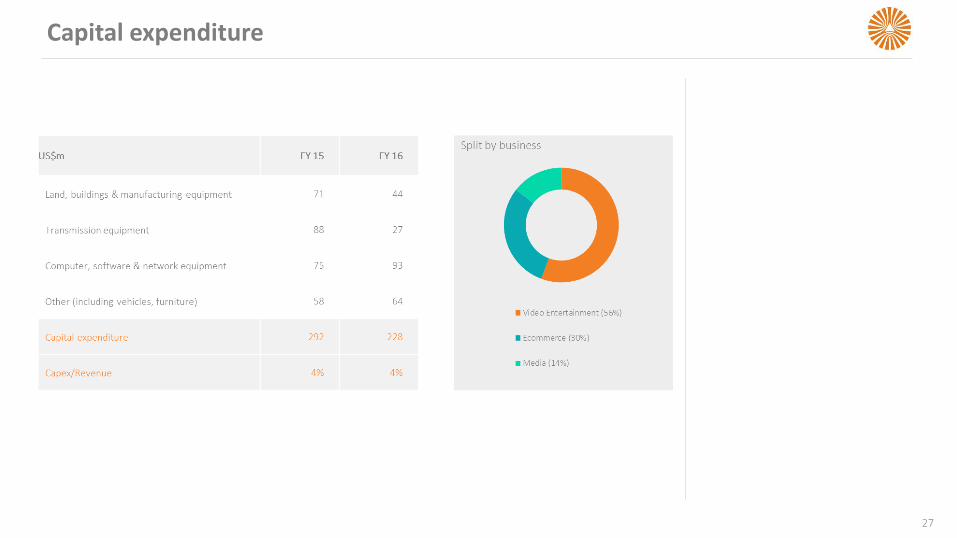
Capital expenditure
27

FX exposure: hedging
28

Consistent dividend growth
29

Debt maturity profile and debt position
30

INTERNET
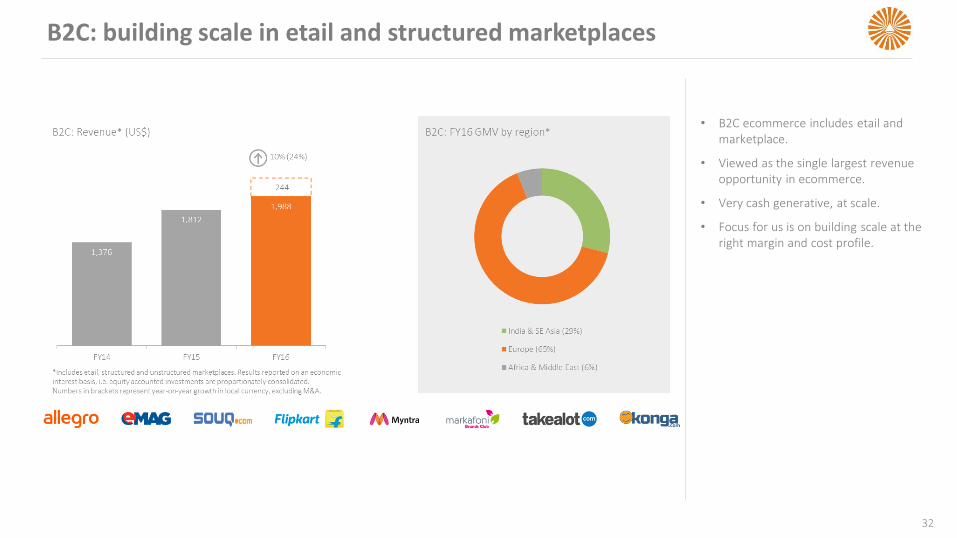
B2C: building scale in etail and structured marketplaces
32
• B2C ecommerce includes etail and marketplace.
• Viewed as the single largest revenue opportunity in ecommerce.
• Very cash generative, at scale.
• Focus for us is on building scale at the right margin and cost profile.
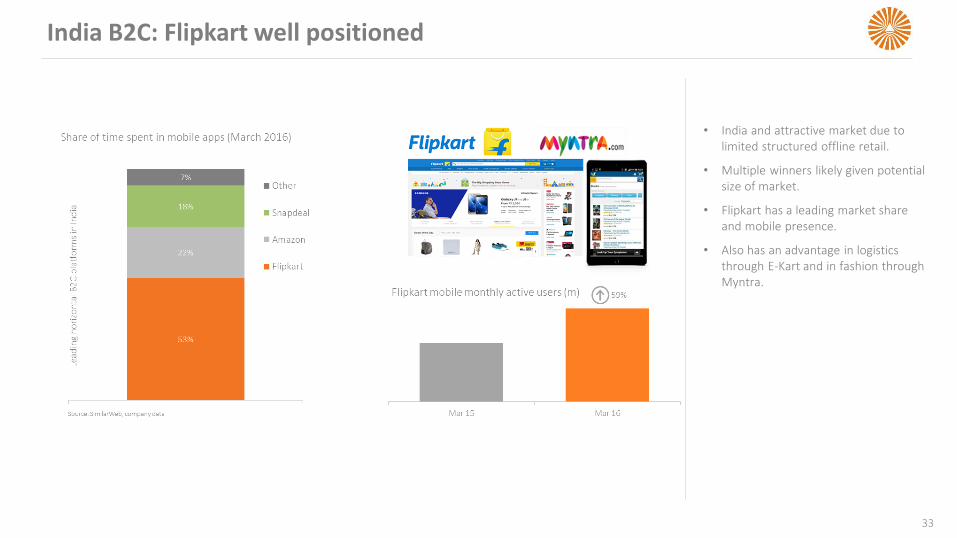
India B2C: Flipkart well positioned
33
• India and attractive market due to limited structured offline retail.
• Multiple winners likely given potential size of market.
• Flipkart has a leading market share and mobile presence.
• Also has an advantage in logistics through E-Kart and in fashion through Myntra.

Allegro: accelerating growth and improving profitability
34
• Allegro is the #1 shopping destination and #1 internet brand in Poland.
• Very successful year, re-accleratedgrowth while maintaining profitability.
• Launched direct selling (1P) and moved Ceneo under Allegro to provide more holistic service.
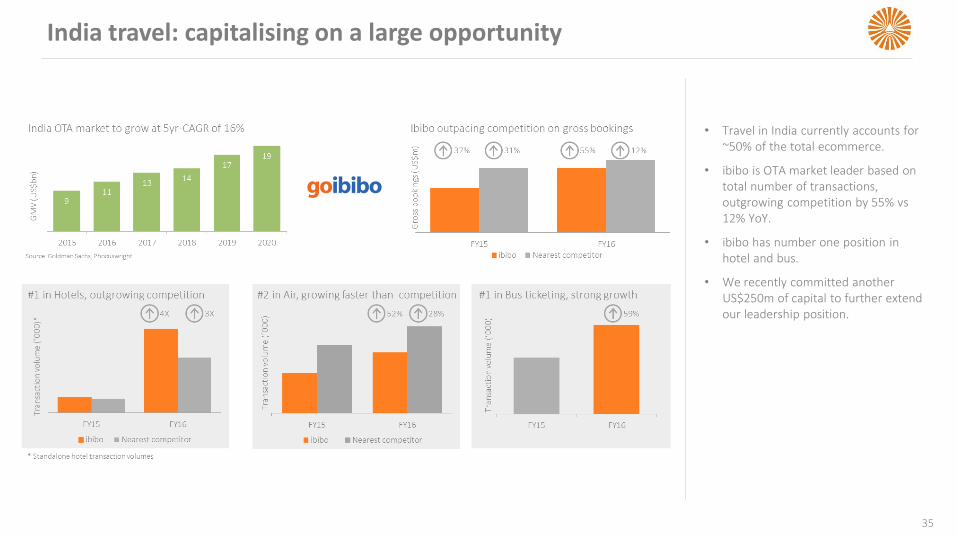
India travel: capitalising on a large opportunity
• Travel in India currently accounts for ~50% of the total ecommerce.
• ibibo is OTA market leader based on total number of transactions, outgrowing competition by 55% vs 12% YoY.
• ibibo has number one position in hotel and bus.
• We recently committed another US$250m of capital to further extend our leadership position.
35

36
Classifieds: building leading platforms
• Strong performance by classifieds –revenue +35% (46% organic) while reducing marketing spend by 11%.
• Operating leverage improved due to operational excellence and improved competitive positions.

Classifieds: continue to monetise and extend current positions
37
• Shifted from market expansion to market consolidation in FY16.
• Now leading in 34 markets of our 40 markets.
• Monetising in Russia, UAE, Portugal, Brazil, Poland, Bosnia, Bulgaria, Romania, Ukraine and Ecuador.

Classifieds: ramping monetisation in Russia
38
• Revenue growth accelerated and outpaced user growth over past year.
• Driven by continuous optimisationof value added services and advertising, and introduction of listing fees.

Listed internet: Tencent delivers another strong performance
39
• Results incorporated on a 3 month lag basis.
• Strong performance all round.
• Good progress on “connection” strategy which seeks to capture mobile internet opportunities.
• Started monetising mobile news service via in-feed ads, building out subscription business for premium content.
• Benefiting from explosive rise in social “person-to-person” payments.

Listed internet: Mail.ru navigating a challenging environment
40
• Results also reflected on a 3-month lag basis.
• Affected by tough macro environment.
• Continues to grow albeit at relatively slow pace.
• IVAS and gaming negatively affected, advertising revenue better.
• Continued focus on ‘communitainment’ online strategy.
• Mobile users of VKontakte and Odnoklassniki now exceeding desktop users.

VIDEO ENTERTAINMENT

VE: Significant scale across 50 African countries
42
• Due to pressure of weak currencies on margins, we increased prices ~25% in 2015.
• Combination of higher prices and weak consumer sentiments resulted in loss of 228,000 DTH subscribers.
• Total subscriber base 10.4m households, up 2% YoY.
• Mix shifting as we continue signing up middle to lower-income households.
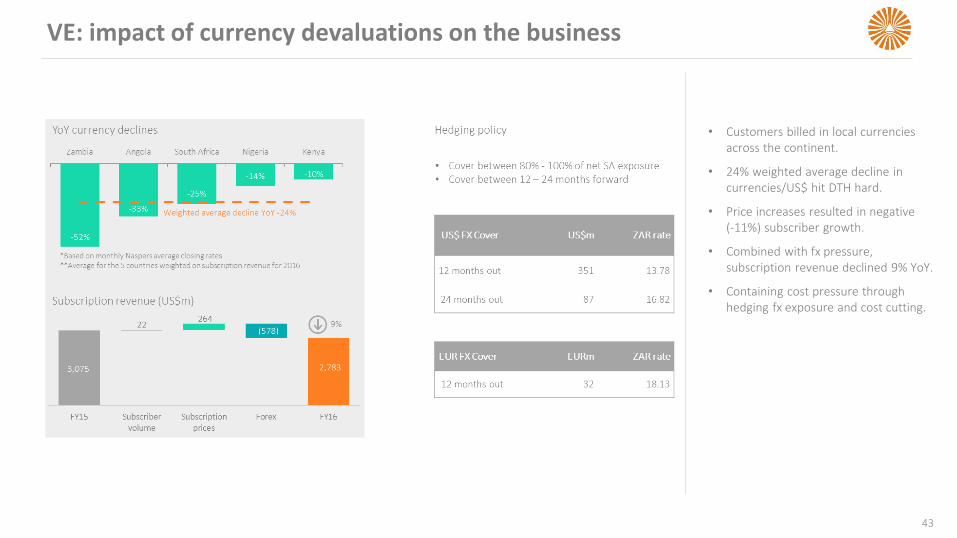
VE: impact of currency devaluations on the business
43
• Customers billed in local currencies across the continent.
• 24% weighted average decline in currencies/US$ hit DTH hard.
• Price increases resulted in negative (-11%) subscriber growth.
• Combined with fx pressure, subscription revenue declined 9% YoY.
• Containing cost pressure through hedging fx exposure and cost cutting.

VE: strong economic headwinds hit DTH sub-Saharan Africa
44
• Decline in the customer base ARPU declining 11%.
• Mismatch of local billing and US$ costs and higher content costs hit margins.
• Operating cash flow down substantially, despite stable capex.
• Difficult to extract cash from Angola, Nigeria and Mozambique.
• Various strategies implemented 2H of FY16 starting to show results.
• Will take time to fix.

VE: DTT continue to scale, approaching break-even
45
• DTT subs up 7% YoY (147k subs), despite no ASOs.
• Capex significantly lower due to completion of footprint.
• Development spend trending down due to scale benefits.
• Currently in 9 markets (Sierra Leone and Zimbabwe not operational).

VE: DTH South Africa holding up better, for now
46
• SA DTH base up 6% YoY, i.e. 325k subs.
• Growth predominantly at lower-end of market.
• Strong PVR growth, typically low propensity for churn.
• 17% decline in US$ ARPU highlights challenges given 50% of costs in US$.
• Cost containment initiatives to be pursued.

OUTLOOK

FY17 Outlook: continue building our platforms
48

APPENDIX

Print Media:
50
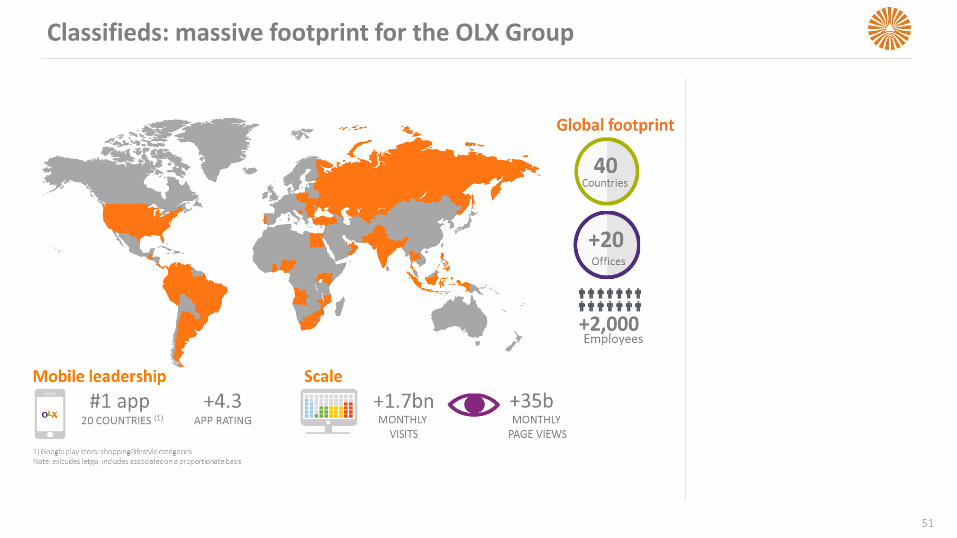
Classifieds: massive footprint for the OLX Group
51

Naspers strategy summarised
52

Glossary of terms
53
