briefing note - alteryx analytics gallery · pdf filecape v2_2013 release (fall 2013) page 2...
TRANSCRIPT
CAPE V2_2013 Release Fall 2013 Briefing Note
CAPE V2_2013 Release (Fall 2013)
Page 2 │Briefing Note Document Version 1.0 | CAPE Fall 2013 Release Experian Public
Contents Introduction 3
CAPE Outputs: V2_2013 Release (Fall 2013) 5 Demographics - Current Year Estimates (CYE) and Five Year Projections (FYP) 5 Daytime Population – Current Year Estimates (CYE) 5 Consumer Expenditure - Current Year Estimates (CYE) and Five Year Projections (FYP) 6 Retail Demand - Current Year Estimates (CYE) 7
CAPE Inputs 9
Methodology 10 Demographics 10
Demographics – Current Year Estimates (CYE) 10 Demographics – Five Year Projections (FYP) 11
Daytime Population 12 Daytime Population – Current Year Estimates (CYE) 12
Consumer Expenditure 14 Consumer Expenditure – Current Year Estimates (CYE) 14 Consumer Expenditure – Five Year Projections (FYP) 14
Retail Demand 15 Retail Demand – Current Year Estimates (CYE) 15
Appendix A: Listing of CAPE Demographic Table availability as Current Year Estimates and Five-Year Projections 17
CAPE V2_2013 Release (Fall 2013)
Page 3 │Briefing Note Document Version 1.0 | CAPE Fall 2013 Release Experian Public
Introduction This document provides an overview of key points relating to the V2_2013 (Fall 2013)
release of Experian’s Census Area Projections & Estimates (CAPE) databases. This
release updates and replaces the estimates and projections of the V1_2013 (Spring 2013)
CAPE release.
The work to produce all of the CAPE databases utilises several decades of experience in
building such databases worldwide. It also leverages the wealth of input data that is
available for small area estimation within the USA.
The CAPE databases updated for this release are:
• Demographics – Current Year Estimates (CYE)
• Demographics – Five Year Projections (FYP)
• Daytime Population – Current Year Estimates (CYE)
• Consumer Expenditure – Current Year Estimates (CYE)
• Consumer Expenditure – Five Year Projections (FYP)
• Retail Demand – Current Year Estimates (CYE)
The CAPE databases are made available at Census Block Group level. The Block Group
list, on which the CAPE counts are provided, is exactly the same list as used for the
V1_2013 (Spring 2013) CAPE release. This is the Census 2010 Block Group list without Water Block Groups. This consists of 217,182 Block Groups which nest into 72,739 Tracts
which in turn nest into 3,143 Counties.
The Block Group level Demographics databases relate to two points in time:
• July 01, 2013 for Current Year Estimates (CYE) (compared to January 01, 2013 for the V1_2013 (Spring 2013) release)
• July 01, 2018 for Five-Year Projections (FYP) (compared to January 01, 2018 for the V1_2013 (Spring 2013) release)
Within each of the above two ‘data views’, income figures relate to income received during a
12-month time period. The relevant time periods are as follows:
• Current Year Estimates: Income received during July 2012 - June 2013 inclusive
(compared to January 2012 - December 2012 inclusive for the V1_2013 (Spring 2013) release)
• Five-Year Projections: Income projected to be received during July 2017- June 2018
inclusive (compared to January 2017 - December 2017 inclusive for the V1_2013 (Spring 2013) release)
CAPE V2_2013 Release (Fall 2013)
Page 4 │Briefing Note Document Version 1.0 | CAPE Fall 2013 Release Experian Public
The Block Group level Daytime Population – Current Year Estimates dataset contains
Current Year Estimates (CYE) of daytime population as at July 01, 2013 (compared to
January 01, 2013 for the V1_2013 (Spring 2013) release).
The Block Group level Consumer Expenditure – Current Year Estimates and Consumer Expenditure – Five Year Projections databases provide estimates and projections of
various categories of expenditure. The Consumer Expenditure – Current Year Estimates
relate to the estimated amount spent ($) during the time period of July 2012 - June 2013
inclusive (compared to January 2012 - December 2012 inclusive for the V1_2013 (Spring
2013) release). The Consumer Expenditure – Five Year Projections relate to the projected
amount that will be spent ($) during the time period of July 2017 - June 2018 inclusive
(compared to January 2017 - December 2017 inclusive for the V1_2013 (Spring 2013)
release).
The Block Group level Retail Demand – Current Year Estimates database consists of
Consumer Expenditure – Current Year estimates ($) accumulated up and presented
separately in terms of (a) Merchandise Line categories and (b) Store Type categories. They
relate to the estimated amount spent ($) during the time period of July 2012 - June 2013
inclusive (compared to January 2012 - December 2012 inclusive for the V1_2013 (Spring
2013) release).
CAPE V2_2013 Release (Fall 2013)
Page 5 │Briefing Note Document Version 1.0 | CAPE Fall 2013 Release Experian Public
CAPE Outputs: V2_2013 Release (Fall 2013)
Demographics - Current Year Estimates (CYE) and Five Year Projections (FYP)
The CAPE counts data portfolio of Demographics – Current Year Estimates contains 88
tables covering the 4 subject areas of (a) Population (b) Households & Housing Units (c)
Income & Poverty and (d) Education & Employment. The lists of tables and of variables
within these tables is exactly the same for the V2_2013 (Fall 2013) CAPE release as for the
V1_2013 (Spring 2013) CAPE release.
The CAPE counts data portfolio of Demographics – Five Year Projections contains 78
tables covering the 4 subject areas of (a) Population (b) Households & Housing Units (c)
Income & Poverty and (d) Education & Employment. These 78 tables are a subset of the 88
tables featured for the CYE. The lists of tables and of variables within these tables is exactly
the same for the V2_2013 (Fall 2013) CAPE release as for the V1_2013 (Spring 2013)
CAPE release.
Appendix A at the end of this document provides a listing of the CAPE Demographics
tables. It highlights which tables are available as Current Year Estimates (CYE) and which
are available as Five Year Projections (FYP).
Daytime Population – Current Year Estimates (CYE) The CAPE database of Daytime Population contains 11 Current Year Estimate (CYE)
counts relating to the estimated population in each Block Group during the daytime of a
typical weekday. The counts consist of the total population at daytime, and various key
subsets of this, as listed below:
• DPN13V2_P01V001 : Total Daytime Population (i.e. all ages)
• DPN13V2_P01V002 : Daytime Population Aged 16+
• DPN13V2_P01V003 : Daytime Population, Civilian 16+, At Workplace
• DPN13V2_P01V004 : Daytime Population, Civilian 16+, Unemployed
• DPN13V2_P01V005 : Daytime Population, Civilian 16+, Work at home
• DPN13V2_P01V006 : Daytime Population, Aged 65+, Retired
• DPN13V2_P01V007 : Daytime Population, Aged 16+, Homemakers
• DPN13V2_P01V008 : Daytime Population, Aged less than 16 (i.e. Children)
• DPN13V2_P01V009 : Daytime Population, Students : Prekindergarten to 8th grade
• DPN13V2_P01V010 : Daytime Population, Students : 9th grade to 12th grade
• DPN13V2_P01V011 : Daytime Population, Students : Post-secondary students
The CAPE Daytime Population database recognizes that the level and composition of the
typical population present in a Block Group during the day can differ significantly to the
residential population of the same Block Group (i.e. the daytime population in a Block
CAPE V2_2013 Release (Fall 2013)
Page 6 │Briefing Note Document Version 1.0 | CAPE Fall 2013 Release Experian Public
Group can differ significantly to the population who normally live, or reside, within the same
Block Group). Whilst there are a very wide variety of reasons for this, some of the main
ones are as follows:
• Population living outside of the area that travels into the area to work
• Population living inside the area that travels out of the area to work elsewhere
• Children living outside of the area that travel into the area to attend school
• Children living inside the area that travel out of the area to attend school
• Students living outside the area that travel into the area to attend college/university
• Students living in the area that travel out of the area to attend college/university
The Daytime Population database allows for typical travel patterns such as the above, and
also allows for segments of the population likely to spend the majority of the day in the
same area (Block Group) in which they reside, such as the unemployed, retired, and pre-
school age children. All of these different types of population are then combined in order to
estimate the typical daytime population of each Block Group.
Consumer Expenditure - Current Year Estimates (CYE) and Five Year Projections (FYP)
The Consumer Expenditure – Current Year Estimates and Consumer Expenditure – Five Year Projections databases provide count estimates and projections of expenditure
($) undertaken within 12 month periods by the residents in each Block Group. Major
expenditure categories represented within each database are as follows:
• Food
• Alcoholic beverages
• Housing
• Apparel and services
• Transportation
• Health care
• Entertainment
• Personal care products and services
• Reading
• Education
• Tobacco products and smoking supplies
• Miscellaneous
• Cash contributions
• Personal insurance and pensions
CAPE V2_2013 Release (Fall 2013)
Page 7 │Briefing Note Document Version 1.0 | CAPE Fall 2013 Release Experian Public
The categories above are comprised of detailed variables that can nest into several levels.
For example:
• Food
o Food At Home
Processed Fruits
- Frozen Orange Juice
A separate view of the subset of Gifts within each of the14 categories above, as well as
further sub-categories, is also provided.
It is very important to note that both the Consumer Expenditure – Current Year Estimates and Consumer Expenditure – Five Year Projections databases are presented
in terms of nominal spend ($). That is, both databases are presented in terms of expected
actual spend ($) within each 12 month period reported on, including the anticipated impact
of inflation upon consumer prices.
Retail Demand - Current Year Estimates (CYE) The Retail Demand – Current Year Estimates database consists of Consumer Expenditure – Current Year Estimates figures ($) accumulated up and presented
separately in terms of (a) Merchandise Line categories and (b) Store Type categories.
Merchandise Line categories covered by Retail Demand include the following:
• Groceries and Other Foods
• Meals and Snacks
• Alcoholic Drinks
• Drugs, Health Aids, and Beauty Aids
• Soaps, Detergents, and Household Cleaners
• Men’s Wear
• Women’s, Juniors’ & Misses’ Wear
• Footwear
• Major Household Appliances
• Small Electric Appliances
• Televisions, Video Recorders, Video Cameras
• Audio Equipment, Musical Instruments, and Supplies
• Furniture and Sleep Equipment
• Flooring and Floor Coverings
• Computer Hardware, Software & Supplies
• Jewellery
• Books
CAPE V2_2013 Release (Fall 2013)
Page 8 │Briefing Note Document Version 1.0 | CAPE Fall 2013 Release Experian Public
• Toys, Hobby Goods, and Games
• Optical Goods
• Sporting Goods
• Hardware Tools, and Plumbing and Electrical Supplies
• Lumber and Building Materials
• Paint & Sundries
• Cars, Trucks, Other Powered Transportation
• Automotive Fuels
• Automotive Lubricants
• Pets, Pet Foods & Pet Supplies
• All Other Merchandise
Major Store Categories covered by Retail Demand are:
• Motor Vehicle & Parts Dealers
• Furniture & Home Furnishings Stores
• Electronics & Appliances Stores
• Building Material & Garden Equipment & Supply Dealers
• Food & Beverage Stores
• Health & Personal Care Stores
• Clothing & Clothing Accessories Stores
• Sporting Goods, Hobby, Book, & Music Stores
• General Merchandise Stores
• Miscellaneous Store Retailers
• Foodservice & Drinking Places
• GAFO (Discount retailers)
Each Major Store Category listed above is then typically split into sub-categories. For
example, Electronics & Appliances Stores are split into the following sub-categories:
• Electronics & Appliances Stores (443)
o Appliance, Television, and Other Electronics Stores (44311)
Household Appliances Stores (443111)
Radio, Television and Other Electronics Stores (443112)
o Computer & Software Stores (44312)
o Camera & Photographic Equipment Stores (44313)
CAPE V2_2013 Release (Fall 2013)
Page 9 │Briefing Note Document Version 1.0 | CAPE Fall 2013 Release Experian Public
CAPE Inputs A key process in the development and construction of CAPE estimates and projections has
been the acquisition and use of an extensive range of high quality input data from a wide
variety of sources. This has included data from the following:
• US Census Bureau: Census
• US Census Bureau: Annual Population Estimates
• US Census Bureau: American Community Survey (ACS)
• US Census Bureau: Current Population Survey (CPS)
• US Census Bureau: Census of Retail Trade (part of the Economic Census)
• US Bureau of Labor Statistics: Local Area Unemployment Statistics (LAUS) program information
• US Bureau of Labor Statistics: Consumer Price Index: All Items CPI for all Urban Consumers (CPI-U)
• US Bureau of Labor Statistics: Consumer Expenditure Survey
• Congressional Budget Office (CBO) – Historic time series of Economic macrodata.
Used as an input to estimate expenditure targets for the Consumer Expenditure – Five Year Projections database
• Congressional Budget Office (CBO) – Projections of Economic macrodata. Also
used as an input to estimate expenditure targets for the Consumer Expenditure – Five Year Projections database
• Experian: Household-level ConsumerView database statistics for small areas
• Federal Emergency Management Agency (FEMA): Declared disaster and emergency statistics
• IHS Global Insight: Economic Estimates and Projections
• Maponics: Carrier Route level counts of Active USPS Residential Delivery Points
• National Center for Education Statistics (NCES): Information regarding population levels at schools, colleges and universities
• Valassis Lists: Block Group level counts of addresses
CAPE V2_2013 Release (Fall 2013)
Page 10 │Briefing Note Document Version 1.0 | CAPE Fall 2013 Release Experian Public
Methodology
Demographics
Demographics – Current Year Estimates (CYE) The CAPE Demographics – Current Year Estimates V2_2013 (Fall 2013) release uses the
CAPE V1_2013 (Spring 2013) estimates as a starting point.
The first phase of processing uses a variety of sophisticated demographic methods to
update key demographics such as Housing Units, Households, Families, Total Population,
and Population split by Age, Sex, Ethnicity and Race. These methods take the CAPE
V1_2013 (Spring 2013) release, estimates as at January 01, 2013 as a starting point ,and
update them by six months to the latest estimate date (July 01, 2013). The methods utilize
various data sources such as Experian - ConsumerView, Maponics, Valassis Lists, and US
Census Bureau 2010 Census and Annual Population Estimates data. They include ‘ratio-
change’ methods to track localized change in the Housing stock, the use of a ‘Housing Unit
Component Model’ at higher geographic levels to track the impact of new builds and
demolitions and set high-level calibration targets for the number of Housing Units, and the
use of a cohort-survival model to estimate the change in the age by sex distribution of the
population since the previous CAPE estimate date (January 01, 2013). The result of this
phase is a set of Current Year Estimate demographics variables that form the relevant ‘table
base populations’ for the remaining CAPE tables.
The second phase of processing then typically uses localized propensities for the detailed
characteristics of each table. It is based upon sources such as Census 2010, the American
Community Survey (ACS) and the Current Population Survey (CPS). Trends in these
propensities over time are used to update them to the CAPE ‘Current Year Estimates’ date
(July 01, 2013). These updated propensities are then applied to the relevant table base
population (or sub-populations) resulting from the first phase of processing. Within this
phase of processing, some variables have their own specialized methods. For example, the
creation of Household Income estimates by various characteristics (e.g. Race) includes the
use of an ‘inflation adjustment algorithm’ and also multi-dimensional Iterative Proportional
Fitting (IPF). These methods differ from the ‘typical ‘second phase’ methods’ outlined
above. Some key tables, including Household Income, Housing Value, and Employment
Status by Sex, are also subject to calibration, so that they agree as closely as possible with
sources of data that are only available for geographic areas much larger than Block Groups.
Within the final phase of CYE processing, routines are used to calculate means, medians,
aggregates, and other derived variables, from the CAPE tables of CYE counts that have
been created in the first two phases of the processing.
CAPE V2_2013 Release (Fall 2013)
Page 11 │Briefing Note Document Version 1.0 | CAPE Fall 2013 Release Experian Public
Demographics – Five Year Projections (FYP) The vast majority of tables produced above as Current Year Estimates have also been
projected forward 5 years to form the Demographics – Five Year Projections dataset.
There are many similarities between the methods to produce the projections and those
described above to produce the estimates. In particular,
• Higher level (e.g. County, State, or National) calibration or guideline figures are produced and used wherever possible.
• At Block Group level
o The set of key base counts (Housing Units, Households, Households split by
Family Households and Nonfamily Households, and Total Population split by Population in Households and Group Quarters Population) is produced first.
o The cohort-survival model used for the CYE is used to project age & gender distributions.
o Distributions of ‘Other Population & Household’ characteristics are then calculated and applied to the relevant base count(s).
• Special care is taken when applying the above methods to areas affected by major disasters.
However, there are also a couple of key differences between the methods used for the
projections and those used for the estimates. The main differences are as follows:
• It is far more difficult to source calibration statistics for the projections than for the
estimates. As such, calibration routines are used for less FYP tables than for CYE
tables. FYP tables where detailed calibration routines have been used for this release
include those relating to Housing Value (Table B17), Household Income (Table C01), and Employment Status by Sex (Table D04).
• Block Group level projected distributions of ‘Other Population & Household Characteristics’ have generally been produced by
o reviewing trends between the Census 2000 distributions and CYE distributions, and then,
o applying these trends forward 5 years.
A combination of linear and non-linear methods has been used in this process.
CAPE V2_2013 Release (Fall 2013)
Page 12 │Briefing Note Document Version 1.0 | CAPE Fall 2013 Release Experian Public
Daytime Population
Daytime Population – Current Year Estimates (CYE) The Daytime Population database is created using a variety of methodologies applicable for
different subsets of the Total Daytime Population (all ages). These subsets are then added
together to create the Total Daytime Population (all ages) variable, which estimates the
total number of people in each Block Group estimated to be present during the daytime of a
typical weekday. It is important to note that this variable is different to the separate Total
Population (all ages) variable, which estimates the number of people that live (or reside) in each Block Group.
The process to create Daytime Population – Current Year Estimates starts by identifying
key subsets of the residential population that are assumed to stay in or close to their home
location during the day. In particular, the following subsets of population are assumed to
remain in the same Block Group during the day as the Block Group in which they live (or
reside):
• Residential Population : Children aged less than or equal to 2
• Residential Population : Civilian aged 16+ population that are unemployed
• Residential Population : Civilian aged 16+ population that work at home
• Residential Population : Population aged 65+ who are retired
• Residential Population : Population aged 16+ who are homemakers
• Residential Population : Population aged 16+ who are in the Armed Forces
All of the above variables can be directly calculated from existing CAPE – Demographics –
Current Year Estimate (CYE) residentially-based variables except for the ‘Residential
Population: Population aged 16+ who are homemakers’. This variable is calculated by
applying suitable localized proportions to the existing ‘larger population’ variable of the
‘Civilian aged 16+ population who are Not in Labor Force’. Applying these proportions
determines the subset of this ‘larger population’ that are estimated to be homemakers.
Once these initial subsets of Daytime Population who are assumed to stay in their
residential Block Group during the daytime are defined and accounted for, then the daytime
locations of other population types are modelled. It is assumed that these remaining
population types are much more likely to travel out of their residential Block Group to reach
their typical daytime location than is the case for the previously accounted for groups.
However, flows from home address to daytime address that occur completely within the
same Block Group are also possible for these types.
First, the estimate of daytime population at place of work (i.e. Daytime Population, Civilian
16+, at Workplace) is estimated. This is done using Census Tract-to-Tract flows of workers
from residence to workplace, and National Business Database data to update these flows
and to allocate them from Tract level to Block Group level.
CAPE V2_2013 Release (Fall 2013)
Page 13 │Briefing Note Document Version 1.0 | CAPE Fall 2013 Release Experian Public
After the above, the main daytime population groups then estimated are:
• Daytime Population, Students: Prekindergarten to 8th grade
• Daytime Population, Students: 9th grade to 12th grade
• Daytime Population, Students: Post-secondary students
• Daytime Population: Any remaining Civilian aged 16+ population that are ‘Not in Labor Force’ and have not yet been accounted for.
All of the three student populations are modelled using a variety of data from the National
Center for Education Statistics (NCES) and also information from key institutions (i.e.
universities/colleges) themselves. After making allowance for students registered at an
institution but very unlikely to travel to that institution on a typical day (for example, students
undertaking online courses), this information is compiled and modelled to create an initial
estimate of the typical number of students that spend the day at the location (or campus) of
each institution. These figures are then calibrated so that the initial estimates of students
who spend a typical day at the location of each institution, and those who stay within their
residential Block Group during a typical day, are balanced to equal the national number of
students within each category (i.e. Prekindergarten to 8th grade, 9th grade to 12th grade,
Post-secondary students).
Once all students have been accounted for, current estimates of each relevant daytime
population sub-group are tallied and compared to the national CAPE Demographics –
Current Year Estimate figure of ‘Residential Population: Civilian aged 16+ population that
are Not in Labor Force’. The above modelling does not yet account for a subset of this
population group. The, as yet unaccounted for, proportion of this group is therefore
calculated and assumed to spend a typical day within the Block Group in which they reside
(or live).
Having allocated all of the relevant subsets of residential population to either the Block
Group in which they reside, or to another Block Group which they are estimated to travel to,
in order to spend a typical day, then the two final variables in the database are calculated.
This is done by adding relevant subsets of the already estimated daytime population
together. These two final variables are:
• Daytime Population Aged 16+
• Total Daytime Population (i.e. all ages)
CAPE V2_2013 Release (Fall 2013)
Page 14 │Briefing Note Document Version 1.0 | CAPE Fall 2013 Release Experian Public
Consumer Expenditure
Consumer Expenditure – Current Year Estimates (CYE) Consumer Expenditure estimates have been created based upon Experian analysis of
individual respondent level information from the Consumer Expenditure Survey conducted
by the U.S. Census Bureau, on behalf of the U.S. Bureau of Labor Statistics.
This respondent information is analyzed by Experian to determine relationships between
expenditure and key demographic factors. Variables that the analysis has shown drive
variation in average household expenditure include:
• Age of Householder
• Ethnicity (Hispanic, Non-Hispanic)
• Household Income
Once the relationship between these key factors and expenditure has been determined, the
appropriate relationship for each expenditure item is then applied out to the full Block Group
list based on Current Year Estimates of these variables. Initial Block Group level results are
then calibrated to agree with target expenditure values that have been set based upon
analysis of the latest Consumer Expenditure Survey results, and recent US Bureau of Labor
Statistics: Consumer Price Index (CPI-U) statistics.
Consumer Expenditure – Five Year Projections (FYP) The methodology for the Consumer Expenditure – Five Year Projections (FYP) database
builds upon the methodology for the existing CAPE Consumer Expenditure – Current Year
Estimates (CYE) database. The output of the method produces exactly the same variables
as the CYE version of Consumer Expenditure, but for five years ahead.
The input data sources used to create the Consumer Expenditure – Five Year Projections
are as follows:
• US Bureau of Labor Statistics (BLS) – Consumer Expenditure Survey
• US Bureau of Labor Statistics (BLS) - Consumer Price Index (CPI-U) statistics.
• Congressional Budget Office (CBO) – Economic Macrodata: Historic Time-series
• Congressional Budget Office (CBO) – Economic Macrodata: Projections
• CAPE : Consumer Expenditure – Current Year Estimates (CYE)
• CAPE : Demographics – Five Year Projections (FYP)
First, national targets are created for projected average expenditure per household by key
product lines featured within the CAPE – Consumer Expenditure database. This is
undertaken via the creation of sophisticated linear and non-linear regression models that
explain year-on-year variation in historical expenditure on key product lines, in real terms,
based upon the historic time-series of ‘Congressional Budget Office (CBO) – Economic
Macrodata’. Projected future inflation rates based upon analysis of ‘US Bureau of Labor
Statistics (BLS): Consumer Price Index (CPI-U) statistics’ are then taken into account, and
applied to the ‘real terms’ targets previously calculated. This converts the targets from
CAPE V2_2013 Release (Fall 2013)
Page 15 │Briefing Note Document Version 1.0 | CAPE Fall 2013 Release Experian Public
results in real terms to results in nominal terms. That is, the final targets and eventual Block
Group results are presented in terms of expected actual spend ($) within the 12 month
time period July 2017 – June 2018, including the impact of expected consumer price
inflation to this time period.
Once national targets of projected average expenditure per household by key product lines
featured within the CAPE – Consumer Expenditure database have been created, these
figures are then converted to regional level targets based upon analysis of regional
variations in average household expenditures from the ‘US Bureau of Labor Statistics (BLS)
– Consumer Expenditure Survey’. Targets are driven down from key product lines to all
product lines based upon the historical relationship between sales for each key product line
and the detailed product lines that constitute each key product line.
After the target-setting work, Block Group level initial estimates of projected expenditure are
created. These use ‘CAPE: Consumer Expenditure – Current Year Estimates (CYE)’ figures
as a base and amend them to allow for changing spend levels and projected changes in
underlying Block Group level demographics over time. Initial estimates of variation in
average spend levels per household based upon key predictor household demographics
such as Age of Householder, Ethnicity (Hispanic, Non-Hispanic), and Household Income
are therefore combined with CAPE: Demographics – Five Year Projections (FYP) of the
number of households in each combination of the key predictor categories.
The resultant initial estimates of total projected expenditure (i.e. expenditure across all
households) on each product line within each Block Group are finally calibrated to agree as
closely as possible with the regional targets of projected average expenditure per
household previously created. Within this process, a hierarchical count-adjustment
algorithm is used in order to ensure that finally published Block Group level projections of
total expenditure for each detailed product line exactly sum to the finally published Block
Group projections for the key product lines that they nest into.
Retail Demand
Retail Demand – Current Year Estimates (CYE) The Retail Demand database is built using information from two main data sources:
• The Consumer Expenditure Survey conducted by the U.S. Census Bureau on behalf of the U.S. Bureau of Labor Statistics.
• The Census of Retail Trade (CRT - part of the US Census Bureau Economic Census).
A CRT report that maps the relationship between sales by Merchandise Line and sales by Store Type is used.
The estimates are created initially using information from the Consumer Expenditure
Survey.
First, the Experian Consumer Expenditure estimates (see methodology above) are
converted from the detailed Product Line level shown in the Consumer Expenditure
database, to the Merchandise Line level required in Retail Demand.
CAPE V2_2013 Release (Fall 2013)
Page 16 │Briefing Note Document Version 1.0 | CAPE Fall 2013 Release Experian Public
Secondly, Census of Retail Trade information on the proportion of sales of each
Merchandise line by North American Industry Classification (NAICS) category is used. This
allows Experian to transfer the Merchandise Line Retail Demand expenditures into NAICS
categories which then map to Retail Store Types.
CAPE V2_2013 Release (Fall 2013)
Page 17 │Briefing Note 2013 © Experian Ltd All rights reserved Experian Public
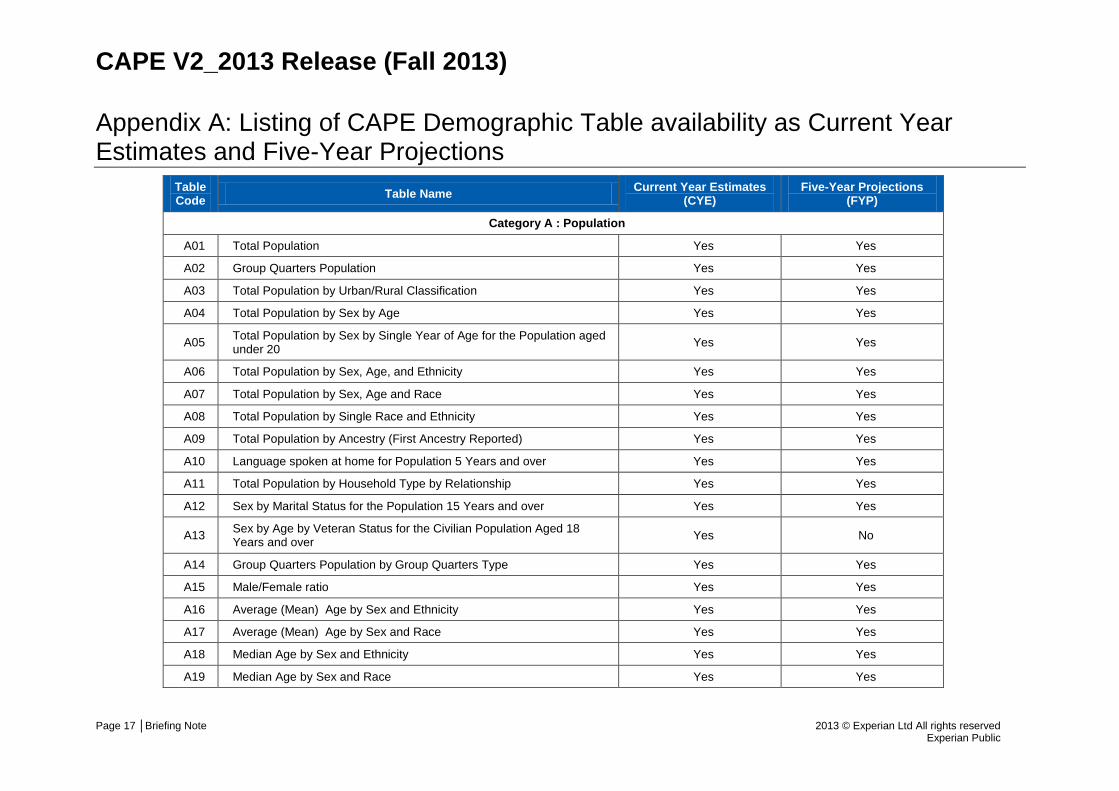
Appendix A: Listing of CAPE Demographic Table availability as Current Year Estimates and Five-Year Projections
Table Code Table Name Current Year Estimates
(CYE) Five-Year Projections
(FYP)
Category A : Population
A01 Total Population Yes Yes
A02 Group Quarters Population Yes Yes
A03 Total Population by Urban/Rural Classification Yes Yes
A04 Total Population by Sex by Age Yes Yes
A05 Total Population by Sex by Single Year of Age for the Population aged under 20 Yes Yes
A06 Total Population by Sex, Age, and Ethnicity Yes Yes
A07 Total Population by Sex, Age and Race Yes Yes
A08 Total Population by Single Race and Ethnicity Yes Yes
A09 Total Population by Ancestry (First Ancestry Reported) Yes Yes
A10 Language spoken at home for Population 5 Years and over Yes Yes
A11 Total Population by Household Type by Relationship Yes Yes
A12 Sex by Marital Status for the Population 15 Years and over Yes Yes
A13 Sex by Age by Veteran Status for the Civilian Population Aged 18 Years and over Yes No
A14 Group Quarters Population by Group Quarters Type Yes Yes
A15 Male/Female ratio Yes Yes
A16 Average (Mean) Age by Sex and Ethnicity Yes Yes
A17 Average (Mean) Age by Sex and Race Yes Yes
A18 Median Age by Sex and Ethnicity Yes Yes
A19 Median Age by Sex and Race Yes Yes
CAPE V2_2013 Release (Fall 2013)
Page 18 │Briefing Note 2013 © Experian Ltd All rights reserved Experian Public
Table Code Table Name Current Year Estimates
(CYE) Five-Year Projections
(FYP)
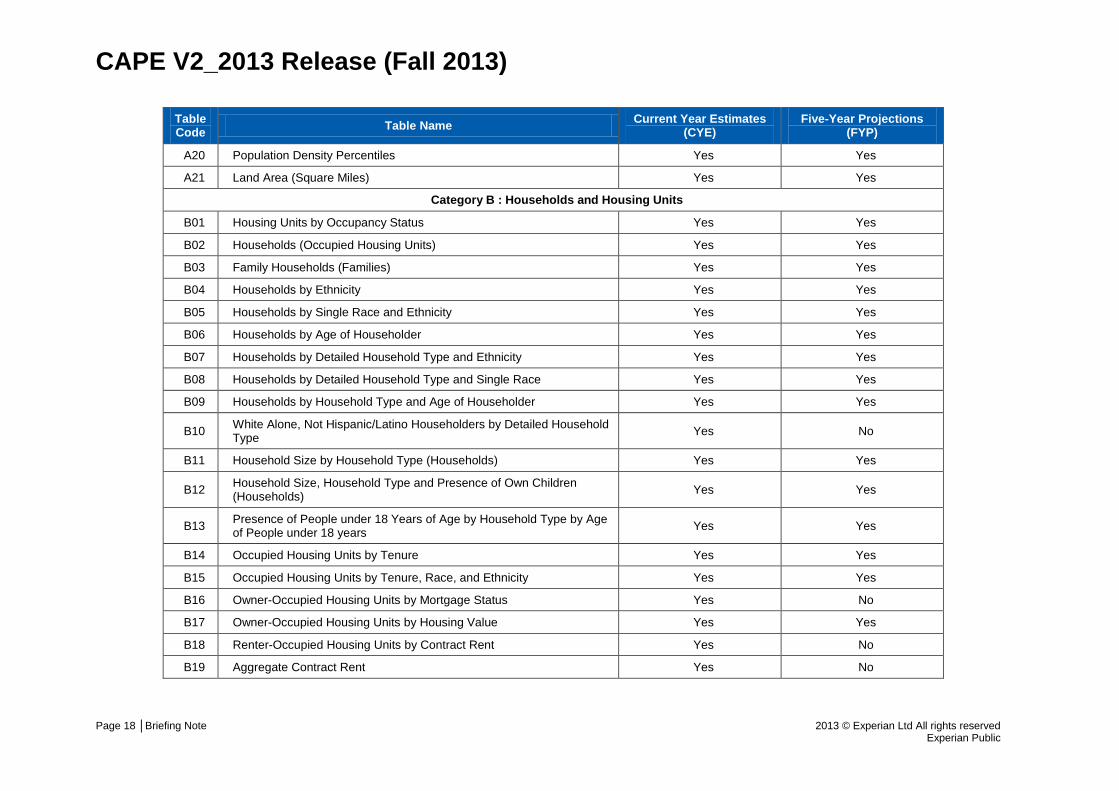
A20 Population Density Percentiles Yes Yes
A21 Land Area (Square Miles) Yes Yes
Category B : Households and Housing Units
B01 Housing Units by Occupancy Status Yes Yes
B02 Households (Occupied Housing Units) Yes Yes
B03 Family Households (Families) Yes Yes
B04 Households by Ethnicity Yes Yes
B05 Households by Single Race and Ethnicity Yes Yes
B06 Households by Age of Householder Yes Yes
B07 Households by Detailed Household Type and Ethnicity Yes Yes
B08 Households by Detailed Household Type and Single Race Yes Yes
B09 Households by Household Type and Age of Householder Yes Yes
B10 White Alone, Not Hispanic/Latino Householders by Detailed Household Type Yes No
B11 Household Size by Household Type (Households) Yes Yes
B12 Household Size, Household Type and Presence of Own Children (Households) Yes Yes
B13 Presence of People under 18 Years of Age by Household Type by Age of People under 18 years Yes Yes
B14 Occupied Housing Units by Tenure Yes Yes
B15 Occupied Housing Units by Tenure, Race, and Ethnicity Yes Yes
B16 Owner-Occupied Housing Units by Mortgage Status Yes No
B17 Owner-Occupied Housing Units by Housing Value Yes Yes
B18 Renter-Occupied Housing Units by Contract Rent Yes No
B19 Aggregate Contract Rent Yes No
CAPE V2_2013 Release (Fall 2013)
Page 19 │Briefing Note 2013 © Experian Ltd All rights reserved Experian Public
Table Code Table Name Current Year Estimates
(CYE) Five-Year Projections
(FYP)
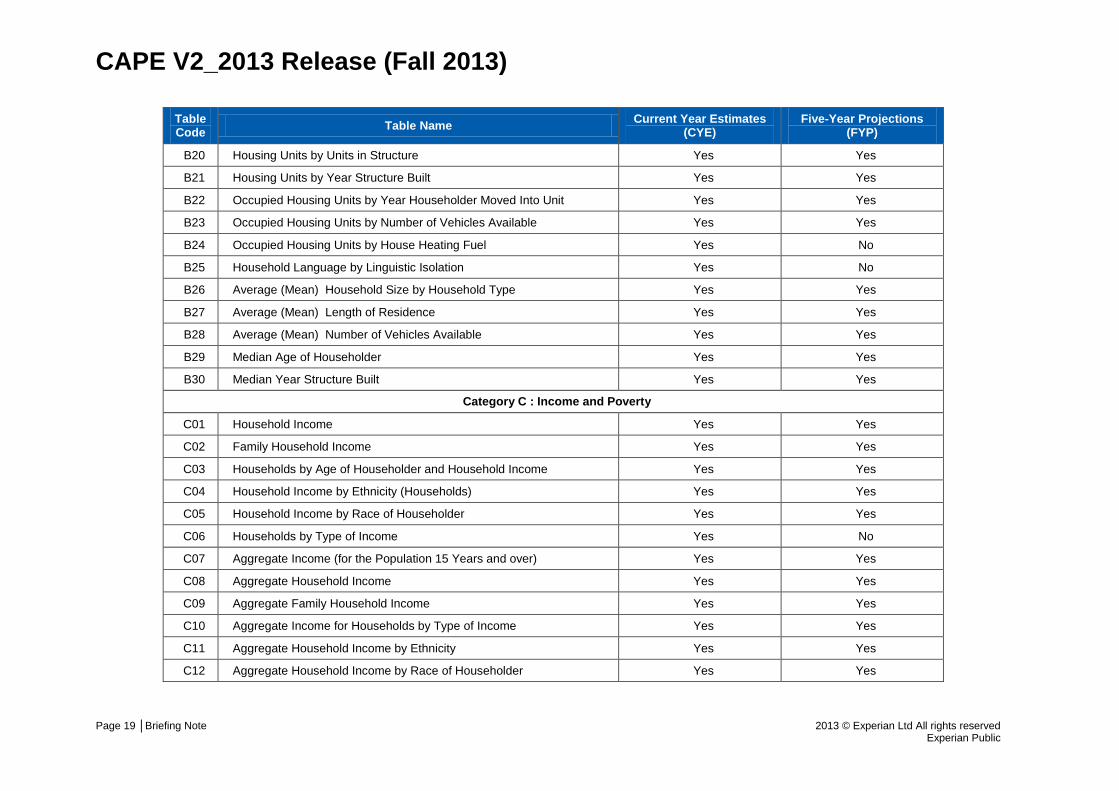
B20 Housing Units by Units in Structure Yes Yes
B21 Housing Units by Year Structure Built Yes Yes
B22 Occupied Housing Units by Year Householder Moved Into Unit Yes Yes
B23 Occupied Housing Units by Number of Vehicles Available Yes Yes
B24 Occupied Housing Units by House Heating Fuel Yes No
B25 Household Language by Linguistic Isolation Yes No
B26 Average (Mean) Household Size by Household Type Yes Yes
B27 Average (Mean) Length of Residence Yes Yes
B28 Average (Mean) Number of Vehicles Available Yes Yes
B29 Median Age of Householder Yes Yes
B30 Median Year Structure Built Yes Yes
Category C : Income and Poverty
C01 Household Income Yes Yes
C02 Family Household Income Yes Yes
C03 Households by Age of Householder and Household Income Yes Yes
C04 Household Income by Ethnicity (Households) Yes Yes
C05 Household Income by Race of Householder Yes Yes
C06 Households by Type of Income Yes No
C07 Aggregate Income (for the Population 15 Years and over) Yes Yes
C08 Aggregate Household Income Yes Yes
C09 Aggregate Family Household Income Yes Yes
C10 Aggregate Income for Households by Type of Income Yes Yes
C11 Aggregate Household Income by Ethnicity Yes Yes
C12 Aggregate Household Income by Race of Householder Yes Yes
CAPE V2_2013 Release (Fall 2013)
Page 20 │Briefing Note 2013 © Experian Ltd All rights reserved Experian Public
Table Code Table Name Current Year Estimates
(CYE) Five-Year Projections
(FYP)
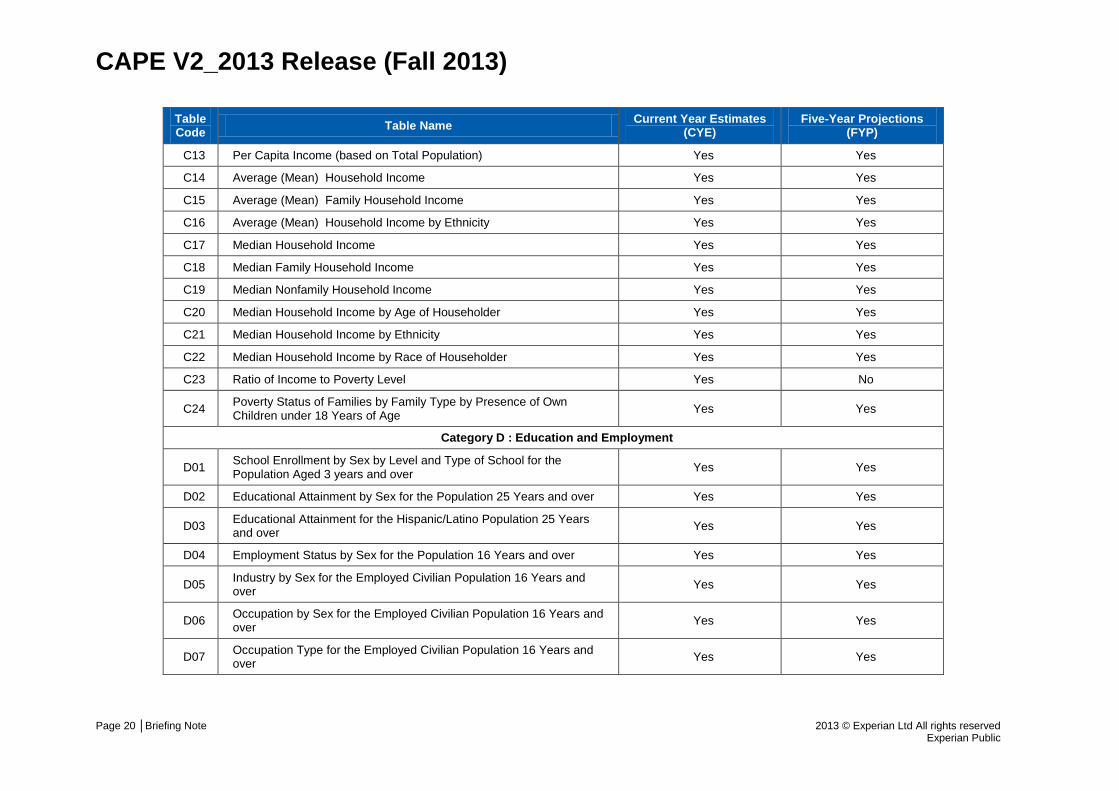
C13 Per Capita Income (based on Total Population) Yes Yes
C14 Average (Mean) Household Income Yes Yes
C15 Average (Mean) Family Household Income Yes Yes
C16 Average (Mean) Household Income by Ethnicity Yes Yes
C17 Median Household Income Yes Yes
C18 Median Family Household Income Yes Yes
C19 Median Nonfamily Household Income Yes Yes
C20 Median Household Income by Age of Householder Yes Yes
C21 Median Household Income by Ethnicity Yes Yes
C22 Median Household Income by Race of Householder Yes Yes
C23 Ratio of Income to Poverty Level Yes No
C24 Poverty Status of Families by Family Type by Presence of Own Children under 18 Years of Age Yes Yes
Category D : Education and Employment
D01 School Enrollment by Sex by Level and Type of School for the Population Aged 3 years and over Yes Yes
D02 Educational Attainment by Sex for the Population 25 Years and over Yes Yes
D03 Educational Attainment for the Hispanic/Latino Population 25 Years and over Yes Yes
D04 Employment Status by Sex for the Population 16 Years and over Yes Yes
D05 Industry by Sex for the Employed Civilian Population 16 Years and over Yes Yes
D06 Occupation by Sex for the Employed Civilian Population 16 Years and over Yes Yes
D07 Occupation Type for the Employed Civilian Population 16 Years and over Yes Yes

CAPE V2_2013 Release (Fall 2013)
Page 21 │Briefing Note 2013 © Experian Ltd All rights reserved Experian Public
Table Code Table Name Current Year Estimates
(CYE) Five-Year Projections
(FYP)
D08 Method of Transport to Work for Workers 16 Years and over Yes Yes
D09 Travel Time to Work for Workers 16 Years and over Yes Yes
D10 Time Leaving Home to go to work for Workers Aged 16 Years and over who travel to work No Yes
D11 Aggregate Travel Time to Work for Workers Age 16 Years and over who travel to work Yes Yes
D12 Average (Mean) Travel Time to Work for Workers Age 16 Years and over who travel to work Yes Yes
D13 Percentage of the Civilian Labor Force Unemployed Yes Yes