brigham 0324597703 ch.01 1. - cengage · *ram*...
TRANSCRIPT
*ram* D:/Thomson_Learning_Projects/Brigham_Full_120614/z_production/z_3B2_3D_files/Brigham_0324597703_Ch.01.3d, 12/9/8, 13:15, page: 1
PART 1
INTRODUCTIONTO FINANCIALMANAGEMENT
1 An Overview of Financial Management
CHAPTER
Cengage Learning

*ram* D:/Thomson_Learning_Projects/Brigham_Full_120614/z_production/z_3B2_3D_files/Brigham_0324597703_Ch.01.3d, 12/9/8, 13:15, page: 2
CHAPTER
1 An Overview of FinancialManagement
Str ik ing the Right Balance
In 1776, Adam Smith described how an “invisiblehand” guides companies as they strive for profits;and that hand leads them to decisions thatbenefit society. Smith’s insights led him to con-clude that profit maximization is the right goalfor a business and that the free enterprise systemis best for society. But the world has changedsince 1776. Firms today are much larger, theyoperate globally, they have thousands of employ-ees, and they are owned by millions of stock-holders. This makes us wonder if the “invisiblehand” still provides reliable guidance. Shouldcompanies still try to maximize profits; or shouldthey take a broader view and take more balancedactions designed to benefit customers, employees,suppliers, and society as a whole?
Most academics today subscribe to the fol-lowing modified version of Adam Smith’s theory:l A firm’s principal goal should be to maximize
the wealth of its stockholders, which meansmaximizing the value of its stock.
l Free enterprise is still the best economic systemfor the country as a whole.
l However, some constraints are needed—firmsshould not be allowed to pollute the air andwater, engage in unfair employment practices,or create monopolies that exploit consumers.
Profits depend on sales; and sales requirethat firms develop desirable products and serv-ices, produce them efficiently, and sell them atcompetitive prices, all of which benefit society.So the view today is that management shouldtry to maximize stock prices, but their actionsshould be subject to government-imposedconstraints.
Still, some argue that the constrained max-imization theory is inadequate. For example, GEChief Executive Officer (CEO) Jeffrey Immeltbelieves that just obeying the law is not enough.GE is the world’s most valuable company, and ithas an excellent reputation.1 Immelt argues thatvalue and reputation go hand in hand and that
©STR/AFP
/Getty
Imag
es
1Marc Gunther, “Money and Morals at GE,” Fortune, November 15, 2004, pp. 176–182.
2 Cengage Learning
*ram* D:/Thomson_Learning_Projects/Brigham_Full_120614/z_production/z_3B2_3D_files/Brigham_0324597703_Ch.01.3d, 12/9/8, 13:15, page: 3
PUTTING THINGS IN PERSPECTIVE
This chapter will give you an idea of what financial management is all about. Webegin the chapter by describing how finance is related to the overall business andby discussing the different forms of business organization. For corporations,management’s goal should be to maximize shareholder wealth, which meansmaximizing the value of the stock. When we say “maximizing the value of thestock,” we mean the “true, long-run value,” which may be different from the cur-rent stock price. Good managers understand the importance of ethics, and theyrecognize that maximizing long-run value is consistent with being sociallyresponsible. We conclude the chapter by discussing how firms must provide theright incentives if they are to get managers to focus on long-run value max-imization. When you finish this chapter, you should be able to:l Explain the role of finance and the different types of jobs in finance.l Identify the advantages and disadvantages of different forms of business
organization.l Explain the links between stock price, intrinsic value, and executive compensation.l Discuss the importance of business ethics and the consequences of unethical
behavior.l Identify the potential conflicts that arise within the firm between stockholders
and managers and between stockholders and bondholders and discuss thetechniques that firms can use to mitigate these potential conflicts.
having a good reputation with customers, suppliers,employees, and regulators is essential if value is to bemaximized. According to Immelt, “The reason people cometo work for GE is that they want to be part of somethingbigger than themselves. They want to work hard, winpromotions, and be well compensated, but they also wantto work for a company that makes a difference, a companythat’s doing great things in the world. . . . It’s up to GE to bea good citizen. Not only is that a nice thing to do, it’s goodfor business and thus the price of our stock.”
GE is by no means alone. An increasing number ofcompanies see their mission as more than just makingmoney for their shareholders. Google Inc.’s well-knowncorporate motto is “Don’t Be Evil.” Taking things a stepfurther, the company recently announced that it was set-ting aside another $30 million to be used for philanthropicventures worldwide. The company’s in-house foundation
now has assets in excess of $2 billion. Days later MicrosoftCorporation’s chairperson, Bill Gates, gave a speech to theWorld Economic Forum in which he made the case for a“creative capitalism.” Gates stated that, “Such a systemwould have a twin mission: making profits and also improvinglives for those who don’t fully benefit from market forces.”
Gates has certainly been true to his word. In 2000, heand his wife established the Bill & Melinda Gates Founda-tion. Today the fund has assets totaling $37.6 billion. Itreceived a notable boost in 2006 when famed investorWarren Buffett announced that he would donate a hugeshare of his fortune to the Foundation. To date, Buffett hascontributed more than $3 billion; and over time, he isscheduled to contribute additional shares of stock that arenow worth in excess of $40 million. These efforts show thatwhile there is more to life than money, it often takes moneyto do good things.
Sources: Patricia Sellers, “Melinda Gates Goes Public,” CNNMoney.com, January 7, 2008; Kevin J. Delaney, “Google: From ‘Don’t Be Evil’ toHow to Do Good,” The Wall Street Journal, January 18, 2008, p. B1; and Robert A. Guth, “Bill Gates Issues Call for Kinder Capitalism,” TheWall Street Journal, January 24, 2008, p. A1.
Chapter 1 An Overview of Financial Management 3
Cengage Learning
*ram* D:/Thomson_Learning_Projects/Brigham_Full_120614/z_production/z_3B2_3D_files/Brigham_0324597703_Ch.01.3d, 12/9/8, 13:15, page: 4
1-1 WHAT IS FINANCE?It’s hard to define finance—the term has many facets, which makes it difficult toprovide a clear and concise definition. The discussion in this section will give youan idea of what finance people do and what you might do if you enter the financefield after you graduate.
1-1a Finance versus Economics and AccountingFinance as we know it today grew out of economics and accounting. Economistsdeveloped the notion that an asset’s value is based on the future cash flows theasset will provide, and accountants provided information regarding the likely sizeof those cash flows. Finance then grew out of and lies between economics andaccounting, so people who work in finance need knowledge of those two fields.Also, as discussed next, in the modern corporation, the accounting departmentfalls under the control of the chief financial officer (CFO).
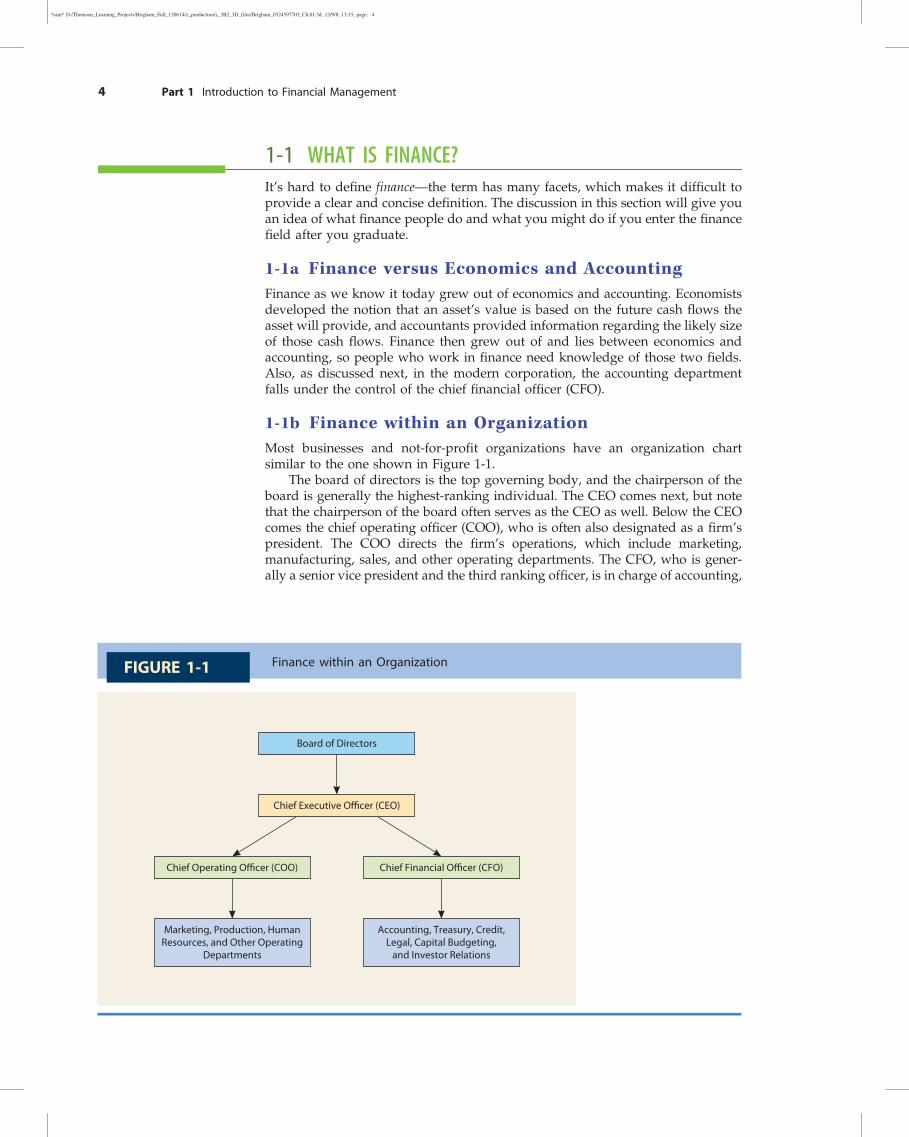
1-1b Finance within an OrganizationMost businesses and not-for-profit organizations have an organization chartsimilar to the one shown in Figure 1-1.
The board of directors is the top governing body, and the chairperson of theboard is generally the highest-ranking individual. The CEO comes next, but notethat the chairperson of the board often serves as the CEO as well. Below the CEOcomes the chief operating officer (COO), who is often also designated as a firm’spresident. The COO directs the firm’s operations, which include marketing,manufacturing, sales, and other operating departments. The CFO, who is gener-ally a senior vice president and the third ranking officer, is in charge of accounting,
Finance within an OrganizationFIGURE 1-1
Chief Operating Officer (COO)
Marketing, Production, HumanResources, and Other Operating
Departments
Accounting, Treasury, Credit,Legal, Capital Budgeting,
and Investor Relations
Board of Directors
Chief Financial Officer (CFO)
Chief Executive Officer (CEO)
4 Part 1 Introduction to Financial Management
Cengage Learning
*ram* D:/Thomson_Learning_Projects/Brigham_Full_120614/z_production/z_3B2_3D_files/Brigham_0324597703_Ch.01.3d, 12/9/8, 13:15, page: 5
financing, credit policy, decisions regarding asset acquisitions, and investor rela-tions, which involves communications with stockholders and the press.
If the firm is publicly owned, the CEO and the CFO must both certify to theSecurities and Exchange Commission (SEC) that reports released to stockholders,and especially the annual report, are accurate. If inaccuracies later emerge, theCEO and the CFO could be fined or even jailed. This requirement was instituted in2002 as a part of the Sarbanes-Oxley Act. The Act was passed by Congress in thewake of a series of corporate scandals involving now-defunct companies such asEnron and WorldCom, where investors, workers, and suppliers lost billions ofdollars due to false information released by those companies.
1-1c Corporate Finance, Capital Markets,and Investments
Finance as taught in universities is generally divided into three areas: (1) financialmanagement, (2) capital markets, and (3) investments.
Financial management, also called corporate finance, focuses on decisionsrelating to how much and what types of assets to acquire, how to raise thecapital needed to buy assets, and how to run the firm so as to maximize itsvalue. The same principles apply to both for-profit and not-for-profit organ-izations; and as the title suggests, much of this book is concerned with financialmanagement.
Capital markets relate to the markets where interest rates, along with stock andbond prices, are determined. Also studied here are the financial institutions thatsupply capital to businesses. Banks, investment banks, stockbrokers, mutualfunds, insurance companies, and the like bring together “savers”who have moneyto invest and businesses, individuals, and other entities that need capital forvarious purposes. Governmental organizations such as the Federal Reserve Sys-tem, which regulates banks and controls the supply of money, and the SEC, whichregulates the trading of stocks and bonds in public markets, are also studied aspart of capital markets.
Investments relate to decisions concerning stocks and bonds and include anumber of activities: (1) Security analysis deals with finding the proper values ofindividual securities (i.e., stocks and bonds). (2) Portfolio theory deals with the bestway to structure portfolios, or “baskets,” of stocks and bonds. Rational investorswant to hold diversified portfolios in order to limit risks, so choosing a properlybalanced portfolio is an important issue for any investor. (3) Market analysis dealswith the issue of whether stock and bond markets at any given time are “toohigh,” “too low,” or “about right.” Behavioral finance, where investor psychology isexamined in an effort to determine if stock prices have been bid up to unrea-sonable heights in a speculative bubble or driven down to unreasonable lows in afit of irrational pessimism, is a part of market analysis.
Although we separate these three areas, they are closely interconnected.Banking is studied under capital markets, but a bank lending officer evaluating abusiness’ loan request must understand corporate finance to make a sound deci-sion. Similarly, a corporate treasurer negotiating with a banker must understandbanking if the treasurer is to borrow on “reasonable” terms. Moreover, a securityanalyst trying to determine a stock’s true value must understand corporate financeand capital markets to do his or her job. In addition, financial decisions of all typesdepend on the level of interest rates; so all people in corporate finance, invest-ments, and banking must know something about interest rates and the way theyare determined. Because of these interdependencies, we cover all three areas inthis book.
Sarbanes-Oxley ActA law passed by Congressthat requires the CEO andCFO to certify that theirfirm’s financial statementsare accurate.
Chapter 1 An Overview of Financial Management 5
Cengage Learning
*ram* D:/Thomson_Learning_Projects/Brigham_Full_120614/z_production/z_3B2_3D_files/Brigham_0324597703_Ch.01.3d, 12/9/8, 13:15, page: 6
SELF TEST What is the relationship between economics, finance, and accounting?
Who is the CFO, where does this individual fit into the corporate hierarchy,and what are some of his or her responsibilities?
Does it make sense for not-for-profit organizations such as hospitals anduniversities to have CFOs?
What three areas of finance does this book cover? Are these areas inde-pendent of one another, or are they interrelated in the sense that someoneworking in one area should know something about each of the other areas?
1-2 JOBS IN FINANCENext to health care, jobs in finance have been growing faster than any other area.Finance prepares students for jobs in banking, investments, insurance, corpo-rations, and the government. Accounting students need to know finance, mar-keting, management, and human resources; they also need to understand finance,for it affects decisions in all those areas. For example, marketing people proposeadvertising programs, but those programs are examined by finance people tojudge the effects of the advertising on the firm’s profitability. So to be effective inmarketing, one needs to have a basic knowledge of finance. The same holds formanagement—indeed, most important management decisions are evaluated interms of their effects on the firm’s value. This is called value-based management,and it is the “in” thing today.
It is also worth noting that finance is important to individuals regardless oftheir jobs. Some years ago most businesses provided pensions to their employees,so managing one’s personal investments was not critically important. That’s nolonger true. Most firms today provide what’s called “defined contribution” pen-sion plans, where each year the company puts a specified amount of money intoan account that belongs to the employee. The employee must decide how thosefunds are to be invested—how much should be divided among stocks, bonds, ormoney funds and how risky the stocks and bonds should be. These decisions havea major effect on people’s lives, and the concepts covered in this book can improvedecision-making skills.
1-3 FORMS OF BUSINESS ORGANIZATIONThe basics of financial management are the same for all businesses, large or small,regardless of how they are organized. Still, a firm’s legal structure affects itsoperations and thus should be recognized. There are four main forms of businessorganizations: (1) sole proprietorships, (2) partnerships, (3) corporations, and (4)limited liability companies (LLCs) and limited liability partnerships (LLPs). Interms of numbers, most businesses are sole proprietorships. However, based onthe dollar value of sales, about 80% of all business is done by corporations.Because corporations conduct the most business and because most successfulbusinesses eventually convert to corporations, we concentrate on them in thisbook. Still, it is important to understand the legal differences between firms.
A proprietorship is an unincorporated business owned by one individual.Going into business as a sole proprietor is easy—a person begins business oper-ations. Proprietorships have three important advantages: (1) They are easily andinexpensively formed, (2) they are subject to few government regulations, and
To find information aboutdifferent finance careers, goto www.careers-in-finance.com. This web site providesinformation about differentfinance areas andrecommends different booksabout jobs in finance.
ProprietorshipAn unincorporated busi-ness owned by oneindividual.
6 Part 1 Introduction to Financial Management
Cengage Learning
*ram* D:/Thomson_Learning_Projects/Brigham_Full_120614/z_production/z_3B2_3D_files/Brigham_0324597703_Ch.01.3d, 12/9/8, 13:15, page: 7
(3) they are subject to lower income taxes than are corporations. However, pro-prietorships also have three important limitations: (1) Proprietors have unlimitedpersonal liability for the business’s debts, so they can lose more than the amount ofmoney they invested in the company. You might invest $10,000 to start a businessbut be sued for $1 million if, during company time, one of your employees runsover someone with a car. (2) The life of the business is limited to the life of theindividual who created it; and to bring in new equity, investors require a changein the structure of the business. (3) Because of the first two points, proprietorshipshave difficulty obtaining large sums of capital; hence, proprietorships are usedprimarily for small businesses. However, businesses are frequently started asproprietorships and then converted to corporations when their growth results inthe disadvantages outweighing their advantages.
A partnership is a legal arrangement between two or more people who decideto do business together. Partnerships are similar to proprietorships in that they canbe established relatively easily and inexpensively. Moreover, the firm’s income isallocated on a pro rata basis to the partners and is taxed on an individual basis.This allows the firm to avoid the corporate income tax. However, all of thepartners are generally subject to unlimited personal liability, which means that if apartnership goes bankrupt and any partner is unable to meet his or her pro ratashare of the firm’s liabilities, the remaining partners will be responsible for makinggood on the unsatisfied claims. Thus, the actions of a Texas partner can bring ruinto a millionaire New York partner who had nothing to do with the actions that ledto the downfall of the company. Unlimited liability makes it difficult for part-nerships to raise large amounts of capital.2
A corporation is a legal entity created by a state, and it is separate and distinctfrom its owners and managers. It is this separation that limits stockholders’ losses tothe amount they invested in the firm—the corporation can lose all of its money, but itsowners can lose only the funds that they invested in the company. Corporations alsohave unlimited lives, and it is easier to transfer shares of stock in a corporation thanone’s interest in an unincorporated business. These factors make it much easier forcorporations to raise the capital necessary to operate large businesses. Thus, com-panies such as Hewlett-Packard and Microsoft generally begin as proprietorships orpartnerships, but at some point they find it advantageous to become a corporation.
A major drawback to corporations is taxes. Most corporations’ earnings aresubject to double taxation—the corporation’s earnings are taxed; and then whenits after-tax earnings are paid out as dividends, those earnings are taxed again aspersonal income to the stockholders. However, as an aid to small businesses, Con-gress created S corporations, which are taxed as if they were partnerships; thus, theyare exempt from the corporate income tax. To qualify for S corporation status, a firmcan have no more than 75 stockholders, which limits their use to relatively small,privately owned firms. Larger corporations are known as C corporations. The vastmajority of small corporations elect S status and retain that status until they decide tosell stock to the public, at which time they become C corporations.
A limited liability company (LLC) is a relatively new type of organizationthat is a hybrid between a partnership and a corporation. A limited liabilitypartnership (LLP) is similar to an LLC; but LLPs are used for professional firms in
2Originally, there were just “plain vanilla” partnerships; but over the years, lawyers have created a number ofvariations. We leave the variations to courses on business law, but we note that the variations are generallydesigned to limit the liabilities of some of the partners. For example, a “limited partnership” has a general partner,who has unlimited liability, and one or more limited partners, whose liability is limited to the amount of theirinvestment. This sounds great from the standpoint of limited liability; but the limited partners must cede solecontrol to the general partner, which means that they have almost no say in the way the firm is managed. With acorporation, the owners (stockholders) have limited liability, but they also have the right to vote and thus changemanagement if they think that a change is in order. Note too that LLCs and LLPs, discussed later in this section,are increasingly used in lieu of partnerships.
PartnershipAn unincorporated busi-ness owned by two ormore persons.
CorporationA legal entity created by astate, separate and dis-tinct from its owners andmanagers, having unlim-ited life, easy trans-ferability of ownership,and limited liability.
S CorporationA special designation thatallows small businessesthat meet qualifications tobe taxed as if they were aproprietorship or a part-nership rather than acorporation.
Limited LiabilityCompany (LLC)A relatively new type oforganization that is ahybrid between a part-nership and a corporation.
Limited LiabilityPartnership (LLP)Similar to an LLC but usedfor professional firms inthe fields of accounting,law, and architecture. Ithas limited liability likecorporations but is taxedlike partnerships.
Chapter 1 An Overview of Financial Management 7
Cengage Learning
*ram* D:/Thomson_Learning_Projects/Brigham_Full_120614/z_production/z_3B2_3D_files/Brigham_0324597703_Ch.01.3d, 12/9/8, 13:15, page: 8
the fields of accounting, law, and architecture, while LLCs are used by otherbusinesses. Both LLCs and LLPs have limited liability like corporations but aretaxed like partnerships. Further, unlike limited partnerships, where the generalpartner has full control of the business, the investors in an LLC or LLP have votesin proportion to their ownership interest. LLCs and LLPs have been gaining inpopularity in recent years, but large companies still find it advantageous to be Ccorporations because of the advantages in raising capital to support growth.LLCs/LLPs were dreamed up by lawyers, and it is necessary to hire a goodlawyer when establishing one.3
When deciding on its form of organization, a firm must trade off the advan-tages of incorporation against a possibly higher tax burden. However, for thefollowing reasons, the value of any business other than a relatively small one willprobably be maximized if it is organized as a corporation:1. Limited liability reduces the risks borne by investors; and other things held
constant, the lower the firm’s risk, the higher its value.2. A firm’s value is dependent on its growth opportunities, which are dependent
on its ability to attract capital. Because corporations can attract capital moreeasily than other types of businesses, they are better able to take advantage ofgrowth opportunities.
3. The value of an asset also depends on its liquidity, which means the time andeffort it takes to sell the asset for cash at a fair market value. Because the stockof a corporation is easier to transfer to a potential buyer than is an interest in aproprietorship or partnership and because more investors are willing to investin stocks than in partnerships (with their potential unlimited liability), a cor-porate investment is relatively liquid. This too enhances the value of acorporation.
SELF TEST What are the key differences between proprietorships, partnerships, andcorporations?
How are LLCs and LLPs related to the other forms of organization?
What is an S corporation, and what is its advantage over a C corporation?Why don’t firms such as IBM, GE, and Microsoft choose S corporation status?
What are some reasons the value of a business other than a small one isgenerally maximized when it is organized as a corporation?
Suppose you are relatively wealthy and are looking for a potential invest-ment. You do not plan to be active in the business. Would you be moreinterested in investing in a partnership or in a corporation? Why or why not?
1-4 STOCK PRICES AND SHAREHOLDER VALUEThe primary goal of a corporation should be to maximize its owners’ value, but aproprietor’s goal might be quite different. Consider Larry Jackson, the proprietorof a local sporting goods store. Jackson is in business to make money, but he likesto take time off to play golf on Fridays. He also has a few employees who are nolonger very productive, but he keeps them on the payroll out of friendship andloyalty. Jackson is running the business in a way that is consistent with his own
3LLCs and LLPs are relatively complicated structures, and what they can do and how they must be set up varies bystate. Moreover, they are still evolving. If you are interested in learning more about them, we recommend that yougo to Google (or another search engine), enter LLC or LLP, and see the many references that are available.
8 Part 1 Introduction to Financial Management
Cengage Learning

*ram* D:/Thomson_Learning_Projects/Brigham_Full_120614/z_production/z_3B2_3D_files/Brigham_0324597703_Ch.01.3d, 12/9/8, 13:15, page: 9
personal goals. He knows that he could make more money if he didn’t play golf orif he replaced some of his employees. But he is comfortable with his choices; andsince it is his business, he is free to make those choices.
By contrast, Linda Smith is CEO of a large corporation. Smith manages thecompany; but most of the stock is owned by shareholders who purchased it becausethey were looking for an investment that would help them retire, send their childrento college, pay for a long-anticipated trip, and so forth. The shareholders elected aboard of directors, which then selected Smith to run the company. Smith and thefirm’s other managers are working on behalf of the shareholders, and they werehired to pursue policies that enhance shareholder value. At the same time, themanagers know that this does not mean maximize shareholder value “at all costs.”Managers have an obligation to behave ethically, and they must follow the laws andother society-imposed constraints that we discussed in the opening vignette to thischapter. Throughout this book, we focus primarily on publicly owned companies;hence, we operate on the assumption that management’s primary goal is share-holder wealth maximization. That translates into this rule:
A manager should try to maximize the price of the firm’s stock, subject to theconstraints discussed in the opening vignette.
If a manager is to maximize shareholder wealth, he or she must know how thatwealth is determined. Essentially, shareholder wealth is the number of shares out-standing times the market price per share. For example, if you own 100 shares ofGE’s stock and the price is $40 per share, your wealth in GE is $4,000. The wealth ofall of GE’s stockholders can be summed; and that is the value of the firm’s stock, theitem that management should maximize. The number of shares outstanding is agiven, so what really determines shareholder wealth is the price of the stock.
Throughout this book, we will see that the value of any asset is the presentvalue of the stream of cash flows the asset provides to its owners. We discuss stockvaluation in depth in Chapter 9, where we will see that a stock’s price at any giventime depends on the cash flows a “marginal” investor expects to receive after buyingthe stock. To illustrate, suppose investors are aware that GE earned $2.20 per share in2007 and paid out 52% of that amount, or $1.15 per share, in dividends. Supposefurther that most investors expect earnings, dividends, and the stock price to increaseby about 6% per year. It might turn out that these expectations are met exactly.However, management might make a prudent decision that causes profits to rise at a12% rate, causing the stock price to jump from $40 to $60 per share. Of course,management might make a big mistake, profits might suffer, and the stock pricemight decline to $20. Thus, investors are exposed to risk when they buy GE stock orany other company’s stock. If, instead, the investor bought a U.S. Treasury bond, heor she would receive a guaranteed interest payment every 6 months plus the bond’spar value when it matures; so his or her risk would be minimal.
We see then that if GE’s management makes good decisions, its stock pricewill increase; however, if its managers make bad decisions, the stock price willdecrease. Management’s goal should be to make decisions designed to maximize thestock’s price. Note, though, that factors beyond management’s control also affectstock prices. Thus, after the 9/11 terrorist attacks on the World Trade Center, theprice of most stocks fell no matter how effective their management may have been.
Firms have a number of different departments, including marketing,accounting, production, human resources, and finance. The finance department’sprincipal task is to evaluate proposed decisions and judge how they will affect thestock price and thus shareholder wealth. For example, suppose the productionmanager wants to replace some old equipment with new automated machinerythat will reduce labor costs. The finance staff will evaluate that proposal anddetermine whether the savings seem to be worth the cost. Similarly, if marketingwants to sign a contract with Tiger Woods that will cost $10 million per year for
Shareholder WealthMaximizationThe primary goal formanagers of publiclyowned companies impliesthat decisions should bemade to maximize thelong-run value of thefirm’s common stock.
Chapter 1 An Overview of Financial Management 9
Cengage Learning
*ram* D:/Thomson_Learning_Projects/Brigham_Full_120614/z_production/z_3B2_3D_files/Brigham_0324597703_Ch.01.3d, 12/9/8, 13:15, page: 10
5 years, the financial staff will evaluate the proposal, look at the probable increasein sales, and reach a conclusion as to whether signing Tiger will lead to a higher stockprice. Most significant decisions are evaluated in terms of their financial consequences.
Note too that stock prices change over time as conditions change and asinvestors obtain new information about a company’s prospects. For example,Apple Computer’s stock ranged from $77 to $193 per share during a recent12-month period, rising and falling as good and bad news was released. Wal-Mart,which is in a more stable industry, had a narrower price range—from $42 to $52.Investors can predict future results for Wal-Mart more accurately than for Apple;thus, Wal-Mart is thought to be less risky. Also, some projects are relativelystraightforward and easy to evaluate and, hence, not very risky. For example, ifWal-Mart were considering a proposed new store, the revenues, costs, and profitsfor this project would be easier to estimate than for an Apple project related to anew voice-activated computer. The success or lack thereof of projects such as thesedetermine the stock prices of Wal-Mart, Apple, and other companies.
SELF TEST What is management’s primary goal?
What do investors expect to receive when they buy a share of stock? Doinvestors know for sure how much they will receive? Explain.
Based just on the name, which company would you expect to be riskier—General Foods or South Seas Oil Exploration? Explain.
When Boeing decides to invest $5 billion in a new jet airliner, are itsmanagers certain of the project’s effects on Boeing’s future profits and stockprice? Explain.
Who would be better able to judge the effect of a new airliner on Boeing’sprofits—its managers or its stockholders? Explain.
Would all Boeing stockholders expect the same outcome from a given newproject, and how would those expectations affect the stock’s price? Explain.
1-5 INTRINSIC VALUES, STOCK PRICES,AND EXECUTIVE COMPENSATION
As noted in the preceding section, stock prices are based on cash flows expected infuture years, not just in the current year. Thus, stock price maximization requiresus to take a long-run view of operations. Academics have generally assumed thatmanagers adhere to this long-run focus, but it is now clear that the focus for manycompanies shifted to the short run in recent years. To give managers an incentiveto focus on stock prices, stockholders (acting through boards of directors) awardedexecutives stock options that could be exercised on a specified future date. Anexecutive could exercise the option on that date, receive stock, immediately sell it,and earn a profit. The profit was based on the stock price on the option exercisedate, which led some managers to try to maximize the stock price on that specificdate, not over the long run. That, in turn, led to some horrible abuses. Projects thatlooked good from a long-run perspective were turned down because they wouldpenalize profits in the short run and thus lower the stock price on the optionexercise day. Even worse, some managers deliberately overstated profits, tem-porarily boosted the stock price, exercised their options, sold the inflated stock,and left outside stockholders “holding the bag” when the true situation wasrevealed. Enron and WorldCom are examples of companies whose managers didthis, but there were many others.
10 Part 1 Introduction to Financial Management
Cengage Learning
*ram* D:/Thomson_Learning_Projects/Brigham_Full_120614/z_production/z_3B2_3D_files/Brigham_0324597703_Ch.01.3d, 12/9/8, 13:15, page: 11
Other companies have also used aggressive but legal accounting practices thatboosted current profits but lowered profits in future years. For example, knowingthat an asset would be usable for only 5 years, management might depreciate itover a 10-year life. This reduces reported costs—and raises reported income—forthe next 5 years but raises costs and lowers income during the following 5 years.Many other legal but questionable accounting procedures have been used, all in aneffort to boost reported profits and the stock price on the option exercise day.Obviously, all this can make it difficult for investors to decide how much a stock isreally worth, and it helps explain why a firm’s reputation is an important deter-minant of its stock price.
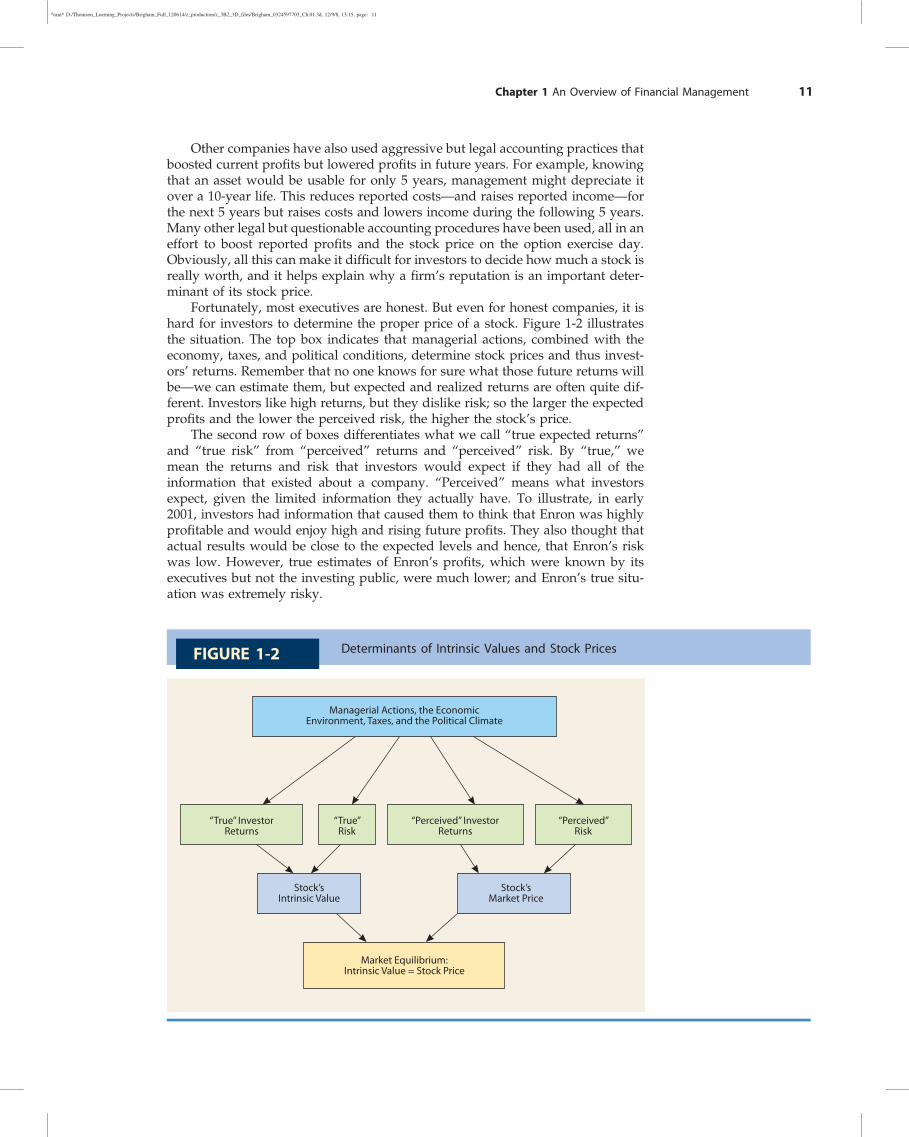
Fortunately, most executives are honest. But even for honest companies, it ishard for investors to determine the proper price of a stock. Figure 1-2 illustratesthe situation. The top box indicates that managerial actions, combined with theeconomy, taxes, and political conditions, determine stock prices and thus invest-ors’ returns. Remember that no one knows for sure what those future returns willbe—we can estimate them, but expected and realized returns are often quite dif-ferent. Investors like high returns, but they dislike risk; so the larger the expectedprofits and the lower the perceived risk, the higher the stock’s price.
The second row of boxes differentiates what we call “true expected returns”and “true risk” from “perceived” returns and “perceived” risk. By “true,” wemean the returns and risk that investors would expect if they had all of theinformation that existed about a company. “Perceived” means what investorsexpect, given the limited information they actually have. To illustrate, in early2001, investors had information that caused them to think that Enron was highlyprofitable and would enjoy high and rising future profits. They also thought thatactual results would be close to the expected levels and hence, that Enron’s riskwas low. However, true estimates of Enron’s profits, which were known by itsexecutives but not the investing public, were much lower; and Enron’s true situ-ation was extremely risky.
Determinants of Intrinsic Values and Stock PricesFIGURE 1-2
Managerial Actions, the EconomicEnvironment, Taxes, and the Political Climate
“True” InvestorReturns
“True”Risk
“Perceived” InvestorReturns
“Perceived”Risk
Stock’sIntrinsic Value
Stock’sMarket Price
Market Equilibrium:Intrinsic Value = Stock Price
Chapter 1 An Overview of Financial Management 11
Cengage Learning
*ram* D:/Thomson_Learning_Projects/Brigham_Full_120614/z_production/z_3B2_3D_files/Brigham_0324597703_Ch.01.3d, 12/9/8, 13:15, page: 12
The third row of boxes shows that each stock has an intrinsic value, which isan estimate of the stock’s “true” value as calculated by a competent analyst whohas the best available risk and return data, and a market price, which is the actualmarket price based on perceived but possibly incorrect information as seen by themarginal investor.4 Not all investors agree, so it is the “marginal” investor whodetermines the actual price. For example, investors at the margin might expect afirm to pay a $1.00 dividend with a 5% growth rate thereafter; and on that basis,they might set the firm’s stock price at $45 per share. However, if they had all ofthe available facts, they might conclude that the dividend would be $1.30 with a7% growth rate, which would lead to a price of $50 per share. In this case, theactual market price would be $45 versus an intrinsic value of $50.
When a stock’s actual market price is equal to its intrinsic value, the stock is inequilibrium, which is shown in the bottom box in Figure 1-2; and when equi-librium exists, there is no pressure for a change in the stock’s price. Market pricescan and do differ from intrinsic values; but eventually, as the future unfolds, thetwo values tend to converge.
Actual stock prices are easy to determine—they can be found on the Internetand are published in newspapers every day. However, intrinsic values are esti-mates; and different analysts with different data and different views about thefuture form different estimates of a stock’s intrinsic value. Indeed, estimatingintrinsic values is what security analysis is all about and is what distinguishes successfulfrom unsuccessful investors. Investing would be easy, profitable, and essentiallyriskless if we knew all stocks’ intrinsic values; but, of course, we don’t. We canestimate intrinsic values, but we can’t be sure that we are right. A firm’s managershave the best information about the firm’s future prospects, so managers’ esti-mates of intrinsic values are generally better than those of outside investors.However, even managers can be wrong.
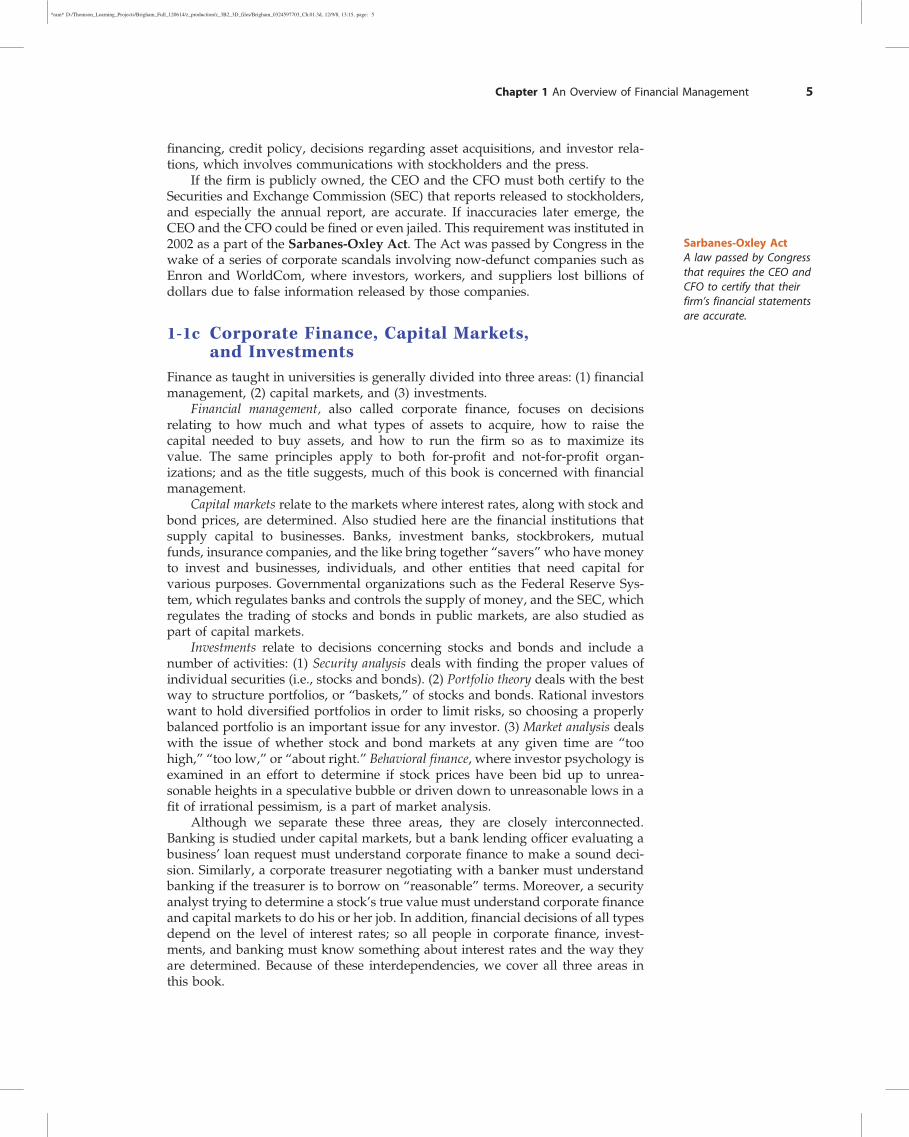
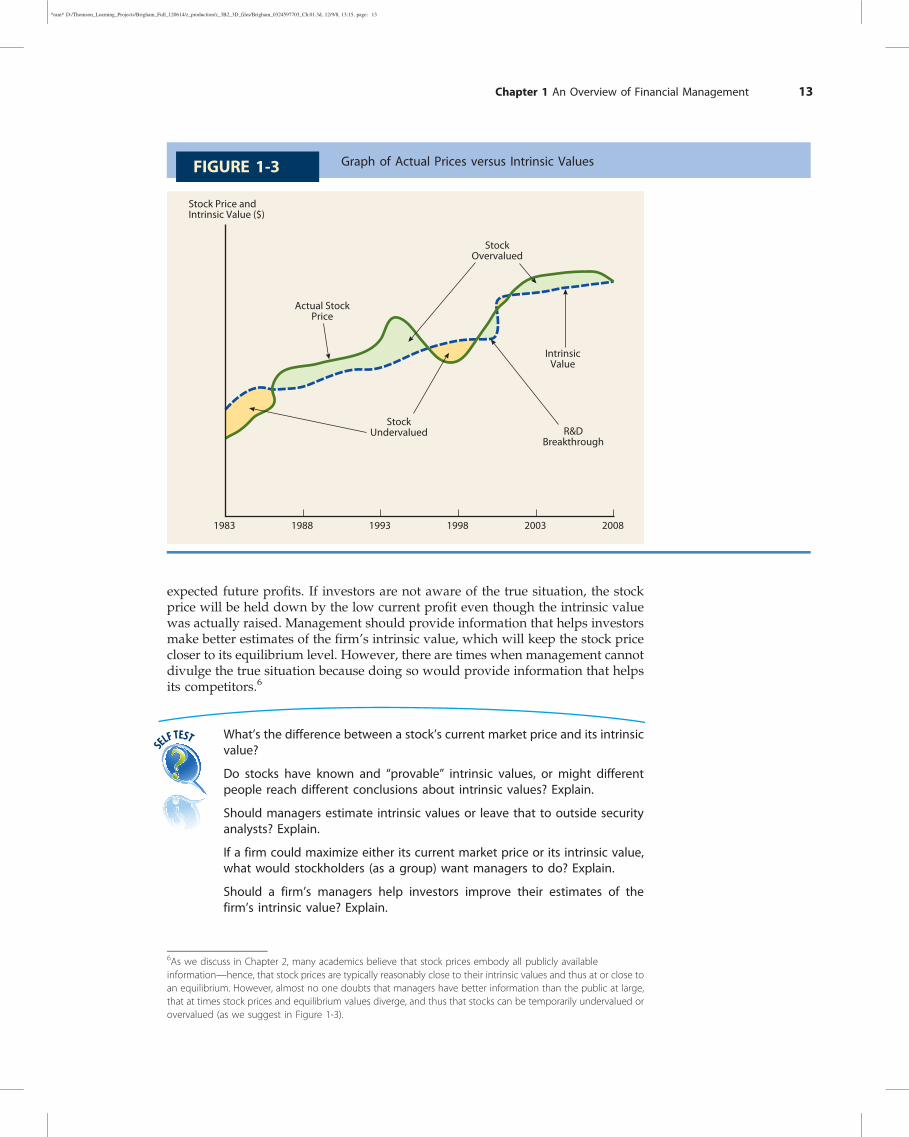
Figure 1-3 graphs a hypothetical company’s actual price and intrinsic value asestimated by its management over time.5 The intrinsic value rises because the firmretains and reinvests earnings each year, which tends to increase profits. The valuejumped dramatically in 2003, when a research and development (R&D) break-through raised management’s estimate of future profits before investors had thisinformation. The actual stock price tended to move up and down with the esti-mated intrinsic value; but investor optimism and pessimism, along with imperfectknowledge about the true intrinsic value, led to deviations between the actualprices and intrinsic values.
Intrinsic value is a long-run concept. It reflects both improper actions (likeEnron’s overstating earnings) and proper actions (like GE’s efforts to improve theenvironment). Management’s goal should be to take actions designed to maximizethe firm’s intrinsic value, not its current market price. Note, though, that maximizingthe intrinsic value will maximize the average price over the long run, but notnecessarily the current price at each point in time. For example, managementmight make an investment that lowers profits for the current year but raises
Intrinsic ValueAn estimate of a stock’s“true” value based onaccurate risk and returndata. The intrinsic valuecan be estimated but notmeasured precisely.
Market PriceThe stock value based onperceived but possiblyincorrect information asseen by the marginalinvestor.
Marginal InvestorAn investor whose viewsdetermine the actual stockprice.
4Investors at the margin are the ones who actually set stock prices. Some stockholders think that a stock at itscurrent price is a good deal, and they would buy more if they had more money. Others think that the stock ispriced too high, so they would not buy it unless the price dropped sharply. Still others think that the current stockprice is about where it should be; so they would buy more if the price fell slightly, sell it if the price rose slightly,and maintain their current holdings unless something were to change. These are the marginal investors, and it istheir view that determines the current stock price. We discuss this point in more depth in Chapter 9, where wediscuss the stock market in detail.5We emphasize that the intrinsic value is an estimate and that different analysts have different estimates for acompany at any given time. Managers should also estimate their firm’s intrinsic value and then take actions tomaximize that value. They should try to help outside security analysts improve their intrinsic value estimates byproviding accurate information about the company’s financial position and operations, but without releasinginformation that would help its competitors. Enron, WorldCom, and a number of other companies tried todeceive analysts; and they succeeded all too well.
EquilibriumThe situation in which theactual market price equalsthe intrinsic value, soinvestors are indifferentbetween buying or sellinga stock.
12 Part 1 Introduction to Financial Management
Cengage Learning
*ram* D:/Thomson_Learning_Projects/Brigham_Full_120614/z_production/z_3B2_3D_files/Brigham_0324597703_Ch.01.3d, 12/9/8, 13:15, page: 13
expected future profits. If investors are not aware of the true situation, the stockprice will be held down by the low current profit even though the intrinsic valuewas actually raised. Management should provide information that helps investorsmake better estimates of the firm’s intrinsic value, which will keep the stock pricecloser to its equilibrium level. However, there are times when management cannotdivulge the true situation because doing so would provide information that helpsits competitors.6
SELF TEST What’s the difference between a stock’s current market price and its intrinsicvalue?
Do stocks have known and “provable” intrinsic values, or might differentpeople reach different conclusions about intrinsic values? Explain.
Should managers estimate intrinsic values or leave that to outside securityanalysts? Explain.
If a firm could maximize either its current market price or its intrinsic value,what would stockholders (as a group) want managers to do? Explain.
Should a firm’s managers help investors improve their estimates of thefirm’s intrinsic value? Explain.
Graph of Actual Prices versus Intrinsic ValuesFIGURE 1-3
R&DBreakthrough
Actual StockPrice
IntrinsicValue
StockUndervalued
StockOvervalued
1983 1988 1993 1998 2003 2008
Stock Price and Intrinsic Value ($)
6As we discuss in Chapter 2, many academics believe that stock prices embody all publicly availableinformation—hence, that stock prices are typically reasonably close to their intrinsic values and thus at or close toan equilibrium. However, almost no one doubts that managers have better information than the public at large,that at times stock prices and equilibrium values diverge, and thus that stocks can be temporarily undervalued orovervalued (as we suggest in Figure 1-3).
Chapter 1 An Overview of Financial Management 13
Cengage Learning
*ram* D:/Thomson_Learning_Projects/Brigham_Full_120614/z_production/z_3B2_3D_files/Brigham_0324597703_Ch.01.3d, 12/9/8, 13:15, page: 14
1-6 IMPORTANT BUSINESS TRENDSFour important business trends should be noted. First, the points discussed in thepreceding section have led to profound changes in business practices. Executivesat Enron, WorldCom, and other companies lied when they reported financialresults, leading to huge stockholder losses. These companies’ CEOs later claimednot to have been aware of what was happening, and their knowledge (orlack thereof) was a central issue in their trials. As a result, Congress passed theSarbanes-Oxley bill, which requires the CEO and CFO of a firm to certify that thefirm’s financial statements are accurate. These executives can be sent to jail if itlater turns out that the statements did not meet the required standards. Conse-quently, businesses beefed up their internal and external auditing procedures, andthe accuracy of published statements has improved.
A second trend is the increased globalization of business. Developments in com-munications technology have made it possible for Wal-Mart, for example, to obtainreal-time data on the sales of hundreds of thousands of items in stores from China toChicago and tomanage all of its stores fromBentonville, Arkansas. IBM,Microsoft, andother high-tech companies now have research labs and help desks in China, India,and Romania; and customers of HomeDepot and other retailers have their telephoneand e-mail questions answered by call center operators in countries around the globe.Coca-Cola, Exxon Mobil, GE, and IBM, among others, generate more than half oftheir sales and income overseas. The trend toward globalization is likely to continue,and companies that resist will have difficulty competing in the 21st century.7
A third trend that’s having a profound effect on financial management is ever-improving information technology (IT). Improvements in IT are spurring global-ization, and they are changing financial management as it is practiced in the
GLOBAL PERSPECTIVES
IS SHAREHOLDER WEALTH MAXIMIZATION A WORLDWIDE GOAL?Most academics agree that shareholder wealth max-imization should be a firm’s primary goal, but it’s not clearthat people elsewhere really know how to implement it.PricewaterhouseCoopers (PWC), a global consulting firm,conducted a survey of 82 Singapore companies to testtheir understanding and implementation of shareholdervalue concepts. Ninety percent of the respondents saidtheir firm’s primary goal was to enhance shareholdervalue, but only 44% had taken steps to achieve this goal.Moreover, almost half of the respondents who hadshareholder value programs in place said they were dis-satisfied with the results achieved thus far. Even so,respondents who focused on shareholder value weremore likely to believe that their stock was fairly valuedthan those with other focuses, and 50% of those without a
specific program said they wanted to learn more andwould probably adopt the goal of shareholder wealthmaximization eventually.
The study found that firms measure performance pri-marily with accounting-based measures such as the returnon assets, equity, or invested capital. These measures areeasy to understand and thus to implement, even thoughthey are not the best conceptually. When compensationwas tied to shareholder value, this was only for mid-levelmanagers and above.
It is unclear how closely these results correspond toU.S. firms, but firms in the United States and Singaporewould certainly agree on one thing: It is easier to setthe goal of shareholder wealth maximization than it is tofigure out how to achieve it.
Source: Kalpana Rashiwala, “Low Adoption of Shareholder Value Concepts Here,” The Business Times (Singapore), February 14, 2002.
7To give you an idea of the prevalence of globalization, the computer programming that causes the test bankproblems for this book to vary randomly was outsourced to programmers in Moscow, Russia. Our books havebeen translated into 11 languages, and they are sold throughout the world. Globalization is alive and well!
14 Part 1 Introduction to Financial Management
Cengage Learning
*ram* D:/Thomson_Learning_Projects/Brigham_Full_120614/z_production/z_3B2_3D_files/Brigham_0324597703_Ch.01.3d, 12/9/8, 13:15, page: 15
United States and elsewhere. Firms are collecting massive amounts of data andusing it to take much of the guesswork out of financial decisions. For example,when Wal-Mart is considering a potential site for a new store, it can draw onhistorical results from thousands of other stores to predict results at the proposedsite. This lowers the risk of investing in new stores.
A fourth trend relates to corporate governance, or the way the top managersoperate and interface with stockholders. Some years ago the chairperson of the boardof directors was almost always also the CEO, and this individual decided whowould be elected to the board. That made it almost impossible for stockholders toreplace a poor management team. Today, though, active investors who control hugepools of capital (hedge funds and private equity groups) are constantly looking forunderperforming firms; and they will quickly pounce on laggards, take control, andreplace managers. At the same time, the SEC, which has jurisdiction over the waystockholders vote and the information they must be given, has been making it easierfor activist stockholders to change the way things are done within firms. Forexample, the SEC is forcing companies to provide more transparent information onCEO compensation, which is affecting managers’ actions.
SELF TEST What four trends affect business management in general and financialmanagement in particular?
1-7 BUSINESS ETHICSAs a result of the Enron scandal and other recent scandals, there has been a strongpush to improve business ethics. This is occurring on several fronts—actions begunby former New York attorney general and former governor Elliot Spitzer andothers who sued companies for improper acts; Congress’ passing of the SarbanesOxley bill to impose sanctions on executives who sign financial statements laterfound to be false; and business schools trying to inform students about properversus improper business actions.
As noted earlier, companies benefit from having good reputations and arepenalized by having bad ones; the same is true for individuals. Reputations reflectthe extent to which firms and people are ethical. Ethics is defined in Webster’s Dic-tionary as “standards of conduct or moral behavior.” Business ethics can be thoughtof as a company’s attitude and conduct toward its employees, customers, commu-nity, and stockholders. A firm’s commitment to business ethics can be measured bythe tendency of its employees, from the top down, to adhere to laws, regulations,and moral standards relating to product safety and quality, fair employment prac-tices, fair marketing and selling practices, the use of confidential information forpersonal gain, community involvement, and illegal payments to obtain business.
1-7a What Companies Are DoingMost firms today have strong written codes of ethical behavior; companies alsoconduct training programs to ensure that employees understand proper behaviorin different situations. When conflicts arise involving profits and ethics, ethicalconsiderations sometimes are so obviously important that they dominate. In othercases, however, the right choice is not clear. For example, suppose that NorfolkSouthern’s managers know that its coal trains are polluting the air; but the amountof pollution is within legal limits, and further reduction would be costly. Are the
Business EthicsA company’s attitude andconduct toward itsemployees, customers,community, andstockholders.
Chapter 1 An Overview of Financial Management 15
Cengage Learning
*ram* D:/Thomson_Learning_Projects/Brigham_Full_120614/z_production/z_3B2_3D_files/Brigham_0324597703_Ch.01.3d, 12/9/8, 13:15, page: 16
managers ethically bound to reduce pollution? Similarly, several years agoMerck’s research indicated that its Vioxx pain medicine might be causing heartattacks. However, the evidence was not overly strong, and the product was clearlyhelping some patients. Over time, additional tests produced stronger evidencethat Vioxx did pose a health risk. What should Merck have done, and whenshould Merck have done it? If the company released negative but perhapsincorrect information, this announcement would have hurt sales and possiblyprevented some patients who could have benefit from using the product. If thecompany delayed the release of this additional information, more patients mighthave suffered irreversible harm. At what point should Merck have made thepotential problem known to the public? There are no obvious answers to questionssuch as these; but companies must deal with them, and a failure to handle themproperly can lead to severe consequences.
1-7b Consequences of Unethical BehaviorOver the past few years, ethical lapses have led to a number of bankruptcies. Therecent collapses of Enron and WorldCom as well as the accounting firm ArthurAndersen dramatically illustrate how unethical behavior can lead to a firm’s rapiddecline. In all three cases, top executives came under fire because of misleadingaccounting practices that led to overstated profits. Enron and WorldCom execu-tives were busily selling their stock at the same time they were recommending thestock to employees and outside investors. These executives reaped millions beforethe stock declined, while lower-level employees and outside investors were left“holding the bag.” Some of these executives are now in jail, and Enron’s CEO hada fatal heart attack while awaiting sentencing after being found guilty of con-spiracy and fraud. Moreover, Merrill Lynch and Citigroup, which were accused offacilitating these frauds, were fined hundreds of millions of dollars.
These frauds also severely damaged other companies and even whole industries.For example, WorldCom understated its costs by billions of dollars. It then usedthose artificially low costs when it set prices for its customers. Not knowing thatWorldCom’s results were built on lies, AT&T’s CEO put pressure on his ownmanagers to match WorldCom’s costs and prices. AT&T cut back on importantprojects, put far too much stress on its employees, acquired other companies at highprices, and ended up ruining a successful 100-year-old company.8 A similar situationoccurred in the energy industry as a result of Enron’s cheating.
These and other improper actions caused many investors to lose faith inAmerican business and to turn away from the stock market, which made it dif-ficult for firms to raise the capital they needed to grow, create jobs, and stimulatethe economy. So unethical actions can have adverse consequences far beyond thecompanies that perpetrate them.
All this raises a question: Are companies unethical, or is it just a few of theiremployees? That was a central issue that came up in the case of Arthur Andersen,the accounting firm that audited Enron, WorldCom, and several other companiesthat committed accounting fraud. Evidence showed that relatively few ofAndersen’s accountants helped perpetrate the frauds. Its top managers arguedthat while a few rogue employees did bad things, most of the firm’s 85,000employees, and the firm itself, were innocent. The U.S. Justice Department dis-agreed, concluding that the firm was guilty because it fostered a climate whereunethical behavior was permitted and that Andersen used an incentive system
8The original AT&T was reorganized into a manufacturing company (Lucent), 8 regional telephone companies,and a long-distance company that retained the AT&T name. WorldCom was in the long-distance business andthus competed with the surviving AT&T. Partly as the result of its efforts to match WorldCom’s phony costs andprices, AT&T lost billions. In the end, AT&T was acquired by the smallest of the 8 regional companies, which thentook the AT&T name.
16 Part 1 Introduction to Financial Management
Cengage Learning
*ram* D:/Thomson_Learning_Projects/Brigham_Full_120614/z_production/z_3B2_3D_files/Brigham_0324597703_Ch.01.3d, 12/9/8, 13:15, page: 17
that made such behavior profitable to both the perpetrators and the firm. As aresult, Andersen was put out of business, its partners lost millions of dollars, andits 85,000 employees lost their jobs. In most other cases, individuals rather thanfirms were tried; and while the firms survived, they suffered damage to theirreputations, which greatly lowered their future profit potential and value.
1-7c How Should Employees Deal withUnethical Behavior?
Far too often the desire for stock options, bonuses, and promotions drives man-agers to take unethical actions such as fudging the books to make profits in themanager’s division look good, holding back information about bad products thatwould depress sales, and failing to take costly but needed measures to protect theenvironment. Generally, these acts don’t rise to the level of an Enron or a World-Com, but they are still bad. If questionable things are going on, who should takeaction and what should that action be? Obviously, in situations such as Enron andWorldCom, where fraud was being perpetrated at or close to the top, seniormanagers knew about the illegal activities. In other cases, the problem is caused bya mid-level manager trying to boost his or her unit’s profits and thus his or herbonus. In all cases, though, at least some lower-level employees are aware ofwhat’s happening; they may even be ordered to take fraudulent actions. Shouldthe lower-level employees obey their boss’s orders; refuse to obey those orders; orreport the situation to a higher authority, such as the company’s board of direc-tors, the company’s auditors, or a federal prosecutor?
In the WorldCom and Enron cases, it was clear to a number of employees thatunethical and illegal acts were being committed; but in cases such as Merck’s Vioxxproduct, the situation was less clear. Because early evidence that Vioxx led to heartattacks was weak and evidence of its pain reduction was strong, it was probably notappropriate to sound an alarm early on. However, as evidence accumulated, at somepoint the public needed to be given a strong warning or the product should havebeen taken off the market. But judgment comes into play when deciding on whataction to take and when to take it. If a lower-level employee thinks that a productshould be pulled but the boss disagrees, what should the employee do? If anemployee decides to report the problem, trouble may ensue regardless of the meritsof the case. If the alarm is false, the company will have been harmed and nothing willhave been gained. In that case, the employee will probably be fired. Even if theemployee is right, his or her career may still be ruined because many companies (orat least bosses) don’t like “disloyal, troublemaking” employees.
PROTECTION FOR WHISTLE-BLOWERS
As a result of the recent accounting and other frauds, in2002, Congress passed the Sarbanes-Oxley Act, whichcodified certain rules pertaining to corporate behavior. Oneprovision in the bill was designed to protect whistle-blowers,or lower-level employees who sound an alarm over actionsby their superiors. Employees who report improper actionsare often fired or otherwise penalized, which keeps manypeople from reporting activities that should be investigated.The Sarbanes-Oxley provision was designed to alleviate thisproblem. If someone reports a corporate wrongdoing and is
later penalized, he or she can ask the Occupational Safety &Health Administration (OSHA) to investigate the situation; ifthe employee was improperly penalized, the company canbe required to reinstate the person, along with back payand a sizable penalty award. According to The Wall StreetJournal, some big awards have been handed out and aNational Whistle-Blower Center has been established tohelp people sue companies. It’s still dangerous to blow thewhistle, but less so than before the Sarbanes-Oxley Act waspassed.
Source: Deborah Solomon and Kara Scannell, “SEC Is Urged to Enforce ‘Whistle-Blower’ Provision,” The Wall Street Journal, November 15,2004, p. A6.
Chapter 1 An Overview of Financial Management 17
Cengage Learning
*ram* D:/Thomson_Learning_Projects/Brigham_Full_120614/z_production/z_3B2_3D_files/Brigham_0324597703_Ch.01.3d, 12/9/8, 13:15, page: 18
Such situations arise fairly often in contexts ranging from accounting fraud toproduct liability and environmental cases. Employees jeopardize their jobs if theycome forward over their bosses’ objections. However, if they don’t speak up, theymay suffer emotional problems and contribute to the downfall of their companiesand the accompanying loss of jobs and savings. Moreover, if employees obeyorders regarding actions they know are illegal, they may end up going to jail.Indeed, in most of the scandals that have gone to trial, the lower-level people whophysically entered the bad data received longer jail sentences than the bosses whopresumably gave the directives. So employees can be “stuck between a rock and ahard place,” that is, doing what they should do and possibly losing their jobsversus going along with the boss and possibly ending up in jail.
This discussion shows why ethics is such an important consideration inbusiness and in business schools—and why we are concerned with it in this book.
SELF TEST How would you define “business ethics”?
Can a firm’s executive compensation plan lead to unethical behavior?Explain.
Unethical acts are generally committed by unethical people. What are somethings companies can do to help ensure that their employees act ethically?
1-8 CONFLICTS BETWEEN MANAGERS, STOCKHOLDERS,AND BONDHOLDERS9
1-8a Managers versus StockholdersIt has long been recognized that managers’ personal goals may compete withshareholder wealth maximization. In particular, managers might be more inter-ested in maximizing their own wealth than their stockholders’ wealth; therefore,managers might pay themselves excessive salaries. For example, Disney paid itsformer president Michael Ovitz $140 million as a severance package after just14 months on the job—$140 million to go away—because he and Disney CEOMichael Eisner were having disagreements. Eisner was also handsomely com-pensated the year Ovitz was fired—a $750,000 base salary plus a $9.9 millionbonus plus $565 million in profits from stock options, for a total of just over $575million. As another example of corporate excesses, Tyco CEO Dennis Kozlowski(who is now in jail) spent more than $1 million of the company’s money on abirthday party for his wife.
Neither the Disney executives’ pay nor Kozlowski’s birthday party seemconsistent with shareholder wealth maximization. Still, good executive compen-sation plans can motivate managers to act in their stockholders’ best interests.Useful motivational tools include (1) reasonable compensation packages, (2) firingof managers who don’t perform well, and (3) the threat of hostile takeovers.
Compensation packages should be sufficient to attract and retain able managers,but they should not go beyond what is needed. Also, compensation should bestructured so that managers are rewarded on the basis of the stock’s performanceover the long run, not the stock’s price on an option exercise date. This means thatoptions (or direct stock awards) should be phased in over a number of years sothat managers have an incentive to keep the stock price high over time. When the
9These conflicts are studied under the heading of agency theory in finance literature. The classic work on agencytheory is Michael C. Jensen and William H. Meckling, “Theory of the Firm, Managerial Behavior, Agency Costs, andOwnership Structure,” Journal of Financial Economics, October 1976, pp. 305–360.
18 Part 1 Introduction to Financial Management
Cengage Learning
*ram* D:/Thomson_Learning_Projects/Brigham_Full_120614/z_production/z_3B2_3D_files/Brigham_0324597703_Ch.01.3d, 12/9/8, 13:15, page: 19
intrinsic value can be measured in an objective and verifiable manner, perfor-mance pay can be based on changes in intrinsic value. However, because intrinsicvalue is not observable, compensation must be based on the stock’s market price—but the price used should be an average over time rather than on a specific date.
Stockholders can intervene directly with managers. Years ago most stock wasowned by individuals. Today, however, the majority of stock is owned by insti-tutional investors such as insurance companies, pension funds, hedge funds, andmutual funds; and private equity groups are ready and able to step in and takeover underperforming firms. These institutional money managers have the cloutto exercise considerable influence over firms’ operations. First, they can talk withmanagers and make suggestions about how the business should be run. In effect,institutional investors such as CalPERS (California Public Employees’ RetirementSystem, with $165 billion of assets) and TIAA-CREF (Teachers Insurance andAnnuity Association–College Retirement Equity Fund, a retirement plan originallyset up for professors at private colleges that now has more than $300 billion ofassets) act as lobbyists for the body of stockholders. When such large stockholdersspeak, companies listen. Second, any shareholder who has owned $2,000 of acompany’s stock for one year can sponsor a proposal that may be voted on at theannual stockholders’ meeting, even if management opposes the proposal.10
Although shareholder-sponsored proposals are nonbinding, the results of suchvotes are heard by top management. There is an ongoing debate regarding howmuch influence shareholders should have through the proxy process. For exam-ple, shareholder activists sharply criticized a recent SEC vote that continued toallow companies to exclude shareholder proposals related to director elections.11
Until recently, the probability of a large firm’s management being ousted byits stockholders was so remote that it posed little threat. Most firms’ shares were sowidely distributed and the CEO had so much control over the voting mechanismthat it was virtually impossible for dissident stockholders to get the votes neededto overthrow a management team. However, that situation has changed. In recentyears, the top executives of AT&T, Coca-Cola, Fannie Mae, General Motors, IBM,and Xerox, to name a few, have been forced out. All of these departures were dueto the firm’s poor performance.
If a firm’s stock is undervalued, corporate raiders will see it as a bargain andwill attempt to capture the firm in a hostile takeover. If the raid is successful, thetarget’s executives will almost certainly be fired. This situation gives managers astrong incentive to take actions to maximize their stock’s price. In the words of oneexecutive, “If you want to keep your job, never let your stock become a bargain.”
Again, note that the price managers should be trying to maximize is not theprice on a specific day. Rather, it is the average price over the long run, which willbe maximized if management focuses on the stock’s intrinsic value. However,managers must communicate effectively with stockholders (without divulginginformation that would aid their competitors) to keep the actual price close to theintrinsic value. It’s bad for stockholders and managers when the intrinsic value ishigh but the actual price is low. In that situation, a raider may swoop in, buy thecompany at a bargain price, and fire the managers. To repeat our earlier message:
Managers should try to maximize their stock’s intrinsic value and then com-municate effectively with stockholders. That will cause the intrinsic value to behigh and the actual stock price to remain close to the intrinsic value over time.
10Under current guidelines, shareholder proposals are restricted to governance issues and shareholders are notallowed to vote directly on items that are considered to be “operating issues.”11Kara Scannell, “Cox, in Denying Proxy Access, Puts His Legacy on the Line,” The Wall Street Journal Online,November 29, 2007, p. C1.
Corporate RaiderAn individual who targetsa corporation for takeoverbecause it is undervalued.
Hostile TakeoverThe acquisition of a com-pany over the oppositionof its management.
Chapter 1 An Overview of Financial Management 19
Cengage Learning
*ram* D:/Thomson_Learning_Projects/Brigham_Full_120614/z_production/z_3B2_3D_files/Brigham_0324597703_Ch.01.3d, 12/9/8, 13:15, page: 20
Because the intrinsic value cannot be observed, it is impossible to knowwhether it is really being maximized. Still, as we will discuss in Chapter 9,there are procedures for estimating a stock’s intrinsic value. Managers can usethese valuation models to analyze alternative courses of action and thus see howthese actions are likely to impact the firm’s value. This type of value-based man-agement is not as precise as we would like, but it is the best way to run a business.
1-8b Stockholders versus BondholdersConflicts can also arise between stockholders and bondholders. Bondholdersgenerally receive fixed payment regardless of how well the company does, whilestockholders do better when the company does better. This situation leads toconflicts between these two groups.12 To illustrate the problem, suppose a com-pany has the chance to make an investment that will result in a profit of $10 billionif it is successful but the company will be worthless and go bankrupt if theinvestment is unsuccessful. The firm has bonds that pay an 8% annual interest rateand have a value of $1,000 per bond and stock that sells for $10 per share. If thenew project—say, a cure for the common cold—is successful, the price of the stockwill jump to $2,000 per share, but the value of the bonds will remain just $1,000per bond. The probability of success is 50% and the probability of failure is 50%, sothe expected stock price is
Expected stock price ¼ 0:5($2,000) þ 0:5ð$0Þ ¼ $1,000
versus a current price of $10. The expected percentage gain on the stock is
Expected percentage gain on stock ¼ ð$1,000 − $10Þ=$10� 100% ¼ 9,900%
The project looks wonderful from the stockholders’ standpoint but lousy for thebondholders. They just break even if the project is successful, but they lose theirentire investment if it is a failure.
Another type of bondholder/stockholder conflict arises over the use ofadditional debt. As we will see later in this book, the more debt a firm uses tofinance a given amount of assets, the riskier the firm is. For example, if a firm has$100 million of assets and finances them with $5 million of bonds and $95 millionof common stock, things will have to go terribly bad before the bondholders willsuffer a loss. On the other hand, if the firm uses $95 million of bonds and$5 million of stock, the bondholders will suffer a loss even if the value of the assetsdeclines only slightly.
Bondholders attempt to protect themselves by including covenants in thebond agreements that limit firms’ use of additional debt and constrain managers’actions in other ways. We will address these issues later in this book, but they arequite important and everyone should be aware of them.
SELF TEST What are three techniques stockholders can use to motivate managers tomaximize their stock’s long-run price?
Should managers focus directly on the stock’s actual market price or itsintrinsic value, or are both important? Explain.
Why might conflicts arise between stockholders and bondholders?
12Managers represent stockholders; so saying “stockholders versus bondholders” is the same as saying “managersversus bondholders.”
20 Part 1 Introduction to Financial Management
Cengage Learning
*ram* D:/Thomson_Learning_Projects/Brigham_Full_120614/z_production/z_3B2_3D_files/Brigham_0324597703_Ch.01.3d, 12/9/8, 13:15, page: 21
TYING IT ALL TOGETHER
This chapter provides a broad overview of financial management. Management’sprimary goal should be to maximize the long-run value of the stock, which meansthe intrinsic value as measured by the stock’s price over time. To maximize value,firms must develop products that consumers want, produce the products effi-ciently, sell them at competitive prices, and observe laws relating to corporatebehavior. If firms are successful at maximizing the stock’s value, they will also becontributing to social welfare and citizens’ well-being.
Businesses can be organized as proprietorships, partnerships, corporations,limited liability companies (LLCs), or limited liability partnerships (LLPs). The vastmajority of all business is done by corporations, and the most successful firms endup as corporations, which explains the focus on corporations in this book. We alsodiscussed four important business trends: (1) the focus on business ethics thatresulted from a series of scandals in the late 1990s, (2) the trend toward global-ization, (3) the ever-improving information technology, and (4) the changes incorporate governance. These four trends are changing the way business is done.
The primary tasks of the CFO are (1) to make sure the accounting systemprovides “good” numbers for internal decision making and for investors, (2) toensure that the firm is financed in the proper manner, (3) to evaluate the operatingunits to make sure they are performing in an optimal manner, and (4) to evaluateall proposed capital expenditures to make sure they will increase the firm’s value.In the remainder of this book, we discuss exactly how financial managers carry outthese tasks.
SELF-TEST QUESTION AND PROBLEM(Solutions Appear in Appendix A)
ST-1 KEY TERMS Define each of the following terms:
a. Sarbanes-Oxley Act
b. Proprietorship; partnership; corporation
c. S corporations; limited liability companies (LLCs); limited liability partnerships(LLPs)
d. Stockholder wealth maximization
e. Intrinsic value; market price
f. Equilibrium; marginal investor
g. Business ethics
h. Corporate raider; hostile takeover
QUESTIONS
1-1 If you bought a share of stock, what would you expect to receive, when would you expectto receive it, and would you be certain that your expectations would be met?
1-2 If most investors expect the same cash flows from Companies A and B but are moreconfident that A’s cash flows will be closer to their expected value, which company shouldhave the higher stock price? Explain.
Chapter 1 An Overview of Financial Management 21
Cengage Learning
*ram* D:/Thomson_Learning_Projects/Brigham_Full_120614/z_production/z_3B2_3D_files/Brigham_0324597703_Ch.01.3d, 12/9/8, 13:15, page: 22
1-3 What is a firm’s intrinsic value? its current stock price? Is the stock’s “true long-run value”more closely related to its intrinsic value or to its current price?
1-4 When is a stock said to be in equilibrium? At any given time, would you guess that moststocks are in equilibrium as you defined it? Explain.
1-5 Suppose three honest individuals gave you their estimates of Stock X’s intrinsic value. Oneperson is your current roommate, the second person is a professional security analyst withan excellent reputation on Wall Street, and the third person is Company X’s CFO. If thethree estimates differed, in which one would you have the most confidence? Why?
1-6 Is it better for a firm’s actual stock price in the market to be under, over, or equal to its intrinsicvalue? Would your answer be the same from the standpoints of stockholders in general and aCEO who is about to exercise a million dollars in options and then retire? Explain.
1-7 If a company’s board of directors wants management to maximize shareholder wealth,should the CEO’s compensation be set as a fixed dollar amount, or should the compen-sation depend on how well the firm performs? If it is to be based on performance, howshould performance be measured? Would it be easier to measure performance by thegrowth rate in reported profits or the growth rate in the stock’s intrinsic value? Whichwould be the better performance measure? Why?
1-8 What are the four forms of business organization? What are the advantages and dis-advantages of each?
1-9 Should stockholder wealth maximization be thought of as a long-term or a short-term goal?For example, if one action increases a firm’s stock price from a current level of $20 to $25 in6 months and then to $30 in 5 years but another action keeps the stock at $20 for severalyears but then increases it to $40 in 5 years, which action would be better? Think of somespecific corporate actions that have these general tendencies.
1-10 What are some actions that stockholders can take to ensure that management’s andstockholders’ interests are aligned?
1-11 The president of Southern Semiconductor Corporation (SSC) made this statement in thecompany’s annual report: “SSC’s primary goal is to increase the value of our commonstockholders’ equity.” Later in the report, the following announcements were made:a. The company contributed $1.5 million to the symphony orchestra in Birmingham,
Alabama, its headquarters city.
b. The company is spending $500 million to open a new plant and expand operations inChina. No profits will be produced by the Chinese operation for 4 years, so earningswill be depressed during this period versus what they would have been had thedecision been made not to expand in China.
c. The company holds about half of its assets in the form of U.S. Treasury bonds, and itkeeps these funds available for use in emergencies. In the future, though, SSC plans toshift its emergency funds from Treasury bonds to common stocks.
Discuss how SSC’s stockholders might view each of these actions and how the actionsmight affect the stock price.
1-12 Investors generally can make one vote for each share of stock they hold. TIAA-CREF is thelargest institutional shareholder in the United States; therefore, it holds many shares andhas more votes than any other organization. Traditionally, this fund has acted as a passiveinvestor, just going along with management. However, in 1993, it mailed a notice to all1,500 companies whose stocks it held that henceforth, it planned to actively intervene if, inits opinion, management was not performing well. Its goal was to improve corporateperformance to boost the prices of the stocks it held. It also wanted to encourage corporateboards to appoint a majority of independent (outside) directors; and it stated that it wouldvote against any directors of firms that “don’t have an effective, independent board that canchallenge the CEO.”
In the past, TIAA-CREF responded to poor performance by “voting with its feet,”which means selling stocks that were not doing well. However, by 1993, that position hadbecome difficult to maintain for two reasons. First, the fund invested a large part of itsassets in “index funds,” which hold stocks in accordance with their percentage value in thebroad stock market. Furthermore, TIAA-CREF owns such large blocks of stocks in manycompanies that if it tried to sell out, doing so would severely depress the prices of thosestocks. Thus, TIAA-CREF is locked in to a large extent, which led to its decision to become amore active investor.a. Is TIAA-CREF an ordinary shareholder? Explain.
b. Due to its asset size, TIAA-CREF owns many shares in a number of companies. Thefund’s management plans to vote those shares. However, TIAA-CREF is owned by
22 Part 1 Introduction to Financial Management
Cengage Learning

*ram* D:/Thomson_Learning_Projects/Brigham_Full_120614/z_production/z_3B2_3D_files/Brigham_0324597703_Ch.01.3d, 12/9/8, 13:15, page: 23
many thousands of investors. Should the fund’s managers vote its shares; or should itpass those votes, on a pro rata basis, back to its own shareholders? Explain.
1-13 Edmund Enterprises recently made a large investment to upgrade its technology. Whilethese improvements won’t have much effect on performance in the short run, they areexpected to reduce future costs significantly. What effect will this investment have onEdmund Enterprises’ earnings per share this year? What effect might this investment haveon the company’s intrinsic value and stock price?
1-14 Suppose you were a member of Company X’s board of directors and chairperson of thecompany’s compensation committee. What factors should your committee consider whensetting the CEO’s compensation? Should the compensation consist of a dollar salary, stockoptions that depend on the firm’s performance, or a mix of the two? If “performance” is tobe considered, how should it be measured? Think of both theoretical and practical (that is,measurement) considerations. If you were also a vice president of Company X, might youractions be different than if you were the CEO of some other company?
1-15 Suppose you are a director of an energy company that has three divisions—natural gas, oil,and retail (gas stations). These divisions operate independently from one another, but alldivision managers report to the firm’s CEO. If you were on the compensation committee asdiscussed in Question 1–14 and your committee was asked to set the compensation for thethree division managers, would you use the same criteria as that used for the firm’s CEO?Explain your reasoning.
Chapter 1 An Overview of Financial Management 23
Cengage Learning

*ram* D:/Thomson_Learning_Projects/Brigham_Full_120614/z_production/z_3B2_3D_files/Brigham_0324597703_Ch.01.3d, 12/9/8, 13:15, page: 24
Cengage Learning

*ram* D:/Thomson_Learning_Projects/Brigham_Full_120614/z_production/z_3B2_3D_files/Brigham_0324597703_Ch.02.3d, 12/9/8, 13:23, page: 25
PART 2
FUNDAMENTAL CONCEPTSIN FINANCIALMANAGEMENT
2 Financial Markets and Institutions
3 Financial Statements, Cash Flow,and Taxes
4 Analysis of Financial Statements
5 Time Value of MoneyCHAPTER
Cengage Learning
*ram* D:/Thomson_Learning_Projects/Brigham_Full_120614/z_production/z_3B2_3D_files/Brigham_0324597703_Ch.02.3d, 12/9/8, 13:23, page: 26
CHAPTER
2 Financial Marketsand Institutions
Eff ic ient Financial Markets Are Necessary for aGrowing Economy
Over the past few decades, changing technologyand improving communications have increasedcross-border transactions and expanded the scopeand efficiency of the global financial system.Companies routinely raise funds throughout theworld; and with the click of a mouse, an investorcan buy GE stock on the New York Stock Exchange,deposit funds in a European bank, or purchase amutual fund that invests in Chinese securities.
This globalization was dramatically illustratedin the fall of 2007. The U.S. housing market hadbeen exceedingly strong, which bolstered theentire economy. Rising home values enabledpeople to borrow on home equity loans to buyeverything from autos to Caribbean vacations.However, lenders had been making loans thatrequired no down payment, that had “teaser”rates programmed to rise sharply after a year ortwo, and that were made to borrowers whosecredit had not been carefully checked. Theserelaxed lending standards enabled people whocould not have bought homes in the past to buy
a home now; but the loans were getting riskier,and about 30% were classified as “subprime.”
The risk buildup was obscured by fancy“financial engineering.” A few years ago peopleobtained mortgage loans primarily from localbanks. The banks kept the mortgages, collectedthe interest, and likely knew how risky the loanswere. In recent years, the situation has changed.Now mortgage brokers originate, for example,500 loans for $200,000 each, or $100 million intotal, and then sell them to an investment bank.The bank uses the loans as collateral for$100 million of bonds, which are divided intoclasses such as A, B, and C. The A bonds have firstclaim on cash from the mortgages and are ratedAAA; the Bs are next, which are also highly rated;and even the Cs are rated “investment grade.”Initially, times were good; the interest andrepayment of principal from the mortgages weresufficient to cover required payments to all ofthe bonds. However, recently, some of themortgages began going into default, and
ªHIROKO
MASUIKE/GETTYIM
AGES
26 Cengage Learning
*ram* D:/Thomson_Learning_Projects/Brigham_Full_120614/z_production/z_3B2_3D_files/Brigham_0324597703_Ch.02.3d, 12/9/8, 13:23, page: 27
PUTTING THINGS IN PERSPECTIVE
In Chapter 1, we saw that a firm’s primary goal is to maximize the price of its stock.Stock prices are determined in the financial markets; so if financial managers are tomake good decisions, they must understand how these markets operate. In addi-tion, individuals make personal investment decisions; so they too need to knowsomething about financial markets and the institutions that operate in thosemarkets. Therefore, in this chapter, we describe the markets where capital is raised,securities are traded, and stock prices are established and the institutions thatoperate in these markets.
When you finish this chapter, you should be able to:l Identify the different types of financial markets and financial institutions and
explain how these markets and institutions enhance capital allocation.l Explain how the stock market operates and list the distinctions between the
different types of stock markets.l Explain how the stock market has performed in recent years.l Discuss the importance of market efficiency and explain why some markets are
more efficient than others.
inflows were no longer sufficient to cover required pay-ments to all of the bonds.
When home prices are rising, borrowers’ equity alsorises. That enables borrowers who cannot keep up withtheir payments to refinance—or sell the house for enoughto pay off the mortgage. But when home prices start falling,refinancings and profitable sales are impossible. That trig-gers mortgage defaults, which, in turn, triggers defaults onthe riskiest bonds. People become worried about the B andeven the A bonds, so their values also fall. The banks andother institutions that own the bonds are forced to writethem down on their balance sheets.
Institutions that hold mortgage-backed bonds—manyof which are subsidiaries of banks—raised the money tobuy the bonds by borrowing on a 3-month basis frommoney market funds of similar lenders. As risks becamemore apparent, the short-term lenders refused to roll overthese loans; thus, the bondholders were forced to sellbonds to repay their short-term loans. Those salesdepressed the bond market even further, causing furtherbond sales, lower bond prices, and more write-downs. Adownward spiral and a severe credit crunch began.
Banks across the globe had invested in these bonds; andhuge losses were reported by Citigroup, Deutsche Bank(Germany’s largest), and UBS (Switzerland’s largest). Theselosses reduced banks’ willingness and ability to make newloans, which threatened economies in many nations. TheFederal Reserve and other central banks lowered interestrates and eased the terms under which they extended creditto banks, and the banks themselves joined forces to head offa downward spiral. The headline in The Wall Street Journal onOctober 13, 2007, read as follows: “Big Banks Push $100 Bil-lion Plan to Avert Credit Crunch.” The article described howgovernment officials are working with bankers to head off animpending crisis. However, working things out will be diffi-cult. Many think that the banks whose actions contributed tothe problems—especially Citigroup—should not be bailedout. Others think that the crisis must be averted because theU.S. economy and other economies will be badly damaged ifthe downward spiral continues.
All of this demonstrates the extent to which markets areinterconnected, the impact markets can have on countriesand on individual companies, and the complexity of capitalmarkets.
Source: Carrick Mollenkamp, Ian McDonald, and Deborah Solomon, “Big Banks Push $100 Billion Plan to Avert Crunch: Fund Seeks toPrevent Mortgage-Debt Selloff; Advice from Treasury,” The Wall Street Journal, October 13, 2007, p. A1.
Chapter 2 Financial Markets and Institutions 27
Cengage Learning

*ram* D:/Thomson_Learning_Projects/Brigham_Full_120614/z_production/z_3B2_3D_files/Brigham_0324597703_Ch.02.3d, 12/9/8, 13:23, page: 28
2-1 THE CAPITAL ALLOCATION PROCESSBusinesses, individuals, and governments often need to raise capital. For example,Carolina Power & Light (CP&L) forecasts an increase in the demand for electricityin North and South Carolina, so it will build a new power plant to meet thoseneeds. Because CP&L’s bank account does not contain the $1 billion necessary topay for the plant, the company must raise this capital in the financial markets.Similarly, Mr. Fong, the proprietor of a San Francisco hardware store, wants toexpand into appliances. Where will he get the money to buy the initial inventoryof TV sets, washers, and freezers? Or suppose the Johnson family wants to buy ahome that costs $200,000, but they have only $50,000 in savings. Where will theyget the additional $150,000? The city of New York needs $200 million to build anew sewer plant. Where can it obtain this money? Finally, the federal governmentneeds more money than it receives from taxes. Where will the extra money comefrom?
On the other hand, some individuals and firms have incomes that exceed theircurrent expenditures, in which case they have funds available to invest. Forexample, Carol Hawk has an income of $36,000, but her expenses are only $30,000.That leaves her with $6,000 to invest. Similarly, Microsoft has accumulatedroughly $23.5 billion of cash. What can Microsoft do with this money until it isneeded in the business?
People and organizations with surplus funds are saving today in order toaccumulate funds for some future use. Members of a household might save to payfor their children’s education and the parents’ retirement, while a business mightsave to fund future investments. Those with surplus funds expect to earn a returnon their investments, while people and organizations that need capital understandthat they must pay interest to those who provide that capital.
In a well-functioning economy, capital flows efficiently from those with sur-plus capital to those who need it. This transfer can take place in the three waysdescribed in Figure 2-1.1. Direct transfers of money and securities, as shown in the top section, occur
when a business sells its stocks or bonds directly to savers, without going
Diagram of the Capital Formation ProcessFIGURE 2-1
Business
Business
Business
1. Direct Transfers
2. Indirect Transfers through Investment Bankers
3. Indirect Transfers through a Financial Intermediary
Savers
Savers
SaversFinancialIntermediary
Investment Banks
Securities (Stocks or Bonds)
Dollars
Securities
Dollars
Securities
Dollars
Intermediary’sSecurities
Dollars
Business’Securities
Dollars
28 Part 2 Fundamental Concepts in Financial Management
Cengage Learning

*ram* D:/Thomson_Learning_Projects/Brigham_Full_120614/z_production/z_3B2_3D_files/Brigham_0324597703_Ch.02.3d, 12/9/8, 13:23, page: 29
through any type of financial institution. The business delivers its securitiesto savers, who, in turn, give the firm the money it needs. This procedure isused mainly by small firms, and relatively little capital is raised by directtransfers.
2. As shown in the middle section, transfers may also go through an investmentbank (iBank) such as Citigroup, which underwrites the issue. An underwriterserves as a middleman and facilitates the issuance of securities. The companysells its stocks or bonds to the investment bank, which then sells these samesecurities to savers. The businesses’ securities and the savers’ money merely“pass through” the investment bank. However, because the investment bankbuys and holds the securities for a period of time, it is taking a risk—it maynot be able to resell the securities to savers for as much as it paid. Because newsecurities are involved and the corporation receives the proceeds of the sale,this transaction is called a primary market transaction.
3. Transfers can also be made through a financial intermediary such as a bank, aninsurance company, or a mutual fund. Here the intermediary obtains fundsfrom savers in exchange for its securities. The intermediary uses this money tobuy and hold businesses’ securities, while the savers hold the intermediary’ssecurities. For example, a saver deposits dollars in a bank, receiving a certif-icate of deposit; then the bank lends the money to a business in the form of amortgage loan. Thus, intermediaries literally create new forms of capital—inthis case, certificates of deposit, which are safer and more liquid than mort-gages and thus are better for most savers to hold. The existence of inter-mediaries greatly increases the efficiency of money and capital markets.
Often the entity needing capital is a business (and specifically a corporation); but itis easy to visualize the demander of capital being a home purchaser, a smallbusiness, or a government unit. For example, if your uncle lends you money tohelp you fund a new business, a direct transfer of funds will occur. Alternatively,if you borrow money to purchase a home, you will probably raise the fundsthrough a financial intermediary such as your local commercial bank or mortgagebanker. That banker could sell your mortgage to an investment bank, which thenmight use it as collateral for a bond that is bought by a pension fund.
In a global context, economic development is highly correlated with the leveland efficiency of financial markets and institutions.1 It is difficult, if not impos-sible, for an economy to reach its full potential if it doesn’t have access to a well-functioning financial system. In a well-developed economy like that of the UnitedStates, an extensive set of markets and institutions has evolved over time tofacilitate the efficient allocation of capital. To raise capital efficiently, managersmust understand how these markets and institutions work; and individuals needto know how the markets and institutions work to get high rates of returns ontheir savings.
SELF TEST Name three ways capital is transferred between savers and borrowers.
Why are efficient capital markets necessary for economic growth?
1For a detailed review of the evidence linking financial development to economic growth, see Ross Levine,“Finance and Growth: Theory and Evidence,” NBER Working Paper No. 10766, September 2004.
Chapter 2 Financial Markets and Institutions 29
Cengage Learning
*ram* D:/Thomson_Learning_Projects/Brigham_Full_120614/z_production/z_3B2_3D_files/Brigham_0324597703_Ch.02.3d, 12/9/8, 13:23, page: 30
2-2 FINANCIAL MARKETSPeople and organizations wanting to borrow money are brought together withthose who have surplus funds in the financial markets. Note that markets is plural;there are many different financial markets in a developed economy such as that ofthe United States. We describe some of these markets and some trends in theirdevelopment.
2-2a Types of MarketsDifferent financial markets serve different types of customers or different parts ofthe country. Financial markets also vary depending on the maturity of thesecurities being traded and the types of assets used to back the securities. For thesereasons, it is useful to classify markets along the following dimensions:1. Physical asset markets versus financial asset markets. Physical asset markets (also
called “tangible” or “real” asset markets) are for products such as wheat,autos, real estate, computers, and machinery. Financial asset markets, on theother hand, deal with stocks, bonds, notes, and mortgages. Financial marketsalso deal with derivative securitieswhose values are derived from changes in theprices of other assets. A share of Ford stock is a “pure financial asset,” whilean option to buy Ford shares is a derivative security whose value depends onthe price of Ford stock. The bonds backed by subprime mortgages discussedat the beginning of this chapter are another type of derivative, as the values ofthese bonds are derived from the values of the underlying mortgages.
2. Spot markets versus futures markets. Spot markets are markets in which assetsare bought or sold for “on-the-spot” delivery (literally, within a few days).Futures markets are markets in which participants agree today to buy or sellan asset at some future date. For example, a farmer may enter into a futurescontract in which he agrees today to sell 5,000 bushels of soybeans 6 monthsfrom now at a price of $5 a bushel. To continue that example, a food processorthat needs soybeans in the future may enter into a futures contract in which itagrees to buy soybeans 6 months from now. Such a transaction can reduce, orhedge, the risks faced by both the farmer and the food processor.
3. Money markets versus capital markets.Money markets are the markets for short-term, highly liquid debt securities. The New York, London, and Tokyo moneymarkets are among the world’s largest. Capital markets are the markets forintermediate- or long-term debt and corporate stocks. The New YorkStock Exchange, where the stocks of the largest U.S. corporations are traded,is a prime example of a capital market. There is no hard-and-fast rule, but ina description of debt markets, short-term generally means less than1 year, intermediate-term means 1 to 10 years, and long-term means more than10 years.
4. Primary markets versus secondary markets. Primary markets are the markets inwhich corporations raise new capital. If GE were to sell a new issue of com-mon stock to raise capital, a primary market transaction would take place. Thecorporation selling the newly created stock, GE, receives the proceeds fromthe sale in a primary market transaction. Secondary markets are markets inwhich existing, already outstanding securities are traded among investors.Thus, if Jane Doe decided to buy 1,000 shares of GE stock, the purchase wouldoccur in the secondary market. The New York Stock Exchange is a secondarymarket because it deals in outstanding, as opposed to newly issued, stocksand bonds. Secondary markets also exist for mortgages, other types of loans,and other financial assets. The corporation whose securities are being traded isnot involved in a secondary market transaction and thus does not receivefunds from such a sale.
Spot MarketsThe markets in whichassets are bought or soldfor “on-the-spot” delivery.
Futures MarketsThe markets in whichparticipants agree todayto buy or sell an asset atsome future date.
Money MarketsThe financial markets inwhich funds are borrowedor loaned for short periods(less than one year).
Capital MarketsThe financial markets forstocks and for intermediate-or long-term debt (oneyear or longer).
Primary MarketsMarkets in which corpo-rations raise capital byissuing new securities.
Secondary MarketsMarkets in which securitiesand other financial assetsare traded among invest-ors after they have beenissued by corporations.
30 Part 2 Fundamental Concepts in Financial Management
Cengage Learning
*ram* D:/Thomson_Learning_Projects/Brigham_Full_120614/z_production/z_3B2_3D_files/Brigham_0324597703_Ch.02.3d, 12/9/8, 13:23, page: 31
5. Private markets versus public markets. Private markets, where transactions arenegotiated directly between two parties, are differentiated from publicmarkets, where standardized contracts are traded on organized exchanges.Bank loans and private debt placements with insurance companies areexamples of private market transactions. Because these transactions are pri-vate, they may be structured in any manner to which the two parties agree. Bycontrast, securities that are traded in public markets (for example, commonstock and corporate bonds) are held by a large number of individuals. Thesesecurities must have fairly standardized contractual features because publicinvestors do not generally have the time and expertise to negotiate unique,nonstandardized contracts. Broad ownership and standardization result inpublicly traded securities being more liquid than tailor-made, uniquelynegotiated securities.
Other classifications could be made, but this breakdown shows that there aremany types of financial markets. Also note that the distinctions among marketsare often blurred and unimportant except as a general point of reference. Forexample, it makes little difference if a firm borrows for 11, 12, or 13 months, that is,whether the transaction is a “money” or “capital” market transaction. You shouldbe aware of the important differences among types of markets, but don’t be overlyconcerned about trying to distinguish them at the boundaries.
A healthy economy is dependent on efficient funds transfers from people whoare net savers to firms and individuals who need capital. Without efficienttransfers, the economy could not function: Carolina Power & Light could not raisecapital, so Raleigh’s citizens would have no electricity; the Johnson family wouldnot have adequate housing; Carol Hawk would have no place to invest her sav-ings; and so forth. Obviously, the level of employment and productivity (i.e., thestandard of living) would be much lower. Therefore, it is essential that financialmarkets function efficiently—not only quickly, but also inexpensively.2
Table 2-1 is a listing of the most important instruments traded in the variousfinancial markets. The instruments are arranged in ascending order of typicallength of maturity. As we go through this book, we will look in more detail atmany of the instruments listed in Table 2-1. For example, we will see that there aremany varieties of corporate bonds, ranging from “plain vanilla” bonds to bondsthat can be converted to common stocks to bonds whose interest payments varydepending on the inflation rate. Still, the table provides an overview of thecharacteristics and costs of the instruments traded in the major financial markets.
2-2b Recent TrendsFinancial markets have experienced many changes in recent years. Technologicaladvances in computers and telecommunications, along with the globalization ofbanking and commerce, have led to deregulation, which has increased competi-tion throughout the world. As a result, there are more efficient, internationallylinked markets, which are far more complex than what existed a few years ago.While these developments have been largely positive, they have also createdproblems for policy makers. At one conference, former Federal Reserve BoardChairperson Alan Greenspan stated that modern financial markets “exposenational economies to shocks from new and unexpected sources and with little ifany lag.”He went on to say that central banks must develop new ways to evaluateand limit risks to the financial system. Large amounts of capital move quickly
Private MarketsMarkets in which trans-actions are worked outdirectly between twoparties.
Public MarketsMarkets in which stand-ardized contracts aretraded on organizedexchanges.
2As the countries of the former Soviet Union and other Eastern European nations move toward capitalism, asmuch attention must be paid to the establishment of cost-efficient financial markets as to electrical power,transportation, communications, and other infrastructure systems. Economic efficiency is impossible without agood system for allocating capital within the economy.
Chapter 2 Financial Markets and Institutions 31
Cengage Learning
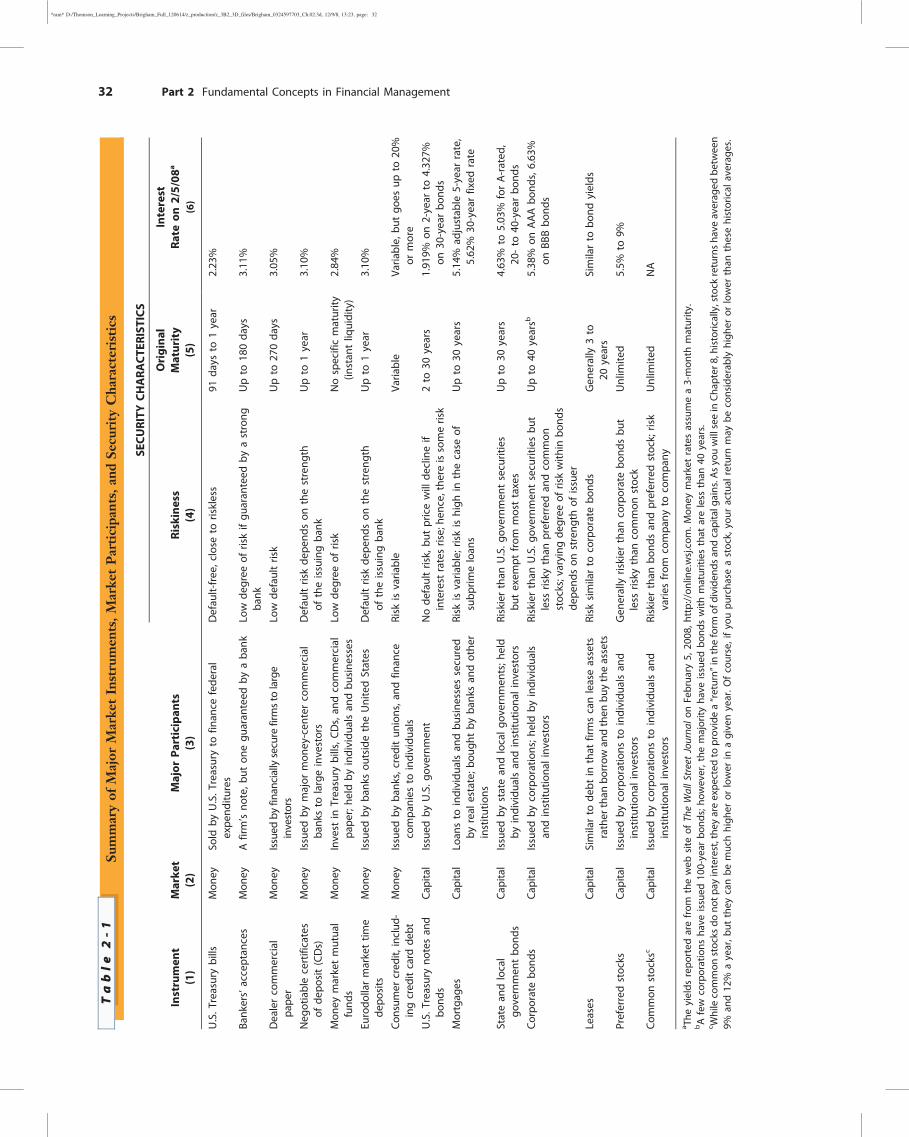
*ram* D:/Thomson_Learning_Projects/Brigham_Full_120614/z_production/z_3B2_3D_files/Brigham_0324597703_Ch.02.3d, 12/9/8, 13:23, page: 32
Summaryof
Major
Marke
tInstrumen
ts,M
arke
tParticipa
nts,
andSe
curity
Cha
racteristics
Table
2-1
SECURITYCHARACTE
RISTICS
Instrumen
t(1)
Marke
t(2)
Major
Participan
ts(3)
Riskiness
(4)
Original
Maturity
(5)
Interest
Rateon
2/5/08
a
(6)
U.S.T
reasurybills
Mon
eySo
ldby
U.S.T
reasuryto
finan
cefede
ral
expe
nditu
res
Defau
lt-free
,close
toriskless
91da
ysto
1year
2.23
%
Bank
ers’acceptan
ces
Mon
eyAfirm’sno
te,b
uton
egu
aran
teed
byaba
nkLo
wde
gree
ofriskifgu
aran
teed
byastrong
bank
Upto
180da
ys3.11
%
Dealercommercial
pape
rMon
eyIssued
byfin
anciallysecure
firmsto
large
investors
Low
defaultrisk
Upto
270da
ys3.05
%
Neg
otiablecertificates
ofde
posit(CDs)
Mon
eyIssued
bymajor
mon
ey-cen
tercommercial
bank
sto
largeinvestors
Defau
ltriskde
pend
son
thestreng
thof
theissuingba
nkUpto
1year
3.10
%
Mon
eymarketmutua
lfund
sMon
eyInvest
inTreasury
bills,C
Ds,an
dcommercial
pape
r;he
ldby
individu
alsan
dbu
sine
sses
Low
degree
ofrisk
Nospecificmaturity
(instan
tliq
uidity)
2.84
%
Eurodo
llarmarkettim
ede
posits
Mon
eyIssued
byba
nksou
tsidetheUnitedStates
Defau
ltriskde
pend
son
thestreng
thof
theissuingba
nkUpto
1year
3.10
%
Consum
ercred
it,includ
-ingcred
itcard
debt
Mon
eyIssued
byba
nks,cred
itun
ions,a
ndfin
ance
compa
nies
toindividu
als
Risk
isvaria
ble
Varia
ble
Varia
ble,
butgo
esup
to20
%or
more
U.S.T
reasuryno
tesan
dbo
nds
Cap
ital
Issued
byU.S.g
overnm
ent
Node
faultrisk,
butpricewill
declineif
interestratesrise;he
nce,thereissomerisk
2to
30years
1.91
9%on
2-year
to4.32
7%on
30-yearbo
nds
Mortgag
esCap
ital
Loan
sto
individu
alsan
dbu
sine
sses
secured
byreal
estate;b
ough
tby
bank
san
dothe
rinstitu
tions
Risk
isvaria
ble;
riskishigh
inthecase
ofsubp
rimeloan
sUpto
30years
5.14
%ad
justab
le5-year
rate,
5.62
%30
-yearfixed
rate
Statean
dlocal
governmen
tbo
nds
Cap
ital
Issued
bystatean
dlocalgo
vernmen
ts;h
eld
byindividu
alsan
dinstitu
tiona
linv
estors
Riskierthan
U.S.g
overnm
entsecurities
butexem
ptfrom
mosttaxes
Upto
30years
4.63
%to
5.03
%forA-rated
,20
-to
40-yearbo
nds
Corpo
rate
bond
sCap
ital
Issued
bycorporations;h
eldby
individu
als
andinstitu
tiona
linv
estors
Riskierthan
U.S.g
overnm
entsecuritiesbu
tless
risky
than
preferredan
dcommon
stocks;varying
degree
ofriskwith
inbo
nds
depe
ndson
streng
thof
issuer
Upto
40yearsb
5.38
%on
AAAbo
nds,6.63
%on
BBBbo
nds
Leases
Cap
ital
Similarto
debt
inthat
firmscanleaseassets
rather
than
borrow
andthen
buytheassets
Risk
similarto
corporatebo
nds
Gen
erally
3to
20years
Similarto
bond
yields
Preferredstocks
Cap
ital
Issued
bycorporations
toindividu
alsan
dinstitu
tiona
linvestors
Gen
erally
riskier
than
corporatebo
ndsbu
tless
risky
than
common
stock
Unlim
ited
5.5%
to9%
Com
mon
stocks
cCap
ital
Issued
bycorporations
toindividu
alsan
dinstitu
tiona
linvestors
Riskierthan
bond
san
dpreferredstock;
risk
varie
sfrom
compa
nyto
compa
nyUnlim
ited
NA
a The
yields
repo
rted
arefrom
theweb
site
ofTheWallS
treetJourna
lonFebrua
ry5,
2008
,http://on
line.wsj.com
.Mon
eymarketratesassumea3-mon
thmaturity
.bAfew
corporations
have
issued
100-year
bond
s;ho
wever,the
majority
have
issued
bond
swith
maturities
that
areless
than
40years.
c Whilecommon
stocks
dono
tpay
interest,the
yareexpe
cted
toprov
idea“return”
intheform
ofdivide
ndsan
dcapitalg
ains.A
syo
uwillseein
Cha
pter
8,historically,stock
returnsha
veaverag
edbe
twee
n9%
and12
%ayear,b
utthey
canbe
muchhigh
eror
lower
inagivenyear.O
fcourse,ifyo
upu
rcha
seastock,yo
uractual
return
may
beconsiderab
lyhigh
eror
lower
than
thesehistorical
averag
es.
32 Part 2 Fundamental Concepts in Financial Management
Cengage Learning
*ram* D:/Thomson_Learning_Projects/Brigham_Full_120614/z_production/z_3B2_3D_files/Brigham_0324597703_Ch.02.3d, 12/9/8, 13:23, page: 33
around the world in response to changes in interest and exchange rates, and thesemovements can disrupt local institutions and economies. The subprime mortgagecrisis discussed in the opening chapter vignette illustrates how problems in onecountry quickly affect the economies of other nations.
Globalization has exposed the need for greater cooperation among regulatorsat the international level, but the task is not easy. Factors that complicate coor-dination include (1) the different structures in nations’ banking and securitiesindustries; (2) the trend toward financial services conglomerates, which obscuresdevelopments in various market segments; and (3) the reluctance of individualcountries to give up control over their national monetary policies. Still, regulatorsare unanimous about the need to close the gaps in the supervision of worldwidemarkets.
Another important trend in recent years has been the increased use ofderivatives. A derivative is any security whose value is derived from the price ofsome other “underlying” asset. An option to buy IBM stock is a derivative, as is acontract to buy Japanese yen 6 months from now or a bond backed by subprimemortgages. The value of the IBM option depends on the price of IBM’s stock, thevalue of the Japanese yen “future” depends on the exchange rate between yen anddollars, and the value of the bond depends on the value of the underlyingmortgages. The market for derivatives has grown faster than any other market inrecent years, providing investors with new opportunities, but also exposing themto new risks.
Derivatives can be used to reduce risks or to speculate. Suppose a wheatprocessor’s costs rise and its net income falls when the price of wheat rises. Theprocessor could reduce its risk by purchasing derivatives—wheat futures—whosevalue increases when the price of wheat rises. This is a hedging operation, and itspurpose is to reduce risk exposure. Speculation, on the other hand, is done in thehope of high returns; but it raises risk exposure. For example, several years agoProcter & Gamble disclosed that it lost $150 million on derivative investments.More recently, losses on mortgage-related derivatives helped contribute to thecredit collapse in 2008.
The values of most derivatives are subject to more volatility than the values ofthe underlying assets. For example, someone might pay $500 for an option to buy100 shares of IBM stock at $120 per share when the stock is selling for $120. If thestock rose by $5 per share, a gain of 4.17% would result. However, the optionswould be worth somewhere between $25 and $30; so the percentage gain wouldbe between 400% and 500%.3 Of course, if IBM stayed at $120 or fell, the optionswould be worthless and the option purchaser would have a 100% loss. Many otherderivatives have similar characteristics and are equally as risky or even morerisky.
If a bank or any other company reports that it invests in derivatives, how canone tell if the derivatives are held as a hedge against something like an increase inthe price of wheat or as a speculative bet that wheat prices will rise? The answer isthat it is very difficult to tell how derivatives are affecting the risk profile of thefirm. In the case of financial institutions, things are even more complicated—thederivatives are generally based on changes in interest rates, foreign exchangerates, or stock prices; and a large international bank might have tens of thousandsof separate derivative contracts. The size and complexity of these transactionsconcern regulators, academics, and members of Congress. Former Fed Chair-person Greenspan noted that in theory, derivatives should allow companies tobetter manage risk but that it is not clear whether recent innovations have“increased or decreased the inherent stability of the financial system.”
DerivativeAny financial asset whosevalue is derived from thevalue of some other“underlying” asset.
3For a discussion on options and option pricing, refer to Chapter 18 in this text.
Chapter 2 Financial Markets and Institutions 33
Cengage Learning
*ram* D:/Thomson_Learning_Projects/Brigham_Full_120614/z_production/z_3B2_3D_files/Brigham_0324597703_Ch.02.3d, 12/9/8, 13:23, page: 34
SELF TEST Distinguish between physical asset markets and financial asset markets.
What’s the difference between spot markets and futures markets?
Distinguish between money markets and capital markets.
What’s the difference between primary markets and secondary markets?
Differentiate between private and public markets.
Why are financial markets essential for a healthy economy and economicgrowth?
2-3 FINANCIAL INSTITUTIONSDirect funds transfers are common among individuals and small businesses and ineconomies where financial markets and institutions are less developed. But largebusinesses in developed economies generally find it more efficient to enlist theservices of a financial institution when it comes time to raise capital.
In the United States and other developed nations, a set of highly efficientfinancial intermediaries has evolved. Their original roles were generally quitespecific, and regulation prevented them from diversifying. However, in recentyears, regulations against diversification have been largely removed; and todaythe differences between institutions have become blurred. Still, there remains adegree of institutional identity. Therefore, it is useful to describe the major cate-gories of financial institutions here. Keep in mind, though, that one company canown a number of subsidiaries that engage in the different functions described next.1. Investment banks traditionally help companies raise capital. They (a) help
corporations design securities with features that are currently attractive toinvestors, (b) buy these securities from the corporation, and (c) resell them tosavers. Since the investment bank generally guarantees that the firm will raisethe needed capital, the investment bankers are also called underwriters. Therecent credit crisis has had a dramatic effect on the investment bankingindustry. Bear Stearns collapsed and was later acquired by J.P. Morgan,Lehman Brothers went bankrupt, and Merrill Lynch was forced to sell out toBank of America. Moreover, the two “surviving” major investment banks(Morgan Stanley and Goldman Sachs) received Federal Reserve approval tobecome commercial bank holding companies. Their future remains uncertain.
2. Commercial banks, such as Bank of America, Citibank, Wells Fargo, Wachovia,and JPMorgan Chase, are the traditional “department stores of finance” becausethey serve a variety of savers and borrowers. Historically, commercial bankswere the major institutions that handled checking accounts and through whichthe Federal Reserve System expanded or contracted the money supply. Today,however, several other institutions also provide checking services and sig-nificantly influence the money supply. Note, too, that the larger banks aregenerally part of financial services corporations as described next.4
3. Financial services corporations are large conglomerates that combine manydifferent financial institutions within a single corporation. Most financial serv-ices corporations started in one area but have now diversified to cover most ofthe financial spectrum. For example, Citigroup owns Citibank (a commercialbank), Smith Barney (an investment bank and securities brokerage organiza-tion), insurance companies, and leasing companies.
Investment BankAn organization thatunderwrites and distrib-utes new investmentsecurities and helps busi-nesses obtain financing.
Commercial BankThe traditional depart-ment store of financeserving a variety of saversand borrowers.
4Two other institutions that were important a few years ago were savings and loan associations and mutualsavings banks. Most of these organizations have now been merged into commercial banks.
Financial ServicesCorporationA firm that offers a widerange of financial services,including investmentbanking, brokerage oper-ations, insurance, andcommercial banking.
34 Part 2 Fundamental Concepts in Financial Management
Cengage Learning
*ram* D:/Thomson_Learning_Projects/Brigham_Full_120614/z_production/z_3B2_3D_files/Brigham_0324597703_Ch.02.3d, 12/9/8, 13:23, page: 35
4. Credit unions are cooperative associations whose members are supposed tohave a common bond, such as being employees of the same firm. Members’savings are loaned only to other members, generally for auto purchases, homeimprovement loans, and home mortgages. Credit unions are often thecheapest source of funds available to individual borrowers.
5. Pension funds are retirement plans funded by corporations or governmentagencies for their workers and administered primarily by the trust depart-ments of commercial banks or by life insurance companies. Pension fundsinvest primarily in bonds, stocks, mortgages, and real estate.
6. Life insurance companies take savings in the form of annual premiums; investthese funds in stocks, bonds, real estate, and mortgages; and make paymentsto the beneficiaries of the insured parties. In recent years, life insurancecompanies have also offered a variety of tax-deferred savings plans designedto provide benefits to participants when they retire.
7. Mutual funds are corporations that accept money from savers and then usethese funds to buy stocks, long-term bonds, or short-term debt instrumentsissued by businesses or government units. These organizations pool funds andthus reduce risks by diversification. They also achieve economies of scale inanalyzing securities, managing portfolios, and buying and selling securities.Different funds are designed to meet the objectives of different types of savers.Hence, there are bond funds for those who prefer safety, stock funds for saverswho are willing to accept significant risks in the hope of higher returns, andstill other funds that are used as interest-bearing checking accounts (moneymarket funds). There are literally thousands of different mutual funds withdozens of different goals and purposes.
Mutual funds have grown more rapidly than most other institutions inrecent years, in large part because of a change in the way corporations providefor employees’ retirement. Before the 1980s, most corporations said, in effect,“Come work for us; and when you retire, we will give you a retirementincome based on the salary you were earning during the last five years beforeyou retired.” The company was then responsible for setting aside funds eachyear to make sure it had the money available to pay the agreed-upon retire-ment benefits. That situation is changing rapidly. Today new employees arelikely to be told, “Come work for us, and we will give you some money eachpayday that you can invest for your future retirement. You can’t get themoney until you retire (without paying a huge tax penalty); but if you investwisely, you can retire in comfort.” Most workers recognize that they don’tknow how to invest wisely, so they turn their retirement funds over to amutual fund. Hence, mutual funds are growing rapidly. Excellent informationon the objectives and past performances of the various funds are provided inpublications such as Value Line Investment Survey and Morningstar MutualFunds, which are available in most libraries and on the Internet.
8. Exchange Traded Funds (ETFs) are similar to regular mutual funds and areoften operated by mutual fund companies. ETFs buy a portfolio of stocks of acertain type—for example, the S&P 500 or media companies or Chinesecompanies—and then sell their own shares to the public. ETF shares aregenerally traded in the public markets, so an investor who wants to invest inthe Chinese market, for example, can buy shares in an ETF that holds stocks inthat particular market.
9. Hedge funds are also similar to mutual funds because they accept money fromsavers and use the funds to buy various securities, but there are someimportant differences. While mutual funds (and ETFs) are registered andregulated by the Securities and Exchange Commission (SEC), hedge funds arelargely unregulated. This difference in regulation stems from the fact that
Mutual FundsOrganizations that poolinvestor funds to purchasefinancial instruments andthus reduce risks throughdiversification.
Money Market FundsMutual funds that investin short-term, low-risksecurities and allowinvestors to write checksagainst their accounts.
Chapter 2 Financial Markets and Institutions 35
Cengage Learning
*ram* D:/Thomson_Learning_Projects/Brigham_Full_120614/z_production/z_3B2_3D_files/Brigham_0324597703_Ch.02.3d, 12/9/8, 13:23, page: 36
mutual funds typically target small investors, whereas hedge funds typicallyhave large minimum investments (often exceeding $1 million) and are mar-keted primarily to institutions and individuals with high net worths. Hedgefunds received their name because they traditionally were used when anindividual was trying to hedge risks. For example, a hedge fund manager whobelieves that interest rate differentials between corporate and Treasury bondsare too large might simultaneously buy a portfolio of corporate bonds and sella portfolio of Treasury bonds. In this case, the portfolio would be “hedged”against overall movements in interest rates, but it would perform especiallywell if the spread between these securities were to narrow.
However, some hedge funds take on risks that are considerably higherthan that of an average individual stock or mutual fund. For example, in 1998,Long-Term Capital Management (LTCM), a high-profile hedge fund whosemanagers included several well-respected practitioners as well as two NobelPrize–winning professors who were experts in investment theory, made someincorrect assumptions and “blew up.”5 LTCM had many billions of dollarsunder management, and it owed large amounts of money to a number ofbanks. To avert a worldwide crisis, the Federal Reserve orchestrated a buyoutof the firm by a group of New York banks.
As hedge funds have become more popular, many of them have begun tolower their minimum investment requirements. Perhaps not surprisingly,their rapid growth and shift toward smaller investors have also led to a call formore regulation.
10. Private equity companies are organizations that operate much like hedge funds;but rather than buying some of the stock of a firm, private equity players buyand then manage entire firms. Most of the money used to buy the targetcompanies is borrowed. Recent examples include Cerberus Capital’s buyoutof Chrysler and private equity company JC Flowers’ proposed $25 billionpurchase of Sallie Mae, the largest student loan company. The Sallie Mae dealis in jeopardy—Flowers planned to borrow most of the money for the pur-chase, but the subprime situation has made borrowing more difficult andexpensive. Flowers tried to back out of the deal, but Sallie Mae executivesinsisted that it complete the transaction or pay a $900 million “breakup fee.”
With the exception of hedge funds and private equity companies, financial insti-tutions are regulated to ensure the safety of these institutions and to protectinvestors. Historically, many of these regulations—which have included a prohi-bition on nationwide branch banking, restrictions on the types of assets theinstitutions could buy, ceilings on the interest rates they could pay, and limitationson the types of services they could provide—tended to impede the free flow ofcapital and thus hurt the efficiency of the capital markets. Recognizing this fact,policy makers took several steps during the 1980s and 1990s to deregulatefinancial services companies. For example, the restriction barring nationwidebranching by banks was eliminated in 1999.
Panel A of Table 2-2 lists the 10 largest U.S. bank holding companies, whilePanel B shows the leading world banking companies. Among the world’s 10 largest,only two (Citigroup and Bank of America) are based in the United States. While U.S.banks have grown dramatically as a result of recent mergers, they are still small byglobal standards. Panel C of the table lists the 10 leading underwriters in terms ofdollar volume of new debt and equity issues. Six of the top underwriters are alsomajor commercial banks or are part of bank holding companies, which confirms thecontinued blurring of distinctions between different types of financial institutions.
5See Franklin Edwards, “Hedge Funds and the Collapse of Long-Term Capital Management,” Journal of EconomicPerspectives, Vol. 13, no. 2 (Spring 1999), pp. 189–210, for a thoughtful review of the implications of Long-TermCapital Management’s collapse.
36 Part 2 Fundamental Concepts in Financial Management
Cengage Learning

*ram* D:/Thomson_Learning_Projects/Brigham_Full_120614/z_production/z_3B2_3D_files/Brigham_0324597703_Ch.02.3d, 12/9/8, 13:23, page: 37
Largest Banks and UnderwritersT a b l e 2 - 2
Panel AU.S. Bank HoldingCompaniesa
Panel BWorld BankingCompaniesb
Panel CLeading GlobalUnderwritersc
Citigroup Inc. UBS AG (Zurich) Citigroup Inc.
Bank of America Corp. Barclays PLC (London) JPMorgan
JPMorgan Chase & Co. BNP Paribas (Paris) Deutsche Bank AG
Wachovia Corp. Citigroup Inc. (New York) Merrill Lynch
Taunus Corp. HSBC Holdings PLC (London) Morgan Stanley
Wells Fargo & Co. Royal Bank of Scotland Group PLC (Edinburgh) Lehman Brothers
HSBC North America Holdings Inc. Credit Agricole (Paris) Goldman Sachs
U.S. Bancorp Mitsubishi UFJ Financial Group (Tokyo) Barclays Capital
Bank of New York, The Mellon Corp. Deutsche Bank AG (Frankfurt) UBS AG
SunTrust Banks, Inc. Bank of America Corp. (Charlotte) Credit Suisse
Notes:aRanked by total assets as of December 31, 2007. Source: National Information Center, www.ffiec.gov/nicpubweb/nicweb/Top50Form.aspx.bRanked by total assets as of December 31, 2007. Source: Thomson One Banker.cRanked by dollar amount raised through new issues (stocks and bonds) in 2007. For this ranking, the lead underwriter (manager) is given credit forthe entire issue. Source: Adapted from The Wall Street Journal, January 2, 2008, p. R18.
CITIGROUP BUILT TO COMPETE IN A CHANGING ENVIRONMENT
The financial environment has been undergoing tremen-dous changes, including breakthroughs in technology,increased globalization, and shifts in the regulatory envi-ronment. All of these factors have presented financialmanagers and investors with opportunities, but thoseopportunities are accompanied by substantial risks.
Consider the case of Citigroup Inc., which was createdin 1998 when Citicorp and Travelers Group (which includedthe investment firm Salomon Smith Barney) merged. Citi-group today operates in more than 100 countries, hasroughly 200 million customers and 275,000 employees, andholds more than $2.2 trillion (that’s over two thousand bil-lion!) worth of assets.
Citigroup resulted from three important trends:
1. Regulatory changes made it possible for U.S. corpo-rations to engage in commercial banking, investmentbanking, insurance, and other activities.
2. Increased globalization made it essential for financialinstitutions to follow their clients and thus operate inmany countries.
3. Changing technology led to increased economies ofscale and scope, both of which increased the relativeefficiency of huge diversified companies such asCitigroup.
Citigroup has grown, and it is now the largest financialinstitution in the world. But as the chapter opening vignetteindicated, Citigroup has been hit hard by the mortgagedebacle; and its chairperson, Charles Prince, recently lost hisjob. When you read this, you might access the Internet tofind the extent to which Citigroup has been able to reboundfrom its recent difficulties.
Chapter 2 Financial Markets and Institutions 37
Cengage Learning

*ram* D:/Thomson_Learning_Projects/Brigham_Full_120614/z_production/z_3B2_3D_files/Brigham_0324597703_Ch.02.3d, 12/9/8, 13:23, page: 38
SELF TEST What’s the difference between a commercial bank and an investment bank?
List the major types of financial institutions and briefly describe the primaryfunction of each.
What are some important differences between mutual funds, ExchangeTraded Funds, and hedge funds? How are they similar?
2-4 THE STOCK MARKETAs noted earlier, outstanding, previously issued securities are traded in the sec-ondary markets. By far, the most active secondary market—and the mostimportant one to financial managers—is the stock market,where the prices of firms’stocks are established. Because the primary goal of financial managers is tomaximize their firms’ stock prices, knowledge of the stock market is important toanyone involved in managing a business.
There are a number of different stock markets. The two leaders are the NewYork Stock Exchange (NYSE) and the Nasdaq stock market. Stocks are tradedusing a variety of market procedures, but there are just two basic types: (1) physicallocation exchanges, which include the NYSE, the American Stock Exchange(AMEX), and several regional stock exchanges, and (2) electronic dealer-basedmarkets, which include the Nasdaq, the less formal over-the-counter market, andthe recently developed electronic communications networks (ECNs). (See the boxentitled, “The NYSE and Nasdaq Go Global.”) Because the physical locationexchanges are easier to describe and understand, we discuss them first.
GLOBAL PERSPECTIVES
THE NYSE AND NASDAQ GO GLOBAL
Advances in computers and telecommunications thatspurred consolidation in the financial services industry havealso promoted online trading systems that bypass the tra-ditional exchanges. These systems, which are known aselectronic communications networks (ECNs), use electronictechnology to bring buyers and sellers together. The rise ofECNs accelerated the move toward 24-hour trading. U.S.investors who wanted to trade after the U.S. marketsclosed could utilize an ECN, thus bypassing the NYSE andNasdaq.
Recognizing the new threat, the NYSE and Nasdaq tookaction. First, both exchanges went public, which enabledthem to use their stock as “currency” that could be used tobuy ECNs and other exchanges across the globe. Forexample, Nasdaq acquired the American Stock Exchange
(AMEX), several ECNs, and 25% of the London StockExchange; and it is actively seeking to merge with otherexchanges around the world. The NYSE has taken similaractions, including a merger with the largest Europeanexchange, Euronext, to form NYSE Euronext.
These actions illustrate the growing importance ofglobal trading, especially electronic trading. Indeed, manypundits have concluded that the floor traders who buy andsell stocks on the NYSE and other physical exchanges willsoon become a thing of the past. That may or may not betrue, but it is clear that stock trading will continue toundergo dramatic changes in the upcoming years.
To find a wealth of up-to-date information on the NYSEand Nasdaq, go to Google (or another search engine) anddo NYSE history and Nasdaq history searches.
38 Part 2 Fundamental Concepts in Financial Management
Cengage Learning
*ram* D:/Thomson_Learning_Projects/Brigham_Full_120614/z_production/z_3B2_3D_files/Brigham_0324597703_Ch.02.3d, 12/9/8, 13:23, page: 39
2-4a Physical Location Stock ExchangesPhysical location exchanges are tangible entities. Each of the larger ones occupiesits own building, allows a limited number of people to trade on its floor, and hasan elected governing body—its board of governors. Members of the NYSE for-merly had “seats” on the exchange, although everybody stood up. Today the seatshave been exchanged for trading licenses, which are auctioned to memberorganizations and cost about $50,000 per year. Most of the larger investmentbanks operate brokerage departments. They purchase seats on the exchanges anddesignate one or more of their officers as members. The exchanges are open on allnormal working days, with the members meeting in a large room equipped withtelephones and other electronic equipment that enable each member to commu-nicate with his or her firm’s offices throughout the country.
Like other markets, security exchanges facilitate communication betweenbuyers and sellers. For example, Merrill Lynch (the fourth largest brokerage firm)might receive an order in its Atlanta office from a customer who wants to buyshares of GE stock. Simultaneously, the Denver office of Morgan Stanley (the fifthlargest brokerage firm) might receive an order from a customer wanting to sellshares of GE. Each broker communicates electronically with the firm’s represen-tative on the NYSE. Other brokers throughout the country are also communicatingwith their own exchange members. The exchange members with sell orders offerthe shares for sale, and they are bid for by the members with buy orders. Thus, theexchanges operate as auction markets.6
2-4b Over-the-Counter (OTC) and the NasdaqStock Markets
While the stocks of most large companies trade on the NYSE, a larger numberof stocks trade off the exchange in what was traditionally referred to as the over-the-counter (OTC) market. An explanation of the term over-the-counter will helpclarify how this term arose. As noted earlier, the exchanges operate as auctionmarkets—buy and sell orders come in more or less simultaneously, and exchangemembers match these orders. When a stock is traded infrequently, perhapsbecause the firm is new or small, few buy and sell orders come in and matchingthem within a reasonable amount of time is difficult. To avoid this problem, somebrokerage firms maintain an inventory of such stocks and stand prepared to makea market for them. These “dealers” buy when individual investors want to sell,and they sell part of their inventory when investors want to buy. At one time, theinventory of securities was kept in a safe; and the stocks, when bought and sold,were literally passed over the counter.
Physical LocationExchangesFormal organizationshaving tangible physicallocations that conductauction markets indesignated (“listed”)securities.
6 The NYSE is actually a modified auction market wherein people (through their brokers) bid for stocks. Originally—in 1792—brokers would literally shout, “I have 100 shares of Erie for sale; how much am I offered?” and then sellto the highest bidder. If a broker had a buy order, he or she would shout, “I want to buy 100 shares of Erie; who’llsell at the best price?” The same general situation still exists, although the exchanges now have members knownas specialists who facilitate the trading process by keeping an inventory of shares of the stocks in which theyspecialize. If a buy order comes in at a time when no sell order arrives, the specialist will sell off some inventory.Similarly, if a sell order comes in, the specialist will buy and add to inventory. The specialist sets a bid price (theprice the specialist will pay for the stock) and an ask price (the price at which shares will be sold out of inventory).The bid and ask prices are set at levels designed to keep the inventory in balance. If many buy orders start comingin because of favorable developments or many sell orders come in because of unfavorable events, the specialistwill raise or lower prices to keep supply and demand in balance. Bid prices are somewhat lower than ask prices,with the difference, or spread, representing the specialist’s profit margin.
Special facilities are available to help institutional investors such as mutual or pension funds sell large blocks ofstock without depressing their prices. In essence, brokerage houses that cater to institutional clients will purchaseblocks (defined as 10,000 or more shares) and then resell the stock to other institutions or individuals. Also, when afirm has a major announcement that is likely to cause its stock price to change sharply, it will ask the exchange tohalt trading in its stock until the announcement has been made and the resulting information has been digestedby investors.
Over-the-Counter (OTC)MarketA large collection of brok-ers and dealers, connectedelectronically by tele-phones and computers,that provides for tradingin unlisted securities.
Chapter 2 Financial Markets and Institutions 39
Cengage Learning

*ram* D:/Thomson_Learning_Projects/Brigham_Full_120614/z_production/z_3B2_3D_files/Brigham_0324597703_Ch.02.3d, 12/9/8, 13:23, page: 40
Today these markets are often referred to as dealer markets. A dealer marketincludes all facilities that are needed to conduct security transactions, but thetransactions are not made on the physical location exchanges. The dealer marketsystem consists of (1) the relatively few dealers who hold inventories of thesesecurities and who are said to “make a market” in these securities; (2) the thou-sands of brokers who act as agents in bringing the dealers together with investors;and (3) the computers, terminals, and electronic networks that provide a com-munication link between dealers and brokers. The dealers who make a market in aparticular stock quote the price at which they will pay for the stock (the bid price)and the price at which they will sell shares (the ask price). Each dealer’s prices,which are adjusted as supply and demand conditions change, can be seen oncomputer screens across the world. The bid-ask spread, which is the differencebetween bid and ask prices, represents the dealer’s markup, or profit. The dealer’srisk increases when the stock is more volatile or when the stock trades infre-quently. Generally, we would expect volatile, infrequently traded stocks to havewider spreads in order to compensate the dealers for assuming the risk of holdingthem in inventory.
Brokers and dealers who participate in the OTC market are members of a self-regulatory body known as the National Association of Securities Dealers (NASD),which licenses brokers and oversees trading practices. The computerized networkused by the NASD is known as the NASD Automated Quotation System (Nasdaq).
Nasdaq started as just a quotation system, but it has grown to become anorganized securities market with its own listing requirements. Over the pastdecade, the competition between the NYSE and Nasdaq has become increasinglyfierce. As noted earlier, the Nasdaq has invested in the London Stock Exchangeand other market makers, while the NYSE merged with Euronext. Since most ofthe larger companies trade on the NYSE, the market capitalization of NYSE-tradedstocks is much higher than for stocks traded on Nasdaq. However, reportedvolume (number of shares traded) is often larger on Nasdaq, and more companiesare listed on Nasdaq.7
Interestingly, many high-tech companies such as Microsoft, Google, and Intelhave remained on Nasdaq even though they meet the listing requirements of theNYSE. At the same time, however, other high-tech companies have left Nasdaq forthe NYSE. Despite these defections, Nasdaq’s growth over the past decade hasbeen impressive. In the years ahead, competition between Nasdaq and NYSEEuronext will no doubt remain fierce.
SELF TEST What are the differences between the physical location exchanges and theNasdaq stock market?
What is the bid-ask spread?
2-5 THE MARKET FOR COMMON STOCKSome companies are so small that their common stocks are not actively traded;they are owned by relatively few people, usually the companies’ managers. Thesefirms are said to be privately owned, or closely held, corporations; and their stock iscalled closely held stock. In contrast, the stocks of most large companies are owned
Dealer MarketIncludes all facilities thatare needed to conductsecurity transactions notconducted on the physicallocation exchanges.
7One transaction on Nasdaq generally shows up as two separate trades (the buy and the sell). This “doublecounting” makes it difficult to compare the volume between stock markets.
Closely HeldCorporationA corporation that isowned by a few individu-als who are typicallyassociated with the firm’smanagement.
40 Part 2 Fundamental Concepts in Financial Management
Cengage Learning
*ram* D:/Thomson_Learning_Projects/Brigham_Full_120614/z_production/z_3B2_3D_files/Brigham_0324597703_Ch.02.3d, 12/9/8, 13:23, page: 41
by thousands of investors, most of whom are not active in management. Thesecompanies are called publicly owned corporations, and their stock is calledpublicly held stock.
A recent study found that institutional investors owned about 46% of allpublicly held common stocks. Included are pension plans (26%), mutual funds(10%), foreign investors (6%), insurance companies (3%), and brokerage firms(1%). However, because these institutions buy and sell relatively actively, theyaccount for about 75% of all transactions. Thus, institutional investors have asignificant influence on the prices of individual stocks.
2-5a Types of Stock Market TransactionsWe can classify stock market transactions into three distinct categories:1. Outstanding shares of established publicly owned companies that are traded: the
secondary market. Allied Food Products, the company we will study inChapters 3 and 4, has 50 million shares of stock outstanding. If the owner of100 shares sells his or her stock, the trade is said to have occurred in thesecondary market. Thus, the market for outstanding shares, or used shares, is thesecondary market. The company receives no new money when sales occur inthis market.
2. Additional shares sold by established publicly owned companies: the primary market.If Allied Food decides to sell (or issue) an additional 1 million shares to raisenew equity capital, this transaction is said to occur in the primary market.8
3. Initial public offerings made by privately held firms: the IPO market. In the sum-mer of 2004, Google sold shares to the public for the first time at $85 per share.By February 2008, the stock was selling for $495, so it had increased by over480%. In 2006, McDonald’s owned Chipotle Mexican Grill. McDonald’s thensold its shares to the public for about $47.50 to raise capital to support its corebusiness; and by February 2008, Chipotle’s stock price was $117. Makingthese types of offerings is called going public. Whenever stock in a closelyheld corporation is offered to the public for the first time, the company is saidto be going public. The market for stock that is just being offered to the publicis called the initial public offering (IPO) market.9
The number of new IPOs rises and falls with the stock market. When the market isstrong, many companies go public to bring in new capital and to give theirfounders an opportunity to cash out some of their shares. Table 2-3 lists thelargest, the best performing, and the worst performing IPOs of 2007 and showshow they performed from their offering dates through year-end 2007. As the tableshows, not all IPOs are as well received as Google and Chipotle. Moreover, even ifyou are able to identify a “hot” issue, it is often difficult to purchase shares in theinitial offering. These deals are often oversubscribed, which means that the demandfor shares at the offering price exceeds the number of shares issued. In suchinstances, investment bankers favor large institutional investors (who are theirbest customers); and small investors find it hard, if not impossible, to get in on theground floor. They can buy the stock in the aftermarket; but evidence suggests
Publicly OwnedCorporationA corporation that isowned by a relativelylarge number of individu-als who are not activelyinvolved in the firm’smanagement.
8Allied has 60 million shares authorized but only 50 million outstanding; thus, it has 10 million authorized butunissued shares. If it had no authorized but unissued shares, management could increase the authorized shares byobtaining stockholders’ approval, which would generally be granted without any arguments.9A number of years ago Coors, the beer company, offered some of its shares to the public. These shares weredesignated Class B, and they were nonvoting. The Coors family retained the founders’ shares, called Class A stock,which carried full voting privileges. This illustrates how the managers of a company can use different classes ofshares to maintain control. However, the nonvoting shares always sell for less than the voting shares, so usingnonvoting shares does not maximize the value of the firm.
Going PublicThe act of selling stock tothe public at large by aclosely held corporation orits principal stockholders.
Initial Public Offering(IPO) MarketThe market for stocks ofcompanies that are in theprocess of going public.
Chapter 2 Financial Markets and Institutions 41
Cengage Learning
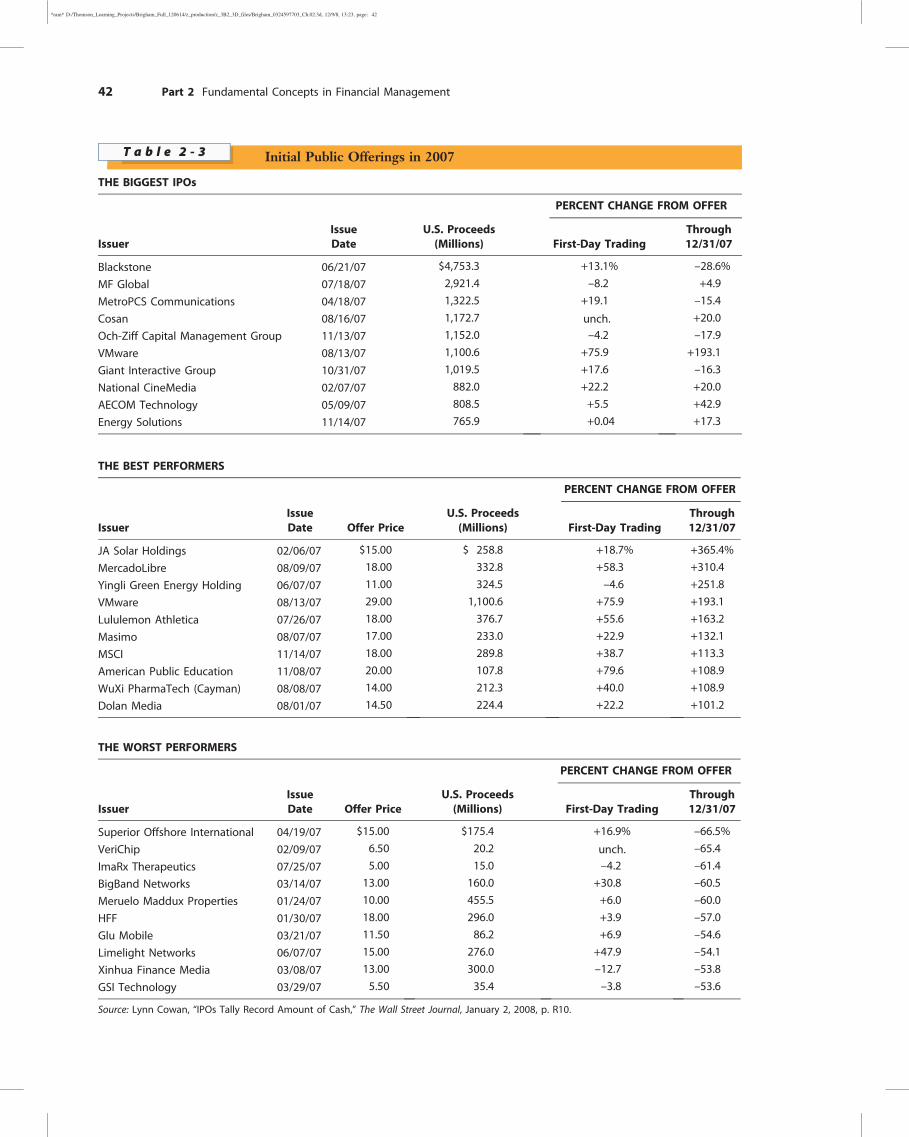
*ram* D:/Thomson_Learning_Projects/Brigham_Full_120614/z_production/z_3B2_3D_files/Brigham_0324597703_Ch.02.3d, 12/9/8, 13:23, page: 42
Initial Public Offerings in 2007T a b l e 2 - 3
THE BIGGEST IPOs
PERCENT CHANGE FROM OFFER
IssuerIssueDate
U.S. Proceeds(Millions) First-Day Trading
Through12/31/07
Blackstone 06/21/07 $4,753.3 +13.1% –28.6%
MF Global 07/18/07 2,921.4 –8.2 +4.9
MetroPCS Communications 04/18/07 1,322.5 +19.1 –15.4
Cosan 08/16/07 1,172.7 unch. +20.0
Och-Ziff Capital Management Group 11/13/07 1,152.0 –4.2 –17.9
VMware 08/13/07 1,100.6 +75.9 +193.1
Giant Interactive Group 10/31/07 1,019.5 +17.6 –16.3
National CineMedia 02/07/07 882.0 +22.2 +20.0
AECOM Technology 05/09/07 808.5 +5.5 +42.9
Energy Solutions 11/14/07 765.9 +0.04 +17.3
THE BEST PERFORMERS
PERCENT CHANGE FROM OFFER
IssuerIssueDate Offer Price
U.S. Proceeds(Millions) First-Day Trading
Through12/31/07
JA Solar Holdings 02/06/07 $15.00 $ 258.8 +18.7% +365.4%
MercadoLibre 08/09/07 18.00 332.8 +58.3 +310.4
Yingli Green Energy Holding 06/07/07 11.00 324.5 –4.6 +251.8
VMware 08/13/07 29.00 1,100.6 +75.9 +193.1
Lululemon Athletica 07/26/07 18.00 376.7 +55.6 +163.2
Masimo 08/07/07 17.00 233.0 +22.9 +132.1
MSCI 11/14/07 18.00 289.8 +38.7 +113.3
American Public Education 11/08/07 20.00 107.8 +79.6 +108.9
WuXi PharmaTech (Cayman) 08/08/07 14.00 212.3 +40.0 +108.9
Dolan Media 08/01/07 14.50 224.4 +22.2 +101.2
THE WORST PERFORMERS
PERCENT CHANGE FROM OFFER
IssuerIssueDate Offer Price
U.S. Proceeds(Millions) First-Day Trading
Through12/31/07
Superior Offshore International 04/19/07 $15.00 $175.4 +16.9% –66.5%
VeriChip 02/09/07 6.50 20.2 unch. –65.4
ImaRx Therapeutics 07/25/07 5.00 15.0 –4.2 –61.4
BigBand Networks 03/14/07 13.00 160.0 +30.8 –60.5
Meruelo Maddux Properties 01/24/07 10.00 455.5 +6.0 –60.0
HFF 01/30/07 18.00 296.0 +3.9 –57.0
Glu Mobile 03/21/07 11.50 86.2 +6.9 –54.6
Limelight Networks 06/07/07 15.00 276.0 +47.9 –54.1
Xinhua Finance Media 03/08/07 13.00 300.0 –12.7 –53.8
GSI Technology 03/29/07 5.50 35.4 –3.8 –53.6
Source: Lynn Cowan, “IPOs Tally Record Amount of Cash,” The Wall Street Journal, January 2, 2008, p. R10.
42 Part 2 Fundamental Concepts in Financial Management
Cengage Learning
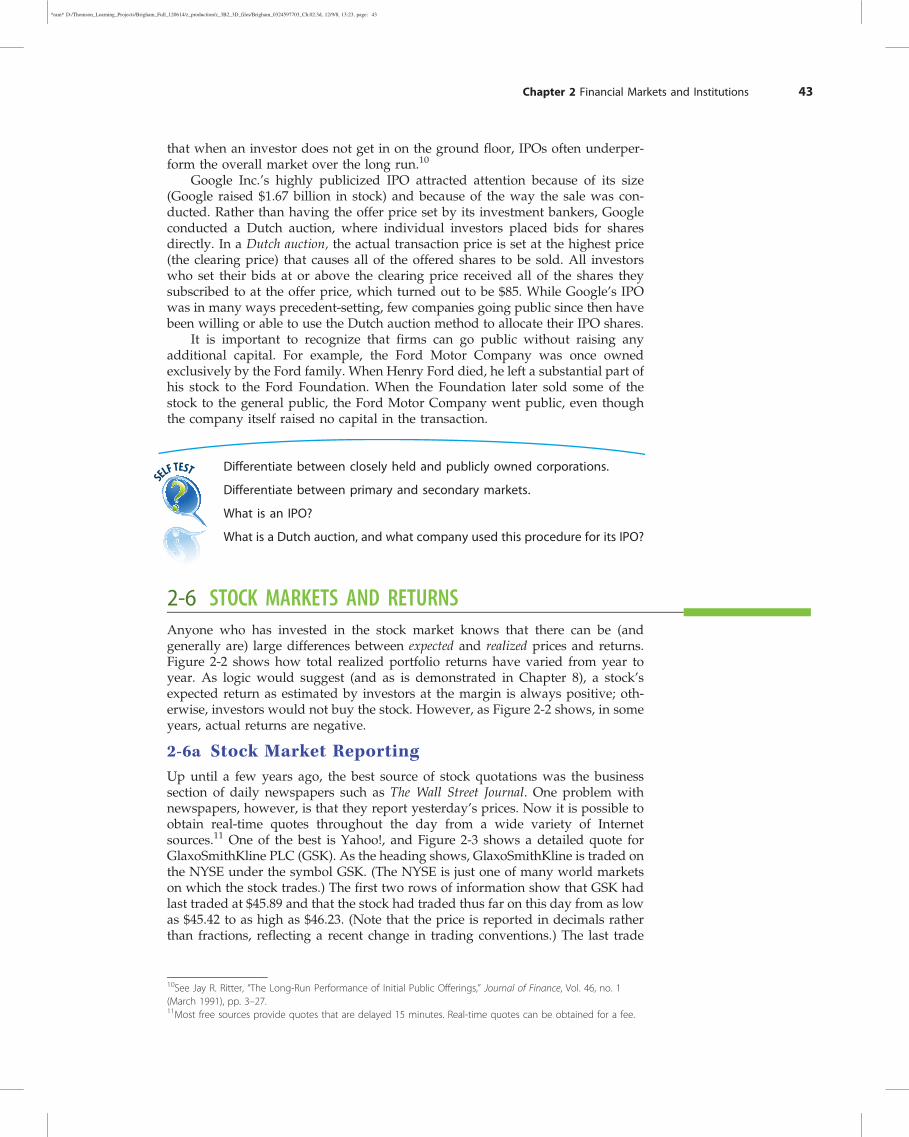
*ram* D:/Thomson_Learning_Projects/Brigham_Full_120614/z_production/z_3B2_3D_files/Brigham_0324597703_Ch.02.3d, 12/9/8, 13:23, page: 43
that when an investor does not get in on the ground floor, IPOs often underper-form the overall market over the long run.10
Google Inc.’s highly publicized IPO attracted attention because of its size(Google raised $1.67 billion in stock) and because of the way the sale was con-ducted. Rather than having the offer price set by its investment bankers, Googleconducted a Dutch auction, where individual investors placed bids for sharesdirectly. In a Dutch auction, the actual transaction price is set at the highest price(the clearing price) that causes all of the offered shares to be sold. All investorswho set their bids at or above the clearing price received all of the shares theysubscribed to at the offer price, which turned out to be $85. While Google’s IPOwas in many ways precedent-setting, few companies going public since then havebeen willing or able to use the Dutch auction method to allocate their IPO shares.
It is important to recognize that firms can go public without raising anyadditional capital. For example, the Ford Motor Company was once ownedexclusively by the Ford family. When Henry Ford died, he left a substantial part ofhis stock to the Ford Foundation. When the Foundation later sold some of thestock to the general public, the Ford Motor Company went public, even thoughthe company itself raised no capital in the transaction.
SELF TEST Differentiate between closely held and publicly owned corporations.
Differentiate between primary and secondary markets.
What is an IPO?
What is a Dutch auction, and what company used this procedure for its IPO?
2-6 STOCK MARKETS AND RETURNSAnyone who has invested in the stock market knows that there can be (andgenerally are) large differences between expected and realized prices and returns.Figure 2-2 shows how total realized portfolio returns have varied from year toyear. As logic would suggest (and as is demonstrated in Chapter 8), a stock’sexpected return as estimated by investors at the margin is always positive; oth-erwise, investors would not buy the stock. However, as Figure 2-2 shows, in someyears, actual returns are negative.
2-6a Stock Market ReportingUp until a few years ago, the best source of stock quotations was the businesssection of daily newspapers such as The Wall Street Journal. One problem withnewspapers, however, is that they report yesterday’s prices. Now it is possible toobtain real-time quotes throughout the day from a wide variety of Internetsources.11 One of the best is Yahoo!, and Figure 2-3 shows a detailed quote forGlaxoSmithKline PLC (GSK). As the heading shows, GlaxoSmithKline is traded onthe NYSE under the symbol GSK. (The NYSE is just one of many world marketson which the stock trades.) The first two rows of information show that GSK hadlast traded at $45.89 and that the stock had traded thus far on this day from as lowas $45.42 to as high as $46.23. (Note that the price is reported in decimals ratherthan fractions, reflecting a recent change in trading conventions.) The last trade
10See Jay R. Ritter, “The Long-Run Performance of Initial Public Offerings,” Journal of Finance, Vol. 46, no. 1(March 1991), pp. 3–27.11Most free sources provide quotes that are delayed 15 minutes. Real-time quotes can be obtained for a fee.
Chapter 2 Financial Markets and Institutions 43
Cengage Learning
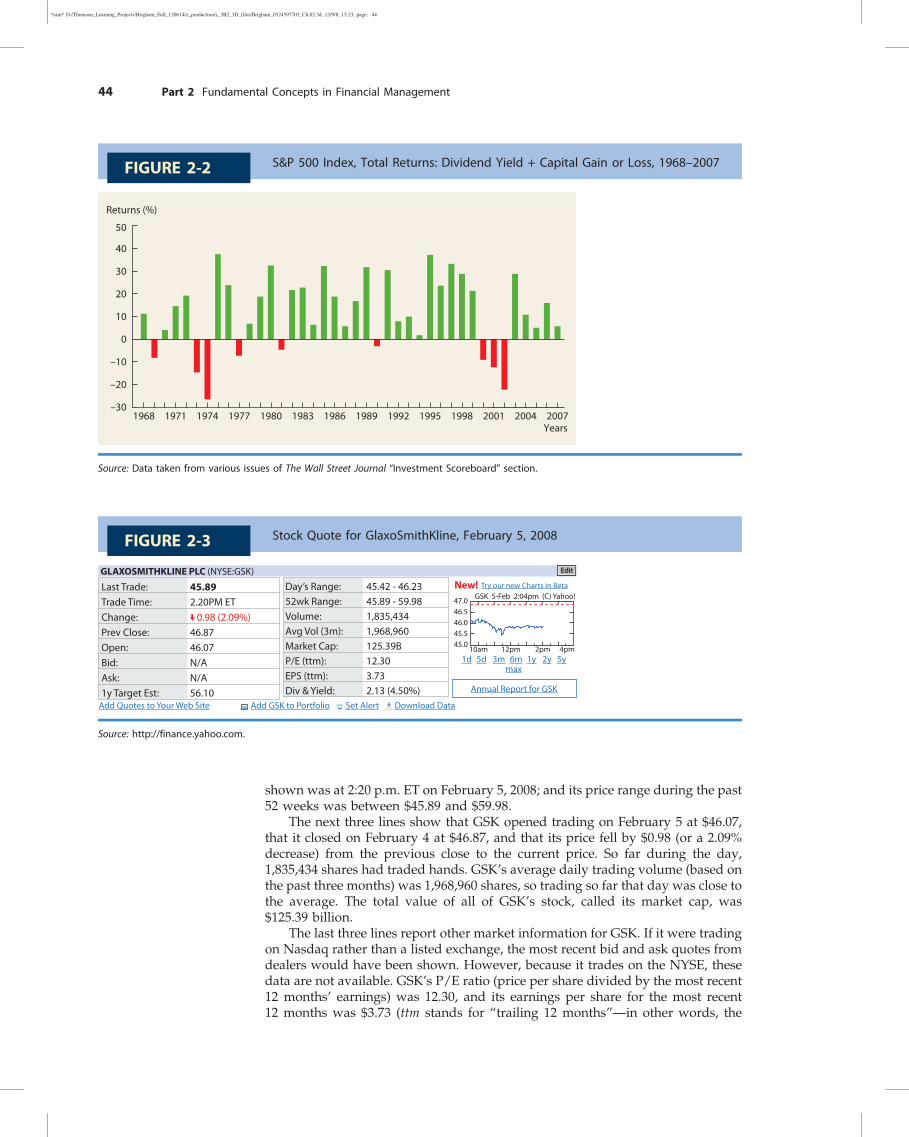
*ram* D:/Thomson_Learning_Projects/Brigham_Full_120614/z_production/z_3B2_3D_files/Brigham_0324597703_Ch.02.3d, 12/9/8, 13:23, page: 44
shown was at 2:20 p.m. ET on February 5, 2008; and its price range during the past52 weeks was between $45.89 and $59.98.
The next three lines show that GSK opened trading on February 5 at $46.07,that it closed on February 4 at $46.87, and that its price fell by $0.98 (or a 2.09%decrease) from the previous close to the current price. So far during the day,1,835,434 shares had traded hands. GSK’s average daily trading volume (based onthe past three months) was 1,968,960 shares, so trading so far that day was close tothe average. The total value of all of GSK’s stock, called its market cap, was$125.39 billion.
The last three lines report other market information for GSK. If it were tradingon Nasdaq rather than a listed exchange, the most recent bid and ask quotes fromdealers would have been shown. However, because it trades on the NYSE, thesedata are not available. GSK’s P/E ratio (price per share divided by the most recent12 months’ earnings) was 12.30, and its earnings per share for the most recent12 months was $3.73 (ttm stands for “trailing 12 months”—in other words, the
S&P 500 Index, Total Returns: Dividend Yield + Capital Gain or Loss, 1968–2007FIGURE 2-2
Returns (%)
1992 1995 199819891983 198619801974 197719711968
40
30
20
10
0
–10
–20
–30
50
Years2001 2004 2007
Source: Data taken from various issues of The Wall Street Journal “Investment Scoreboard” section.
Stock Quote for GlaxoSmithKline, February 5, 2008FIGURE 2-3
Last Trade:Trade Time:Change:Prev Close:Open:Bid:Ask:1y Target Est:
45.892.20PM ET 0.98 (2.09%)46.8746.07N/AN/A56.10
47.046.546.045.545.0
10am 12pm 2pm 4pm
New! Try our new Charts in BetaGSK 5-Feb 2:04pm (C) Yahoo!
1d 5d 3m 6m 1y 2y 5ymax
Annual Report for GSK
Add Quotes to Your Web Site Add GSK to Portfolio Set Alert Download Data
Day’s Range:52wk Range:Volume:Avg Vol (3m):Market Cap:P/E (ttm):EPS (ttm):Div & Yield:
45.42 - 46.2345.89 - 59.981,835,4341,968,960125.39B12.303.732.13 (4.50%)
GLAXOSMITHKLINE PLC (NYSE:GSK) Edit
Source: http://finance.yahoo.com.
44 Part 2 Fundamental Concepts in Financial Management
Cengage Learning
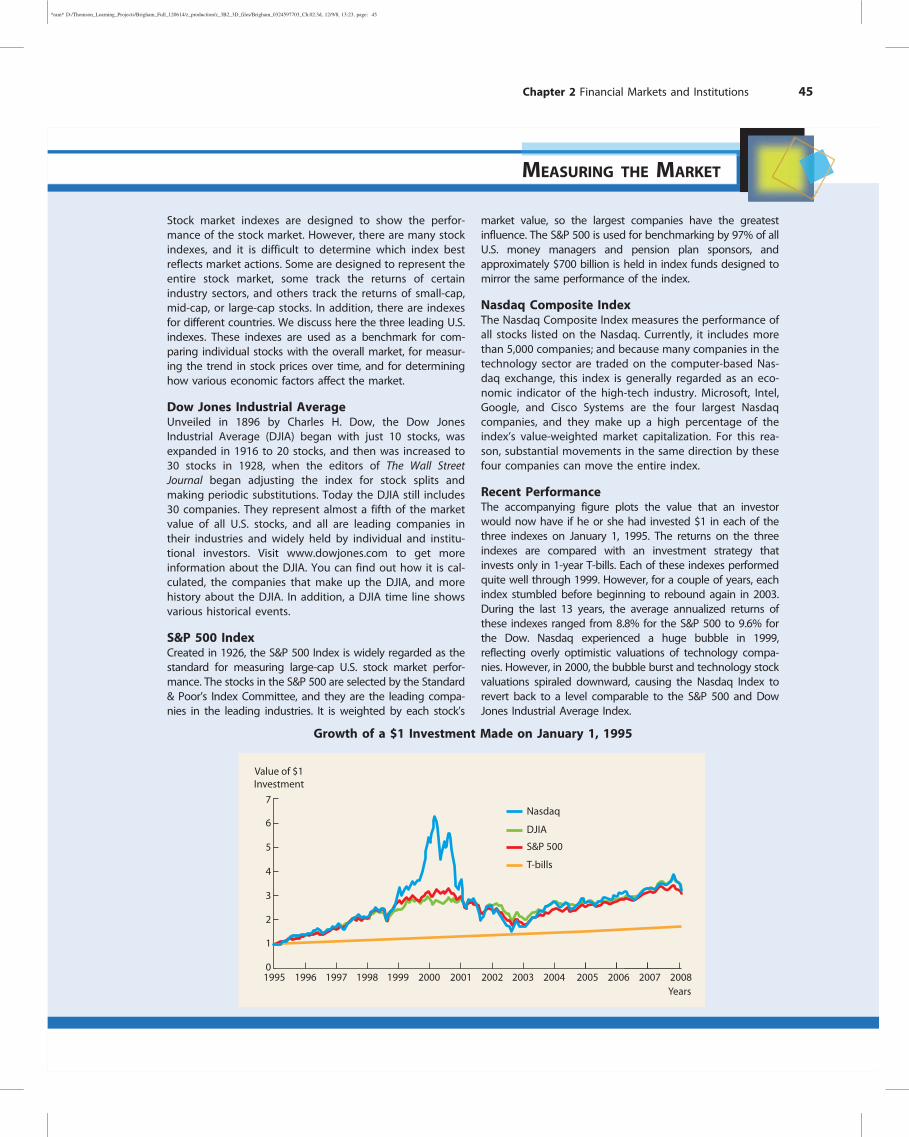
*ram* D:/Thomson_Learning_Projects/Brigham_Full_120614/z_production/z_3B2_3D_files/Brigham_0324597703_Ch.02.3d, 12/9/8, 13:23, page: 45
MEASURING THE MARKET
Stock market indexes are designed to show the perfor-mance of the stock market. However, there are many stockindexes, and it is difficult to determine which index bestreflects market actions. Some are designed to represent theentire stock market, some track the returns of certainindustry sectors, and others track the returns of small-cap,mid-cap, or large-cap stocks. In addition, there are indexesfor different countries. We discuss here the three leading U.S.indexes. These indexes are used as a benchmark for com-paring individual stocks with the overall market, for measur-ing the trend in stock prices over time, and for determininghow various economic factors affect the market.
Dow Jones Industrial AverageUnveiled in 1896 by Charles H. Dow, the Dow JonesIndustrial Average (DJIA) began with just 10 stocks, wasexpanded in 1916 to 20 stocks, and then was increased to30 stocks in 1928, when the editors of The Wall StreetJournal began adjusting the index for stock splits andmaking periodic substitutions. Today the DJIA still includes30 companies. They represent almost a fifth of the marketvalue of all U.S. stocks, and all are leading companies intheir industries and widely held by individual and institu-tional investors. Visit www.dowjones.com to get moreinformation about the DJIA. You can find out how it is cal-culated, the companies that make up the DJIA, and morehistory about the DJIA. In addition, a DJIA time line showsvarious historical events.
S&P 500 IndexCreated in 1926, the S&P 500 Index is widely regarded as thestandard for measuring large-cap U.S. stock market perfor-mance. The stocks in the S&P 500 are selected by the Standard& Poor’s Index Committee, and they are the leading compa-nies in the leading industries. It is weighted by each stock’s
market value, so the largest companies have the greatestinfluence. The S&P 500 is used for benchmarking by 97% of allU.S. money managers and pension plan sponsors, andapproximately $700 billion is held in index funds designed tomirror the same performance of the index.
Nasdaq Composite IndexThe Nasdaq Composite Index measures the performance ofall stocks listed on the Nasdaq. Currently, it includes morethan 5,000 companies; and because many companies in thetechnology sector are traded on the computer-based Nas-daq exchange, this index is generally regarded as an eco-nomic indicator of the high-tech industry. Microsoft, Intel,Google, and Cisco Systems are the four largest Nasdaqcompanies, and they make up a high percentage of theindex’s value-weighted market capitalization. For this rea-son, substantial movements in the same direction by thesefour companies can move the entire index.
Recent PerformanceThe accompanying figure plots the value that an investorwould now have if he or she had invested $1 in each of thethree indexes on January 1, 1995. The returns on the threeindexes are compared with an investment strategy thatinvests only in 1-year T-bills. Each of these indexes performedquite well through 1999. However, for a couple of years, eachindex stumbled before beginning to rebound again in 2003.During the last 13 years, the average annualized returns ofthese indexes ranged from 8.8% for the S&P 500 to 9.6% forthe Dow. Nasdaq experienced a huge bubble in 1999,reflecting overly optimistic valuations of technology compa-nies. However, in 2000, the bubble burst and technology stockvaluations spiraled downward, causing the Nasdaq Index torevert back to a level comparable to the S&P 500 and DowJones Industrial Average Index.
Growth of a $1 Investment Made on January 1, 1995
1995 1996 1997 1998 1999 2000 2001 2002
Nasdaq
DJIA
S&P 500
T-bills
2003 2004 2005
7
Value of $1Investment
2006 2007 2008Years
6
5
4
3
2
1
0
Chapter 2 Financial Markets and Institutions 45
Cengage Learning
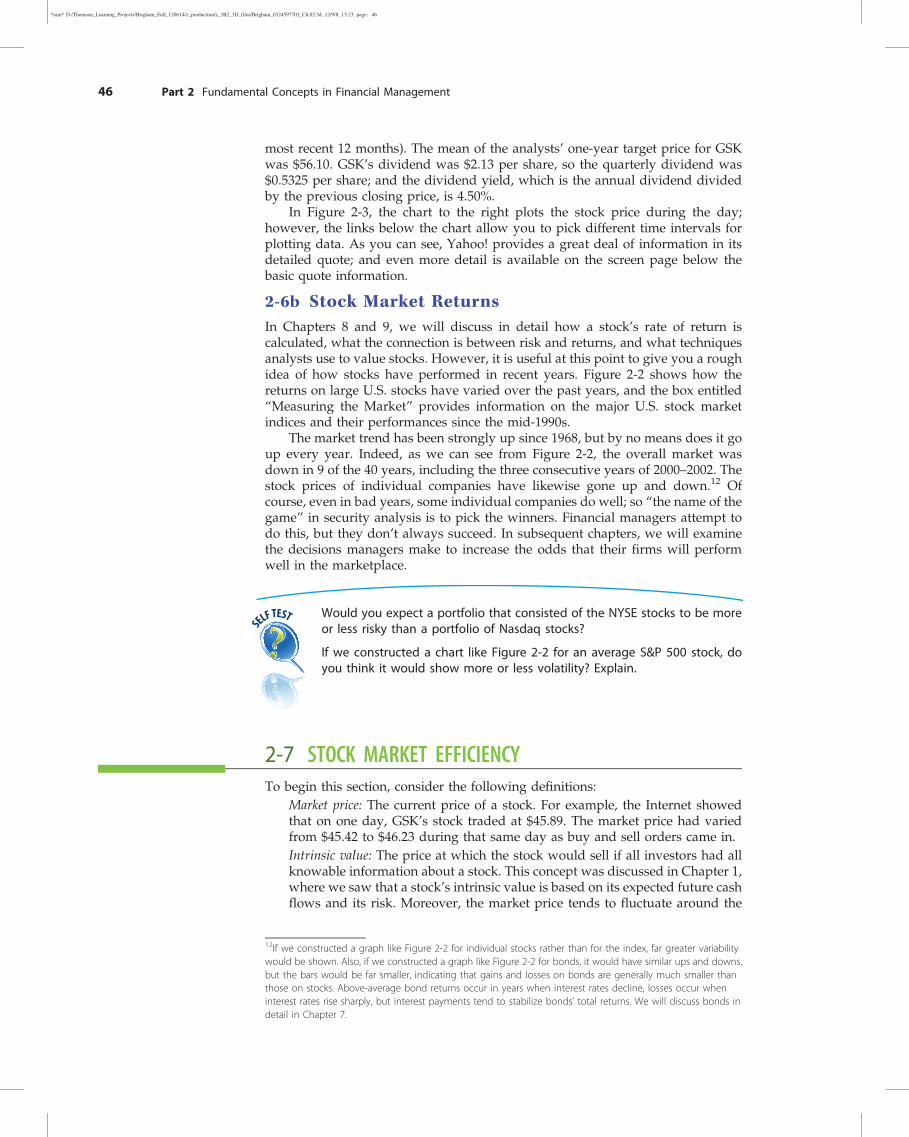
*ram* D:/Thomson_Learning_Projects/Brigham_Full_120614/z_production/z_3B2_3D_files/Brigham_0324597703_Ch.02.3d, 12/9/8, 13:23, page: 46
most recent 12 months). The mean of the analysts’ one-year target price for GSKwas $56.10. GSK’s dividend was $2.13 per share, so the quarterly dividend was$0.5325 per share; and the dividend yield, which is the annual dividend dividedby the previous closing price, is 4.50%.
In Figure 2-3, the chart to the right plots the stock price during the day;however, the links below the chart allow you to pick different time intervals forplotting data. As you can see, Yahoo! provides a great deal of information in itsdetailed quote; and even more detail is available on the screen page below thebasic quote information.
2-6b Stock Market ReturnsIn Chapters 8 and 9, we will discuss in detail how a stock’s rate of return iscalculated, what the connection is between risk and returns, and what techniquesanalysts use to value stocks. However, it is useful at this point to give you a roughidea of how stocks have performed in recent years. Figure 2-2 shows how thereturns on large U.S. stocks have varied over the past years, and the box entitled“Measuring the Market” provides information on the major U.S. stock marketindices and their performances since the mid-1990s.
The market trend has been strongly up since 1968, but by no means does it goup every year. Indeed, as we can see from Figure 2-2, the overall market wasdown in 9 of the 40 years, including the three consecutive years of 2000–2002. Thestock prices of individual companies have likewise gone up and down.12 Ofcourse, even in bad years, some individual companies do well; so “the name of thegame” in security analysis is to pick the winners. Financial managers attempt todo this, but they don’t always succeed. In subsequent chapters, we will examinethe decisions managers make to increase the odds that their firms will performwell in the marketplace.
SELF TEST Would you expect a portfolio that consisted of the NYSE stocks to be moreor less risky than a portfolio of Nasdaq stocks?
If we constructed a chart like Figure 2-2 for an average S&P 500 stock, doyou think it would show more or less volatility? Explain.
2-7 STOCK MARKET EFFICIENCYTo begin this section, consider the following definitions:
Market price: The current price of a stock. For example, the Internet showedthat on one day, GSK’s stock traded at $45.89. The market price had variedfrom $45.42 to $46.23 during that same day as buy and sell orders came in.Intrinsic value: The price at which the stock would sell if all investors had allknowable information about a stock. This concept was discussed in Chapter 1,where we saw that a stock’s intrinsic value is based on its expected future cashflows and its risk. Moreover, the market price tends to fluctuate around the
12If we constructed a graph like Figure 2-2 for individual stocks rather than for the index, far greater variabilitywould be shown. Also, if we constructed a graph like Figure 2-2 for bonds, it would have similar ups and downs,but the bars would be far smaller, indicating that gains and losses on bonds are generally much smaller thanthose on stocks. Above-average bond returns occur in years when interest rates decline, losses occur wheninterest rates rise sharply, but interest payments tend to stabilize bonds’ total returns. We will discuss bonds indetail in Chapter 7.
46 Part 2 Fundamental Concepts in Financial Management
Cengage Learning
*ram* D:/Thomson_Learning_Projects/Brigham_Full_120614/z_production/z_3B2_3D_files/Brigham_0324597703_Ch.02.3d, 12/9/8, 13:23, page: 47
intrinsic value; and the intrinsic value changes over time as the companysucceeds or fails with new projects, competitors enter or exit the market, andso forth. We can guess (or estimate) GSK’s intrinsic value, but different ana-lysts will reach somewhat different conclusions.Equilibrium price: The price that balances buy and sell orders at any given time.When a stock is in equilibrium, the price remains relatively stable until newinformation becomes available and causes the price to change. For example,GSK’s equilibrium price appears to be about $45.89, as it has been fluctuatingnarrowly around this amount.Efficient market: A market in which prices are close to intrinsic values andstocks seem to be in equilibrium.
When markets are efficient, investors can buy and sell stocks and be confident thatthey are getting good prices. When markets are inefficient, investors may be afraidto invest and may put their money “under the pillow,” which will lead to a poorallocation of capital and economic stagnation. So from an economic standpoint,market efficiency is good.
Academics and financial professionals have studied the issue of market effi-ciency extensively.13 As generally happens, some people think that markets arehighly efficient, others think that markets are highly inefficient, and others thinkthat the issue is too complex for a simple answer.
Those who believe that markets are efficient note that there are 100,000 or sofull-time, highly trained professional analysts and traders operating in the market.Many have PhDs in physics, chemistry, and other technical fields in addition toadvanced degrees in finance. Moreover, there are fewer than 3,000 major stocks; soif each analyst followed 30 stocks (which is about right, as analysts tend to focuson a specific industry), on average, 1,000 analysts would be following each stock.Further, these analysts work for organizations such as Goldman Sachs, MerrillLynch, Citigroup, and Deutsche Bank or for Warren Buffett and other billionaireinvestors who have billions of dollars available to take advantage of bargains.Also, the SEC has disclosure rules which, combined with electronic informationnetworks, means that new information about a stock is received by all analysts atabout the same time, causing almost instantaneous revaluations. All of thesefactors help markets be efficient and cause stock prices to move toward theirintrinsic values.
However, other people point to data that suggests that markets are not veryefficient. For example, on October 15, 1987, the S&P 500 lost 25% of its value.Many of the largest U.S. companies did worse, watching their prices get cut inhalf. In 2000, Internet stocks rose to phenomenally high prices, then fell to zero orclose to it the following year. No truly important news was announced that couldhave caused either of these changes; and if the market was efficient, it’s hard to seehow such drastic changes could have occurred. Another situation that causespeople to question market efficiency is the apparent ability of some analysts toconsistently outperform the market over long periods. Warren Buffett comes tomind, but there are others. If markets are truly efficient, then each stock’s price
13The general name for these studies is the efficient markets hypothesis, or EMH. It was, and still is, a hypothesisthat needs to be proved or disproved empirically. In the literature, researchers identified three levels of efficiency:weak form, which contends that information on past stock price movements cannot be used to predict futurestock prices; semi-strong form, which contends that all publicly available information is immediately incorporatedinto stock prices (i.e., that one cannot analyze published reports and then beat the market); and strong form,which contends that even company insiders, with inside information, cannot earn abnormally high returns. Fewpeople believe the strong form today, as a number of insiders have made large profits, been caught (it’s illegal totrade on inside information), and gone to jail. Martha Stewart is one, and she helped disprove the strong form ofthe EMH.
Chapter 2 Financial Markets and Institutions 47
Cengage Learning

*ram* D:/Thomson_Learning_Projects/Brigham_Full_120614/z_production/z_3B2_3D_files/Brigham_0324597703_Ch.02.3d, 12/9/8, 13:23, page: 48
should be close to its intrinsic value. That would make it hard for any analyst toconsistently pick stocks that outperform the market.
The following diagram sums up where most observers seem to be today.There is an “efficiency continuum,” with the market for some companies’ stocksbeing highly efficient and the market for other stocks being highly inefficient. Thekey factor is the size of the company—the larger the firm, the more analysts tendto follow it and thus the faster new information is likely to be reflected in thestock’s price. Also, different companies communicate better with analysts andinvestors; and the better the communications, the more efficient the market for thestock.
Highly Inefficient Highly Efficient
Small companies Large companies
not followed by many followed by many
analysts. Not much analysts. Good
contact with investors. communicationswith investors.
As an investor, would you prefer to purchase a stock whose price was determinedin an efficient or an inefficient market? If you thought you knew something thatothers didn’t know, you might prefer inefficient markets. But if you thought thatthose physics PhDs with unlimited buying power and access to company CEOsmight know more than you, you would probably prefer efficient markets, wherethe price you paid was likely to be the “right” price. From an economic standpoint,it is good to have efficient markets in which everyone is willing to participate. Sothe SEC and other regulatory agencies should do everything they can to encouragemarket efficiency.
Thus far we have been discussing themarket for individual stocks. There is alsoa market for entire companies, where other companies, private equity groups, andlarge investors like Warren Buffett buy the entire company or a controlling stake init. Suppose, for example, that Company X is in equilibrium, selling at a price that isclose to its intrinsic value but where the intrinsic value is based on it being operatedby its current managers, who own 51% of the stock. However, suppose that astuteanalysts study the company and conclude that it could produce much higherearnings and cash flows under a different management team or if it were combinedwith some other company or if it were broken up into a number of separate pieces.In this case, the stock might be thought of as trading in an efficient market while thecompany as a whole was not efficiently priced.
Some years ago, quite a few companies were inefficiently priced. But thenalong comes Warren Buffett, the private equity players, and hedge fund managerswho are willing to contest entrenched managers. For example, Dow Jones, theowner of The Wall Street Journal, was controlled by its founding family, the Ban-crofts. Dow Jones’s stock lagged the market for years. Then Rupert Murdoch, whocontrols News Corporation, arguably the largest media company in the world,offered $60 per share for Dow Jones, which was then selling for about $35 pershare. Murdoch planned to change The Wall Street Journal and combine its contentwith his Fox News and new financial channel. To Murdoch, Dow Jones’ intrinsicvalue was $60. Without him or someone else who would operate the companydifferently, the intrinsic value was about $35. One could, of course, argue thatDow Jones’ intrinsic value was $60 all along; but it was hard to know that untilMurdoch came along and made his offer. Alternatively, one could argue thatMurdoch raised the intrinsic value from $35 to $60. Finally, you can bet that manyanalysts on Wall Street are looking for the next Dow Jones. If they succeed, theywill surely beat the market!
48 Part 2 Fundamental Concepts in Financial Management
Cengage Learning
*ram* D:/Thomson_Learning_Projects/Brigham_Full_120614/z_production/z_3B2_3D_files/Brigham_0324597703_Ch.02.3d, 12/9/8, 13:23, page: 49
A CLOSER LOOK AT BEHAVIORAL FINANCE THEORY
The efficient markets hypothesis (EMH) remains one of thecornerstones of modern finance theory. It implies that, onaverage, asset prices are about equal to their intrinsic val-ues. The logic behind the EMH is straightforward. If a stock’sprice is “too low,” rational traders will quickly take advan-tage of this opportunity and buy the stock, pushing pricesup to the proper level. Likewise, if prices are “too high,”rational traders will sell the stock, pushing the price down toits equilibrium level. Proponents of the EMH argue thatthese forces keep prices from being systematically wrong.
While the logic behind the EMH is compelling, manyevents in the real world seem inconsistent with thehypothesis, which has spurred a growing field calledbehavioral finance. Rather than assuming that investors arerational, behavioral finance theorists borrow insights frompsychology to better understand how irrational behaviorcan be sustained over time. Pioneers in this field includepsychologists Daniel Kahneman, Amos Tversky, and RichardThaler. Their work has encouraged a growing number ofscholars to work in this promising area of research.14
Professor Thaler and his colleague Nicholas Barberissummarized much of this research in the article cited below.They argue that behavioral finance’s criticism of the EMHrests on two key points. First, it is often difficult or risky fortraders to take advantage of mispriced assets. For example,even if you know that a stock’s price is too low becauseinvestors have overreacted to recent bad news, a traderwith limited capital may be reluctant to buy the stock forfear that the same forces that pushed the price down maywork to keep it artificially low for a long time. Similarly,during the recent stock market bubble, many traders whobelieved (correctly) that stock prices were too high lost agreat deal of money selling stocks short in the early stagesof the bubble, because prices went even higher before theyeventually collapsed. Thus, mispricings may persist.
The second point deals with why mispricings can occurin the first place. Here insights from psychology come intoplay. For example, Kahneman and Tversky suggested thatindividuals view potential losses and gains differently. If youask average individuals whether they would rather have $500with certainty or flip a fair coin and receive $1,000 if a headcomes up and nothing if a tail comes up, most would prefer
the certain $500, which suggests an aversion to risk. How-ever, if you ask people whether they would rather pay $500with certainty or flip a coin and pay $1,000 if it’s a head andnothing if it’s a tail, most would indicate that they prefer toflip the coin. Other studies suggest that people’s willingnessto take a gamble depends on recent performance. Gamblerswho are ahead tend to take on more risks, whereas thosewho are behind tend to become more conservative.
These experiments suggest that investors and managersbehave differently in down markets than they do in upmarkets, which might explain why those who made moneyearly in the stock market bubble continued to invest theirmoney in the market even as prices went ever higher. Otherevidence suggests that individuals tend to overestimate theirtrue abilities. For example, a large majority (upward of 90% insome studies) of people believe that they have above-aver-age driving ability and above-average ability to get alongwith others. Barberis and Thaler point out that:
Overconfidence may in part stem from two otherbiases, self-attribution bias and hindsight bias. Self-attribution bias refers to people’s tendency to ascribeany success they have in some activity to their owntalents, while blaming failure on bad luck rather thanon their ineptitude. Doing this repeatedly will leadpeople to the pleasing, but erroneous, conclusion thatthey are very talented. For example, investors mightbecome overconfident after several quarters of inves-ting success [Gervais and Odean (2001)]. Hindsightbias is the tendency of people to believe, after an eventhas occurred, that they predicted it before it hap-pened. If people think they predicted the past betterthan they actually did, they may also believe that theycan predict the future better than they actually can.
Behavioral finance has been studied in both the cor-porate finance and investments areas. Ulrike Malmendier ofStanford and Geoffrey Tate of Wharton found that over-confidence leads managers to overestimate their ability andthus the profitability of their projects. This result mayexplain why so many corporate projects fail to live up totheir stated expectations.
Sources: Nicholas Barberis and Richard Thaler, “A Survey of Behavioral Finance,” Chapter 18, Handbook of the Economics of Finance, editedby George Constantinides, Milt Harris, and René Stulz, part of the Handbooks in Economics Series (New York: Elsevier/North-Holland, 2003);and Ulrike Malmendier and Geoffrey Tate, “CEO Overconfidence and Corporate Investment,” Stanford Graduate School of BusinessResearch Paper #1799, June 2004.
14Three noteworthy sources for students interested in behavioral finance are Richard H. Thaler, Editor, Advances inBehavioral Finance (New York: Russell Sage Foundation, 1993); Hersh Shefrin, “Behavioral Corporate Finance,” Journal ofApplied Corporate Finance, Vol. 14.3, Fall 2001, pp. 113–125; and Nicholas Barberis and Richard Thaler, “A Survey ofBehavioral Finance,” Chapter 18, Handbook of the Economics of Finance, edited by George Constantinides, Milt Harris,and René Stulz , part of the Handbooks in Economics Series (New York: Elsevier/North-Holland, 2003). Students interestedin learning more about the efficient markets hypothesis should consult Burton G. Malkiel, A Random Walk Down WallStreet: The Time-Tested Strategy for Successful Investing, 9th ed., (New York: W.W. Norton & Company, 2007).
Chapter 2 Financial Markets and Institutions 49
Cengage Learning
*ram* D:/Thomson_Learning_Projects/Brigham_Full_120614/z_production/z_3B2_3D_files/Brigham_0324597703_Ch.02.3d, 12/9/8, 13:23, page: 50
2-7a Conclusions about Market EfficiencyAs noted previously, if the stock market is efficient, it is a waste of time for mostpeople to seek bargains by analyzing published data on stocks. That followsbecause if stock prices already reflect all publicly available information, they willbe fairly priced; and a person can beat the market only with luck or insideinformation. So rather than spending time and money trying to find undervaluedstocks, it would be better to buy an index fund designed to match the overallmarket as reflected in an index such as the S&P 500. However, if we worked for aninstitution with billions of dollars, we would try to find undervalued stocks orcompanies because even a small undervaluation would amount to a great deal ofmoney when investing millions rather than thousands. Also, markets are moreefficient for individual stocks than for entire companies; so for investors withenough capital, it does make sense to seek out badly managed companies that canbe acquired and improved. Note, though, that a number of private equity playersare doing exactly that; so the market for entire companies may soon be as efficientas that for individual stocks.
However, even if markets are efficient and all stocks and companies are fairlypriced, an investor should still be careful when selecting stocks for his or herportfolio. Most importantly, the portfolio should be diversified, with a mix ofstocks from various industries along with some bonds and other fixed incomesecurities. We will discuss diversification in greater detail in Chapter 8, but it is animportant consideration for most individual investors.
SELF TEST What does it mean for a market to be “efficient”?
Is the market for all stocks equally efficient? Explain.
Why is it good for the economy that markets be efficient?
Is it possible that the market for individual stocks could be highly efficientbut the market for whole companies could be less efficient?
What is behavioral finance? What are the implications of behavioral financefor market efficiency?
TYING IT ALL TOGETHER
In this chapter, we provided a brief overview of how capital is allocated and dis-cussed the financial markets, instruments, and institutions used in the allocationprocess. We discussed physical location exchanges and electronic markets forcommon stocks, stock market reporting, and stock indexes. We demonstrated thatsecurity prices are volatile—investors expect to make money, which they generallydo over time; but losses can be large in any given year. Finally, we discussed theefficiency of the stock market and developments in behavioral finance. Afterreading this chapter, you should have a general understanding of the financialenvironment in which businesses and individuals operate, realize that actualreturns are often different from expected returns, and be able to read stock marketquotations from business newspapers or various Internet sites. You should alsorecognize that the theory of financial markets is a “work in progress,” and muchwork remains to be done.
50 Part 2 Fundamental Concepts in Financial Management
Cengage Learning

*ram* D:/Thomson_Learning_Projects/Brigham_Full_120614/z_production/z_3B2_3D_files/Brigham_0324597703_Ch.02.3d, 12/9/8, 13:23, page: 51
SELF-TEST QUESTION AND PROBLEM(Solutions Appear in Appendix A)
ST-1 KEY TERMS Define each of the following terms:
a. Spot markets; futures markets
b. Money markets; capital markets
c. Primary markets; secondary markets
d. Private markets; public markets
e. Derivatives
f. Investment banks (iBanks); commercial banks; financial services corporations
g. Mutual funds; money market funds
h. Physical location exchanges; over-the-counter (OTC) market; dealer market
i. Closely held corporation; publicly owned corporation
j. Going public; initial public offering (IPO) market
k. Efficient markets hypothesis (EMH)
l. Behavioral finance
QUESTIONS
2-1 How does a cost-efficient capital market help reduce the prices of goods and services?
2-2 Describe the different ways in which capital can be transferred from suppliers of capital tothose who are demanding capital.
2-3 Is an initial public offering an example of a primary or a secondary market transaction?Explain.
2-4 Indicate whether the following instruments are examples of money market or capitalmarket securities.a. U.S. Treasury bills
b. Long-term corporate bonds
c. Common stocks
d. Preferred stocks
e. Dealer commercial paper
2-5 What would happen to the U.S. standard of living if people lost faith in the safety of thefinancial institutions? Explain.
2-6 What types of changes have financial markets experienced during the last two decades?Have they been perceived as positive or negative changes? Explain.
2-7 Differentiate between dealer markets and stock markets that have a physical location.
2-8 Identify and briefly compare the two leading stock exchanges in the United States today.
2-9 Describe the three different forms of market efficiency.
2-10 Investors expect a company to announce a 10% increase in earnings; instead, the companyannounces a 1% increase. If the market is semi-strong form efficient, which of the followingwould you expect to happen? (Hint: Refer to Footnote 13 in this chapter.)a. The stock’s price will increase slightly because the company had a slight increase in
earnings.
b. The stock’s price will fall because the earnings increase was less than expected.
c. The stock’s price will stay the same because earnings announcements have no effect ifthe market is semi-strong form efficient.
2-11 Briefly explain what is meant by the term efficiency continuum.
2-12 Explain whether the following statements are true or false.a. Derivative transactions are designed to increase risk and are used almost exclusively by
speculators who are looking to capture high returns.
Chapter 2 Financial Markets and Institutions 51
Cengage Learning
*ram* D:/Thomson_Learning_Projects/Brigham_Full_120614/z_production/z_3B2_3D_files/Brigham_0324597703_Ch.02.3d, 12/9/8, 13:23, page: 52
b. Hedge funds typically have large minimum investments and are marketed to institu-tions and individuals with high net worths.
c. Hedge funds have traditionally been highly regulated.
d. The New York Stock Exchange is an example of a stock exchange that has a physicallocation.
e. A larger bid-ask spread means that the dealer will realize a lower profit.
f. The efficient markets hypothesis assumes that all investors are rational.
INTEGRATED CASESMYTH BARRY & COMPANY
2-1 FINANCIAL MARKETS AND INSTITUTIONS Assume that you recently graduated with a degree in finance andhave just reported to work as an investment adviser at the brokerage firm of Smyth Barry & Co. Your firstassignment is to explain the nature of the U.S. financial markets to Michelle Varga, a professional tennis playerwho recently came to the United States fromMexico. Varga is a highly ranked tennis player who expects to investsubstantial amounts of money through Smyth Barry. She is very bright; therefore, she would like to understandin general terms what will happen to her money. Your boss has developed the following questions that you mustuse to explain the U.S. financial system to Varga.
a. What are the three primary ways in which capital is transferred between savers and borrowers? Describeeach one.
b. What is a market? Differentiate between the following types of markets: physical asset markets versusfinancial asset markets, spot markets versus futures markets, money markets versus capital markets, pri-mary markets versus secondary markets, and public markets versus private markets.
c. Why are financial markets essential for a healthy economy and economic growth?
d. What are derivatives? How can derivatives be used to reduce risk? Can derivatives be used to increase risk?Explain.
e. Briefly describe each of the following financial institutions: commercial banks, investment banks, mutualfunds, hedge funds, and private equity companies.
f. What are the two leading stock markets? Describe the two basic types of stock markets.
g. If Apple Computer decided to issue additional common stock and Varga purchased 100 shares of this stockfrom Smyth Barry, the underwriter, would this transaction be a primary or a secondary market transaction?Would it make a difference if Varga purchased previously outstanding Apple stock in the dealer market?Explain.
h. What is an initial public offering (IPO)?
i. What does it mean for a market to be efficient? Explain why some stock prices may be more efficient thanothers.
j. After your consultation with Michelle, she asks to discuss these two scenarios with you:
(1) While in the waiting room of your office, she overheard an analyst on a financial TV network say that aparticular medical research company just received FDA approval for one of its products. On the basisof this “hot” information, Michelle wants to buy many shares of that company’s stock. Assuming thestock market is highly efficient, what advice would you give her?
(2) She has read a number of newspaper articles about a huge IPO being carried out by a leadingtechnology company. She wants to get as many shares in the IPO as possible and would even bewilling to buy the shares in the open market immediately after the issue. What advice do you have forher?
52 Part 2 Fundamental Concepts in Financial Management
Cengage Learning
*ram* D:/Thomson_Learning_Projects/Brigham_Full_120614/z_production/z_3B2_3D_files/Brigham_0324597703_Ch.03.3d, 12/9/8, 13:26, page: 53
ªF1
ONLINE/PHOTOLIBRARY
CHAPTER
3 Financial Statements,Cash Flow, and Taxes
The “Qual i ty” of Financial Statements
The financial statements presented in a typicalcompany’s annual report look quite official. Theyare signed by the firm’s top executives and arecertified by a Big Four accounting firm, so onewould think that they must be accurate. Thatmay not be true, though, for three reasons:legitimate misjudgments in valuing assets andmeasuring costs, “flexible” accounting rules thatresult in differently reported results for similarcompanies, and outright cheating.
One blatant example of cheating involvedWorldCom, which reported asset values thatexceeded their true value by about $11 billion.This led to an understatement of costs and acorresponding overstatement of profits. Enron isanother example. That company overstated thevalue of certain assets, reported those artificialvalue increases as profits, and transferred theassets to subsidiary companies to hide the truefacts. Enron’s and WorldCom’s investors eventu-ally learned what was happening, the companieswere forced into bankruptcy, their top execu-tives went to jail, the accounting firm that
audited their books was forced out of business,and millions of investors lost billions of dollars.
After the Enron and WorldCom blowups,Congress passed the Sarbanes-Oxley Act (SOX),which required companies to improve theirinternal auditing standards and required the CEOand CFO to certify that the financial statementswere properly prepared. The SOX bill also cre-ated a new watchdog organization to help makesure that the outside accounting firms weredoing their job. From all indications, financialstatements are generally more accurate andclearer than they were in the past.
But the world is dynamic, and a newaccounting problem surfaced in 2007. Big banks,most notably Citigroup, owned many risky buthigh-yielding subprime mortgages. The banksinvented a complex legal procedure that theycalled a structured investment vehicle (SIV) toconceal the fact that they held all of these riskymortgages. They correctly feared that peoplewouldn’t want to do business with a risky bank.But when the subprime market fell apart in 2007,
53Cengage Learning

*ram* D:/Thomson_Learning_Projects/Brigham_Full_120614/z_production/z_3B2_3D_files/Brigham_0324597703_Ch.03.3d, 12/9/8, 13:26, page: 54
PUTTING THINGS IN PERSPECTIVE
Amanager’s primary goal is to maximize the value of his or her firm’s stock, and valueis based on the firm’s future cash flows. But howdomanagers decidewhich actions aremost likely to increase those flows, and how do investors estimate future cash flows?The answers to both questions lie in a study of financial statements that publiclytraded firmsmust provide to investors. Here investors include both institutions (banks,insurance companies, pension funds, and the like) and individuals like you.
Much of the material in this chapter deals with concepts you covered in a basicaccounting course. However, the information is important enough to warrant areview. Also, in accounting, you probably focused on how accounting statementsare made; the focus here is on how investors and managers interpret and use them.Accounting is the basic language of business, so everyone engaged in businessneeds a good working knowledge of it. It is used to “keep score”; and if investorsand managers do not know the score, they won’t know whether their actions areappropriate. If you took midterm exams but were not told your scores, you wouldhave a difficult time knowing whether you needed to improve. The same idea holdsin business. If a firm’s managers—whether they are in marketing, personnel, pro-duction, or finance—do not understand financial statements, they will not be ableto judge the effects of their actions, which will make it hard for the firm to survive,much less to have a maximum value.
When you finish this chapter you should be able to:l List each of the key financial statements and identify the kinds of information
they provide to corporate managers and investors.l Estimate a firm’s free cash flow and explain why free cash flow has such an
important effect on firm value.l Discuss the major features of the federal income tax system.
3-1 FINANCIAL STATEMENTS AND REPORTSThe annual report is the most important report that corporations issue to stock-holders, and it contains two types of information.2 First, there is a verbal section,often presented as a letter from the chairperson,which describes the firm’s operating
the banks had to acknowledge their losses, which ran intomany billions of dollars.
It turns out that the banks had tried to avoid writingdown their mortgages; but a newly formed organizationset up by the Big Four accounting firms, called the Center
for Audit Quality, took a hard line and forced the write-downs. That led Lynn Turner, former chief accountant forthe SEC and a frequent critic of the accounting profession,to state, “The accounting firms are doing a much better jobthan they did in the past.”1
Annual ReportA report issued annuallyby a corporation to itsstockholders. It containsbasic financial statementsas well as management’sanalysis of the firm’s pastoperations and futureprospects.
2Firms also provide quarterly reports, but these are much less comprehensive than the annual report. In addition,larger firms file even more detailed statements with the Securities and Exchange Commission (SEC), givingbreakdowns for each major division or subsidiary. These reports, called 10-K reports, are made available tostockholders upon request to a company’s corporate secretary. In this chapter, we focus on annual data—balancesheets at the ends of years and income statements for entire years rather than for shorter periods.
1David Reilly, “Behind Bank’s Credit Rescue Fund: “With New, United Voice, Auditors Stand Ground on How to Treat Crunch,” The WallStreet Journal, October 17, 2007, p. C1.
54 Part 2 Fundamental Concepts in Financial Management
Cengage Learning
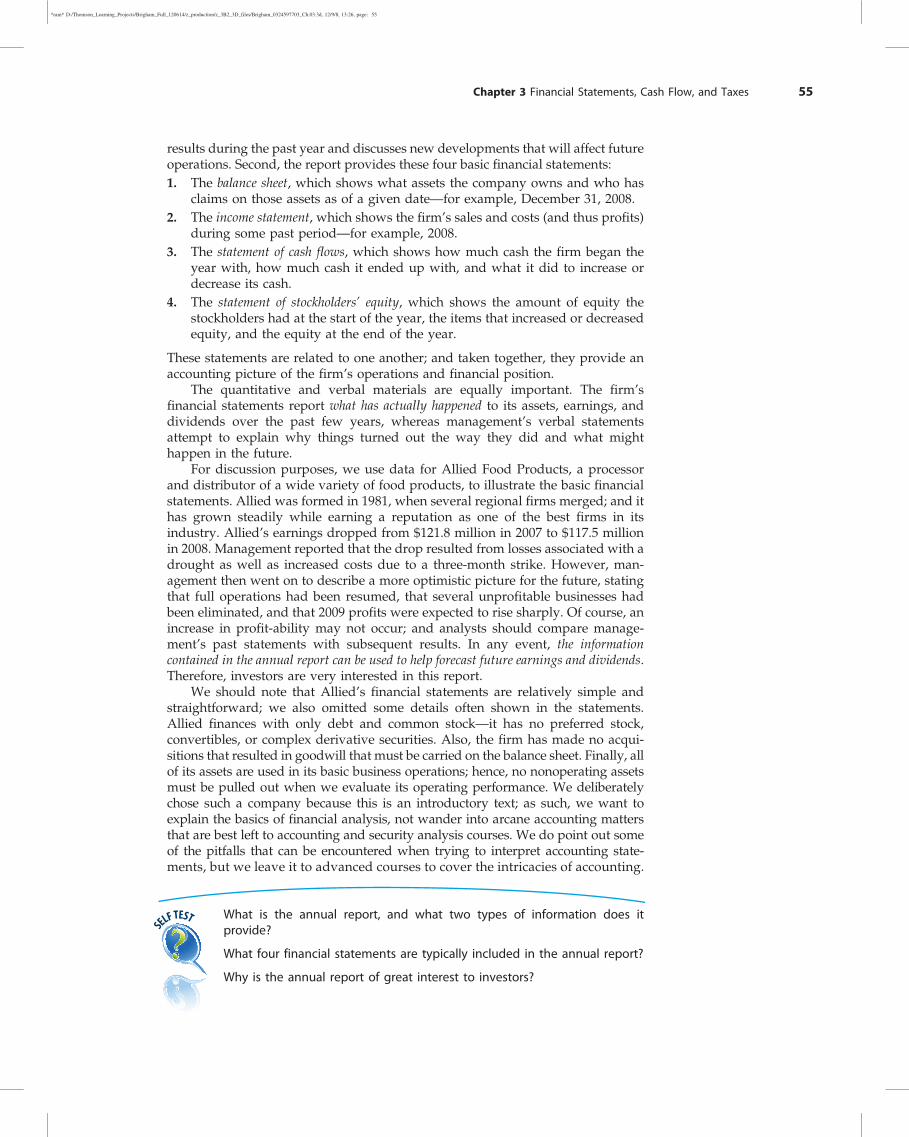
*ram* D:/Thomson_Learning_Projects/Brigham_Full_120614/z_production/z_3B2_3D_files/Brigham_0324597703_Ch.03.3d, 12/9/8, 13:26, page: 55
results during the past year and discusses new developments that will affect futureoperations. Second, the report provides these four basic financial statements:1. The balance sheet, which shows what assets the company owns and who has
claims on those assets as of a given date—for example, December 31, 2008.2. The income statement, which shows the firm’s sales and costs (and thus profits)
during some past period—for example, 2008.3. The statement of cash flows, which shows how much cash the firm began the
year with, how much cash it ended up with, and what it did to increase ordecrease its cash.
4. The statement of stockholders’ equity, which shows the amount of equity thestockholders had at the start of the year, the items that increased or decreasedequity, and the equity at the end of the year.
These statements are related to one another; and taken together, they provide anaccounting picture of the firm’s operations and financial position.
The quantitative and verbal materials are equally important. The firm’sfinancial statements report what has actually happened to its assets, earnings, anddividends over the past few years, whereas management’s verbal statementsattempt to explain why things turned out the way they did and what mighthappen in the future.
For discussion purposes, we use data for Allied Food Products, a processorand distributor of a wide variety of food products, to illustrate the basic financialstatements. Allied was formed in 1981, when several regional firms merged; and ithas grown steadily while earning a reputation as one of the best firms in itsindustry. Allied’s earnings dropped from $121.8 million in 2007 to $117.5 millionin 2008. Management reported that the drop resulted from losses associated with adrought as well as increased costs due to a three-month strike. However, man-agement then went on to describe a more optimistic picture for the future, statingthat full operations had been resumed, that several unprofitable businesses hadbeen eliminated, and that 2009 profits were expected to rise sharply. Of course, anincrease in profit-ability may not occur; and analysts should compare manage-ment’s past statements with subsequent results. In any event, the informationcontained in the annual report can be used to help forecast future earnings and dividends.Therefore, investors are very interested in this report.
We should note that Allied’s financial statements are relatively simple andstraightforward; we also omitted some details often shown in the statements.Allied finances with only debt and common stock—it has no preferred stock,convertibles, or complex derivative securities. Also, the firm has made no acqui-sitions that resulted in goodwill that must be carried on the balance sheet. Finally, allof its assets are used in its basic business operations; hence, no nonoperating assetsmust be pulled out when we evaluate its operating performance. We deliberatelychose such a company because this is an introductory text; as such, we want toexplain the basics of financial analysis, not wander into arcane accounting mattersthat are best left to accounting and security analysis courses. We do point out someof the pitfalls that can be encountered when trying to interpret accounting state-ments, but we leave it to advanced courses to cover the intricacies of accounting.
SELF TEST What is the annual report, and what two types of information does itprovide?
What four financial statements are typically included in the annual report?
Why is the annual report of great interest to investors?
Chapter 3 Financial Statements, Cash Flow, and Taxes 55
Cengage Learning
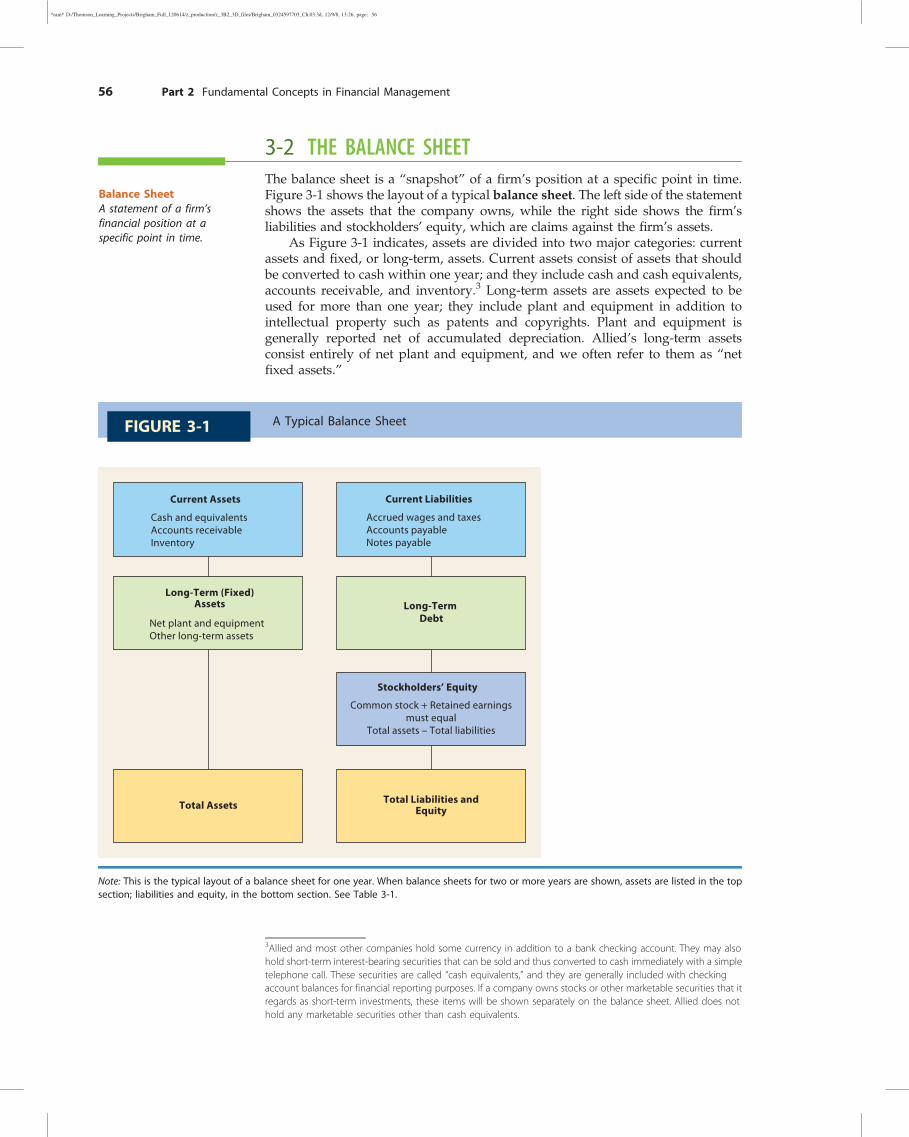
*ram* D:/Thomson_Learning_Projects/Brigham_Full_120614/z_production/z_3B2_3D_files/Brigham_0324597703_Ch.03.3d, 12/9/8, 13:26, page: 56
3-2 THE BALANCE SHEETThe balance sheet is a “snapshot” of a firm’s position at a specific point in time.Figure 3-1 shows the layout of a typical balance sheet. The left side of the statementshows the assets that the company owns, while the right side shows the firm’sliabilities and stockholders’ equity, which are claims against the firm’s assets.
As Figure 3-1 indicates, assets are divided into two major categories: currentassets and fixed, or long-term, assets. Current assets consist of assets that shouldbe converted to cash within one year; and they include cash and cash equivalents,accounts receivable, and inventory.3 Long-term assets are assets expected to beused for more than one year; they include plant and equipment in addition tointellectual property such as patents and copyrights. Plant and equipment isgenerally reported net of accumulated depreciation. Allied’s long-term assetsconsist entirely of net plant and equipment, and we often refer to them as “netfixed assets.”
Balance SheetA statement of a firm’sfinancial position at aspecific point in time.
3Allied and most other companies hold some currency in addition to a bank checking account. They may alsohold short-term interest-bearing securities that can be sold and thus converted to cash immediately with a simpletelephone call. These securities are called “cash equivalents,” and they are generally included with checkingaccount balances for financial reporting purposes. If a company owns stocks or other marketable securities that itregards as short-term investments, these items will be shown separately on the balance sheet. Allied does nothold any marketable securities other than cash equivalents.
A Typical Balance SheetFIGURE 3-1
Total Assets Total Liabilities andEquity
Current Assets Current Liabilities
Long-Term (Fixed)Assets Long-Term
Debt
Cash and equivalentsAccounts receivableInventory
Net plant and equipmentOther long-term assets
Stockholders’ Equity
Common stock + Retained earningsmust equal
Total assets – Total liabilities
Accrued wages and taxesAccounts payableNotes payable
Note: This is the typical layout of a balance sheet for one year. When balance sheets for two or more years are shown, assets are listed in the topsection; liabilities and equity, in the bottom section. See Table 3-1.
56 Part 2 Fundamental Concepts in Financial Management
Cengage Learning

*ram* D:/Thomson_Learning_Projects/Brigham_Full_120614/z_production/z_3B2_3D_files/Brigham_0324597703_Ch.03.3d, 12/9/8, 13:26, page: 57
The claims against assets are of two basic types—liabilities (or money thecompany owes to others) and stockholders’ equity. Liabilities consist of claims thatmust be paid off within one year (current liabilities), including accounts payable,accruals (total of accrued wages and accrued taxes), and notes payable to banksthat are due within one year. Long-term debt includes bonds that mature in morethan a year.
Stockholders’ equity can be thought of in two ways. First, it is the amount thatstockholders paid to the company when they bought shares the company sold toraise capital, in addition to all of the earnings the company has retained over theyears:
Stockholders' equity ¼ Paid -in capitalþ Retained earnings
The retained earnings are not just the earnings retained in the latest year—they arethe cumulative total of all of the earnings the company has earned during its life.
Stockholders’ equity can also be thought of as a residual:
Stockholders' equity ¼ Total assets -- Total liabilities
If Allied had invested surplus funds in bonds backed by subprime mortgages andthe bonds’ value fell below their purchase price, the true value of the firm’s assetswould have declined. The amount of its liabilities would not have changed—thefirm would still owe the amount it had promised to pay its creditors. Therefore,the reported value of the common equity must decline. The accountants wouldmake a series of entries, and the result would be a reduction in retained earnings—and thus in common equity. In the end, assets would equal liabilities and equityand the balance sheet would balance. This example shows why common stock ismore risky than bonds—any mistake that management makes has a big impact onthe stockholders. Of course, gains from good decisions also go to the stockholders;so with risk comes possible rewards.
Assets on the balance sheet are listed by the length of time before they will beconverted to cash (inventories and accounts receivable) or used by the firm (fixedassets). Similarly, claims are listed in the order in which they must be paid:Accounts payable must generally be paid within a few days, accruals must also bepaid promptly, notes payable to banks must be paid within one year, and so forth,down to the stockholders’ equity accounts, which represent ownership and neednever be “paid off.”
3-2a Allied’s Balance SheetTable 3-1 shows Allied’s year-end balance sheets for 2008 and 2007. From the 2008statement, we see that Allied had $2 billion of assets—half current and half longterm. These assetswere financedwith $310million of current liabilities, $750millionof long-term debt, and $940 million of common equity. Comparing the balancesheets for 2008 and 2007, we see that Allied’s assets grew by $320 million and itsliabilities and equity necessarily grew by that same amount. Assets must, of course,equal liabilities and equity; otherwise, the balance sheet does not balance.
Several additional points about the balance sheet should be noted:1. Cash versus other assets. Although assets are reported in dollar terms, only the
cash and equivalents account represents actual spendable money. Accountsreceivable represents credit sales that have not yet been collected. Inventoriesshow the cost of raw materials, work in process, and finished goods. Net fixedassets represent the cost of the buildings and equipment used in operationsminus the depreciation that has been taken on these assets. At the end of 2008,Allied has $10million of cash; hence, it could write checks totaling that amount.The noncash assets should generate cash over time, but they do not representcash in hand. And the cash theywould bring in if they were sold today could behigher or lower than the values reported on the balance sheet.
Chapter 3 Financial Statements, Cash Flow, and Taxes 57
Cengage Learning

*ram* D:/Thomson_Learning_Projects/Brigham_Full_120614/z_production/z_3B2_3D_files/Brigham_0324597703_Ch.03.3d, 12/9/8, 13:26, page: 58
2. Working capital. Current assets are often called working capital because theseassets “turn over”; that is, they are used and then replaced throughout the year.4
3. Net working capital. When Allied buys inventory items on credit, its suppliers,in effect, lend it the money used to finance the inventory items. Allied couldhave borrowed from its bank or sold stock to obtain the money, but it receivedthe funds from its suppliers. These loans are shown as accounts payable, andthey typically are “free” in the sense that they do not bear interest. Similarly,Allied pays its workers every two weeks and it pays taxes quarterly; so
Allied Food Products: December 31 Balance Sheets (Millions of Dollars)T a b l e 3 - 1
2008 2007
Assets
Current assets:
Cash and equivalents $ 10 $ 80
Accounts receivable 375 315
Inventories 615 415
Total current assets $1,000 $ 810
Net fixed assets:
Net plant and equipment (cost minus depreciation) 1,000 870
Other assets expected to last more than a year 0 0
Total assets $2,000 $1,680
Liabilities and Equity
Current liabilities:
Accounts payable $ 60 $ 30
Accruals 140 130
Notes payable 110 60
Total current liabilities $ 310 $ 220
Long-term bonds 750 580
Total debt $1,060 $ 800
Common equity:
Common stock (50,000,000 shares) $ 130 $ 130
Retained earnings 810 750
Total common equity $ 940 $ 880
Total liabilities and equity $2,000 $1,680
Notes:1. Inventories can be valued by several different methods, and the method chosen can affect both
the balance sheet value and the cost of goods sold, and thus net income, as reported on the incomestatement. Similarly, companies can use different depreciation methods. The methods used mustbe reported in the notes to the financial statements, and security analysts can make adjustmentswhen they compare companies if they think the differences are material.
2. Book value per share: Total common equity/Shares outstanding ¼ $940/50 ¼ $18.80.3. Also note that a relatively few firms use preferred stock, which we discuss in Chapter 9. Preferred
stock can take several different forms, but it is generally like debt because it pays a fixed amount eachyear. However, it is like common stock because a failure to pay the preferred dividend does notexpose the firm to bankruptcy. If a firm does use preferred stock, it is shown on the balancesheet between Total debt and Common stock. There is no set rule on how preferred stock shouldbe treated when financial ratios are calculated—it could be considered as debt or as equity. Bondholdersoften think of it as equity, while stockholders think of it as debt because it is a fixed charge. In truth,it is a hybrid, somewhere between debt and common equity.
Working CapitalCurrent assets.
4Any current assets not used in normal operations, such as excess cash held to pay for a plant under construction,are deducted and thus not included in working capital. Allied requires all of its current assets for operations.
58 Part 2 Fundamental Concepts in Financial Management
Cengage Learning
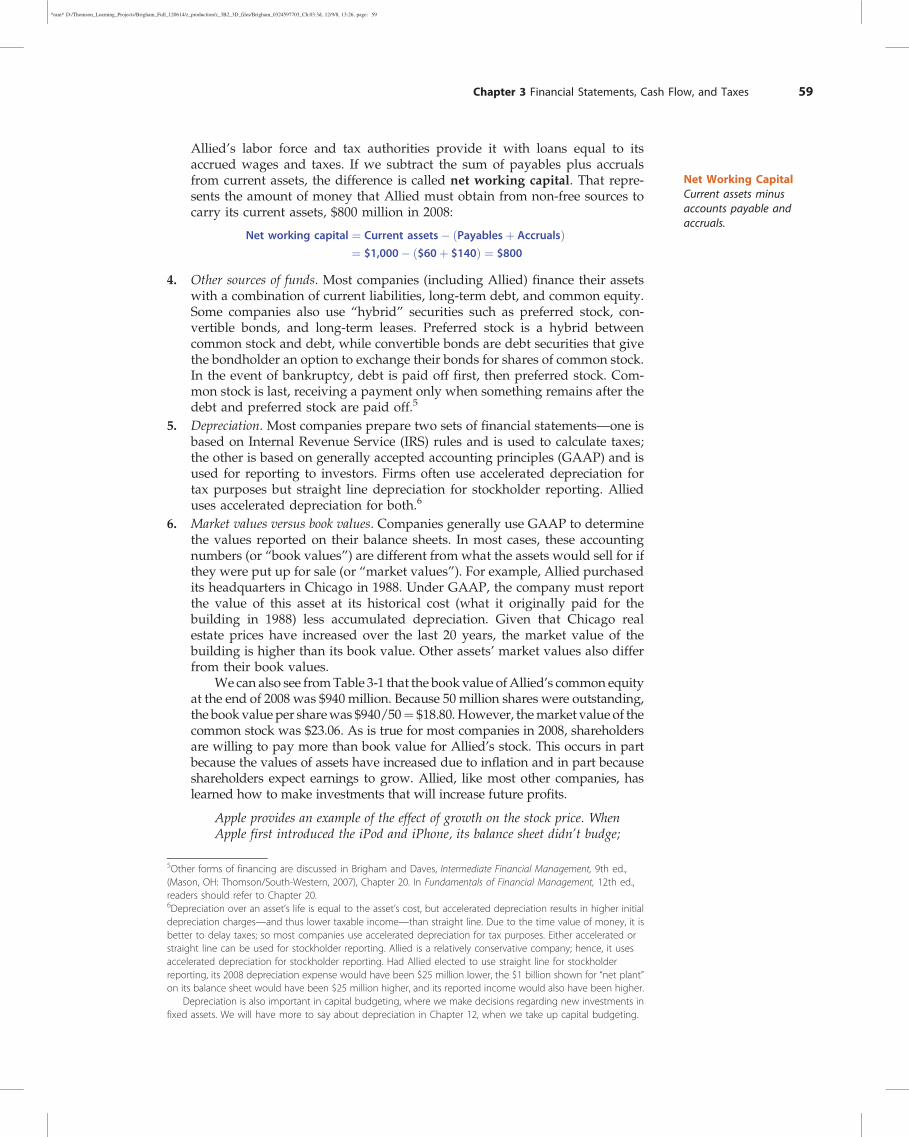
*ram* D:/Thomson_Learning_Projects/Brigham_Full_120614/z_production/z_3B2_3D_files/Brigham_0324597703_Ch.03.3d, 12/9/8, 13:26, page: 59
Allied’s labor force and tax authorities provide it with loans equal to itsaccrued wages and taxes. If we subtract the sum of payables plus accrualsfrom current assets, the difference is called net working capital. That repre-sents the amount of money that Allied must obtain from non-free sources tocarry its current assets, $800 million in 2008:
Net working capital ¼ Current assets� ðPayablesþ AccrualsÞ¼ $1,000� ð$60þ $140Þ ¼ $800
4. Other sources of funds. Most companies (including Allied) finance their assetswith a combination of current liabilities, long-term debt, and common equity.Some companies also use “hybrid” securities such as preferred stock, con-vertible bonds, and long-term leases. Preferred stock is a hybrid betweencommon stock and debt, while convertible bonds are debt securities that givethe bondholder an option to exchange their bonds for shares of common stock.In the event of bankruptcy, debt is paid off first, then preferred stock. Com-mon stock is last, receiving a payment only when something remains after thedebt and preferred stock are paid off.5
5. Depreciation. Most companies prepare two sets of financial statements—one isbased on Internal Revenue Service (IRS) rules and is used to calculate taxes;the other is based on generally accepted accounting principles (GAAP) and isused for reporting to investors. Firms often use accelerated depreciation fortax purposes but straight line depreciation for stockholder reporting. Allieduses accelerated depreciation for both.6
6. Market values versus book values. Companies generally use GAAP to determinethe values reported on their balance sheets. In most cases, these accountingnumbers (or “book values”) are different from what the assets would sell for ifthey were put up for sale (or “market values”). For example, Allied purchasedits headquarters in Chicago in 1988. Under GAAP, the company must reportthe value of this asset at its historical cost (what it originally paid for thebuilding in 1988) less accumulated depreciation. Given that Chicago realestate prices have increased over the last 20 years, the market value of thebuilding is higher than its book value. Other assets’ market values also differfrom their book values.
We can also see fromTable 3-1 that the book value ofAllied’s common equityat the end of 2008 was $940 million. Because 50 million shares were outstanding,the book value per sharewas $940/50¼ $18.80.However, themarket value of thecommon stock was $23.06. As is true for most companies in 2008, shareholdersare willing to pay more than book value for Allied’s stock. This occurs in partbecause the values of assets have increased due to inflation and in part becauseshareholders expect earnings to grow. Allied, like most other companies, haslearned how to make investments that will increase future profits.
Apple provides an example of the effect of growth on the stock price. WhenApple first introduced the iPod and iPhone, its balance sheet didn’t budge;
Net Working CapitalCurrent assets minusaccounts payable andaccruals.
5Other forms of financing are discussed in Brigham and Daves, Intermediate Financial Management, 9th ed.,(Mason, OH: Thomson/South-Western, 2007), Chapter 20. In Fundamentals of Financial Management, 12th ed.,readers should refer to Chapter 20.6Depreciation over an asset’s life is equal to the asset’s cost, but accelerated depreciation results in higher initialdepreciation charges—and thus lower taxable income—than straight line. Due to the time value of money, it isbetter to delay taxes; so most companies use accelerated depreciation for tax purposes. Either accelerated orstraight line can be used for stockholder reporting. Allied is a relatively conservative company; hence, it usesaccelerated depreciation for stockholder reporting. Had Allied elected to use straight line for stockholderreporting, its 2008 depreciation expense would have been $25 million lower, the $1 billion shown for “net plant”on its balance sheet would have been $25 million higher, and its reported income would also have been higher.
Depreciation is also important in capital budgeting, where we make decisions regarding new investments infixed assets. We will have more to say about depreciation in Chapter 12, when we take up capital budgeting.
Chapter 3 Financial Statements, Cash Flow, and Taxes 59
Cengage Learning

*ram* D:/Thomson_Learning_Projects/Brigham_Full_120614/z_production/z_3B2_3D_files/Brigham_0324597703_Ch.03.3d, 12/9/8, 13:26, page: 60
but investors recognized that these were great products that would lead tohigher future profits. So Apple’s stock quickly rose above its book value—itnow (Spring 2008) has a stock price of $185 versus a $20 book value.
If a company has problems, its stock price can fall below its book value.For example, Countrywide Financial, the largest originator of subprimemortgages, saw its stock price fall to $13 versus a book value of $25 when thesub-prime market blew up in 2007.
7. The time dimension. The balance sheet is a snapshot of the firm’s financialposition at a point in time—for example, on December 31, 2008. Thus, we seethat on December 31, 2007, Allied had $80 million of cash; but that balance fellto $10 million by year-end 2008. The balance sheet changes every day asinventories rise and fall, as bank loans are increased or decreased, and soforth. A company such as Allied, whose business is seasonal, experiencesespecially large balance sheet changes during the year. Its inventories are lowjust before the harvest season but high just after the fall crops have beenharvested and processed. Similarly, most retailers have large inventories justbefore Christmas but low inventories (and high accounts receivable) just afterChristmas. We will examine the effects of these changes in Chapter 4, whenwe compare companies’ financial statements and evaluate their performance.
SELF TEST What is the balance sheet, and what information does it provide?
How is the order in which items are shown on the balance sheet determined?
What was Allied’s net working capital on December 31, 2007? ($650 million)
What items on Allied’s December 31 balance sheet would probably bedifferent from its June 30 values? Would these differences be as large ifAllied were a grocery chain rather than a food processor? Explain. (Inven-tories, accounts receivable, and accounts payable would experienceseasonal fluctuations; no—less seasonality)
3-3 THE INCOME STATEMENTTable 3-2 shows Allied’s 2007 and 2008 income statements. Net sales are shown atthe top of the statement; then operating costs, interest, and taxes are subtracted toobtain the net income available to common shareholders. We also show earningsand dividends per share, in addition to some other data, at the bottom of Table 3-2.Earnings per share (EPS) is often called “the bottom line,” denoting that of all itemson the income statement, EPS is the one that is most important to stockholders.Allied earned $2.35 per share in 2008, down from $2.44 in 2007. In spite of thedecline in earnings, the firm still increased the dividend from $1.06 to $1.15.
A typical stockholder focuses on the reported EPS, but professional securityanalysts and managers differentiate between operating and non-operating income.Operating income is derived from the firm’s regular core business—in Allied’scase, from producing and selling food products. Moreover, it is calculated beforededucting interest expenses and taxes, which are considered to be non-operatingcosts. Operating income is also called EBIT, or earnings before interest and taxes.Here is its equation:
Operating income ðor EBITÞ ¼ Sales revenues� Operating costs
¼ $3,000:0� $2,716:2
¼ $283:8
3-1
This figure must, of course, match the one reported on the income statement.
Income StatementA report summarizing afirm’s revenues, expenses,and profits during areporting period, generallya quarter or a year.
Operating IncomeEarnings from operationsbefore interest and taxes(i.e., EBIT).
60 Part 2 Fundamental Concepts in Financial Management
Cengage Learning
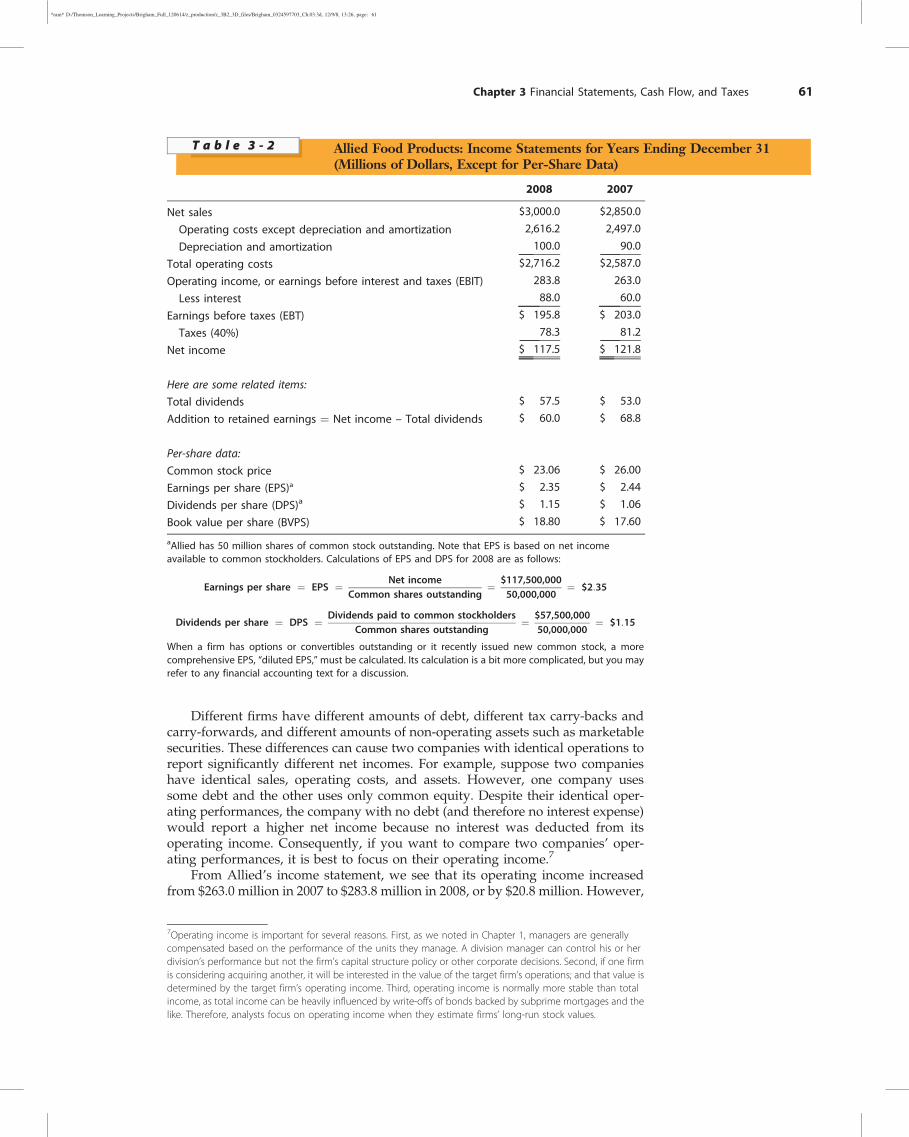
*ram* D:/Thomson_Learning_Projects/Brigham_Full_120614/z_production/z_3B2_3D_files/Brigham_0324597703_Ch.03.3d, 12/9/8, 13:26, page: 61
Different firms have different amounts of debt, different tax carry-backs andcarry-forwards, and different amounts of non-operating assets such as marketablesecurities. These differences can cause two companies with identical operations toreport significantly different net incomes. For example, suppose two companieshave identical sales, operating costs, and assets. However, one company usessome debt and the other uses only common equity. Despite their identical oper-ating performances, the company with no debt (and therefore no interest expense)would report a higher net income because no interest was deducted from itsoperating income. Consequently, if you want to compare two companies’ oper-ating performances, it is best to focus on their operating income.7
From Allied’s income statement, we see that its operating income increasedfrom $263.0 million in 2007 to $283.8 million in 2008, or by $20.8 million. However,
7Operating income is important for several reasons. First, as we noted in Chapter 1, managers are generallycompensated based on the performance of the units they manage. A division manager can control his or herdivision’s performance but not the firm’s capital structure policy or other corporate decisions. Second, if one firmis considering acquiring another, it will be interested in the value of the target firm’s operations; and that value isdetermined by the target firm’s operating income. Third, operating income is normally more stable than totalincome, as total income can be heavily influenced by write-offs of bonds backed by subprime mortgages and thelike. Therefore, analysts focus on operating income when they estimate firms’ long-run stock values.
Allied Food Products: Income Statements for Years Ending December 31(Millions of Dollars, Except for Per-Share Data)
T a b l e 3 - 2
2008 2007
Net sales $3,000.0 $2,850.0
Operating costs except depreciation and amortization 2,616.2 2,497.0
Depreciation and amortization 100.0 90.0
Total operating costs $2,716.2 $2,587.0
Operating income, or earnings before interest and taxes (EBIT) 283.8 263.0
Less interest 88.0 60.0
Earnings before taxes (EBT) $ 195.8 $ 203.0
Taxes (40%) 78.3 81.2
Net income $ 117.5 $ 121.8
Here are some related items:
Total dividends $ 57.5 $ 53.0
Addition to retained earnings ¼ Net income – Total dividends $ 60.0 $ 68.8
Per-share data:
Common stock price $ 23.06 $ 26.00
Earnings per share (EPS)a $ 2.35 $ 2.44
Dividends per share (DPS)a $ 1.15 $ 1.06
Book value per share (BVPS) $ 18.80 $ 17.60
aAllied has 50 million shares of common stock outstanding. Note that EPS is based on net incomeavailable to common stockholders. Calculations of EPS and DPS for 2008 are as follows:
Earnings per share ¼ EPS ¼ Net incomeCommon shares outstanding
¼ $117,500,00050,000,000
¼ $2:35
Dividends per share ¼ DPS ¼ Dividends paid to common stockholdersCommon shares outstanding
¼ $57,500,00050,000,000
¼ $1:15
When a firm has options or convertibles outstanding or it recently issued new common stock, a morecomprehensive EPS, “diluted EPS,” must be calculated. Its calculation is a bit more complicated, but you mayrefer to any financial accounting text for a discussion.
Chapter 3 Financial Statements, Cash Flow, and Taxes 61
Cengage Learning
*ram* D:/Thomson_Learning_Projects/Brigham_Full_120614/z_production/z_3B2_3D_files/Brigham_0324597703_Ch.03.3d, 12/9/8, 13:26, page: 62
its 2008 net income declined. This decline occurred because it increased its debt in2008, and the $28 million interest increase lowered its net income.
Taking a closer look at the income statement, we see that depreciation andamortization are important components of operating costs. Recall from accountingthat depreciation is an annual charge against income that reflects the estimateddollar cost of the capital equipment and other tangible assets that were used up inthe production process. Amortization amounts to the same thing except that itrepresents the decline in value of intangible assets such as patents, copyrights,trademarks, and goodwill. Because depreciation and amortization are so similar,they are generally lumped together for purposes of financial analysis on theincome statement and for other purposes. They both write off, or allocate, the costsof assets over their useful lives.
Even though depreciation and amortization are reported as costs on the incomestatements, they are not cash expenses—cash was spent in the past, when the assetsbeing written off were acquired, but no cash is paid out to cover depreciation.Therefore, managers, security analysts, and bank loan officers who are concernedwith the amount of cash a company is generating often calculate EBITDA, anacronym for earnings before interest, taxes, depreciation, and amortization. Alliedhas no amortization charges, so Allied’s depreciation and amortization consistentirely of depreciation. In 2008, Allied’s EBITDA was $383.8 million.
While the balance sheet represents a snapshot in time, the income statementreports on operations over a period of time. For example, during 2008, Allied hadsales of $3 billion and its net income was $117.5 million. Income statements areprepared monthly, quarterly, and annually. The quarterly and annual statementsare reported to investors, while the monthly statements are used internally forplanning and control purposes.
Finally, note that the income statement is tied to the balance sheet through theretained earnings account on the balance sheet. Net income as reported on theincome statement, less dividends paid, is the retained earnings for the year(e.g., 2008). Those retained earnings are added to the cumulative retained earningsfrom prior years to obtain the year-end 2008 balance for retained earnings. Theretained earnings for the year are also reported in the statement of stockholders’equity. All four of the statements provided in the annual report are tied together.
SELF TEST Why is earnings per share called “the bottom line”?
What is EBIT, or operating income?
What is EBITDA?
Which is more like a snapshot of the firm’s operations—the balance sheet orthe income statement? Explain your answer.
3-4 STATEMENT OF CASH FLOWSNet income as reported on the income statement is not cash; and in finance, “cashis king.” Management’s goal is to maximize the price of the firm’s stock; and thevalue of any asset, including a share of stock, is based on the cash flows the asset isexpected to produce. Therefore, managers strive to maximize the cash flowsavailable to investors. The statement of cash flows as shown in Table 3-3 is theaccounting report that shows how much cash the firm is generating. The statementis divided into four sections, and we explain it on a line-by-line basis.8
DepreciationThe charge to reflect thecost of assets used up inthe production process.Depreciation is not acash outlay.
AmortizationA noncash charge similarto depreciation exceptthat it is used to write offthe costs of intangibleassets.
EBITDAEarnings before interest,taxes, depreciation, andamortization.
Statement of CashFlowsA report that shows howthings that affect the bal-ance sheet and incomestatement affect the firm’scash flows.
0Our statement of cash flows is relatively simple because Allied is a relatively uncomplicated company. Many cashflow statements are more complicated; but if you understand Table 3-3, you should be able to follow morecomplicated statements.
62 Part 2 Fundamental Concepts in Financial Management
Cengage Learning
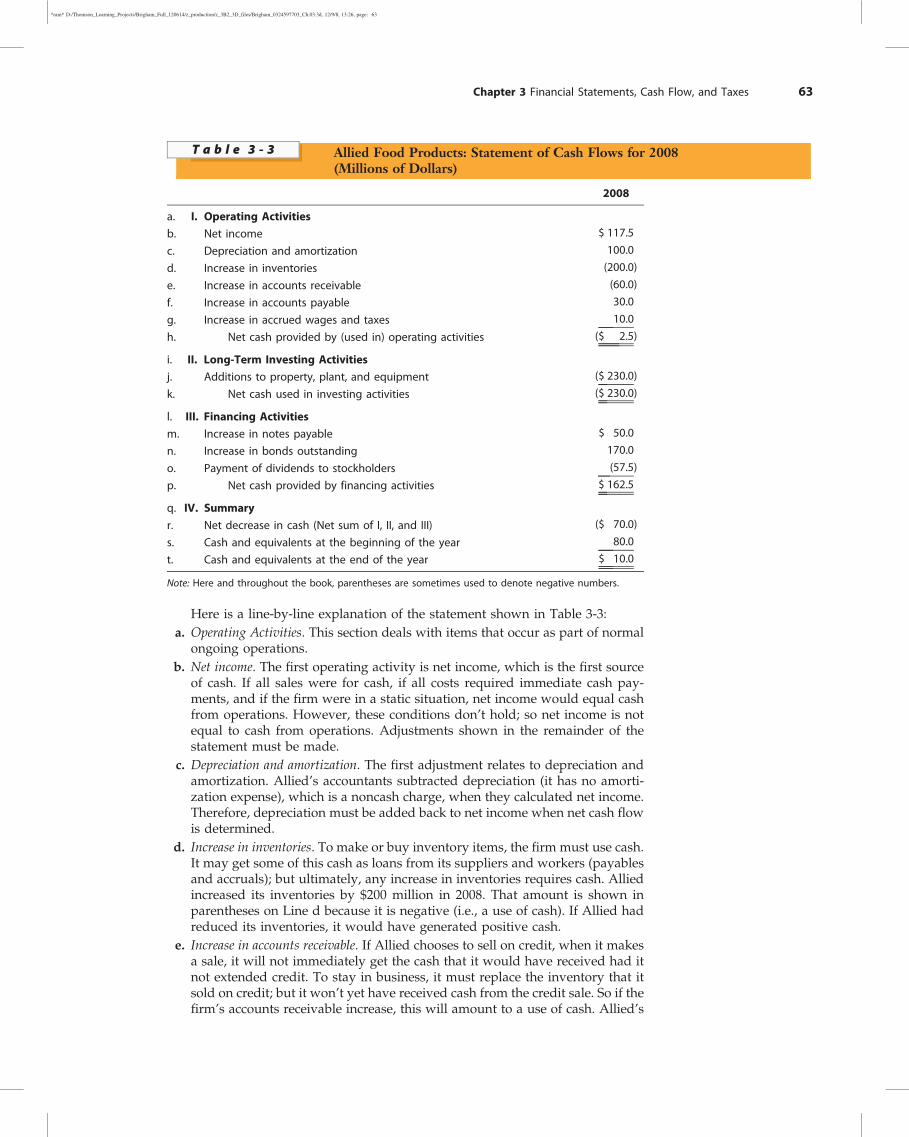
*ram* D:/Thomson_Learning_Projects/Brigham_Full_120614/z_production/z_3B2_3D_files/Brigham_0324597703_Ch.03.3d, 12/9/8, 13:26, page: 63
Here is a line-by-line explanation of the statement shown in Table 3-3:a. Operating Activities. This section deals with items that occur as part of normal
ongoing operations.b. Net income. The first operating activity is net income, which is the first source
of cash. If all sales were for cash, if all costs required immediate cash pay-ments, and if the firm were in a static situation, net income would equal cashfrom operations. However, these conditions don’t hold; so net income is notequal to cash from operations. Adjustments shown in the remainder of thestatement must be made.
c. Depreciation and amortization. The first adjustment relates to depreciation andamortization. Allied’s accountants subtracted depreciation (it has no amorti-zation expense), which is a noncash charge, when they calculated net income.Therefore, depreciation must be added back to net income when net cash flowis determined.
d. Increase in inventories. To make or buy inventory items, the firm must use cash.It may get some of this cash as loans from its suppliers and workers (payablesand accruals); but ultimately, any increase in inventories requires cash. Alliedincreased its inventories by $200 million in 2008. That amount is shown inparentheses on Line d because it is negative (i.e., a use of cash). If Allied hadreduced its inventories, it would have generated positive cash.
e. Increase in accounts receivable. If Allied chooses to sell on credit, when it makesa sale, it will not immediately get the cash that it would have received had itnot extended credit. To stay in business, it must replace the inventory that itsold on credit; but it won’t yet have received cash from the credit sale. So if thefirm’s accounts receivable increase, this will amount to a use of cash. Allied’s
Allied Food Products: Statement of Cash Flows for 2008(Millions of Dollars)
T a b l e 3 - 3
2008
a. I. Operating Activities
b. Net income $ 117.5
c. Depreciation and amortization 100.0
d. Increase in inventories (200.0)
e. Increase in accounts receivable (60.0)
f. Increase in accounts payable 30.0
g. Increase in accrued wages and taxes 10.0
h. Net cash provided by (used in) operating activities ($ 2.5)
i. II. Long-Term Investing Activities
j. Additions to property, plant, and equipment ($ 230.0)
k. Net cash used in investing activities ($ 230.0)
l. III. Financing Activities
m. Increase in notes payable $ 50.0
n. Increase in bonds outstanding 170.0
o. Payment of dividends to stockholders (57.5)
p. Net cash provided by financing activities $ 162.5
q. IV. Summary
r. Net decrease in cash (Net sum of I, II, and III) ($ 70.0)
s. Cash and equivalents at the beginning of the year 80.0
t. Cash and equivalents at the end of the year $ 10.0
Note: Here and throughout the book, parentheses are sometimes used to denote negative numbers.
Chapter 3 Financial Statements, Cash Flow, and Taxes 63
Cengage Learning
*ram* D:/Thomson_Learning_Projects/Brigham_Full_120614/z_production/z_3B2_3D_files/Brigham_0324597703_Ch.03.3d, 12/9/8, 13:26, page: 64
receivables rose by $60 million in 2008, and that use of cash is shown as anegative on Line e. If Allied had reduced its receivables, this would haveshowed up as a positive cash flow. (Once cash is received for the sale, theaccompanying accounts receivable will be eliminated.)
f. Increase in accounts payable. Accounts payable represent a loan from suppliers.Allied bought goods on credit, and its payables increased by $30 million thisyear. That is treated as a $30 million increase in cash on Line f. If Allied hadreduced its payables, that would have required, or used, cash. Note that asAllied grows, it will purchase more inventories. That will give rise to addi-tional payables, which will reduce the amount of new outside funds requiredto finance inventory growth.
g. Increase in accrued wages and taxes. The same logic applies to accruals as toaccounts payable. Allied’s accruals increased by $10 million this year, whichmeans that in 2008, it borrowed an additional $10 million from its workersand tax authorities. So this represents a $10 million cash inflow.
h. Net cash provided by operating activities. All of the previous items are part ofnormal operations—they arise as a result of doing business. When we sumthem, we obtain the net cash flow from operations. Allied had positive flowsfrom net income, depreciation, and increases in payables and accruals; but itused cash to increase inventories and to carry receivables. The net result wasthat operations led to a $2.5 million net outflow of cash.
i. Long-Term Investing Activities. All activities involving long-term assets arecovered in this section. Allied had only one long-term investment activity—the acquisition of some fixed assets, as shown on Line j. If Allied had soldsome fixed assets, its accountants would have reported it in this section as apositive amount (i.e., as a source of cash).
j. Additions to property, plant, and equipment. Allied spent $230 million on fixedassets during the current year. This is an outflow; therefore, it is shown inparentheses. If Allied had sold some of its fixed assets, this would have been acash inflow.9
k. Net cash used in investing activities. Since Allied had only one investmentactivity, the total on this line is the same as that on the previous line.
l. Financing Activities. Allied’s financing activities are shown in this section.m. Increase in notes payable. Allied borrowed an additional $50 million from its
bank this year, which was a cash inflow. When Allied repays the loan, this willbe an outflow.
n. Increase in bonds (long-term debt). Allied borrowed an additional $170 millionfrom long-term investors this year, giving them newly issued bonds inexchange for cash. This is shown as an inflow. When the bonds are repaidsome years hence, this will be an outflow.
o. Payment of dividends to stockholders. Dividends are paid in cash, and the$57.5 million that Allied paid out is shown as a negative amount.
p. Net cash provided by financing activities. The sum of the three financing entries,which is a positive $162.5 million, is shown here. These funds were used tohelp pay for the $230 million of new plant and equipment and to help coverthe deficit resulting from operations.
q. Summary. This section summarizes the change in cash and cash equivalentsover the year.
9The number on Line j is “gross” investment, or total expenditures. It is also equal to the change in net plant andequipment (from the balance sheet) plus depreciation as shown on Line c: Gross investment ¼ Net investment þDepreciation ¼ $130 þ $100 ¼ $230.
64 Part 2 Fundamental Concepts in Financial Management
Cengage Learning
*ram* D:/Thomson_Learning_Projects/Brigham_Full_120614/z_production/z_3B2_3D_files/Brigham_0324597703_Ch.03.3d, 12/9/8, 13:26, page: 65
r. Net decrease in cash. The net sum of the operating activities, investing activities,and financing activities is shown here. These activities resulted in a $70 millionnet decrease in cash during 2008, mainly due to expenditures on new fixedassets.
s. Cash and equivalents at the beginning of the year. Allied began the year with the$80 million of cash, which is shown here.
t. Cash and equivalents at the end of the year. Allied ended the year with $10million of cash, the $80 million it started with minus the $70 million netdecrease as shown previously. Clearly, Allied’s cash position is weaker than itwas at the beginning of the year.
Allied’s statement of cash flows should be of concern to its managers andinvestors. The company was able to cover the small operating deficit and the largeinvestment in fixed assets by borrowing and reducing its beginning balances ofcash and equivalents. However, that can’t continue indefinitely. In the long run,Section I needs to show positive operating cash flows. In addition, we wouldexpect Section II to show expenditures on fixed assets that are about equal to (1) itsdepreciation charges (to replace worn out fixed assets) along with (2) someadditional spending to provide for growth. Section III would normally show somenet borrowing in addition to a “reasonable” amount of dividends.10 Finally,Section IV should show a reasonably stable cash balance from year to year. Theseconditions don’t hold for Allied, so something should be done to correct thesituation. We will consider corrective actions in Chapter 4, when we analyze thefirm’s financial statements.
MASSAGING THE CASH FLOW STATEMENT
Profits as reported on the income statement can be “mas-saged” by changes in depreciation methods, inventory val-uation procedures, and so on, but “cash is cash,” somanagement can’t mess with the cash flow statement, right?Nope—wrong. A recent article in The Wall Street Journaldescribed how Ford, General Motors, and several othercompanies overstated their operating cash flows, the mostimportant section of the cash flow statement. Indeed, GMreported more than twice as much cash from operations as itreally generated, $7.6 billion versus a true $3.5 billion. Whathappened is that when GM sold cars to a dealer on credit, itcreated an account receivable, which should be shown in the“Operating Activities” section as a use of cash. However, GMclassified these receivables as loans to dealers and reportedthem as a financing activity. That decision more than dou-bled the reported cash flow from operations. It didn’t affectthe end-of-year cash balance, but it made operations lookstronger than they really were.
If Allied Foods, in Table 3-3, had done this, the $60million increase in receivables, which is correctly shown as ause of cash, would have been shifted to the “FinancingActivities” section, causing Allied’s cash provided by oper-ations to rise from $2.5 million to +$57.5 million. That wouldhave made Allied look better to investors and credit ana-lysts, but it would have been just smoke and mirrors.
GM’s treatment was first reported by Charles Mulford,a professor at Georgia Tech. The SEC then sent GM a letterthat basically required it to change its procedures. Thecompany issued a statement saying that it thought at thetime that it was acting in accordance with GAAP but that itwould reclassify its accounts in the future. GM’s action wasnot in the league of WorldCom’s or Enron’s fraudulentaccounting, but it does show that companies sometimesdo things to make their statements look better than theyreally are.
Source: Diya Gullapalli, “Little Campus Lab Shakes Big Firms,” The Wall Street Journal, March 1, 2005, p. C3.
10The average company pays out about one third of its earnings as dividends, but there is a great deal of variationbetween companies depending on each company’s needs for retained earnings to support its growth. We coverdividends in detail later in the text in Distributions to Shareholders: Dividends and Share Repurchases.
Chapter 3 Financial Statements, Cash Flow, and Taxes 65
Cengage Learning
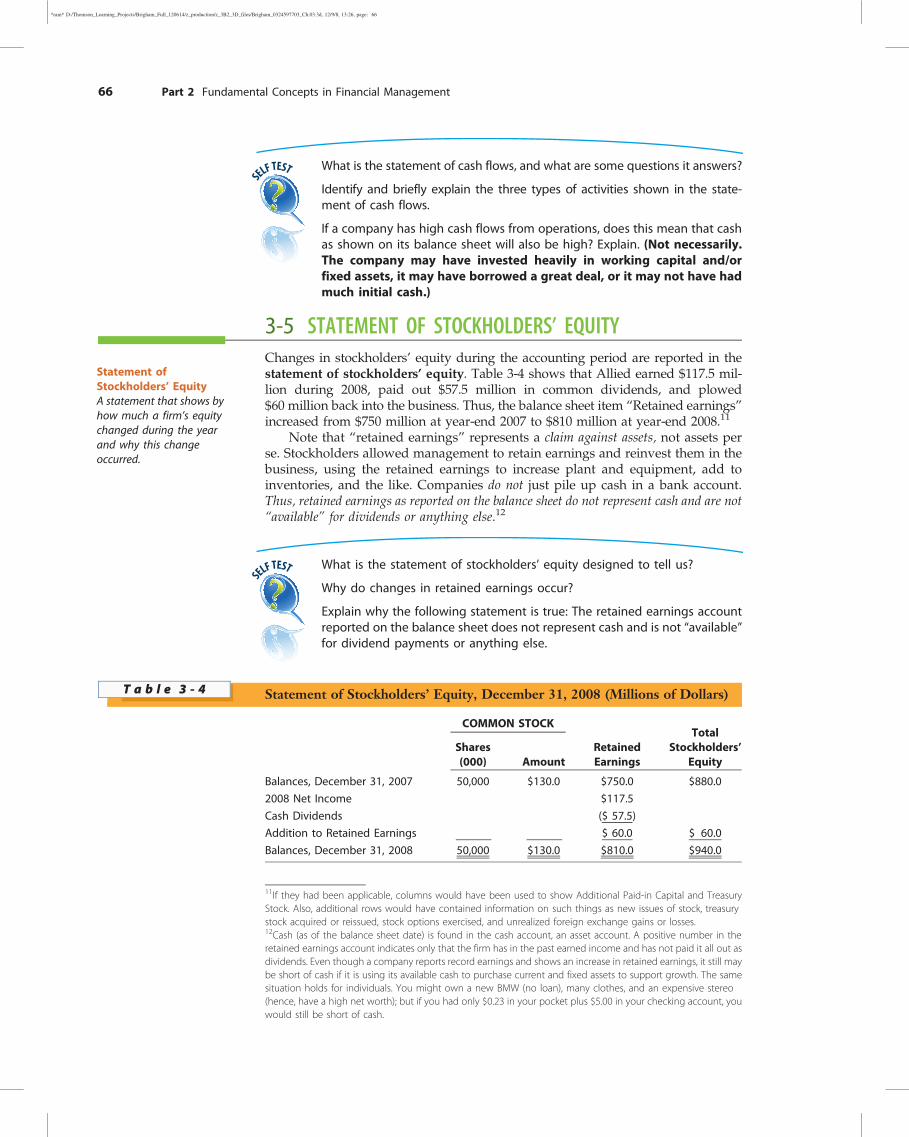
*ram* D:/Thomson_Learning_Projects/Brigham_Full_120614/z_production/z_3B2_3D_files/Brigham_0324597703_Ch.03.3d, 12/9/8, 13:26, page: 66
SELF TEST What is the statement of cash flows, and what are some questions it answers?
Identify and briefly explain the three types of activities shown in the state-ment of cash flows.
If a company has high cash flows from operations, does this mean that cashas shown on its balance sheet will also be high? Explain. (Not necessarily.The company may have invested heavily in working capital and/orfixed assets, it may have borrowed a great deal, or it may not have hadmuch initial cash.)
3-5 STATEMENT OF STOCKHOLDERS’ EQUITYChanges in stockholders’ equity during the accounting period are reported in thestatement of stockholders’ equity. Table 3-4 shows that Allied earned $117.5 mil-lion during 2008, paid out $57.5 million in common dividends, and plowed$60 million back into the business. Thus, the balance sheet item “Retained earnings”increased from $750 million at year-end 2007 to $810 million at year-end 2008.11
Note that “retained earnings” represents a claim against assets, not assets perse. Stockholders allowed management to retain earnings and reinvest them in thebusiness, using the retained earnings to increase plant and equipment, add toinventories, and the like. Companies do not just pile up cash in a bank account.Thus, retained earnings as reported on the balance sheet do not represent cash and are not“available” for dividends or anything else.12
SELF TEST What is the statement of stockholders’ equity designed to tell us?
Why do changes in retained earnings occur?
Explain why the following statement is true: The retained earnings accountreported on the balance sheet does not represent cash and is not “available”for dividend payments or anything else.
Statement of Stockholders’ Equity, December 31, 2008 (Millions of Dollars)T a b l e 3 - 4
COMMON STOCK
RetainedEarnings
TotalStockholders’
EquityShares(000) Amount
Balances, December 31, 2007 50,000 $130.0 $750.0 $880.0
2008 Net Income $117.5
Cash Dividends ($ 57.5)
Addition to Retained Earnings $ 60.0 $ 60.0
Balances, December 31, 2008 50,000 $130.0 $810.0 $940.0
Statement ofStockholders’ EquityA statement that shows byhow much a firm’s equitychanged during the yearand why this changeoccurred.
11If they had been applicable, columns would have been used to show Additional Paid-in Capital and TreasuryStock. Also, additional rows would have contained information on such things as new issues of stock, treasurystock acquired or reissued, stock options exercised, and unrealized foreign exchange gains or losses.12Cash (as of the balance sheet date) is found in the cash account, an asset account. A positive number in theretained earnings account indicates only that the firm has in the past earned income and has not paid it all out asdividends. Even though a company reports record earnings and shows an increase in retained earnings, it still maybe short of cash if it is using its available cash to purchase current and fixed assets to support growth. The samesituation holds for individuals. You might own a new BMW (no loan), many clothes, and an expensive stereo(hence, have a high net worth); but if you had only $0.23 in your pocket plus $5.00 in your checking account, youwould still be short of cash.
66 Part 2 Fundamental Concepts in Financial Management
Cengage Learning
*ram* D:/Thomson_Learning_Projects/Brigham_Full_120614/z_production/z_3B2_3D_files/Brigham_0324597703_Ch.03.3d, 12/9/8, 13:26, page: 67
3-6 FREE CASH FLOWThus far, we have focused on financial statements as they are prepared byaccountants. However, accounting statements are designed primarily for use bycreditors and tax collectors, not for managers and stock analysts. Therefore, cor-porate decision makers and security analysts often modify accounting data tomeet their needs. The most important modification is the concept of free cash flow(FCF), defined as “the amount of cash that could be withdrawn without harming afirm’s ability to operate and to produce future cash flows.” Here is the equationused to calculate free cash flow:
FCF ¼ EBIT ð1� TÞ þ Depreciation���
Capital
expendituresþ Increase in net
working capital
��
¼ $283:8ð1� 0:4Þ þ 100 ��$230 þ
�Change in
current assets� Change in
payables and accruals
��
¼ $170:3 þ $100� ð$230 þ ½ð$1,000� $810Þ � ð$200� $160Þ�Þ¼ $170:3 þ $100� $230� $150
¼ �$109:7 million
FINANCIAL ANALYSIS ON THE INTERNET
A wide range of valuable financial information is availableon the Internet. With just a couple of clicks, an investor canfind the key financial statements for most publicly tradedcompanies.
Suppose you are thinking of buying some Disney stock,and you want to analyze its recent performance. Here’s apartial (but by no means complete) list of sites you canaccess to get started:l One source is Yahoo!’s finance web site, http://finance.
yahoo.com. Here you will find updated market infor-mation along with links to a variety of interestingresearch sites. Enter a stock’s ticker symbol, click “Go,”and you will see the stock’s current price along withrecent news about the company. Click “Key Statistics” tofind a report on the company’s key financial ratios.Links to the company’s financials (income statement,balance sheet, and statement of cash flows) can also befound. The Yahoo! site also has a list of insider trans-actions that will tell you whether a company’s CEO andother key insiders are buying or selling the company’sstock. In addition, the site has a message board whereinvestors share opinions about the company and a linkis provided to the company’s filings with the Securitiesand Exchange Commission (SEC). Note also that, inmost cases, a more complete listing of SEC filings canbe found at www.sec.gov.
l Two other web sites with similar information are GoogleFinance (http://finance.google.com) and MSN Money(http://moneycentral.msn.com). After entering a stock’sticker symbol, you will see the current stock price and a
list of recent news stories. At either of these sites, youwill find links to a company’s financial statements andkey ratios, as well as other information including analystratings, historical charts, earnings estimates, and asummary of insider transactions. Google Finance, MSNMoney, and Yahoo! Finance allow you to export thefinancial statements and historical prices to an Excelspreadsheet.
l Other sources for up-to-date market information arehttp://money.cnn.com and www.marketwatch.com. Onthese sites, you also can obtain stock quotes, financialstatements, links to Wall Street research and SEC filings,company profiles, and charts of a firm’s stock price overtime.
l After accumulating all of this information, you maywant to look at a site that provides opinions regardingthe direction of the overall market and a particularstock. Two popular sites are The Motley Fool’s web site,www.fool.com, and the site for TheStreet.com, www.thestreet.com.
l A popular source is the online web site of TheWall StreetJournal, http://online.wsj.com. It is a great resource, butyou have to subscribe to access the full range ofmaterials.
Keep in mind that this list is just a small subset of theinformation available online. Also, sites come and go andchange their content over time. New and interesting sitesare constantly being added to the Internet.
Free Cash Flow (FCF)The amount of cash thatcould be withdrawn froma firm without harming itsability to operate and toproduce future cash flows.
Chapter 3 Financial Statements, Cash Flow, and Taxes 67
Cengage Learning
*ram* D:/Thomson_Learning_Projects/Brigham_Full_120614/z_production/z_3B2_3D_files/Brigham_0324597703_Ch.03.3d, 12/9/8, 13:26, page: 68
EBIT(1 – T) is the after-tax operating income that would exist if the firm had nodebt and therefore no interest payments.13 For Allied, EBIT(1 – T) ¼ $283.8(1 – 0.4) ¼$170.3. Depreciation is then added back because it is a noncash expense. Allied’sbusiness plan called for $230 million of capital expenditures plus a $150 millionincrease in net working capital. Those investments are necessary to sustain ongoingoperations.
Allied’s FCF is negative, which is not good. Note, though, that the negativeFCF is largely attributable to the $230 million expenditure for a new processingplant. This plant is large enough to meet production for several years, so anothernew plant will not be needed until 2012. Therefore, Allied’s FCF for 2009 and thenext few years should increase, which means that things are not as bad as thenegative FCF might suggest.
Note also that most rapidly growing companies have negative FCFs—thefixed assets and working capital needed to support rapid growth generally exceedcash flows from existing operations. This is not bad, provided the new invest-ments are eventually profitable and contribute to FCF.
Many analysts regard FCF as being the single most important number that canbe developed from accounting statements, even more important than net income.
13After tax operating income ¼ EBIT – Taxes ¼ EBIT – EBIT(T) ¼ EBIT(1 – T), where T is the firm’s marginal tax rate.
FREE CASH FLOW IS IMPORTANT FOR SMALL BUSINESSES
Free cash flow is important to large companies like AlliedFoods. Security analysts use FCF to help estimate the valueof the stock, and Allied’s managers use it to assess the valueof proposed capital budgeting projects and potentialmerger candidates. Note, though, that the concept is alsorelevant for small businesses.
Let’s assume that your aunt and uncle own a smallpizza shop and that they have an accountant who preparestheir financial statements. The income statement showstheir accounting profit for each year. While they are cer-tainly interested in this number, what they probably caremore about is how much money they can take out of thebusiness each year to maintain their standard of living. Let’sassume that the shop’s net income for 2008 was $75,000.However, your aunt and uncle had to spend $50,000 torefurbish the kitchen and restrooms.
So while the business is generating a great deal of“profit,” your aunt and uncle can’t take much money outbecause they have to put money back into the pizza shop.Stated another way, their free cash flow is much less thantheir net income. The required investments could be solarge that they even exceed the money made from sellingpizza. In this case, your aunt and uncle’s free cash flowwould be negative. If so, this means they must find fundsfrom other sources just to maintain the pizza business.
As astute businesspeople, your aunt and uncle recog-nize that investments in the restaurant, such as updatingthe kitchen and restrooms, are nonrecurring; and if nothingelse comes up unexpectedly, your aunt and uncle should beable to take more out of the business in upcoming years,when their free cash flow increases. But some businessesnever seem to produce cash for their owners—they con-sistently generate positive net income, but this net incomeis swamped by the amount of cash that has to be plowedback into the business. Thus, when it comes to valuing thepizza shop (or any business small or large), what reallymatters is the amount of free cash flow that the businessgenerates over time.
Looking ahead, your aunt and uncle face competitionfrom national chains that are moving into the area. To meetthe competition, your aunt and uncle will have to mod-ernize the dining room. This will again drain cash from thebusiness and reduce its free cash flow, although the hope isthat it will enable them to increase sales and free cash flowin the years ahead. As we will see when we discuss capitalbudgeting, evaluating projects requires us to estimatewhether the future increases in free cash flow are sufficientto more than offset the initial project cost. And this comesdown to free cash flows.
68 Part 2 Fundamental Concepts in Financial Management
Cengage Learning

*ram* D:/Thomson_Learning_Projects/Brigham_Full_120614/z_production/z_3B2_3D_files/Brigham_0324597703_Ch.03.3d, 12/9/8, 13:26, page: 69
After all, FCF shows how much the firm can distribute to its investors. We willdiscuss FCF again in Chapter 9, which deals with stock valuation, and in Chapter 11and Chapter 12, which deal with capital budgeting.
SELF TEST What is free cash flow (FCF)?
Why is FCF an important determinant of a firm’s value?
A company has EBIT of $30 million, depreciation of $5 million, and a 40% taxrate. It needs to spend $10 million on new fixed assets and $15 million toincrease its current assets, and it expects its payables to increase by $2 millionand its accruals to increase by $3 million. What is its free cash flow?($3 million)
3-7 INCOME TAXESIndividuals and corporations pay out a significant portion of their income as taxes,so taxes are important in both personal and corporate decisions. We summarizethe key aspects of the U.S. tax system for individuals in this section and forcorporations in the next section, using 2008 data. The details of our tax lawschange fairly often—annually for things that are indexed for inflation—but thebasic nature of the tax system is likely to remain intact.
3-7a Individual TaxesIndividuals pay taxes on wages and salaries, on investment income (dividends,interest, and profits from the sale of securities), and on the profits of proprietor-ships and partnerships. The tax rates are progressive—that is, the higher one’sincome, the larger the percentage paid in taxes. Table 3-5 gives the tax rates thatwere in effect April 2008.
Taxable income is defined as “gross income less a set of exemptions anddeductions.” When filing a tax return in 2008 for the tax year 2007, taxpayersreceived an exemption of $3,400 for each dependent, including the taxpayer, whichreduces taxable income. However, this exemption is indexed to rise with inflation,and the exemption is phased out (taken away) for high-income taxpayers. Also,certain expenses, including mortgage interest paid, state and local income taxespaid, and charitable contributions, can be deducted and thus be used to reducetaxable income; but again, high-income taxpayers lose most of these deductions.
The marginal tax rate is defined as “the tax rate on the last dollar of income.”Marginal rates begin at 10% and rise to 35%. Note, though, that when consider-ation is given to the phase-out of exemptions and deductions, to Social Securityand Medicare taxes, and to state taxes, the marginal tax rate may actually exceed50%. Average tax rates can be calculated from the data in Table 3-5. For example, ifa single individual had taxable income of $35,000, his or her tax bill would be$4,386.25 þ ($35,000 – $31,850)(0.25) ¼ $4,386.25 þ $787.50 ¼ $5,173.75. Heraverage tax rate would be $5,173.75/$35,000 ¼ 14.78% versus a marginal rate of25%. If she received a raise of $1,000, bringing her income to $36,000, she wouldhave to pay $250 of it as taxes; so her after-tax raise would be $750.
Note too that interest income received by individuals from corporate securitiesis added to other income and thus is taxed at federal rates going up to 35%, plusstate taxes.14 Capital gains and losses, on the other hand, are treated differently.
Progressive TaxA tax system where thetax rate is higher onhigher incomes. The per-sonal income tax in theUnited States, whichranges from 0% on thelowest incomes to 35% onthe highest incomes, isprogressive.
Marginal Tax RateThe tax rate applicable tothe last unit of a person’sincome.
Average Tax RateTaxes paid divided bytaxable income.
14Under U.S. tax laws, interest on most state and local government bonds, called municipals or “munis,” is notsubject to federal income taxes. This has a significant effect on the values of munis and on their rates of return. Wediscuss rates and returns in Chapter 8.
Chapter 3 Financial Statements, Cash Flow, and Taxes 69
Cengage Learning

*ram* D:/Thomson_Learning_Projects/Brigham_Full_120614/z_production/z_3B2_3D_files/Brigham_0324597703_Ch.03.3d, 12/9/8, 13:26, page: 70
Assets such as stocks, bonds, and real estate are defined as capital assets.When youbuy a capital asset and later sell it for more than you paid, you earn a profit that iscalled a capital gain; when you suffer a loss, it is called a capital loss. If you heldthe asset for less than one year, you will have a short-term gain or loss, while if youheld it for more than a year, you will have a long-term gain or loss. Thus, if you buy100 shares of Disney stock for $42 per share and sell it for $52 per share, you makea capital gain of 100 × $10, or $1,000. However, if you sell the stock for $32 pershare, you will have a $1,000 capital loss. Depending on how long you hold thestock, you will have a short-term or long-term gain or loss.15 If you sell the stockfor exactly $42 per share, you make neither a gain nor a loss; so no tax is due.
A short-term capital gain is added to such ordinary income as wages andinterest, then is taxed at the same rate as ordinary income. However, long-termcapital gains are taxed differently. The top rate on long-term gains in 2008 is 15%.Thus, if in 2008, you were in the 35% tax bracket, any short-term gains you earnedwould be taxed just like ordinary income; but your long-term gains would betaxed at 15%. Thus, capital gains on assets held for more than 12 months are betterthan ordinary income for many people because the tax bite is smaller. However,
Individual Tax Rates in April 2008T a b l e 3 - 5
SINGLE INDIVIDUALS
If Your Taxable Income Is
You Pay ThisAmount on the
Base of the Bracket
Plus This Percentage onthe Excess over the Base
(Marginal Rate)Average Tax Rateat Top of Bracket
Up to $7,825 $ 0 10.0% 10.0%
$7,825–$31,850 782.50 15.0 13.8
$31,850–$77,100 4,386.25 25.0 20.4
$77,100–$160,850 15,698.75 28.0 24.3
$160,850–$349,700 39,148.75 33.0 29.0
Over $349,700 101,469.25 35.0 35.0
MARRIED COUPLES FILING JOINT RETURNS
If Your Taxable Income Is
You Pay ThisAmount on the Base
of the Bracket
Plus This Percentage onthe Excess over the Base
(Marginal Rate)Average Tax Rateat Top of Bracket
Up to $15,650 $ 0 10.0% 10.0%
$15,650–$63,700 1,565.00 15.0 13.8
$63,700–$128,500 8,772.50 25.0 19.4
$128,500–$195,850 24,972.50 28.0 22.4
$195,850–$349,700 43,830.50 33.0 27.0
Over $349,700 94,601.00 35.0 35.0
Notes:a. These are the tax rates as of April 2008. The income ranges at which each tax rate takes effect are indexed with inflation, so they change each year.b. The average tax rates are always below the marginal rates, but the average at the top of the brackets approaches 35% as taxable income
rises without limit.c. In 2007, a personal exemption of $3,400 per person or dependent could be deducted from gross income to determine taxable income. Thus,
a husband and wife with two children would have a 2007 exemption of 4 × $3,400 ¼ $13,600. The exemption increases with inflation;but if gross income exceeds certain limits, the exemption is phased out, which has the effect of raising the effective tax rate on incomes over thespecified limit. In addition, taxpayers can claim itemized deductions for charitable contributions and certain other items, but these deductions arealso phased out for high-income taxpayers. In addition, there are Social Security and Medicare taxes. All of this pushes the effective tax rate towell above 35%.
Capital Gain or LossThe profit (loss) from thesale of a capital asset formore (less) than its pur-chase price.
15If you have a net capital loss (your capital losses exceed your capital gains) for the year, you can deduct up to$3,000 of this loss against your other income (for example, salary, interest, and dividends).
70 Part 2 Fundamental Concepts in Financial Management
Cengage Learning
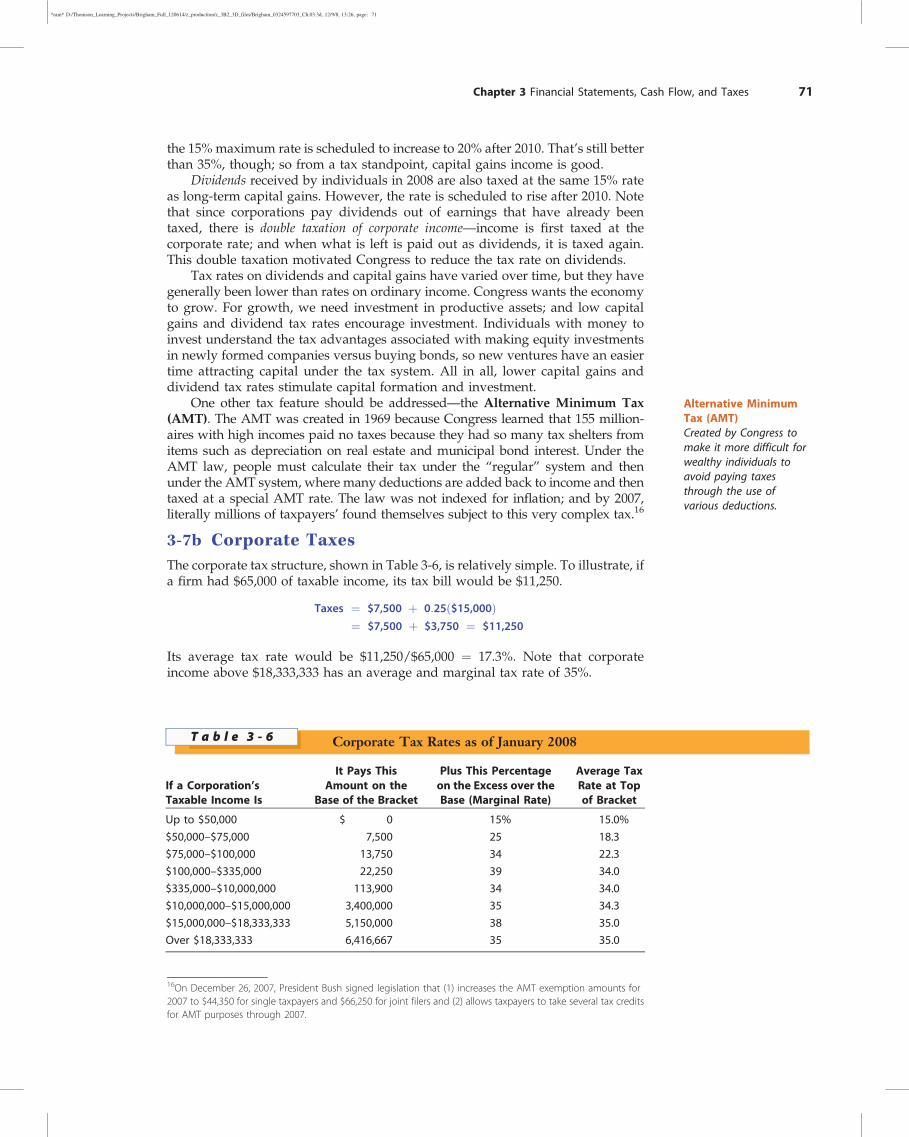
*ram* D:/Thomson_Learning_Projects/Brigham_Full_120614/z_production/z_3B2_3D_files/Brigham_0324597703_Ch.03.3d, 12/9/8, 13:26, page: 71
the 15% maximum rate is scheduled to increase to 20% after 2010. That’s still betterthan 35%, though; so from a tax standpoint, capital gains income is good.
Dividends received by individuals in 2008 are also taxed at the same 15% rateas long-term capital gains. However, the rate is scheduled to rise after 2010. Notethat since corporations pay dividends out of earnings that have already beentaxed, there is double taxation of corporate income—income is first taxed at thecorporate rate; and when what is left is paid out as dividends, it is taxed again.This double taxation motivated Congress to reduce the tax rate on dividends.
Tax rates on dividends and capital gains have varied over time, but they havegenerally been lower than rates on ordinary income. Congress wants the economyto grow. For growth, we need investment in productive assets; and low capitalgains and dividend tax rates encourage investment. Individuals with money toinvest understand the tax advantages associated with making equity investmentsin newly formed companies versus buying bonds, so new ventures have an easiertime attracting capital under the tax system. All in all, lower capital gains anddividend tax rates stimulate capital formation and investment.
One other tax feature should be addressed—the Alternative Minimum Tax(AMT). The AMT was created in 1969 because Congress learned that 155 million-aires with high incomes paid no taxes because they had so many tax shelters fromitems such as depreciation on real estate and municipal bond interest. Under theAMT law, people must calculate their tax under the “regular” system and thenunder the AMT system, where many deductions are added back to income and thentaxed at a special AMT rate. The law was not indexed for inflation; and by 2007,literally millions of taxpayers’ found themselves subject to this very complex tax.16
3-7b Corporate TaxesThe corporate tax structure, shown in Table 3-6, is relatively simple. To illustrate, ifa firm had $65,000 of taxable income, its tax bill would be $11,250.
Taxes ¼ $7,500 þ 0:25ð$15,000Þ¼ $7,500 þ $3,750 ¼ $11,250
Its average tax rate would be $11,250/$65,000 ¼ 17.3%. Note that corporateincome above $18,333,333 has an average and marginal tax rate of 35%.
Corporate Tax Rates as of January 2008T a b l e 3 - 6
If a Corporation’sTaxable Income Is
It Pays ThisAmount on the
Base of the Bracket
Plus This Percentageon the Excess over theBase (Marginal Rate)
Average TaxRate at Topof Bracket
Up to $50,000 $ 0 15% 15.0%
$50,000–$75,000 7,500 25 18.3
$75,000–$100,000 13,750 34 22.3
$100,000–$335,000 22,250 39 34.0
$335,000–$10,000,000 113,900 34 34.0
$10,000,000–$15,000,000 3,400,000 35 34.3
$15,000,000–$18,333,333 5,150,000 38 35.0
Over $18,333,333 6,416,667 35 35.0
Alternative MinimumTax (AMT)Created by Congress tomake it more difficult forwealthy individuals toavoid paying taxesthrough the use ofvarious deductions.
16On December 26, 2007, President Bush signed legislation that (1) increases the AMT exemption amounts for2007 to $44,350 for single taxpayers and $66,250 for joint filers and (2) allows taxpayers to take several tax creditsfor AMT purposes through 2007.
Chapter 3 Financial Statements, Cash Flow, and Taxes 71
Cengage Learning
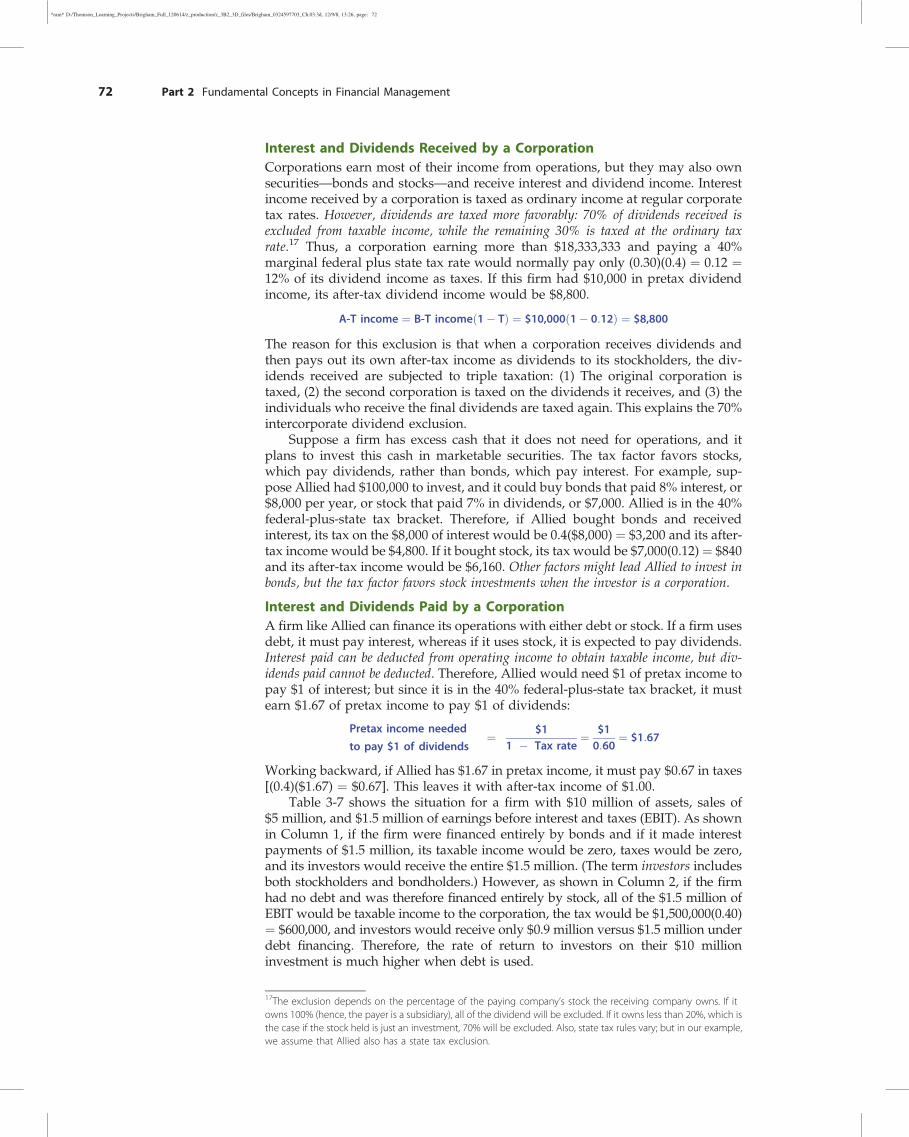
*ram* D:/Thomson_Learning_Projects/Brigham_Full_120614/z_production/z_3B2_3D_files/Brigham_0324597703_Ch.03.3d, 12/9/8, 13:26, page: 72
Interest and Dividends Received by a CorporationCorporations earn most of their income from operations, but they may also ownsecurities—bonds and stocks—and receive interest and dividend income. Interestincome received by a corporation is taxed as ordinary income at regular corporatetax rates. However, dividends are taxed more favorably: 70% of dividends received isexcluded from taxable income, while the remaining 30% is taxed at the ordinary taxrate.17 Thus, a corporation earning more than $18,333,333 and paying a 40%marginal federal plus state tax rate would normally pay only (0.30)(0.4) ¼ 0.12 ¼12% of its dividend income as taxes. If this firm had $10,000 in pretax dividendincome, its after-tax dividend income would be $8,800.
A-T income ¼ B-T incomeð1� TÞ ¼ $10,000ð1� 0:12Þ ¼ $8,800
The reason for this exclusion is that when a corporation receives dividends andthen pays out its own after-tax income as dividends to its stockholders, the div-idends received are subjected to triple taxation: (1) The original corporation istaxed, (2) the second corporation is taxed on the dividends it receives, and (3) theindividuals who receive the final dividends are taxed again. This explains the 70%intercorporate dividend exclusion.
Suppose a firm has excess cash that it does not need for operations, and itplans to invest this cash in marketable securities. The tax factor favors stocks,which pay dividends, rather than bonds, which pay interest. For example, sup-pose Allied had $100,000 to invest, and it could buy bonds that paid 8% interest, or$8,000 per year, or stock that paid 7% in dividends, or $7,000. Allied is in the 40%federal-plus-state tax bracket. Therefore, if Allied bought bonds and receivedinterest, its tax on the $8,000 of interest would be 0.4($8,000) ¼ $3,200 and its after-tax income would be $4,800. If it bought stock, its tax would be $7,000(0.12) ¼ $840and its after-tax income would be $6,160. Other factors might lead Allied to invest inbonds, but the tax factor favors stock investments when the investor is a corporation.
Interest and Dividends Paid by a CorporationA firm like Allied can finance its operations with either debt or stock. If a firm usesdebt, it must pay interest, whereas if it uses stock, it is expected to pay dividends.Interest paid can be deducted from operating income to obtain taxable income, but div-idends paid cannot be deducted. Therefore, Allied would need $1 of pretax income topay $1 of interest; but since it is in the 40% federal-plus-state tax bracket, it mustearn $1.67 of pretax income to pay $1 of dividends:
Pretax income needed
to pay $1 of dividends¼ $1
1 � Tax rate¼ $1
0:60¼ $1:67
Working backward, if Allied has $1.67 in pretax income, it must pay $0.67 in taxes[(0.4)($1.67) ¼ $0.67]. This leaves it with after-tax income of $1.00.
Table 3-7 shows the situation for a firm with $10 million of assets, sales of$5 million, and $1.5 million of earnings before interest and taxes (EBIT). As shownin Column 1, if the firm were financed entirely by bonds and if it made interestpayments of $1.5 million, its taxable income would be zero, taxes would be zero,and its investors would receive the entire $1.5 million. (The term investors includesboth stockholders and bondholders.) However, as shown in Column 2, if the firmhad no debt and was therefore financed entirely by stock, all of the $1.5 million ofEBIT would be taxable income to the corporation, the tax would be $1,500,000(0.40)¼ $600,000, and investors would receive only $0.9 million versus $1.5 million underdebt financing. Therefore, the rate of return to investors on their $10 millioninvestment is much higher when debt is used.
17The exclusion depends on the percentage of the paying company’s stock the receiving company owns. If itowns 100% (hence, the payer is a subsidiary), all of the dividend will be excluded. If it owns less than 20%, which isthe case if the stock held is just an investment, 70% will be excluded. Also, state tax rules vary; but in our example,we assume that Allied also has a state tax exclusion.
72 Part 2 Fundamental Concepts in Financial Management
Cengage Learning
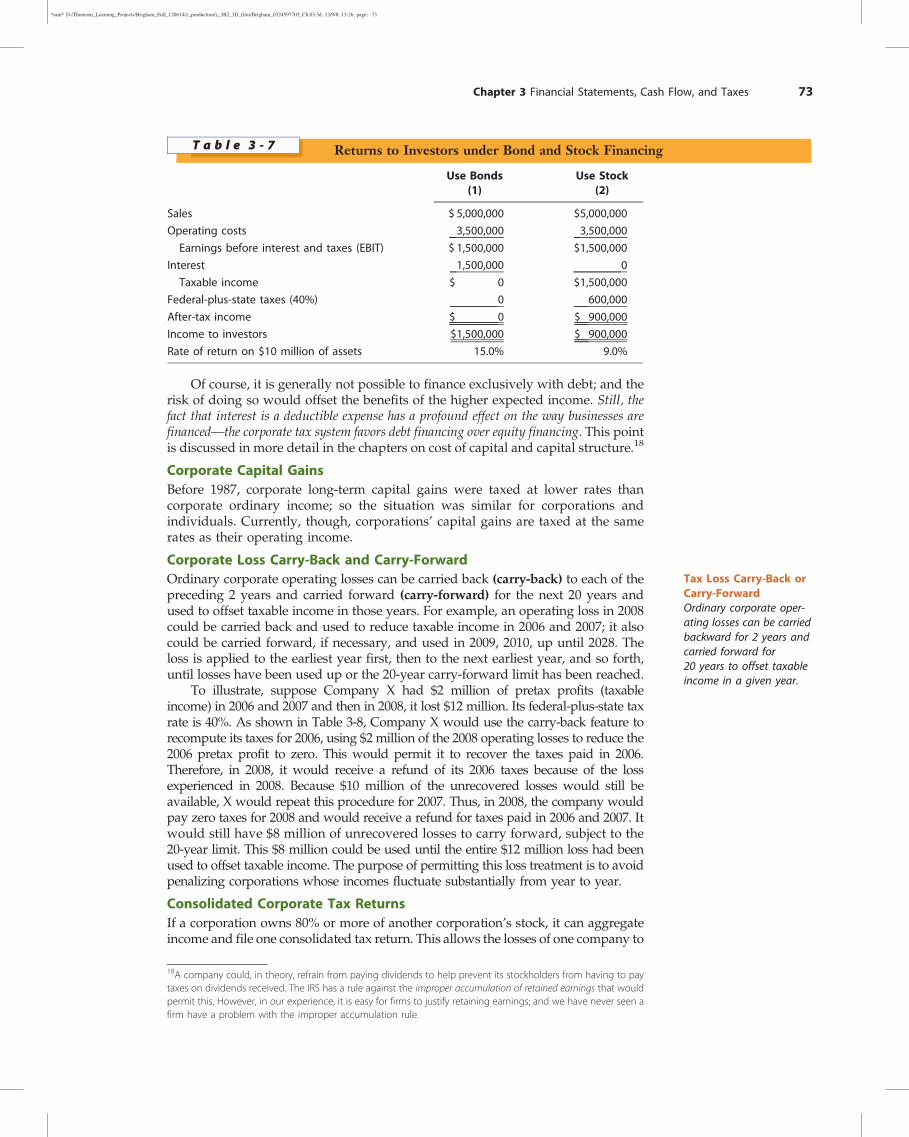
*ram* D:/Thomson_Learning_Projects/Brigham_Full_120614/z_production/z_3B2_3D_files/Brigham_0324597703_Ch.03.3d, 12/9/8, 13:26, page: 73
Of course, it is generally not possible to finance exclusively with debt; and therisk of doing so would offset the benefits of the higher expected income. Still, thefact that interest is a deductible expense has a profound effect on the way businesses arefinanced—the corporate tax system favors debt financing over equity financing. This pointis discussed in more detail in the chapters on cost of capital and capital structure.18
Corporate Capital GainsBefore 1987, corporate long-term capital gains were taxed at lower rates thancorporate ordinary income; so the situation was similar for corporations andindividuals. Currently, though, corporations’ capital gains are taxed at the samerates as their operating income.
Corporate Loss Carry-Back and Carry-ForwardOrdinary corporate operating losses can be carried back (carry-back) to each of thepreceding 2 years and carried forward (carry-forward) for the next 20 years andused to offset taxable income in those years. For example, an operating loss in 2008could be carried back and used to reduce taxable income in 2006 and 2007; it alsocould be carried forward, if necessary, and used in 2009, 2010, up until 2028. Theloss is applied to the earliest year first, then to the next earliest year, and so forth,until losses have been used up or the 20-year carry-forward limit has been reached.
To illustrate, suppose Company X had $2 million of pretax profits (taxableincome) in 2006 and 2007 and then in 2008, it lost $12 million. Its federal-plus-state taxrate is 40%. As shown in Table 3-8, Company X would use the carry-back feature torecompute its taxes for 2006, using $2 million of the 2008 operating losses to reduce the2006 pretax profit to zero. This would permit it to recover the taxes paid in 2006.Therefore, in 2008, it would receive a refund of its 2006 taxes because of the lossexperienced in 2008. Because $10 million of the unrecovered losses would still beavailable, X would repeat this procedure for 2007. Thus, in 2008, the company wouldpay zero taxes for 2008 and would receive a refund for taxes paid in 2006 and 2007. Itwould still have $8 million of unrecovered losses to carry forward, subject to the20-year limit. This $8 million could be used until the entire $12 million loss had beenused to offset taxable income. The purpose of permitting this loss treatment is to avoidpenalizing corporations whose incomes fluctuate substantially from year to year.
Consolidated Corporate Tax ReturnsIf a corporation owns 80% or more of another corporation’s stock, it can aggregateincome and file one consolidated tax return. This allows the losses of one company to
Returns to Investors under Bond and Stock FinancingT a b l e 3 - 7
Use Bonds(1)
Use Stock(2)
Sales $ 5,000,000 $5,000,000
Operating costs 3,500,000 3,500,000
Earnings before interest and taxes (EBIT) $ 1,500,000 $1,500,000
Interest 1,500,000 0
Taxable income $ 0 $1,500,000
Federal-plus-state taxes (40%) 0 600,000
After-tax income $ 0 $ 900,000
Income to investors $1,500,000 $ 900,000
Rate of return on $10 million of assets 15.0% 9.0%
18A company could, in theory, refrain from paying dividends to help prevent its stockholders from having to paytaxes on dividends received. The IRS has a rule against the improper accumulation of retained earnings that wouldpermit this. However, in our experience, it is easy for firms to justify retaining earnings; and we have never seen afirm have a problem with the improper accumulation rule.
Tax Loss Carry-Back orCarry-ForwardOrdinary corporate oper-ating losses can be carriedbackward for 2 years andcarried forward for20 years to offset taxableincome in a given year.
Chapter 3 Financial Statements, Cash Flow, and Taxes 73
Cengage Learning
*ram* D:/Thomson_Learning_Projects/Brigham_Full_120614/z_production/z_3B2_3D_files/Brigham_0324597703_Ch.03.3d, 12/9/8, 13:26, page: 74
be used to offset the profits of another. (Similarly, one division’s losses can be used tooffset another division’s profits.) No business wants to incur losses; but tax offsetsmake it more feasible for large, multidivisional corporations to undertake risky newventures or ventures that will suffer losses during a developmental period.
Taxation of Small Businesses: S CorporationsAs we noted in Chapter 1, the Tax Code allows small businesses that meet certainconditions to be set up as corporations and thus receive the benefits of the cor-porate form of organization—especially limited liability—yet still be taxed asproprietorships or partnerships rather than as corporations. These corporationsare called S corporations. (Regular corporations are called C corporations.) If acorporation elects S, all of its income is reported as personal income by itsstockholders, on a pro rata basis, and thus is taxed at the stockholders’ individualrates. Because the income is taxed only once, this is an important benefit to theowners of small corporations in which all or most of the income earned each yearwill be distributed as dividends. The situation is similar for LLCs.
DepreciationDepreciation plays an important role in income tax calculations—the larger thedepreciation, the lower the taxable income, the lower the tax bill, and thus thehigher the operating cash flow. Congress specifies the life over which assets canbe depreciated for tax purposes and the depreciation methods that can be used.We will discuss in detail how depreciation is calculated and how it affects incomeand cash flows when we study capital budgeting.
SELF TEST Explain this statement: Our tax rates are progressive.
What’s the difference between marginal and average tax rates?
What’s the AMT, and why was it instituted?
What’s a muni bond, and how are these bonds taxed?
What are long-term capital gains? Are they taxed like other income? Explain.
How does our tax system influence the use of debt financing by corporations?
What is the logic behind allowing tax loss carry-backs/carry-forwards?
Differentiate between S and C corporations.
Calculation of Loss Carry-Back and Carry-Forward for 2006–2007Using a $12 Million 2008 Loss
T a b l e 3 - 8
2006 2007
Original taxable income $ 2,000,000 $ 2,000,000
Carry-back credit �2,000,000 �2,000,000
Adjusted profit $ 0 $ 0
Taxes previously paid (40%) 800,000 800,000
Difference ¼ Tax refund $ 800,000 $ 800,000
Total refund check received in 2009: $800,000 þ $800,000 ¼ $1,600,000Amount of loss carry-forward available for use in 2009–2028:
2008 loss $12,000,000
Carry-back losses used 4,000,000
Carry-forward losses still available $ 8,000,000
S CorporationA small corporation that,under Subchapter S of theInternal Revenue Code,elects to be taxed as aproprietorship or a part-nership yet retains limitedliability and other benefitsof the corporate form oforganization.
74 Part 2 Fundamental Concepts in Financial Management
Cengage Learning

*ram* D:/Thomson_Learning_Projects/Brigham_Full_120614/z_production/z_3B2_3D_files/Brigham_0324597703_Ch.03.3d, 12/9/8, 13:26, page: 75
TYING IT ALL TOGETHER
The primary purposes of this chapter were to describe the basic financial state-ments, to present background information on cash flows, to differentiate betweencash flow and accounting income, and to provide an overview of the federalincome tax system. In the next chapter, we build on this information to analyze afirm’s financial statements and to determine its financial health.
SELF-TEST QUESTIONS AND PROBLEMS(Solutions Appear in Appendix A)
ST-1 KEY TERMS Define each of the following terms:
a. Annual report; balance sheet; income statement; statement of cash flows; statement ofstockholders’ equity
b. Stockholders’ equity; retained earnings; working capital; net working capital
c. Depreciation; amortization; operating income; EBITDA; free cash flow
d. Progressive tax; marginal tax rate; average tax rate
e. Tax loss carry-back; carry-forward; AMT
f. Capital gain (loss)
g. S corporation
ST-2 NET INCOME AND CASH FLOW Last year Rattner Robotics had $5 million in operatingincome (EBIT). Its depreciation expense was $1 million, its interest expense was $1 million,and its corporate tax rate was 40%. At year-end, it had $14 million in current assets,$3 million in accounts payable, $1 million in accruals, and $15 million in net plant andequipment. Assume that Rattner’s only noncash item was depreciation.
a. What was the company’s net income?
b. What was its net working capital (NWC)?
c. Rattner had $12 million in net plant and equipment the prior year. Its net workingcapital has remained constant over time. What is the company’s free cash flow (FCF)for the year that just ended?
d. If the firm had $4.5 million in retained earnings at the beginning of the year and paidout total dividends of $1.2 million, what was its retained earnings at the end of theyear? Assume that all dividends declared were actually paid.
QUESTIONS
3-1 What four financial statements are contained in most annual reports?
3-2 Who are some of the basic users of financial statements, and how do they use them?
3-3 If a “typical” firm reports $20 million of retained earnings on its balance sheet, could itsdirectors declare a $20 million cash dividend without having any qualms about what theywere doing? Explain your answer.
3-4 Explain the following statement: While the balance sheet can be thought of as a snapshotof a firm’s financial position at a point in time, the income statement reports on operationsover a period of time.
Chapter 3 Financial Statements, Cash Flow, and Taxes 75
Cengage Learning

*ram* D:/Thomson_Learning_Projects/Brigham_Full_120614/z_production/z_3B2_3D_files/Brigham_0324597703_Ch.03.3d, 12/9/8, 13:26, page: 76
3-5 Financial statements are based on generally accepted accounting principles (GAAP) and areaudited by CPA firms. Therefore, do investors need to worry about the validity of thosestatements? Explain your answer.
3-6 What is free cash flow? If you were an investor, why might you be more interested in freecash flow than net income?
3-7 Would it be possible for a company to report negative free cash flow and still be highlyvalued by investors; that is, could a negative free cash flow ever be a good thing in the eyesof investors? Explain your answer.
3-8 What is meant by the following statement: Our tax rates are progressive.
3-9 What does double taxation of corporate income mean? Could income ever be subject to tripletaxation? Explain your answer.
3-10 How does the deductibility of interest and dividends by the paying corporation affect thechoice of financing (that is, the use of debt versus equity)?
PROBLEMS
EasyProblems1–3
3-1 INCOME STATEMENT Little Books Inc. recently reported $3 million of net income. ItsEBIT was $6 million, and its tax rate was 40%. What was its interest expense? [Hint: Writeout the headings for an income statement and fill in the known values. Then divide$3 million of net income by (1 – T) ¼ 0.6 to find the pretax income. The differencebetween EBIT and taxable income must be the interest expense. Use this same procedureto complete similar problems.]
3-2 INCOME STATEMENT Pearson Brothers recently reported an EBITDA of $7.5 million andnet income of $1.8 million. It had $2.0 million of interest expense, and its corporate taxrate was 40%. What was its charge for depreciation and amortization?
3-3 STATEMENT OF STOCKHOLDERS’ EQUITY In its most recent financial statements,Newhouse Inc. reported $50 million of net income and $810 million of retainedearnings. The previous retained earnings were $780 million. How much in dividendswere paid to shareholders during the year? Assume that all dividends declared wereactually paid.
IntermediateProblems4–7
3-4 BALANCE SHEET Which of the following actions are most likely to directly increase cash asshown on a firm’s balance sheet? Explain and state the assumptions that underlie youranswer.
a. It issues $2 million of new common stock.
b. It buys new plant and equipment at a cost of $3 million.
c. It reports a large loss for the year.
d. It increases the dividends paid on its common stock.
3-5 STATEMENT OF STOCKHOLDERS’ EQUITY Computer World Inc. paid out $22.5 millionin total common dividends and reported $278.9 million of retained earnings at year-end.The prior year’s retained earnings were $212.3 million. What was the net income? Assumethat all dividends declared were actually paid.
3-6 STATEMENT OF CASH FLOWS W.C. Cycling had $55,000 in cash at year-end 2007 and$25,000 in cash at year-end 2008. Cash flow from long-term investing activities totaled�$250,000, and cash flow from financing activities totaled þ$170,000.
a. What was the cash flow from operating activities?
b. If accruals increased by $25,000, receivables and inventories increased by $100,000, anddepreciation and amortization totaled $10,000, what was the firm’s net income?
3-7 FREE CASH FLOW Bailey Corporation’s financial statements (dollars and shares are inmillions) are provided here.
76 Part 2 Fundamental Concepts in Financial Management
Cengage Learning

*ram* D:/Thomson_Learning_Projects/Brigham_Full_120614/z_production/z_3B2_3D_files/Brigham_0324597703_Ch.03.3d, 12/9/8, 13:26, page: 77
Balance Sheets as of December 31
2008 2007
Assets
Cash and equivalents $ 14,000 $ 13,000
Accounts receivable 30,000 25,000
Inventories 28,125 21,000
Total current assets $ 72,125 $ 59,000
Net plant and equipment 50,000 47,000
Total assets $122,125 $106,000
Liabilities and Equity
Accounts payable $ 10,800 $ 9,000
Notes payable 6,700 5,150
Accruals 7,600 6,000
Total current liabilities $ 25,100 $ 20,150
Long-term bonds 15,000 15,000
Total debt $ 40,100 $ 35,150
Common stock (5,000 shares) 50,000 50,000
Retained earnings 32,025 20,850
Common equity $ 82,025 $ 70,850
Total liabilities and equity $122,125 $106,000
Income Statement for Year Ending December 31, 2008
Sales $214,000
Operating costs excluding depreciation and amortization 170,000
EBITDA $ 44,000
Depreciation & amortization 5,000
EBIT $ 39,000
Interest 1,750
EBT $ 37,250
Taxes (40%) 14,900
Net income $ 22,350
Dividends paid $ 11,175
a. What was net working capital for 2007 and 2008?
b. What was Bailey’s 2008 free cash flow?
c. Construct Bailey’s 2008 statement of stockholders’ equity.
ChallengingProblems8–10
3-8 INCOME STATEMENT Hermann Industries is forecasting the following income statement:
Sales $8,000,000
Operating costs excluding depr. & amort. 4,400,000
EBITDA $3,600,000
Depreciation & amortization 800,000
EBIT $2,800,000
Interest 600,000
EBT $2,200,000
Taxes (40%) 880,000
Net income $1,320,000
The CEO would like to see higher sales and a forecasted net income of $2,500,000. Assumethat operating costs (excluding depreciation and amortization) are 55% of sales and thatdepreciation and amortization and interest expenses will increase by 10%. The tax rate, whichis 40%, will remain the same. What level of sales would generate $2,500,000 in net income?
Chapter 3 Financial Statements, Cash Flow, and Taxes 77
Cengage Learning
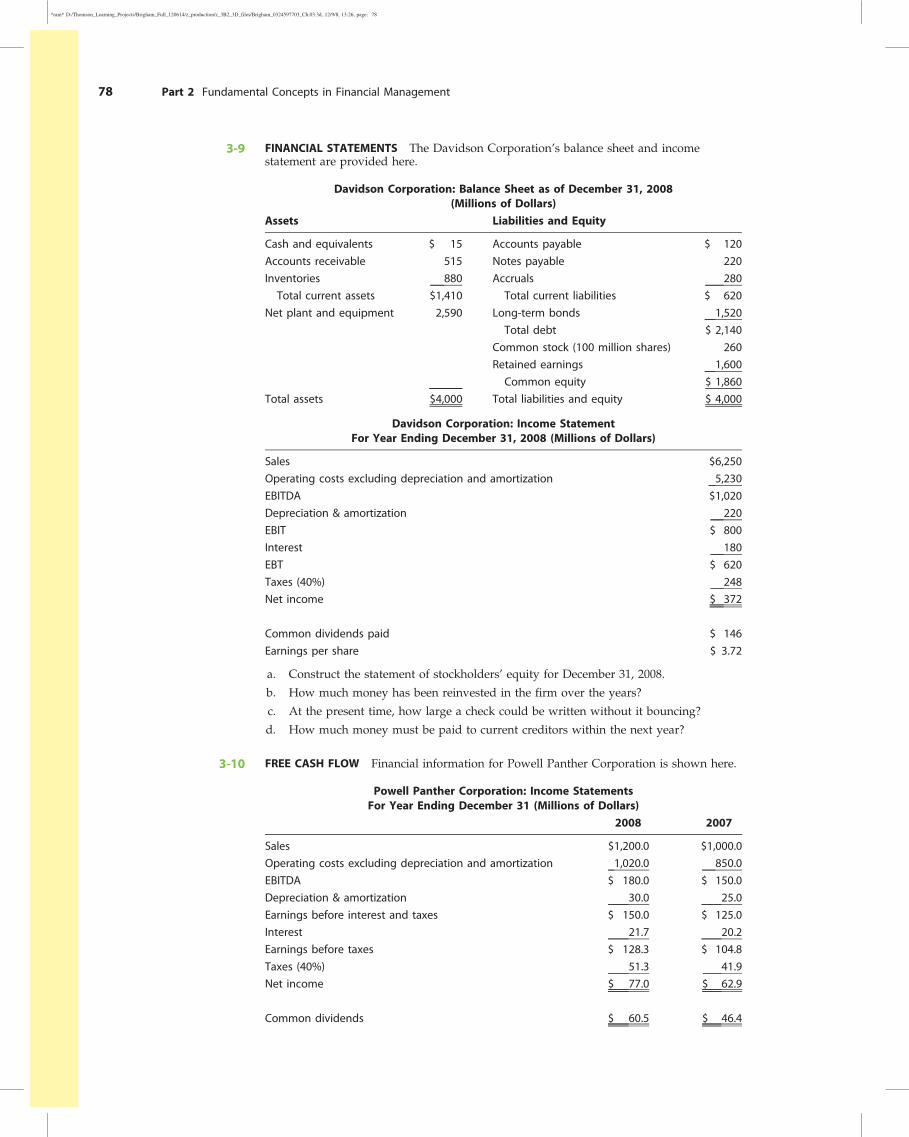
*ram* D:/Thomson_Learning_Projects/Brigham_Full_120614/z_production/z_3B2_3D_files/Brigham_0324597703_Ch.03.3d, 12/9/8, 13:26, page: 78
3-9 FINANCIAL STATEMENTS The Davidson Corporation’s balance sheet and incomestatement are provided here.
Davidson Corporation: Balance Sheet as of December 31, 2008(Millions of Dollars)
Assets Liabilities and Equity
Cash and equivalents $ 15 Accounts payable $ 120
Accounts receivable 515 Notes payable 220
Inventories 880 Accruals 280
Total current assets $1,410 Total current liabilities $ 620
Net plant and equipment 2,590 Long-term bonds 1,520
Total debt $ 2,140
Common stock (100 million shares) 260
Retained earnings 1,600
Common equity $ 1,860
Total assets $4,000 Total liabilities and equity $ 4,000
Davidson Corporation: Income StatementFor Year Ending December 31, 2008 (Millions of Dollars)
Sales $6,250
Operating costs excluding depreciation and amortization 5,230
EBITDA $1,020
Depreciation & amortization 220
EBIT $ 800
Interest 180
EBT $ 620
Taxes (40%) 248
Net income $ 372
Common dividends paid $ 146
Earnings per share $ 3.72
a. Construct the statement of stockholders’ equity for December 31, 2008.
b. How much money has been reinvested in the firm over the years?
c. At the present time, how large a check could be written without it bouncing?
d. How much money must be paid to current creditors within the next year?
3-10 FREE CASH FLOW Financial information for Powell Panther Corporation is shown here.
Powell Panther Corporation: Income StatementsFor Year Ending December 31 (Millions of Dollars)
2008 2007
Sales $1,200.0 $1,000.0
Operating costs excluding depreciation and amortization 1,020.0 850.0
EBITDA $ 180.0 $ 150.0
Depreciation & amortization 30.0 25.0
Earnings before interest and taxes $ 150.0 $ 125.0
Interest 21.7 20.2
Earnings before taxes $ 128.3 $ 104.8
Taxes (40%) 51.3 41.9
Net income $ 77.0 $ 62.9
Common dividends $ 60.5 $ 46.4
78 Part 2 Fundamental Concepts in Financial Management
Cengage Learning

*ram* D:/Thomson_Learning_Projects/Brigham_Full_120614/z_production/z_3B2_3D_files/Brigham_0324597703_Ch.03.3d, 12/9/8, 13:26, page: 79
Powell Panther Corporation: Balance Sheets as of December 31 (Millions of Dollars)
2008 2007
Assets
Cash and equivalents $ 12.0 $ 10.0
Accounts receivable 180.0 150.0
Inventories 180.0 200.0
Total current assets $372.0 $360.0
Net plant and equipment 300.0 250.0
Total assets $672.0 $610.0
Liabilities and Equity
Accounts payable $108.0 $ 90.0
Notes payable 67.0 51.5
Accruals 72.0 60.0
Total current liabilities $247.0 $201.5
Long-term bonds 150.0 150.0
Total debt $397.0 $351.5
Common stock (50 million shares) 50.0 50.0
Retained earnings 225.0 208.5
Common equity $275.0 $258.5
Total liabilities and equity $672.0 $610.0
a. What was net working capital for 2007 and 2008?
b. What was the 2008 free cash flow?
c. How would you explain the large increase in 2008 dividends?
COMPREHENSIVE/SPREADSHEET PROBLEM
3-11 FINANCIAL STATEMENTS, CASH FLOW, AND TAXES Laiho Industries’ 2007 and 2008balance sheets (in thousands of dollars) are shown.
2008 2007
Cash $102,850 $ 89,725
Accounts receivable 103,365 85,527
Inventories 38,444 34,982
Total current assets $244,659 $210,234
Net fixed assets 67,165 42,436
Total assets $311,824 $252,670
Accounts payable $ 30,761 $ 23,109
Accruals 30,477 22,656
Notes payable 16,717 14,217
Total current liabilities $ 77,955 $ 59,982
Long-term debt 76,264 63,914
Total liabilities $154,219 $123,896
Common stock 100,000 90,000
Retained earnings 57,605 38,774
Total common equity $157,605 $128,774
Total liabilities and equity $311,824 $252,670
a. Sales for 2008 were $455,150,000, and EBITDA was 15% of sales. Furthermore,depreciation and amortization were 11% of net fixed assets, interest was $8,575,000, thecorporate tax rate was 40%, and Laiho pays 40% of its net income in dividends. Giventhis information, construct the firm’s 2008 income statement.
Chapter 3 Financial Statements, Cash Flow, and Taxes 79
Cengage Learning
*ram* D:/Thomson_Learning_Projects/Brigham_Full_120614/z_production/z_3B2_3D_files/Brigham_0324597703_Ch.03.3d, 12/9/8, 13:26, page: 80
b. Construct the statement of stockholders’ equity for the year ending December 31, 2008,and the 2008 statement of cash flows.
c. Calculate 2007 and 2008 net working capital and 2008 free cash flow.
d. If Laiho increased its dividend payout ratio, what effect would this have on corporatetaxes paid? What effect would this have on taxes paid by the company’s shareholders?
INTEGRATED CASED’LEON INC., PART I
3-1 FINANCIAL STATEMENTS AND TAXES Donna Jamison, a 2003 graduate of the University of Florida with 4 years ofbanking experience, was recently brought in as assistant to the chairperson of the board of D’Leon Inc., a small foodproducer that operates in north Florida and whose specialty is high-quality pecan and other nut products sold in thesnack foods market. D’Leon’s president, Al Watkins, decided in 2007 to undertake a major expansion and to “gonational” in competition with Frito-Lay, Eagle, and other major snack foods companies. Watkins believed thatD’Leon’s products were of higher quality than the competition’s; that this quality differential would enable it tocharge a premium price; and that the end result would be greatly increased sales, profits, and stock price.
The company doubled its plant capacity, opened new sales offices outside its home territory, and launched anexpensive advertising campaign. D’Leon’s results were not satisfactory, to put it mildly. Its board of directors, whichconsisted of its president, vice president, and major stockholders (who were all local businesspeople), was mostupset when directors learned how the expansion was going. Unhappy suppliers were being paid late; and the bankwas complaining about the deteriorating situation, threatening to cut off credit. As a result, Watkins was informedthat changes would have to be made—and quickly; otherwise, he would be fired. Also, at the board’s insistence,Donna Jamison was brought in and given the job of assistant to Fred Campo, a retired banker who was D’Leon’schairperson and largest stockholder. Campo agreed to give up a few of his golfing days and help nurse the companyback to health, with Jamison’s help.
Jamison began by gathering the financial statements and other data given in Tables IC 3-1, IC 3-2, IC 3-3,and IC 3-4. Assume that you are Jamison’s assistant. You must help her answer the following questions forCampo. (Note: We will continue with this case in Chapter 4, and you will feel more comfortable with the analysisthere. But answering these questions will help prepare you for Chapter 4. Provide clear explanations.)a. What effect did the expansion have on sales, after-tax operating income, net working capital (NWC), and net
income?
b. What effect did the company’s expansion have on its free cash flow?
c. D’Leon purchases materials on 30-day terms, meaning that it is supposed to pay for purchases within30 days of receipt. Judging from its 2008 balance sheet, do you think that D’Leon pays suppliers on time?Explain, including what problems might occur if suppliers are not paid in a timely manner.
d. D’Leon spends money for labor, materials, and fixed assets (depreciation) to make products—and spendsstill more money to sell those products. Then the firm makes sales that result in receivables, which eventuallyresult in cash inflows. Does it appear that D’Leon’s sales price exceeds its costs per unit sold? How does thisaffect the cash balance?
e. Suppose D’Leon’s sales manager told the sales staff to start offering 60-day credit terms rather than the30-day terms now being offered. D’Leon’s competitors react by offering similar terms, so sales remainconstant. What effect would this have on the cash account? How would the cash account be affected ifsales doubled as a result of the credit policy change?
f. Can you imagine a situation in which the sales price exceeds the cost of producing and selling a unit ofoutput, yet a dramatic increase in sales volume causes the cash balance to decline? Explain.
g. Did D’Leon finance its expansion program with internally generated funds (additions to retained earningsplus depreciation) or with external capital? How does the choice of financing affect the company’s financialstrength?
h. Refer to Tables IC 3-2 and IC 3-4. Suppose D’Leon broke even in 2008 in the sense that sales revenuesequaled total operating costs plus interest charges. Would the asset expansion have caused the company toexperience a cash shortage that required it to raise external capital? Explain.
i. If D’Leon starts depreciating fixed assets over 7 years rather than 10 years, would that affect (1) the physicalstock of assets, (2) the balance sheet account for fixed assets, (3) the company’s reported net income, and (4)the company’s cash position? Assume that the same depreciation method is used for stockholder reportingand for tax calculations and that the accounting change has no effect on assets’ physical lives.
j. Explain how earnings per share, dividends per share, and book value per share are calculated and what theymean. Why does the market price per share not equal the book value per share?
k. Explain briefly the tax treatment of (1) interest and dividends paid, (2) interest earned and dividendsreceived, (3) capital gains, and (4) tax loss carry-back and carry-forward. How might each of these itemsaffect D’Leon’s taxes?
3-2
80 Part 2 Fundamental Concepts in Financial Management
Cengage Learning
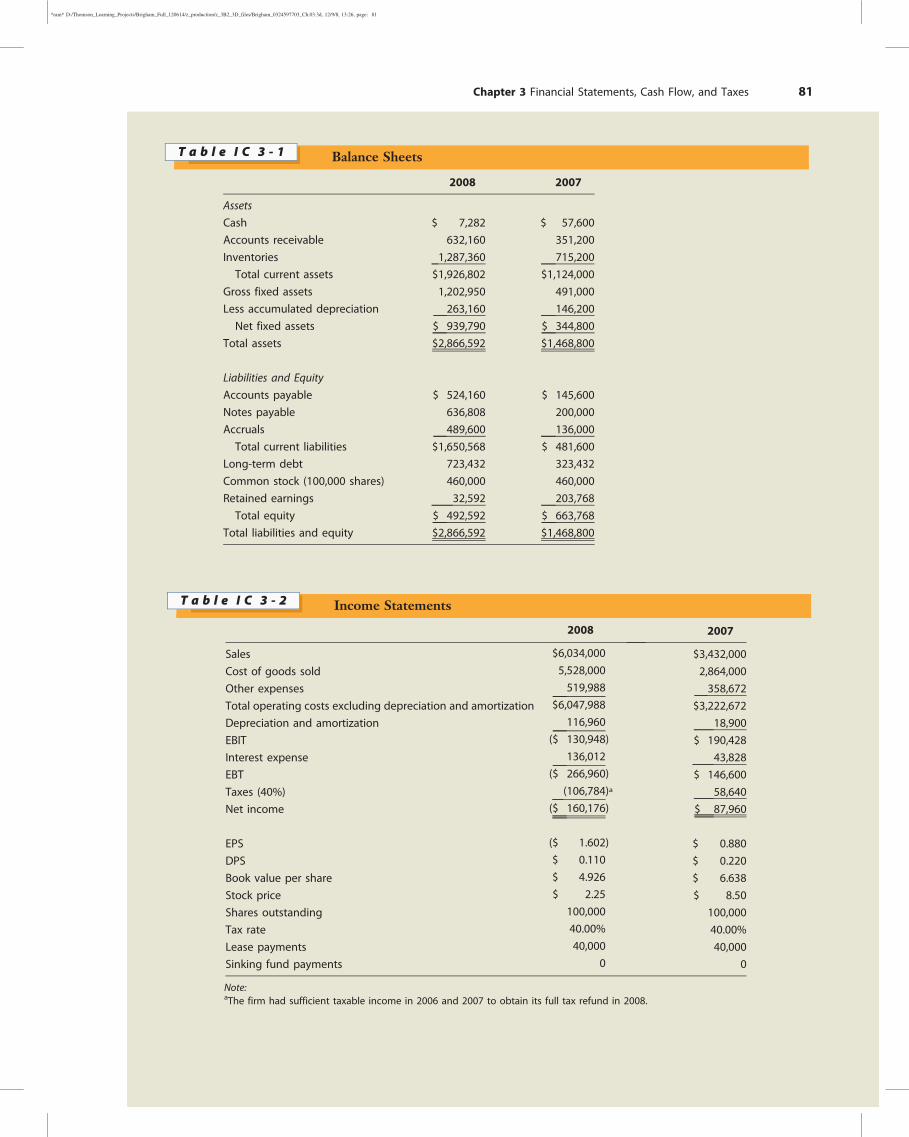
*ram* D:/Thomson_Learning_Projects/Brigham_Full_120614/z_production/z_3B2_3D_files/Brigham_0324597703_Ch.03.3d, 12/9/8, 13:26, page: 81
Balance SheetsT a b l e I C 3 - 1
2008 2007
Assets
Cash $ 7,282 $ 57,600
Accounts receivable 632,160 351,200
Inventories 1,287,360 715,200
Total current assets $1,926,802 $1,124,000
Gross fixed assets 1,202,950 491,000
Less accumulated depreciation 263,160 146,200
Net fixed assets $ 939,790 $ 344,800
Total assets $2,866,592 $1,468,800
Liabilities and Equity
Accounts payable $ 524,160 $ 145,600
Notes payable 636,808 200,000
Accruals 489,600 136,000
Total current liabilities $1,650,568 $ 481,600
Long-term debt 723,432 323,432
Common stock (100,000 shares) 460,000 460,000
Retained earnings 32,592 203,768
Total equity $ 492,592 $ 663,768
Total liabilities and equity $2,866,592 $1,468,800
Income StatementsT a b l e I C 3 - 2
2008 2007
Sales $6,034,000 $3,432,000
Cost of goods sold 5,528,000 2,864,000
Other expenses 519,988 358,672
Total operating costs excluding depreciation and amortization $6,047,988 $3,222,672
Depreciation and amortization 116,960 18,900
EBIT ($ 130,948) $ 190,428
Interest expense 136,012 43,828
EBT ($ 266,960) $ 146,600
Taxes (40%) (106,784)a 58,640
Net income ($ 160,176) $ 87,960
EPS ($ 1.602) $ 0.880
DPS $ 0.110 $ 0.220
Book value per share $ 4.926 $ 6.638
Stock price $ 2.25 $ 8.50
Shares outstanding 100,000 100,000
Tax rate 40.00% 40.00%
Lease payments 40,000 40,000
Sinking fund payments 0 0
Note:aThe firm had sufficient taxable income in 2006 and 2007 to obtain its full tax refund in 2008.
Chapter 3 Financial Statements, Cash Flow, and Taxes 81
Cengage Learning

*ram* D:/Thomson_Learning_Projects/Brigham_Full_120614/z_production/z_3B2_3D_files/Brigham_0324597703_Ch.03.3d, 12/9/8, 13:26, page: 82
Statement of Cash Flows, 2008T a b l e I C 3 - 4
Operating Activities
Net income ($160,176)
Depreciation and amortization 116,960
Increase in accounts payable 378,560
Increase in accruals 353,600
Increase in accounts receivable (280,960)
Increase in inventories (572,160)
Net cash provided by operating activities ($164,176)
Long-Term Investing ActivitiesAdditions to property, plant, and equipment ($711,950)
Net cash used in investing activities ($711,950)
Financing ActivitiesIncrease in notes payable $436,808
Increase in long-term debt 400,000
Payment of cash dividends (11,000)
Net cash provided by financing activities $825,808
SummaryNet decrease in cash ($ 50,318)
Cash at beginning of year 57,600
Cash at end of year $ 7,282
Statement of Stockholders’ Equity, 2008T a b l e I C 3 - 3
COMMON STOCKRetainedEarnings
TotalStockholders’
EquityShares Amount
Balances, 12/31/07 100,000 $460,000 $ 203,768 $663,7682008 Net Income (160,176)
Cash Dividends (11,000)
Addition (Subtraction)
to Retained Earnings (171,176) (171,176)
Balances, 12/31/08 100,000 $460,000 $ 32,592 $492,592
82 Part 2 Fundamental Concepts in Financial Management
Cengage Learning
*vijay* D:/Thomson_Learning_Projects/Brigham_Full_120614/z_production/z_3B2_3D_files/PIE/Brigham_0324597703_Ch.03.3d, 12/16/8, 14:58, page: 83
Use the Thomson ONE—Business School Edition online database to answer this chapter’s questions.
Exploring Starbucks’ Financial Statements
Over the past decade, Starbucks coffee shops have become an increasingly familiar part of the urbanlandscape. Currently (2008), the company operates more than 8,000 coffee shops in all 50 states, in theDistrict of Columbia, and in international markets; and in 2008, it had approximately 145,000 employees.
Thomson ONE can access a wealth of financial information for companies such as Starbucks. To findsome background information, begin by entering the company’s ticker symbol, SBUX, and then selecting“GO.” On the opening screen, you will see a great deal of useful information, including a summary ofwhat Starbucks does, a chart of its recent stock price, EPS estimates, recent news stories, and a list of keyfinancial data and ratios.
In researching a company’s operating performance, a good place to start is the recent stock priceperformance. At the top of the Stock Price Chart, click on the section labeled “Interactive Chart.” Fromthis point, you can obtain a chart of the company’s stock price performance relative to the overall market(as measured by the S&P 500) between 1998 and 2008. To obtain a 10-year chart, go to “Time Frame,”click on the down arrow, and select “10 years.” Then click on “Draw”; a 10-year price chart shouldappear.
As you can see, Starbucks has had its ups and downs. But the company’s overall performance hasbeen quite strong, and it has beaten the overall market handily.
You can also find Starbucks’ recent financial statements. Click on Financials to find the company’sannual balance sheets for the past 5 years. Selecting Thomson Financials provides balance sheets, incomestatements, and statements of cash flows for various time periods. Clicking on the Microsoft Excel icondownloads these statements directly to a spreadsheet.
Discussion Questions1. Looking at the most recent year available, what is the amount of total assets on Starbucks’ balance sheet? What
percentage is fixed assets, such as plant and equipment? What percentage is current assets? How much has thecompany grown over the years that are shown?
2. Does Starbucks have very much long-term debt? What are the chief ways in which Starbucks has financedassets?
3. Looking at the statement of cash flows, what factors can explain the change in the company’s cash positionover the last couple of years?
4. Looking at the income statement, what are the company’s most recent sales and net income? Over the pastseveral years, what has been the sales growth rate? What has been the growth rate in net income?
5. Over the past few years, has there been a strong correlation between stock price performance and reportedearnings? Explain.
Chapter 3 Financial Statements, Cash Flow, and Taxes 83
Cengage Learning