brighttalk online events insightsgo.brighttalk.com/rs/brighttalk/images/brighttalk_2009...
TRANSCRIPT

BrightTALK™
Online Events Insights Extended Report

Introduction This year proved to be another banner year for online events. The industry, and BrightTALK specifically, saw strong month-on-month growth in audience development, event registrations and viewings. As 2010 approaches and marketers are evaluating their demand generation, awareness, and thought leadership strategies utilizing online events, this report provides a guide to the demographics of who is watching online events and how specific audiences can be targeted through online events. This report reviews data from over 1500 public events published on BrightTALK from January 2009 to November 2009.

Table of Contents
Introduction ................................................................................................................................ 2
Chapter 1 : Audience Growth & Distribution .......................................... 5
2009 Audience Growth ............................................................................................................ 5
Audience referrals .................................................................................................................... 9
Chapter 2 : Industry ................................................................................ 10
Audience by industry ............................................................................................................. 10
Chapter 3 : Company Size ...................................................................... 13
Audience by company size ................................................................................................... 13
Viewing by company size ...................................................................................................... 15
Chapter 4 : Seniority ............................................................................... 16
Audience by seniority ............................................................................................................ 16
Event registration by seniority .............................................................................................. 16
Viewing totals by seniority..................................................................................................... 18
Chapter 5 : Geography ........................................................................... 19
Audience by country .............................................................................................................. 19
US audience by time zone .................................................................................................... 20
Chapter 6 : Duration ............................................................................... 23
Total events by duration ........................................................................................................ 23
Chapter 7 : Day of Week ......................................................................... 27
Viewing by day of week ......................................................................................................... 27
Day of week by seniority ....................................................................................................... 28
C-level/Executive ................................................................................................................ 28
SVP/VP ................................................................................................................................ 28
Manager / Team Lead ....................................................................................................... 29
Day of week by Company Size ............................................................................................ 30
Company size: 1-10 ........................................................................................................... 30
Company size: 11-100 ...................................................................................................... 30
Company size: 101 – 250 ................................................................................................. 31
Company size: 251 – 500 ................................................................................................. 31
Company size: 501 – 1000 ............................................................................................... 32
Company size: 1001 – 2500 ............................................................................................. 32
Company size: 5000+ ........................................................................................................ 33

Day of week by industry ........................................................................................................ 34
Aerospace & Defense ........................................................................................................ 34
Agriculture and Agribusiness ............................................................................................ 34
Automotive........................................................................................................................... 35
Construction & Property .................................................................................................... 35
Diversified & Conglomerate .............................................................................................. 36
Education ............................................................................................................................. 36
Financial Services – Banking & Securities ..................................................................... 37
Financial Services – Insurance ........................................................................................ 38
Financial Services – Investment ...................................................................................... 38
Government – National ..................................................................................................... 39
Health Care, Medical, Pharma, & Biotech ...................................................................... 40
Manufacturing ..................................................................................................................... 41
Other..................................................................................................................................... 42
Professional Services – Consulting ................................................................................. 43
Professional Services – Other .......................................................................................... 44
Technology – Hardware & Equipment ............................................................................ 45
Technology – Software & Services ................................................................................. 46
Transportation & Distribution ............................................................................................ 47

Chapter 1 : Audience Growth & Distribution
2009 Audience Growth BrightTALK significantly grew its user base in 2009 by providing a destination for online events presented in both BrightTALK™ Summits, full day series of webcasts presented by leaders of industry specific business communities, and BrightTALK™ Channels, the places presenters go to present and send their audiences to view their presentations. As seen in the chart below, growth rate increase over the course of the year. Channel subscriptions also grew across the ecosystem as channel owners drove audience to their events using email, social media, and traditional marketing practices.
The above chart represents month-on-month audience growth in unique user IDs across the BrightTALK network.

Event Registration Growth Event registrations grew in a similar way to audience growth, but at an even faster rate in Q1 and Q2. One contributor to this for the BrightTALK network could be the offering of single sign-on, which enables users to become a member once and then register for multiple events without ever needing to provide registration information again. This feature assists marketers interested in using online events to generate demand, preference, and nurture opportunities in presenting multiple pieces of content to their audiences. Also, channel owners who have built an audience can now focus on having more of their subscribers return to their channels to watch additional content by registering with a single click.
The above chart is looking at unique event registrations by month.

Event viewing growth Event viewings also grew consistently in all areas over 2009 with on-demand viewings double live viewings. After a live event, the number of on-demand views consistently exceeds the number of live viewings within the first couple weeks following the event. In fact, the majority of the on-demand viewing occurs within 48 hours of the live event and up to 80% of on-demand viewing happens within the first week following the event. The automatic conversion of live events on BrightTALK to on-demand assets within a few minutes facilitates the rapid accumulation of on-demand viewing. This is a great advantage over those who record, then convert and self-host their on-demand content, which typically takes 2-3 days. Taking a couple of days to deliver the on-demand link to your viewers can cost you as much as 40% of your audience.
This chart looks at total viewings (combined live and on-demand) on a month-by-month basis and indicates the breakdown of the total by live and on-demand.

Audience by company size and seniority
The breakdown of the audience by company size and seniority reveals a variety of professionals educating themselves through online events. The chart below indicates that the tactical users represented in the categories of managers/team leads and others comprise a good percentage of the audience, which is logical considering the large number of these knowledge professionals. This crucial audience can act as your champions as they recommend services and even serve as decision makers. Although there is a significant number of these users at all company sizes, those from enterprise level companies with over 5000 employees have a particularly strong presence at online events. Across the other levels, there is a healthy breakdown of seniority at every size organization. Overall these findings indicate that it is possible to reach the entire organization with online events.
This chart represents the level of authority of users stacked by company size.

Audience referrals
Tracking how audiences find online events demonstrates that placing content within a collective marketplace of content builds audience. Referrals, which happen when registered subscribers browsing BrightTALK for additional content or finding embeds of channels on the web, constitute roughly 31% of online event audiences. The rest of the attendees find content on BrightTALK directly through links to individual events often promoted in emails and social media messages sent by channel owners. It also includes the marketing the BrightTALK team does for summits and other events hosted by BrightTALK including those on the BrightTALK™ Online Events Academy. The Academy receives about 12% of its audience from referrals on the network, meaning that more than 350 subscribers did not require specific effort to acquire. Other channels have received as much as 50% of their audience from referrals. Marketers can take advantage of this opportunity to increase audience through referrals by refining titles and cover slides to capture additional clicks from the network.
The above chart show the percentage of the audience generated by referrals from BrightTALK, that is registered subscribers searching BrightTALK for additional content.

Chapter 2 : Industry
Audience by industry
The breakdown of the audience by industry shows technology, specifically the software and services sector, leading the way at 16% of the audience. This makes sense as this industry has been on the cutting edge of online events for over the last 10 years. That gap, however, is narrowing as more industries continue to discover online events to be a cost effective way to reach their audience. In the second half of the year, the education, healthcare, and manufacturing industries grew in relation to the rest of the industries.
This chart shows the breakdown of audience by industry. The red “Other” section represents those who indicated that their industry did not fall into the specified categories. The purple “Others” section represents all of those from specified industries that are not shown individually on this chart.

Event registration by industry
Event registration by industry follows the breakdown of the audience for the most part with some notable differences. For example, financial services, specifically the banking and securities sector, swapped places with education. Professional services and legal registered more in comparison on to other industries. The investment sector of the financial services industry, showed more registration growth than the user base, moving up sixth spots in the event registration rankings by industry compared to the audience rankings by industry. Last, government emerges from the “other” category as one of the top 20 industries for registrations.
The above chart shows the relative number of event registrations by industry.

Viewing duration by industry
Viewing duration by industry also aligned with the audience distribution by industry. However, education accounts for a greater percentage of the duration of viewing, overtaking healthcare. The industry represents more of the user base, and while it shows fewer registrations than healthcare, it watches more content. The hardware and equipment sector of the technology industry also moved up a few spots. Although the investment sector of the financial services industry registers for more events, they drop back down to align with the user base in terms of viewing duration. The sector also watches more live content than on-demand, suggesting that if members of the sector do not attend a live event, they will be unlikely to view it.
This chart captures the breakdown on the duration of viewing time by industry.

Chapter 3 : Company Size
Audience by company size
All company sizes are represented in the online events audience. The large percentage of the audience coming from organizations with less than 100 employees reflects the large number of small companies in comparison to large companies. Yet, companies with more than 5000 employees also made a strong showing at 22% of the audience. No matter the size business you want to reach, small or large, you can do it with online events.
The above chart details the breakdown of the audience by company size.

Event registration by company size
Event registrations are distributed over the different company sizes similarly to the distribution of the user base. The only difference is that attendees from company sizes 11-100 and 5000+ register slightly less often than attendees from the other company sizes in comparison to the user base, but this is not significant.
This chart shows the distribution of event registrations over company size.

Viewing by company size
The sum of the total viewings as a percentage of the user base is evenly distributed over company size. In other words, regardless of the size of the company, there is no disconnect between those subscribing, registering, and their viewing patterns. This also holds true for total duration by company size and viewing by day of week based on company size, and there were no real patterns that suggested any drop-off in the viewing based on the size of the user base.
The above chart reviews total viewing as a percentage of the user base over company size.

Chapter 4 : Seniority
Audience by seniority
A variety of levels of seniority is represented in the online events audience with managers/team leads constituting the largest percentage of the audience. The number of C-level/executives over doubles the number of SVP/VPs, so percentage of audience did not correlate to authority. This finding also suggests that there may be a better chance of reaching a C-level executive than a VP in an online event, but SVP/VP still represents a substantial part of the audience. Furthermore, it is equally likely for all levels that they will view the content for which they register either live or on-demand.
This chart shows the distribution of the audience by seniority.
Event registration by seniority

Similar to company size, the distribution of event registration over seniority is aligned with the user base. The „other‟ category takes .5% from both the C-level and VPs, but this is not significant. This is also a good indicator that there is not a drop off rate by seniority.
The chart above shows the distribution of event registration by seniority.

Viewing totals by seniority
Viewing totals by seniority also remains in line with the user base. When users subscribe and register for events, it is equally likely for all levels that they will view the content either live or on-demand. Online offers a convenient opportunity to reach your audience with your content.
The above chart presents the percentage of total viewing by seniority.

Chapter 5 : Geography
Audience by country
The English-speaking countries comprise the largest percentage of the audience, with the US, UK, India and Canada leading the way. Several other European countries and China also makes the list, but don‟t constitute as large percentage of the audience, which may be a reflection of the current lack of local language events. This suggests a huge opportunity to reach this audience if you are able to offer your events in local languages. In fact, Intel offered local language content to this market for a product launch and it was a huge success. Local language should be considered in trying to reach specific geographic audiences.
This chart displays the distribution of the audience by country.

US audience by time zone
Consideration of the time zone of your target audience can help you select the time of day to host your events. The distribution of the audience by time zone in the US, for example, shows that the East Coast constitutes nearly half of the US audience – more than Central and Pacific combined. This may be surprising because just 5 years ago the further east you looked, the less familiar the audience was with the idea of online events or online meetings and collaboration. The region may have been slow to adopt the technology, but it is not slow to consume content. The Central region has been pulling even with Pacific Time Zone in the last six month. This indicates a growing opportunity in this region for regional marketers with a keen eye on generating demand. The distribution of US registrations and viewings by time zone reflects the distribution of the audience.
The above chart shows the distribution of the US audience by time zone.

US registrations by time zone
Event registrations in the US by time zone reflect the distribution of the audience. This is another comforting figure as growth in new regions has not led to drop-off.
The above chart reviews event registrations in the United States distributed over time zone.

Viewings by time zone
Last, we looked at the top time zones for total viewings. At the US level, it was not much different than the makeup of audience and registrations. However, at a global level the GMT time zone constituted a larger percentage of viewing than either the Pacific or the Central Time Zones. That could reflect the UK roots of BrightTALK, which was founded in London, but also the high quality of events being produced in the UK.
This chart captures the distribution of viewings across the top time zones.

Chapter 6 : Duration
Total events by duration
Events are usually scheduled in standard 15 minute durations ranging from 15 to 120 minutes. Nearly 40% of events are set at the 45 minute length with 30 and 60 minutes bookending the majority and collectively accounting for 82% of all events. The scheduling of events at these times suggests that marketers believe the ideal length of an online event to be somewhere between 30 and 60 minutes.
The above chart illustrates the distribution of events by their scheduled duration.

Consumption by webcast duration
Although the majority of events are scheduled for between 30 and 60 minutes, longer events show a relative increase in the total amount they are consumed across all of the events compared to the shorter events. Events of the lengths 60, 75, 90 and 120 gained 9%, 6%, 8% and 4% respectively in consumption. These data points include the total live and on-demand viewings, so the number of times someone watches or comes back to watch events. The rise in consumption could be explained by people returning to watch longer events.
This chart shows the total consumption of the webcasts distributed over the scheduled
duration of the webcast.

Average viewing by duration
Longer events are also viewed for a longer amount of time on average with the average duration an event is viewed positively correlating with scheduled duration. It makes sense that the longer the event the more time that it is consumed. It might also be the case that longer events are packed with so much good information that they attract repeat viewings. Another benefit of longer events is that they offer the opportunity to generate additional content assets.
The above chart captures the average viewing for a webcast of a given duration.

Average rating by duration
Regardless of the number of events ran at each of these durations, ratings overall express audience satisfaction with the content and/or experience. The average webcast rating is 4.1 out of 5 stars.
The above chart shows the average rating for each scheduled duration.

Chapter 7 : Day of Week
Viewing by day of week
Viewing by day of week offers a key indicator of audience engagement. Many people schedule their events on Tuesday, Wednesday and Thursday, so it is not surprising that the highest consumption of online events is during those three days for both live and recorded. There is, however, a considerable amount of recorded viewings on Monday and Friday. Monday, in particular, is almost as popular as any other day of the week for on-demand viewing though there are few live viewings. This indicates that there is an opportunity on both Monday and Friday to host live events, moving away from the competitive middle of the week days of Tuesday through Thursday because the audience is clearly willing to view content on those days. Furthermore, there is an incredible opportunity to market on-demand content on Monday and Friday or even on the weekend. People in every industry, every size company, and every level of authority have viewed recorded content on the weekend.
The above chart shows the overall viewing data by day of week for both live and recorded online events. The following charts show you the breakdown of the audience by day of week for seniority, company size, industry and US state. You can use this report as a handbook for planning online events in 2010 to reach your target audience.

Day of week by seniority
C-level/Executive
SVP/VP

Director
Manager / Team Lead

Day of week by Company Size
Company size: 1-10
Company size: 11-100

Company size: 101 – 250
Company size: 251 – 500

Company size: 501 – 1000
Company size: 1001 – 2500

Company size 2501 – 4999
Company size: 5000+

Day of week by industry
Aerospace & Defense
Agriculture and Agribusiness

Automotive
Construction & Property

Diversified & Conglomerate
Education

Energy, Chemical, & Utilities
Financial Services – Banking & Securities

Financial Services – Insurance
Financial Services – Investment

Financial Services – Other
Government – National

Government – State, Local & Other
Health Care, Medical, Pharma, & Biotech
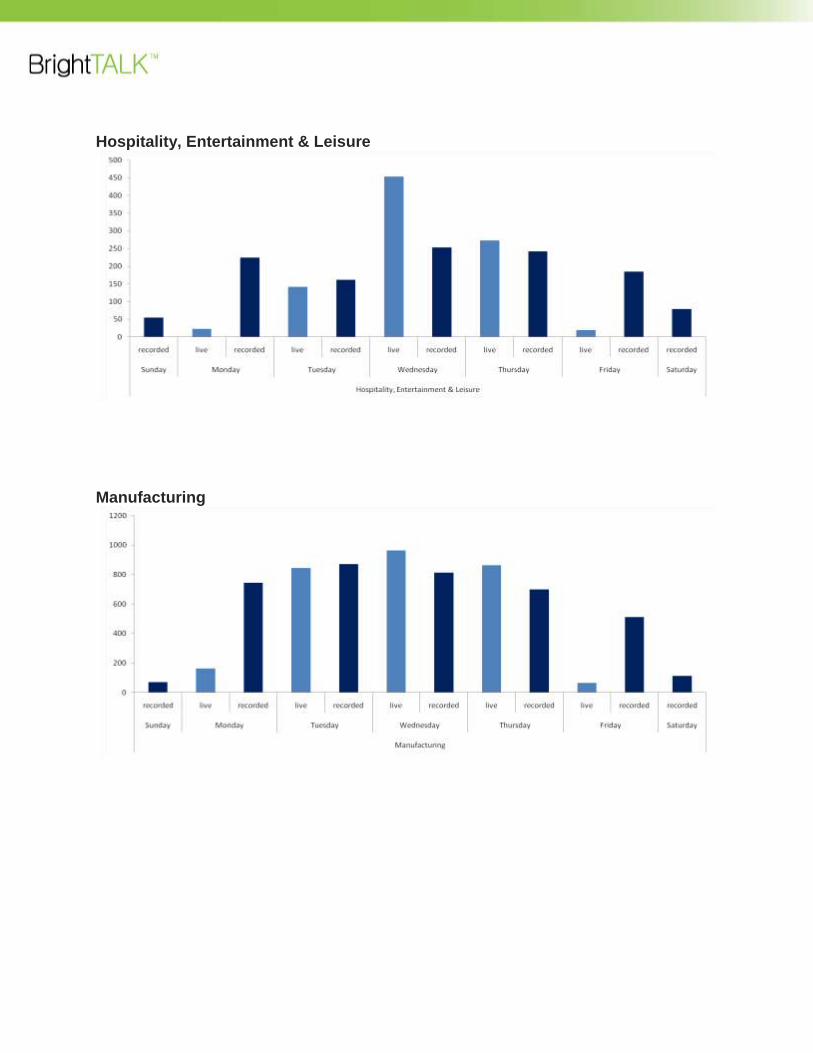
Hospitality, Entertainment & Leisure
Manufacturing
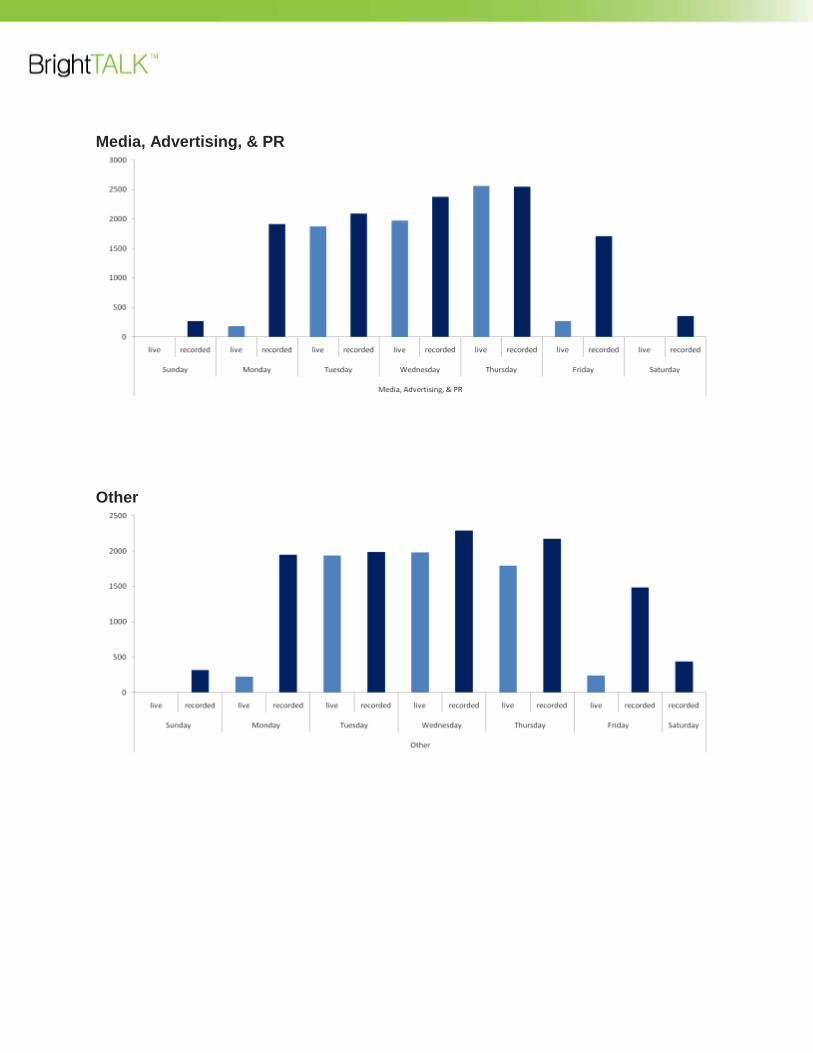
Media, Advertising, & PR
Other

Professional Services – Accounting
Professional Services – Consulting

Professional Services – Legal
Professional Services – Other

Retail
Technology – Hardware & Equipment

Technology – Other
Technology – Software & Services

Telecommunications
Transportation & Distribution