bringing ecosystem services into economic decision-making: land
TRANSCRIPT

Bringing Ecosystem Services intoEconomic Decision-Making: LandUse in the United KingdomIan J. Bateman,1* Amii R. Harwood,1 Georgina M. Mace,2 Robert T. Watson,3 David J. Abson,4,5
Barnaby Andrews,1 Amy Binner,1 Andrew Crowe,6 Brett H. Day,1 Steve Dugdale,1 Carlo Fezzi,1
Jo Foden,7 David Hadley,1,8 Roy Haines-Young,9 Mark Hulme,10 Andreas Kontoleon,11
Andrew A. Lovett,1 Paul Munday,1 Unai Pascual,11,12 James Paterson,13 Grischa Perino,1,14
Antara Sen,1 Gavin Siriwardena,10 Daan van Soest,15 Mette Termansen16
Landscapes generate a wide range of valuable ecosystem services, yet land-use decisions often ignore thevalue of these services. Using the example of the United Kingdom, we show the significance of land-usechange not only for agricultural production but also for emissions and sequestration of greenhouse gases,open-access recreational visits, urban green space, and wild-species diversity. We use spatially explicitmodels in conjunction with valuation methods to estimate comparable economic values for these services,taking account of climate change impacts. We show that, although decisions that focus solely onagriculture reduce overall ecosystem service values, highly significant value increases can be obtainedfrom targeted planning by incorporating all potential services and their values and that this approach alsoconserves wild-species diversity.
TheMillennium EcosystemAssessment (1)provided important evidence of the ongoingglobal degradation of ecosystem services
and highlighted the need to incorporate their val-ue into the economic analyses that underpin real-world decision-making. Previous studies haveshown that the overall values of unconvertednatural habitats can exceed the private benefitsafter conversion (2, 3); that knowledge of land-scape heterogeneity and ecological processes cansupport cost-effective land planning (4–7); that
trade-offs in land-use decisions affect values fromecosystem services and biodiversity at the locallevel (8, 9); and that current land use is vulner-able to the impacts of global change (10, 11). Inthe UK National Ecosystem Assessment (NEA)(12), a comprehensive assessment of the UnitedKingdom’s ecosystems was linked to a system-atic environmental and economic analysis of thebenefits they generate. Here, we show how takingaccount of multiple objectives in a changing envi-ronment (including, but not restricted to, climate
change) fundamentally alters decisions regardingoptimal land use. The NEA analyses are based onhighly detailed, spatially referenced environmentaldata covering all of Great Britain. These data sup-ported the design and parameterization of modelsof both the drivers and consequences of land-usedecisions, by incorporating the complexity ofthe natural environment and its variation acrossspace and time (13). Model outputs provide inputs
RESEARCHARTICLE
1Centre for Social and Economic Research on the Global En-vironment (CSERGE), School of Environmental Sciences, Uni-versity of East Anglia (UEA), Norwich Research Park, Norwich,NR4 7TJ, UK. 2Department of Genetics, Ecology and Environ-ment, University College London, LondonWC1E6BT,UK. 3TyndallCentre, Department of Environmental Sciences, University of EastAnglia, Norwich Research Park, NR47TJ, UK andMonash Sustain-ability Institute, Monash University, Melbourne, Australia. 4FuturESResearch Center, LeuphanaUniversität Lüneburg, 21335 Lüneburg.Germany. 5School of Earth and Environment, University of Leeds,Leeds LS2 9JT, UK. 6The Food and Environment Research Agency,Department for Environment, Food and Rural Affairs, H.M. Gov-ernment, London SW1P 3JR, UK. 7Centre for Environment,Fisheries and Aquaculture Science (Cefas), Lowestoft, SuffolkNR33 0HT, UK. 8UNE Business School, University of New England,Armidale, New South Wales 2351, Australia. 9Centre for En-vironmental Management (CEM), School of Geography, Univer-sity of Nottingham, Nottingham NG7 2RD, UK. 10British Trustfor Ornithology, Thetford, Norfolk IP24 2PU, UK. 11Departmentof Land Economy, University of Cambridge, Cambridge CB39EP, UK. 12Basque Centre for Climate Change (BC3) andIKERBASQUE, Basque Foundation for Science, 48011 BilbaoBizkaia, Spain. 13School of Geosciences, University of Edinburgh,Edinburgh EH9 3JW, UK. 14School of Business, Economics andSocial Sciences, University of Hamburg,Welckerstrasse 8, 20354Hamburg, Germany. 15Department of Spatial Economics andInstitute for Environmental Studies (IVM), VUUniversity Amsterdam,1081 HV Amsterdam, and Department of Economics, Tilburg Uni-versity, 5037 AB Tilburg, Netherlands. 16Department of En-vironmental Science, Aarhus University, 8000 Aarhus, Denmark.
*Corresponding author. E-mail: [email protected]
Table 1. Summaryof the ecosystemservice relatedgoods considered in the analysis. [Metrics, data, modeling and valuation are fully documented in (13).]
Ecosystemservice–related good
Metrics(in year specified)
Main dataand sources
Model Valuation
Agriculturalproduction
Proportion and outputof land use in each2-km grid square
Land use, soils and physicalenvironment, climate,digital mapping, etc.(31–33)
Environmental-econometric regressionanalysis of land-use decisions asa function of the local physicalenvironment, prices, costsand policies, based on (34)
Market values (35)
Greenhousegases
Net metric tons of CO2,CH4, and N2O per2-km grid square
Land-use predictions,GHG responses (36–38)
Process models for CO2,CH4, and N2O; conversionto metric tons of CO2
equivalent (MTCO2Eq) basedon insulation factors
Official UK values perMTCO2Eq (39)
Recreation Visitors per2-km grid square
National survey of >40,000households, census (40, 41)
Regression model of visit countfrom outset to destination asa function of characteristicsof both locations, populationsocioeconomics, etc.
Meta-analysis of 300ecosystem-specificvaluation estimates
Urbangreen-spaceamenity
Distance to greenspace from each2-km grid square
Digital mappingcensus (32, 41)
Regression modellinking distance fromhouseholds to green-spacesites, their size and quality
Meta-analysis of priorliterature examiningchanges in value withrespect to distance
Wild bird–speciesdiversity
Wild bird diversity(20) per 2-kmgrid square
Breeding BirdSurvey (42)
Regression model linkingwild bird diversity to landuse and location.
Not valued; analysisuses the opportunitycost of avoiding declines
www.sciencemag.org SCIENCE VOL 341 5 JULY 2013 45
on
July
4, 2
013
ww
w.s
cien
cem
ag.o
rgD
ownl
oade
d fr
om

to economic analyses that assess the value of bothmarketed and nonmarketed goods (Table 1).
TheNEAspecifically addressed theconsequencesof land-use change driven by either agriculturalvalues only or a wider set of values, all within thecontext of ongoing climate change. To assess this,raw data on land use and its determinants weredrawn frommultiple sources to compile a 40-yeardata set, spatially disaggregated at a resolutionof 2-km grid squares (400 ha) or finer across all ofGreat Britain, forming more than one-half millionsets of spatially referenced, time-specific, land-userecords. Data on the determinants of that land usewere assembled frommultiple sources and includedthe physical environment (both spatially variablefactors, such as soil characteristics and slope, andspatio-temporal climate variables, such as growingseason temperature and precipitation); policy (bothagricultural and relevant environmental measures,including subsidies, taxes, and activity constraints);market forces (such as prices and costs); and tech-nology (reflected as changes in costs).
Land-Use ChangeLand use in the United Kingdom is dominated byagriculture, which accounts for some 18.3 millionhectares or 74.8% of the total surface area (14) andincludes not only cropland but also the majorityof grassland, mountain, moor, and heathland hab-itats. Agricultural land use was analyzed by usingintegrated environmental-economic models de-veloped to capture spatial and temporal variationin determinants (15). These models start fromthe premise that farmers seek to arrange landuse so as to maximize long-run profit, subjectto the physical-environmental, policy, and priceconditions they face in a given location and time(13). Evenwithin the relatively small area of GreatBritain, variation in environmental conditions issufficient to yield very substantial differencesin agricultural productivity and, hence, land use.These differences are captured by the model alongwith the variation due to other drivers; the mod-els are verified by using rigorous out-of-sample,actual-versus-predicted, testing (13).
The focus of the analysis concerned the con-sequences of alternative land-use futures up until2060. To assess this, information was needed re-garding how drivers of land-use change mightalter over that period. Some physical environ-ment factors can be treated as fixed (for example,soil type) but others, most notably climate change,vary temporally and spatially. For these, modeledoutputs of variables—such as growing seasontemperatures and precipitation (16)—were in-cluded in our land-use models. Certain marketdrivers were kept constant because of extremeuncertainties; for example, food prices may wellrise because of increased demand from higherpopulation and other pressures, but this may bemitigated by technological advance and behav-ioral change. Policy-induced changes—such asthe consequences of stronger or weaker environ-mental regulation on both agricultural and otherland—were addressed through an expert-based,deliberative process consistent with the Millen-nium Ecosystem Assessment (1). This processgenerated six plausible future scenarios, each de-scribed in terms of changes in regulations; thesewere either generally applied or spatially focused(Table 2). A rule-based approach was used to gen-erate probabilities for each land-cover transitionin each cell under each scenario [for example, trans-fers of landout of intensive agriculture to support theenhancement of areas of conservation importance,as per (17, 18)]. Resultant scenarios are summar-ized in Table 2 and discussed in detail in (13).
Response of Market-Priced Goods toLand-Use ChangeAn initial analysis demonstrates the outcome ofconventional land-use decision-making, whichemphasizes market values (for example, agricul-tural produce) and ignores nonmarket ecosystemservices. Maps of the change in the market valueof agricultural output from the present day (2010baseline) to 2060 under alternative climate changeand policy scenarios (ignoring any effects frominflation) are shown in Fig. 1. In the first scenario(Fig. 1A), low emissions from greenhouse gases
(GHGs) cause little climate change [taken from(16)] and have relatively little impact on farmingduring this period. However, relatively strongerenvironmental regulations are imposed (the NWscenario from Table 2) that restrict high-intensityfarming in many areas, which results in declines inmarket agricultural values across much of the coun-try. These relatively strong environmental regula-tions are maintained in the next scenario (Fig. 1B),but climate change now follows a high-emissionspath. Although climate change is expected to havemixed consequences for agriculture at a global scale(18, 19), comparison of Fig. 1A and 1B showsthat farming in the United Kingdom will largelybenefit from warmer temperatures. When the high-emission assumption is maintained (Fig. 1C), itweakens environmental regulations (the WM sce-nario). This allows land-use changes such as theconversion of some currently protected conser-vation areas into higher-intensity farming, whichresults in substantial further increases in agricul-tural production and corresponding market values.
In these scenarios, irrespective of climate changeprojections, if land-use decisions are based onmarket-priced goods alone, then a reduction in environ-mental regulations must always appear justified.Land-use change, however, alters not only market-priced agricultural outputs butmany other important(but typically nonmarket) ecosystem services aswell.
Response of Nonmarket Ecosystem Servicesto Land-Use ChangeThe analysis was extended to include the conse-quences of land-use change for GHG balance,open-access recreation, urban green space, andwild-species diversity [each modeled according toTable 1 and (13)]. Economic values were estimatedfor each of these additional impacts, with the ex-ception of wild-species diversity, which is difficultto measure accurately using standard economictools (15) and was accordingly assessed using adiversity index (13, 20).
Land-use change was then modeled for all sce-narios, by embracing a variety of combinations ofenvironmental regulation and climate change, with
Table 2. Summary of land-use change scenarios. [Details in (13).]
ScenarioEnvironmental regulation and
planning policy relative to currentSpatial focusing of changes
Go with the flow (GF) Similar: Policy and regulatory regime as today.Existing patterns of countryside protectionrelaxed only where economic priorities dominate.
Unfocused: Similar spatial constraints on land-usechange as today. No expansion of the protectedarea network.
Nature at work (NW) Stronger: Policy and planning emphasize multifunctionallandscapes and the need to maintain ecosystem function.
Focused: Greening of urban and peri-urban areasto enhance recreation values.
Green and pleasant land (GPL) Stronger: Agri-environmental schemes strengthenedwith expansion of stewardship and conservation areas.
Focused: Increased extent of existing conservation areas.Creation of functional ecological networks where possible.
Local stewardship (LS) Stronger: Agri-environmental schemes strengthenedwith expansion of stewardship and conservation areas.
Unfocused: No strong spatial component to changes butprotection of areas of national significance continues.
National security (NS) Weaker: Emphasis on increasing UK agricultural production.Environmental regulation and policy is weakened.
Unfocused: Some land-use conversion into woodlandoccurs in areas of lower agricultural values
World markets (WM) Weaker: Environmental regulation and policy areweakened unless they coincide with improvedagricultural production.
Focused: Losses of greenbelt to urban development,which results in loss of recreational values. Weakerprotection of designated sites and habitats.
5 JULY 2013 VOL 341 SCIENCE www.sciencemag.org46
RESEARCH ARTICLE
on
July
4, 2
013
ww
w.s
cien
cem
ag.o
rgD
ownl
oade
d fr
om

the consequences assessed for all market and non-market ecosystem services (including agriculturaloutputs) and their value or indices. Changes invalue from the 2010 baseline are shown in Fig. 2under either the weaker environmental regulationsof the WM scenario (top row of Fig. 2) or thestronger regulations of the NW scenario (bottomrow); high-emission climate change projectionswereassumed in both cases. Considering agriculturalvalues alone, results are (as per Fig. 1, B and C)that theweaker environmental regulations of theWMscenario yield higher market values. However, thenonmarket impacts of land-use change illustratedin the rest of Fig. 2 show that, across much of thecountry, strong environmental policies yield gainsin the value of ecosystem services resulting fromreduced GHG emissions and enhanced recreationand urban green space, as well as improvements inspecies diversity. Temporarily setting aside thenonmonetary wild bird–diversity index andsumming across all other values shows thatweaker (or stronger) environmental regulationslead to net losses (or gains) nationally; a resultthat reverses the restricted, market value assess-ment of Fig. 1. It is clear that considering marketprices alone can drive decisions for land use thatwould deprive society of many other benefitsfrom the environment and would risk leaving theUnited Kingdom worse, rather than better, off.
Benefits of Spatially Targeted Land-Use PlanningWhereas the two alternative futures shown inFig. 2 illustrate the importance of bringing eco-system services into decision-making rather thansimply relying on market values, these extremesignore the potential gains from working with thespatial and temporal heterogeneity of the naturalenvironment and the underpinning biophysicalprocesses. This variation makes it unlikely thatany single policy will be optimal everywhere (forexample, in Fig. 2 the generally superior NW pol-
icy still yields higher GHG emissions in north-western Britain than the generally inferior WMscenario), which suggests, instead, that a movetoward a spatially differentiated, targeted approachto decision-making will almost inevitably be better.
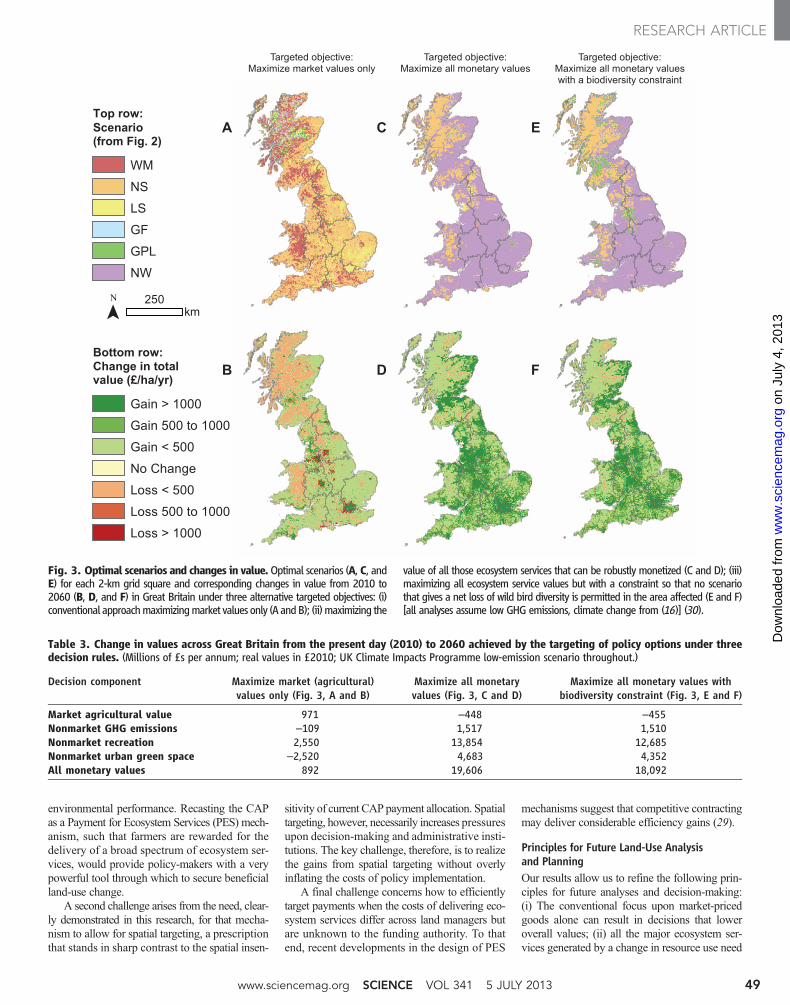
In order to examine the benefits of spatiallyexplicit decision-making, the outcomes of eachscenario were evaluated in each 2-km grid squareacross Great Britain, and the scenario that max-imized a given objective in that cell was identified(Fig. 3). Results showed that, although a conven-tional, market-dominated approach to decision-making chooses options to maximize agriculturalvalues (Fig. 3A), these policies will reduce over-all values (including those from other ecosystemservices) from the landscape in many parts of thecountry (Fig. 3B); notably in upland areas (whereagricultural intensification results in substantialnet emissions of GHG) and around major cities(where losses of greenbelt land lower recreationvalues). In comparison, an approach that considersall of those ecosystem services for which robusteconomic values can be estimated (Fig. 3C) yieldsnet benefits in almost all areas, with the largestgains in areas of high population (Fig. 3D).
To provide an idea of the scale of potentialgains, consider that our measure of agriculturalprofitability [technically, farm gross margins (21)]suggests returns to farming (including subsidies)ranging from £400/ha to in excess of £1000/ha,depending on location [see (22)]. Our analyses sug-gest that a targeted approach to land-use planningthat recognizes both market goods and nonmarketecosystem services would increase the net valueof land to society by 20% on average, with consid-erably higher increases arising in certain locations.
Decisions based on all ecosystem services forwhich robust economic values can be derived (Fig.3, C and D) are clearly better than those basedonly on a conventional pursuit of market pricedgoods (Fig. 3, A and B). However, this analysis
omits impacts that cannot be reliablymonetized, forexample, the effects onwild bird species diversity.We now incorporate ourmeasures of change inwildbird species diversity through the application of asimple constraint requiring that, in each area, anypolicy that resulted in a reduction in the species-diversity index was ruled out for that area (Fig. 3, Eand F). The similarity to Fig. 3, C and D, showsthat, when applied in a targeted manner, thisconstraint has relatively little impact upon whichscenario is best; that is, the “opportunity cost” (17)of imposing a species conservation constraint isrelativelyminor.Nevertheless, comparison of Fig. 3,C and E, shows that, in certain areas, the sustain-ability constraint causes a shift from scenario NW,which focuses on the enhancement of greenbeltareas for recreation, to scenario GPL, which focuseson extension of existing areas of conservation value.
National-Scale ImplicationsMonetary sums from the analyses of Fig. 3 areshown in Table 3. Even if we only consider ag-ricultural market values, then a targeted approachto maximizing these values (first column of re-sults) can yield a small gain in total values rela-tive to the present situation (a result that is notfeasible using single policies applied over all ofthe country, which highlights the inefficiency ofcurrent one-size-fits-all policies, evenwhen theyare only assessed in terms of market value). How-ever, a targeted approach to optimizing both mar-ket and nonmarket values yields a major increasein gains (second column of results). Furthermore,placing a targeted biodiversity constraint on thelatter approach only marginally reduces these gains(final column), which suggests both that such con-straints are a highly effective and efficient solu-tion to conserving wild-species diversity and thatland-use policies that increase GHG storage andrecreation values typically correlate with improve-ments in such diversity.
Fig. 1. Change from2010to 2060 in the marketvalue of United Kingdomagricultural productionunder various climate andpolicy scenarios. (A) Underlow-emissions climate projec-tions [from (16)] and strongenvironmental regulations(NWscenario furtherdescribedin Table 1), environmental-ly important habitats areconserved and farm intensi-fication is restricted. (B) Un-der high-emissions climateprojections (16) with thepolicy scenario as in (A). (C)Emissions as in (B) but withweak environmental regu-lations (WM scenario seeTable 1). All values are ad-justed for inflation.
www.sciencemag.org SCIENCE VOL 341 5 JULY 2013 47
RESEARCH ARTICLE
on
July
4, 2
013
ww
w.s
cien
cem
ag.o
rgD
ownl
oade
d fr
om

Recreation values arising from these changesexceed those from agriculture (Table 3). Thisstriking difference does not imply that the totalvalue of recreation is greater than that of food. Itcomes about because economic analyses such asthis evaluate alternatives by focusing not on totalvalues but on the changes in value that these al-ternatives generate. In a highly developed coun-try such as the United Kingdom, where food isplentiful and cheap but opportunities for recrea-tional use of the natural environment are some-what limited, it is not surprising that convertingsome comparatively small amount of land out ofagriculture and into open-access recreation yieldsa relatively modest loss in farm produce valuewhile at the same time generating a much biggervalue from increased recreation. This positivedisparity will be greater if (as in this analysis)such conversions are spatially targeted so as tomaximize net benefits (here, by ensuring suchland-use conversions occur near urban centerswhere resulting recreational gains can be huge).
However, as progressively more land is convertedto recreation, the number of additional visits gen-erated will fall, whereas the agricultural loss ofeach conversion steadily mounts (explaining whyonly a limited area, typically near to cities, is con-verted to recreation). Obviously, such results wouldvary substantially if analyses were conducted invery different contexts, such as in less developedcountries where the value of changes in foodmaybe much higher relative to those for recreation.
From Potential to PracticeOur analysis shows that land-use decisions basedon market prices alone can reduce the overallvalue of the sum of agricultural and monetizableecosystem services at the national scale. Althoughthe economic values provided in Table 3 are sub-ject to certain assumptions (13), further work toelaborate significant underpinning processes—such as the effects of ecological, biodiversity, andother global change factors (23–25)—and to betterreflect links between economic valuation of eco-
system services and decisions seem unlikely to alterthis general conclusion. Indeed, if other servicessuch as water resources were added to the analysis,current national estimates of pollution costs (26)imply that the differences would be accentuated.
Although potential improvements in land-useplanningwould generate social gains sufficient tomore than compensate for any associated losses,a new direction for land-use decision-making doesnot come without implementation challenges. Afirst challenge concerns the mechanics of securingthe participation of land managers in deliveringland-use changes that are unlikely to be privatelybeneficial. In the United Kingdom, the obviousmechanism through which that goal could beachieved is reform of the European Union’s (EU’s)Common Agricultural Policy (CAP). Currently,CAP payments to UK farmers are in excess of£3 billion per annum (27) compared with a totalvalue of UK agriculture of only £5 billion perannum (28) with the vast majority of those pay-ments (70%) made without consideration of
Fig. 2. Spatial distribution of the changes in market and nonmarketecosystem service economic values and nonmonetary wild species–diversity assessments. These were measured as changes in Simpson’s Di-
versity Index (13, 20) induced by moving from the year 2010 baseline to theWM and NW scenarios for 2060 [all analyses assume high GHG emissionclimate-change projections from (16)] (30).
5 JULY 2013 VOL 341 SCIENCE www.sciencemag.org48
RESEARCH ARTICLE
on
July
4, 2
013
ww
w.s
cien
cem
ag.o
rgD
ownl
oade
d fr
om
environmental performance. Recasting the CAPas a Payment for Ecosystem Services (PES) mech-anism, such that farmers are rewarded for thedelivery of a broad spectrum of ecosystem ser-vices, would provide policy-makers with a verypowerful tool through which to secure beneficialland-use change.
A second challenge arises from the need, clear-ly demonstrated in this research, for that mecha-nism to allow for spatial targeting, a prescriptionthat stands in sharp contrast to the spatial insen-
sitivity of current CAPpayment allocation. Spatialtargeting, however, necessarily increases pressuresupon decision-making and administrative insti-tutions. The key challenge, therefore, is to realizethe gains from spatial targeting without overlyinflating the costs of policy implementation.
A final challenge concerns how to efficientlytarget payments when the costs of delivering eco-system services differ across land managers butare unknown to the funding authority. To thatend, recent developments in the design of PES
mechanisms suggest that competitive contractingmay deliver considerable efficiency gains (29).
Principles for Future Land-Use Analysisand PlanningOur results allow us to refine the following prin-ciples for future analyses and decision-making:(i) The conventional focus upon market-pricedgoods alone can result in decisions that loweroverall values; (ii) all the major ecosystem ser-vices generated by a change in resource use need
Fig. 3. Optimal scenarios and changes in value.Optimal scenarios (A, C, andE) for each 2-km grid square and corresponding changes in value from 2010 to2060 (B, D, and F) in Great Britain under three alternative targeted objectives: (i)conventional approachmaximizingmarket values only (A andB); (ii)maximizing the
value of all those ecosystem services that can be robustly monetized (C and D); (iii)maximizing all ecosystem service values but with a constraint so that no scenariothat gives a net loss of wild bird diversity is permitted in the area affected (E and F)[all analyses assume low GHG emissions, climate change from (16)] (30).
Table 3. Change in values across Great Britain from the present day (2010) to 2060 achieved by the targeting of policy options under threedecision rules. (Millions of £s per annum; real values in £2010; UK Climate Impacts Programme low-emission scenario throughout.)
Decision component Maximize market (agricultural)values only (Fig. 3, A and B)
Maximize all monetaryvalues (Fig. 3, C and D)
Maximize all monetary values withbiodiversity constraint (Fig. 3, E and F)
Market agricultural value 971 –448 –455Nonmarket GHG emissions –109 1,517 1,510Nonmarket recreation 2,550 13,854 12,685Nonmarket urban green space –2,520 4,683 4,352All monetary values 892 19,606 18,092
www.sciencemag.org SCIENCE VOL 341 5 JULY 2013 49
RESEARCH ARTICLE
on
July
4, 2
013
ww
w.s
cien
cem
ag.o
rgD
ownl
oade
d fr
om

to be assessed; (iii) that assessment must recog-nize spatial and temporal variation in ecosystemservices, as well as synergistic impacts such asthose arising between climate and land-use change;(iv) changes in ecosystem service flows shouldbe valued wherever robust economic values areavailable; (v) difficult-to-monetize impacts, suchas those on wild species, should be incorporatedthrough the imposition of sustainability constraints,which can then be satisfied in cost-effective ways;(vi) spatial targeting of policies can generate majorgains; and, perhaps most important, (vii) a rangeof substantial benefits to society can be realizedby bringing natural science and economic infor-mation together to inform environmental decision-making. Taken together, we hope that theseprinciples and their demonstration through thecase study illustrate the practical potential for na-tional, yet spatially sensitive, application of anapproach to decision-making that places eco-system services on a level playing field withmarket-priced goods and, thereby, contributes tothe sustainable use of Earth’s limited resources.
References and Notes1. Millennium Ecosystem Assessment, Ecosystems and Human
Well-Being: Synthesis (Island Press, Washington, DC, 2005).2. A. Balmford et al., Science 297, 950–953 (2002).3. H. Tallis, A. Guerry, G. C. Daily, in Encyclopedia of
Biodiversity, S. A. Levin, Ed. (Academic Press, Waltham,ed. 2, 2013), pp. 96–104.
4. E. B. Barbier et al., Science 319, 321–323 (2008).5. J. A. Foley et al., Nature 478, 337–342 (2011).6. R. Naidoo, T. H. Ricketts, PLoS Biol. 4, e360 (2006).7. E. Nelson et al., Front. Ecol. Environ 7, 4–11 (2009).8. J. H. Goldstein et al., Proc. Natl. Acad. Sci. U.S.A. 109,
7565–7570 (2012).9. S. Polasky, E. Nelson, D. Pennington, K. A. Johnson,
Environ. Resour. Econ. 48, 219–242 (2011).10. J. A. Foley et al., Science 309, 570–574 (2005).11. D. Schröter et al., Science 310, 1333–1337 (2005).12. NEA, UK National Ecosystem Assessment: Technical
Report [United Nations Environmental Programme–WorldConservation Monitoring Centre (UNEP-WCMC),Cambridge, 2011].
13. Supplementary materials are available on Science Online.14. Department for Environment, Food, and Rural Affairs
(Defra) (United Kingdom); Department of Agricultureand Rural Development (Northern Ireland); TheDepartment for Rural Affairs and Heritage, WelshAssembly Government; Rural and Environment Researchand Analysis Directorate, The Scottish Government,Agriculture in the United Kingdom 2011 (Office forNational Statistics, Newport, UK, 2011).
15. I. J. Bateman, G. M. Mace, C. Fezzi, G. AtkinsonK. Turner, Environ. Resour. Econ. 48, 177–218 (2011).
16. G. J. Jenkins et al., UK Climate Projection: Briefing Report(Met Office Hadley Centre, Exeter, UK, 2009).
17. J. H. Lawton et al., “Making space for nature: A reviewof England’s wildlife sites and ecological network: Reportto Defra” (Defra, London, 2010).
18. D. B. Lobell, W. Schlenker, J. Costa-Roberts, Science 333,616–620 (2011).
19. J. Schmidhuber, F. N. Tubiello, Proc. Natl. Acad. Sci. U.S.A.104, 19703–19708 (2007).
20. E. H. Simpson, Nature 163, 688 (1949).21. C. Fezzi, D. Rigby, I. J. Bateman, D. Hadley, P. Posen,
Agric. Econ. 39, 197–205 (2008).22. I. J. Bateman, A. A. Lovett, J. S. Brainard, Applied
Environmental Economics: A GIS Approach to Cost-BenefitAnalysis (Cambridge Univ. Press, Cambridge, 2003).
23. A. D. Barnosky et al., Nature 486, 52–58 (2012).24. B. J. Cardinale et al., Nature 486, 59–67 (2012).25. A. P. Kinzig et al., Science 334, 603–604 (2011).26. A. Moxey, “Agriculture and water quality: Monetary costs and
benefits across OECD countries” (OECD, Paris, 2012).27. Defra, CAP payments (Defra, London, 2013);
www.cap-payments.defra.gov.uk/Default.aspx.28. U.K. Agriculture, Economic trends (Living Countryside,
Peterfield, UK, 2013); www.ukagriculture.com/farming_today/economic_trends.cfm.
29. P. J. Ferraro, Ecol. Econ. 65, 810–821 (2008).30. Ordnance Survey data, Crown copyright and database
right 2013.31. Department for Environment Food and Rural Affairs,
“June agricultural census” (Edina, Manchester, 2010).32. Ordnance Survey, “Land-Form PANORAMA (Digital
Elevation Model)” (OS OpenData, Southampton, 2010);www.ordnancesurvey.co.uk/oswebsite/products/os-opendata.html.
33. M. Van Liedekerke, P. Panagos, ESDBv2 Raster Archive(European Commission and the European Soil BureauNetwork, Brussels, 2005).
34. C. Fezzi, I. J. Bateman, Am. J. Agric. Econ. 93,1168–1188 (2011).
35. C. Fezzi et al., Agric. Econ. 41, 123–134 (2010).36. R. Lal, Environ. Int. 30, 981–990 (2004).37. A. R. Mosier et al., Clim. Change 40, 39–80 (1998).38. P. Smith et al., Agric. Ecosyst. Environ. 118, 6–28
(2007).39. Department of Energy and Climate Change, “Guidance on
estimating carbon values beyond 2050: An interimapproach” (Department of Energy and Climate Change,London, 2009).
40. Natural England, “Monitor of engagement with thenatural environment” (Technical Report NECR050,Natural England, London, 2010).
41. Casweb, “UK Census” (UK Data Service Census Support,Mimas, 2001); http://casweb.mimas.ac.uk/.
42. K. Risely et al., The Breeding Bird Survey 2011(BTO Research Report 624, British Trust for Ornithology,Thetford, UK, 2011).
Acknowledgments: This work was funded by The UK-NEAand its Follow-On program [which are together supported bythe UK Defra; the devolved administrations of Scotland, Wales,and Northern Ireland; the Natural Environment ResearchCouncil (NERC) and the Economic and Social Research Council(ESRC)]; and the Social and Environmental EconomicResearch (SEER) project (ESRC Funder Ref: RES-060-25-0063).I.J.B. led the project with support from all authors; theanalysis was designed by I.J.B., A.R.H., G.M.M., and R.W.; C.F.,I.J.B., U.P., D.H., P.M., A.R.H., and A.S. undertook the farmland–use analysis; D.J.A., U.P., M.T., C.F., and I.J.B. undertookthe GHG analysis; A.S., A.R.H., I.J.B., A.C., J.F., and P.M.undertook the recreation analysis; G.P., B.A., A.K., and I.J.B.undertook the urban green space analysis; M.H., G.S., S.D.,and A.A.L. undertook the biodiversity analysis; R.H.-Y. and J.P.undertook the scenario-building exercise; A.R.H. undertookthe synthesis and targeting analysis with I.J.B., G.M.M., A.B.,B.H.D., and D.v.S.; I.J.B., A.R.H., and G.M.M. wrote thepaper with contributions from all authors. We are gratefulto P. Dasgupta and K.-G. Mäler for research advice. Wedeclare no conflict of interest. Data are included in thesupplementary materials available on Science Online.
Supplementary Materialswww.sciencemag.org/cgi/content/full/341/6141/45/DC1Supplementary TextFigs. S1 and S2Tables S1 to S15References (43–132)Data Table S1
20 December 2012; accepted 20 May 201310.1126/science.1234379
REPORTS
Signatures of Cool Gas Fueling aStar-Forming Galaxy at Redshift 2.3N. Bouché,1,2* M. T. Murphy,3 G. G. Kacprzak,3 C. Péroux,4 T. Contini,1,2
C. L. Martin,5 M. Dessauges-Zavadsky6
Galaxies are thought to be fed by the continuous accretion of intergalactic gas, but direct observationalevidence has been elusive. The accreted gas is expected to orbit about the galaxy’s halo, delivering notjust fuel for star formation but also angular momentum to the galaxy, leading to distinct kinematicsignatures. We report observations showing these distinct signatures near a typical distant star-forminggalaxy, where the gas is detected using a background quasar passing 26 kiloparsecs from the host. Ourobservations indicate that gas accretion plays a major role in galaxy growth because the estimatedaccretion rate is comparable to the star-formation rate.
At all epochs, galaxies have short gas de-pletion time scales (1, 2); to sustain theobserved levels of star formation over
many billions of years, galaxies must continu-ously replenish their gas reservoir with fresh gasaccreted from the vast amounts available in the
intergalactic medium. In numerical cosmologicalsimulations (3–5), the accretion phenomenon isoften referred to as “cold accretion” (6), and thisterm describes the mass regime where the ac-cretion is most efficient (7, 8). The cold accretedgas should orbit about the halo before falling in tobuild the central disk, delivering fuel for star for-mation and also angular momentum to shape theouter parts of the galaxy (9, 10). Thus, accreting
1CNRS/IRAP, 14 Avenue E. Belin, F-31400 Toulouse, France.2Université de Toulouse/UPS-OMP/IRAP, F-31400 Toulouse,France. 3Swinburne University of Technology, P.O. Box 218,Hawthorn, Victoria 3122, Australia. 4Aix Marseille Université,CNRS, LAM (Laboratoire d’Astrophysique de Marseille) UMR7326, 13388 Marseille, France. 5Department of Physics, Uni-versity of California, Santa Barbara, CA 93106, USA. 6Observ-atory of Geneva, 51 Chemin des Maillettes, CH-1290 Versoix,Switzerland.
*Corresponding author. E-mail: [email protected]
5 JULY 2013 VOL 341 SCIENCE www.sciencemag.org50
on
July
4, 2
013
ww
w.s
cien
cem
ag.o
rgD
ownl
oade
d fr
om