britain at the crossroads - tullett prebon...strategy insights | issue four 3 britain at the...
TRANSCRIPT

strategy insights | issue four
britain at the crossroadsthe case for fundamental change
Dr Tim Morgan Global Head of Research

strategy insights | issue four2
britain at the crossroads | the case for fundamental change‘It is possible to envisage a future in which the British population is subjected to ever-increasing taxation and charging to sustain an administrative superstructure which is increasingly coercive as well as unaffordably costly.’

strategy insights | issue four 3
britain at the crossroadsthe case for fundamental change
“The UK needs to modernise, and to commence a new ‘quest for national efficiency’”
contents
introduction an unreal debate
part one: the road to here
1 a golden inheritance?
2 the great experiment
part two: where is here?
3 money troubles
4 the way we live now
part three: the road out
5 limited options
6 practical choices
strategy insights | issue four
Note: In Issue Three, we said that our ‘Dangerous Exponentials’ core thesis would form the subject of Issue Four. However, because of the imminence of the UK general election, we have brought this report forward. ‘Dangerous Exponentials’ will now be the subject of Issue Five.

strategy insights | issue four
britain at the crossroads | the case for fundamental change

strategy insights | issue four 1
the case for fundamental change – summary
• With a general election looming, investors are being inundated with research, much of it suggesting appropriate investment strategies. Given our remit – which is to stimulate debate on matters of economic and financial significance, and to think outside the box – this report is different. We aim to probe some of the deeper and longer-term strands of the current UK situation.
• To this end, this report is divided into three parts. After an introductory discussion of some of the issues at stake, Part one takes a detailed look at how we got here, reviewing both recent and longer-term economic and political developments. Part two assesses the issues as they now stand, and the final section offers radical policy options going forward.
• Readers might regard much of this report as gloomy. It may certainly seem so to those unaware of the full scale of the problems with which the UK is beset. Our analysis is certainly intended to be hard-hitting, for four main reasons:
1. Much of the political debate is being conducted in an air of unreality, and seems to assume a freedom of manoeuvre (on issues such as the urgency of deficit reduction) which may not in fact exist.
2. The debate is essentially short-term in nature, so necessarily misses some of the longer-term trends (such as the growth of bureaucracy) which are critical to an understanding of the current situation and of the future imperatives.
3. Where the recent economic and fiscal crisis is concerned, the bill hasn’t turned up yet, and politicians are understandably loathe to reveal the full scale of the challenges confronting the United Kingdom.
4. It is only by grasping both the current situation and its historical precedents that we can frame practical new directions.
• The latter point is the most important. It is perhaps a simplification, but not much of one, to say that the best policy options for the future may lie in the flip-sides of the mistakes of the past and the weaknesses of the present.
• Our strategy is predicated on the belief that, after a decade of break-neck increases in public spending, the UK system of administration is ruinously over-expensive as well as absurdly complex. Huge savings could be achieved simply by (a) consolidating or scrapping many of the plethora of ‘agencies’ and
quangos that have proliferated over the last 20 years, and (b) reducing the complexity and cost of departmental administration to that of international best practice.
• In the final chapter, we explain how this could be done. We describe a route to achieving a sustainable (3%) deficit over five years, while at the same both reducing (slightly) the overall burden of taxation, and actually improving public service provision.
britain at the crossroads

strategy insights | issue four2
britain at the crossroads | the case for fundamental change
principal recommendations
• Recognise that Britain’s public services are over-expensive because they are over-managed. This over-management has arisen from (a) the fragmentation of services (such as the NHS) in the vain pursuit of quasi-competition, and (b) the proliferation of quangos and semi-autonomous ‘agencies’.
• Live within realistic revenues. The next Parliament should adopt a ‘self-denying ordinance’ which says that government must decide upon a realistic level of revenue and only then decide how this spending should be allocated.
• Reduce public spending by £80bn. Far from devastating public services, this would only cut outlays (currently £700bn) to
the real-terms level of 2007-08 (£615bn at 2010 values).
• A quest for national efficiency. Essential modernising steps include: - reconsolidating fragmented
public services
- reducing administrative costs to best-practice international levels
- dispensing with large numbers of quangos and semi-autonomous ‘agencies’
- capping the tax deductibility of interest expense
- abandoning the wasteful PFI process
- abolishing the failed tripartite regulatory system, with the banking oversight function restored to the Bank of England.
• Tackle the deficit, reduce taxation. Our calculations suggest that a real-terms cut of £80bn in public spending would, if achieved by 2015, reduce the deficit to 3% of GDP while enabling the overall tax burden to fall slightly, from 36% to 35% of GDP.
• Helping at the margin. If scope did indeed exist for some modest reductions in taxation, our preference would be to raise the basic tax allowance from the current £6,475 to the level of the minimum wage (about £10,200). Likewise, we would address the interface between benefits and work.
strategy insights | issue four2
Fig. 1: Outline financing projections
£bn 2008-09 2009-10 2010-11 2011-12 2012-13 2013-14 2014-5 vs 09-10
GDP £1,435 £1,409 £1,465 £1,520 £1,593 £1,672 £1,756
Revenue nominal £534 £508 £525 £541 £564 £588 £614
in 2010 £ £547 £508 £514 £522 £530 £538 £546 +£38.4
as % GDP 37.2% 36.1% 35.8% 35.6% 35.4% 35.2% 35.0%
Spending nominal £630 £674 £672 £667 £668 £668 £667
in 2010 £ £645 £674 £657 £643 £628 £611 £594 -£80.2
as % GDP 43.9% 47.8% 45.9% 43.9% 41.9% 40.0% 38.0%
Deficit nominal £96 £166 £147 £126 £104 £80 £53
in 2010 £ £98 £166 £144 £121 £98 £73 £48 -£118.6
as % GDP 6.7% 11.8% 10.0% 8.3% 6.5% 4.8% 3.0%

about this report
Economic slumps do not happen by accident. Fiscal crises are not ordained by a malignant economic deity. Though the immediate catalyst for the UK’s debt crunch was the global downturn triggered by US sub-prime, this merely crystallised the implications of a policy direction that, sooner or later, was always destined to hit the buffers anyway.
Events follow from policies, and the policies which have been followed in the UK for more than a decade have been fundamentally flawed. The country’s current straitened economic and fiscal circumstances are the logical outcome of these mistakes.
This report, which takes a radical view of the British malaise, explains this process. The basics of the UK’s self-chosen route to crisis are straightforward enough. ‘Light touch’ (for which read ‘negligent’) regulation of the financial system led to a totally unsustainable, and almost entirely illusory, economic ‘boom’. Far from recognising this, and responding accordingly, the government proclaimed an end to
‘boom and bust’. This was simply hubris. Much worse, public spending was allowed to rise dramatically, largely on the assumption that growth was both real and sustainable. As a result, the government is running an unprecedented deficit (of 12% of GDP) that far exceeds either the IMF crisis of the 1970s (7%) or the post-ERM squeeze (7.7%) of 1993-94.
When anyone calls for cuts in public spending, there are howls of protest, and grim warnings that slashing spending would inflict unacceptable damage on the public services that are required by a civilised society. This is bunkum. In 2009-10, the government spent £674bn. If this were reduced by £50bn, it would remain higher than the inflation-adjusted total for 2007-08, when the public services were hardly under-funded. Even a £100bn reduction would only take real spending back to the 2004-05 level.
In any case, the claim that big cuts would devastate front-line services is bogus. The reality is that the UK public sector is grotesquely over-managed, to the detriment not just of the national
finances but of the front-line workers and of the users of social services as well. For example, the Ministry of Defence spends 20% of its budget on administration while its foreign counterparts manage to get by on just 11%1. The situation in an NHS fragmented both by this government and by its predecessor is even worse. Examples of administrative profligacy abound.
This report proposes an alternative strategy. We advocate reducing the deficit to 3% of GDP by 2015 through radical overall of the public sector, culling quangos and slashing overheads. An important implication of this strategy would be that quality public services could be maintained at a level of taxation (35%) that would give Britain’s economy a real competitive edge. Any such strategy would, of course, provoke screams of protest from vested interests. Government should turn a deaf ear to such screams, and make a quest for national renewal as its overriding aim. It is a matter of choices.
3strategy insights | issue four
Fig. 2: An inexorable rise – public spending, 2001-10
£bn 01-02 02-03 03-04 04-05 05-06 06-07 07-08 08-09 09-10
Actual spend £389 £421 £456 £492 £524 £550 £583 £630 £674
In 2010 £ £480 £508 £533 £559 £580 £597 £615 £645 £674
1 Source: report by McKinsey, cited The Financial Times, 23rd March 2010.

britain at the crossroads | the case for fundamental change
4 strategy insights | issue four
*Source: Budget 2010
Fig. 3: Financial summary, 2009-15*
£bn 2008-09 2009-10 2010-11 2011-12 2012-13 2013-14 2014-15
GDP £1,435 £1,406 £1,464 £1,533 £1,621 £1,720 £1,824
Revenue £534 £508 £541 £582 £621 £660 £699
Expenditure £630 £674 £704 £713 £730 £748 £772
Surplus/(deficit) £96 £167 £163 £131 £109 £88 £73
Debt at year-end:
Reported debt £629 £761 £931 £1,065 £1,183 £1,281 £1,366
Treaty debt £796 £1,004 £1,179 £1,318 £1,438 £1,534 £1,618
As % GDP:
Revenue 37.2% 36.1% 37.0% 38.0% 38.3% 38.4% 38.3%
Expenditure 43.9% 47.9% 48.1% 46.5% 45.0% 43.5% 42.3%
Deficit 6.7% 11.8% 11.1% 8.5% 6.7% 5.1% 4.0%
Reported debt 43.8% 54.1% 63.6% 69.5% 73.0% 74.5% 74.9%
Treaty debt 55.5% 71.4% 80.5% 86.0% 88.7% 89.2% 88.7%
Memo:
Real growth -1.5% -3.8% 2.0% 3.0% 3.3% 3.3% 3.3%
GDP deflator 2.5% 1.8% 2.3% 1.5% 2.5% 2.8% 2.8%

strategy insights | issue four 5
*Source: Tullett Prebon projections, based on 2% real GDP growth, a tax target of 35% of GDP by 2014-15, and a deficit target of 3%
Fig. 4: Financial projections 2009-15*
£bn 2008-09 2009-10 2010-11 2011-12 2012-13 2013-14 2014-15
GDP £1,435 £1,409 £1,465 £1,520 £1,593 £1,672 £1,756
Revenue £534 £508 £525 £541 £564 £588 £614
Expenditure £630 £674 £672 £667 £668 £668 £667
Surplus/(deficit) £96 £166 £147 £126 £104 £80 £53
Debt at year-end:
Reported debt £629 £761 £970 £1,109 £1,227 £1,320 £1,385
Treaty debt £796 £1,004 £1,218 £1,362 £1,482 £1,573 £1,637
As % GDP:
Revenue 37.2% 36.1% 35.8% 35.6% 35.4% 35.2% 35.0%
Expenditure 43.9% 47.8% 45.9% 43.9% 41.9% 40.0% 38.0%
Deficit 6.7% 11.8% 10.0% 8.3% 6.5% 4.8% 3.0%
Reported debt 44% 54% 66% 73% 77% 79% 79%
Treaty debt 55% 71% 83% 90% 93% 94% 93%
Memo:
Real growth -1.25% -3.50% 1.50% 2.00% 2.00% 2.00% 2.00%
GDP deflator 2.50% 1.75% 2.25% 1.50% 2.50% 2.75% 2.75%
*Source: Tullett Prebon projections, based on 2% real GDP growth, a tax target of 35% of GDP by 2014-15, and a deficit target of 3%

britain at the crossroads | the case for fundamental change
strategy insights | issue four6
summaries: part one – the road to here
1. a golden legacy?
• Though much of the blame for the state of the economy and of the national finances falls squarely at the feet of the current government, significant weaknesses pre-dated 1997.
• The British tax system has long favoured debt capital over equity. While defenders of this bias claim that it attracts investment, the reality is that it simply attracts debt. The employers’ National Insurance (NI) system penalises job-creation, and NI itself has become nothing more than an income tax masquerading under another name.
• The original aim of privatisation was to return to the private sector industries which had no logical place in government ownership. After the departure of Mrs Thatcher, however, privatisation was pushed into wholly inappropriate areas of public service provision. This resulted in a costly and inefficient fragmentation of the public services, and claims that this would offer both efficiency and consumer choice were essentially bogus.
• The British bureaucracy has been growing, with few pauses and even fewer reversals, since 1945. This growth has long been out of control.
• There has been a long-standing failure to target the welfare system on those in genuine need, or to overcome the poverty trap.
• Trends towards excessive deregulation of financial services began in the 1980s, and triggered the regrettable de-mutualisation of the building societies.
• Since the early 1990s, the need for energy security has been neglected, and short-termism (most notably in the ‘dash to gas’ in power generation) has damaged the longer-term outlook for energy.
• Britain has, since the 1990s, taken an unduly relaxed stance towards overseas ownership of key strategic industries. Britain is almost alone among major developed economies in that it has allowed its utilities, airports and other key strategic assets to become foreign-owned.

strategy insights | issue four 7
2. the great experiment
• Since 1997, Labour has attempted to remodel society along essentially ideological lines. Unfortunately, these objectives have been undermined by failed economic, fiscal, monetary and regulatory policies which continued and worsened, rather than reversing, inherited weaknesses.
• Together, the introduction of the tripartite system, and the exclusion of asset price inflation from monetary targeting, paved the way for a ‘notional value’ bubble of which the 2008 financial crisis was the inevitable result.
• Far from realising that the 2000-07 ‘boom’ was essentially both illusory and borrowed, government bought into the theory that ‘boom and bust’ had been abolished. This, it was believed, could pay for a remodelling of society based upon increases in public spending which took government outlays from 36% to 48% of GDP in the space of a decade.
• At this point, two inevitable processes combined to stretch the government balance sheet to somewhere near breaking point. Via an inevitable TAT (toxic asset transference) process, banking
overstretch transitioned into the national debt, while the reversal of earlier, largely illusory growth pushed the relationship between government revenue and spending into the red to an extent unparalleled in the peace-time history of the UK.
• This has in turn damaged the performance of an economy whose competitiveness has been undermined by excessive taxation and by burdensome regulation and interference. Moral absolutism has been the cause of many of the mistakes of the last 13 years.

strategy insights | issue four8
• The United Kingdom has become mired in debt. Reported national debt – which the government says will rise from £760bn today to £1.37 trillion by 2015 – severely understates indebtedness because it omits both public sector pension obligations (of perhaps £1 trillion) and PFI (private finance initiative) commitments.
• Projections for the future trajectories of debt and the deficit are flattered by unrealistic growth
assumptions, while the exclusion of pensions and PFI increments leads to the under-reporting of the real deficit.
• Britain faces significant ‘vortex risk’, by which we mean the danger that the economy could be damaged, via much higher interest rates, if the markets conclude that UK government indebtedness is out of control.
• ‘Vortex risk’ makes resolute action imperative.
3. money troubles
summaries: part two – where is here?
britain at the crossroads | the case for fundamental change

4. the way we live now
• The argument that cutting public spending could put at risk the ‘recovery’ (which has been anaemic at best) misses the key point, which is that the British system of government has become both unaffordable and inefficient.
• Thus far, ‘vortex risk’ has been averted thanks to ‘three props’ – quantitative easing, the imminence of the general election, and the weakness of sterling – each of which is time-limited.
• The debate over how long Britain can defer spending cuts is essentially a false one.
• The bill for the downturn is about to turn up, and the markets may not be willing to help pay it unless a determination to reform is demonstrated.
• The UK economy has been stifled by a system of government which is at once both excessively costly and unnecessarily interventionist.
• The wastefulness of government spending has combined with increasingly burdensome regulation to undermine economic competitiveness.
• Quasi-market ‘reforms’, and a proliferation of agencies and quangos, have created a sprawling, costly and inefficient bureaucracy.
9strategy insights | issue four

strategy insights | issue four10
britain at the crossroads | the case for fundamental change
strategy insights | issue four10
• The policy alternatives available to the next government are stark. Attempting to muddle through with a ‘business as usual’ approach will not work, because Britain’s economic and fiscal problems are structural, not transitory.
• Any attempt to repair fiscal balances simply through higher taxation would impoverish British households and inflict further damage upon the economy.
• The obvious solution would be to reverse the growth in public spending by seeking, over a five-year period, real cuts of £80bn. This would amount to nothing more drastic than reducing real-terms spending to the levels of 2004-05, when public services were hardly cash-starved.
• Critics would contend that cuts of this magnitude would damage public services, but we completely disagree with such scare-mongering.
• Britain’s sprawling and inefficient bureaucracy is so vast and wasteful that it would not be difficult to find £80bn of savings without in any way damaging front-line services.
5. limited options
summaries: part three – the road out

strategy insights | issue four 11
6. practical alternatives
• How, then, can public spending be slashed without damaging essential services?
• No less a person than Steve Bundred, Chief Executive of the Audit Commission, has stated that spending cuts are ‘inevitable, and perfectly manageable’, and that fears that front-line service impairment will result from spending reductions is a ‘myth’. Mr Bundred has urged the public not to ‘believe the shroud wavers who tell you grannies will die and children starve if spending is cut. They won’t.’
• Since our outline reform plan is aimed at slashing administrative overheads, we see no need to reduce the salaries of public sector workers earning less than £30,000 annually (though higher pension contributions seem inevitable).
• Rather, we would aim to drive administrative overheads down to best-practice international levels, and to cut entire agencies and quangos out of the public sector gravy-train.
• Essentially, Britain needs to commence a ‘quest for national efficiency’.
• This should include:
- Driving down administrative costs
- Scrapping many quangos and quasi-autonomous ‘agencies’
- Reconsolidating fragmented public services
- Simplifying the tax system (and combining National Insurance with income tax)
- Abandoning the ID card and NHS computer programmes
- Scrapping the wasteful PFI system
- Concentrating any possible scope for realignment of taxation into raising personal tax thresholds at least to the level of the minimum wage
- Limiting corporate tax relief on interest expense
- Scrapping the failed tripartite system and handing responsibility for banking supervision to the Bank of England
- Imposing mortgage lending limits in order to minimise the risk of future asset bubbles.

strategy insights | issue four12
britain at the crossroads | the case for fundamental change
an unreal debate
2 See appendix 1 for the basis of international comparisons used in this report. Essentially, we use CIA World Factbook dollar-denominated data for calendar year 2009.3 Private Finance Initiative.4 See Financial Times, 22nd February 2010.
introduction
Within the next month, British electors will go to the polls in an election which is widely (and rightly) regarded as the most important since 1979. Not surprisingly, investors are already being inundated with reports aimed at influencing investment strategies.
Our purpose, however, is a different one, the aim of our strategy research being to stimulate debate on issues of importance. The pivotal UK general election of 2010, and the economic issues which will hinge upon it, clearly belong within our remit. In order to fulfil our brief, which is to present new perspectives and to think outside the box, we shall not confine ourselves to – though of course we must address – the near-term, battleground arguments over taxation, spending, the deficit, and other current policy areas. Rather, we endeavour to undertake a longer-term and more fundamental analysis of underlying issues.
There is, in any case, an air of unreality about the current economic debate. Essentially, the Conservatives are arguing for an early (though by no means swingeing) attack on the deficit, while the government counters that early spending cuts could endanger the economic recovery.
This debate is unreal, in two senses. First, the assumption is that there
exists a lot of freedom of choice over the timing of a reduction in the deficit. As the public both in Ireland and in Greece have discovered, such freedom of choice is illusory.
Second, none of the canvassed options for deficit reduction really tackles the structural problems which have rendered the British system of government ever more expensive and burdensome and, as a result, the economy increasingly uncompetitive. Moreover, and as we shall explain later in this report, this debate is being conducted in the context of data which may be at best misleading.
In order to identify the real issues, this analysis will take a lengthy look at the underlying causes of Britain’s current problems. We shall then examine the current situation, and pass on to consider possible solutions. Many of these solutions will be radical but, as we shall explain, the circumstances call for fundamental reform, not for tinkering and muddling through.
During 2009-10, the government borrowed £167bn. This is equivalent to 11.8% of GDP on the reported format and, when calibrated on an international basis2, works out
at a figure which is not drastically dissimilar to the deficits recorded in 2009 by Greece (10.8%), Spain (11.1%) or the United States (11.9%).
The UK number (and, no doubt, at least some of the others) understates the depth of the problem, because
it excludes very significant increments to off-balance-sheet obligations such as public sector pensions and PFI3 commitments. By the same token,
reported national debt – which, according to the budget, will rise from £760bn to £1.37 trillion, or 75% of GDP, by 2014-15 – very materially understates true government obligations, which we estimate at £2.1 trillion, and believe could rise to £3.15 trillion (180% of GDP) over the same time-frame. During 2009-10, the deficit was essentially monetised through £200bn of quantitative easing (QE). For obvious reasons, this is not a long-term solution.
Neither is the burden of forward obligations by any means confined to government. According to recent reports, the liabilities of the private sector pension system exceed £1 trillion4. Some £1.2 trillion is owed by individuals on mortgages secured against a housing stock which, based
‘Where the recession and the fiscal crisis are concerned, the bill hasn’t turned up yet. But it will’
strategy insights | issue four 135 See Issue Two, Brave New World?
both on historic multiples and on likely future trends in net-of-tax incomes, continues to look overvalued. Commercial property probably represents another serious financial black hole. And, through a process that we describe later in this report as ‘TAT’ (toxic asset transference), the government is, in principle, the forced underwriter of any future setbacks in the banking system.
It should be said from the outset that the UK is by no means alone where these problems are concerned. American off-balance-sheet obligations are probably well in excess of $50 trillion, and the administration itself admits that committed spending (in areas such as healthcare and social security) will rise, not diminish, over the coming decade, even without healthcare reform. There are similar problems both in Europe and in Japan. The global dynamic – in which the west borrows from Asian savers to fund unsustainable levels of consumption – is fundamentally unbalanced.
This said, Britain’s situation is by no means wholly (or even mainly) a consequence of global trends. To understand the nature of the UK economic crisis, and to consider what happens next, and what shape a solution might take, we need to look beyond a blame-shifting exercise which has attempted to pin the culpability on everyone from American
homebuyers to energy companies, oil producing states, and reckless and foolhardy bankers.
Over-rewarded bankers are an easy target, but the public is being asked to believe that the leaders of the UK banks suffered simultaneous brain-storms, which seems to us highly implausible. The problem was clearly systemic and regulatory, not idiosyncratic. The crisis is indubitably global, but a lot of the UK’s problems are self-inflicted. A country which believed that it was ‘best placed’ to weather a global downturn and, even more ludicrously, that it had abolished ‘boom and bust’, will soon wake up to reality.
Indeed, part of the air of unreality which surrounds the current debate springs from the fact that, where the recession and the fiscal crisis are concerned, the bill hasn’t turned up yet. But it will. Public sector debt has escalated, but the deficit has been funded thus far by QE to the point where the UK has not been confronted by the challenge of raising genuinely new debt. Indeed, and because of low interest rates, most consumers – so long as they have avoided unemployment – have felt better off than they did before the crisis. Thus far, government spending has not been cut, and there have been few material increases in taxation. This, then, is the unreal atmosphere in which fiscal and economic choices are being discussed.
Of course, this situation cannot last. In due course – and, we think, sooner rather than later – taxes will rise, and government spending will fall. Unless resolute action is taken on the deficit, there is every danger that raising sufficient new funds to finance the deficit may prove difficult, resulting in a sharp increase in interest rates. Indeed, and again unless resolute action is taken, we cannot rule out the possibility of a ‘perfect storm’ for the UK economy – higher interest rates, rising unemployment, falling property prices, an even weaker currency, rising inflation (caused in part by higher import costs), and escalating public debt.
A report which looks ahead to a post-election economic landscape obviously cannot avoid politics. Political decisions are a critical part of the economic landscape because, as we have explained in a previous report, economic outcomes are not the workings of blind chance but, rather, are matters of choice5. In this assessment we shall be highly critical of the Labour administration which has governed the UK since 1997, but investors should be in no doubt that many of Britain’s woes long pre-date the advent of Blair and Brown.

14 strategy insights | issue four
britain at the crossroads | the case for fundamental change
‘most members of the public have, as yet, no real
conception of quite how weak the economy of the
UK has become’

15strategy insights | issue four
not broke, not broken – but in urgent need of repair
6 Populus poll for The Times, conducted 5th-7th February 2010. 7 See The Economist, 6th February 2010, for a discussion of this issue. 8 Quoted in Boom and Bust: The Politics and Legacy of Gordon Brown, Simon Lee (2007, 2009).
One big conundrum presents itself at the outset and is, we think, central to the debate about the future of Britain. A recent opinion poll6 showed that a clear majority of the British public are very dissatisfied with the state of the country. By a significant margin (64% of those asked), those polled responded that Britain was going in the wrong direction, and, according to the majority (56%), was a country that they no longer recognised. A remarkably large minority (42%) said that they would emigrate if it were practical for them to so.
Opposition politicians see such findings as support for their ‘broken Britain’ thesis – indeed, 70% of those polled agreed with them about this - yet the evidence for this is actually scant. Crime (including violent crime) has diminished, not increased, while teenage pregnancy and binge drinking have not been escalating, as is widely assumed (though both remain uncomfortably high)7. In short, and while the ‘broken Britain’ tag does not accord with the facts, it remains true that a significant majority of the British public are deeply unhappy about the state of the country. The condition of the economy is a factor here, of course, though we are convinced that most members of the public have, as yet, no real conception of quite how weak the economy of the UK has become.
The observation that, while Britain is not ‘broken’, the public are clearly extremely dissatisfied, poses two questions. First, how is this contradiction to be explained? Second, does it matter? The answer to the latter question is, emphatically, yes – it matters very much indeed. A depressed population is not compatible with a progressive, wealth-generating economy.
The answer to the former question must follow an economic overview which falls into three principal categories:
1. Weaknesses which pre-date 1997, and the evolution of the economy under Labour.
2. The current state of the economy and the public finances.
3. Future challenges and policy options.
In the meantime, however, we can anticipate two of the conclusions which inform our thinking. First, and simply as an indicative example, public anger over revelations about MPs’ expenses has completely missed the point, which is this – why has it cost perhaps £7m to recover £1.1m in overpaid expenses, and why is the simple task of monitoring the invoices of just 646 people going to cost the
taxpayer at least £1m annually? Why, indeed, has the inquiry into Bloody Sunday cost the taxpayer £200m?
In other words, why has the British system of government become so expensive, so cumbersome, and so divorced from reality?
Second, politicians (of all parties) need simply to listen to the general public, in order to appreciate the breadth of the divide that has arisen between governing and governed. Bleak opinion poll findings essentially highlight a deep sense of unease in a population which increasingly believes that it is serving, rather than being served by, the apparatus of the state. Unless and until this can be resolved, the British public will increasingly believe that they are governed by what they regard as a self-serving, gravy-train elite which has become disconnected from the hinterland of broader society.
These are issues to which we shall return. First, though, let’s look at how weaknesses, both recent and long-standing, led the UK economy to perform poorly, and the public finances to deteriorate alarmingly, during an economic crisis that Ed Balls famously described as ‘the most serious global recession for...over one hundred years’.8

strategy insights | issue four16
britain at the crossroads | the case for fundamental change
strategy insights | issue four
1. a golden legacy?
This report is highly critical of Labour’s management of the economy, but it must first be said that several important strands of the current economic and fiscal malaise significantly pre-date 1997. The structural problems inherited by Labour included:
• Asymmetric fiscal treatment of debt and equity capital, and the employers’ National Insurance tax on jobs.
• A privatisation programme which had morphed from the ‘laudably-industrial’ into the ‘imitation- and-quango’.
• A long-standing tendency towards an ever larger and more costly bureaucracy, a trend worsened by the fragmentation of public service providers.
• A failure to target the welfare system on those in genuine need, or to overcome the poverty trap.
• Neglect of the longer-term outlook for energy security.
• A trend towards excessive deregulation of the financial services sector.
part one:
the road to here
16

strategy insights | issue four 17strategy insights | issue four 17
9 On Sundays, shops were allowed to sell magazines (hence Playboy) but not books. Bread rolls were permissible, but currant buns – being deemed ‘luxury’ items – were not.
a kingdom of quirks
Britain has always been a somewhat quirky country – within living memory, it was possible to buy a bread roll or a copy of Playboy on a Sunday, but not a currant bun or a Bible9 – and the honours system is either a quaint survival or a risible anachronism, according to taste. But some quirks are far more harmful. These include two very long-standing fiscal idiocies – the employers’ National Insurance (NI) system, and the very different ways in which the tax system treats interest and dividend payments.
The objection to employers’ NI is that it is a tax on jobs. Particularly when set against the allowances that apply to capital investment, NI skews the system against employment. It has also contributed to the overseas outsourcing of labour-intensive work. More broadly, employers’ NI is part of a huge fiscal and regulatory burden which places unquantifiable (but undoubtedly huge) obstacles in the way of business start-ups, and is thus extremely detrimental to economic renewal. (The nature of the offer which Britain makes to new businesses is considered later in this report). The linkage between social protection and NI has long since been weakened but, far from consolidating NI into the income tax system, governments of both hues have tended to increase
NI because it enables them to raise additional funds while claiming, speciously, that income tax has not been increased.
Pre-dating the present administration, the tax system has long favoured debt over equity capital, because interest payments on companies’ debt capital are tax-deductible while dividends paid to shareholders are not. This led directly to excessive leverage and the rise of private equity (which is actually a euphemism for ‘little or no equity at all’).
Essentially, the current system creates an uneven playing field between debt and equity capital. The tax-deductibility of interest is often defended on the grounds that it attracts business, whereas the truth is that it simply attracts debt. Conservative politicians have hinted that the fiscal relationship between debt and equity might be reviewed and, since excessive borrowing (public, corporate and private) has taken the UK to the brink of a ‘debt vortex’, such a review is surely long overdue. Later in this report, we look at how this might be accomplished.

britain at the crossroads | the case for fundamental change
privatisation – from wisdom to folly
Another policy strand long pre-dating 1997 is privatisation. After the departure of Margaret Thatcher, a fundamental (and extraordinarily detrimental) shift took place in the aims and structure of privatisation. Privatisation had been a flagship policy of the Conservatives in the 1980s, but the aim at that time was that government should withdraw from wholly-inappropriate industrial activities.
In 1979, the state was involved in a bewildering array of activities which had no logical place in government. At that time, the government controlled monopolies in telecommunications, ship-building, coal, gas and electricity. The state could take you on holiday (British Airways), supply you with an
ordinary car (British Leyland) or sell you a luxury vehicle (Jaguar). The Thatcher administration reasoned, surely very logically, that none of these activities remotely belonged in government hands – why on earth was government involved in manufacturing cars or running an airline? Privatisation of these industries made perfect sense, as well as yielding huge windfalls for the taxpayer.
Thereafter, however, and under both parties, privatisation increasingly moved from the appropriately-industrial into areas which involved the provision of public services. One effect of this was that the consumer paid again for services previously provided out of taxation. Where outright privatisation was impossible,
‘Governments of the
future face a compelling
need to reverse the steady
rise of the bureaucracy, a
rise which really began in
1945, and has continued
ever since, with few pauses
and even fewer reversals’
strategy insights | issue four18

government moved to create quasi-independent ‘agencies’, and to make extensive use of out-sourcing. The effect of this process was not to extend, but rather to reverse, Mrs Thatcher’s famous ‘bonfire of the quangos’. It also helped pave the way towards an excessive dependency on arbitrary targets in the public sector.
While privatisation was being diverted from the industrial-and-appropriate model of the 1980s to the imitation-and-quango hybrid of more recent times, government simultaneously set out to
create artificial ‘markets’ in essentially monopolistic, state-controlled fields. This process, which began in the early 1990s, has resulted in a huge increase in administrative costs, often with little or no benefit to the consumer and sometimes with effects which are
detrimental to the quality and the cost-effectiveness of public services.
To take just one example, the percentage of
National Health Service (NHS) funding absorbed by management appears to have tripled over the last 19 years,
blunting the genuine benefits which could otherwise have resulted from the massive increase in health funding which has been achieved since 1997. In an age of advanced information technology, does the NHS really need to employ more than 200,000 administrators? To put it mildly, we doubt it. This situation, which is replicated across the gamut of state activities, has worsened under Labour, but the process has clear origins in the pursuit of quasi-‘markets’ by the Conservative administration of the early 1990s.
‘If the apparent Conservative intention to restore the primacy of the Bank is surely wise, Labour’s reluctance to accept that the tripartite system has failed looks a lot like hubris.’
19strategy insights | issue four

britain at the crossroads | the case for fundamental change
20 strategy insights | issue four
the seeds of light touch‘Light touch’ (which has all too often amounted to ‘negligent’) supervision of the financial system has necessarily become a hot topic since the collapse of Northern Rock in 2007 and the government’s rescue of the banking system in 2008. Labour has received a lot of criticism for its supervision of the banking system – and gets a lot more such criticism later in this report – but the trend towards lax oversight and excessive deregulation really began under the preceding Conservative administration.
In the 1980s, laws governing building societies were relaxed to enable these previously-narrow (but fiscally conservative and socially beneficial) organisations to act like banks. Under legislation passed in 1986, societies became able to demutualise. While some society managements were happy to embrace demutualisation, others were pressured into it by members seeking short-term gains. The crisis which engulfed Bradford & Bingley and Northern Rock happened on Labour’s watch, but the erosion of this valuable tier of the financial system began under the preceding Conservative administration.
Another problem inherited by Labour was the progressive abandonment of any really coherent energy strategy. As memories of the frightening energy
21strategy insights | issue four
the cost of government
10 trillion cubic feet. 11 Based on data for 2008. Source: BP Statistical Review of World Energy, June 2009.
crises of the 1970s faded, an ever more laissez-faire stance was adopted, which culminated in the abolition of the Department of Energy itself in 1992.
Simultaneously, the Conservative government scrapped most of Britain’s coal mines, and permitted two dangerous trends in the management of the UK’s reserves of natural gas. First - and despite a pretty modest reserves base of 22 tcf10 of gas – exports were allowed. Between 1995 and 2003, the UK exported about 1.7 tcf. Second, and in our opinion more damagingly, a ‘dash to gas’ in electricity generation was initiated, prompted in part by a structurally-botched electricity privatisation which encouraged RECs (regional electricity companies) to integrate upstream into less-regulated power generation activities. Not only did this deplete more gas (about 8 tcf over the same period) than exports, but it has continued since, and has aligned Britain’s power generating sector firmly towards gas despite the comparative paucity of the country’s remaining reserves. Partly as a result of exports and of power generation, Britain’s gas reserves now equate to just 4.9 years of current production, or 3.6 years of current consumption11, and imports are rising rapidly. Compounding energy sector errors (and policy neglect) have occurred since 1997.
The Conservative government of the 1990s became extremely – excessively, we believe – relaxed about overseas ownership of British businesses. The recent acquisition of Cadburys by Kraft has attracted much attention but, if looked at in practical rather than in emotional terms, ownership of a chocolate manufacturer is hardly a matter of national strategic interest. The same cannot be said of infrastructure assets such as airports, power generation and utilities, the majority of which are no longer under UK ownership.
In his well-known early 2009 slating of the outlook for sterling, renowned investor Jim Rogers pointed out that Britain had very little left to sell. Other governments have notably avoided this relaxed approach to the ownership of strategic assets, which is why neither Spanish airports nor the French electricity industry could ever have become British-owned. If Mr Brown’s recent list of possible asset sales – essentially, the Dartford crossing, the high-speed rail link and the student loans book – underlined quite how bare the national asset cupboard has become, it is a process that began under the Conservative government that preceded the current administration.
A recurring theme of this analysis is that the British system of government has become ever more expensive and bureaucratic. If this was ever affordable (which we doubt), those times have surely gone. The state’s fiscally-enfeebled condition – and future challenges in areas such as demographic change and the security of energy supply – surely mean that this sprawling bureaucracy is no longer remotely affordable. Governments of the future face a compelling need to reverse the steady rise of the bureaucracy, a rise which really began in 1945, and has continued ever since, with few pauses and even fewer reversals. Though this problem has worsened since 1997, it was not invented by the current Labour administration. Since the ending of the Second World War, successive administrations have presided over a rise in the scale, scope and cost of the administrative apparatus.
It must be emphasised, however, that the dramatic increase in bureaucracy over the last 20 years has not primarily been a matter of the over-rapid expansion of the conventional civil service. Though the scale of expansion in employment, especially in the middle and junior ranks of the civil service, has been excessive – and, undoubtedly, inadequate use has been

strategy insights | issue four22
britain at the crossroads | the case for fundamental change
12 See The Public Sector Rich List, 2009. 13 Niall Ferguson, The Ascent of Money, 2009, pp 207-212.14 Ferguson, op cit, p 211.
made of the labour-saving potential of information technology – the expansion in the bureaucracy has been concentrated primarily, not into the civil service, but into the plethora of agencies and quangos that have come into existence since 1990.
Indeed, career civil servants would be entitled to resent the growth of the administration outside the confines of the conventional civil service. This has seen outside advisers and consultants promoted over the heads of professional civil servants, and has also seen the payment, to individuals in agencies and quangos, of salaries vastly higher than those permitted by the civil service pay scale. As we shall remark later in this report, no less than 72 taxpayer employees are paid more than the highest paid civil servant while, of the 296 people who earn more than the Prime Minister, only 11 are conventional civil servants (while Transport for London alone accounts for 21)12.
A second long-running (and related) theme concerns welfare. Although
Britain played a pioneering role in the creation of an all-encompassing welfare system, Niall Ferguson has explained13 that Japan was the real pioneer of the modern welfare state. But successive British (and overseas) governments have yet to find an answer to a conundrum described by Professor Ferguson. Essentially, welfare was designed as a safety net which, while eminently workable in ‘a culture of social conformism’ such as that of Japan, can rapidly become unaffordable (and detrimental to growth) in a more individualistic culture which encourages people to ‘game the system’14.
The future of welfare may be the subject of a future report in the Tullett Prebon Strategy Insights series but, for present purposes, it is sufficient to note that flaws in the system now seem certain to be exposed by an ageing population, by strained government finances and by an uncertain economic future.
‘Why did government fail
to spot the causal chain
here – a causal chain which
included deregulation, lax
lending criteria, excessive
leverage, unsustainable
increases in property prices,
imprudent consumer
behaviour, a serious skewing
of the economy and the
creation of a largely illusory
acceleration in growth?’

strategy insights | issue four 23
15 At the adult rate (of £5.80 per hour), and assuming a 37-hour working week, the annual equivalent of the minimum wage is £11,159, yet the income tax threshold is £6,475, meaning that 42% of the minimum wage is taxable.
2. the great experiment
Thus far, we have observed that the Labour government elected in 1997 inherited many significant weaknesses in addition to a reasonably strong economy. Some of these weaknesses were very long-standing, such as the NI tax on jobs, a fiscal system which favoured debt rather than equity capital, a welfare state with inherent contradictions and, above, all, a costly and over-bearing bureaucracy which had been growing, relentlessly and almost continuously, since 1945.
Other problems were of more recent origin, including the diversion of privatisation from the logically-industrial into the quasi-market-bureaucratic. Nothing had been done about a looming energy squeeze which, while it lay far in the future in 1997, nevertheless required urgent attention given the ultra-long-term nature of the energy industries.
Our assessment of the conduct of the economy and the public finances since 1997 is substantially negative, for the following reasons:
• Government made two cardinal errors in 1997 – the supervisory role of the Bank of England was fatally weakened by the introduction of the tripartite system, and monetary policy was tied to a definition of inflation which wholly ignored the very concept of asset inflation.
• There was no satisfactory monetary, regulatory or fiscal response to the house price bubble which inevitably ensued.
• The largely illusory boom which this bubble created was mistaken for real and sustainable growth, in the ludicrous belief that ‘boom and bust’ had somehow been abolished.
• Labour has presided over an unsustainable escalation in public spending and the worsening of a pre-existing trend towards over-complex and excessively-expensive government.
• Reflecting these factors, on- and off-balance-sheet debt has taken on an upwards trajectory which seriously threatens both national creditworthiness and the ability of government to finance deficits going forward.
Where Labour’s management of the economy is concerned, let’s first consider some mitigating factors. First, and where Labour’s stewardship is concerned, we cannot say that a government of another party would have fared better, since we cannot know this. Second, Labour has a number of achievements to its credit, even if the word ‘but’ has too often had to be appended to them. For example, the introduction of a national minimum wage was commendable, but why has the income tax threshold not been raised in accordance with the implicit recognition that the wage floor really does represent the minimum amount on which a working person can live satisfactorily?15
britain at the crossroads | the case for fundamental change
16 See Terry Arthur and Corin Taylor, The UK Pensions Crisis, 2008.17 Between 1996-97 and 2009-10, the single-person full weekly pension has increased by a nominal 56%, to £95.25 from £61.15. This compares with a nominal increase in GDP of 80% over the same period. On a CPI-adjusted basis, the rise in the weekly sum is equivalent to a real increase 15%, but the state pension has decreased by 15% relative to GDP.
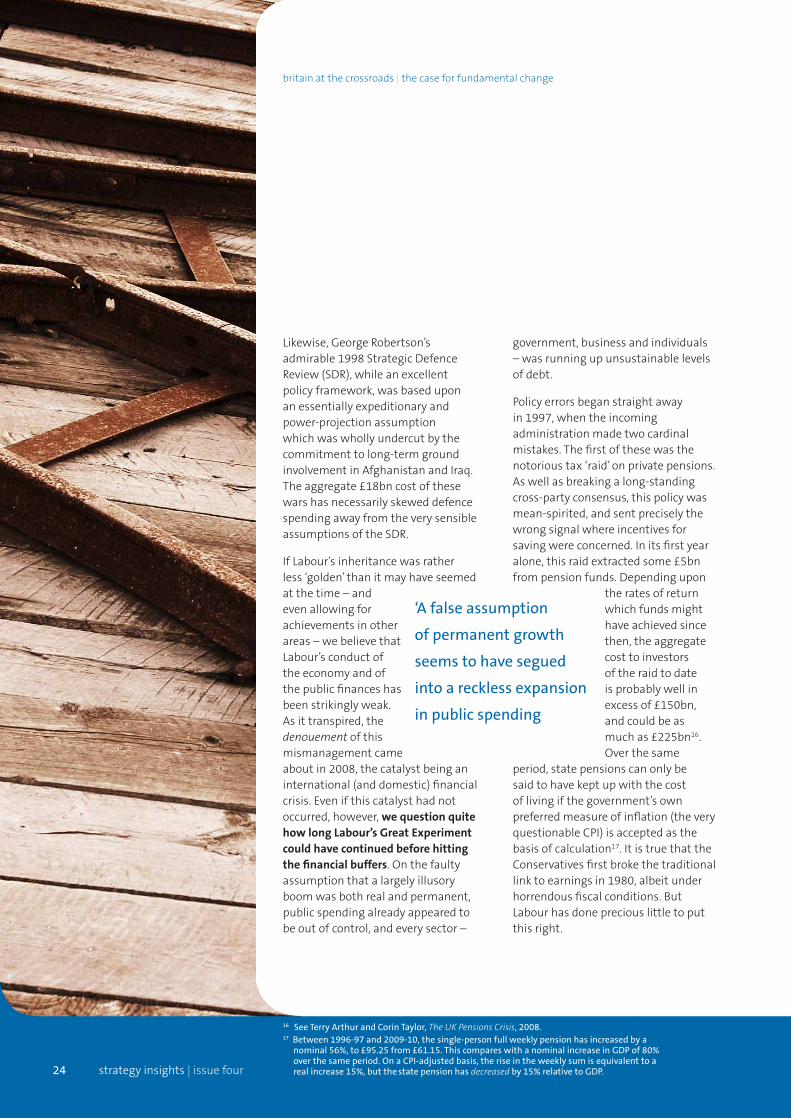
Likewise, George Robertson’s admirable 1998 Strategic Defence Review (SDR), while an excellent policy framework, was based upon an essentially expeditionary and power-projection assumption which was wholly undercut by the commitment to long-term ground involvement in Afghanistan and Iraq. The aggregate £18bn cost of these wars has necessarily skewed defence spending away from the very sensible assumptions of the SDR.
If Labour’s inheritance was rather less ‘golden’ than it may have seemed at the time – and even allowing for achievements in other areas – we believe that Labour’s conduct of the economy and of the public finances has been strikingly weak. As it transpired, the denouement of this mismanagement came about in 2008, the catalyst being an international (and domestic) financial crisis. Even if this catalyst had not occurred, however, we question quite how long Labour’s Great Experiment could have continued before hitting the financial buffers. On the faulty assumption that a largely illusory boom was both real and permanent, public spending already appeared to be out of control, and every sector –
government, business and individuals – was running up unsustainable levels of debt.
Policy errors began straight away in 1997, when the incoming administration made two cardinal mistakes. The first of these was the notorious tax ‘raid’ on private pensions. As well as breaking a long-standing cross-party consensus, this policy was mean-spirited, and sent precisely the wrong signal where incentives for saving were concerned. In its first year alone, this raid extracted some £5bn from pension funds. Depending upon
the rates of return which funds might have achieved since then, the aggregate cost to investors of the raid to date is probably well in excess of £150bn, and could be as much as £225bn16. Over the same
period, state pensions can only be said to have kept up with the cost of living if the government’s own preferred measure of inflation (the very questionable CPI) is accepted as the basis of calculation17. It is true that the Conservatives first broke the traditional link to earnings in 1980, albeit under horrendous fiscal conditions. But Labour has done precious little to put this right.
‘A false assumption
of permanent growth
seems to have segued
into a reckless expansion
in public spending
strategy insights | issue four24

25strategy insights | issue four
18 Financial Services Authority. 19 For 2007 – when nominal CPI was just 1.8%, but fuel and food costs were soaring - supermarket group ASDA calculated inflation, as it affected consumers, at 5.2%. See ASDA press release, 27th March 2008. ASDA calculated that, within a cost-of-living rise of 5.2%, petrol costs had risen by 20.3%, transport by 6.2%, and food by 5.6%. Average after-tax incomes had increased by only 2.3%.
faulty reform – the tripartite system
The second (and far more serious) error concerned the regulatory structure. In 1997, new chancellor Gordon Brown gave the Bank of England quasi-independent status, but at the same time, we believe, made two very serious mistakes. First, he divided regulatory responsibility – previously the preserve of the Bank – between the Bank, the FSA18 and the Treasury in the new ‘tripartite structure’. Second, the Bank was given a very narrow monetary policy remit based entirely on retail price inflation. This meant that the Bank was not empowered to monitor asset inflation, and amounted to a near-disastrous blunder in monetary policy.
The tripartite system effectively removed the long-established (and, historically, very effective) role of the Bank as the informal guardian of overall lending probity. As a result, no single authority could act to rein-in excessive lending, most pertinently where mortgages were concerned. At the same time, institutions other than banks began lending in forms which ran the gamut from junk-mail loan offers to shop cards and car finance. ‘Anything goes’, in fact. Any concept of controlling credit seemed to have been progressively abandoned. The previous system - whereby the Bank regulated lending through cosy, behind-the-
scenes conversations with banks, while no-one other than an authorised bank was allowed to lend - had been replaced with something very close to a free-for-all.
One of the biggest ironies of the Labour era has been that, while ‘light touch’ regulation contributed to the creation of the unsustainable debt bubble, regulation in other, essentially petty areas has become ever more onerous. At a time when supervision of financial risk was impaired by the ill-starred tripartite system, other industries have suffered successive strangulation from a worsening complexity of regulation. Meanwhile, businesses (and individuals) have been burdened by a tax code which has more than doubled in length and complexity since 1997. The government itself has put the annual cost of regulation to business at £13bn, but we believe that this sum is calculated on a very narrow basis, and that the real cost is far higher.
Together with the weakening of regulatory oversight through the tripartite system, one of the biggest mistakes made by the government was a complete failure to appreciate the concept of asset inflation. As a result, inflation-targeting and interest rate management, though devolved
to a supposedly-independent Bank of England, were referenced wholly to retail prices, and specifically to the new CPI measure which, we believe, leaves a great deal to be desired19. This left a huge risk area – asset inflation – unmonitored and unchecked. With hindsight – though many observers said so at the time – interest rates should have been increased significantly no later than 2002, by which point it should have been obvious that a housing bubble was being fostered to replace the previous dotcom bubble. This new bubble needed to be choked off. Tragically, it was not.
These two factors – ‘light touch’ regulation, and a monetary policy which ignored asset inflation - should be considered together, since it is unlikely that interest rate policy would, of itself, have been sufficient to have prevented the dangerous escalation in indebtedness which has occurred over the last decade. We suspect that the Bank understood this perfectly well – and, indeed, had a better grasp of the situation than Alan Greenspan’s Fed – but was unable to take effective action because of its reduced regulatory powers, and the straitjacket imposed by a CPI-defined monetary policy remit.

strategy insights | issue four26
britain at the crossroads | the case for fundamental change
20 Loan To Value. 21 Adjusted for the GDP deflator, outstanding mortgages of £500bn in 2000 would correspond to £590bn in 2009 money, far below the actual outstanding total of £1,220bn.
22 Source: FSA – Address by Adair Turner: The Mortgage Market: Issues for Debate, 12th May 2009.
As a result, mortgage lending criteria became dangerously relaxed, with borrowers able to obtain funds on unsafe LTV10 ratios, at excessive multiples of earnings, and often on self-certified statements of income which were not verified by lenders. Under the previous system, the Bank, in its role as supervisory authority, would have acted informally to check the irresponsible lending practices which saw outstanding mortgage debt rise from £500bn in 2000 to £1,220bn by 2009, a nominal rise of 140% and a real-terms increase of almost 50%21. If the apparent Conservative intention to restore the primacy of the Bank is surely wise, Labour’s reluctance to accept that the tripartite system has failed looks a lot like hubris.
the distorting bubbleThe housing bubble injected growth into housing-related activities running the gamut from estate-agents to domestic appliance suppliers via house-builders, builders’ merchants, white goods retailers, electrical and plumbing contractors, furniture companies and the legal profession.
Thus seen, huge swathes of the economy became hostage to an intrinsically-unsustainable house price bubble. It is not possible to isolate the broader housing effect from the remainder of the economy, but it is more than probable that the ex-property economy – that is, the economy excluding all housing-related activities - contracted very materially while the asset bubble was taking shape.
Impacted by low interest rates – and by the savage tax on pension funds introduced in 1997 – savings ratios deteriorated, which did not seem to matter because of the availability of wholesale funding on international markets. Many individuals saw buy-to-let as an alternative to investing in tax-raided pensions, yet buy-to-let was wholly predicated on capital gains (through perpetual rises in house prices), because after-cost yields on UK domestic property never exceeded 3.5%, well below the cost of capital at any time during the boom. Buy-to-let,
of course, injected yet more borrowed liquidity into the housing bubble. By 2007, 26% of mortgage issuance was going into buy-to-let and 39% into equity release, such that just 35% was actually being used to finance house purchases22. Again, this was ludicrous, and should have sounded warning-
bells. Again, it seems to have been either unnoticed or ignored.
Bank leaders played a part in all this, of course, but their actions need to be seen in the context of an economic
and fiscal structure which amounted to an unwatched free-for-all. Those few banks which stood aside from this jamboree were often criticised for being too cautious, while demutualisation had largely stripped the system of the building societies, hitherto a stabilising tier in the housing finance structure. Almost all of the demutualised societies (such as Northern Rock and Halifax) have since come to grief.
‘Mr Brown mistook bubble
growth for the real thing, and
assumed that government
could safely spend up to
it (and beyond it), on the
grounds that ‘boom and bust’
had been abolished’

strategy insights | issue four 27
the perils of notional value
23 See Forever Blowing Bubbles, March 2010, pp8-10. 24 Robert Peston, Who Runs Britain?, 2008.25 Capital gains tax.
• Slack lending behaviour had consequences far beyond a simple and unsustainable bubble in property prices. These consequences included:
• An illusory economic boom that was mistaken for the real thing.
• An escalation in public spending driven, in part, by false confidence in the sustainability of the apparent boom.
• Imprudent consumer behaviour driven by inflated property equity.
At the heart of the problem, where consumers were concerned, was the critically-important concept of notional value, a misunderstanding which, while it can accompany any asset bubble, is particularly dangerous when it results from a bubble in property prices.
Notional value was discussed in Issue Three of this series21, but this concept is of such importance that we need to reiterate it here. Essentially, notional value means that increases in property prices need to be distinguished from realisable rises in wealth. While an individual feels richer if the notional price of his or her house rises, this increased wealth is essentially theoretical, and capable of reversal. It is obviously impossible for the whole of the national housing stock (or even a material proportion of it) to be monetised.
Mistaking notional for real value can be lethally dangerous if it distorts behaviour. The danger with notional value occurs when its owners borrow up to it (or, in absurd cases, beyond it), via mortgage and consumer debt in the instance of individuals, or increased leverage in the case of corporates, and this is what happened in the UK.
Drawing upon confidence falsely derived from the ‘notional value’ of rising property equity, individuals – and, to a considerable extent, businesses as well – bought into the belief that leveraging was good. While mortgage debt escalated, so did consumer and corporate debt, the latter reflected in the private equity
model which itself exploited the bizarre way in which the tax system favours debt over equity capital. As Robert Peston has explained, Labour seems to have made ‘a bit of a cock-up or a case of mistaken identity’ by confusing private equity with venture capital, and encouraging the former with generous tax breaks24. When the tax status of private equity began to attract adverse public comment, the government compounded this mistake by raising CGT25 from 10% to 18% without discriminating between the types of gain involved.
Once notional value – most notably in the housing market - took hold in an under-regulated environment, the unavoidable result was that both debt and risk escalated. After that, the transitioning of unsustainable private debt, via banks, to the government - a process that we describe as TAT (toxic asset transference) – became an inevitability. This process is described later in this report.
Why did government fail to spot the causal chain here – a causal chain which included deregulation, lax lending criteria, excessive leverage, unsustainable increases in property prices, imprudent consumer behaviour, a serious skewing of the economy

britain at the crossroads | the case for fundamental change
26 See Michael White, ‘The gift of tired tongues’, The Guardian, 30 September 1994, and Norman Macrae, ‘You’ve never had it so incoherent’, Sunday Times, 2 October 1994.
and the creation of a largely illusory acceleration in growth? Critics would no doubt ascribe it either to wishful thinking about the abolition of ‘boom and bust’, or to a simple failure of comprehension. The theory that Mr Brown has never really understood economics seems to be supported by his gobbledegook 1994 reference to ‘the importance of macro-economics, post neo-classical endogenous growth theory and the symbiotic relationships between growth and investment, and people and infrastructure’26. Right.
Far from recognising the unsustainable nature of the housing boom and the dangers implicit in the notional value trap – and therefore trying to do something about it - government itself fell into notional value thinking. Instead of realising that the UK was riding an unsustainable debt bubble, government proclaimed an end to
‘boom and bust’, thereby implying that growth had become permanent, and that the law of economic cyclicality had, presumably, been abolished.
Worse still, government appears to have believed its own rhetoric, since a false assumption of permanent growth seems to have segued into a reckless expansion in public spending. It is difficult to avoid the conclusion that government simply did not understand the concept of bubbles and asset inflation or, conversely, understood it all too well but was happy to ride the wave in the Micawberish hope that ‘something will turn up’. Something did indeed ‘turn up’ – a full-blown banking and fiscal crisis combined with massive consumer and corporate indebtedness.
‘The European Commission
is quite right to warn
that the pace at which
the government plans to
tackle the deficit shows
insufficient urgency’.
strategy insights | issue four28

29strategy insights | issue four
this and TAT
When the crisis struck in 2008, the preceding expansion in non-government debt (and most notably of mortgages) inevitably dragged government into costly intervention (which, to their credit, both chancellor Alistair Darling and Bank governor Mervyn King handled with considerable skill). This was inevitable, because over-extension of private borrowing, if it imperils the viability of the banking system, necessarily draws in governments through a process which we describe as ‘TAT’ (toxic asset transference). The TAT concept is an important tool in understanding how the financial crisis developed, and where it might go from here.
The TAT process is shown schematically in fig. 5. The TAT model divides the stages of the financial crisis into three phases – problem creation, toxic asset transference and long-run implications.
In the first phase, policy weakness results in a failure to recognise and to curb an asset bubble in a timely fashion. In the UK, this policy weakness took three main forms:
• Failure to appreciate and manage the concept of asset inflation.
• Weakening, through the tripartite system, a largely informal supervisory structure which could hitherto have choked off a borrowing bubble.
• Believing that, because of the abolition of ‘boom and bust’, the bubble was permanent, sustainable and benign.
In the second stage of TAT, the burden of the resulting debt, by becoming excessive for originators (such as home owners), becomes a problem for the banks. When the banks in turn are unable to withstand the resulting damage to their balance sheets, the state is forced into shouldering the burden as the only alternative to an implosion of the financial system.
Fig. 5: Toxic asset transference
Problem creation
Toxic asset transference
Long-run implications
Excessive borrowingPolicy weakness
Fiscal stress
Reduced competitiveness Economic underperformance
Asset bubble
Originator stressBank Stress

britain at the crossroads | the case for fundamental change
30
Fiscal stress inaugurates the third phase of TAT. Escalating government debt threatens to drive interest rates upwards, and at the same time forces government into fiscal tightening, in the form both of increased taxation and of reduced expenditure. This in turn results in economic under-performance. The UK story is a classic example of this process, and has left the economy firmly in the talons of toxic asset transference.
TAT is, of course, by no means unique to the UK. Seen as a global phenomenon, TAT explains why the consequences of excessive lending have transitioned from the banking system into sovereign debt, where a string of countries now look vulnerable. Though by no means alone where the sovereign debt problem is concerned, Britain is one of a number of countries where TAT-related problems have piled additional burdens onto a government balance sheet which had already been stretched by excessive levels of public spending.
strategy insights | issue four

31strategy insights | issue four
spend, spend, spend
When Labour returned to power in 1997 after an absence of 18 years, a key element of the party’s election manifesto had been a commitment to stick to the spending plans of the outgoing administration. This commitment - designed to rebut accusations that Labour would return to the profligacy of the 1970s – tied the government’s hands during the first Blair-Brown term.
After the 2001 election, with Labour now free from this commitment, government expenditure began to escalate in a wholly unsustainable way. Between 1999-2000 and 2008-09, annual public spending increased from £343bn to £628bn. To understand the step-change which this represents, we need to appreciate that, had spending simply risen in line with inflation27, the outturn for 2008-09 would have been £429bn. Conversely, if expenditure growth had matched the increase in nominal GDP, the total would have risen to £521bn. So the £628bn out-turn for 2007-08 represented a real-terms increase of £200bn (46%) and an above-GDP rise of £107bn (21%).
27 The GDP deflator is used in this calculation.

britain at the crossroads | the case for fundamental change
strategy insights | issue four32
The above-inflation increase – of £200bn – should be seen in the context of a fiscal deficit of £167bn during 2009-10. In other words, the surge in public spending correlates pretty closely with the deficit.
Between 1999-2000 and 2008-09, the proportion of GDP spent by the government increased from 36% to 44%, and reached 48% in 2009-10. Unfortunately, government income did not behave in the same way, rising only fractionally - from 38% of GDP in 1999-2000 to a peak of 38.6% in both 2007-08 and 2008-09 - before declining to 36% in 2009-10.
Exactly why this was allowed to happen is open to debate. According
to James Buchan, ‘Brown thought that the profits of the City would finance a new welfare state that would be a monument to him more lasting than bronze. He was mistaken’28. Our own view, which is not at odds with this interpretation, is that Mr Brown mistook bubble growth for the real thing, and assumed that government could safely spend up to it (and beyond it), on the grounds that ‘boom and bust’ had been abolished.
One factor which we believe should be borne in mind here is that reported inflation numbers may well be misleading. If this is true, it has at least two implications for government spending. As remarked earlier, ASDA data for 2007 indicated that inflation,
as it affected the average consumer, was far higher (5.2%) than the reported CPI number (1.8%) or the GDP deflator (3%). The reliability of official statistics is a controversial topic in America, where analysts such as John Williams (of Shadow Government Statistics) have done a great deal to call this reliability into question. Where inflation is concerned, both substitution and hedonics seem to play a significant role in distorting reported out-turns, while the GDP number itself may be distorted by the controversial use of imputations29.
Fig. 6: Spend, spend, spend – public spending, 2000-09
700
£628bn
£343bn
£521bn
£429bn
600
500
300
400
200
100
008-0907-0806-0705-0604-0503-0402-0301-0200-0199-00
ActualGDP-constantInflation-adjusted
28 ‘Is Britain Bust?’, Prospect, August 2009, pp28-33 29 Hedonics – lowering the recorded price of an item because its quality has improved, even if the actual price has increased or remained unchanged. Substitution – replacing an item in the measurement basket on the grounds that, as its price has increased, consumers would purchase something else instead. Imputation – attaching cash values to goods and services where no money has actually changed hands.

strategy insights | issue four 33
In the absence of such comprehensive external analysis, the UK position is less clear, but it is at least possible that inflation, particularly as measured by CPI, is understated. If such understatement were to be reflected in the GDP deflator as well, this would imply the overstatement of GDP growth. So, where the superheated growth in public spending is concerned, it is possible that government planning was predicated on an exaggerated reading of the real strength of the economy during the ‘boom’ years before 2008. Moreover, much of the growth of those years was essentially borrowed, funded by wholesale borrowings from overseas and distorted by the impact on consumer behaviour which resulted from the property price bubble.
If, as we very strongly suspect, inflation has been routinely understated, this would have had a second implication for government spending. It would mean that ‘real’ inflation, as it impacted activities such as health, education and defence, was a great deal higher than was generally assumed.
‘UK government spending is
more wasteful than that of
Tunisia, the Gambia, Malawi,
Ethiopia or Albania, and
government regulation is
more burdensome in Britain
than in Bulgaria, Nigeria,
Pakistan or China’

britain at the crossroads | the case for fundamental change
30 Quoted by Simon Lee in Boom and Bust: The Politics and Legacy of Gordon Brown (2007, 2009).34 strategy insights | issue four
remodelling society
In any case, government seems to have been philosophically inclined towards increased public spending. From the outset of the Blair-Brown project, the assumption seems to have been that the ills of society can be cured if state activity (and, by implication, fiscal redistribution) is increased. In the Thatcher and Major eras, much stress was placed on holding taxes down, and reducing them wherever possible. But much higher spending seems to have been an implication of Tony Blair’s 1994 leadership election manifesto, Change and National Renewal, in which Mr Blair wrote of ‘social renewal’30.
Certainly, a great deal of the increase in government spending seems to have been predicated on social activism, and upon an agenda of remodelling society. Within the expansion in public spending, there have been huge increases in benefits paid, on an essentially capricious basis, to people of working age, while the cost of government, too, has escalated. By contrast, the sums paid to state pensioners, for example, have barely kept pace with relevant inflation, while defence spending seems to have been inadequate in the context of two simultaneous wars and of pre-existing defence commitments.
Though a sense of purpose is desirable in government, politicians always need to be aware that, at any level other than that of platitude, morality is essentially subjective. At a very general level, everyone is surely in favour of ‘fairness’, but this means very different things to different people. For example, a wealthy person might believe that a ‘fair’ tax would take the same percentage of everyone’s income, while a poor person might argue that the better off should pay a higher proportion. Philosophically, there is no wholly objective ‘right’ or ‘wrong’ answer to such a conundrum, which therefore needs to be resolved pragmatically.
And, in any case, politics is essentially a matter of choices. Most people would applaud Labour’s aim of eliminating child poverty, but what if we have to choose between this and, say, eliminating pensioner poverty? (And, for that matter, what was the moral justification for Labour’s pension raid?) Both reducing child poverty and helping the elderly are laudable aims, but both make competing claims on limited resources, meaning that choices have to be made. In this regard, Labour has not been helped by lobby groups which push particular special interests (almost all of which
involve increased state spending), or by a media which often pushes these groups’ agendas without an adequate recognition of the limitation of fiscal resources.
Reflecting both the breadth of Labour’s ambitions and an increasing and regrettable tendency towards moral absolutism, a large part of the increase in spending has resulted from a hands-on, interventionist philosophy which puts emphasis on ‘fairness’ (as Labour defines it) when an emphasis on efficiency, wealth-generation and individual choice might have been much more desirable. It is noteworthy that a whole chapter of the 2009 budget was entitled ‘Helping people fairly’. Helping them effectively might, we think, have been a much better idea. More generally, Labour seems to have had a preference for the most complicated solution on offer. Since 1997, the length of the tax code has more than doubled, an ultra-complex tax credit system has been preferred to simplifying reforms, and a torrent of legislation has been passed on every conceivable subject.
Ultimately, the purpose of a tax system is to raise money. But Labour, from its standpoint of moral absolutism and a preference for the complicated, has
strategy insights | issue four 35
taking count
often seemed to regard the primary purpose of taxation as a means of social engineering. The recent introduction of a 50% top tax rate is largely gesture-politics, since any sum realised from this is likely to be modest, and may be more than offset anyway by collateral damage in the form of reduced incentives. Governments need to realise that, in a global economy, tax rates need to be competitive with those operative in other countries, since individuals and businesses are quite capable of moving to a more attractive fiscal (and regulatory) environment.
The effectiveness of a fiscal system can be judged by three criteria - yield, distortion effects and cost of collection - and Labour’s complex fiddling with the system fails all three tests.
Overall, where the Labour administration is concerned, it seems impossible not to conclude that a lot of very serious mistakes have been made, though sometimes with the best of intentions, and often in furtherance of adverse trends already in place before 1997.
‘Light touch’ regulation clearly represented a continuation of pre-1997 policy, though the tripartite system – and the exclusion of asset inflation from monetary policy - look like grave and idiosyncratic mistakes. As the housing market overheated and as debt escalated, the largely illusory nature of the ensuing ‘boom’ was not appreciated, and government spending was allowed to escalate on the assumption that a period of temporary and illusory growth was a genuine and sustainable pointer to the future.
In particular, the claim that ‘boom and bust’ had been abolished was manifestly absurd. Even at times when the global economy appears to be performing well, shocks are always possible. These could take any one of numerous forms, including wars,
oil crises, major financial failures or political instability in important economic players. The assumption of perpetual economic growth defies all past history, pre-supposes that nothing can ever go wrong, and leads to highly dangerous assumptions
about affordable levels of spending and borrowing.
Within the increase in public spending, the simple fact seems to be that, at least since 2001, government has been living beyond its sustainable means, not just in terms of the cost of public services but also, and less forgivably, in the cost of delivering those services, which
has escalated over the last decade. Tax assumptions, too, seem to have been over-optimistic, at least in the sense that, even before the present administration came to power, government was reaching a level of public fiscal resistance, resulting in a recourse to so-called ‘stealth taxes’. This has continued relentlessly, combined with an insidious (and largely unremarked) process of charging for services hitherto paid for out of taxation. The latter, in particular, is extremely damaging to businesses.
‘It is possible to envisage
a future in which the
British population is
subjected to ever-increasing
taxation and charging to
sustain an administrative
superstructure which is
increasingly coercive as well
as unaffordably costly’

britain at the crossroads | the case for fundamental change
36 strategy insights | issue four
part two: where is here?
3. money troubles
So much, then, for the unedifying history of how Britain got into its current economic and fiscal mess. Two questions remain. First, exactly how bad is the situation? Second, and much more importantly, how can the UK progress towards sustainability? As we explained earlier in this report, the appropriate sequence here is to let the answers to the first question prompt answers to the second. It is not too much of an over-simplification to say that the best policies for the future will lie in the reverse of the mistakes and weaknesses that have brought Britain here.
First, though, where is ‘here’? For understandable reasons, the election battleground is being fought in a fog of unreality, because no politician really wants to tell the electorate quite how serious Britain’s problems are, or, more to the point, how painful the necessary post-election responses will need to be.
We have no such compunction, so this section of our report might hurt. For a start, the reported figures for government indebtedness seriously understate the situation. In comparison with reported national debt (of £760bn, excluding the one-off effects of interventions, and projected to rise to £1,370bn by 2014-15), we estimate the real public sector obligation at £2.1 trillion, a number which could rise to £3.2 trillion, or more, over the same timescale (see figs. 9 and 10).
Second, Britain’s 2009-10 fiscal deficit – of £167bn, or 11.8% of GDP – exceeded the prudent, Maastricht-required 3% limit by £135bn, equivalent to £5,300 per UK household. This is the sum which needs to be rebalanced through tax increases and/or cuts in public spending. Third, we believe that the official projections for the economy – essentially, a real growth rate of
3.25% annually from 2012 – are far too optimistic.
Each of these points will be addressed later in this report. There are other problems, too, but this should act as a clear summary of the scale of the issues needing to be tackled. The good news – and there is some – is that the solutions may be a great deal less difficult than is often supposed.
Are these problems simply part of an international malaise, and will they therefore self-rectify if and when the global economy returns to pre-2008 levels of growth and prosperity? Since the financial crisis began in 2008, ministers have gone to great lengths to insist that Britain’s problems are, almost entirely, part of a worldwide downturn. No mention is ever made of ‘crisis’ or ‘recession’ without the obligatory prefix ‘global’ being tacked on to it. Even if the government had not previously claimed that the UK
37strategy insights | issue four
was ‘best placed’ to weather any downturn, this ‘globalisation’ of the issue is, essentially, an exercise in blame-shifting, as have been attempts to fix the entire responsibility onto bankers. The reality is that domestic trends – most notably, slack regulation, the reckless boom in property markets and the out-of-control surge in public spending – would, sooner or later, have resulted in a crisis even without the catalyst of a global economic slump.
This said, of course, there is a global dimension to the crisis. The key elements of the global problem are structural, and form an essential context to the UK issues.
First, the global dynamic is seriously flawed. A system in which the west borrows Asian savings and spends the proceeds on imported consumer goods from Asia – and on imported energy, principally from the Middle East – is fundamentally unsustainable. In this context, two adverse trends
– escalating western indebtedness, and rapidly increasing energy costs - were running pretty much in tandem prior to 2008. Borrowed liquidity and excessive consumption – ‘excessive’, that is, in relation to domestic output – do not form a solid basis for a sustainable economy.
Second, the Anglo-American model, which has been a dominant economic ideology for three decades, has now suffered a serious (perhaps a crippling) setback. This issue was discussed at length in Issue Two, and will no doubt recur in future reports as we comment further on the implications of the emergence of the ‘new normal’.
Since this section of our report – which aims to examine the true scale of the problems which the UK faces – is necessarily depressing, let’s take a line-item look at the biggest challenges. Only then can some solutions be explored.
These issues are:
1. The true extent of government indebtedness, including off-balance-sheet liabilities such as public sector pensions and PFI obligations.
2. The real scale of the deficit when increments to these off-balance-sheet items are taken into account.
3. The very real risks posed by excessive government borrowing.
In examining each of these issues, it is essential to bear in mind that the solutions to these problems can only be found if policymakers and the public (a) face the current situation as it really is, and (b) understand the root causes of these problems.

strategy insights | issue four38
britain at the crossroads | the case for fundamental change
the real scale of national indebtedness
According to the 2010 budget, and excluding the one-off effects of the financial sector intervention, public sector net debt stands at £760bn, equivalent to 54% of GDP. Based on official forecasts, this number will rise to £1.37 trillion (75% of GDP) by 2014-15. Neither figure, we are reassured, is particularly high by international standards, which is true – but only as far as it goes. Unfortunately, the
current figure is not an accurate reflection of the true scale of public sector indebtedness, while the forward projections seem to us to be fancifully optimistic anyway.
First of all, the reported debt figures exclude obligations under the PFI (Private Finance Initiative) programme. Based on published data, projects completed thus far under PFI have
had a capital cost to the contractors of £55bn. Annual payments by the government currently stand at some £7.8bn, and are projected – on the basis of current projects only – to peak at around £9bn in 2017 before declining gradually over a repayment schedule which runs to 2047
Fig. 7: PFI economics – existing projects
Year to endMarch (£bn)
Pre-2010* 2010 2011 2012 2013 2014 2015 2016 2017 2018 2019 2020 2021 2022 2023 2024 2025
Capital cost £55
Payments £45 £7.8 £8.1 £8.3 £8.6 £8.7 £8.9 £8.9 £9.1 £8.5 £8.7 £8.6 £8.3 £8.2 £8.2 £8.4 £8.3
NPV of futurepayments
£110 £7.8 £7.7 £7.4 £7.3 £6.9 £6.6 £6.2 £5.9 £5.2 £4.9 £4.6 £4.1 £3.9 £3.6 £3.5 £3.2
Total repayment £155
Discount rate 4.0%
*1997-2009
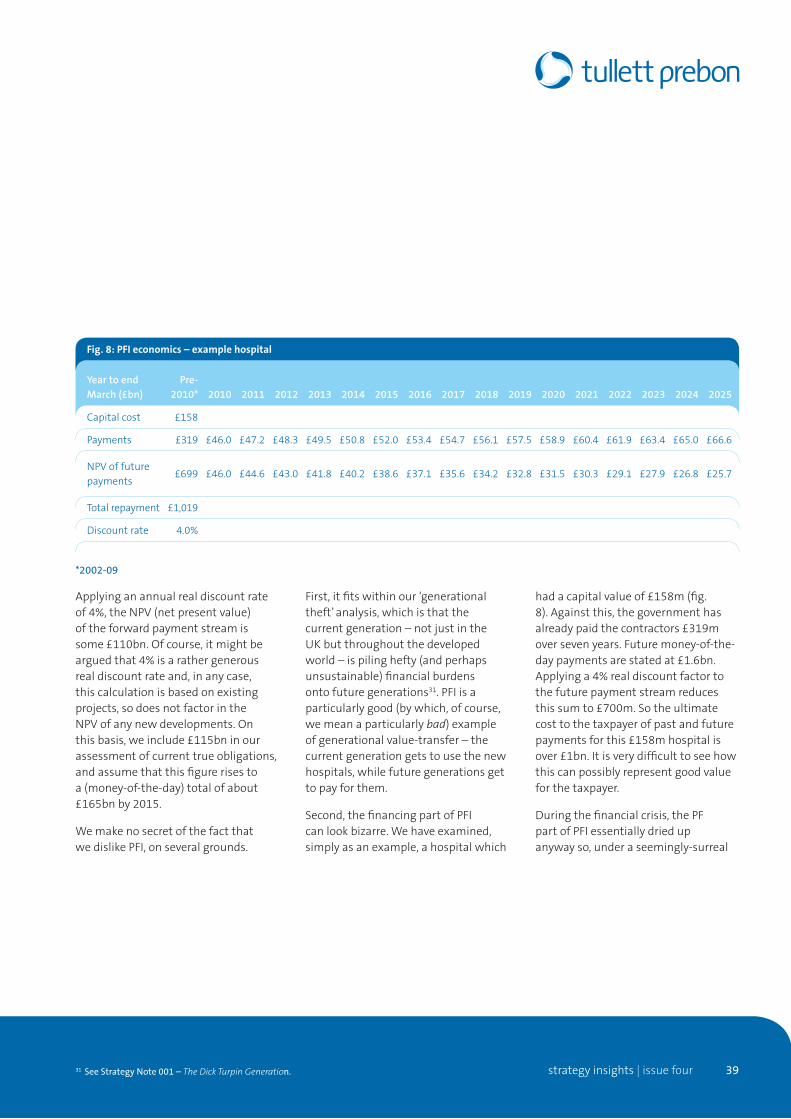
strategy insights | issue four 3931 See Strategy Note 001 – The Dick Turpin Generation.
Applying an annual real discount rate of 4%, the NPV (net present value) of the forward payment stream is some £110bn. Of course, it might be argued that 4% is a rather generous real discount rate and, in any case, this calculation is based on existing projects, so does not factor in the NPV of any new developments. On this basis, we include £115bn in our assessment of current true obligations, and assume that this figure rises to a (money-of-the-day) total of about £165bn by 2015.
We make no secret of the fact that we dislike PFI, on several grounds.
First, it fits within our ‘generational theft’ analysis, which is that the current generation – not just in the UK but throughout the developed world – is piling hefty (and perhaps unsustainable) financial burdens onto future generations31. PFI is a particularly good (by which, of course, we mean a particularly bad) example of generational value-transfer – the current generation gets to use the new hospitals, while future generations get to pay for them.
Second, the financing part of PFI can look bizarre. We have examined, simply as an example, a hospital which
had a capital value of £158m (fig. 8). Against this, the government has already paid the contractors £319m over seven years. Future money-of-the-day payments are stated at £1.6bn. Applying a 4% real discount factor to the future payment stream reduces this sum to £700m. So the ultimate cost to the taxpayer of past and future payments for this £158m hospital is over £1bn. It is very difficult to see how this can possibly represent good value for the taxpayer.
During the financial crisis, the PF part of PFI essentially dried up anyway so, under a seemingly-surreal
Fig. 8: PFI economics – example hospital
Year to endMarch (£bn)
Pre-2010* 2010 2011 2012 2013 2014 2015 2016 2017 2018 2019 2020 2021 2022 2023 2024 2025
Capital cost £158
Payments £319 £46.0 £47.2 £48.3 £49.5 £50.8 £52.0 £53.4 £54.7 £56.1 £57.5 £58.9 £60.4 £61.9 £63.4 £65.0 £66.6
NPV of futurepayments
£699 £46.0 £44.6 £43.0 £41.8 £40.2 £38.6 £37.1 £35.6 £34.2 £32.8 £31.5 £30.3 £29.1 £27.9 £26.8 £25.7
Total repayment £1,019
Discount rate 4.0%
*2002-09

strategy insights | issue four40
britain at the crossroads | the case for fundamental change
arrangement, government agreed to lend money to contractors who would, in return, effectively lend it back to the government (at a profit) through PFI. There must surely be better ways of financing public sector capital projects.
Third, we suspect that the capital repayment stream does not capture the full value to contractors (who, for example, can control the maintenance of facilities such as hospitals, thereby denying the government the competitive benefits of either competitively out-sourcing these services or taking them in-house – anecdotes abound about nurses being forbidden even to change light-bulbs in PFI hospitals).
Next – and vastly larger in absolute terms – is the issue of public sector pensions. These are operated on a PAYGO (pay as you go) basis, meaning that they are not funded – rather, those drawing pensions today are paid from the contributions of today’s workers. Because of the way in which unfunded public sector pensions obligations are accounted, the future liability does not appear on the government balance sheet, but exclusion of this committed liability hugely distorts perceptions of the national debt.

41strategy insights | issue four
Fig. 9: Estimated public sector indebtedness, based on budget debt forecasts
2010 2015*
£bn % of GDP £ per household** £bn % of GDP £ per household**
Reported debt £761 54% £29,843 £1,366 75% £53,569
Increment £243 17% £9,529 £252 14% £9,882
Treaty debt £1,004 71% £39,373 £1,618 89% £63,451
PS pensions £995 71% £39,020 £1,195 66% £46,863
PFI £110 8% £4,310 £160 9% £6,289
Total obligations £2,109 150% £82,702 £2,973 163% £116,603
Memo items:
GDP £1,406 £1,824
External debt*** £5,902
How big is the pension liability? In 2006, the government calculated the sum at £650bn. In December 2008, the CBI estimated the liability at £915bn, a figure which the CBI itself said was ‘conservative’. We believe that the liability is rising by not less than £40 billion annually, so now probably stands at about £1,000bn (official figures do provide annual increments, but then write them out). Later in this report, we look at the role that tightening of public sector pension provisions will need to play if Britain is to get its real public sector indebtedness under control.
Before we move on to tot up our assessment of the ‘real’ level of national debt, we need to bear in
mind a critical distinction between on- and off-balance sheet public sector obligations. A government which controls the printing presses is unlikely to go bankrupt in its own currency. Rather, sovereign debts tend to be deflated away through the ‘soft default’ mechanism of devaluation and inflation. But the critical distinction is that this process does not work where off-balance-sheet obligations are concerned, because the monetary cost of these obligations tends to rise if the value of the currency deteriorates.
In addition to off-balance-sheet liabilities, one further component is required if we are to assess the full extent of the national debt. The reported debt number – for the end of
2009-10, £760bn – is computed on the government’s own methodology. But government also reports ‘Treaty debt’, which is debt calculated on the criteria specified by the Maastricht Treaty. The official number for the end of the 2009-10 fiscal year is 71% of GDP, or £1.0 trillion.
Together, then, Treaty debt, plus the two principal off-balance-sheet items, total some £2.1 trillion, or 150% of GDP, as set out in fig. 9. According to budget projections, Treaty debt will increase to £1.6 trillion by 2015. Adding off-balance-sheet items – and our expected increments to these items – to this forecast suggests that total obligations will reach £3 trillion (163% of GDP) by that date.
*Reported and Treaty debt based on budget forecasts **Based on 25.5 million households ***Source: CIA World Factbook data for end-2009

strategy insights | issue four42
britain at the crossroads | the case for fundamental change
32 Basedonasterlingexchangeratefor2009of$1.54=£1.
33 TheCIA World Factbookputsend-2009Irishexternaldebtat$2.4trillion,or$568,000foreach ofIreland’s 4.1millioncitizens.
Nor is this all. Budget debt projections, used in fig. 9, assume a real annual economic growth rate of 3.25% from 2012. Since we believe that this growth assumption is extremely over-optimistic (for reasons which will be explored later), we have run alternative calculations, again discussed later, on the basis that growth actually averages 2% whereas public spending remains at the officially-projected monetary level. On this basis, the total obligation rises to £3.15 trillion, or 180% of GDP (fig. 10).
Before leaving the subject of debt and turning to the more important issue of deficits, we need to bear in mind that the obligations discussed so far exclude
all private sector commitments (such as outstanding mortgages of £1.2 trillion, big pension liabilities, and very large corporate and consumer debts). Britain as a whole – government, businesses and individuals – is very deeply mired in debt.
In one sense, the domestic component of these debts is less important than the sums owed to overseas lenders. The CIA World Factbook puts the United Kingdom’s end-2009 external debt at $9.1 trillion, equivalent to about £5.85 trillion32. Though this debt is materially offset by overseas assets, the net sum remains very large (perhaps $7.5 trillion). Moreover, asset ownership and debt obligations are asymmetric
– a very high proportion of overseas assets is owned by corporates (such as oil companies) whose debts are comparatively small – so netting off is not realistically applicable.
At $9.1 trillion, British external debt equates to a rather disturbing $149,000 (say £96,000) per person, or £230,000 per household. The $149,000 per capita figure is far higher than the equivalent numbers for France ($78,000), Germany ($63,000) or the US ($44,000), and is much larger than the equivalents for Spain, Greece, Portugal or Italy (see fig. 11). (The figure for Ireland is frighteningly higher even than that for the UK)33.
Fig. 10: Estimated public sector indebtedness, based on 2% real growth
2010 2015
£bn % of GDP £ per household** £bn % of GDP £ per household**
Reported debt £761 54% £29,843 £1,542 88% £60,454
Increment £243 17% £9,529 £252 14% £9,882
Treaty debt £1,004 71% £39,373 £1,794 102% £70,336
PS pensions £995 71% £39,020 £1,195 68% £46,863
PFI £110 8% £4,310 £160 9% £6,271
Total obligations £2,109 150% £82,702 £3,148 180% £123,470
Memo items:
GDP £1,406 £1,752
External debt*** £5,902
* Reported and Treaty debt based on lower growth forecasts, assuming real GDP growth of 2.00% from 2011-12 **Based on 25.5 million households ***Source: CIA World Factbook data for end-2009
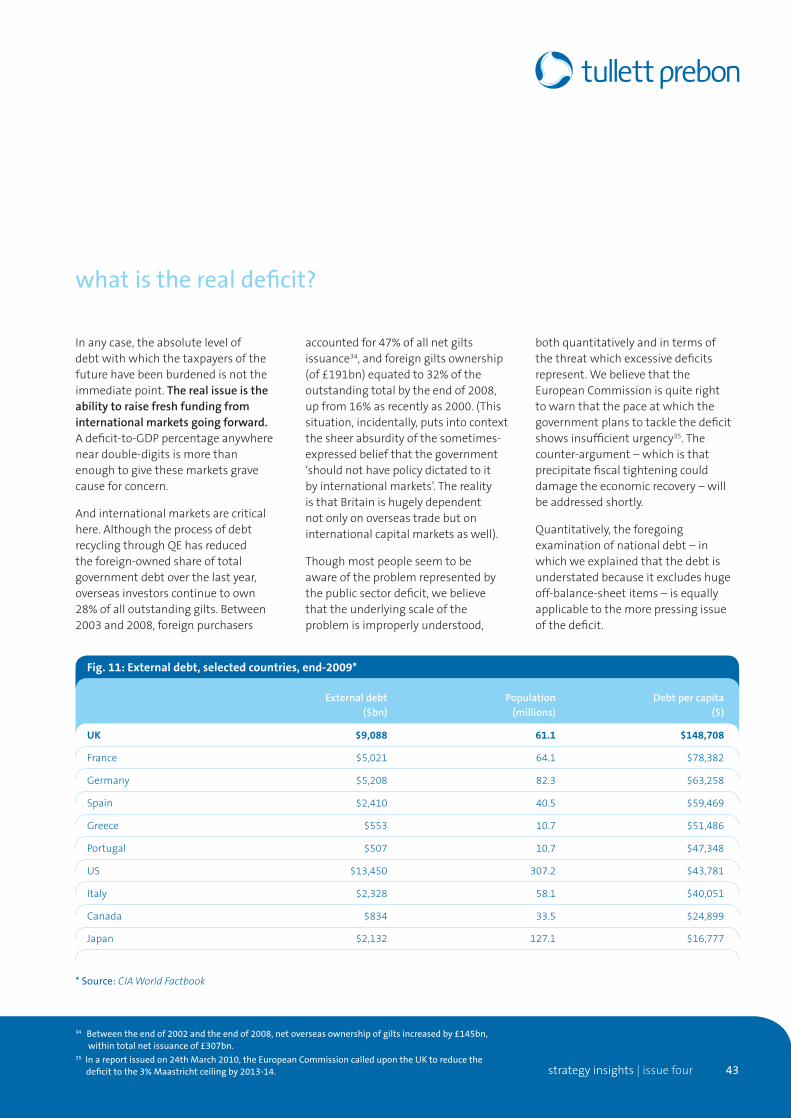
strategy insights | issue four 43
34 Between the end of 2002 and the end of 2008, net overseas ownership of gilts increased by £145bn, within total net issuance of £307bn. 35 In a report issued on 24th March 2010, the European Commission called upon the UK to reduce the deficit to the 3% Maastricht ceiling by 2013-14.
what is the real deficit?
In any case, the absolute level of debt with which the taxpayers of the future have been burdened is not the immediate point. The real issue is the ability to raise fresh funding from international markets going forward. A deficit-to-GDP percentage anywhere near double-digits is more than enough to give these markets grave cause for concern.
And international markets are critical here. Although the process of debt recycling through QE has reduced the foreign-owned share of total government debt over the last year, overseas investors continue to own 28% of all outstanding gilts. Between 2003 and 2008, foreign purchasers
accounted for 47% of all net gilts issuance34, and foreign gilts ownership (of £191bn) equated to 32% of the outstanding total by the end of 2008, up from 16% as recently as 2000. (This situation, incidentally, puts into context the sheer absurdity of the sometimes-expressed belief that the government ‘should not have policy dictated to it by international markets’. The reality is that Britain is hugely dependent not only on overseas trade but on international capital markets as well).
Though most people seem to be aware of the problem represented by the public sector deficit, we believe that the underlying scale of the problem is improperly understood,
both quantitatively and in terms of the threat which excessive deficits represent. We believe that the European Commission is quite right to warn that the pace at which the government plans to tackle the deficit shows insufficient urgency35. The counter-argument – which is that precipitate fiscal tightening could damage the economic recovery – will be addressed shortly.
Quantitatively, the foregoing examination of national debt – in which we explained that the debt is understated because it excludes huge off-balance-sheet items – is equally applicable to the more pressing issue of the deficit.
Fig. 11: External debt, selected countries, end-2009*
External debt ($bn)
Population(millions)
Debt per capita($)
UK $9,088 61.1 $148,708
France $5,021 64.1 $78,382
Germany $5,208 82.3 $63,258
Spain $2,410 40.5 $59,469
Greece $553 10.7 $51,486
Portugal $507 10.7 $47,348
US $13,450 307.2 $43,781
Italy $2,328 58.1 $40,051
Canada $834 33.5 $24,899
Japan $2,132 127.1 $16,777
* Source: CIA World Factbook

strategy insights | issue four44
britain at the crossroads | the case for fundamental change
According to budget figures, the deficit is projected to fall from £167bn (11.8% of GDP) in 2010-11 to £73bn (4.0%) by 2014-15. In fact, this is a rather misleading set of figures, for the following reasons:
• These numbers are based on the Treasury’s own definition of public sector debt, whereas adjustment to the Treaty basis is necessary for effective comparisons.
• The official numbers exclude annual increments to outstanding PFI and public sector pension obligations.
• Official projections assume annual real GDP growth of 3.25% annually from 2012 onwards, a forecast which (for reasons outlined later) we regard as over-optimistic.
Of these, the Treaty adjustment is the simplest, and can be calculated by comparing official Treaty debt numbers for the beginning and end of each
fiscal year. On this basis, the deficit is set to fall from £208bn (14.8% of GDP) in 2009-10 to £84bn (4.6%) by 2014-15.
Increments to PFI and public sector pension obligations are difficult to estimate, but are undoubtedly significant. The CBI, in the report mentioned earlier, calculated that the pension obligation increased by £265bn – from £650bn to £915bn - in the 29 months between March 2006 and August 2008, an annualised rate of increase of £110bn.
Because the CBI calculation assumes a significant item which might be regarded as a one-off – a £90bn ‘move to realistic mortality’ - this might materially overstate the ongoing rate of increase, though the remaining increment (of £175bn) still equates to £72bn annually. On the assumption – perhaps an optimistic one - that progress has been made towards containing the rise in the public sector pension obligation since 2008, we include annual increments of £40bn
in this line, together with smaller annual additions to outstanding PFI obligations. After adjustment both for the Treaty definition and for these off-balance-sheet items, we estimate that the underlying deficit was £255bn (18.2% of GDP) in 2009-10, and is likely to fall to £135bn (7.4%) by 2014-15.
However, one further adjustment is required. Where forward projections are concerned, the above calculation is based on Treasury forecasts which assume annual real GDP growth of 3.25% from 2012 onwards. Since we find this growth rate pretty implausible, we have calculated likely forward deficits on the basis of a more restrained (2%) real growth trajectory. On this basis, the underlying deficit – that is, aggregate additions to government indebtedness including Treaty adjustments and off-balance-sheet items – is projected at £170bn in 2014-15, equivalent to 9.7% of (lower) GDP for that year.
Fig 12: Foreign net purchasing of gilts, 2003-09
£bn 2003 2004 2005 2006 2007 2008 2009
Net issuance £20.7 £39.8 £50.3 £27.1 £41.6 £127.6 £149.2
of which foreign: £9.0 £17.8 £26.7 £25.0 £22.7 £43.3 £16.9
Foreign % 43% 45% 53% 92% 55% 34% 11%
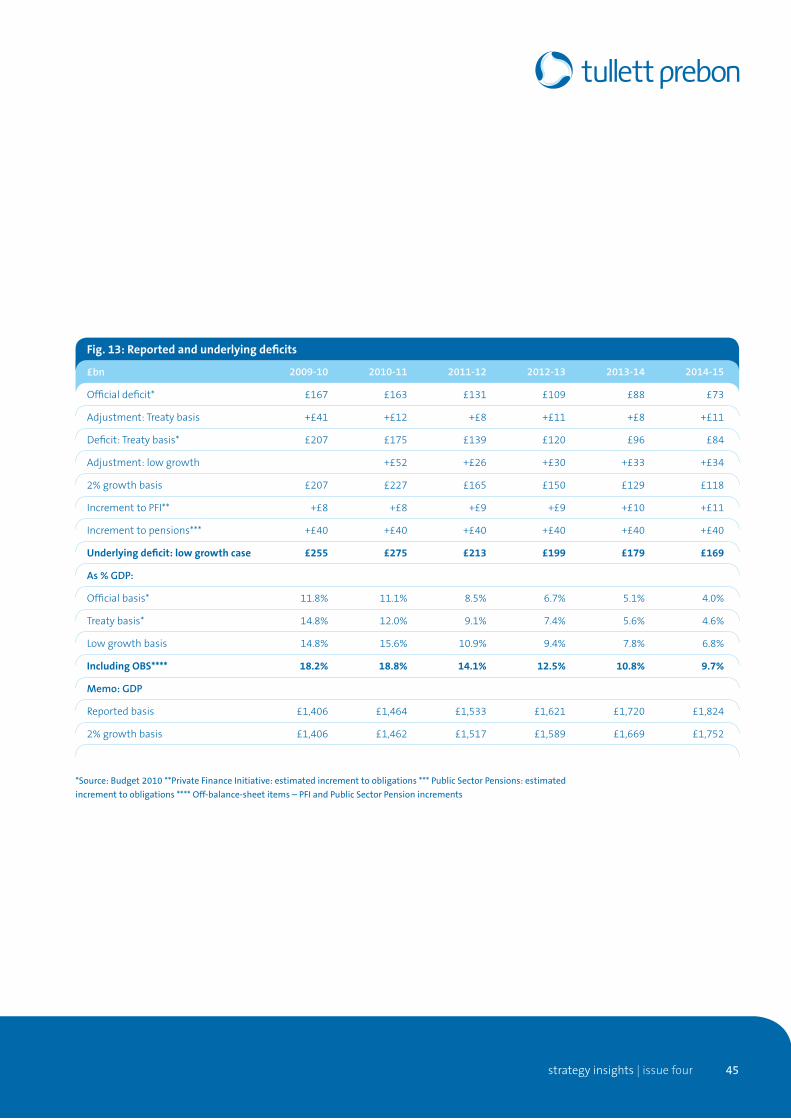
strategy insights | issue four 45
Fig. 13: Reported and underlying deficits
£bn 2009-10 2010-11 2011-12 2012-13 2013-14 2014-15
Official deficit* £167 £163 £131 £109 £88 £73
Adjustment: Treaty basis +£41 +£12 +£8 +£11 +£8 +£11
Deficit: Treaty basis* £207 £175 £139 £120 £96 £84
Adjustment: low growth +£52 +£26 +£30 +£33 +£34
2% growth basis £207 £227 £165 £150 £129 £118
Increment to PFI** +£8 +£8 +£9 +£9 +£10 +£11
Increment to pensions*** +£40 +£40 +£40 +£40 +£40 +£40
Underlying deficit: low growth case £255 £275 £213 £199 £179 £169
As % GDP:
Official basis* 11.8% 11.1% 8.5% 6.7% 5.1% 4.0%
Treaty basis* 14.8% 12.0% 9.1% 7.4% 5.6% 4.6%
Low growth basis 14.8% 15.6% 10.9% 9.4% 7.8% 6.8%
Including OBS**** 18.2% 18.8% 14.1% 12.5% 10.8% 9.7%
Memo: GDP
Reported basis £1,406 £1,464 £1,533 £1,621 £1,720 £1,824
2% growth basis £1,406 £1,462 £1,517 £1,589 £1,669 £1,752
*Source: Budget 2010 **Private Finance Initiative: estimated increment to obligations *** Public Sector Pensions: estimated
increment to obligations **** Off-balance-sheet items – PFI and Public Sector Pension increments

46 strategy insights | issue four
britain at the crossroads | the case for fundamental change
36 Exchange Rate Mechanism.
Even if we leave out both Treaty adjustments and the off-balance-sheet items, our 2% growth case puts the 2014-15 deficit at some £107bn (6.1% of GDP) rather than the £73bn (4.0%) predicted by the Treasury. In that year, we estimate government revenue at £665bn (£30bn below the Treasury forecast) and assume that public spending is in line with the projected £772bn. These calculations are summarised in fig. 12. Moreover, this calculation suggests only sluggish annual change between the out-turn for 2009-10 (£167bn) and our estimate for 2014-15 (£107bn). The European Commission is surely right to call for much more resolute action.
Investors need to be aware of quite how unprecedented such borrowing
levels are. In 1976 – when the UK needed an IMF bail-out to preserve the public finances – the ratio reached a hitherto-unprecedented 7%. In 1993-94, after the UK had crashed out of the European ERM36, the ratio reached an all-time (until now) peak of 7.7%. Historically, there seems to be a very strong correlation between the Maastricht-required 3% deficit ceiling and the health of the economy, a correlation which suggests that the current (and projected) levels of UK deficits may be unsustainable. Both in 1976 and in 1993-94, the value of sterling crashed, and drastic cuts in public spending became unavoidable. Yet on neither occasion did the deficit/GDP relationship reach anywhere near the double-digit rates now being experienced.

strategy insights | issue four 4737 ‘Our public debt is hitting Armageddon levels’, The Times, 27th February 2009. The article can be read at www.timesonline.co.uk/tol/comment/columnists/guest_contributors/article5811186.ece
vortex risk
The danger with running deficits at these unprecedented levels is that the UK runs significant ‘vortex risk’. What we mean by this is that the process may become a downward spiral if a lack of perceived determination to reduce the deficit spooks the international markets, at which point a very nasty, multi-dimensional feedback loop could kick in.
What happens first under this scenario is that the UK finds it increasingly difficult to secure foreign borrowings, meaning that interest rates rise. This in turn would have no less than three adverse implications. First, and most obviously, higher rates would damage an economic recovery which already looks extremely fragile. Second, higher rates would drive property prices downwards, inflicting further severe damage to consumer spending. Third, the cost of servicing government debt would rise, worsening the deficit.
The end-game of such a vortex process is full-scale currency crisis, in which sterling loses even more than the 25%
of its value that has haemorrhaged since 2007. This in turn could lead to an inability to borrow in sterling at all. In this situation, the sterling burden of servicing borrowings taken out in foreign currencies would escalate.
This kind of scenario seems to have been in the mind of Steve Bundred, chief executive of the Audit Commission, when he warned, in February last year, that the UK ran the risk of ‘[an] Armageddon scenario most feared by the Treasury - that there will be insufficient lenders to match the planned level of borrowing’. This, he warned, ‘begins to look a distinct possibility’37
It was in this context – that of a looming problem of funding government spending through new borrowings on international markets – that the decision was taken to engage in ‘quantitative easing’ (QE).
It should be said from the outset that the use of QE, though a dangerous decision, was the right one. Though the
term ‘money supply’ typically conveys the idea of a simple quantity of money, the effective money supply is actually a quantity-and-velocity equation. By velocity, economists mean the frequency with which money changes hands. In the context of the financial crisis, velocity naturally declined sharply as businesses and individuals scaled back their spending and endeavoured to hoard cash. Therefore, increasing the quantity of the money supply was an appropriate offset to a decline in its velocity.
As the authorities admitted when the policy commenced in March 2009, the use of QE is on this scale took the UK into uncharted territory. There were two obvious risks with this policy. The first was that QE would stoke up inflation. Though this is a real risk, it can be averted if – but only if – the QE process (a) is not over-used, and (b) is reversed at a later stage. The second risk was that QE could spook international markets by conveying the impression that the government was printing new money because

britain at the crossroads | the case for fundamental change
it was running out of the genuine commodity. This impression may have been reinforced by the fact that virtually all (99%) of QE purchasing has been directed to gilts rather than corporate bonds.
Printing money with which to fund government borrowings – the so-called monetisation of debt – is specifically forbidden under Article 101 of the Maastricht Treaty. The UK got around this restriction by purchasing existing gilts from (principally domestic) institutional investors whose risk profile essentially required them to reinvest the proceeds in new government paper. In other words, the use of QE to buy government debt paper seems to us to have confirmed the impression that debt was being monetised through the
back door, despite official protestations to the contrary38.
The introduction of QE was handled superbly in terms of public relations. Rather than ‘printing money’ – a term which conveys images of Weimar wheelbarrows or Zimbabwean billion-dollar loaves – a shiny new name was coined for a process which, it is insisted, is quite different from ‘printing money’ anyway. This is simply not true. Second, markets
have been informed that QE is wise and prudent because Britain faces a threat, not of inflation, but of deflation. Again, and in anything other than the short-term, this is simply not true either.
Where QE is concerned, our view is that the gamble has paid off, but that any further significant use of the process
could be extremely dangerous. QE has bought the government a vital breathing-space (as well as artificially depressing the rates at which government can borrow). But QE is a one-off, emergency contingency - if international markets ever came to believe that QE was anything other than a temporary, stop-gap measure, the UK could very soon find itself slipping into the kind of ‘vortex’ (the ‘Armageddon scenario’) described above.
From here on, government, irrespective of party, must move decisively towards balancing expenditure and revenue. This may appear difficult, especially if, as we strongly suspect to be the case, the British economy is appreciably weaker than is generally supposed.
Actually, we believe – and will explain in Part Three of this study - that cutting public spending may be a lot less painful than most commentators believe.
38 ‘the Bank is not being forced to create money in order to cover the gap between the government’s tax income and its spending commitments. If it were carried out to finance the budget deficit, it would be a violation of Article 101 of the Maastricht Treaty (which the United Kingdom must abide by, even though it is not a member of the euro zone). Rather, the Bank is undertaking quantitative easing in order to meet the inflation target and will sell the government debt back to the private sector once the economy recovers, thus unwinding the original increase in the money supply.
‘Central banks routinely buy and sell government debt in the secondary market as part of their normal operations in the money markets and such operations are not deemed to amount to monetary financing under the Maastricht Treaty. The only thing that distinguishes quantitative easing from normal operations is their scale and the length of time for which the assets are likely to be held’. Source: Bank of England web site
‘The excessive cost of
government provides a
valuable pointer towards
necessary reforms, and
leads us to believe that
it is perfectly possible for
government to cut spending
very markedly without
damaging the provision of
front-line services’.
strategy insights | issue four48

49strategy insights | issue four

50 strategy insights | issue four
4. the way we live now
To the limited extent to which there has been any public debate at all about the urgency of deficit reduction, the dividing line, essentially, has been between two views. The first, associated with the Conservatives, is that there is a need to commence deficit reduction without too much delay. The counter-argument, advanced by the government, is that early action to reduce the deficit would imperil the economic recovery. An ironic (and seemingly counter-intuitive) by-product of this positioning is that any bad news about the economy appears to strengthen the government’s case for ‘safeguarding the recovery’.
In fact, and as we have been at pains to argue throughout, this is a false debate, for two main reasons. First, the government’s argument assumes that Britain has plenty of time in which to tackle deficit reduction. This is not true. Time is in fact very limited. Second, the implicit assumption – and one underpinned by the optimistic budget growth projection – is that economic expansion will go a long way in itself towards bringing down the deficit. This isn’t true either. Britain cannot expect to ‘grow out of’ the deficit.
There has been a natural progression – through the TAT process described earlier – in which toxic risk has migrated from individuals, via the
‘The UK is in great need of a system
of governance which is more efficient,
less expensive, less intimidating, less
ideological, and more responsive to the
broader public’
britain at the crossroads | the case for fundamental change

51strategy insights | issue four39 Quoted in The Guardian, 26th January 2010.40 Central Government Net Cash Requirement.
banking system, to government balance sheets. Most conspicuously in the case of Greece, this has put sovereign debt into the firing line. Thus far, Britain has largely escaped from serious market pressure. In one sense, Britain’s comparative immunity is surprising, given the severe weakness of public finances which are, in the words of Pimco’s Bill Gross, ‘resting on a bed of nitroglycerine’39.
This immunity is purely temporary, and results, we believe, from three factors – we term them ‘the three props’ – each of which is essentially short-term in nature. These ‘props’ are:
1. Quantitative easing, which obviated any need for the UK government to seek new borrowings from the international markets despite a CGNCR40 fund-raising requirement of £201bn during 2009-10.
2. The imminence of the general election, which has given the UK a fragile ‘year of grace’ through market recognition that resolute action is unlikely to happen before the election takes place.
3. The weakness of sterling, which is regarded as an automatic stabiliser which should boost exports and deter imports, thus helping economic recovery.
Each of these ‘props’ is now fast approaching its sell-by-date. For reasons outlined earlier, QE is a strictly limited expedient which cannot be used on an ongoing basis without shaking investor confidence and triggering inflation. The election defence is obviously about to become time-expired. And sterling weakness does not appear to be boosting economic performance.
Our ‘three props’ interpretation leads us to believe that resolute action immediately after the election is imperative, such that the debate over timing is essentially a false one. We believe, first, that it would be too hazardous for the UK to use QE to monetise its deficit for a second year – if this happened, QE would begin to look like a permanent instrument, and markets would punish the UK accordingly.
Second, markets are not going to wait indefinitely for a UK economic recovery which, thus far, appears pretty feeble. Third, a post-election government (of whichever party) will no longer be able to play the ‘pre-election hiatus’ card. Markets will expect swift action immediately after the election.
Thus far, and despite solid recoveries in other developed nations such as the US, France and Germany, the British economy is lagging. The most
recent GDP figures (for the fourth quarter of 2009) showed growth of just 0.3%. Though the revised number was better than the initially-released figure (+0.1%), growth of 0.3% is, by any standards, anaemic, particularly when the weakness of sterling ought to be benefiting net trade. Far from benefiting from currency depreciation, the trade figures for January showed that the deficit had widened to £3.8bn. Moreover, the net figure emerges from a combination of weak imports (which have negative implications for levels of economic activity) and sluggish exports (which suggest that exporters are not benefiting from the depreciation of sterling).
The clear impression, then, is that the UK economy is mired in recession, even if a single quarter of only marginal growth is sufficient to mark the technical end of recession (which is defined as two or more quarters of consecutive GDP shrinkage). As we explained earlier, we suspect that reported GDP growth figures may be questionable anyway.

britain at the crossroads | the case for fundamental change
strategy insights | issue four52
the economy – what is the problem?
The overall impression, then, is that UK’s economy is not performing either as well as competitors’ or as well as might have been expected as the world economy gradually emerges from recession. Why?
The bottom line, we believe, is that UK competitiveness is being stifled by a system of government which is at once both excessively costly and unnecessarily interventionist. Industry is burdened by a level of regulation, much of it essentially petty, which runs the gamut from unduly prescriptive health and safety rules to a pursuit of equality which, while commendable in principle, imposes too great a burden on enterprise.
This interpretation seems to be borne out by the Global Competitiveness Report 2009-10, produced by the World Economic Forum (WEF). The UK has fallen by four places in the last two reports, and now ranks 13th in the rankings. While 13th sounds a reasonable position, this in part reflects some natural advantages (such as market size, and developed world levels of education and health).
Some of the detailed findings and trends are much more worrying. Britain ranks 75th on ‘wastefulness of government spending’, and 86th on ‘burden of government regulation’. These are only two categories within the 110 covered by the research, so
do not have a huge impact on overall rankings. But as individual measures they are telling. They mean that UK government spending is more wasteful than that of, for example, Tunisia, the Gambia, Malawi, Ethiopia or Albania, and government regulation is more burdensome in Britain than in Bulgaria, Nigeria, Pakistan or China.
These factors – government wastefulness and bureaucratic meddling – adversely impact the ‘offer’ which Britain makes to businesses, which can be summarised as follows:
‘We encourage you to invest in Britain. If you do so, you will be required to comply to the letter with vast codes of practice governing all aspects of your activities. You will be expected to act as an unpaid tax collector, collecting sales, income and local taxes. Your business will be subject to a tax code which, having more than doubled in length since 1997, now exceeds 10,000 pages. Even our own tax authorities do not fully understand the tax code but, where in doubt, we reserve the right to interpret it to our advantage. In addition to national regulatory and fiscal agencies, you should also expect interference from local authorities, to whom you will pay substantial taxes in return for minimal services. Welcome to the United Kingdom’
Obviously, this is put rather starkly. Obviously too, it highlights problems
which are by no means unique to the UK. However, we believe that over-complex and excessively costly government has been a by-product of an attempt to remodel society, certainly since 1997 and arguably since 1990. This shows up most obviously in bureaucracy where, as explained earlier, the bulk of the expansion has occurred not in the conventional civil service but in a plethora of ‘agencies’ and quangos. This is a critical issue, not just because of its adverse implications for business, but also because of the role that the expansion in the cost of government has played in creating an unsustainable fiscal deficit.
Given that the Prime Minister is the elected chief executive of the British government, one might expect him to rank at least somewhere near the top of the public sector pay league. In fact, this is not the case. Based on remuneration of £194,000 – and even excluding the government-owned banks from the list – Mr Brown ranked 297th in the 2008-09 league table of those employed by the taxpayer. Of the 296 people above him, only 11 were civil servants (of whom the highest paid earned £248,000).
Of the other 285 people paid more than Mr Brown, no less than 82 were employed (at an aggregate cost of £17.5m) by the health care trusts into which the NHS has been fragmented

53strategy insights | issue four41 Source: The Public Sector Rich List, 2009.
by quasi-market reforms. Some £4m was paid to seven employees of National Rail, £6.1m to 21 members of Transport for London, £3.2m to six Channel Four executives and £13.9m to fifty BBC managers. The £3.3m paid to four Royal Mail executives surely needs no further comment41.
In total, the 296 people who were paid more than Mr Brown in 2008-09 cost the taxpayer £81m. While this is not a major sum in the context of total public spending of £630bn during that year, it does highlight the sheer extent of the UK bureaucracy. The total cost of government administration – including all quangos, agencies and local authorities – is difficult to isolate, but our outline estimates suggest a figure of at least £150bn annually. We suspect that the overall cost of administering the NHS alone exceeds £25bn, with MoD administration costing about £8bn and HMRC perhaps £16bn.
As we explain later in this report, the excessive cost of government provides a valuable pointer towards necessary reforms, and leads us to believe that it is perfectly possible for government to cut spending very markedly without damaging the provision of front-line services. To be sure, this will not be easy. But, in a situation in which the deficit exceeds safe limits by more than £5,000 per household, there are no pain-free and easy solutions.

strategy insights | issue four54
britain at the crossroads | the case for fundamental change
part three: the road out
5. limited options
Thus far in this report, our aim has been to examine the origins and nature of the fiscal problems facing the United Kingdom. Essentially, government has allowed itself to be misled by a largely illusory boom in economic growth, and has driven spending up to – or rather, far beyond - levels that, surely naively, appeared affordable under those circumstances. As a result, and as soon as the illusory boom gave way to an all-too-real bust, the gap between revenue and expenditure widened, reaching levels which are both unprecedented and unsustainable.
The funding gap has, thus far, been met by the one-off (and risky) expedient of QE. Britain thus faces the very real risk of a ‘debt vortex’ unless resolute action is taken to reduce the deficit to a more viable level, by which we mean the 3% limit mandated by the Maastricht Treaty. It is to be hoped that our examination of the causes of the problem has suggested some of the solutions. First, though, we need to assess some of the basic options where the balance between revenue and spending is concerned. These options can be summarised as:
1. Business as usual.
2. Narrowing the deficit through tax increases alone.
3. Applying a balanced approach in which taxes are increased and spending is reduced.
4. Tackling the deficit entirely through spending reductions.
We think that we have made clear our view – which appears to be the view of informed observers, such as the European Commission, as well - that relying on growth to rectify the deficit is not going to work, neither will any such attempt command the confidence of markets once the ‘three props’ – QE, the pre-election hiatus and the devaluation of sterling – have fallen away.
Specifically, we believe that relying on real GDP growth of 3.25% annually is neither realistic nor, where markets are concerned, convincing. Therefore, we have assumed real growth of 2% annually in each of our case-studies. (We have also accepted the government’s inflation projections, though we are far from persuaded that
inflation will actually be as low as the official forecasts assume).
A business-as-usual scenario - in which growth is relied upon to bridge the deficit – is effectively the government’s default position, and is summarised in fig. 14. As yet, there have been neither major tax increases nor drastic spending cuts. The government has spoken of ‘restraint’ in public spending, but restraint and cuts are quite different things. Essentially, growth is relied upon to do most of the work in bringing down the deficit to 4% of GDP by 2015.
This objective is less ambitious than the European Commission – with which our own analysis agrees - believes to be necessary. Moreover, it is heavily dependent upon growth assumptions which look to us pretty heroic. We have tested the government’s spending plans against a core 2% growth assumption and a downside 1% case. In the former, the deficit is over £100bn in 2015, is an uncomfortable 6.1% of GDP. Using a 1% growth assumption, the outcome is, naturally, even worse.

strategy insights | issue four 55
Fig 14: Budget projections
£bn 2008-09 2009-10 2010-11 2011-12 2012-13 2013-14 2014-15 vs 09-10
Revenue £534 £508 £541 £582 £621 £660 £699
(as % GDP) 37.2% 36.1% 37.0% 38.0% 38.3% 38.4% 38.3%
Expenditure £630 £674 £704 £713 £730 £748 £772
(as % GDP) 43.9% 47.9% 48.1% 46.5% 45.0% 43.5% 42.3%
Deficit £96 £167 £163 £131 £109 £88 £73
(as % GDP) 6.7% 11.8% 11.1% 8.5% 6.7% 5.1% 4.0%
Treaty debt £796 £1,004 £1,179 £1,318 £1,438 £1,534 £1,618
(as % GDP) 55% 71% 81% 86% 89% 89% 89%
Memo:
GDP £1,435 £1,406 £1,464 £1,533 £1,621 £1,720 £1,824
Growth -1.50% -3.75% 2.00% 3.00% 3.25% 3.25% 3.25%
GDP deflator 2.50% 1.75% 2.25% 1.50% 2.50% 2.75% 2.75%
In 2010 £:
Revenue £547 £508 £529 £561 £584 £604 £622 +22.6%
Expenditure £645 £674 £689 £687 £686 £684 £687 +2.0%
Deficit £99 £167 £159 £126 £102 £81 £65

strategy insights | issue four56
britain at the crossroads | the case for fundamental change
Next, let’s consider dealing with the deficit entirely through raising taxes (a strategy that would no doubt be popular with many in the public sector). Using this approach, narrowing the deficit to our self-imposed but, we think, reasonable objective – a deficit of 3% by 2015 – involves increasing the tax take by 26%, in real terms, over five years. To put this in broad-brush terms, this increase, were it spread equally across all categories of taxation, would imply VAT of 22%, basic-rate income tax of 25%, and higher-rate tax of 50%, accompanied, of course, by big hikes in excise duties on items such as alcohol and fuel.
In real (2010) terms, it would burden the average household with extra taxes of over £5,200 per year, equivalent to
a reduction of almost 15% in average household after-tax income. After the deduction of non-discretionary costs such as utilities, food, housing and fuel, this would decimate the average consumer’s discretionary spending capability. This would wreak havoc on discretionary industries (such as leisure and non-food retailing). Since the word ‘lethal’ would not be too strong a term to apply to the implications of this for business, investment and trade, a national decision to fix the deficit entirely through tax hikes could amount to a collective economic suicide pact.
A balanced approach might work, and seems likely to be applied unless the next UK government is serious about reducing spending to levels
that are affordable within the levels of government revenue that are likely given a realistic growth trajectory. Incorporating already-announced tax rises, achieving a reduction of the deficit to 3% of GDP over five years via this route might see the real-terms tax take rise by about 20%, combined with a real-terms spending reduction of 4%. If huge swathes of spending (such as health and education) were ring-fenced – which we think would be a mistake – then real-terms spending in unprotected areas could fall by 8-10%. In many ways, this scenario would be commendable only in the sense that it would spread pain across the board.

strategy insights | issue four 57
Fig 15: Case study based on tax at 35% of GDP, deficit at 3%
£bn 2008-09 2009-10 2010-11 2011-12 2012-13 2013-14 2014-15 vs 09-10
Revenue £534 £508 £525 £541 £564 £588 £614
(as % GDP) 37.2% 36.1% 35.8% 35.6% 35.4% 35.2% 35.0%
Expenditure £630 £674 £672 £667 £668 £668 £667
(as % GDP) 43.9% 47.8% 45.9% 43.9% 41.9% 40.0% 38.0%
Deficit £96 £166 £147 £126 £104 £80 £53
(as % GDP) 6.7% 11.8% 10.0% 8.3% 6.5% 4.8% 3.0%
Treaty debt £796 £1,004 £1,218 £1,362 £1,482 £1,573 £1,637
(as % GDP) 55% 71% 83% 90% 93% 94% 93%
Memo:
GDP £1,435 £1,409 £1,465 £1,520 £1,593 £1,672 £1,756
Growth -1.25% -3.50% 1.50% 2.00% 2.00% 2.00% 2.00%
GDP deflator 2.50% 1.75% 2.25% 1.50% 2.50% 2.75% 2.75%
In 2010 £:
Revenue £547 £508 £514 £522 £530 £538 £546 +7.6%
Expenditure £645 £674 £657 £643 £628 £611 £594 -11.9%
Deficit £98 £166 £144 £121 £98 £73 £48
britain at the crossroads | the case for fundamental change
This kind of pain-spreading approach would then pose two possibilities. One is that government would become unpopular with virtually everybody, from tax-payers and businesses at the one end of the spectrum to public sector workers at the other. The alternative (and much more politically likely) possibility is that government would go soft on the deficit target. This would deliver the worst of all worlds – sluggish economic growth, and a continuation of all of the potential hazards (such as higher interest rates and inflation) that accompany ‘vortex risk’.
Is there, then, a viable alternative? We believe that there is. The massive increase in public expenditures over the last decade has been hugely wasteful, most notably in terms of the costs of administration. For example, administration absorbs 20% of the budget of the Ministry of Defence, whereas international peers get by on just 11%. Much the same applies to the NHS and, indeed, to most aspects of administration. On top of that are the huge expenditures incurred by the forest of quangos that has proliferated over the last two decades.
If we start with the assumption – before going on to look at how it might be accomplished – that slashing
administrative costs can deliver huge savings, what would be the implications for fiscal balances? Our ‘drastic reform’ case-study, set out in fig. 15, assumes that government makes two very bold decisions.
The first is that government should live within its means. This means reversing the current situation, in which government decides what it would like to spend and only then sets out to find this sum through taxation and borrowing.
The second bold decision is that the UK needs to create a more competitive economy by reducing the tax take, albeit only slightly, to 35% of GDP from the current 36%. Therefore, the object of the exercise is to tailor spending to the twin objectives of (a) fitting within a 35% tax take, and (b) reducing the deficit to 3% of GDP over five years. Naturally enough, this means cutting public spending from 48% of GDP in 2009-10 to 38% by 2014-15. How this seemingly-difficult challenge might be accomplished is considered in the next chapter.
In nominal, money-of-the-day terms, this objective indicates that spending in 2014 would, at about £670bn, be about the same as the sum spent in 2009-10. In real, inflation-adjusted
58 strategy insights | issue four

42 See The James Review of Taxpayer Value.43 See HM Treasury, 2004 Spending Review, www.hm-treasury.gov.uk/d/sr2004_ch1.pdf
terms, of course, spending would decline by 12% in this scenario, to £594bn at 2010 values, compared with the 2009-10 out-turn of £674bn.
At this point, some will doubtless suggest that a spending cut of this magnitude would be impossibly difficult, and would inflict serious damage on the public services. But reducing spending to about £590bn at 2010 values would still leave real expenditures well ahead of the 2004-05 level (£560bn), let alone the out-turn in 2001-02 (£480bn). Public services did not seem desperately cash-starved in the first half the decade.
Moreover, both of the main parties have, in the recent past, accepted the need for precisely the kind of cost-cutting that we advocate here. In 2005, David James, for the Conservatives, produced a report42 in which he identified £35bn of potential savings, equivalent to about £49bn at 2010 values. On behalf of the government, Peter Gershon produced a report43 pointing to similar potential savings.
If – as we very strongly believe to be the case – a real-terms saving of £80bn can be accomplished over five years largely by cutting bureaucracy, the benefits would be enormous. Competitiveness would
benefit from lower taxes and less intrusive government. The scope for discretionary spending by the consumer would increase, leaving him or her better off. The deficit would decline to 3% by 2015, and would be likely to fall further thereafter. And spending reductions on this scale would give Britain a margin of error for coping with any unexpected economic setbacks in the future.
And there is every reason for factoring a significant degree of caution into forward planning, because current assumptions seem to us unduly optimistic – and not just where future growth rates are concerned. The first of these concerns inflation, which we are by no means convinced will follow the benign course assumed in current official projections. Though much has been made of deflationary risk, the fact remains that inflation (even as measured on the far-from-ideal CPI basis) remains obstinately above expectations.
Our core thesis – to be outlined in detail in Issue Five – is that the global financial system is in the grip of a series of ‘dangerous exponentials’, which include a trend towards sharply higher levels of debt and of fiat money, combined with demographic pressure and looming resource constraints. Put
simply, this means that an economic system which, by its nature, must grow, may be on course to collide with a global resource set which, by definition, cannot grow. This, to us, unmistakably spells inflation on anything other than a short-term view. Additionally, the UK faces local inflationary pressures through an ominously weak currency, through the temptation to push inherently-risky QE one stage too far, and through a looming energy squeeze.
The latter poses an additional risk for the next government. For a start, UK production of natural gas is declining rapidly, meaning that imports will increase successively. Second, energy policy has been bungled by successive governments. The Conservatives presided over a ‘dash for gas’ which, in addition to depleting reserves, skewed Britain’s power generation industry firmly towards gas.
strategy insights | issue four 59

strategy insights | issue four60
britain at the crossroads | the case for fundamental change
44 Hartlepool and Heysham 1 (2014), Hinckley Point B and Hunterston B (2016), and Dungeness B (2018).45 See The Times, 16th August 2004.46 Mr Wolfgang (then aged 82) was a long-time Labour activist who was forcibly ejected from the 2005 party conference (and briefly detained under Section 44 of the Act) for heckling a speech by Jack Straw about the Iraq War. Maya Evans (25) was arrested for reading out a list of British war dead opposite the Cenotaph.47 Our favourites from the 2008 crisis included ‘Origami Bank has folded, Bonsai Bank is cutting its branches and Karaoke Bank is being sold off for a song’.
Under both administrations, there has been a lamentable failure to bite the nuclear bullet. Of Britain’s eight nuclear reactors, five44 - accounting for 60% of installed capacity – are due to close within the coming eight years, yet past government vacillation has meant that no new capacity is likely to come on stream until 2019.
The combination of local weaknesses and global ‘dangerous exponentials’ obviously spells inflationary risk, but it also spells higher interest rates, even if government succeeds in retaining the confidence of the international bond markets (something which is by no means certain unless resolute action is taken). This would be a multi-pronged threat. In addition to the ‘vortex risk’ described earlier, higher interest rates would cause an escalation in the cost of servicing government debt – which already costs more than defence or law and order - and would put further pressure on consumers both through higher mortgage costs and falling property prices.
The future, then, is fraught with economic risk at a time when the pre-election debate is characterised by vagueness and unreality. And there is one further area in which Britain’s
functioning as an effective free-market economy is clearly at risk, even if this can be addressed only briefly here. This is an increasing tendency towards coercion and surveillance. No less a person than then Information Commissioner Richard Thomas warned in 2004 of the danger of ‘sleepwalking into a surveillance society’45. One does not need to be Walter Wolfgang or Maya Evans46 to suspect that anti-terror laws are being used for purposes far beyond the original intentions of Parliament. It is possible, indeed, to envisage a future in which the British population is subjected to ever-increasing taxation and charging to sustain an administrative superstructure which is increasingly coercive as well as unaffordably costly.
This brings us to a point raised much earlier in this report, where we addressed the apparent mismatch between, on the one hand, a society that is by no means as ‘broken’ as is widely supposed and, on the other, a population which
is deeply dissatisfied. In our earlier discussion of this conundrum, we suggested that politicians might actually try the innovation of listening to the public. Were they to do this, they might appreciate that the governing elite is increasingly out of touch with the governed on a gamut of issues ranging from discontent at ‘fat cat’ government, to excessive taxation and charging, to over-complex and petty regulation. It is well known that depression and de-motivation can seriously undermine the performance
of the individual, but it is perhaps less appreciated that this is equally true of a society or an economy. So efficiency, social cohesion, economic weakness and fiscal overstretch seem to point towards the same conclusion, which is that the UK is in great need of a system of governance
which is more efficient, less expensive, less intimidating, less ideological, and more responsive to the broader public.
‘The future is fraught
with economic risk
at a time when the
pre-election debate
is characterised
by vagueness and
unreality’.
strategy insights | issue four 61
6. practical alternatives
48 The per-household equivalent of a £167bn deficit is £6,550.49 5th July 2009.
In any financial crisis, a grim gallows humour tends to develop in the markets47. One of the pithiest – but, as it turned out, most inaccurate – such quips of the 2008 crisis was that ‘the only differences between Iceland and Ireland are one letter and six months’.
To be sure, Ireland had faithfully followed the same irresponsible economic approach which had effectively bankrupted Iceland. But Ireland has – albeit painfully – avoided the fate of Iceland, for two main reasons. Since an independent Irish currency would almost certainly have disintegrated in much the same way as the Icelandic króna, it is clear that the first of these reasons has been Ireland’s membership of the Eurozone. But the second reason for Ireland’s comparative resilience is that the Irish government reacted with commendable resolution, most notably by introducing public sector pay restraints which, combined with a pensions levy, effectively amounted to reductions in public sector pay of between 12% and 15%.
This is not a policy which we recommend in Britain’s rather different circumstances, but there is one aspect of the Irish story which has particular significance in this context. It is the observation that, beyond some noisy demonstrations and a pretty
modest number of strikes, public sector workers in Ireland have largely accepted the need for government spending restraint. While it is too soon yet to judge whether public sector employees in Greece will respond as phlegmatically as their Irish counterparts, there seems to be every likelihood that Greece will succeed in imposing significant restraint without system-stopping unrest.
There are, essentially, two perceived obstacles to the implementation of big public spending cuts in the UK, of which the first (and biggest) is a fear that public sector workers will react by bringing government to a standstill. We think that this fear is over-rated. When the delayed bill for the recession arrives – which it indubitably will – public sector employees will become aware of two things. First, that they have hitherto enjoyed not only better conditions of employment (and far superior pension arrangements) than their private sector counterparts but, latterly, have received higher average earnings as well (so that the traditional defence of the pension scheme, on the grounds that it is a form of compensation for lower earnings, is no longer valid). Second, it needs to be explained that the British state has, for many years, been living beyond its means to an extent that now
equates to more than £6,500 per UK household48.
The second perceived obstacle to spending cuts is that front-line services will necessarily suffer severe damage. But, as our analysis of the nature of the over-spend has endeavoured to explain, this assumption need not be correct. Essentially, the British public sector over-spends because it is over-managed. Far from improving the quality of public services, this over-management has resulted in excessive complication, an undue reliance on an arbitrary and distorting target culture, and a diversion of resources away from front-line services.
This suggests that cutting spending will be by no means as difficult as is generally supposed. Writing in The Guardian49, Audit Commission chief executive Steve Bundred explained why the need for big cuts in public spending need by no means lead to a degrading of front-line services, pointing out that ‘the idea that spending cuts will destroy the quality of public services’ is a ‘myth’. ‘Even if a budget reduction of some £50bn fell entirely on lower spending rather than higher taxes, that would still leave us with a real level of public spending greater than in 2003/04, when services were not noticeably worse than they are now.

strategy insights | issue four62
britain at the crossroads | the case for fundamental change
50 Adjusted for subsequent inflation, public spending in 1999-2000 (of £343m) equates to £437m in 2010 money, meaning that actual spending (of £676m) equates to a real terms increase of 55%.
Moreover, as most public sector workers know, some services remain underfunded, but the relationship between spending and service quality is at best complex and in many instances tenuous’. ‘So don’t believe the shroud wavers who tell you grannies will die and children starve if spending is cut. They won’t’, concluded Mr Bundred. ‘Cuts are inevitable, and perfectly manageable’.
Mr Bundred is surely right about this. Moreover, we believe that the approach to be adopted in the UK needs to be rather more nuanced than it has been in Ireland. For the most part, we do not believe that government needs to cut the wages of any public sector workers earning less than the national average wage (about £21,000 per year). In this category, a pay freeze is likely to suffice. Rather – and in addition to tackling the pensions problem - government needs to look at imposing graduated cuts, restricting Irish-scale reductions to those earning more than £30,000 per year. Though any future government is going to need a pretty thick skin where public sector pay restraint is concerned, there are ways of handling the need for cuts which can help to offset adverse reactions.
This said, there is an undoubted need to reduce the overall public sector pay
bill, but this, we think, can be best accomplished by a sharp reduction in the numbers of administrative staff. Entire entities – to name just one category amongst many, the regional development agencies – could be scrapped with no detriment to the quality of public services. Spending cuts need not mean that public services suffer, or – contrary to the predictable protestations of some public sector unions – that the incomes of such low-paid worthies as school dinner-ladies or hospital porters need suffer either.
Moreover, and since the real level of government expenditure increased by 55%50 between 1999-2000 and 2009-10, it would be remarkable if current outlays did not include huge swathes of waste. As we have remarked earlier, the template for future success is often to be found in the errors of the past which, in this instance, means reversing much of the improperly-controlled expansion in the scale and cost, not of public services, but of government itself.
‘Efficiency, social cohesion,
economic weakness and
fiscal overstretch seem to
point towards the same
conclusion, which is that
the UK is in great need of
a system of governance
which is more efficient, less
expensive, less intimidating,
less ideological, and more
responsive to the broader
public’
strategy insights | issue four 63
So what is needed is wholesale reform of a public sector which has become massively over-managed. Since this applies as much in health and in education as it does in other areas, we see no need (beyond pre-election posturing) for ring-fencing any spending areas where the requirement for reform-driven spending reductions is concerned. In several areas – most notably health – government needs to start reversing a quasi-market process which has fragmented public services, and increased costs, while generating little if any real competition and giving the public very little real freedom of choice. We believe that patients, and for that matter parents, would prefer good quality public services based locally, rather than an often spurious (and impossible-to-exercise) ‘choice’ between different hospitals and schools.
We also believe that government needs to become far smarter where the use of technology is concerned. Government employees need to understand that laptops and data-sticks are not designed to boost freedom of information by being left on trains or in cabs. The aim with
information technology should be the efficient conduct of administration, not an increase in the endeavour to control a population which is already subject to massively intrusive systems of surveillance. Abuse of anti-terror powers should itself be rendered a criminal offence, and made subject to the binding oversight of the Information Commissioner.
As well as dealing with current issues, a future government needs to look
ahead, and to try to anticipate future trends which could put the public finances under renewed stress. In doing this, two key factors need to be
borne in mind. The first of these is the demographic challenge posed by an ageing population and a worsening ratio between working-age and retired people. The second is the trend towards ‘dangerous exponentials’, mentioned earlier, and which will be explained in a forthcoming Strategy Insights report. For UK purposes, this issue points to a need to move away from a growth-and-debt model which, in Britain as elsewhere, is based upon the assumption that the economy can continue to grow indefinitely despite the confines of a finite resource set. Specifically, this implies awareness of
potential resource constraint (most notably, but by no means only, in terms of energy).
Britain’s public sector pension obligations, unless tackled resolutely, could turn into a fiscal time-bomb. Therefore, a key imperative is to ensure that this obligation ceases to grow. Specifically, government needs, at the minimum, to raise public sector pension contributions to the point where annual income at least covers annual outgoings. Similarly, to avoid the build-up of future financing problems, we advocate scrapping PFI with immediate effect, and reverting to the historic policy of directly funding capital projects.
As well as seeking to defuse future fiscal time-bombs, it is imperative that action is taken to prevent a recurrence of the borrowed boom of 2000-07 and the ensuing crash of 2008-09. The first requirement here is to dismantle the failed tripartite system. The FSA has a vital role to play in ensuring probity and consumer protection in the financial services industries, but regulation of the banking system itself needs to be handed back to the Bank of England. It is essential that monetary targets be recalibrated to include asset inflation.
‘The British public sector
over-spends because it is
over-managed’

britain at the crossroads | the case for fundamental change
64
51 The quest for national efficiency was the title of a ground-breaking 1971 study by G.R. Searle, which examined Britain’s attempt to respond to the growing industrial rivalry of the United States and Germany between 1890 and 1914. strategy insights | issue four
Since property price expansion is by far the largest cause of bubbles, the government should re-impose limits on mortgage lending, where we believe that a maximum multiple of 5.5 times proved net income, and a maximum LTV of 85%, are essential.
While bank regulation needs to be tightened, essentially petty intervention in other areas needs to be reduced. Government needs to adopt a ‘self-denying ordinance’ and, in addition to creating mandatory limits to deficits, start to reverse the historic process of ever-greater interference in the conduct of business.
Welfare reform needs to focus primarily on eliminating the poverty trap. Essentially, this trap refers to marginal changes of income which impose a severe deterrent on those seeking to move from benefits to work. One step in the right direction would be to seek to raise the income tax threshold to the equivalent of the minimum wage (some £10,000, based on current rates). This could be paid for by dismantling the over-complicated and capricious tax credit system. At the same time, the National Insurance fiction should be abolished by combining NI into income tax.
Alone, these measures might not be sufficient to eliminate the poverty trap (though they
would go a long way towards it). Consequently, if the excessively-narrow difference in quantity cannot be widened sufficiently, it could be counterbalanced by a distinction of quality. In other words, part (perhaps as much as 80%) of benefits could be paid not in cash but in kind. As a result, a person who moved from benefits to work would enjoy not only a larger income in the absolute but the significant additional incentive of a greater freedom in how this could be spent.
We have remarked earlier that the tax system has long incentivised debt over equity capital by allowing interest expense, but not dividends, to be offset against tax. It has been argued, disingenuously, by defenders of the current system, that removing interest relief would damage big UK corporates. The solution would be simple – a cap limiting the interest deduction to no more than 20% of pre-tax profits.
Other desirable reforms will have been obvious from our analysis of the history and nature of the British malaise. The ID card scheme – which, as well as being ludicrously expensive, threatens to take the UK even further
down the surveillance and intrusion route – should be scrapped, as, indeed, should an NHS IT programme which is on course to cost Britain more than
£20bn. There is a crying need for thoroughgoing reform of local government.
The essence of our analysis is that the UK needs to modernise, and to commence a new ‘quest for national efficiency’51. Other progressive measures could follow from this, including electoral
reform (moving away from the unrepresentative first-past-the-post system), an overhaul of the welfare/taxation interface (where a system of ‘negative income tax’ would be a bold step forward), and the creation of an elected (rather than, as now, and ludicrously, a nominated) second chamber. But the most important need by far is for economic and administrative reforms designed both to reverse the economic and fiscal crisis and to prevent such crises recurring in the future.
Dr Tim MorganGlobal Head of Research April 2010
“The UK needs to
modernise, and to
commence a new
‘quest for national
efficiency’”

In the interests of consistency, and except where otherwise noted, financial and economic data used in this report for the purposes of international comparison is sourced from the CIA World Factbook.
To assist readers with comparisons, a summary of key data for 2009 is shown in fig. 16. In addition to GDP (which is
stated at purchasing power parity), the table shows budgetary information summarising revenues, public expenditure, the surplus or deficit and reported government debt at year-end. The table also shows exports, imports and the trade balance. Key items – the fiscal deficit, public debt and the trade balance – are also shown as percentages of GDP.
In some instances, and reflecting a commonality of method, this data differs from nationally-published numbers. All data is for the 2009 calendar year, whereas some countries (including the United Kingdom and the United States) report on the basis of their own fiscal years. With the exception of percentages, all data is shown in billions of US dollars.
financial and economic data
appendix 1
Fig. 16: Summary economic data, 2009*
Budget Trade As % GDP
$bn GDP** Revenue Spending +/- Debt Exports Imports +/- Deficit Debt Trade
Canada $1,287 $515 $547 -$33 $931 $299 $305 -$7 -2.5% 72% -0.5%
China $8,767 $972 $1,137 -$165 $1,596 $1,194 $922 $273 -1.9% 18% 3.1%
France $2,113 $1,229 $1,445 -$216 $1,684 $457 $532 -$75 -10.2% 80% -3.6%
Germany $2,812 $1,398 $1,540 -$142 $2,171 $1,187 $1,022 $165 -5.0% 77% 5.9%
Greece $339 $109 $145 -$37 $367 $19 $61 -$43 -10.8% 108% -12.6%
Iceland $12 $4 $5 -$2 $12 $4 $3 $1 -13.2% 101% 11.4%
India $3,548 $123 $223 -$100 $2,132 $155 $232 -$77 -2.8% 60% -2.2%
Ireland $177 $75 $105 -$30 $113 $107 $65 $42 -16.8% 64% 23.9%
Italy $1,756 $960 $1,068 -$108 $2,023 $369 $359 $10 -6.1% 115% 0.6%
Japan $4,141 $1,614 $1,997 -$383 $7,955 $516 $491 $26 -9.2% 192% 0.6%
Portugal $232 $92 $107 -$15 $175 $41 $59 -$17 -6.4% 75% -7.5%
Russia $2,103 $205 $307 -$101 $145 $296 $197 $99 -4.8% 7% 4.7%
Spain $1,367 $489 $640 -$151 $813 $216 $293 -$78 -11.1% 60% -5.7%
UK $2,165 $820 $1,132 -$312 $1,483 $351 $474 -$122 -14.4% 69% -5.6%
US $14,260 $1,914 $3,615 -$1,701 $5,661 $995 $1,445 -$450 -11.9% 40% -3.2%
Memo:
UK in £bn £1,406 £532 £735 -£203 £963 £228 £308 -£79 -14.4% 69% -5.6%
65strategy insights | issue four
* PPP ** Based on CIA World Factbook exchange rate of $1.54=$1

strategy insights | issue four66
britain at the crossroads | the case for fundamental change
Disclaimer
The information in this communication is provided for informational and demonstrational purposes only and neither is it intended as an offer or solicitation with
respect to the purchase or sale of any security nor should it serve as the basis for any investment decisions. In the UK, this material is intended for use only by
persons who have professional experience in matters relating to investments falling within Articles 19(5) and 49(2)(a) to (d) of the Financial Services and Markets Act
2000 (Financial Promotion) Order 2005 (as amended), or to persons to whom it can be otherwise lawfully distributed.
Any reference to ‘Tullett Prebon’ refers to Tullett Prebon plc and/or its subsidiaries and affiliated companies as applicable.
Neither Tullett Prebon plc, nor any of its subsidiaries (collectively, “Contributors”) guarantees the accuracy or completeness of the information or any analysis based
thereon. Neither Tullett Prebon plc nor Contributors make any warranties, express or implied, with respect to the information (including without limitation any
warranties of merchantability or fitness for particular purposes) and neither Tullett Prebon plc, nor Contributors shall in any circumstances be liable for economic
loss or any indirect, or consequential loss or damages including without limitation, loss of business or profits arising from the use of, any inability to use, or any in
accuracy in the information.
Tullett Prebon provides a wholesale broking service only. It does not provide services to private clients. Tullett Prebon (Securities) Limited and Tullett Prebon (Europe)
Limited are authorised and regulated by the Financial Services Authority (“FSA”).
This publication is produced and distributed in accordance with ‘COB 12.2 – Investment Research’ of the FSA Handbook. Recipients should note that all such
publications are objective and impartial in their content unless clearly notified otherwise. The author(s) act in accordance with Tullett Prebon’s ‘Conflict Management
Policy’, full details of which can be viewed on our website at www. tullettprebon.com
TPSI 004 | April 2010

Tullett Prebon Group Ltd
155 BishopsgateLondon EC2M 3TQ
Tel: +44 (0)20 7200 7000Fax: +44 (0)20 7200 7176www.tullettprebon.com