british columbia agrifood industry 2013 year in review · the 2013 british columbia agrifood...
TRANSCRIPT
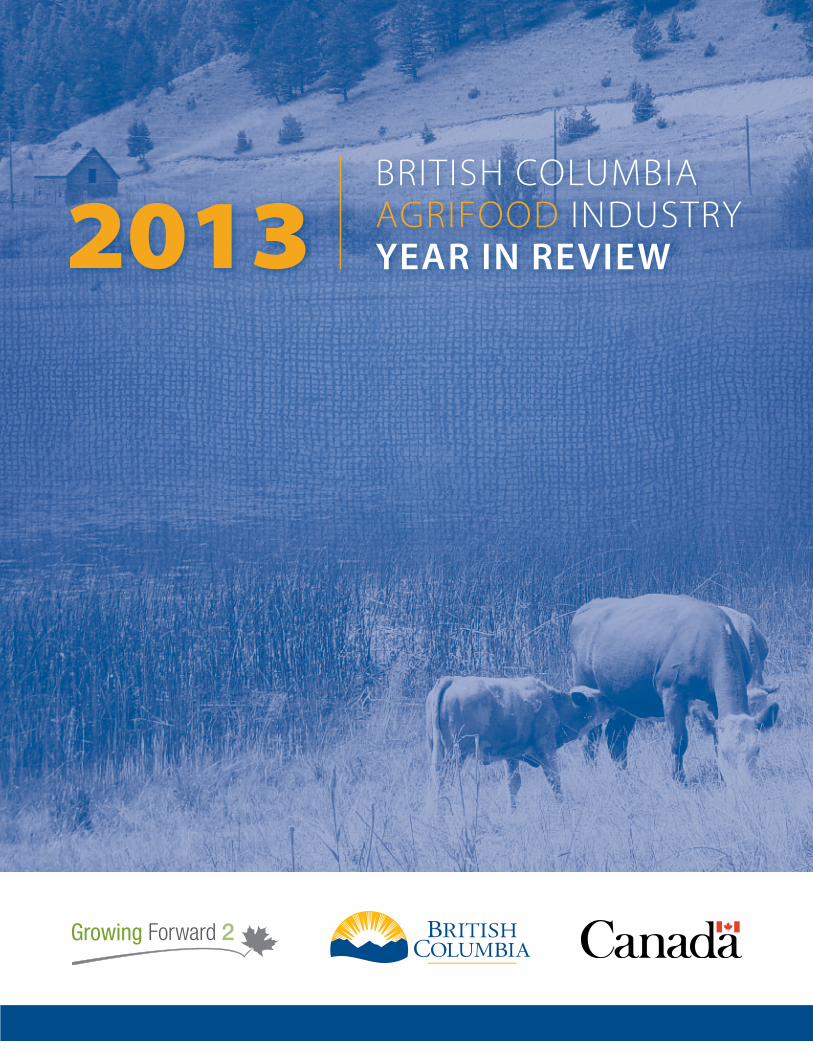
BRITISH COLUMBIA AGRIFOOD INDUSTRY YEAR IN REVIEW
2 British Columbia Agrifood Industry | 2013 YEAR IN RE VIEW
ISSN 2368-1969 (Print) ISSN 2368-1977 (Online)
Copyright © 2014, Province of British Columbia All rights reserved.
British Columbia Agrifood Industry | 2013 YEAR IN RE VIEW 3
Contents
A MESSAGE FROM CANADA’S AGRICULTURE MINISTER . . . . . . . . . . . . 4
A MESSAGE FROM THE MINISTER OF AGRICULTURE . . . . . . . . . . . . . . . 5
2013 INDUSTRY HIGHLIGHTS . . . . . . . . . . . . . . . . . . . . . . . . . . . . . . . . . . . . 6
INDUSTRY PERFORMANCE . . . . . . . . . . . . . . . . . . . . . . . . . . . . . . . . . . . . . . 7
AGRICULTURE EXPORT HIGHLIGHTS . . . . . . . . . . . . . . . . . . . . . . . . . . . . . 8
B.C. FRUITS & NUTS . . . . . . . . . . . . . . . . . . . . . . . . . . . . . . . . . . . . . . . . . . . . . 9
B.C. BERRIES & GRAPES . . . . . . . . . . . . . . . . . . . . . . . . . . . . . . . . . . . . . . . . . 10
B.C. TREE FRUITS . . . . . . . . . . . . . . . . . . . . . . . . . . . . . . . . . . . . . . . . . . . . . . . 11
B.C. VEGETABLES . . . . . . . . . . . . . . . . . . . . . . . . . . . . . . . . . . . . . . . . . . . . . . . 12
B.C. GREENHOUSE VEGETABLES . . . . . . . . . . . . . . . . . . . . . . . . . . . . . . . . . 13
B.C. FLORICULTURE, NURSERY & SOD PRODUCTS . . . . . . . . . . . . . . . . 14
B.C. LIVESTOCK & POULTRY PRODUCTS . . . . . . . . . . . . . . . . . . . . . . . . . . 15
B.C. BEEF & DAIRY . . . . . . . . . . . . . . . . . . . . . . . . . . . . . . . . . . . . . . . . . . . . . . 16
B.C. POULTRY, EGGS & PORK . . . . . . . . . . . . . . . . . . . . . . . . . . . . . . . . . . . . 17
OTHER ANIMALS & ANIMAL PRODUCTS . . . . . . . . . . . . . . . . . . . . . . . . . 18
B.C. GRAINS & OILSEEDS . . . . . . . . . . . . . . . . . . . . . . . . . . . . . . . . . . . . . . . 19
B.C. FOOD & BEVERAGE PROCESSING . . . . . . . . . . . . . . . . . . . . . . . . . . . 20
SIGNIFICANT EVENTS IN B.C. AGRIFOOD – 2013 / 2014 . . . . . . . . . . . . 21
DATA SOURCES / MORE INFORMATION . . . . . . . . . . . . . . . . . . . . . . . . . . 22
4 British Columbia Agrifood Industry | 2013 YEAR IN RE VIEW
I’m very pleased to join with Minister Letnick to release the 2013 British Columbia Agrifood Industry Year in Review. As you will see in this report, the British Columbia agriculture and food industry is a strong driver of jobs and economic growth right across Canada. Great numbers like these are the result of a lot of hard work from gate to plate, but we’re not stopping here. Minister Letnick and I continue to work hard to help the B.C. agri-food industry capture exciting new opportunities in the global marketplace. As this report indicates, our efforts are paying off, with an 11 per cent increase in B.C. ag and food exports in 2013. Our trade mission to China in June
could help triple B.C. agriculture and food sales to this critical market, including our outstanding B.C. cherries. Here at home, we’re working together to build a strong foundation for growth in B.C. through the five-year, $3-billion, Growing Forward 2 agreement. Thanks to our joint investments under GF2 of $115 million over five years, the governments of Canada and B.C. are supporting proactive initiatives from innovation, to food safety, to the environment, to exports, to the production of this report. The future is bright for our agriculture and food industry, with growing demand for food that will come from our innovative farms and food processors in B.C. and across Canada. Congratulations on these tremendous results. I look forward to working together to build an even stronger bottom line next year.
Gerry Ritz, PC, MP Agriculture Minister
A message from Canada’s Agriculture Minister
British Columbia Agrifood Industry | 2013 YEAR IN RE VIEW 5
Welcome to the Ministry of Agriculture’s 2013 British Columbia Agrifood Industry Year in Review, an annual statistical summary of the B.C. agriculture and food and beverage processing sectors.
British Columbians are increasingly interested in what they eat and the support for fresh, safe and locally produced food continues to grow. Our products are sought after at local farmers markets, and in stores throughout our province, Canada and the world. In 2013, B.C. agriculture products were shipped to more than 140 countries and the overall export value increased by 11 per cent to $1.8 billion.
There is a global spotlight on agriculture and now is the time to build on this momentum. I had the pleasure of leading a B.C. delegation on a trade mission to China that included an agreement for full, unimpeded access for B.C. fresh cherries into China. We also saw ongoing progress towards fresh B.C. blueberries being approved for sale in the Chinese market.
Growing B.C.’s economy is a key focus of the B.C. Government and agriculture is a big part of this commitment. We have a goal of building B.C. agrifoods revenue from over $11 billion currently, to $14 billion a year by 2017. The best way to do that is by working together. I have been meeting with industry representatives throughout British Columbia and getting their ideas on how we can continue to build this great sector.
As you look through the pages of this year’s Agriculture Year in Review, please take a moment to realize that for every statistic you read about in this publication, there are hardworking British Columbians behind each one of those numbers. The passion and drive of the people working in B.C. agriculture is incredible. From the Okanagan, to the Cowichan Valley, to Dawson Creek, they are the heart of our agrifoods industry. The B.C. government’s commitment to work with them to secure a strong future will ensure they will be able to share their passion and knowledge with the next generation of farmers, so British Columbians will continue to enjoy high-quality local foods, and the jobs and communities that agrifoods businesses support in B.C.
To learn more about the B.C. agrifoods sector, please visit the Ministry of Agriculture’s website at www.gov.bc.ca/agri and www.bcseafood.ca.
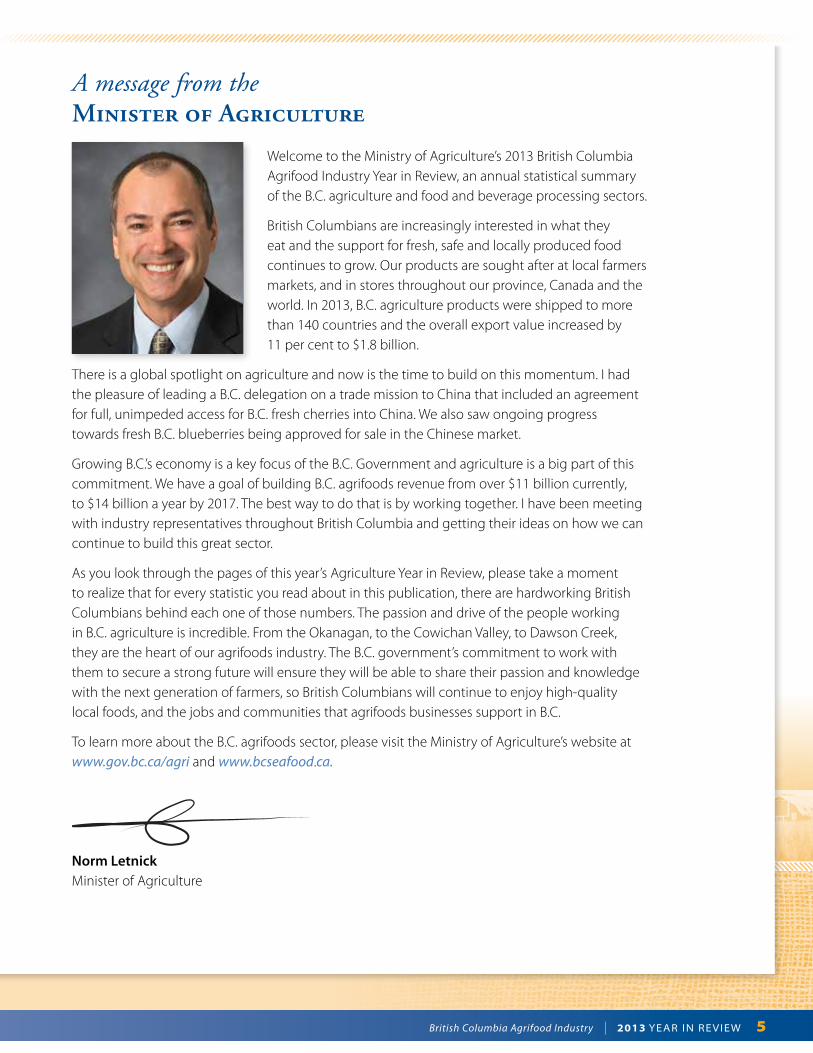
Norm Letnick Minister of Agriculture
A message from the Minister of Agriculture
6 British Columbia Agrifood Industry | 2013 YEAR IN RE VIEW
2013 Industry Highlights
British Columbia’s agrifoods sector includes primary production in agriculture, aquaculture and commercial fisheries and processing of food and beverages. In 2013, the sector generated $11.6 billion in combined gross revenues and exported $2.7 billion worth of products to more than 140 markets.
$ BI
LLIO
NS
Farm Cash Receipts Value of Manufacturing Shipments
0
2
4
6
8
2004 2005 2006 2007 2008 2009 2010 2011 2012 2013
PRIMARY AGRICULTURE 27,600
FOOD & BEVERAGE PROCESSING 28,700
PRIMARY SEAFOOD 3,400
TOTAL AGRIFOOD 59,700
SOURCE: http://www.bcstats.gov.bc.ca
} JOB COUNT:
This document focuses on the B.C. agriculture and food and beverage processing sectors. The provincial seafood sector is profiled in the B.C. Seafood Industry Year in Review, available at www.bcseafood.ca.
Around the province’s varied landscapes and different climatic zones, B.C.’s farmers and food and beverage processors produce an impressive array of food products to supply both local and export markets.
The industry’s nearly 20,000 farms utilized 2.6 million hectares – less than three per cent of the provincial land base – to produce
more than 200 agriculture and
agrifood commodities.
In 2013, many of B.C.’s agrifood
products led the country in
sales including blueberries,
sweet cherries, raspberries, apricots,
cranberries, garlic and leeks. B.C.
also had several products rank
second including pears, grapes,
peaches, nectarines, Brussels
sprouts, lettuce, pumpkins,
spinach and plums/prunes.
The province’s more than 1,500 food
and beverage processors generated
an additional $8.0 billion in sales.
} BRITISH COLUMBIA AGRIFOOD REVENUES 2004 – 2013
Agriculture2.8
Seafood0.8
Food & BeverageProcessing 8.0
B.C. AGRIFOODS REVENUES 2013($ Billions)
British Columbia Agrifood Industry | 2013 YEAR IN RE VIEW 7
Industry Performance
In 2013, total farm cash receipts generated by British Columbia’s agriculture sector remained at $2.8 billion while total food and beverage manufacturing shipments increased more than one per cent to $8.0 billion.
Included in the farm cash receipts total are farm sales of crop and livestock/poultry products as well as direct program payments made to producers. The crop and livestock/poultry sectors generated almost equal shares of the provincial farm cash receipts. Sales from the crop sector contributed $1.36 billion (a 49 per cent share) and sales from livestock and poultry sectors contributed $1.39 billion (a 50 per cent share). The remaining $28 million was generated by direct program payments*.
B.C.’s dairy sector generated 19 per cent of the provincial farm cash receipts in 2013, followed by
hens and chickens at 14 per cent,
greenhouse vegetables at 11 per
cent, flori-culture at 10 per cent and
beef at eight per cent.
Food processing accounted
for 85 per cent of the value of
B.C.’s total food and beverage
manufacturing shipments in
2013 while beverage processing
accounted for 15 per cent.
Close to 1,200 food processing
firms, along with more than
300 beverage processing firms,
generated combined shipments
valued at $8.0 billion – the largest
manufacturing sector in
the province.
SECTOR$ Millions $ Billions % Change
12/132011 2012 2013 2011 2012 2013
Crops 1,237 1,327 1,363 1.2 1.3 1.4 2.7
Livestock and Poultry Products 1,302 1,376 1,393 1.3 1.4 1.4 1.3
Direct Program Payments 66 66 28 0.1 0.1 0.0 -57.6
Agriculture Total Farm Cash Receipts 2,605 2,769 2,784 2.6 2.8 2.8 0.6
Seafood (Aquaculture and Capture) 813 704 811 0.8 0.7 0.8 15.1
Food and Beverage Processing Shipments 7,635 7,856 7,953 7.6 7.9 8.0 1.2
B C AGRIFOODS TOTAL REVENUES 11,053 11,329 11,548 11 0 11 4 11 6 1 9
} VALUE OF B C ’s AGRIFOOD INDUSTRY
* Direct Payments to agricultural producers include all payments made directly to producers under federal, provincial and municipal programs as well as payments made under private programs such as private hail insurance and private livestock insurance programs in the calendar year.
Hens & Chickens 378.4
Berries152.7
Grapes44.9
Floriculture267.6
Nursery182.1
Other Crops55.0
Pork 30.5Turkeys
51.3 Eggs117.2
Honey 9.7 Other 66.2
Food Processing Beverage Processing
Grains & Oilseeds53.9
GreenhouseVegetables 305.3
Sheep & Lambs 4.9
Beef 207.7
Dairy 527.7
Tree Fruits102.7
Field Vegetables198.8
B.C. CROPS2013 Farm Cash Receipts ($ Millions)
B.C. LIVESTOCK & POULTRY PRODUCTS2013 Farm Cash Receipts ($ Millions)
B.C. FOOD AND BEVERAGE PROCESSINGValue of Shipments ($ Billions)
0.0
1.0
2.0
3.0
4.0
5.0
6.0
7.0
8.0
9.0
2008 2009 2010 2011 2012 2013
8 British Columbia Agrifood Industry | 2013 YEAR IN RE VIEW
Agriculture Export Highlights
British Columbia agriculture products were shipped to more than 140 markets in 2013.Almost 90 per cent ($1.6 billion) of the province’s agriculture export value went to our top five markets – the United States, China, Japan, Taiwan and Hong Kong.
MARKET EXPORT VALUE ($ Millions)
EXPORT SHARE (%) TOP PRODUCTS
United States 1,352.0 76 Blueberries, Food Preparations for Manufacturing, Baked Goods, Chocolate & Cocoa Preparations, Mushrooms
China 71.3 4 Pork Products, Rapeseed/Canola, Food Preparations for Manufacturing, Wine, Potatoes
Japan 69.0 4 Pork Products, Mushrooms, Blueberries, Rapeseed /Canola, Water
Taiwan 33.1 2 Poultry Products, Cherries, Food Preparations for Manufacturing, Pork Products, Water
Hong Kong 28.5 2 Cherries, Pork Products, Food Preparations for Manufacturing, Poultry Products, Egg Products
Rest of World 224.4 12 Food Preparations for Manufacturing, Poultry Products, Pork Products, Dairy Products, Cherries
TOTAL B C 1,779 0 100 Food Preparations for Manufacturing, Blueberries, Baked Goods, Pork Products, Chocolate & Cocoa Preparations
Other Agriculture Products 143.3 Food Preparations
for Manufacturing 189.8
Floriculture & Nursery Products
65.5
Chocolate & Confectionary
102.4 Beverages &
Beverage Concentrates153.6
Baked Goods & Other Grain
Preparations 171.8
Alfalfa, Fodder &
Animal Feeds 74.5
Vegetable Products 267.8
Animals & AnmialProducts 260.0
Fruit & Nut Products 349.7
B.C. EXPORTSValue by Product Grouping ($ Millions)
B.C. AGRIFOODS EXPORTS($ Billions)
1.2
1.3
1.4
1.5
1.6
1.7
1.8
2004 2005 2006 2007 2008 2010 2009 2012 2011 2013
The value of British Columbia agriculture product exports grew 11 per cent in 2013 to $1.8 billion. Notable increases in export market values were seen in China with a 45 per cent increase and the Philippines where exports rose 42 per cent from $15.2 million to $21.5 million in 2013. The value of shipments to the United States was up nine per cent over 2012.
British Columbia agriculture exports include products derived partially from imports and value-added within the province. In 2013, our top five export commodities were food preparations for manufacturing, blueberries, baked goods, pork products and chocolate and cocoa preparations.
British Columbia Agrifood Industry | 2013 YEAR IN RE VIEW 9
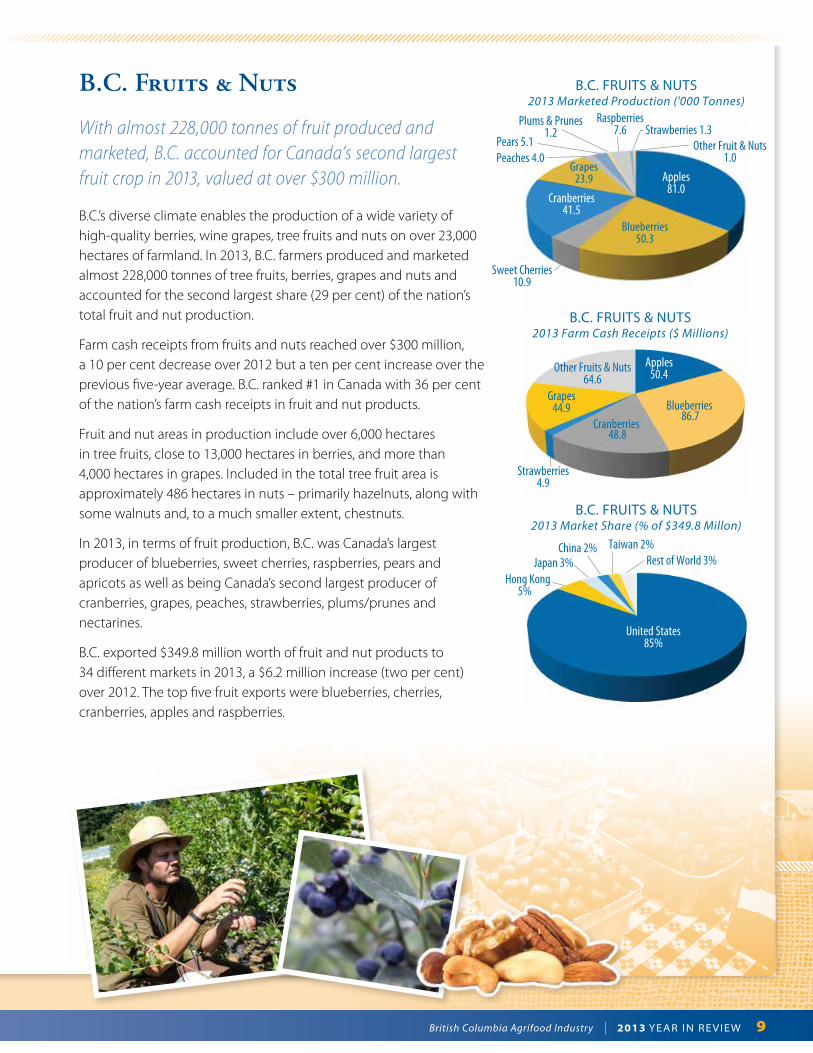
B.C. Fruits & Nuts
With almost 228,000 tonnes of fruit produced and marketed, B.C. accounted for Canada’s second largest fruit crop in 2013, valued at over $300 million.
B.C.’s diverse climate enables the production of a wide variety of high-quality berries, wine grapes, tree fruits and nuts on over 23,000 hectares of farmland. In 2013, B.C. farmers produced and marketed almost 228,000 tonnes of tree fruits, berries, grapes and nuts and accounted for the second largest share (29 per cent) of the nation’s total fruit and nut production.
Farm cash receipts from fruits and nuts reached over $300 million, a 10 per cent decrease over 2012 but a ten per cent increase over the previous five-year average. B.C. ranked #1 in Canada with 36 per cent of the nation’s farm cash receipts in fruit and nut products.
Fruit and nut areas in production include over 6,000 hectares in tree fruits, close to 13,000 hectares in berries, and more than 4,000 hectares in grapes. Included in the total tree fruit area is approximately 486 hectares in nuts – primarily hazelnuts, along with some walnuts and, to a much smaller extent, chestnuts.
In 2013, in terms of fruit production, B.C. was Canada’s largest producer of blueberries, sweet cherries, raspberries, pears and apricots as well as being Canada’s second largest producer of cranberries, grapes, peaches, strawberries, plums/prunes and nectarines.
B.C. exported $349.8 million worth of fruit and nut products to 34 different markets in 2013, a $6.2 million increase (two per cent) over 2012. The top five fruit exports were blueberries, cherries, cranberries, apples and raspberries.
Blueberries 86.7
Cranberries 48.8
Grapes44.9
Peaches 4.0Pears 5.1
Raspberries7.6 Strawberries 1.3
Other Fruit & Nuts1.0
Plums & Prunes1.2
Hong Kong5%
Japan 3% China 2% Taiwan 2%
Rest of World 3%
Sweet Cherries10.9
Other Fruits & Nuts64.6
Apples81.0
Grapes23.9
Cranberries41.5
Blueberries50.3
Apples50.4
Strawberries4.9
United States85%
B.C. FRUITS & NUTS2013 Marketed Production ('000 Tonnes)
B.C. FRUITS & NUTS2013 Farm Cash Receipts ($ Millions)
B.C. FRUITS & NUTS2013 Market Share (% of $349.8 Millon)
10 British Columbia Agrifood Industry | 2013 YEAR IN RE VIEW
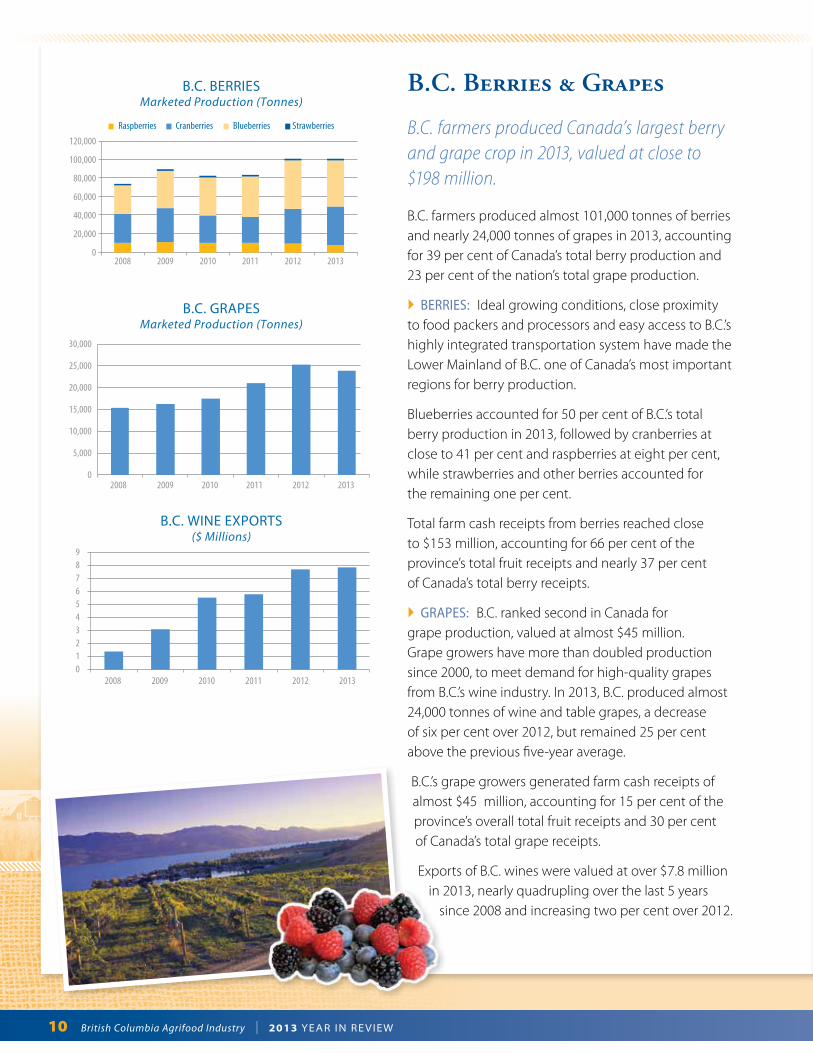
B.C. Berries & Grapes
B.C. farmers produced Canada’s largest berry and grape crop in 2013, valued at close to $198 million.
B.C. farmers produced almost 101,000 tonnes of berries and nearly 24,000 tonnes of grapes in 2013, accounting for 39 per cent of Canada’s total berry production and 23 per cent of the nation’s total grape production.
} BERRIES: Ideal growing conditions, close proximity to food packers and processors and easy access to B.C.’s highly integrated transportation system have made the Lower Mainland of B.C. one of Canada’s most important regions for berry production.
Blueberries accounted for 50 per cent of B.C.’s total berry production in 2013, followed by cranberries at close to 41 per cent and raspberries at eight per cent, while strawberries and other berries accounted for the remaining one per cent.
Total farm cash receipts from berries reached close to $153 million, accounting for 66 per cent of the province’s total fruit receipts and nearly 37 per cent of Canada’s total berry receipts.
} GRAPES: B.C. ranked second in Canada for grape production, valued at almost $45 million. Grape growers have more than doubled production since 2000, to meet demand for high-quality grapes from B.C.’s wine industry. In 2013, B.C. produced almost 24,000 tonnes of wine and table grapes, a decrease of six per cent over 2012, but remained 25 per cent above the previous five-year average.
B.C.’s grape growers generated farm cash receipts of almost $45 million, accounting for 15 per cent of the province’s overall total fruit receipts and 30 per cent of Canada’s total grape receipts.
Exports of B.C. wines were valued at over $7.8 million in 2013, nearly quadrupling over the last 5 years
since 2008 and increasing two per cent over 2012.
Raspberries Cranberries Blueberries Strawberries
B.C. BERRIESMarketed Production (Tonnes)
B.C. GRAPESMarketed Production (Tonnes)
B.C. WINE EXPORTS($ Millions)
0
5,000
10,000
15,000
20,000
25,000
30,000
2008 2009 2010 2011 2012 2013
0
20,000
40,000
60,000
80,000
100,000
120,000
2008 2009 2010 2011 2012 2013
0123456789
2008 2009 2010 2011 2012 2013
British Columbia Agrifood Industry | 2013 YEAR IN RE VIEW 11
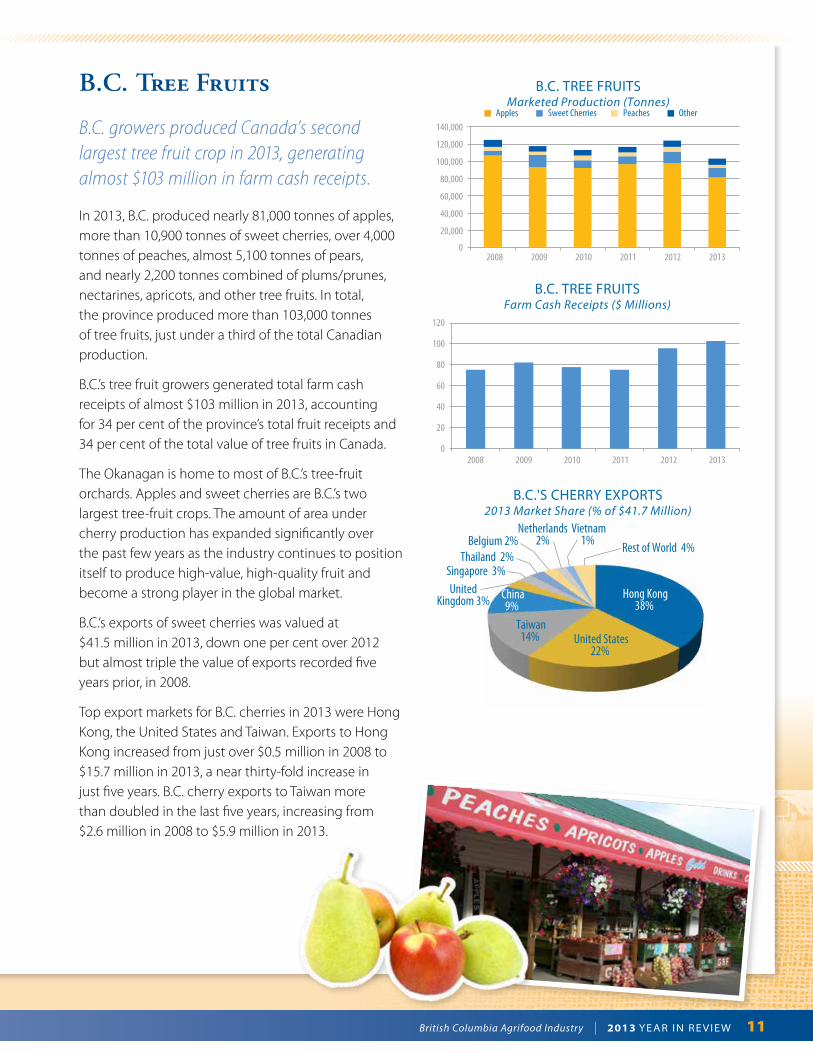
B.C. Tree Fruits
B.C. growers produced Canada’s second largest tree fruit crop in 2013, generating almost $103 million in farm cash receipts.
In 2013, B.C. produced nearly 81,000 tonnes of apples, more than 10,900 tonnes of sweet cherries, over 4,000 tonnes of peaches, almost 5,100 tonnes of pears, and nearly 2,200 tonnes combined of plums/prunes, nectarines, apricots, and other tree fruits. In total, the province produced more than 103,000 tonnes of tree fruits, just under a third of the total Canadian production.
B.C.’s tree fruit growers generated total farm cash receipts of almost $103 million in 2013, accounting for 34 per cent of the province’s total fruit receipts and 34 per cent of the total value of tree fruits in Canada.
The Okanagan is home to most of B.C.’s tree-fruit orchards. Apples and sweet cherries are B.C.’s two largest tree-fruit crops. The amount of area under cherry production has expanded significantly over the past few years as the industry continues to position itself to produce high-value, high-quality fruit and become a strong player in the global market.
B.C.’s exports of sweet cherries was valued at $41.5 million in 2013, down one per cent over 2012 but almost triple the value of exports recorded five years prior, in 2008.
Top export markets for B.C. cherries in 2013 were Hong Kong, the United States and Taiwan. Exports to Hong Kong increased from just over $0.5 million in 2008 to $15.7 million in 2013, a near thirty-fold increase in just five years. B.C. cherry exports to Taiwan more than doubled in the last five years, increasing from $2.6 million in 2008 to $5.9 million in 2013.
Apples Sweet Cherries Peaches Other
United States22%
Taiwan14%
United Kingdom 3%
Singapore 3% Thailand 2%
Belgium 2% Netherlands
2% Vietnam
1% Rest of World 4%
2008 2009 2010 2011 2012 20130
20
40
60
80
100
120
Hong Kong38%
China9%
B.C. TREE FRUITS Marketed Production (Tonnes)
B.C.'S CHERRY EXPORTS2013 Market Share (% of $41.7 Million)
B.C. TREE FRUITSFarm Cash Receipts ($ Millions)
0
20,000
40,000
60,000
80,000
100,000
120,000
140,000
2008 2009 2010 2011 2012 2013
12 British Columbia Agrifood Industry | 2013 YEAR IN RE VIEW
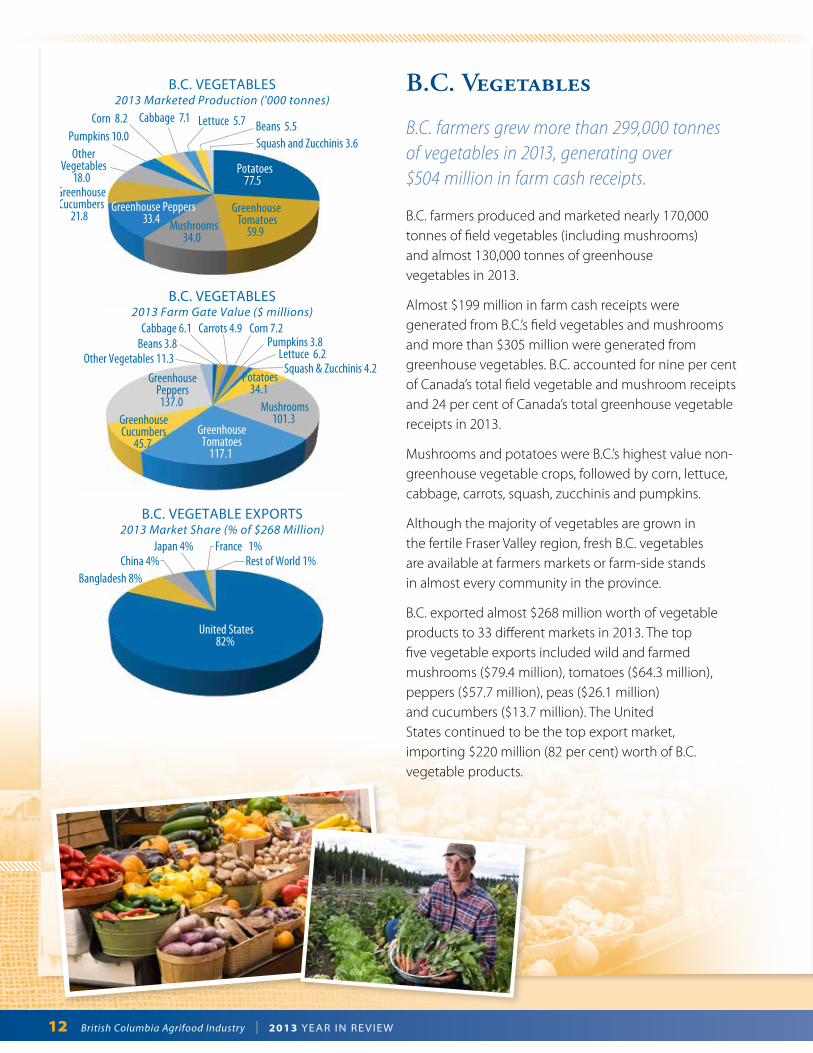
B.C. Vegetables
B.C. farmers grew more than 299,000 tonnes of vegetables in 2013, generating over $504 million in farm cash receipts.
B.C. farmers produced and marketed nearly 170,000 tonnes of field vegetables (including mushrooms) and almost 130,000 tonnes of greenhouse vegetables in 2013.
Almost $199 million in farm cash receipts were generated from B.C.’s field vegetables and mushrooms and more than $305 million were generated from greenhouse vegetables. B.C. accounted for nine per cent of Canada’s total field vegetable and mushroom receipts and 24 per cent of Canada’s total greenhouse vegetable receipts in 2013.
Mushrooms and potatoes were B.C.’s highest value non-greenhouse vegetable crops, followed by corn, lettuce, cabbage, carrots, squash, zucchinis and pumpkins.
Although the majority of vegetables are grown in the fertile Fraser Valley region, fresh B.C. vegetables are available at farmers markets or farm-side stands in almost every community in the province.
B.C. exported almost $268 million worth of vegetable products to 33 different markets in 2013. The top five vegetable exports included wild and farmed mushrooms ($79.4 million), tomatoes ($64.3 million), peppers ($57.7 million), peas ($26.1 million) and cucumbers ($13.7 million). The United States continued to be the top export market, importing $220 million (82 per cent) worth of B.C. vegetable products.
Greenhouse Tomatoes
59.9 Mushrooms34.0
Pumpkins 10.0 Corn 8.2 Cabbage 7.1
Greenhouse Cucumbers
21.8
OtherVegetables
18.0
Squash and Zucchinis 3.6 Beans 5.5 Lettuce 5.7
Corn 7.2
Bangladesh 8% China 4%
Japan 4% France 1% Rest of World 1%
GreenhousePeppers137.0
GreenhouseCucumbers
45.7 Greenhouse
Tomatoes117.1
Mushrooms101.3
Other Vegetables 11.3 Beans 3.8 Cabbage 6.1
Potatoes34.1
Pumpkins 3.8 Carrots 4.9
Lettuce 6.2 Squash & Zucchinis 4.2
Potatoes77.5
Greenhouse Peppers33.4
United States82%
B.C. VEGETABLES2013 Marketed Production ('000 tonnes)
B.C. VEGETABLES2013 Farm Gate Value ($ millions)
B.C. VEGETABLE EXPORTS2013 Market Share (% of $268 Million)
British Columbia Agrifood Industry | 2013 YEAR IN RE VIEW 13
B.C. Greenhouse Vegetables
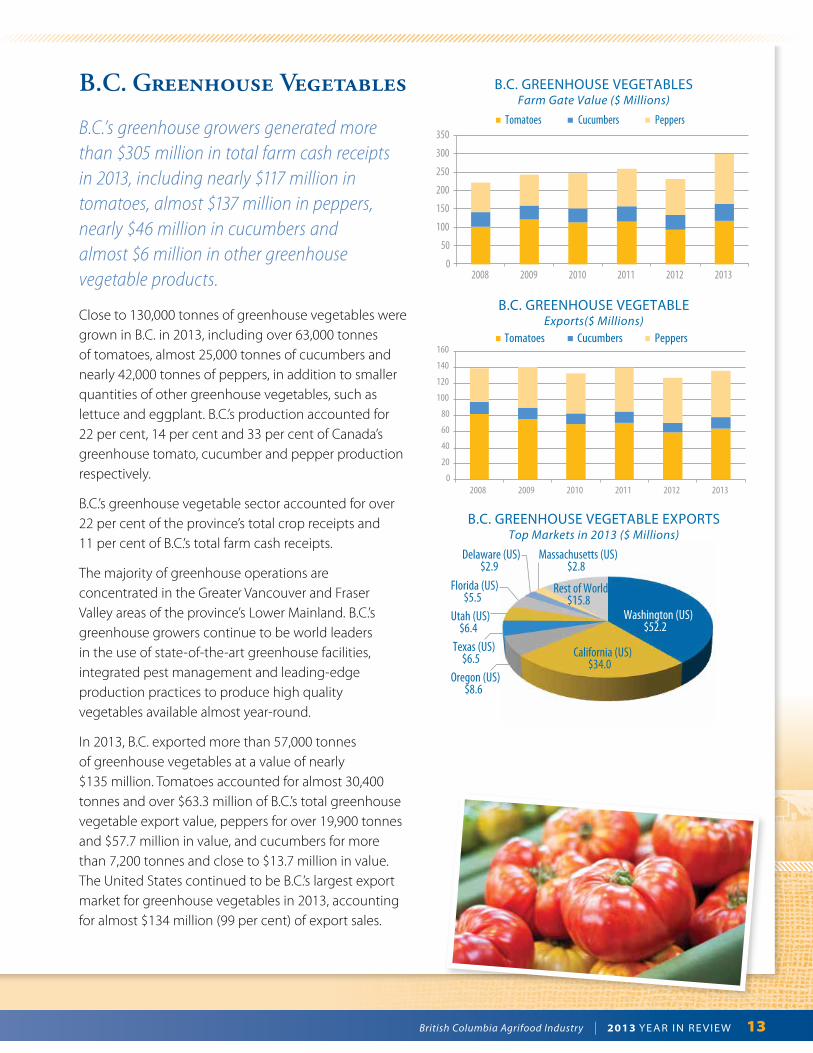
B.C.’s greenhouse growers generated more than $305 million in total farm cash receipts in 2013, including nearly $117 million in tomatoes, almost $137 million in peppers, nearly $46 million in cucumbers and almost $6 million in other greenhouse vegetable products.
Close to 130,000 tonnes of greenhouse vegetables were grown in B.C. in 2013, including over 63,000 tonnes of tomatoes, almost 25,000 tonnes of cucumbers and nearly 42,000 tonnes of peppers, in addition to smaller quantities of other greenhouse vegetables, such as lettuce and eggplant. B.C.’s production accounted for 22 per cent, 14 per cent and 33 per cent of Canada’s greenhouse tomato, cucumber and pepper production respectively.
B.C.’s greenhouse vegetable sector accounted for over 22 per cent of the province’s total crop receipts and 11 per cent of B.C.’s total farm cash receipts.
The majority of greenhouse operations are concentrated in the Greater Vancouver and Fraser Valley areas of the province’s Lower Mainland. B.C.’s greenhouse growers continue to be world leaders in the use of state-of-the-art greenhouse facilities, integrated pest management and leading-edge production practices to produce high quality vegetables available almost year-round.
In 2013, B.C. exported more than 57,000 tonnes of greenhouse vegetables at a value of nearly $135 million. Tomatoes accounted for almost 30,400 tonnes and over $63.3 million of B.C.’s total greenhouse vegetable export value, peppers for over 19,900 tonnes and $57.7 million in value, and cucumbers for more than 7,200 tonnes and close to $13.7 million in value. The United States continued to be B.C.’s largest export market for greenhouse vegetables in 2013, accounting for almost $134 million (99 per cent) of export sales.
Tomatoes Cucumbers Peppers
Tomatoes Cucumbers Peppers
California (US)$34.0
Oregon (US)$8.6
Texas (US)$6.5
Utah (US)$6.4
Delaware (US)$2.9
Massachusetts (US)$2.8
Rest of World$15.8
Florida (US)$5.5
Washington (US)$52.2
0
50
100
150
200
250
300
350
0
20
40
60
80
100
120
140
160
2008 2009 2010 2011 2012 2013
2008 2009 2010 2011 2012 2013
B.C. GREENHOUSE VEGETABLESFarm Gate Value ($ Millions)
B.C. GREENHOUSE VEGETABLEExports($ Millions)
B.C. GREENHOUSE VEGETABLE EXPORTSTop Markets in 2013 ($ Millions)
14 British Columbia Agrifood Industry | 2013 YEAR IN RE VIEW
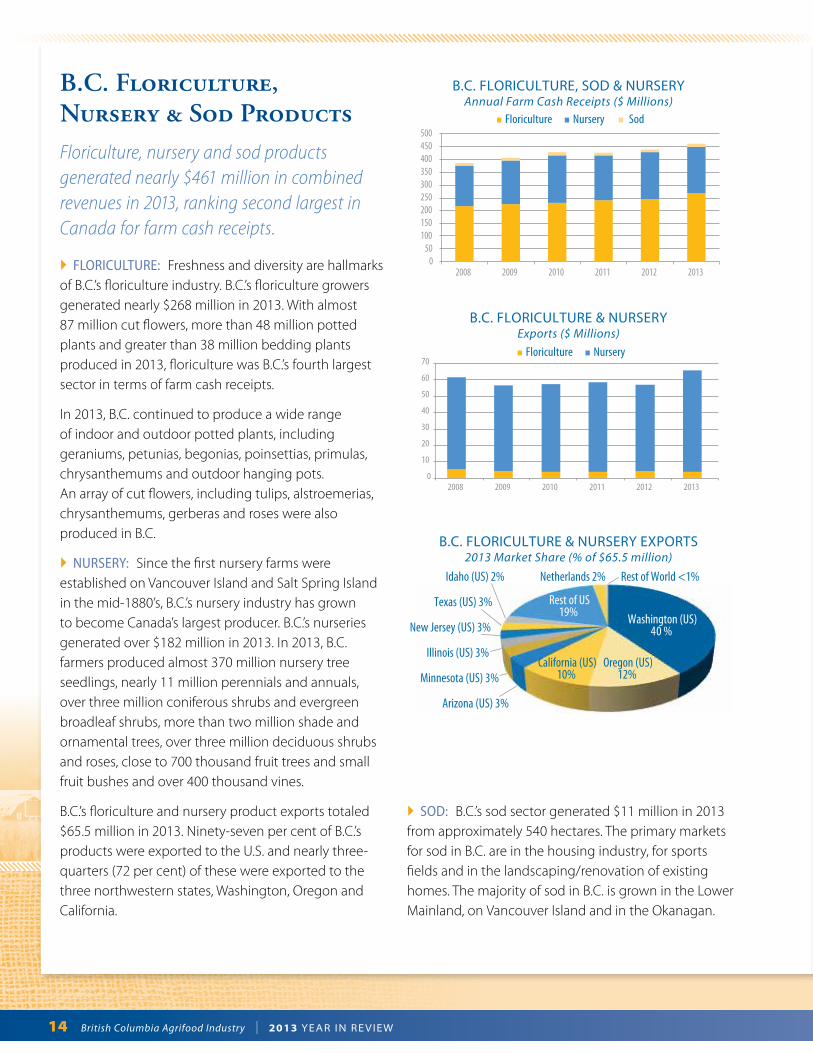
B.C. Floriculture, Nursery & Sod ProductsFloriculture, nursery and sod products generated nearly $461 million in combined revenues in 2013, ranking second largest in Canada for farm cash receipts.
} FLORICULTURE: Freshness and diversity are hallmarks of B.C.’s floriculture industry. B.C.’s floriculture growers generated nearly $268 million in 2013. With almost 87 million cut flowers, more than 48 million potted plants and greater than 38 million bedding plants produced in 2013, floriculture was B.C.’s fourth largest sector in terms of farm cash receipts.
In 2013, B.C. continued to produce a wide range of indoor and outdoor potted plants, including geraniums, petunias, begonias, poinsettias, primulas, chrysanthemums and outdoor hanging pots. An array of cut flowers, including tulips, alstroemerias, chrysanthemums, gerberas and roses were also produced in B.C.
} NURSERY: Since the first nursery farms were established on Vancouver Island and Salt Spring Island in the mid-1880’s, B.C.’s nursery industry has grown to become Canada’s largest producer. B.C.’s nurseries generated over $182 million in 2013. In 2013, B.C. farmers produced almost 370 million nursery tree seedlings, nearly 11 million perennials and annuals, over three million coniferous shrubs and evergreen broadleaf shrubs, more than two million shade and ornamental trees, over three million deciduous shrubs and roses, close to 700 thousand fruit trees and small fruit bushes and over 400 thousand vines.
B.C.’s floriculture and nursery product exports totaled $65.5 million in 2013. Ninety-seven per cent of B.C.’s products were exported to the U.S. and nearly three-quarters (72 per cent) of these were exported to the three northwestern states, Washington, Oregon and California.
Floriculture Nursery Sod
Floriculture Nursery
Arizona (US) 3%
Minnesota (US) 3%
Illinois (US) 3%
New Jersey (US) 3%
Texas (US) 3%
Idaho (US) 2% Netherlands 2% Rest of World <1%
Washington (US)40 %
Oregon (US)12%
Rest of US19%
California (US)10%
0
10
20
30
40
50
60
70
2008 2009 2010 2011 2012 2013
B.C. FLORICULTURE, SOD & NURSERYAnnual Farm Cash Receipts ($ Millions)
B.C. FLORICULTURE & NURSERYExports ($ Millions)
B.C. FLORICULTURE & NURSERY EXPORTS2013 Market Share (% of $65.5 million)
050
100150200250300350400450500
2008 2009 2010 2011 2012 2013
} SOD: B.C.’s sod sector generated $11 million in 2013 from approximately 540 hectares. The primary markets for sod in B.C. are in the housing industry, for sports fields and in the landscaping/renovation of existing homes. The majority of sod in B.C. is grown in the Lower Mainland, on Vancouver Island and in the Okanagan.
British Columbia Agrifood Industry | 2013 YEAR IN RE VIEW 15
Beef85.5
Hogs 20.5
Sheep & Lambs
2.1
Poultry184.4
Honey 0.9
Beef207.7
Pork 30.5 Sheep &
Lambs 4.9
Dairy527.7
Poultry429.6
Eggs117.2
Honey 9.7 Other 34.0
United States48%
Japan9%
China8%
Phillippines7%
Taiwan 6% Russia 4% Hong Kong 3%
Brazil 3% Australia 1%
Rest of World11%
B.C. LIVESTOCK & POULTRY2013 Marketed Production ('000 tonnes)
B.C. LIVESTOCK & POULTRY2013 Farm Cash Receipts ($ millions)
B.C. LIVESTOCK & POULTRY EXPORTS2013 Market Share (% of $260 million)
B.C. Livestock & Poultry Products
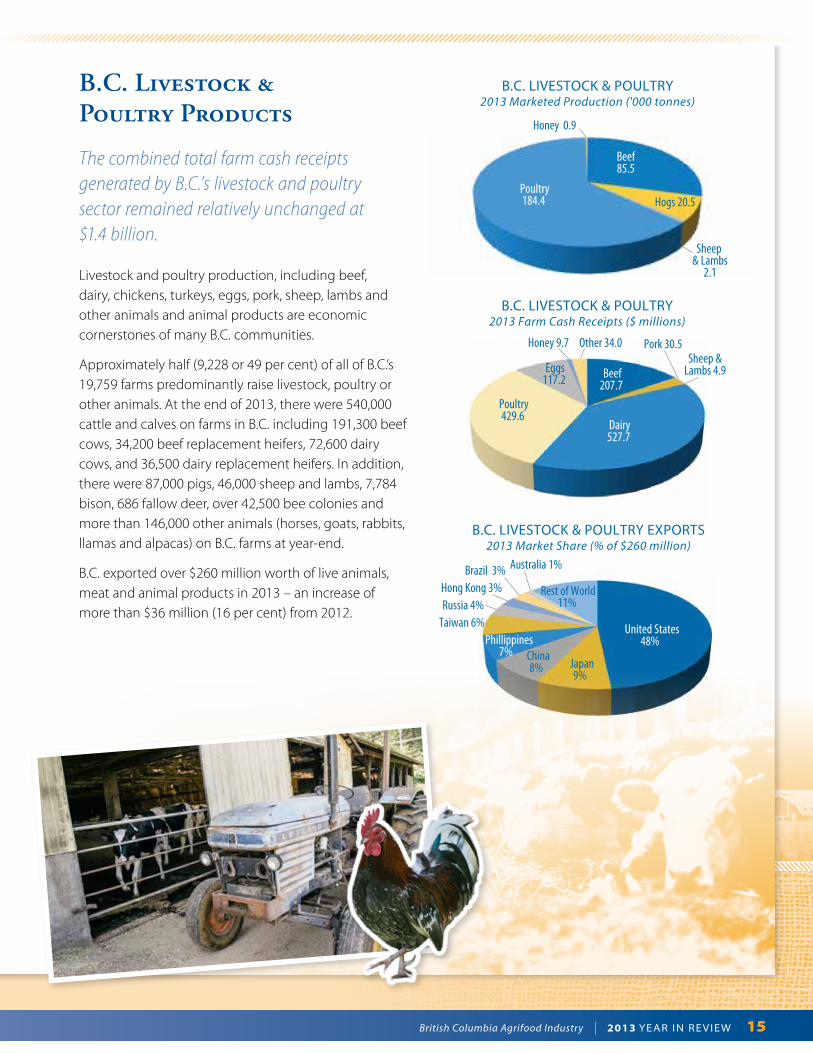
The combined total farm cash receipts generated by B.C.’s livestock and poultry sector remained relatively unchanged at $1.4 billion.
Livestock and poultry production, including beef, dairy, chickens, turkeys, eggs, pork, sheep, lambs and other animals and animal products are economic cornerstones of many B.C. communities.
Approximately half (9,228 or 49 per cent) of all of B.C.’s 19,759 farms predominantly raise livestock, poultry or other animals. At the end of 2013, there were 540,000 cattle and calves on farms in B.C. including 191,300 beef cows, 34,200 beef replacement heifers, 72,600 dairy cows, and 36,500 dairy replacement heifers. In addition, there were 87,000 pigs, 46,000 sheep and lambs, 7,784 bison, 686 fallow deer, over 42,500 bee colonies and more than 146,000 other animals (horses, goats, rabbits, llamas and alpacas) on B.C. farms at year-end.
B.C. exported over $260 million worth of live animals, meat and animal products in 2013 – an increase of more than $36 million (16 per cent) from 2012.
16 British Columbia Agrifood Industry | 2013 YEAR IN RE VIEW
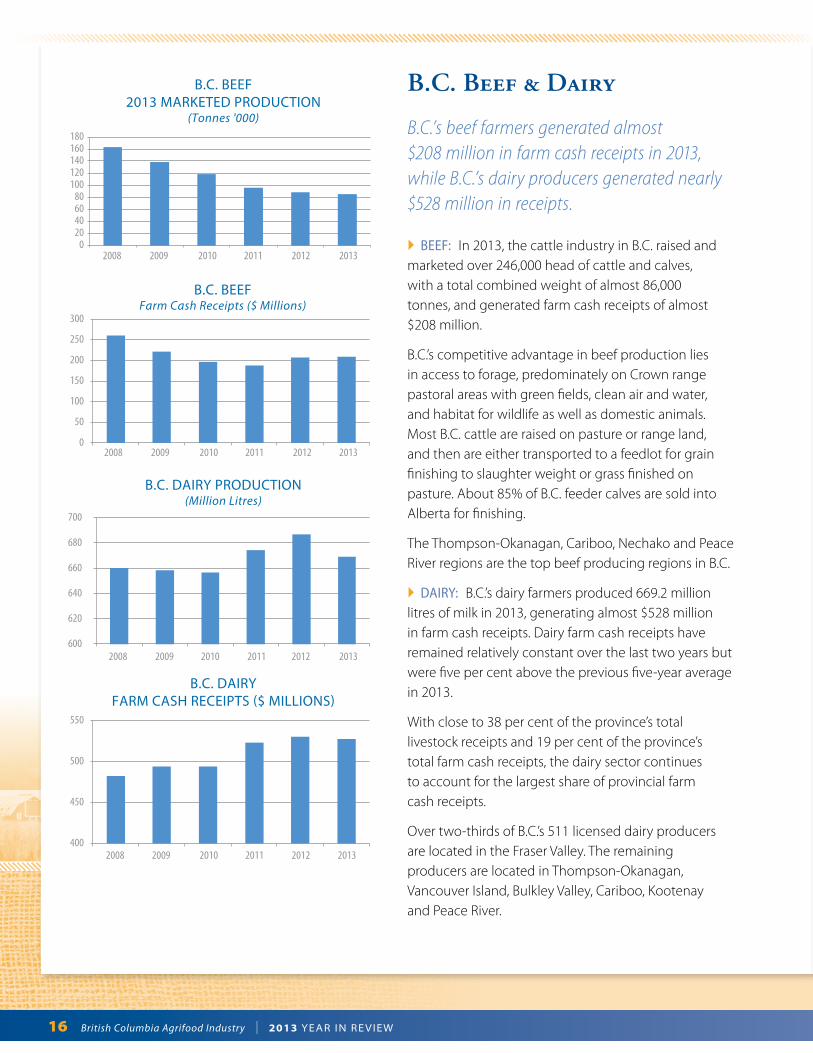
B.C. Beef & Dairy
B.C.’s beef farmers generated almost $208 million in farm cash receipts in 2013, while B.C.’s dairy producers generated nearly $528 million in receipts.
} BEEF: In 2013, the cattle industry in B.C. raised and marketed over 246,000 head of cattle and calves, with a total combined weight of almost 86,000 tonnes, and generated farm cash receipts of almost $208 million.
B.C.’s competitive advantage in beef production lies in access to forage, predominately on Crown range pastoral areas with green fields, clean air and water, and habitat for wildlife as well as domestic animals. Most B.C. cattle are raised on pasture or range land, and then are either transported to a feedlot for grain finishing to slaughter weight or grass finished on pasture. About 85% of B.C. feeder calves are sold into Alberta for finishing.
The Thompson-Okanagan, Cariboo, Nechako and Peace River regions are the top beef producing regions in B.C.
} DAIRY: B.C.’s dairy farmers produced 669.2 million litres of milk in 2013, generating almost $528 million in farm cash receipts. Dairy farm cash receipts have remained relatively constant over the last two years but were five per cent above the previous five-year average in 2013.
With close to 38 per cent of the province’s total livestock receipts and 19 per cent of the province’s total farm cash receipts, the dairy sector continues to account for the largest share of provincial farm cash receipts.
Over two-thirds of B.C.’s 511 licensed dairy producers are located in the Fraser Valley. The remaining producers are located in Thompson-Okanagan, Vancouver Island, Bulkley Valley, Cariboo, Kootenay and Peace River.
B.C. BEEF 2013 MARKETED PRODUCTION
(Tonnes '000)
B.C. DAIRYFARM CASH RECEIPTS $ MILLIONS
B.C. DAIRY PRODUCTION(Million Litres)
B.C. BEEFFarm Cash Receipts ($ Millions)
50
100
150
200
250
300
600
620
640
660
680
700
400
450
500
550
02008 2009 2010 2011 2012 2013
2008 2009 2010 2011 2012 2013
2008 2009 2010 2011 2012 2013
020406080
100120140160180
2008 2009 2010 2011 2012 2013
British Columbia Agrifood Industry | 2013 YEAR IN RE VIEW 17
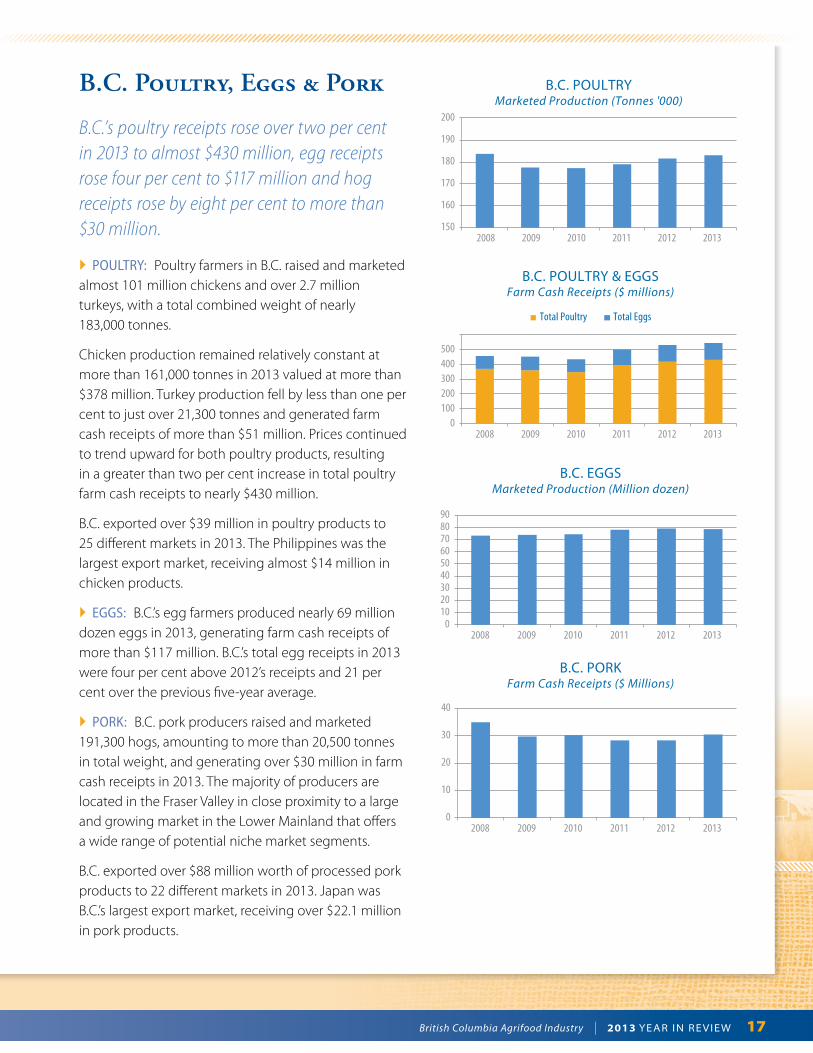
B.C. Poultry, Eggs & Pork
B.C.’s poultry receipts rose over two per cent in 2013 to almost $430 million, egg receipts rose four per cent to $117 million and hog receipts rose by eight per cent to more than $30 million.
} POULTRY: Poultry farmers in B.C. raised and marketed almost 101 million chickens and over 2.7 million turkeys, with a total combined weight of nearly 183,000 tonnes.
Chicken production remained relatively constant at more than 161,000 tonnes in 2013 valued at more than $378 million. Turkey production fell by less than one per cent to just over 21,300 tonnes and generated farm cash receipts of more than $51 million. Prices continued to trend upward for both poultry products, resulting in a greater than two per cent increase in total poultry farm cash receipts to nearly $430 million.
B.C. exported over $39 million in poultry products to 25 different markets in 2013. The Philippines was the largest export market, receiving almost $14 million in chicken products.
} EGGS: B.C.’s egg farmers produced nearly 69 million dozen eggs in 2013, generating farm cash receipts of more than $117 million. B.C.’s total egg receipts in 2013 were four per cent above 2012’s receipts and 21 per cent over the previous five-year average.
} PORK: B.C. pork producers raised and marketed 191,300 hogs, amounting to more than 20,500 tonnes in total weight, and generating over $30 million in farm cash receipts in 2013. The majority of producers are located in the Fraser Valley in close proximity to a large and growing market in the Lower Mainland that offers a wide range of potential niche market segments.
B.C. exported over $88 million worth of processed pork products to 22 different markets in 2013. Japan was B.C.’s largest export market, receiving over $22.1 million in pork products.
Total Poultry Total Eggs
0102030405060708090
150
160
170
180
190
200
0100200300400500
2008 2009 2010 2011 2012 2013
2008 2009 2010 2011 2012 2013
2008 2009 2010 2011 2012 2013
0
10
20
30
40
2008 2009 2010 2011 2012 2013
B.C. PORKFarm Cash Receipts ($ Millions)
B.C. EGGSMarketed Production (Million dozen)
B.C. POULTRYMarketed Production (Tonnes '000)
B.C. POULTRY & EGGSFarm Cash Receipts ($ millions)
18 British Columbia Agrifood Industry | 2013 YEAR IN RE VIEW
B.C. Other Animals & Animal Products
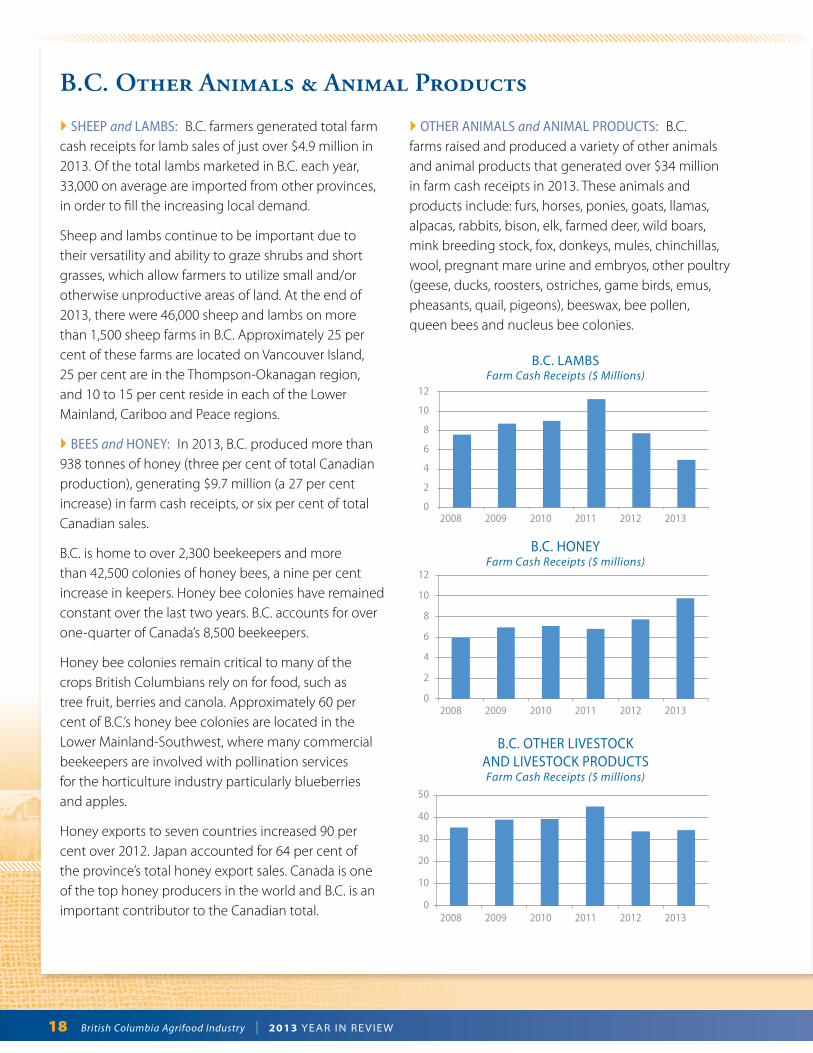
} SHEEP and LAMBS: B.C. farmers generated total farm cash receipts for lamb sales of just over $4.9 million in 2013. Of the total lambs marketed in B.C. each year, 33,000 on average are imported from other provinces, in order to fill the increasing local demand.
Sheep and lambs continue to be important due to their versatility and ability to graze shrubs and short grasses, which allow farmers to utilize small and/or otherwise unproductive areas of land. At the end of 2013, there were 46,000 sheep and lambs on more than 1,500 sheep farms in B.C. Approximately 25 per cent of these farms are located on Vancouver Island, 25 per cent are in the Thompson-Okanagan region, and 10 to 15 per cent reside in each of the Lower Mainland, Cariboo and Peace regions.
} BEES and HONEY: In 2013, B.C. produced more than 938 tonnes of honey (three per cent of total Canadian production), generating $9.7 million (a 27 per cent increase) in farm cash receipts, or six per cent of total Canadian sales.
B.C. is home to over 2,300 beekeepers and more than 42,500 colonies of honey bees, a nine per cent increase in keepers. Honey bee colonies have remained constant over the last two years. B.C. accounts for over one-quarter of Canada’s 8,500 beekeepers.
Honey bee colonies remain critical to many of the crops British Columbians rely on for food, such as tree fruit, berries and canola. Approximately 60 per cent of B.C.’s honey bee colonies are located in the Lower Mainland-Southwest, where many commercial beekeepers are involved with pollination services for the horticulture industry particularly blueberries and apples.
Honey exports to seven countries increased 90 per cent over 2012. Japan accounted for 64 per cent of the province’s total honey export sales. Canada is one of the top honey producers in the world and B.C. is an important contributor to the Canadian total.
} OTHER ANIMALS and ANIMAL PRODUCTS: B.C. farms raised and produced a variety of other animals and animal products that generated over $34 million in farm cash receipts in 2013. These animals and products include: furs, horses, ponies, goats, llamas, alpacas, rabbits, bison, elk, farmed deer, wild boars, mink breeding stock, fox, donkeys, mules, chinchillas, wool, pregnant mare urine and embryos, other poultry (geese, ducks, roosters, ostriches, game birds, emus, pheasants, quail, pigeons), beeswax, bee pollen, queen bees and nucleus bee colonies.
0
2
4
6
8
10
12
0
2
4
6
8
10
12
0
10
20
30
40
50
2008 2009 2010 2011 2012 2013
2008 2009 2010 2011 2012 2013
2008 2009 2010 2011 2012 2013
B.C. LAMBSFarm Cash Receipts ($ Millions)
B.C. HONEYFarm Cash Receipts ($ millions)
B.C. OTHER LIVESTOCK AND LIVESTOCK PRODUCTSFarm Cash Receipts ($ millions)
British Columbia Agrifood Industry | 2013 YEAR IN RE VIEW 19
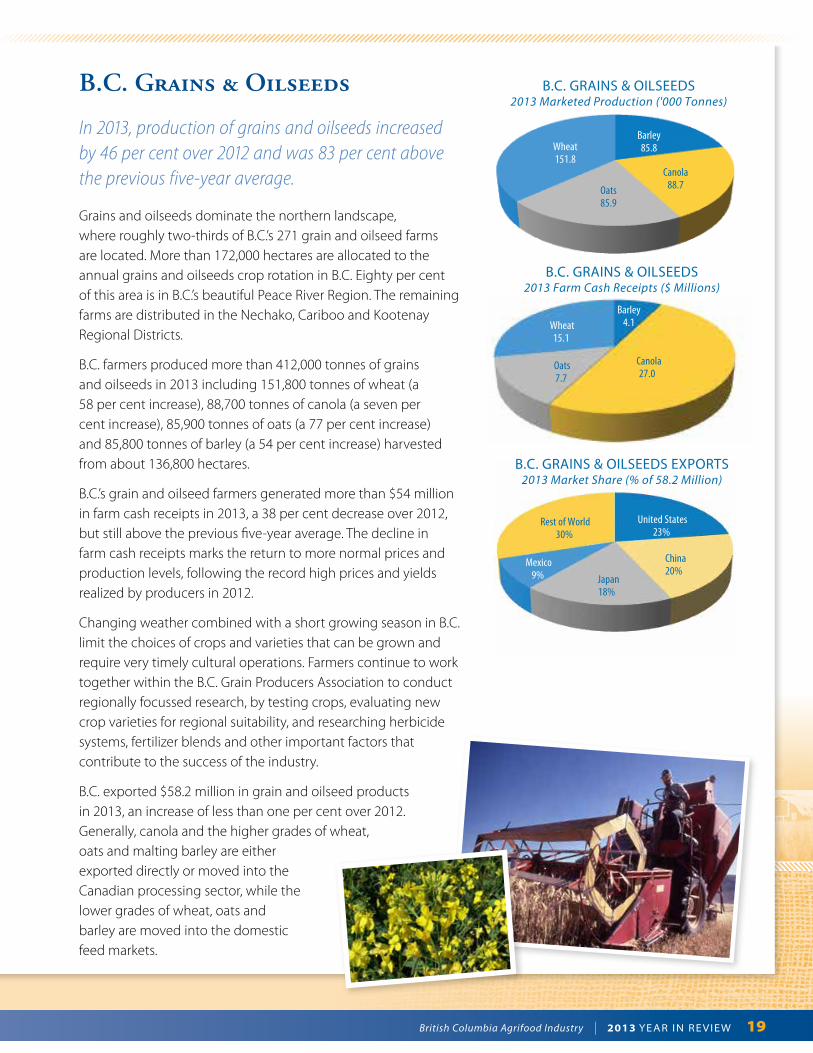
B.C. Grains & Oilseeds
In 2013, production of grains and oilseeds increased by 46 per cent over 2012 and was 83 per cent above the previous five-year average.
Grains and oilseeds dominate the northern landscape, where roughly two-thirds of B.C.’s 271 grain and oilseed farms are located. More than 172,000 hectares are allocated to the annual grains and oilseeds crop rotation in B.C. Eighty per cent of this area is in B.C.’s beautiful Peace River Region. The remaining farms are distributed in the Nechako, Cariboo and Kootenay Regional Districts.
B.C. farmers produced more than 412,000 tonnes of grains and oilseeds in 2013 including 151,800 tonnes of wheat (a 58 per cent increase), 88,700 tonnes of canola (a seven per cent increase), 85,900 tonnes of oats (a 77 per cent increase) and 85,800 tonnes of barley (a 54 per cent increase) harvested from about 136,800 hectares.
B.C.’s grain and oilseed farmers generated more than $54 million in farm cash receipts in 2013, a 38 per cent decrease over 2012, but still above the previous five-year average. The decline in farm cash receipts marks the return to more normal prices and production levels, following the record high prices and yields realized by producers in 2012.
Changing weather combined with a short growing season in B.C. limit the choices of crops and varieties that can be grown and require very timely cultural operations. Farmers continue to work together within the B.C. Grain Producers Association to conduct regionally focussed research, by testing crops, evaluating new crop varieties for regional suitability, and researching herbicide systems, fertilizer blends and other important factors that contribute to the success of the industry.
B.C. exported $58.2 million in grain and oilseed products in 2013, an increase of less than one per cent over 2012. Generally, canola and the higher grades of wheat, oats and malting barley are either exported directly or moved into the Canadian processing sector, while the lower grades of wheat, oats and barley are moved into the domestic feed markets.
Canola88.7Oats
85.9
China20%
Japan18%
Mexico9%
Rest of World30%
Canola27.0
Oats7.7
Barley85.8Wheat
151.8
Barley 4.1 Wheat
15.1
United States23%
B.C. GRAINS & OILSEEDS2013 Marketed Production ('000 Tonnes)
B.C. GRAINS & OILSEEDS EXPORTS2013 Market Share (% of 58.2 Million)
B.C. GRAINS & OILSEEDS2013 Farm Cash Receipts ($ Millions)
20 British Columbia Agrifood Industry | 2013 YEAR IN RE VIEW
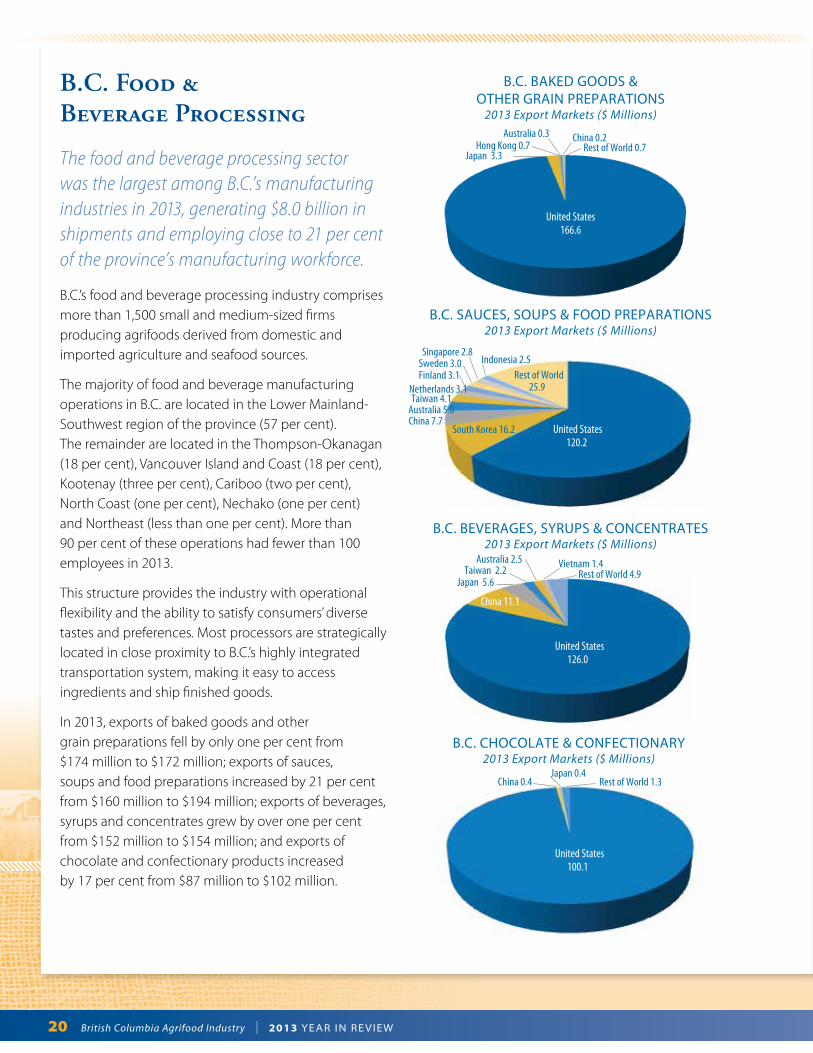
B.C. Food & Beverage Processing
The food and beverage processing sector was the largest among B.C.’s manufacturing industries in 2013, generating $8.0 billion in shipments and employing close to 21 per cent of the province’s manufacturing workforce.
B.C.’s food and beverage processing industry comprises more than 1,500 small and medium-sized firms producing agrifoods derived from domestic and imported agriculture and seafood sources.
The majority of food and beverage manufacturing operations in B.C. are located in the Lower Mainland-Southwest region of the province (57 per cent). The remainder are located in the Thompson-Okanagan (18 per cent), Vancouver Island and Coast (18 per cent), Kootenay (three per cent), Cariboo (two per cent), North Coast (one per cent), Nechako (one per cent) and Northeast (less than one per cent). More than 90 per cent of these operations had fewer than 100 employees in 2013.
This structure provides the industry with operational flexibility and the ability to satisfy consumers’ diverse tastes and preferences. Most processors are strategically located in close proximity to B.C.’s highly integrated transportation system, making it easy to access ingredients and ship finished goods.
In 2013, exports of baked goods and other grain preparations fell by only one per cent from $174 million to $172 million; exports of sauces, soups and food preparations increased by 21 per cent from $160 million to $194 million; exports of beverages, syrups and concentrates grew by over one per cent from $152 million to $154 million; and exports of chocolate and confectionary products increased by 17 per cent from $87 million to $102 million.
United States100.1
Rest of World 0.7 China 0.2
China 7.7
Australia 0.3Hong Kong 0.7
Japan 3.3
China 0.4 Japan 0.4
Rest of World 1.3
China 11.1
Japan 5.6 Taiwan 2.2
Australia 2.5 Vietnam 1.4 Rest of World 4.9
Indonesia 2.5 Singapore 2.8
Sweden 3.0 Finland 3.1
Netherlands 3.1 Taiwan 4.1Australia 5.0
Rest of World25.9
South Korea 16.2
United States166.6
United States126.0
United States 120.2
B.C. BEVERAGES, SYRUPS & CONCENTRATES2013 Export Markets ($ Millions)
B.C. SAUCES, SOUPS & FOOD PREPARATIONS2013 Export Markets ($ Millions)
B.C. BAKED GOODS & OTHER GRAIN PREPARATIONS
2013 Export Markets ($ Millions)
B.C. CHOCOLATE & CONFECTIONARY2013 Export Markets ($ Millions)
British Columbia Agrifood Industry | 2013 YEAR IN RE VIEW 21
Significant Events in B.C. Agrifood – 2013/2014
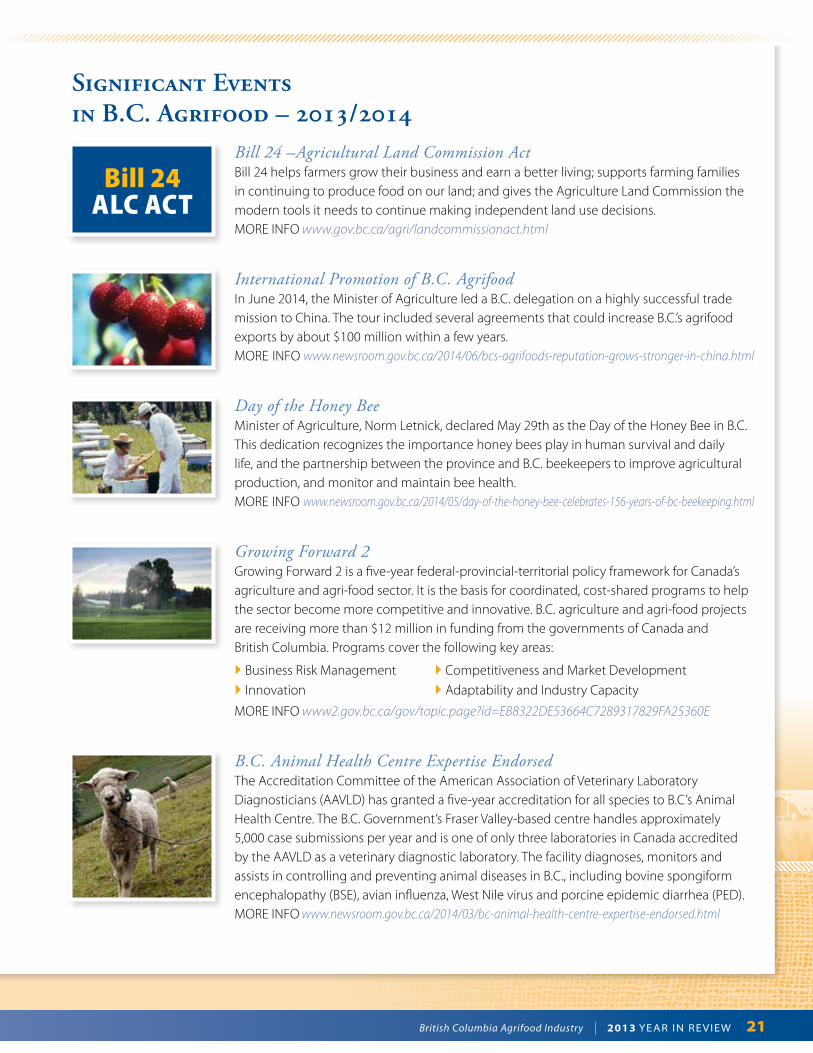
Bill 24 –Agricultural Land Commission ActBill 24 helps farmers grow their business and earn a better living; supports farming families in continuing to produce food on our land; and gives the Agriculture Land Commission the modern tools it needs to continue making independent land use decisions.MORE INFO www.gov.bc.ca/agri/landcommissionact.html
International Promotion of B.C. AgrifoodIn June 2014, the Minister of Agriculture led a B.C. delegation on a highly successful trade mission to China. The tour included several agreements that could increase B.C.’s agrifood exports by about $100 million within a few years.MORE INFO www.newsroom.gov.bc.ca/2014/06/bcs-agrifoods-reputation-grows-stronger-in-china.html
Day of the Honey BeeMinister of Agriculture, Norm Letnick, declared May 29th as the Day of the Honey Bee in B.C. This dedication recognizes the importance honey bees play in human survival and daily life, and the partnership between the province and B.C. beekeepers to improve agricultural production, and monitor and maintain bee health.MORE INFO www.newsroom.gov.bc.ca/2014/05/day-of-the-honey-bee-celebrates-156-years-of-bc-beekeeping.html
Growing Forward 2Growing Forward 2 is a five-year federal-provincial-territorial policy framework for Canada’s agriculture and agri-food sector. It is the basis for coordinated, cost-shared programs to help the sector become more competitive and innovative. B.C. agriculture and agri-food projects are receiving more than $12 million in funding from the governments of Canada and British Columbia. Programs cover the following key areas:
} Business Risk Management
} Innovation
} Competitiveness and Market Development
} Adaptability and Industry Capacity
MORE INFO www2.gov.bc.ca/gov/topic.page?id=EB8322DE53664C7289317829FA25360E
B.C. Animal Health Centre Expertise EndorsedThe Accreditation Committee of the American Association of Veterinary Laboratory Diagnosticians (AAVLD) has granted a five-year accreditation for all species to B.C’s Animal Health Centre. The B.C. Government’s Fraser Valley-based centre handles approximately 5,000 case submissions per year and is one of only three laboratories in Canada accredited by the AAVLD as a veterinary diagnostic laboratory. The facility diagnoses, monitors and assists in controlling and preventing animal diseases in B.C., including bovine spongiform encephalopathy (BSE), avian influenza, West Nile virus and porcine epidemic diarrhea (PED).MORE INFO www.newsroom.gov.bc.ca/2014/03/bc-animal-health-centre-expertise-endorsed.html
Bill 24ALC ACT

22 British Columbia Agrifood Industry | 2013 YEAR IN RE VIEW
Data Sources / More Information
Data Sources• Production, farm cash receipts, manufacturing shipment values,
and employment data sourced from Statistics Canada.
• Mushroom sector data estimates and additional honey data produced by Ministry of Agriculture.
• Specific industry data obtained from industry associations, where necessary.
• Export data sourced from Statistics Canada through the Global Trade Atlas and CATSNET databases.
Contact InformationThis report is available online at www.al.gov.bc.ca/stats/
For more information on B.C. Food products and suppliers, please contact:Ministry of Agriculture PO Box 9120 Stn Prov Gov Victoria, B.C. V8W 9B4 Email: [email protected]
For more information on B.C.’s seafood industry please visit www.bcseafood.ca
August 2014

British Columbia Agrifood Industry | 2013 YEAR IN RE VIEW 23