british columbia utilities commission columbia utilities commission ......
TRANSCRIPT

c+ -1/
BRITISH COLUMBIA UTILITIES COMMISSION
IN THE MATTER OF the Utilities Commission Act,R.S.B.C. 1996, Chapter 473 (the" Acf')
In the matter ofBRITISH COLUMBIA HYDRO AND POWER AUTHORITY
(Be HYDRO)
2007 Rate Design Application
DOCUMENTS REFERRED TO DURINGCROSS-EXAMINATION OF BC HYDRO BY
TERASEN UTILITIES
BOOK 2(TABS 11~21)
July 2007
DM_ VANI240148-00595/6700714.2 09/07/200710:11 AM
C7-11

!
I/
(1 2.5.7 Classificationof DistributionSystem
BChydro mlUI
-!
, II
2 BC Hydro has reviewed the Distribution system in order to classify the cost of distribution.
3 The review of the Distribution system consisted of a review of distribution capital assets and
4 the sub-functionalization of the capital assets into the following categories:
5 • distribution wires,
6 • distribution transformers, and
7 • street lighting.
8
9
10
11
12
13~ 14
15
16
17
18
19
20
21
22
23
24
25
26
The distribution wires system includes duct banks, underground cables, switching cubicles,
poles, overhead conductors, switches, fuses and all distribution assets except transformers.
The distribution wires system was allocated to rate classes where customers are connected
to the distribution system (all rate classes except Transmission), and were classified as
75 per cent demand related and 25 per cent customer related. The portion of costs
classified as demand and customer related is based on experience and the practices of
other distribution utilities. The majority of the distribution system is typically designed to meet
the system demand while local facilities are designed to connect the customer and therefore
the majority of costs are classified as demand related.
As discussed in section 2.3.3, an NCP allocator was used to allocate Distribution costs. The
distribution transformer system includes the cost of the step down transformer. Rate classes
that take primary service do not make use of transformers and were not allocated any cost
associated with distribution transformers. The distribution transformer system was classified
as 75 per cent demand related and 25 per cent customer related.
The cost of distribution metering was allocated on the basis of the cost of replacement
meters and the number of services, by meter type. The meter types are linked back to rate
class in order to allocate metering costs to rate classes.
The assets categorized as street lights were assets in service solely to provide street lighting
service.
Be Hydro 2007 Rate Design Application-22-
,.
..
British Columbia Utilities CommissionInformation Request No. 1.21.1 Dated: April 5, 2007British Columbia Hydro & Power AuthorityResponse issued April 30, 2007British Columbia Hydro & Power AuthorityBC Hvdro 2007 Rate Desian Application
Page 1of 1
Exhibit:B-3
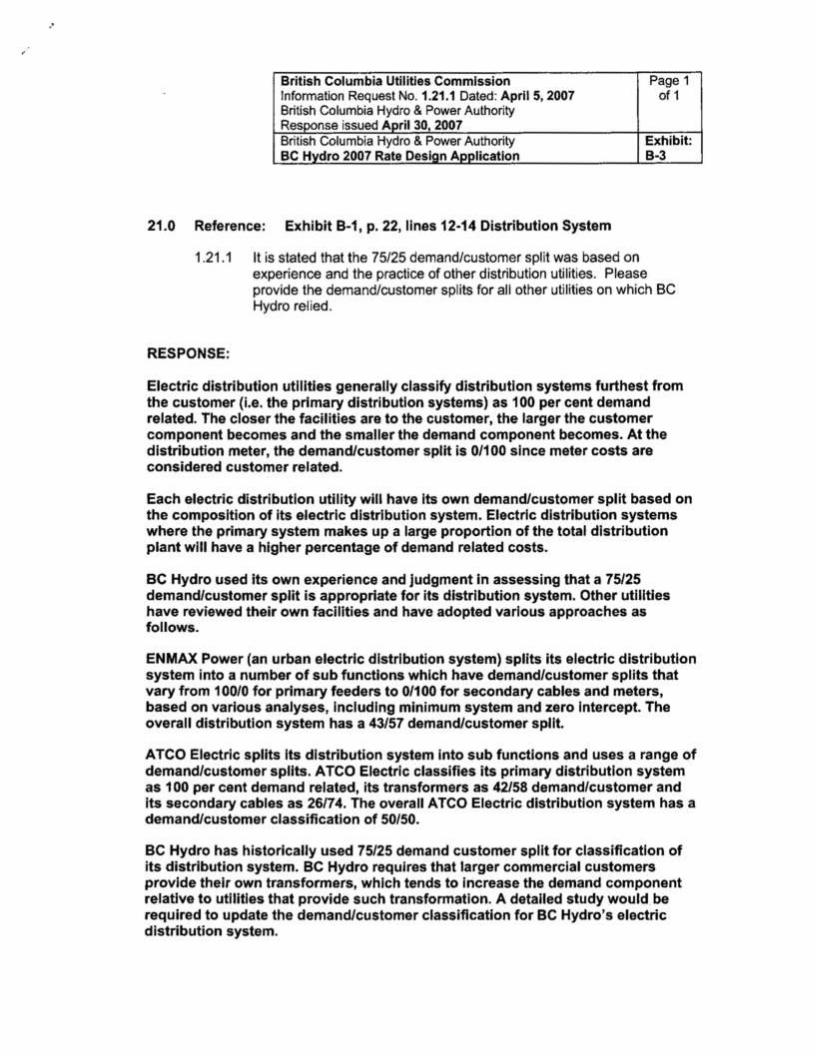
21.0 Reference: Exhibit B-1, p. 22, lines 12-14 Distribution System
1.21.1 It is stated that the 75/25 demand/customer split was based onexperience and the practice of other distribution utilities. Pleaseprovide the demand/customer splits for all other utilities on which BeHydro relied.
RESPONSE:
Electric distribution utilities generally classify distribution systems furthest fromthe customer (i.e. the primary distribution systems) as 100 per cent demandrelated. The closer the facilities are to the customer, the larger the customercomponent becomes and the smaller the demand component becomes. At thedistribution meter, the demand/customer split is 0/100 since meter costs areconsidered customer related.
Each electric distribution utility will have its own demand/customer split based onthe composition of its electric distribution system. Electric distribution systemswhere the primary system makes up a large proportion of the total distributionplant will have a higher percentage of demand related costs.
BC Hydro used its own experience and judgment in assessing that a 75/25demand/customer split is appropriate for its distribution system. Other utilitieshave reviewed their own facilities and have adopted various approaches asfollows.
ENMAX Power (an urban electric distribution system) splits its electric distributionsystem into a number of sub functions which have demand/customer splits thatvary from 100/0 for primary feeders to 0/100 for secondary cables and meters,based on various analyses, including minimum system and zero intercept. Theoverall distribution system has a 43/57 demand/customer split.
ATCO Electric splits its distribution system into sub functions and uses a range ofdemand/customer splits. ATCO Electric classifies its primary distribution systemas 100 per cent demand related, its transformers as 42/58 demand/customer andits secondary cables as 26/74. The overall ATCO Electric distribution system has ademand/customer classification of SO/50.
BC Hydro has historically used 75/25 demand customer split for classification ofits distribution system. BC Hydro requires that larger commercial customersprovide their own transformers, which tends to increase the demand componentrelative to utilities that provide such transformation. A detailed study would berequired to update the demand/customer classification for BC Hydro's electricdistribution system.

British Columbia Utilities CommissionInformation Request No. 1.21.2 Dated: April 5, 2007British Columbia Hydro & Power AuthorityResponse issued April 30, 2007British Columbia Hydro & Power AuthorityBC Hvdro 2007 Rate Desian Application
Page 1of 1
Exhibit:B-3
21.0 Reference: Exhibit B-1, p. 22, lines 12-14 Distribution System
1.21.2 Please provide the demand/customer split from each Be Hydro COSAperformed since 1995 and describe the methodology employed (forinstance, was the split determined by survey, minimum system orintercept analysis?)
RESPONSE:
BC Hydro's 1998 Cost of Service Study used a 73/27 demand/customer split forthe classification of the primary distribution system. The classification was basedon a distribution system analysis, which considers individual components similarto minimum system analysis.

I(I!
Terasen Gas Inc.Information Request No. 1.14.4 Dated: April 11, 2007British Columbia Hydro & Power AuthorityResponse issued April 3D, 2007British Columbia Hydro & Power AuthorityBC Hvdro 2007 Rate DesiQn Aoolication
14.0 Reference: Exhibit B-1, Page 22, Section 2.5.7, lines 8 -16
Page 1of 1
Exhibit:B~3
Preamble: The referenced section states "The distribution wires system wasallocated to rate classes where customers are connected to the distributionsystem (all rate classes except Transmission), and were classified as 75 per centdemand related and 25 per cent customer related. The portion of costs classifiedas demand and customer related is based on experience and the practices ofother distribution utilities."
1.14.4 Has Be Hydro performed any studies at a more detailed level of its owndistribution costs which would lend support to 75% demand-related I25% customer-related split of distribution costs? If so, please file thestudies in this proceeding.
RESPONSE:
BC Hydro has not performed any detailed studies to identify demand related andcustomer related costs associated with its electric distribution system.

(
JIESCInformation Request No. 4.17.2 Dated: June 4, 2007British Columbia Hydro & Power AuthorityResponse issued June 8, 2007British Columbia Hydro & Power AuthorityBC Hvdro 2007 Rate Desian ADDlication
17.0 Reference: Exhibit 8-7, JIESC IR 2.10.1
Page 1of 1
Exhibit:B-9-2
-". (
Explanation: In Information Request JIESC 2.10.1 the JIESC asked that BCHydro:
"Provide the monthly coincident peak demands of each customer class. with andwithout losses, at the times of the domestic peak loads for the fiscal years2001-2005 in the format used for fiscal year 2006 in the spreadsheet identified asJIESC_1_003_1 Attachment 1."
In its response to this Information Request, found in Ex. 8-7, filed Friday, June 1,2007 BC Hydro stated:
"Data sets for years prior to F2004 are incomplete and therefore not useful torespond to this request. In addition, Irrigation and Street Light load profiles forF2004 were unavailable and F2005 load profiles for these rate classes wereused for F2004. F2004 data is provided in a similar format to the response toJIESC IR 1.3.1. This data is included in the document titled "JIESC IR 2.10.1Attachment". Also included in this attachment are the F2005 and F2006 sheetswhere the titles for Irrigation and Street Lights are corrected."
In order to better understand trends in the Peak Loads over time furtherinformation is required.
4.17.2 Provide System Peak data for domestic load by month for F2001 to2007.
RESPONSE:
Please refer to JIESC IR 4.17.2 Attachment 1.

....--..,
JIESC IR 4.17.2 Attachment 1
SYSTEM MONTHLY PEAK
Apr-DO 6,865 Apr-01 7,133 Apr-02 7,087 Apr-03 7,308May-OO 6,545 May-01 6,522 May-02 6,701 May-03 6,537Jun-OO 6,400 Jun-01 6,281 Jun-02 6.487 Jun-03 6,546Jul-OO 6,508 Jul-01 6,234 Jul-02 6,571 Jul-03 6,696
Aug-OO 6,529 Aug-01 6,387 Aug-02 6,585 Aug-03 6,649Sep-OO 6.490 Sep-01 6,452 Sep-02 6,662 Sep-03 6,577Oct-OO 7,402 Oct-01 7,553 Oct-02 7,850 Oct-03 7,741Nov-OO 8,241 Nov-01 8,238 Nov-02 8,196 Nov-03 8,643Dec-OO 8,995 Dec-01 8,692 Dec-02 8,481 Dec-03 8,883Jan-01 8,154 Jan-02 8,398 Jan-03 8,291 Jan-04 9,619Feb-01 8,280 Feb-02 7,929 Feb-03 8,157 Feb-04 8,638Mar-01 7,832 Mar-02 8,037 Mar-03 8,044 Mar-04 8,094
Apr-04 7,031 Apr-OS 7,530 Apr-06 7,357May-04 6,618 May-OS 6,640 May-06 6,902Jun-04 6,729 Jun-05 6,782 Jun-06 7,220Jul-04 6,960 Jul-05 7,007 Jul-06 7,304
Aug-04 6,984 Aug-05 7,039 Aug-06 6,843Sep-04 6,748 Sep-05 7,095 Sap-06 7,013Oct-04 7,686 Oct-OS 7,723 Oct-06 8,327 indicate peak day of the yearNov-04 8,747 Nov-OS 9,128 Nov-06 10,113,Dec-04 8,947 Dec-OS 9,317 Dec-D6 9,315Jan-05 9,437 Jan-D6 9,016 Jan-07 .9,567Feb-05 8.453 Feb-OB 8,789 Feb-07 8,778Mar-OS 7,839 Mar-06 8,411 Mar-07 8,613
Page 1 of 1

!-.IN)<W\ Ll32-. C \5- 8hhibit _IJ;'>L-2)
Page lof8
( Be Hydro
~ ~OO7 IUle DNillD Applitarion
Linxwiler Anal)'sis of Be H)'dro's ~loOlbly Peak Demaods For Fiscal Years ~001-2007
I. Basic Review or Hislori~al ~1onlbly Peak>
Line Deso:M.I!.rion ~OOI 2002 2003 2004 2005 2006 2007
:\lonrhly Firm Peak Demands
--- ;\pol 6.865.000 7.l33,OOO 7.087,000 7.308,000 7.031.000 7.530.000 7.357.0002 ~Iay 6.545.000 6.522.000 6.701.000 6.537.000 6.bl8.000 6.640.000 6.902.0003 JlllIe 6,-l00.000 6.281,000 6,487.000 6.546,000 6,729,000 6,782.000 7,220,0004 Joly 6.508.000 6,234.000 6,571.000 6.696,000 6.960.000 7.007.000 7,304.0005 AogUS! 6,529.000 6.387,000 6.585,000 6,649,000 6,984,000 7,039,000 6,843,0006 Seplember 6.490.000 6.452,000 6,662,000 6.577.000 6.748,000 7.095.000 7.013,0007 October 7.402,000 7.553,000 7,850,000 7,741,000 7.686.000 7.723,000 8,327,0008 :-:ovember 8,241,000 8.238.000 8,196,000 &,643,000 8,747,000 9,128.000 10,113,0009 December 8,995,000 8,692.000 8.481,000 8.883,000 8,947.000 9,317.000 9.315.000
10 January 8.154,000 8.398,000 8.291,000 9.619.000 9,437.000 9,016.000 9.567,000II February 8.280.000 7,929,000 8,157,000 8,638,000 8,-l53,OOO 8.789.000 8,778.00012 Marcb 7.832.000 8.037.000 8.044.000 8.094,000 7.839.000 8,411,000 8.613,000
13 Annual Peak 8,995,000 8.692.000 8,481,000 9.619,000 9,437.000 9,317.000 10,113,00014 Minimum Monthly Peak 6.400,000 6.234,000 6,487.000 6.537,000 6,618,000 6.640.000 6,843,00015 Avera8e of Monthly Peaks 7.353,417 7,321,333 7,.126.000 7,660.917 7,681'.583 7.873,083 8,112.667
16 Month of Annual Peak O«ember December December January January December Sovember17 Monlh of Minimum Monrhly Peak June Joly JlIQe May May May August
:vIonrbly Demands a. Pereenls of Annual Peak18 April 76.32% 82.06% 83.56% 75.97% 74.50% 80.82% 72.75c/o
19 May n76% 75.03% 79.01% 67.96% 70.13% 71.27% 68.25%20 June 71.15% 72.26% 76.49% 68.05%> 71.30% 72.79% 71.39%21 July 72.35% 71.720/0 77.48% 69.61% 73.75% 75.21% 72.22Q/~22 August 72.58% 73.48% 77.640/0 69.12% 74.01% 75.55% 67.67%23 Seplember 72.15% 74.23% 78.55'10 68.38% 71.51% 76.150/. 69.350/.24 October 82.29% 86.90% 92.56% 80.48'10 8l.45% 82.89"1. 82.34%- 25 l'ovember 91.62% 94.78% 96.64% 89.85% 92.69';" 97.97% lOO.OO%26 December 100.00% 100.00% 100.00% 92.35% 94.81% 100.00% 92.11%27 January 911.65% 96.62% 97.76% 100.00% 100.00% 96.77% 94.60%28 February 92.05% 91.22% 96.18% 89.80% 89.57% 94.33% 86.811%29 March 87.07% 92.-\6% 9485% 84.15% 83.07% 90.28% 85.17%
30 Minimwn Monthly Peak 71.15% 71.72% 76.49% 67.96% 70.13% 71.27% 67.67%31 Average of Momhly Peaks 81.75% 84.23% 87.56% 79.64% 81.40% 84.50"';' 80.22%
:\Ionlbly Demands In Rank~d Descending Order32 Grealest (ADDual Peak) 8.995,000 8.692.000 8.481.000 9,619,000 9,437,000 9,317,000 10,113.00033 2-nd Greatest 8.280.000 8.398,000 8.291.000 8.883,000 8.947.000 9,128,000 9.567,00034 3-nd Greatest 8.241,000 8.238,000 8.196,000 8M3.000 8.747,000 9.016,000 9.315.00035 4·th Greatest 8.154.000 8.037.000 8.157.000 8,638.000 8,453,000 8.789,000 &.778.000)(, 5-tb Greatest 7.832.000 7.929,000 8.G44.oo0 8.094.000 7,839.000 8AI1.000 8,613.00037 6-th Gteales, 7,402.000 7.553.000 7.850.000 7,741.000 7,686.000 7.72).000 8.327.000)8 7.th Greatest 6,865,000 7.133.000 7.087.00II 7.308.000 7.031.000 7.530.000 7.357.00039 S-th Greatest 6.54~.000 6.522.000 6.701.000 6,696,000 6.984.000 7.09~.000 7.304.00040 9-tb Great"'t 6.529.000 6.452.000 6.662.000 6.649.000 6.960.000 7.039.000 7.220.00041 IO·th Greatest 6.508.000 6,387.000 6.585.000 6.577,000 6,748,000 7.007.000 ~.013,OOO42 II-th Greatest 6.490.000 6.281.000 6,571.000 6.546.000 6.729.000 1>.7~2.000 6.902.00041 l2·th Greatest 6.400,000 6,234.000 6.487.000 6.537.000 6,618.000 6.640,000 6.M3.000
Lun\""ll~r Cor.sultmg Se[\lc~s.lnc. June II. 2UO:
E:d1ibit _ (JNL-2)Page 2 of g
( BC Hydrop;:;....... \ 2007 R.:ue Design Application
Un~wiler Analysis of BC Hydro's .\tonlhly Peak Demands For Fiscal Years 2001-2007
1. Basic Review of HUlotical ~'oDlbly Peaks...;.;..'.
Une Descrip.tion 2001 21102 2003 2004 2005 2UOCi 2007
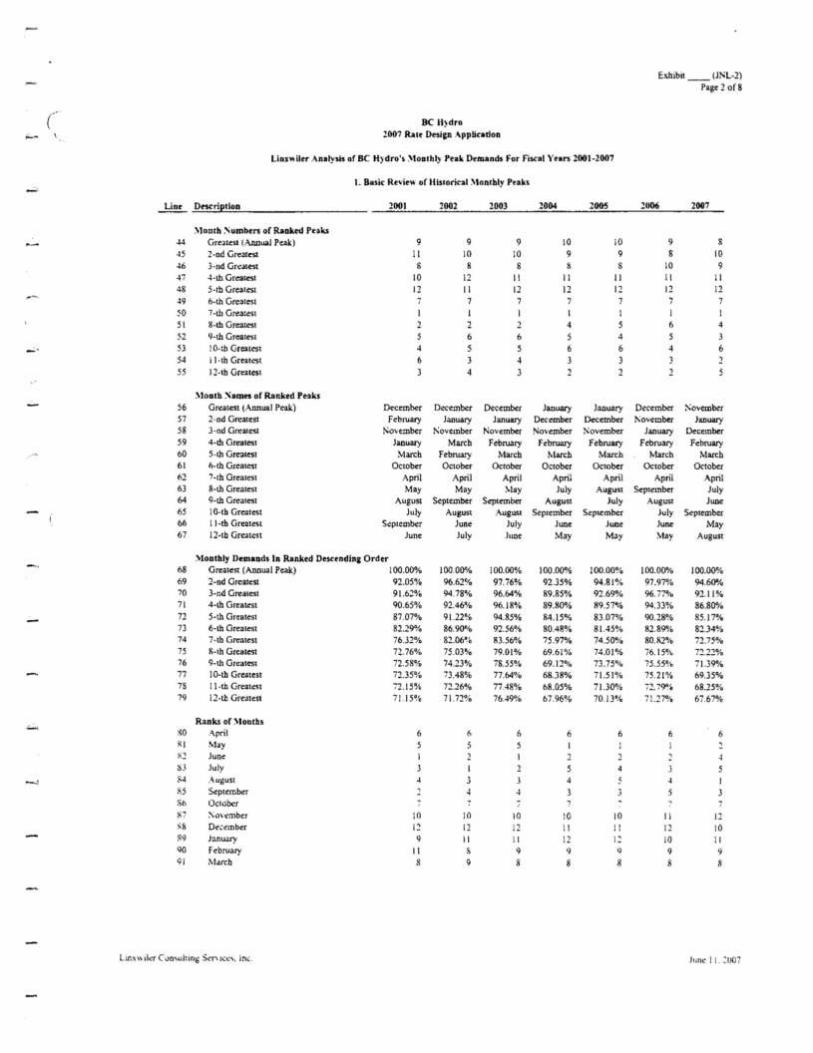
:\.Iolllh .....umbers of Ranked Peaks+I GreateS! (AllDual Peak) 9 9 9 10 10 9 845 2-ndGrear~ II 10 10 9 9 8 1046 3-ndGre;l1~ 8 8 8 8 8 10 9·n 4 -th Greatest 10 12 II 11 II II II48 5 -lb Grealest 12 II 12 12 12 12 12
?'-.49 6-th G""Il;St 7 7 7 7 750 7-th Greatest I I I I I I I51 8-th Greatest 2 2 2 4 5 I} 452 9-th GreaTesl 5 6 6 5 4 5 3
.-:.-~ 53 10-th Greatest 4 5 5 6 6 4 654 1 I·th Grealesl 6 3 4 3 3 355 I 2-lb Grrotest 3 4 3 2 2 2
~Ionlh :'\ames of Ranked Peaks56 Greatesl ( ....llDual Peak) December December December January January December :-;ovember57 2-nd Greatest February January January December December l\ovewber January58 3-nd GrealeS! November November November November i'ovember January December59 4-th Greatest January March February FebnlllI)' February February February60 5-rb Greatest March February March March March March March61 6-th Greatest October October OClober October October October October62 7-rh Greatest April April April April April April April63 8-th Greatest May May :>'lay July August September July64 9-th Greatest August Seplember S,,!>lember August July August June6S 10-th Greatest July August Augll.<1 Seplember September July September66 II-th Greatest September June July June June June May67 12-tb Greatest June July June May May May August
:l-lontbly Demands In Ranked Descending Order1i8 Greatest (Annual Peak) 100.00% 100.00% 100.00% 100.00% 100.00% 100.00% 100.00%69 2-nd Greatest 92.05% 96.62% 97.76% 92.35% 94.81% 97.97% 94.60%70 3-nd Greatest 91.6;!~o 94.78% 96.64% 89.85% 92.69% 96.77°/0 92.11%71 4-tb Greatest 90.65% 92.46% 96.18% 89.80% 89.57% 94.33% 86.80%72 5-lh Greatest 87.07% 91.22% 94.85% 84.15% 83.07% 90.28% 85.17%73 6-lh Greatest 82.29% 86.90% 92.56% 80.48% 81.45% 82.89% 82.34%74 7-th Greatest 76.32°/0 82.06% 83.56% 75.97% 74.50% 80.82% 72.75j%75 8-th Grealest 72.76% 75.03% 79.01% 69.61% 74.01% 76.15% 72.210/076 9-th Grealest 72.58% 74.23% 7S.5S~~ 69.12% 73.75% 75.55% 7U9%77 ID-th Greaten 72.35~o 73.48% 77.64% 68.38% 71.51% 75.21% 69.35%78 Il·th Greatest 72.15% 72.26% 77.48% 68.05% 71.30% 7:!.79'% 68.25%79 12-th Grealest 7L15~lC 71.72%. 76.49% 67.96% 70.13% 71.27% 67.67%
Ranks or :\IOhlhs- ~O April 6 (> 6 6 6 II 6RI May 5 5 5 I I,~2 June I 2 1 2 21>3 July J I 2 5 4 J
~ 1'4 .~uguSl 4 3 J 4 5 4~5 September 2 4 4 3Sh OCIObc:-tf;7 :'\ovember 10 10 10 10 10 II 12'8 December 12 i2 12 11 II 12 10~9 January 9 11 II 12 12 10 1190 february II S 9 9 9 9 991 March S 9 8 8 8 8 8
Linx, .. ikr C un'iuhing S('r'\.lCC .... ln~. June 11. :1l(J7

Exhibit _ tJNL-2)Page3 or8
(--, BC H~dro
2007 Rlll~ Design Application
v . Linl"i1er Anal~'sis of Be Hydro's "Ionthly Peak Demands For Fiscal Years 2001-2007
,.-,I. Basic Re\'iew of Historical .\IODlbly Peab (ConliDu~)
;.- 1... loDlbly Puk Demands
r-'
--
r-
II .llOO.ooo
IO.I~)Q.ooo
~.o.lIl.tXlO
~.OOO.OOO
7.000.000
•. 000.000
l.ooo.ooo
•. 000.000
3.000.000
l.JlOO.OOO
1.000.000
~j~J2
-+-M;..t.I··Mca~. . l .
,...-.
2. Superimposed Monthly Peak Demands
\I~f<bloU:0..::'\0'\OclS~p\u~JoJJun
':·'~~~~~.7~~~;~~~·f;~~·7~~?·~';.~~~~:r~~ii_~~~~:;~:~;~:~~:~{~~~~,-::-~f:F·~;;~-:.~i~:'~':~'~~';".~.<~:<;~:{~:.~'"":~1~- :~~t·:~.\~4)
~.hOil,OOO
'.000.000
9.ooo.UOO
3J.oo.l.JO
I.'I(I",UOO
7.000,000
":,U4IO.OOO
•. 000.000
:.000.1>0<1
11.000.000
10.000.000
"......
,....
.-
±~~!._~~::,:__2~~::}:~:~~~ _~2:~,-=i.:-~O!ii
Lm.\v.lkr C.)nsullin£ Sen i~e.:;. Inc. June II. ~007
,.....

(' Be H~dro2007 IUle Desi&1I Applicatioll
Exbibit _ (J~L-2)Page 5 of 8
,..;....
-"-
~'-
..c.
,,;............
;-0
Lin~"Uer Analysis or Be Hydro's .\1onrbl~· Peak Demaods for fiscal Yean 2001-2007
2. Analysis of 12-CP Allocatioo :\telbod
Lin. DtKnptioll 200t 2002 2003 2004 2005 2006 20117
Basic J!atio Tests for 12-CP\le.hod
Annual Peak vs. Minimum Moothlv PeakAnnual Peak 8.995.000 8,692,000 8,-181.000 9,619,000 9,437.000 9.317,000 10,113,000
2 LOINts' Monthly P.ak 6,400.000 6,234,000 6,487.000 6,537.000 6,618.000 6.1>40.000 6.843.000Ralio Lo"estl\lonthl> to Annual P.ak 71.15~~ 71.12~'o 76.49% 67.96% 70.13% 71.170.'0 67.67~/O
7-y .... RAng.-I Maximum 76.49%5 !\.Iinimum 67.6-;~/O6 Simple A,erage 70.91%
E"c1uding 20037 Maximum 71.72%18 Minimum 67.67%9 Simpl. Average h9.98%
Average P.aks to Annual Peak10 Aonual Peak 8,995,000 8,692,000 8.481.000 9.619,000 9,437,000 9,317.000 10,113.000II Average 12 Monthly Peaks 7.353.417 7.321,333 7.426,000 7,660,917 7,681.583 },873.083 8,112.66712 Ratio Average to Annual Peak 8L75% 84.23% 87.56% 79.1>4% 81.40'10 84.50% 80.22%
7-y.ar Range13 Muimum 87.56~~14 Minimum 79.64%15 Simple Average 82.76%
Lim"'ikr l'onsulllng S~"l(~s.loc. Jun~ Ii. ~OO;

hhibit _lJNL·2)Page 6 of 8
( BC Hldro~- 2007 Rale Design Application
linxwiltr Anall'sis of BC H~'dro's :\Ionlhll' Peal<.Demands For Fiscal Vears 2001-2007
3.. .\nall·sis of 3-CP Allocation :\lelbod~Line DtseriptioD 2001 2002 2003 200.1 2005 2006 2007
. -Bask Rario Tcsts for J-Cp AUocarion \Itlhod
Peak .\loollu: :"io"ember-January
Difference Eklweeo A\"erage Peak "'on,hs.tnd A\'erage OtT-Peal '.10mhs
'" .....I AlllIual Peale. S.995.000 6.692,000 8.~8I,OOO 9,619.000 9,437,000 9.317.000 10.113,0002 A'erage Peale. '-lonms 8,463.333 RA-l2.667 8,322,667 9,048,333 9,043,667 9./53,667 9,665,0003 Juno 10 Annual Peale. 94.09% 97.13% 98.13% 94.07% 95.83% 98.25% 95.57%-I A'erage Non-Peal Months 6.983.444 6.947,556 7.127.111 7,198.4-14 7.227.556 7,.l.-l6,222 -;.5Q5.~225 IUno 10 Annual Peak 77.fM~!o 79. 93~/Cl 84.04% i4.&4% 76.59~'~ 79.92% 75.10%
DitTerence A 'g. Peak Months Over Avg.6 l'on-Pta.Ir. MODlhs ]6.45% 17.20% 14.10% 19.23~', 19.24% 18.33% 20.47%
7-year Range7 Ma ...imwn 20..17%8 Minimum 14.10%9 Simple Average 17.86%
..: Ralio of Average Off-Peak Months10 Average Peak Months
10 Annual Peak 8,995,000 8,692,000 8,~81,OOO 9.619,000 9.437,000 9,317.000 10,113.000II Average Peak Monms 8.463.333 8.442.667 8.322.667 9.048,333 9,043,667 9,153.667 9,665.00012 Ratio 10 Annual Peak 94.09% 97.13% 98.13% 94.07% 95.83% 98.25% 95.57~'O13 A\'erage Non-Peale. Mombs 6.983,444 6,947,556 7.127.111 7.]98,444 7227.556 -:.446.~22 7.59522214 Ralio 10 Annual Peak 77.64% 79.93% 84.04% ;4.&4% 76.59% 79.92% 75.10%
Ratio Avg. Peak Months15 to ....vg. t'on-Peak Months 82.51% 82.29% 85.63'10 79.56% 79.92% S 1.35% 78.58~/c
,.~7.yea.: Range
16 Mailinum 85.63%J7 Minimum 78.580/018 Simple Average 81041%
OtT-Peak Months in Currem Year Exceedinglowesl Peak Momh
19 Lowest Peak MOnlh ofVear 8.154.000 8.238,000 8,196.000 8.643,000 8.747,000 9.0\6,000 9.315,00020 Number r-;on-Peak Months Greater I ° 0 0 0 0 021 Three or More~ ~·o ~o 1\0 l'oio 1'0 1'0 )'\0
Off-Peak Months Exceeding Prior MinimumOn-Peak Monlll
22 Lowes! Peak Month of Prior Year 8.15~.OOO S.Z38,OOO 8.196.000 8.643,000 8,747.000 9.016,00023 "umber r-;on-Peak Months Grea'er 0 0 I 0 J 024 Cumublj,\~ :\"umb~rof Occuren,cs:'5 Cwnulali'e Greater than 10 :-;0
Lm.\\\ iltr Cun~lIltmg Sc"f\ i~c:,.Inc Jllne II. 20117

Exhibit _(JNL-2)Page 7 of8
( BC Hydro-::: 2007 Rale Design Application
liuwiler .-\nal!"i. oC BC Hydro's :\tonlhly Peak Demands for Fiscal Years 2001-2007
~. Analy.i. oC 3-CP Allocation :\telbod
Line D~ril!.riol1 2001 2002 2003 2004 2005 2006 2007
Basic Rario Tests for 3-CP AUocari0l!. 'tethod
Peak \tontb,: December-febnJary
Difference Between Avel3ge Peak \tonthsand A\el3ge Off-PeaIL Months
Annual PeaIL 8.995.000 8,692.000 8,481,000 9,619.000 9,437,000 9,317.000 10,1 J3,OOOAverage PeaIL Months 8.476,333 8,339.667 8,309,667 9,046.667 8,945.667 9.MO.667 9.220,000
3 Ralio 10 Annual PeaIL 94.23% 95.95% 97.98% 94.05% 94.79% 97.03% 91.17%4 Average Non-Peak Months 6.979.111 6,981,889 7,131,#1 7.199,000 7.260.222 7,483.889 7,743.556-', 5 IUtio 10 A.Dnual PeaIL TI.59% 80.33% 84.09"io 74.84% 76.93% 80.33% 76.570/0
Difforc,nce A\ g. Peak MODlhs Over Avg.6 Non-Peak Months 16.65% 15.62% 13.89% 19.21% 17.86% 16.71°/c 14.60%
7-year Range7 Maximum 19.21%8 Minimum 13.89%9 Simple Average 16.36%
Ratjo of Average Off-Peak Monthsto Average PeaIL Mombs
10 Annual Peak 8.995,000 8.692,000 8.481,000 9,619.000 9,437,000 9,317,000 10,113,000II A vel3ge PeaIL Months 8,476,333 8.339,667 8,309,667 9.046,667 8,945,667 9.MO.667 9.220,00012 IUlio to Annual PeaIL 94.23% 95.95% 97.98% 94.05% 94.79% 97.03% 91.17~'O13 A \erage Noo-PeaIL Months 6,979,111 (,,981,889 7,131.444 7,199,000 7.260,122 7,483,889 7.743.55614 Rat io 10 Annual PeaIL 7759% 80.33% 84.09% 74.84% 76.93% 80.33% 76.57%
Ralio Avg. Peak Momhs15 10 Avg.l'on-Peak Months 82.34% 83.72% 85.82% 79.58% 81.16% R2.78~/Q 83.99%
~7-year Range
16 Maximum 85.82%17 Minimum 79.58%18 Simple Average 82.77%
Off-PeaIL Months in Currenl Y~ar E~ce«lingLo",es! PeaIL Month
19 Lowest Peak Month of Year 8,154.000 7.929.000 8,157.000 8,638.000 8,453,000 8.789.000 8,778,00020 Number Non-Peak Months Greater I 2 I 1 1 I I- 21 Three or More? ~o No :-';0 No No 1'0 1'0
Off-Peal< Months Exceeding Prior MinimumOn-Peak Month
22 Lowest Peak ~lolltb of Prior Year 8,154.000 7,929,000 8,157,000 8,638.000 8.453.000 8.789,00023 l\wnber !'olon-Peak :-tonths Grealer I 2 1 I J 124 Cumulative Number of O«urences 7:!5 Cumulative Greater than 10 :-';0
LiIlX\likr CIln.uhlD£ 5(1'\ Ice,. Inc. Jun_ II. ~I)07

hhibil _ONL-2}l'ag( 8 of 8
(,.'
BC H}dro2007 Rare Desillo AppUcatiOD
LiD1"i1u A031ysis of Be H~'dro's :\10ntbly Peak D~mands For Fiscal Years 2001-2007
S. Aoalysis of UP .-\II~arioo :\1~rbod
Line D.. criJ.l.tion 2001 2002 2003 2004 200s 2006 2007
Basic Ralio T .. ls for 4-CP Allocation \Ielbod
Peak .\toolhs: :-Oo\"tmber-Februal")'
DirTer.:nce BelVoeen Averag( Peal: Monlhsand A\(rage Off-Peal. Monlbs
Annual Peak 8,995,000 8,692.000 8A81,000 9.619.000 9.437,000 9.317.000 10,113.0002 Average Pe3l< Months 8A17,5oo 8.31~250 8,281.250 8,945,750 8.896,000 9,062,500 9,443250) IUlio 10 Annual Pe3l< 93.58% 95.65% 97.64D,0 93.00% 94.27~~ 97.27% 93.380/.4 A,<rage Non-Peak Months 6.821.375 6.824,875 6,998,375 7.018,500 7,074,375 7.278.375 7,.\.17,375.- 5 IUlio 10 Annual Peak 75.841'/0 78.52~/o 82.5~~fo 72.96% 74.96% 78.12% 73.64%
Difference Avg. Peak Months Over Avg.6 Non-Peak Months 17.74% 17.14% 15.13% :!O.04~'o 19.30% 19.15% 19.74~1o
7-year Range7 ~1aximum 20.(J4%8 Minimum 15.13%9 Simple Averolge 18.32%
Ratio of Average Off· Peak Months10 Average Peak Months
10 Annual Peak 8,995,000 8,692.000 8.481.000 9,619.000 9,437.000 9.317,000 10,113.000II Average Peak Months 8,417.500 8.314,250 8281,250 8,945,750 8,896,000 9,062,500 9,443,25012 IUtio 10 Annual Pe3\.: 93.58% 95.65% 97.1>4% 93.00% 94.27% 97.27°/. 93.38%
( 13 Average Non-Peak Months 6,821,375 6,824,875 6,998,375 7,018,500 7,074,375 7.278,375 7,447,37514 Ralio to ....lUIual Peak 75.84% 7852% 82,52% 72.96% 74.96% 78.12% 73.64%
Ratio Avg. Peak Months15 10 :\vg. Non-Peak Months 81.04% 82.09% 84.51% 78.46% 79.5~% 80.31% 78.86%
7·year Range16 Maximum 84.51%17 Minimum i'8A6%,18 Simple Avcr.ge 80.68%
,-Off-Peal< Months in Current Year ExoeedingLowest Peak Month
19 Lowest Peak Month of Y(ar 8, IS4,OOO 7.929.000 8,157,000 8,638,000 8,453,000 8,789,000 8,778,00020 Number Nnn-Pcl Montb... Greater 0 I ° 0 0 0 0-' 21 Three or More? No 1'0 ~o No ;0;0 1'0 1\0
Off-Peak Months Exceeding Prior MinimumOp-Peak Month
21 Lowest Peak Month of Prior Year 8.154,000 7.929.000 8,157,000 8.638,000 8.453,000 S,7H9,OOO23 l'umber l"on-Peak Months Greater 0 I 0 0 0 024 Cumulative :\wnber ofOccurences )~, Cumulalive Grealer than 10 :"'0
~....
L1I1.\\\ tier C'Jn ..ulring S~I"\·j~(s.luc. JIllU: I '- 20(1':0

(
British Columbia Utilities CommissionInformation Request No. 2.111.1 Dated: May 16, 2007British Columbia Hydro & Power AuthorityResponse issued June 8, 2007British Columbia Hydro & Power AuthorityBC Hvdro 2007 Rate Desion ADD!"
Page 1of 5
Exhibit:
EXHIBiT
110.0 Reference: Exhibit B·3, ESVIIR 1.2.5 Attachment 1 p.2 Interruption Option;E-4 Interruption Option
2.111.1 In the Attachment Be Hydro states that due to the wet spring they werenot anticipating using the interruption option in the 1990/91 heatingseason. Please explain why it was not used in subsequent years, inparticular the last few years, and why the use of the 30 day mail notice,and penalty billings for failure to comply, could not be used.
RESPONSE:
In the 1980's, BC Hydro had a significant surplus in both energy and capacity.The Pacific Northwest also had a significant surplus, and access to exportmarkets from BC was not sufficiently developed to allow BC Hydro to sell surplusenergy economically, nor were there robust real·time markets. It was in thiscontext that E-Plus rates were developed.
Since that time, load growth has continued and BC Hydro has become a netimporter of energy (with load growth running at approximately 2 percent per year).In addition, there are now robust real-time electricity markets in the PacificNorthwest, and open access transmission tariffs have made those marketsavailable to BC Hydro. Thus, the original premise of the E-Plus rate has beenrendered obsolete by changes in BC Hydro's supply and demand situation andthe industry structure.
Special Conditions of the E-Plus rate allow for the interruption of electricity supplywhen there is lack of surplus hydro energy and the service cannot be providedeconomically from other energy sources. However, the tariff does not clearlydefine 'lack of surplus' hydro energy conditions nor does it define 'economicallyfrom other energy sources'.
As outlined in the response to Rochon IR 1.2.0, lack of surplus hydro energycould arguably mean those periods during which BC Hydro has been a netimporter of electricity. E-Plus customers could arguably now be interruptedcontinuously, which would effectively end the E-Plus service rate.
Be Hydro has considered whether shorter periods of interruption would bepossible and of value in the context of how the system operates, includingdemand patterns and resource options. However, to manage short term systemconstraints Be Hydro currently has several options at its disposal that would bedrawn upon more practicably prior to interrupting E·Plus customers. For example,Be Hydro has the ability to purchase electricity from Powerex (market purchases,

(
British ColumbiaUtilities CommissionInformation Request No. 2.111.1 Dated: May 16, 2007British Columbia Hydro & Power AuthorityResponse issued June 8, 2007British Columbia Hydro & Power AuthorityBC Hvdro 2007 Rate Desian Aoplication
Page 2of 5
Exhibit:B~7-1
including eanadian Entitlement), operate the Burrard Thermal generating stationor initiate voluntary customer curtailment. All of these options provide a quickresponse and the high degree of reliability required to address a short termsupply shortage. For reasons described below, curtailment of E-Plus customersinvolves a longer notice and activation period before the beneficial relief isexperienced and therefore would provide no value for short term, real-time needs.
If BC Hydro were to consider implementing an E-Plus rate interruption driven bysupply shortages for serving domestic load, the only plausible interruption periodwould need to be for several months and during the winter season (November toFebruary) when the system experiences its peak demand load and when theE-Plus load is highest (roughly 88GWh for the 2005/2006winter season).
If BC Hydro were to interrupt E-Plus customers over the winter season, it wouldbe necessary, in light of the fact that E-Plus customers have never beeninterrupted, to develop a comprehensive notification process. Notification wouldbe issued to advise customers of the period of interruption; the customer'sresponsibility in regards to the safe operation and adequacy of back-up systems;and an explanation of penalty rates to be billed if the E-Plus service were to beused during the interruption period. Notification would also advise on Schedule1105 Special Conditions 3 and 10 that stipulate interruption non-compliance mayresult in forfeiture of entitlement to this rate schedule until it can be demonstratedthat adequate standby facilities exist. Additionally, customers would be advisedthat they have the option to switch to the standard rate but that such a transferrequires giving 3 months prior notice to Be Hydro.
As per Schedule 1105 Special eondition 3, written notification requires eitherhand delivery or issuance by registered mail. Given the dispersion of E-Pluscustomers throughout the province, registered mail would likely be utilized.eonfirmation of receipt of registered mail would be required to ensure all E-Pluscustomers received notification. Not only is this stipulated in the tariff but it isalso very important to ensure the safety of E-Plus customers given that it hasbeen 20 years without interruption since the inception of the program. This is amanual process matching notifications issued with customer acknowledgements.It is expected that not all customer confirmations would be received on an initialmail-out and that would then precipitate the need for a second registered notice to
. those who have not confirmed receipt. If, after both mailings, customerconfirmation is still not confirmed, hand delivery would then be required andused.
Working to an interruption period starting in November, the initial mail out wouldoccur throughout March. Mail drops would be staggered to better manageexpected incremental enquiries to the eaU eentre and processing ofconfirmations. The second mail out would occur in May and hand delivery, ifrequired, would occur in'June. This notification process would allow customers

(--
British Columbia Utilities CommissionInformation Request No. 2.111.1 Dated: May 16, 2007British Columbia Hydro & Power AuthorityResponse issued June 8. 2007British Columbia Hydro & Power AuthorityBC Hvdro 2007 Rate DesiQn AD plication
Page 3of 5
Exhibit:8-7-1
\
the time to seek clarification and decide on how they could best respond to theinterruption period. Furthermore, if customers elect to move to the standard rate,this time-varied approach allows for BC Hydro to be notified by the end of July forthe 3 month (August to October) time requirement needed to switch the rate.
Given the length of time between initial notification and interruption, billmessages and/or inserts would be used to remind customers of the upcominginterruption period. An additional direct mailing and newspaper ads would also beconsidered.
Confirmation of compliance with an interruption request requires measurement bymeter readings. As E-Plus customers are widely dispersed throughout theprovince, the meter reading and resulting billing cycles vary by customer. As themajority of E-Plus customers are residential customers, meters are typically readevery second month within a two day window.
Assuming existing scheduled meter readings are used to measure compliance,the start of an interruption period would span over two months. Essentially most,if not all, interrupted E·Plus customers would have different absolute periods ofinterruption. Those that are read in the odd month would have an interruptionperiod of November to March and those read in the even month would have aninterruption period of December to April. Scheduled meter readings would need tobe identified for each E-Plus customer and therefore written notification wouldrequire customization to address differing periods of interruption.
Assuming unscheduled meter readings would be used to measure compliance,BC Hydro staff would need to attend each E-Plus premise to obtain a meterreading at the start and the end of the interruption period. It is not reasonable toexpect that all E-Plus unscheduled readings would occur on the same day giventhe varying locations of customers but is more reasonable to expect that thesereadings could be accomplished within a shorter time period such as two weeks.In this case, E-Plus customers would have interruption periods with more uniformstart and finish dates and all would be from November to February.
Regardless of which of the above two methods are used, there would always beissues related to meter access that impact the ability to read. Customers that haveinaccessible meters would need to be contacted and arrangements made to readthe meter would then impact the interruption period and require manualprocessing in the billing system.
Billing system functionality to invoice penalty rates does not currently exist. Itwas not built in the past because E-Plus customers have never been interrupted.It is anticipated that most E-Plus customers would either comply with interruptionor switch to the standard rate leaving relatively few accounts that would incurpenalty charges. From a system perspective this does not change the need to
( '"--
British Columbia Utilities CommissionInformation Request No. 2.111.1 Dated: May 16, 2007British Columbia Hydro & Power AuthorityResponse issued June 8, 2007British Columbia Hydro & Power AuthorityBC Hvdro 2007 Rate Desian AODlication
Page 4of 5
Exhibit:8-7-1
/\
develop and test programming that provides for the accurate invoicing of E-Pluscustomers. Even with this functionality in place, there would almost certainly beaccounts that require manual processing given the coordination required betweenreadings and interruption periods.
Even with extensive customer notification of interruption periods and associateddetails, it is expected that a number of E-Plus customers would not respond untilafter they receive a first penalty billing (which is currently 19.55cents per KWhbased on a rate approximately 6 times greater than the E-Plus rate or 3 timesgreater than the standard Residential rate during a non-interruption period).During a heating season, an average monthly bill of 1500kWh is approximated at$50 during a non·interruptible period. If the same consumption is used during aperiod of interruption, the cost increases to about $290. It is expecte~ thatcustomers experiencing this penalty would inquire about their invoice which,inturn, would cause a requirement to explain their bill and forfeiture of entitlementto this rate schedule (until it can be demonstrated that adequate standby facilitiesexist) once the period of interruption is complete. During the period of interruptioncustomers are not able to switch to the standard rate and face the higher rate forthe duration of the interruption period. Some of these customers could then revertto back-up energy systems for the duration of the interruption.
eustomers that do not curtail would need to be notified of the removal of theE-Plus rate after the interruption period. However, if these customers candemonstrate that adequate back-up systems are in place, Be Hydro may allow thecontinuance of the rate, although this would require review on a customer-by-customer basis that could include site checks to confirm systems. Training offield staff to perform this type of site check would need to be developed anddelivered.
Be Hydro anticipates that the amount of energy realized from an interruptionwould be very small relative to the amount of energy required to address thesupply shortfall. However, winter-season interruption may be of some value toBC Hydro's long-term supply and capacity management planning, providedcustomers actually curtail. BC Hydro believes it is unrealistic to assume that allcustomers would curtail and indeed, as noted, believes that upon notification ofimpending interruption a portion of E·Plus customers would switch to the regularResidential rate because the back-up energy source is no longer convenient,available, economical or operable. As well, it is expected that some E-Pluscustomers would not curtail, or would curtail for only a portion of the interruptionperiod, and continue to use electricity as their energy source, incurring theassociated penalty.
For these reasons, it is difficult to estimate what portion of E-Plus customerswould actually curtail in the event of an interruption. At least one interruptionperiod would be required to observe and establish the responsiveness behavior
('
British Columbia Utilities CommissionInformation Request No. 2.111.1 Dated: May 16, 2007British Columbia Hydro & Power AuthorityResponse issued June 8, 2007British Columbia Hydro & Power AuthorityBC Hvdro 2007 Rate DesiQn Aoplication
Page 5of 5
Exhibit:8-7-1
pattern of E-Plus customers before any meaningful and useful data would beavailable for incorporation in BC Hydro's long-term load forecasting, planning,decision and system management operational process.
Be Hydro conservatively estimates the cost of interrupting E·Plus customers tobe roughly $1.4 Million if regular reading schedules were used and $1.8 Million ifspecial reading schedules were used.
For illustration purposes, using the E-Plus 2005/06winter consumption of 88,000MWh as a point of reference, the value of a 25 per cent reduction in energy useresulting from customer curtailment is estimated at $1 Million and the value of a50 per cent energy use reduction is estimated at $2 Million.
Since Be Hydro does have a gap between energy supply and demand,interrupting E-Plus customers for an extended period of time would, in theory,provide some marginal benefit. However, Be Hydro has other options ava1labletomeet the supply shortage that are economic, more practical, less problematic andnot as disruptive to customers. BC Hydro believes it should exercise thoseoptions first and not use extended interruptions of customers to meet supply gapissues.

BChydro '"w
1 Following the determination that a cost is proportional to demand, the next question that
2 must be answered, is when does this demand occur? The answer is based on reviewing
3 how the system is planned and designed. If there is one identifiable large demand that is the \
4 sale focus of planning and design activities, then a single coincident peak or 1 CP method of
5 allocation is appropriate for the classification of the demand related costs. A 1 CP method of
6 classifying demand related costs may be appropriate regardless of whether the peak load
7 occurs in the summer or the winter.
8 When planners determine conditions that cause stress on the system, and develop capital
9 upgrades to alleviate the stress, the planners must consider the ability of the system to
10 deliver the energy in addition to forecasting the load on the system. The thermal capacity of
11 electric systems is diminished in the summer as the result of higher ambient temperatures,
12 and the reduced ability for cooling of equipment. An electric system has a derated capacity
13 in the summer time that may result in stress to the system even if the load is smaller or
14 similar to winter load. When transmission upgrades are completed to alleviate stress at
15 times other than that of the annual peak load, 1 CP is not appropriate.
16 Demand classification may vary for each function. Demand related costs for transmission
17 systems are commonly based on coincident peaks because many diverse customers
18 contribute to a coincident load condition. Demand related costs on distribution systems are
19 commonly based on non coincident peaks because there is less diversity between
20 customers, and each individual customer stresses the system close to the customers'
21 service entrance.
22 Transmission systems are commonly designed for more than one annual peak load. The
23 BC Hydro transmission system spans across the province and must be designed to provide
24 reliable service throughout the yeauparts of BC Hydro's transmission system must serve
25 loads that peak in the summer time such as in the Okanagan area. Transmission lines
26 providing service to the southeast interior experience more congestion in the summer than
27 in the winter. The transmission lines providing service to Vancouver Island experience peak
28 load conditions in the winter.
Be Hydro 2007 Rate Design Application-19-

(
(
.,.""..,...•:/~
·~l..~British Columbia TransmissionCORPORATION'-
Marcel RegheliniDirector. Regulatory AffairsPhone: 604 699-7331Fax: 604 699-7537E-mail: [email protected]
December 21, 2006
Mr. Robert J. PellattCommission SecretaryBritish Columbia Utilities CommissionSixth Floor, 900 Howe StreetBox 250Vancouver, BC V6Z 2N3
Dear Mr. Pellatt:
Re: British Columbia Transmission Corporation ("BCrC")Transmission System Capital Plan F2008 to F2017
Pursuant to sections 45(6), 45(6.1) and 45(6.2) of the Utilities Commission Act,BCTC files with the British Columbia Utilities Commission the Transmission SystemCapital Plan F200B to F2017 ("Capital Plan").
In response to Commission Letter L-78-06, BCTC notes that Section 1.6 of the CapitalPlan lists in detail the Orders Sought through this application. BCTC will work withCommission staff during the course of the proceeding to provide electronic copies ofdraft Orders in WORD format, as required.
Sincerely,
Original Signed byGerry Lister for:
Marcel RegheliniDirector, Regulatory Affairs
British Columbia Transmission Corporation.Suite 1100 Four Bentail Centre, 1055 Dunsmuir Street,
Vancouver. BC V7X lVSwww.bctc.com

C2.
3
4
5
6
7
89
10II121314151617]8- , 19
\
20
2]2223242526272829303]32
33
34
353637383940
Table of Contents
TABLE OF CONTENTS
Table of Contents 1
List of Figu res n 4
List of Tables 4
List of Appe ndices 5
List of Abbreviati ons 6
1.0 Application 8
1.1 Contact Information n 81.2 Legal Counsel for the Applicant.. 91.3 Regulatory Context 9
1.3.1 Commission Directives 101.3.2 Resource Planning GuideJines 111.3.3 Approval of Capital Expenditures : 111.3.4 CPCN Criteria 15
1.4 Proposed Review and Approval Process 161.5 Structure of the Application 161.6 Orders Sought 17
1.6.1 General 171.6.2 Orders Under Subsection 45(6.2)(b) of the Act 17
2.0 Corporate Outlook 21
2.1 Corporate Overview 212.1.1 Key Strategic Issues 222.1.2 Corporate Goals 23
2.2 Summary of the Application 242.3 Drivers 252.4 Capital Planning Process 26
2.4.1 Improvements to the Capital Planning Process and Response toCommission Directives 27
2.5 Major Risks to Capital Plan 282.5.1 Growth Portfolio 282.5.2 Sustaining Portfolio , 292.5.3 BCTC Portfolio n .. ' 29
3.0 State of the Transmission System Report 30
4.0 Capital Planning Process Overview 35
4,1 Intraduction , , ,354.2 Process Description , 35
4.2.1 Planning Phase - Needs Identification 364.2.2 Planning Phase - Study Work 374.2.3 Definition Phase 374.2.4 Implementation Phase 38
BCrG Capital Plan F200821 December 2006

(23456789
101112]31415]617l8192021222324
"25
26272829303132333435
36
373839404]4243
44
4546
Table of Contents
4.3 Risk Assessment Framework _ 384.4 Prioritization 39
4.4.1 Financial. 414.4.2 Reliability 414.4.3 Market Efficiency 414.4.4 Asset Condition 424.4.5 Relationships with Community and First Nations 424.4.6 Environment and Safety .43
4.5 Stakeholder and First .Nations Engagement.. .434.5.1 Consultation Activities 434.5.2 Incorporating Stakeholder and First Nations Feedback .49
4.6 Growth Portfolio 504.6.1 Objectives 504.6.2 Planning Standards 524.6.3 Key Drivers 594.6.4 Planning Studies 644.6.5 Probabilistic Performance Analysis 66
4.7 Sustaining Portfolio 674.7.1 Objectives : 674.7.2 Key Drivers 684.7.3 Program Development 71
4.8 BCTC Portfolio : 724.8.1 Objectives 724.8.2 Key Drivers 73
5.0 Growth Capital Portfolio 76
5.1 Growth Capital Portfolio Table 765.2 Historical and Trend Explanations 815.3 Changes from Previous Capital Plan 845.4 Prioritization Results 865.5 Growth Capital Portfolio Descriptions 88
5.5.1 Bulk System Reinforcements 885.5.2 Regional System Reinforcements 1015.5.3 Station Expansion & Modification 1145.5.4 Customer-Requested Projects 1275.5.5 Independent Power Producer Interconnections 127
6.0 Sustaining Capital Portfolio 130
6.1 Sustaining Capital Portfolio Table 1306.2 Historical and Trend Explanations 1336.3 Changes from Previous Capital Plan 1356.4 Optimization Results 1386.5 Sustaining Capital Portfolio Descriptions 139
6.5.1 Stations , ,1406.5.2 Lines 175
7.0 BCTCCapital Portfol i0 201
7.1 BCTC Capital Portfolio Table 2017.2 Program Description and Strategy 204
BCTC Capital Plan F200821 December 2006
2
Transm ission Reven ue Requirement Impacts 254
Commiss ion Oi rectives 257
9.1 Order G-91-05 page 4 : 2579.2 Order G-91-05 page 6 Directive 1 2579.3 Order G-91-05 page 7 Directive 2 2589.4 Order G-91-05 page 8 Directive 3 2599.5 Order G-91-05 page 8 Directive 4 2599.6 Order 8-91-05 page 9 Directive 5 2619.7 Order G-91-05 page 11 Directive 6a 2629.8 Order G-91-05 page 11 Directive 6b 2639.9 Order G-91-05 page 11 Directive 7 2639.10 Order G-91-05 pages 15 and 16 2649.11 Order G-91-05 page 16 Directive 8 2659.12 Order G-91-05 page 17 Directive 9 2669.13 Order G-91-05 page 17 2669.14 Order G-91-05 page 19 Directive 10a 2669.15 Order G-91-05 page 20 Directive 10b 2679.16 Order G-91-05 page 26 Directive 11 2679.17 Order G-91-05 page 26 directive 12 2689.18 Order 8-91-05 page 26 Directive 13 2689.19 Order G-91-05 page 27 Directive 14 2699.20 Order G-91-05 page 30 directive 15 2699.21 Order G-91-05 page 37 Directive 19 2709.22 Order G-91-05 page 41 Directive 21 2709.23 Order G-91-05 page 42 directive 22 2709.24 Order G-91-05 page 44 Directive 23 2719.25 Order G-91-05 page 45 Directive 24 2719.26 Order G-91-05 page 45 Directive 25 2719.27 Order G-91-05 page 47 Directive 26 2729.28 Order G-91-05 page 49 Directive 28a 2729.29 Order 8-91-05 page 49 Directive 28b 272
( 123456789
10]I]213]415]6]7
18 8.0
]9 9.0
20212223242526272829303]3233343536373839404142434445464748
7.3
7.4
7.57.6
Table of Contents
7.2.1 Information Technology 2047.2.2 Control Centre Technologies 2057.2.3 Facilities , 206Historical and Trend Explanations 2067.3.1 Trend for BCTC Capital Portfolio 2067.3.2 Trends for Specific Projects 208Changes from Previous Capital Plan 2097.4.1 Changes to Projects 2097.4.2 Changes to Submission Format... 210Prioritization Results 211BCTC Capital Portfolio Descriptions 2137.6.1 Information Technology Projects for ApprovaL 2137.6.2 Information Technology Future Projects 2487.6.3 Control Centre Technologies Project for Approval. 2497.6.4 Control Centre Technologies Future Project.. 2507.6.5 Facilities Project for Approval 2507.6 .6 Facilities Future Project 253
serc Capital Plan F200821 December 2006
3

(2
3
4
5
6
7
8
9
10
11
12
]3
14
,-. 15{
16
17
18
19
20
21
22
23
24
2.5
26
27
28
29
30
3 ]
4 - Capital Planning Process Overview
(d) A deferral of system reinforcements by using generation shedding forgoes the
benefits that can occur from reinforcements in one part of the system providing
secondary benefits in another part of the system.
Some exceptions to this general policy are made if the amount of shedding is less
than the largest unit on the transmission system, and the required investment to avoid
the shedding cannot be justified.
BCTC will accept generation shedding for a double contingency and for a single
contingency if one element is already out of service. BCTC has adopted this policy so
that the transmission system is more robust and is able to depend on generation
shedding for less common and more severe events.
4.6.2.5.3 Over Voltage Line Tripping
The transmission system has many expensive pieces of equipment that can be
damaged by excessive voltages. For example, underground cables in Metro
Vancouver and the submarine cables to Vancouver Island can be severely damaged
if exposed to excessively high voltages. Because of this, a staged protection scheme
has been implemented which trips 500 kV lines at specific increasing levels of over
voltage. This system is intended to backup other specific measures that are taken to
control voltages to acceptable levels for well-defined contingencies that may occur on
the system.
Tripping a single line reduces system voltages due to two phenomena. Firstly,
because 500 kV lines have some capacitance which tends to support system
voltages, the removal of a line will reduce a source of capacitive reactive power and
the voltage will fall somewhat. Secondly, tripping one line also increases the reactive
power demand by putting more current onto the remaining lines. The demand for
reactive power is proportional to the square of the current on the remaining lines and
this is a non-linear effect. Consequently, the reactive power required to maintain a
given level of voltage is higher after a line trips than it was before and the sources of
reactive power are lower. The net result of these two phenomena is that the voltage
stabilizes at a lower value than it had before the line tripping occurred. One
alternative to the reliance on line tripping is to install additional reactors on the
system.
BCTC Capital Plan F200821 December 2006
58
C·2~.)
4
5
4 - Capital Planning Process Overview
BCTC's planning policy is that the line over voltage protection scheme shall not be
triggered when the system responds to a single (N-1) or double (N-2) contingency. To
effect this standard, BCTC requires that sufficient voltage control equipment be
installed so that the 500 kV lines do not trip on over voltage protection for N, N-1, or
N-2 contingencies.
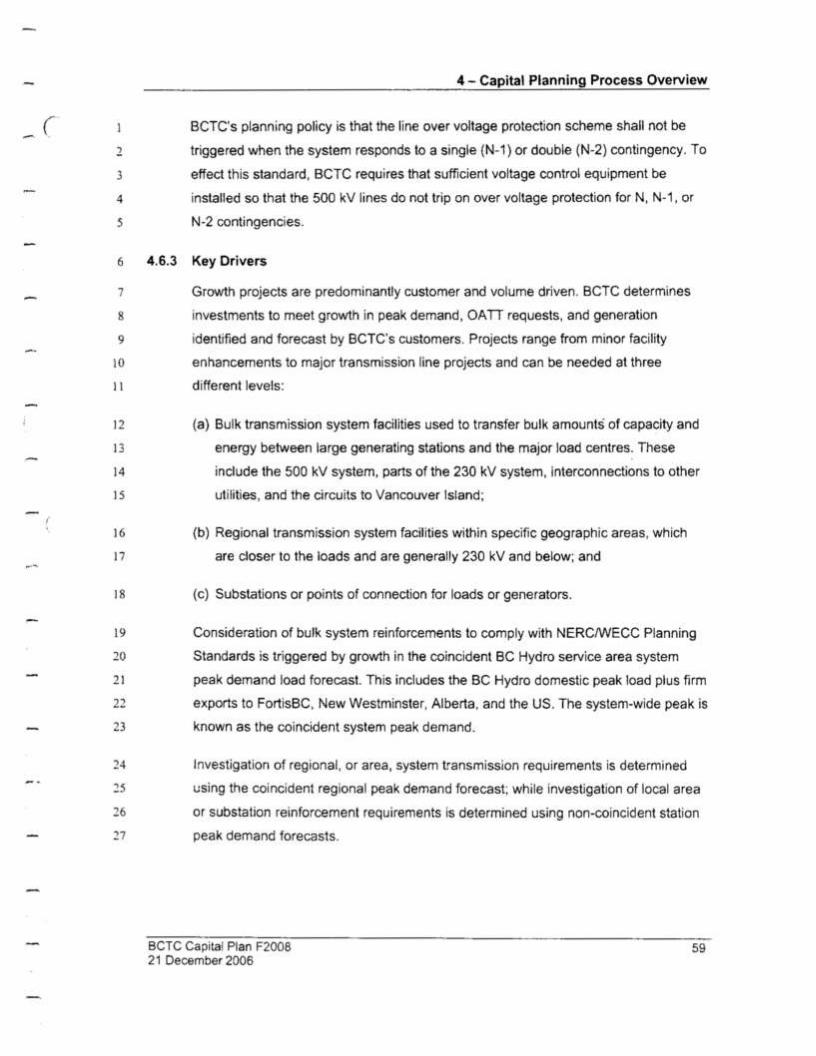
6 4.6.3 Key Drivers
..-'~
i
7
8
9
10
11
12
13
]4
]5
]6
]7
]8
19
20
21
22
23
24
25
26
27
Growth projects are predominantly customer and volume driven. BCTC determines
investments to meet growth in peak demand, OAD requests, and generation
identified and forecast by BCTC's customers. Projects range from minor facility
enhancements to major transmission line projects and can be needed at three
different levels:
(a) Bulk transmission system facilities used to transfer bulk amounts of capacity and
energy between large generating stations and the major load centres. These
include the 500 kV system, parts of the 230 kV system, interconnections to other
utilities, and the circuits to Vancouver Island;
(b) Regional transmission system facilities within specific geographic areas, which
are closer to the loads and are generally 230 kV and below; and
(c) Substations or points of connection for loads or generators.
Consideration of bulk system reinforcements to comply with NERC/WECC Planning
Standards is triggered by growth in the coincident BC Hydro service area system
peak demand load forecast. This includes the Be Hydro domestic peak load plus firm
exports to FortisBC, New Westminster, Alberta, and the US. The system-wide peak is
known as the coincident system peak demand.
Investigation of regional, or area, system transmission requirements is determined
using the coincident regional peak demand forecast; while investigation of local area
or substation reinforcement requirements is determined using non-coincident station
peak demand forecasts.
BCTC Capital Plan F200821 December 2006
59

-(2
3~
4 4.6.3.1
5
6
7
8
9
10
11
12
13
]4
15
]6
17
18
19
20
21
22
23
24
25
26
27
28
29 4.6.3.2
30
31
4 - Capital Planning Process Overview
The comparison of load forecast to Planning Standards is complemented with
probabilistic analysis to validate reinforcement needs. The methodology to conduct
probabilistic analysis is described in Section 4.6.5 below.
Service Agreements
BCTC is obliged to meet the needs of customers that request service under the terms
of the OAn. This includes customers using the system for NITS to meet loads in
multiple locations from multiple sources, PTP to transfer energy from and to specific
points on the network, and Generator Interconnection services which enable
customers to inject energy into the network at the location of a new generation
source. These service requests must be studied to examine the feasibility and impact
on the existing system for the proposed use.
BCTC conducts planning studies to determine the impacts of the proposed use of the
system to see if system damage or sustained interruptions of service would occur.
The studies also determine any need to reinforce the system to securely
accommodate these requests.
BC Hydro is presently the only NITS customer on the transmission system and is
experiencing significant load growth throughout the province. BC Hydro issued a
2006 Call for Tender which resulted in thirty-eight new Energy Purchase Agreements
with IPPs. The impact of each associated IPP interconnection requires some local
extension of the system to accommodate the energy flow into the system. Customer
requests for long-term Point-to-Point transmission services are also tracked and
considered in BCTC's review of the capability of the system to meet customer needs.
All of these services together can create a need to enhance the system at both the
regional and the bulk levels. The need is identified by power flow and stability studies
of the systems which take into account the forecast load on the system as well as
these three types of service requests. Growth projects are planned when the
aggregated service requirements exceed the capability of the system, and
implemented when BCTC obtains service request commitments.
Demand and Resource Forecasts
The transmission system capacity requirements are dictated primarily by MW transfer
forecasts which are provided by BC Hydro in the form of a system load forecast which
BCTC Capital Plan F200821 December 2006
60
4 - Capital Planning Process Overview
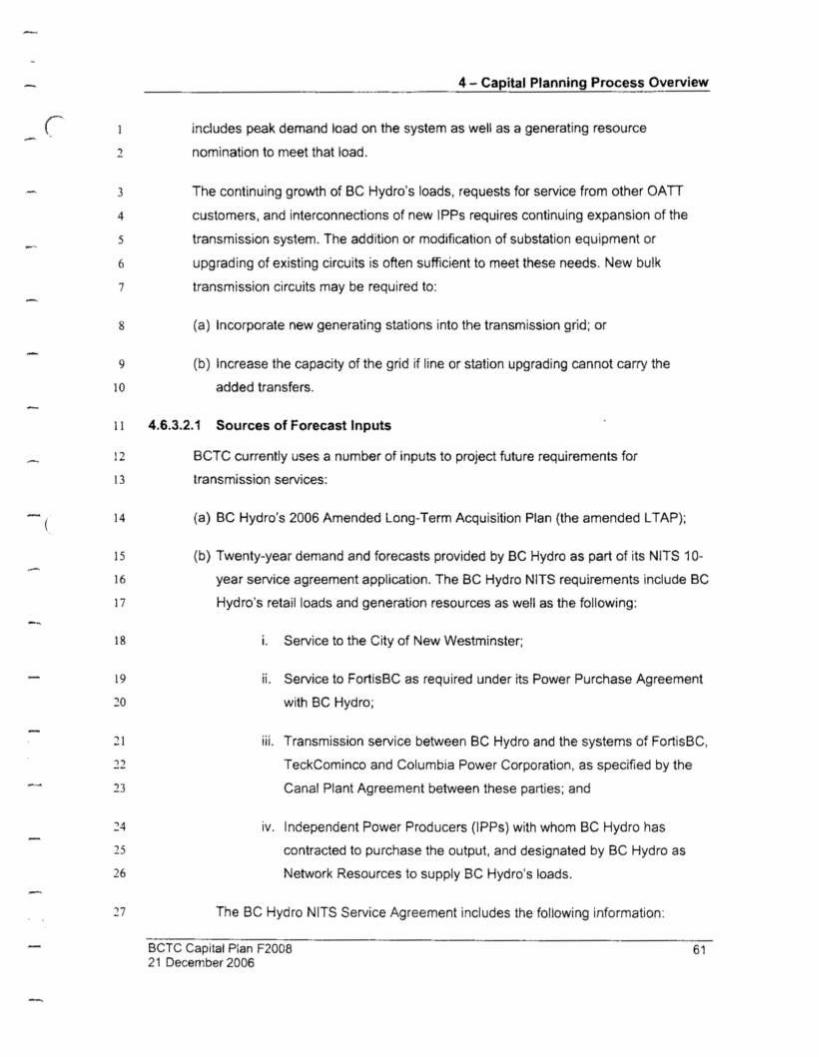
includes peak demand load on the system as well as a generating resource
nomination to meet that load.
The continuing growth of BC Hydro's loads, requests for service from other OA IT
customers, and interconnections of new IPPs requires continuing expansion of the
transmission system. The addition or modification of substation equipment or
upgrading of existing circuits is often sufficient to meet these needs. New bulk
transmission circuits may be required to:
(a) Incorporate new generating stations into the transmission grid; or
(b) Increase the capacity of the grid if line or station upgrading cannot carry the
added transfers.
4.6.3.2.1 Sources of Forecast Inputs
BCTC currently uses a number of inputs to project future requirements for
transmission services:
(a) BC Hydro's 2006 Amended Long-Term Acquisition Plan (the amended LTAP);
(b) Twenty-year demand and forecasts provided by BC Hydro as part of its NITS 10-
year service agreement application. The Be Hydro NITS requirements include BC
Hydro's retail loads and generation resources as well as the following:
i. Service to the City of New Westminster;
ii. Service to FortisBC as required under its Power Purchase Agreement
with BC Hydro;
iii. Transmission service between BC Hydro and the systems of FortisBC,
TeckCominco and Columbia Power Corporation, as specified by the
Canal Plant Agreement between these parties; and
IV. Independent Power Producers (IPPs) with whom BC Hydro has
contracted to purchase the output, and designated by Be Hydro as
Network Resources to supply BC Hydro's loads.
The BC Hydro NITS Service Agreement includes the following information:
Bcrc Capital Plan F200821 December 2006
61

4 - Capital Planning Process Overview
J. Coincident peak-day forecasts for the integrated system are used for
the bulk system studies;
II. Regional coincident peak-day forecasts are used for the regional
transmission system studies; and
III. Non-coincident substation peak-day forecasts are used for the
substation studies.
(c) Identification of transmission service requirements by other customers such as:
i. Transmission capacity specified by FortisBC's resources in the East
Kootenays to its loads in other service areas, such as the Okanagan.
This transmission service is provided under the General Wheeling
Agreement; a grandfathered transmission services agreement which
existed prior to the establishment of the OATT;
ii. Long Term Firm Point-to-Point Transmission Service contracts with
OATT customers under the OA IT tariff; and
iii. Requests by generator owners to interconnect new generators, or to
accommodate changes to existing generators.
4.6.3.2.2 BCTC's Role in Developing Transmission Usage Forecasts
In developing its Growth Capital plan, BCTC does not duplicate the effort that BC
Hydro uses to build its load and resource forecasts. BC Hydro has the data and
detailed knowledge of its residential, commercial and industrial customer base
required to forecast its requirements. Therefore, BCTC believes that it is appropriate
that BC Hydro's load forecasts should form part of BCTC's consolidated view on the
future requirements for transmission. In addition, given that BC Hydro, as the
distribution utility, makes decisions on distribution system reconfigurations that can
impact substation loading, it is BC Hydro's role to develop the forecasts reflecting
those decisions at the substation level, which then become part of BCTC's overall
view on future transmission needs.
As noted, the location, timing and capacity of new generation resources are key
drivers of transmission planning, particularly as they impact the bulk system.
BCTC Capital Plan F200821 December 2006
62

(
Terasen Gas Inc.Information Request No. 1.12.1 Dated: April 11, 2007British Columbia Hydro & Power AuthorityResponse issued April 30, 2007British Columbia Hydro & Power AuthorityBe Hvdro 2007 Rate Desion Application
12.0 Reference: Exhibit B-1, Page 19, Lines 22 - 28
Page 1of 1
Exhibit:B·3
(
i
-.---
The paragraph mentions that the southeast interior of BC experiences morecongestion in the summer than in the winter and Vancouver Island experiencesmore congestion in the winter than the summer.
1.12.1 What proportion of the BC Hydro's system overall summer load andsummer peak demand is represented by the area in the southeastinterior where there is more congestion in the summer than in thewinter?
RESPONSE:
The proportion of the total Southern Interior's sales to Be Hydro's overall totalsales in July and August is 12.0 per cent and 12.2 per cent respectively. This isbased on F2006 sales data excluding distribution and transmission losses.
For the same year, the proportion of peak demand of the total Southern Interiorpeak relative to Domestic System peak in July and August is estimated to about12.7 per cent and 12.5 per cent respectively. This estimate involves using metereddata for the Domestic System and simulated hourly data, excluding losses, for theSouthern Interior.

((.....
Terasen Gas Inc.Information Request No. 1.12.5 Dated: April 11, 2007British Columbia Hydro & Power AuthorityResponse issued April 30, 2007British Columbia Hydro & Power AuthorityBe Hvdro 2007 Rate Desian ADDlication
Page 1of 1
Exhibit:B-3
-
..~(
12.0 Reference: Exhibit B-1, Page 19, Lines 22 - 28
The paragraph mentions that the southeast interior of BC experiences morecongestion in the summer than in the winter and Vancouver Island experiencesmore congestion in the winter than the summer.
1.12.5 In the 2006 IEP/L TAP BC Hydro identified the need in the near futurefor a significant expansion of the Interior to Lower Mainlandtransmission system ("the ILM project"). Is the need for the ILM projectdriven by the requirement to meet winter or summer peak loads?
RESPONSE:
Be Hydro understands that the need for the ILM project is due to the requirementto meet winter peak load.

(
0--4~i6"'f ILT/tP
2006 IEP Report
.;........
BChgdro
Chapter 4
.,.au
.-...i.
,;.:......
Amended Chapter 4 Supply Demand Tables andFigures reflecting the response to BCUC.IR
4.430.5.4

.~~ ( Table of Contents8.1 INTRODUCTION _ _ 1
List of FiguresFIGURE 4 - 9 2006 IEP INTEGRATED SYSTEM FIRM ENERGY LOAD RESOURCE BALANCE
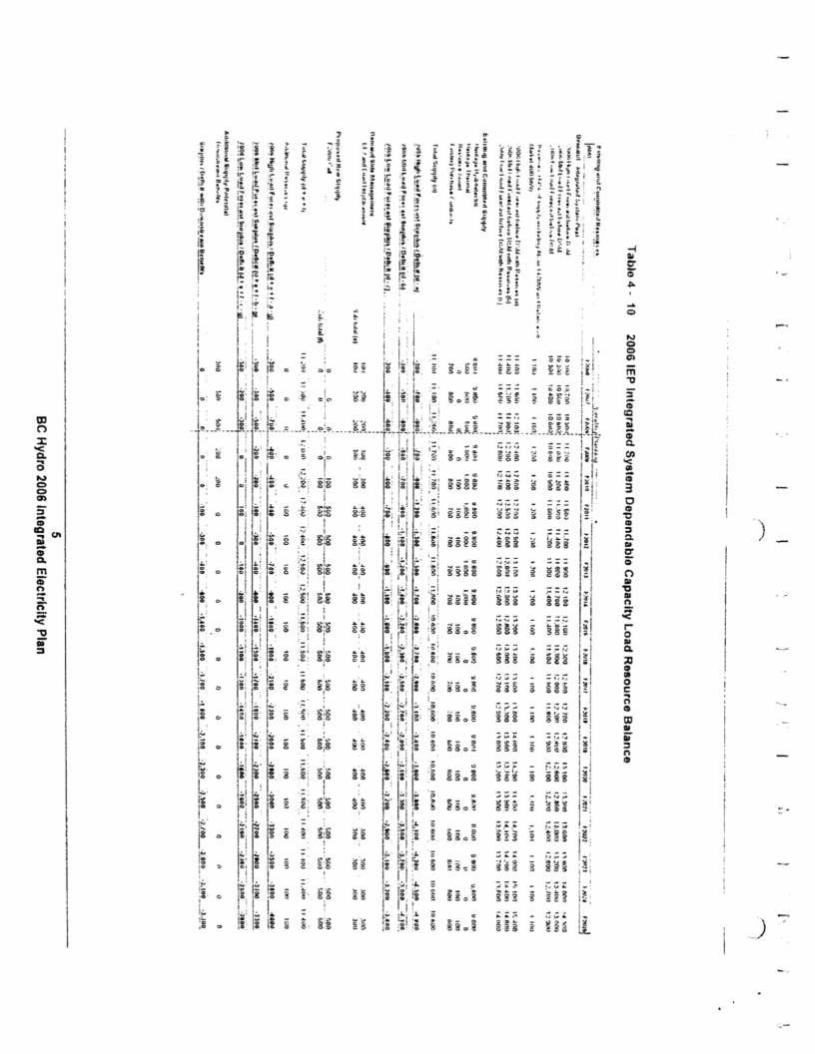
(2006 LOAD FORECAST) 2FIGURE 4 -10 2006 IEP INTEGRATED SYSTEM DEPENDABLE CAPACITY LOAD RESOURCE
BALANCE (2006 LOAD FORECAST) 3
List of TablesTABLE 4 -9 2006 IEP INTEGRATED SYSTEM FIRM ENERGY LOAD RESOURCE BALANCE.4TABLE 4 -10 2006 IEP INTEGRATED SYSTEM DEPENDABLE CAPACITY LOAD RESOURCE
BALANCE 5
iBC Hydro 2006 Integrated Electricity Plan

._ C'1 Introduction
'-'(
2 In the response to BCUC lR 4.430.5.4 (Exhibit B-17), BC Hydro provided an updated
3 energy load and resource balance table reflecting the addition of domestic non-firm
4 supply from the F2006 Call, Alcan and the proposed 2007 Call for the period of fiscal
5 2006 to fiscal 2015. This document provides the updated 20-year energy and capacity
6 load-resource balances that demonstrate Be Hydro's existing supply demand outlook
7 before LTAP directives.
1Be Hydro 2.006 Integrated Electricity Plan

I·._. , j\;. ,~ i ,\ ) 1 ,.. '
,- .'\ f' (. r 1 I"
/)-.
Figure 4 - 9 2006 IEP Integrated System Firm Energy Load Resourco Balance(2008 Load Forec.ast)
---- --- --- .----- ------.,-.,...--~ ..... --
~ting Planning ..
...........----.----.---.---- -..- - -.- -----.-- - --- -.-----.-.- ---'jUO,OOO
85,000
fiO,OOO
75,000~
50,000
45.000
40,000
~ ~ ~ ~ ~ ~ ~ 0 ~ ~ ~ ~ ~ ~ ~ ~ w ~ ~ ~~ ~ ~ ~ ~ ~ ~ ~ ~ ~ ~ ~ ~ ~ ~v ~ ~ ~v ~ ~~ ~ ~ ~ ~ ~ ~ ~ ~ ~ ~ ~ 0 ~ ~ ~ ~ ~ ~ 0Fiscal Year
(year ending March 31)
ii:
.0tUg- 70,000(J~
5E;; > 65,000... c.?(ll~
c GO,OOOwE ~i5,OOO
2006 Load Forecast Range after full EE2 and LD2
_ Existing Purchase Contracts
_ Heritage Hydroelectric
c:::J Resource Smart
_ Heritage Thermal 1 Market Purct1ases
c::::JAdclitional Non-Finn Energy Supply
c:::=:J F200'6 Call ..Expected Firm Energy
- .....2006 Mid Load Forecast after EE2 and LD2
2Be Hydro 2006 Integrated Electricity Plan

j":
Figura" - 10 2006 IEP Integrated System Dopendable Capacity Load Resource Balance(2006 Load Forecast)
17,000
16,000
..'-"\'
---.~ 1G.OOO()III~ 14,000U ,,-.~ ~ 13 000.n ~ 'III '-""tl:ii 12.0000-Il)
o '11,000
10,000
9,000
.Op~rating Planning ~
u---- --- --- -- --
~ ~ ~ ~ ~ ~ ~ ~ ~ ~ ~ ~ ~ ~ ~ ~ W ~ ~ ~~ ~ ~ ~ ~ ~ ~ ~ ~ ~ ~ ~ ~ ~ ~ ~ ~ ~ ~ ~~ ~ ~ ~ ~v ~ ~v ~ ~v XV ~v ~V ~v ~V ~V ~v ~v ~v ~v ~
Fiscal Year(year ending March 31)
200G Load Forecast Range after EE2 and LD2'
_ Exisling rUrCI)8Se Contracts
_ Heritage Thermal
_ Dowllstream Benefits
• including planning reserves
~-~_._--_ .._-_. __ ...__ ._.-~._~.-.-------
_ Heritage Hydroelectric
c=:J Resource Smart
c:::J F2006 Call
- - 2006 Mid Load Forecast after EE2 and LD2'
3Be Hydro 2006 Integrated Electricity Plan

,.-'!
'.~
.J
t-.looeniiiV
-'(ilC...I»..~Q.
en'<IIIiii3."=-3m:::III...lC'<r-oQlC.:J:lIIIIIIoc6III
roIIICi:lC"l(I)
...~ -::-.a~~1- 12
iE.,n,!;..1~:~
~~~i f ~ ~~Hl..~
~ E ~H~i~ g ~ f..~
~.~
~ ~ n~~ ..g~ g
'"., -~::: .::g55
"~&~.§
....o
;-lC...III;-0-en'<GIl;-3o~'0~~0.II>coQC')III
"!IIn;;''<roIII0.;ctil(IIoc...n~ttlIIIi»~ntil
.J

(
British ColumbiaUtilities CommissionInformation Request No. 1.5.1 Dated: AprilS, 2007British Columbia Hydro & Power AuthorityResponse issued April 30, 2007British Columbia Hydro & Power AuthorityBCHvdro2007RateDesionAcclication
Page 1of 2
Exhibit:B·3
5.0 Reference: Exhibit B-1, pp. 3-4 Energy Policy
The Application states on page 3 at lines 8-10 that" ... BC Hydro's 2007 RateDesign Application sets the foundation for BC Hydro's future rate designproposals that will address the opportunities to use rate structures to contributeto the implementation of the government's 2007 Energy Plan." At lines 26-27,the Application states that BC Hydro's long term rate strategy will involvesignificant external engagement with customers and stakeholders
1.5.1 In BC Hydro's view are the proposed rates consistent with the 2007Energy Plan?
RESPONSE:
This response addresses a number of questions asked by the BCUC andintervenors with respect to the 2007 Energy Plan and future rate design proposals.The 2007Energy Plan has been filed as an attachment to the response toESVIIR 1.6.1.
BC Hydro prepared its 2007 RDA in 2006, and most recently in January andFebruary 2007 engaged stakeholders through a number of workshops andmeetings to discuss the draft proposals. It was always BC Hydro's intention thatthis RDAwould establish an updated foundation upon which to base further ratedesign proposals that would specifically promote energy conservation and load
.management. Demand-side management has been a key part of BC Hydro'sresource acquisition plans for some time, and as demonstrated by theintroduction of stepped rates for large industrial customers in 2006, rate design isrecognized as an important tool in attempting to change customers' electricityusage behaviour. Going forward, BC Hydro's long term rate strategy will considerrate structures that may be capable of incenting behaviours towards achieving thetargets for demand side management set in the 2007 Energy Plan.
However, given that BC Hydro's rates have not been comprehensively reviewedby the acuc for 15 years it was considered important that some fundamentalaspects be addressed and confirmed before attempting to develop and proposemore significant structural changes to rates. The principle focus of the 2007 RDAis to ensure that BC Hydro's rates and Terms and Conditions are fair, efficient andsimple, and are reflective of the current cost and operating environment. Morespecifically BC Hydro's proposals include a rebalancing of rates as a result of theF2008Cost of Service Study; restructuring of the large General Service rate;phasing out of the E-Plus rate; and simplifying the Terms and Conditions, inparticular the distribution extension policy.

British Columbia Utilities CommissionInformation Request No. 1.5.1 Dated: April 5, 2007British Columbia Hydro & Power AuthorityResponse issued April 30, 2007British Columbia Hydro & Power AuthorityBe Hvdro 2007 Rate Oesion ADclication
Page 2of 2
Exhibit:B-3
The proposed changes to the large general service rate, the phasing out of the E-Plus rate and the redesigned distribution extension test are consistent with prioracuc determinations and reflect the need to amend certain rate structures andterms that are providing inefficient and inappropriate price signals. To that end,these proposals go some way to ensuring that energy conservation and efficiencyare not discouraged.
The 2007 Energy Plan was released on February 27, 2007 by the Provincialgovernment, 16 days prior to BC Hydro filing its 2007 RCA. Accordingly the 2007Energy Plan does not specifically inform any of the proposed changes in theApplication. While it is BC Hydro's view that the proposed rates are notinconsistent with the 2007 Energy Plan, it is neither realistic nor helpful to attemptto link the specific proposals in the 2007 RDA to the policy actions in the 2007Energy Plan. Be Hydro is not claiming that the proposals in the RDA-meet in fullthe requirements of the policy actions of the 2007 Energy Plan. As with many ofthe policy actions in the 2007 Energy Plan BC Hydro, along with other B.C. energyutilities, needs to clearly understand the requirements and implications of thepolicy, engage the relevant stakeholders, develop proposals and take theappropriate steps for implementation.

_r'OTerasen Gas Inc.Information Request No. 1.3.2 Dated: April 11 , 2007British Columbia Hydro & Power AuthorityResponse issued April 30, 2007British Columbia Hydro & Power AuthorityBe Hvdro 2007 Rate Desion Application
Page 1of 1
Exhibit:8·3
3.0 When discussing home heating on BC Hydro's website, BC Hydrorecommends that its customers use energy resources efficiently andstates: "It's important to match your energy source to its best use.Electricity is best suited for lighting and powering our appliances andtelevisions, whereas natural gas is ideal for space and water heating."
1.3.2 If so, how are the approvals sought in the Rate Design Applicationachieving the aims of this policy?
RESPONSE:
None of the approvals sought in the Application are specifically to encourage ordiscourage heating source alternatives. However, BC Hydro's proposed -distribution extension policy does reflect the cost differential between electric andnon-electric heating connections.
Please also refer to the response to Terasen IR 1.19.1.2.